Embed Size (px)
Citation preview
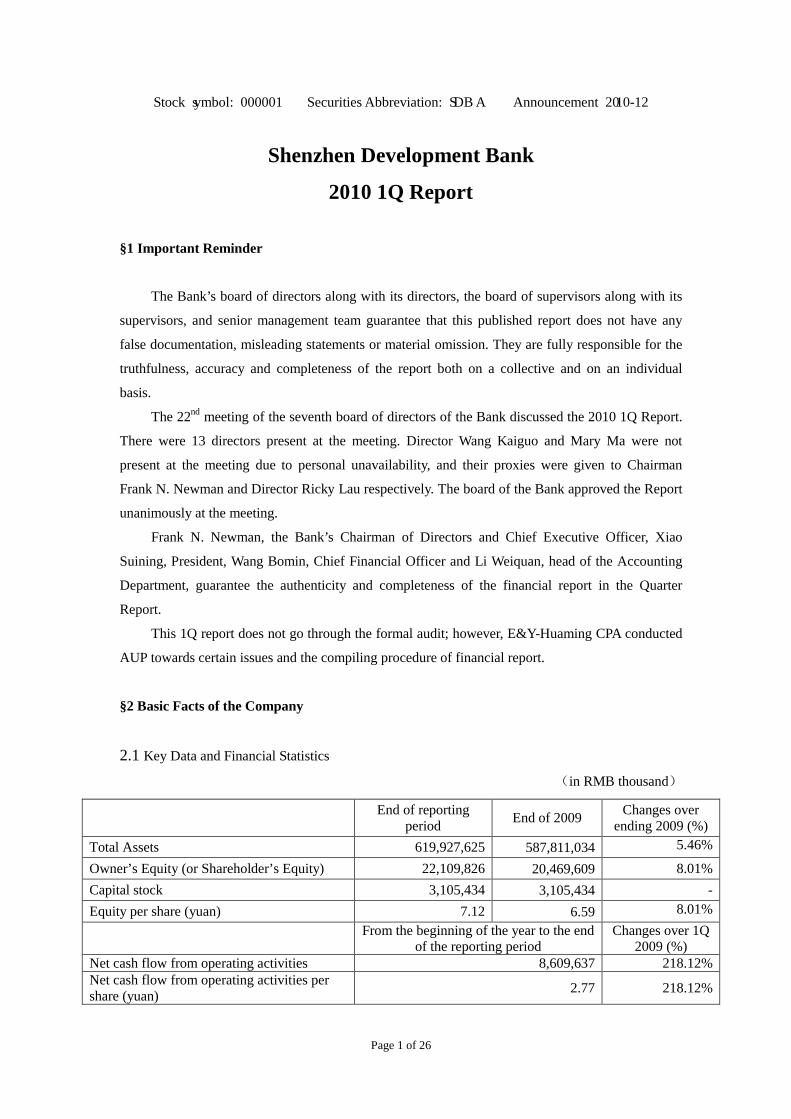
Page 1 of 26
Stock symbol: 000001 Securities Abbreviation: SDB A Announcement 2010-12
Shenzhen Development Bank
2010 1Q Report
§1 Important Reminder
The Bank’s board of directors along with its directors, the board of supervisors along with its
supervisors, and senior management team guarantee that this published report does not have any
false documentation, misleading statements or material omission. They are fully responsible for the
truthfulness, accuracy and completeness of the report both on a collective and on an individual
basis.
The 22nd
§2 Basic Facts of the Company
meeting of the seventh board of directors of the Bank discussed the 2010 1Q Report.
There were 13 directors present at the meeting. Director Wang Kaiguo and Mary Ma were not
present at the meeting due to personal unavailability, and their proxies were given to Chairman
Frank N. Newman and Director Ricky Lau respectively. The board of the Bank approved the Report
unanimously at the meeting.
Frank N. Newman, the Bank’s Chairman of Directors and Chief Executive Officer, Xiao
Suining, President, Wang Bomin, Chief Financial Officer and Li Weiquan, head of the Accounting
Department, guarantee the authenticity and completeness of the financial report in the Quarter
Report.
This 1Q report does not go through the formal audit; however, E&Y-Huaming CPA conducted
AUP towards certain issues and the compiling procedure of financial report.
2.1 Key Data and Financial Statistics
(in RMB thousand)
End of reporting period End of 2009 Changes over
ending 2009 (%) Total Assets 619,927,625 587,811,034 5.46%
Owner’s Equity (or Shareholder’s Equity) 22,109,826 20,469,609 8.01% Capital stock 3,105,434 3,105,434 - Equity per share (yuan) 7.12 6.59 8.01%
From the beginning of the year to the end of the reporting period
Changes over 1Q 2009 (%)
Net cash flow from operating activities 8,609,637 218.12% Net cash flow from operating activities per share (yuan) 2.77 218.12%

Page 2 of 26
Reporting period
From the beginning of the year to ending 1Q
Same period of last year
Changes over 1Q 2009 (%)
Operating income 4,084,252 4,084,252 3,760,604 8.61% Net Profit 1,578,118 1,578,118 1,122,077 40.64% Basic EPS (yuan) 0.51 0.51 0.36 40.64% Diluted EPS (yuan) 0.51 0.51 0.36 40.64% Basic EPS less non-recurring gains/losses (yuan) 0.51 0.51 0.36 40.75%
Return on assets (Jan-Mar in 2010, un-annualized) 0.25 0.86 0.13
Fully diluted return on earnings (un-annualized) 7.13% 7.13% 6.57% +0.56 ppts
Return on average equity (un-annualized) 7.42% 7.42% 6.62% +0.8 ppts Return on equity less non-recurring gains/losses (un-annualized) 7.42% 7.42% 6.60% +0.82 ppts
Items of non-recurring gains/losses Amount from the beginning of the year to ending 1Q Gains/Losses on disposal of illiquid assets (6,338) Gains/Losses from contingency (12) Changes on fair value of investment property 7,304 Other non-operating income and expenses except the above items 968
Impact on income tax by above adjustments (403) Total 1,519
Notes: Non-recurring gains/losses are calculated based on the definition of CSRC Announcement
2008 No.43—Explanatory Announcement of Information Disclosure by Companies Publicly
Offering Securities No.1- Non-recurring Gains/Losses. 2.2 Key Accounting Statistics
(in RMB thousand)
Item Mar.31, 2010 Dec.31, 2009 Dec.31, 2008 Changes over ending 2009
1. Total Assets 619,927,625 587,811,034 474,440,173 5.46%
Financial assets and derivative financial assets designated at fair value and changes of which are booked as gains/losses in the period
1,462,982 1,232,044 332,192 18.74%
Held-to-Maturity investments 36,229,930 34,585,440 15,584,755 4.75%
Loans and receivables 481,029,204 454,274,577 363,900,753 5.89%
Available-for-sale financial assets 38,308,612 36,998,409 48,799,716 3.54%
Others 62,896,897 60,720,564 45,822,757 3.58%
2. Total liabilities 597,817,799 567,341,425 458,039,383 5.37%
Financial liabilities and derivatives financial liabilities designated at fair value and changes of which are booked as gains/losses in the period
42,852 21,540 98,018 98.94%

Page 3 of 26
Inter-bank borrowing 9,000,000 7,570,118 7,380,000 18.89%
Deposits 467,614,913 454,635,208 360,514,036 2.85%
Others 121,160,034 105,114,559 90,047,329 15.26%
3. Shareholders’ total equity 22,109,826 20,469,609 16,400,790 8.01% Net assets per share attributed to shareholders of listed company 7.12 6.59 5.28 8.01%
4. Total deposits 467,614,913 454,635,208 360,514,036 2.85%
Including: Corporate deposits 396,824,454
383,663,003
302,309,165 3.43%
Retail deposits 70,790,459
70,972,205
58,204,871 -0.26%
5. Total loans 371,973,777
359,517,413 283,741,366 3.46%
Including: Commercial loans 269,825,776
261,879,271
209,835,181 3.03%
Commercial general loans 234,331,945
216,593,743
167,617,360 8.19%
Discount 35,493,831
45,285,528 42,217,821 -21.62%
Retail loans 102,148,001
97,638,142
73,906,185 4.62%
Loan impairment provision balance (4,369,455) (3,954,868) (2,026,679) 10.48%
Net loans and advances 367,604,322 355,562,545 281,714,687 3.39%
2.3 Key Financial Statistics
(in %)
Item Benchmark Value
March 31 2010
December 31 2009
December 31 2008
Capital adequacy ratio ≥8 8.66 8.88 8.58 Core capital adequacy ratio ≥4 5.46 5.52 5.27 NPL ratio ≤8 0.63 0.68 0.68 Loan to deposit Ratio (incl. discount) 79.61 79.14 78.85 Loan to deposit Ratio (excl. discount) 71.96 69.12 67.01
Liquidity ratio
RMB ≥25 42.77 38.59 41.50 Foreign Currency ≥25 45.13 54.02 49.68 Home & Foreign Currencies ≥25 41.94 39.46 41.00
Ratio of loans to top 1 single client in net capital ≤10 7.36 7.84 4.22
Ratio of loans to top 10 clients in net capital 37.91 40.85 26.90 Migration ratio of normal loans 0.09 1.31 2.78 Migration ratio of special mention loans 20.73 48.99 1.90 Migration ratio of substandard loans 7.52 23.39 - Migration ratio of doubtful loans 1.17 - - Provision coverage ratio NA 187.53 161.84 105.14 Cost to income ratio (excluding business tax) NA 41.25 41.76 35.99

Page 4 of 26
2.4 Number of shareholders and position of the top 10 unrestricted shareholders at the end of the
reported period
(Unit: shares)
Number of shares at the end of the reported period 3,105,433,762
Number of shareholders at the end of the reported period
(shareholder)
252,420
Top 10 unrestricted shareholders
Name of the shareholder Unrestricted shares held Share nature
NEWBRIDGE ASIA AIV III,
L.P. 339,158,727 RMB ordinary shares
PingAn Life Insurance Company of China, LTD-Tradition-Ordinary insurance products 140,963,528 RMB ordinary shares
Shenzhen Zhongdian Investment Co., Ltd. 87,302,302 RMB ordinary shares China Life Insurance Co., Ltd-dividend-individual dividend-005L-FH002 Shenzhen 63,504,416 RMB ordinary shares
BOC-Yifangda Shenzhen Stock Exchange 100 Tradable Open Index Securities Investment Fund 48,943,526 RMB ordinary shares
Haitong Securities Co., Ltd 46,304,896 RMB ordinary shares CAB-Fuguotianrui Strong Regions Selective Mixed Open Securities Investment Fund 44,649,235 RMB ordinary shares
MORGAN STANLEY & CO. INTERNATIONAL PLC 42,923,527 RMB ordinary shares ICBC-Boshi Selective Stock Securities Investment Fund 32,999,923 RMB ordinary shares ICBC-Rongtong 31,845,026 Shenzhen Stock Exchange 100 Index Fund RMB ordinary shares

Page 5 of 26
§3 Major Events
3.1 Substantial changes of major financial items or indicators with the reasons
√Applicable □not applicable
Items Change over 1Q 2009 Cause for Change
Repurchased financial assets 40% Adjustment of fund use volume and structure
Account receivables 61% Growth of import payment business and factoring business
Derivative financial liabilities 99% Increase of foreign currency futures agreement
Employee compensation payable -36% Bonus due at the end of 2009 was paid at the beginning of 2010
Account payables 67% Growth of import payment business
Deferred tax liabilities 30% Increase of return on changes of financial instruments at fair value
Other liabilities 45% Not booked daily settlement fund at quarter with low comparison basis
Undistributed profit 36% Net profit realized in the quarter
Fee and commission income 52% Increase of income on settlement fee, credit card fee, consultancy fee, and trade finance
Investment return -69% High return on bonds investment was realized in early 2009 in light of the capital market status, which did not occur in this quarter.
Return on changes of financial instruments at fair value 138%
Increase of gain on fair value change of tradable bonds and interest rate swap from-24.83 million yuan to 7.3 million yuan
Return on changes of investment property at fair value 397%
Increase of gain on of fair value change brought by market changes from -2.46 million yuan to 7.3 million yuan.
Exchange return -33% Diminished gain on brokerage business
Assets impairment charges -77% Deduced demand of provision due to solid collection result
Note: The compare period for items of asset or liability is between the ending period of this report
and the end of last year, while between January to March of this year and the same period of last
year for those of profit or loss.
3.2 Explanation about the process, impact and solution of major events
□Applicable √not applicable
The Bank plans to non-publicly offer (“this offering) no less than 370 million but no more
than 585 million shares to PA Life Insurance of China (“PA Life”) according to the Share Purchase
Agreement signed by the Bank and PA Life on June 12 2009.
According to the Share Purchase Agreement signed by the Bank’s first largest shareholder
Newbridge Asia AIV III, L.P. (“NB”) and PingAn Insurance (Group) of China (“China PA”),the
actual controller of PA Life Insurance, on June12 2009, China PA can purchase all shares held by
NB no later than December 31 2010 (“this share transfer”).
On December 24 2009, China PA planed to sign the Supplementary Agreement to Share

Page 6 of 26
Purchase Agreement with NEWBRIDGE on the basis of Share Purchase Agreement, revising
contents including prolonging the effective term of the Share Purchase Agreement.
On April 28 2010, the 22nd meeting of the 7th
Other specifics of this offering plan and this share transfer can be referred to relevant
announcements published by the Bank and relevant information disclosure obligators on China
Securities Journal, Securities Times, Shanghai Securities Journal and
BOD reviewed and approved the Proposal for
Signing the Supplementary Agreement to Share Subscription Agreement between SDB and PA Life,
which approved to revise the Share Subscription Agreement between SDB and PA Life
(“Subscription Agreement”) reached on June 12 2009 by SDB and PA Life, and sign the
Supplementary Agreement to Share Subscription Agreement between SDB and PA Life with PA
Life, which extended the Long Stop Date from April 30 2010 to June 28 2010.
www.cninfo.com.cn on June
13 2009, June16 2009, December 25 2009 and April 29 2010.
This offering plan and this share transfer are subject to approval of relevant regulators.
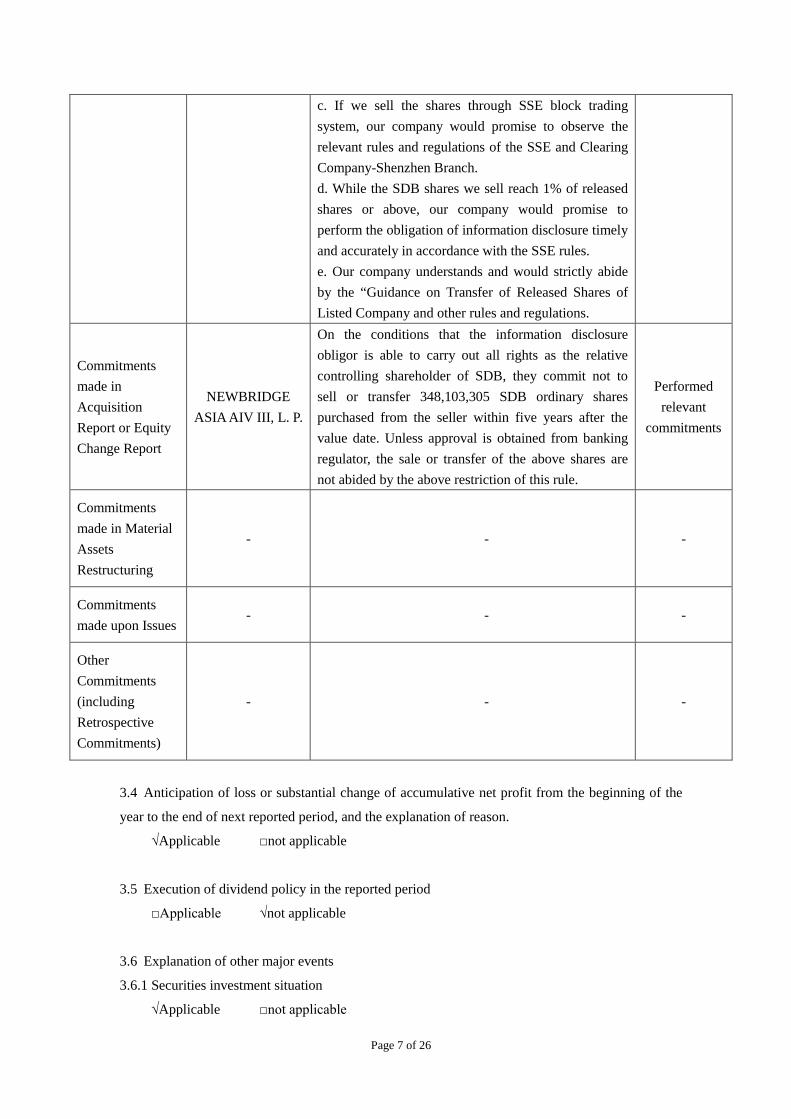
3.3 Performance of commitment of the company, shareholder and actual controller
√Applicable □not applicable
Commitments Promiser Contents Performance
Commitments in Share Reform
NEWBRIDGE ASIA AIV III, L. P.
Promises no transferring/trading the holding non-tradable shares in the securities exchange market within 12 months since the day acquiring trading right (first trading day after the implementation of share reform plan). After the expiration of above commitment term, the previous non-tradable shares traded through the stock exchange shall not be over 5% of total shares in 12 months, not over 10% in 24 months.
Performed relevant
commitments
Restricted Shares Commitments
NEWBRIDGE ASIA AIV III, L. P.
a. Our company has no plan at present to publicly sell the released shares which account for 5% of the total shares through SSE trading system in six months after the release. If our company plans to sell the released SDB shares through SSE trading system in the future and the sold amount in six months would be over 5% from the first batch of selling, our company would disclose a reminding announcement for the selling through SDB in two trading days prior to the first batch of selling. b. If we expect to publicly sell the released shares which accounts for more than 1% of the total shares of SDB within one month in the future, our company would sell the shares through SSE block trading system.
Performed relevant
commitments
Page 7 of 26
c. If we sell the shares through SSE block trading system, our company would promise to observe the relevant rules and regulations of the SSE and Clearing Company-Shenzhen Branch. d. While the SDB shares we sell reach 1% of released shares or above, our company would promise to perform the obligation of information disclosure timely and accurately in accordance with the SSE rules. e. Our company understands and would strictly abide by the “Guidance on Transfer of Released Shares of Listed Company and other rules and regulations.
Commitments made in Acquisition Report or Equity Change Report
NEWBRIDGE ASIA AIV III, L. P.
On the conditions that the information disclosure obligor is able to carry out all rights as the relative controlling shareholder of SDB, they commit not to sell or transfer 348,103,305 SDB ordinary shares purchased from the seller within five years after the value date. Unless approval is obtained from banking regulator, the sale or transfer of the above shares are not abided by the above restriction of this rule.
Performed relevant
commitments
Commitments made in Material Assets Restructuring
- - -
Commitments made upon Issues
- - -
Other Commitments (including Retrospective Commitments)
- - -
3.4 Anticipation of loss or substantial change of accumulative net profit from the beginning of the
year to the end of next reported period, and the explanation of reason.
√Applicable □not applicable
3.5 Execution of dividend policy in the reported period
□Applicable √not applicable
3.6 Explanation of other major events
3.6.1 Securities investment situation
√Applicable □not applicable

Page 8 of 26
At the end of the reporting period, book value of treasury and financial bonds (including PBC
notes, policy bank notes, ordinary financial bonds, and subordinate financial bonds) held by the
Bank was 83.2 billion yuan, among which the bonds with large amount are as follows:
(in RMB thousand)
Type Book value Annual coupon rate (%) Maturity date Impairment
provision 08 financial debts 10,630,000.00 1.98~4.81 2011/2/15~2018/12/16 - 09 financial debts 10,070,000.00 1.95~3.5 2011/9/23~2019/9/23 - 06 treasury bonds 5,717,000.00 2.4~2.8 2011/5/16~2016/3/27 - 07 financial debts 6,115,000.00 2.03~5.14 2010/7/13~2017/10/25 - 09 treasury bonds 3,711,755.80 0~3.73 2010/4/26~2016/6/25 - 09 other financial debts 2,629,160.00 0.7506~5.7 2011/5/19~2024/3/25 -
02 financial debts 2,140,000.00 2.65~4.6 2012/4/19~2022/5/9 - 05 financial debts 1,610,000.00 2.66~3.82 2010/12/30~2020/6/30 - 08 treasury bonds 1,290,000.00 2.64~4.94 2011/4/14~2038/5/8 - 01 treasury bonds 1,068,256.00 2.77~6.8 2011/3/23~2011/8/31 - PBC notes 27,660,000.00 0~4.56 2010/4/9~2011/5/30 -
3.6.2 Shareholding of other listed company
√Applicable □not applicable
(in RMB thousand)
Code Name Initial investment
Portion of total
shareholding
Ending face value
Gains/Losses in
reported period
Change of equity
in reported period
Accounting subjects
Sources of Shares
000040 ShenHongJi 3,215 0.30% 5,925 - 168 Available for sale
Historical investment
000150 Yihua Real Estate 10,000 2.79% 61,179 - 1,724 Available
for sale Repossessed
equity
000892 *ST XingMei 2,911 0.14% 5,568 - 118 Available
for sale Repossessed
equity
600094 ST HuaYuan 4,248 0.23% 4,319 - 58 Available
for sale Repossessed
equity
600062 Shuanghe Yaoye 10,844 0.07% 11,162 - 317 Available
for sale Repossessed
equity
600739 Liaoning ChengDa 8,447 0.02% 8,193 - -253 Available
for sale Repossessed
equity
Visa Inc. - 0.01% 1,378 - 54 Available for sale
Historical investment
Total 39,665 97,724 - 2,186
3.6.3 Shareholding of other unlisted financial company or to-be-listed company
√Applicable □not applicable

Page 9 of 26
(in RMB thousand)
Name of the invested company Investment amount
Impairment provision
Ending net value
China UnionPay Company Ltd. 50,000 - 50,000 SWIFT Membership shares 684 - 684 Total 50,684 - 50,684
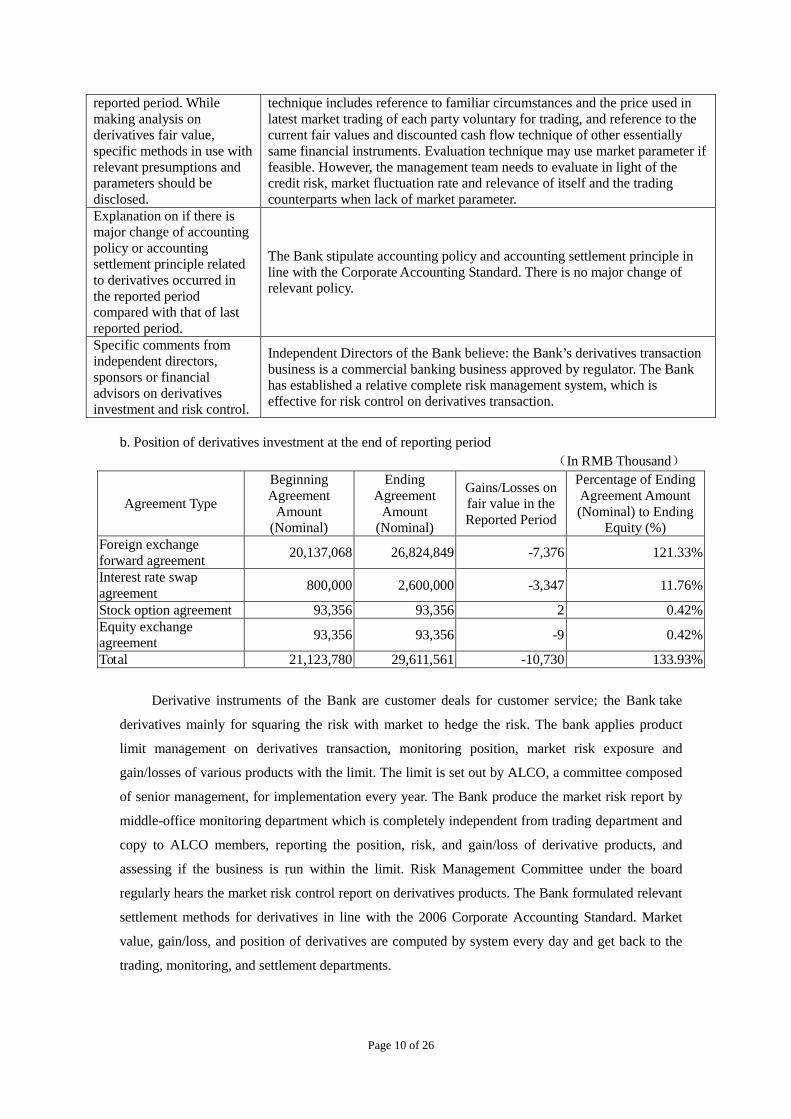
3.6.4 Derivatives investment and the position at the ending period √Applicable □not applicable
a. Derivatives investment table
Risk analysis on derivatives position-holding in the reported period and explanations on controlling measures (including but not limited to market risk, liquidity risk, credit risk, operational risk and legal risk)
1. Market risk. Market risk of derivatives refers to the risk of loss on on-balance-sheet and off-balance-sheet business due to change of market price (interest rate, exchange rate, stock price, and goods price). The Bank conducts limit management from sides such as exposure, risk level, and equity. 2. Liquidity risk. Liquidity risk of derivatives refers to the risk that bank has the solvency but can not obtain sufficient fund timely or can not obtain sufficient fund in time with reasonable cost to deal with asset growth or pay off due debts. For derivatives delivered in full amount, the Bank adopts the measure of integrated position closing to ensure sufficient fund for settlement while delivery; for derivatives delivered in net amount, there is no major impact as the cash flow would have minor impact on liquid assets of the Bank.
3. Operational risk. Operational risk is the risk resulting from defective internal procedure, staff, system, or external events. Including the risks caused by employee, process, system, and outside factors. The Bank strictly observes the CBRC Guidance on Operational risk Management of Commercial Banks, staffs specific trader, adopted professional front-middle-back office monitoring system, set complete business operation process and authorization management system and improved internal monitoring and auditing mechanism, trying best to avoid operational risk.
4. Legal risk. Legal risk refers to the possibility of risk exposure caused by business activity incompliance with legal rules or external legal events. The Bank attaches a lot of importance to legal documentation related to derivatives transaction, and signed legal agreement including ISDA, CSA, NAFMII with peer banks to avoid legal dispute and regulate dispute resolving method. In accordance with regulatory requirement and transaction management necessity, the Bank also set customer transaction agreement referring to above inter-bank legal agreements, thus avoid most potential legal disputes.
5. Force Majeure. Force Majeure refers to the objective circumstances that can not be forecast, avoided, or conquered, including but not limited to fire, earthquake, flood or other natural disaster, war, military act, strike, pandemic, failure of electricity, telephone service or IT system, financial crisis, halt of related market transaction, or change of national legal rules or policy that prevent the derivatives transaction to be implemented normally. The Bank met agreement with all the individual, institutional and inter-bank customers about force Majeure to exempt obligation of contract breaching.
Changes of market price or product fair value of invested derivatives in the
In 2009, the Bank did not see big fair value change of invested derivatives during the reported period. Regarding derivative financial instruments, the Bank engage the evaluation technique to determine the value. The evaluation
Page 10 of 26
reported period. While making analysis on derivatives fair value, specific methods in use with relevant presumptions and parameters should be disclosed.
technique includes reference to familiar circumstances and the price used in latest market trading of each party voluntary for trading, and reference to the current fair values and discounted cash flow technique of other essentially same financial instruments. Evaluation technique may use market parameter if feasible. However, the management team needs to evaluate in light of the credit risk, market fluctuation rate and relevance of itself and the trading counterparts when lack of market parameter.
Explanation on if there is major change of accounting policy or accounting settlement principle related to derivatives occurred in the reported period compared with that of last reported period.
The Bank stipulate accounting policy and accounting settlement principle in line with the Corporate Accounting Standard. There is no major change of relevant policy.
Specific comments from independent directors, sponsors or financial advisors on derivatives investment and risk control.
Independent Directors of the Bank believe: the Bank’s derivatives transaction business is a commercial banking business approved by regulator. The Bank has established a relative complete risk management system, which is effective for risk control on derivatives transaction.
b. Position of derivatives investment at the end of reporting period
(In RMB Thousand)
Agreement Type
Beginning Agreement
Amount (Nominal)
Ending Agreement
Amount (Nominal)
Gains/Losses on fair value in the Reported Period
Percentage of Ending Agreement Amount (Nominal) to Ending
Equity (%) Foreign exchange forward agreement 20,137,068 26,824,849 -7,376 121.33%
Interest rate swap agreement 800,000 2,600,000 -3,347 11.76%
Stock option agreement 93,356 93,356 2 0.42% Equity exchange agreement 93,356 93,356 -9 0.42%
Total 21,123,780 29,611,561 -10,730 133.93%
Derivative instruments of the Bank are customer deals for customer service; the Bank take
derivatives mainly for squaring the risk with market to hedge the risk. The bank applies product
limit management on derivatives transaction, monitoring position, market risk exposure and
gain/losses of various products with the limit. The limit is set out by ALCO, a committee composed
of senior management, for implementation every year. The Bank produce the market risk report by
middle-office monitoring department which is completely independent from trading department and
copy to ALCO members, reporting the position, risk, and gain/loss of derivative products, and
assessing if the business is run within the limit. Risk Management Committee under the board
regularly hears the market risk control report on derivatives products. The Bank formulated relevant
settlement methods for derivatives in line with the 2006 Corporate Accounting Standard. Market
value, gain/loss, and position of derivatives are computed by system every day and get back to the
trading, monitoring, and settlement departments.

Page 11 of 26
3.6.5 Shares offering plan raised by shareholders holding more than 30% of total shares and the
implementation, and whether there is any situation of providing funds or providing external
guarantee in violation of regulations to controlling shareholder or its related party.
□Applicable √not applicable
3.6.6 Signing and implementation of major contracts in the reporting period.
□Applicable √not applicable
3.6.7 Reception of investigation, communication and interview within the reported period.
√Applicable □not applicable
In the reported period, the Bank conducts communication with investors in respect of
performance and financial status. The Bank also accepts inquiry by phone from individual investors.
The contents mainly include: development strategy, periodic report, interim report with illustration,
disclosed business and management information and major events, corporate culture, and other
related information. According to the requirement of SSE Guidelines on Fair Information Disclosure
of Listed Company, the Bank and relevant information disclosure obligators strictly observe the
principle of fair information disclosure, and there is no situation in violation of it.
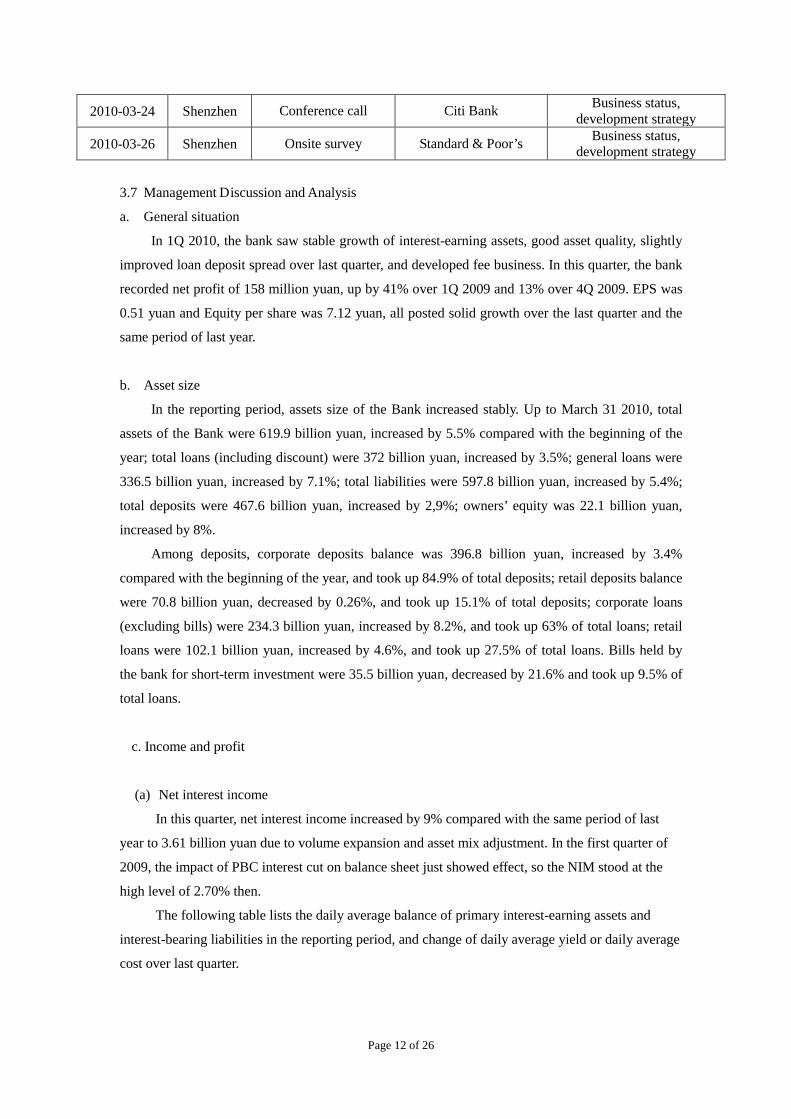
Time Locale Reception Manner Reception Target Contents and provided materials
2010-01-07 Shenzhen Onsite survey Sinolink Securities Business status, development strategy
2010-01-12 Shenzhen Onsite survey Guosen Securities,
Harvest Fund, Yinhua Fund
Business status, development strategy
2010-01-19 Shanghai Investor communication
UBS Great China Seminar, All sorts of investors including
securities traders and funds investors
Business status, development strategy
2010-01-21 Shenzhen Onsite survey Moody’s Business status, development strategy
2010-01-28 Shenzhen Onsite survey Orient Securities,
Xiangcai Securities, Nanjing Securities
Business status, development strategy
2010-02-03 Shanghai Onsite survey Soros Fund Business status, development strategy
2010-02-11 Beijing Onsite survey Nevsky Capital Business status, development strategy
2010-03-12 Shenzhen Onsite survey &
Telephone communication
All sorts of investors including securities traders and funds
investors
Performance disclosure for 2009 Annual Report
2010-03-22 Shenzhen Onsite survey China Southern Fund, Sinolink Securities
Business status, development strategy
2010-03-23 Beijing Onsite survey Sloane Robinson LLP Business status, development strategy
Page 12 of 26
2010-03-24 Shenzhen Conference call Citi Bank Business status, development strategy
2010-03-26 Shenzhen Onsite survey Standard & Poor’s Business status, development strategy
3.7 Management Discussion and Analysis
a. General situation
In 1Q 2010, the bank saw stable growth of interest-earning assets, good asset quality, slightly
improved loan deposit spread over last quarter, and developed fee business. In this quarter, the bank
recorded net profit of 158 million yuan, up by 41% over 1Q 2009 and 13% over 4Q 2009. EPS was
0.51 yuan and Equity per share was 7.12 yuan, all posted solid growth over the last quarter and the
same period of last year.
b. Asset size
In the reporting period, assets size of the Bank increased stably. Up to March 31 2010, total
assets of the Bank were 619.9 billion yuan, increased by 5.5% compared with the beginning of the
year; total loans (including discount) were 372 billion yuan, increased by 3.5%; general loans were
336.5 billion yuan, increased by 7.1%; total liabilities were 597.8 billion yuan, increased by 5.4%;
total deposits were 467.6 billion yuan, increased by 2,9%; owners’ equity was 22.1 billion yuan,
increased by 8%.
Among deposits, corporate deposits balance was 396.8 billion yuan, increased by 3.4%
compared with the beginning of the year, and took up 84.9% of total deposits; retail deposits balance
were 70.8 billion yuan, decreased by 0.26%, and took up 15.1% of total deposits; corporate loans
(excluding bills) were 234.3 billion yuan, increased by 8.2%, and took up 63% of total loans; retail
loans were 102.1 billion yuan, increased by 4.6%, and took up 27.5% of total loans. Bills held by
the bank for short-term investment were 35.5 billion yuan, decreased by 21.6% and took up 9.5% of
total loans.
c. Income and profit
(a) Net interest income
In this quarter, net interest income increased by 9% compared with the same period of last
year to 3.61 billion yuan due to volume expansion and asset mix adjustment. In the first quarter of
2009, the impact of PBC interest cut on balance sheet just showed effect, so the NIM stood at the
high level of 2.70% then.
The following table lists the daily average balance of primary interest-earning assets and
interest-bearing liabilities in the reporting period, and change of daily average yield or daily average
cost over last quarter.

Page 13 of 26
(In RMB million, %)
Items
January-March 2010 October-December 2009 Daily average
balance Average
return/cost (%) Daily average
balance Average
return/cost (%) Interest-earning Assets Loans and advances (excluding discount) 330,112 5.25% 315,925 5.21%
Bond investment 90,066 2.81% 87,240 3.05% Placement at central bank 53,130 1.51% 46,560 1.52% Bills and inter-bank business 123,902 2.68% 105,018 2.07% Others 7,529 1.26% - - Total interest-earning assets 604,739 3.98% 554,742 3.97% Interest-bearing Liabilities - Deposits 462,947 1.48% 432,095 1.48% Bond issue 9,465 5.93% 9,459 5.93% Inter-bank business 106,054 1.86% 92,113 1.60% Others 2,733 1.51% - - Total interest-bearing liabilities 581,199 1.62% 533,666 1.58% Loan-to-deposit spread 3.77% 3.73% NIS 2.36% 2.39% NIM 2.42% 2.45% NIS = yield of interest-earning assets-cost of interest-bearing liabilities NIM = (net interest income/average daily balance of interest-earning assets)*100%
Interests income of loans and advances
(In RMB million,%)
Interests paid for customer deposits
(In RMB million,%)
Item January-March 2010 October-December 2009
ADB Average cost ratio (%) ADB Average cost
ratio (%)
Corporate deposits 271,784 1.52% 248,265 1.50% Including: demand deposits 130,074 0.56% 120,242 0.56%
time deposits 141,710 2.40% 128,023 2.39%
Item January-March 2010 October-December 2009
ADB Average return ADB Average
return) Corporate loans (Excl. discount) 229,721 5.28% 220,461 5.23%
Personal loans 100,391 5.17% 95,464 5.16% Loans and advances(Excl. discount) 330,112 5.25% 315,925 5.21%

Page 14 of 26
Including: treasury and negotiation deposits 33,286 3.76% 31,050 3.56%
Retail deposits 70,851 1.57% 66,174 1.66% Including: demand deposits 23,964 0.36% 21,685 0.36%
savings deposits 46,887 2.19% 44,489 2.29% Guarantee deposits 120,312 1.33% 117,656 1.32% Total deposits 462,947 1.48% 432,095 1.48%
(b). Net fee income
The growth of net fee and commission income is as follows:
(In RMB million, %)
Item Jan-Mar 2010 Jan-Mar 2009 Changes during
Jan-Mar. 2010 over the same period of last year
Fee income of settlement 113 79 43.33% Fee income on wealth management 8 2 232.36%
Fee income on brokerage and trust business 14 11 22.16%
Fee income of credit card 121 85 42.52% Fee income on consultancy 70 31 128.95% Fee income on trade finance 14 6 127.31% Account management fee 6 6 - Others 21 21 - Subtotal of fee and commission income 367 241 51.99%
Expenses for brokerage business 28 23 18.53% Expenses for credit card 14 17 -17.70% Others 7 5 46.45% Subtotal of fee and commission expenses 49 45 7.93%
Net fee and commission income 318 196 62.22%
In this quarter, fee income increased by 62% over the same period of last year to 318 million
yuan, largely on account of expansion of customer base and business volume, as well as pricing
management.
Settlement fee income and brokerage and trust income grew by 43% and 22% respectively
over the same period of last year due to increase of customer and settlement volume.
Credit card fee income grew by 43%, in relation to increase of effective card number and
transaction volume, as well as adjustment of pricing strategy.
Consultancy fee income grew by 129%, largely due to increase of the underwriting business
of debt financing instrument in the quarter, as the bank underwrote 5 commercial notes as leading
underwriter and saw substantial growth of underwriting consultancy income.
Fee income on trade finance grew by 127%, following substantial increase of import payment

Page 15 of 26
business and factoring business volume.
(c). Net other non interest income
Net other operating income includes investment return, gains/losses from fair value changes,
foreign exchange gains/losses and other business income. In this quarter, net other operating income
decreased by 41% compared with the same period of last year. The main reason is that, the Bank
capitalized on the market conditions and recorded high bond gains in 1Q 2009, and not in 1Q 2010,
as interest rates on bonds have risen.
(d). Operating expense
In 1Q 2010, operating expense of the Bank was 1.68 billion yuan, increased by 15% compared
with last quarter, which is primarily due to growth of business volume as well as continuous
investment on management process promotion and IT system. Cost to income ratio of the Bank
during January-March 2010 (excluding business tax) amounted to 41.25%, up by 2.28 percentage
points from the same period of last year, almost the same as the annual cost to income ratio in full
year 2009.
During January to March 2010, average income tax rate was 21%, 5 percentage points down
from the 26% of the same period of last year, on the back of state income tax policy adjustment and
income tax composition change in different tax regions.
(In RMB million)
January- March 2010
January- March 2009
Growth
Profit before tax 1,997 1,517 31.64% Income tax 419 395 6.08% Actual income tax 20.98% 26.04% -5.06 ppts
d. Asset quality
(a) The overall asset quality at the end of reported period
(In RMB million)
5-tier grading March 31, 2010 December 31, 2009 March 31, 2009
Balance % Balance % Balance % Normal 368,568 99.08% 355,717 98.94% 313,930 98.28% Special Mention 1,076 0.29% 1,356 0.38% 3,542 1.11% NPL 2,330 0.63% 2,444 0.68% 1,963 0.61% Including: Substandard 1,351 0.36% 1,474 0.41% 1,893 0.59%
Doubtful 588 0.16% 529 0.15% 67 0.02% Loss 390 0.11% 441 0.12% 3 0.00%
Total 371,974 100.00% 359,517 100.00% 319,435 100.00%
Notes: The loan balance in the table includes the discount loan balance.

Page 16 of 26
Up to March 31 2010, NPL balance of the Bank was 2,330 million yuan, decreased by 114
million yuan or 4.66% from the beginning of the year. NPL ratio was 0.63%, down by 0.05 ppts
from the beginning of the year. 41% of the NPL balance was made before 2005; NPLs initially
issued after (including) January 01 2005 were 1,382 million yuan, as 59 % of the total NPLs.
The Bank sets the initial task for credit work as making more high-quality loans and
preventing and resolving various risk that may arise from existing loans. SDB seriously implements
the national macro control policy of giving differential treatment to different industries, focuses on
SME finance, trade finance, and retail credit, strictly implements the state credit policy against
“two-high” industries and industries with overcapacity; reinforces inspection through the lending
process, requires strict review of the rationality of loan usage and authenticity of transaction, and
focuses on analysis of the first payment source of credit customers; conducts special inspection and
risk inspection for major areas such as local government financing vehicle and major step such as
loan disbursement; enhanced disposal of loans with early-warning signaling and NPLs, and keeps
the loan quality at a solid level.
(b) Loan structure and quality segments by industry in the reported period
(In RMB million)
Industry March 31 2010 December 31 2009
Balance % NPL Ratio Balance % NPL Ratio Agriculture, stockbreeding and fish culture
717 0.19% 0.00% 590 0.16% 0.00%
Excavation (Heavy industry) 4,307 1.16% 0.00% 3,523 0.98% 0.00%
Manufacturing (Light industry 66,704 17.93% 1.06% 59,974 16.68% 1.35%
Energy 8,808 2.37% 0.01% 8,001 2.23% 0.01% Transportation, storage and communication 18,083 4.86% 0.06% 17,405 4.84% 0.34%
Commerce 39,077 10.51% 2.08% 36,070 10.03% 2.13% Real estate 25,426 6.84% 1.20% 23,255 6.47% 1.48% Social service, technology, culture and sanitation
52,872 14.21% 0.14% 52,517 14.61% 0.04%
Construction 15,794 4.25% 0.39% 13,405 3.73% 0.42% Others (mainly personal loans) 104,692 28.15% 0.34% 99,491 27.67% 0.39%
Bills discount 35,494 9.54% 0.00% 45,286 12.60% 0.00% Total loans and advances 371,974 100.00% 0.63% 359,517 100.00% 0.68%
Note: In light of loans quality by industry, as of March 31 2010, NPLs of the bank were mainly
concentrated on commercial, real estate and manufacturing industries. NPL ratios of other industries
were lower than 1%. Real estate NPLs were primarily legacy development NPLs made before 2005.
Page 17 of 26
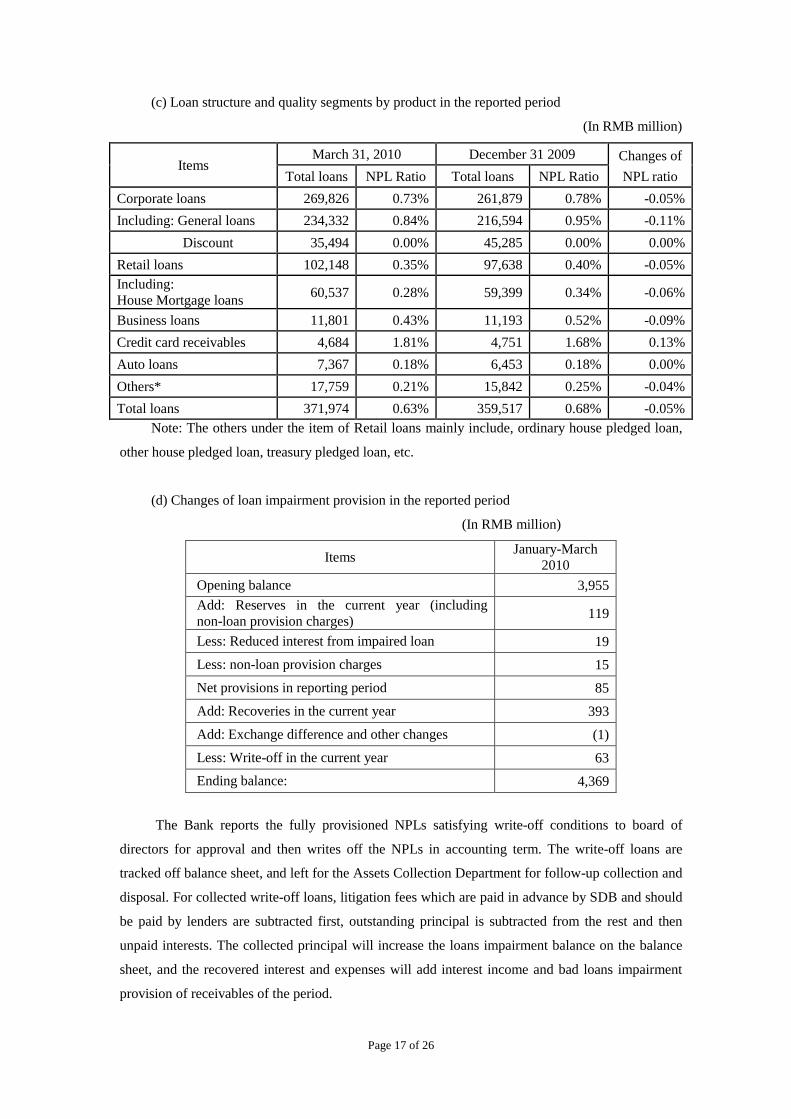
(c) Loan structure and quality segments by product in the reported period
(In RMB million)
Items March 31, 2010 December 31 2009 Changes of
NPL ratio Total loans NPL Ratio Total loans NPL Ratio Corporate loans 269,826 0.73% 261,879 0.78% -0.05% Including: General loans 234,332 0.84% 216,594 0.95% -0.11%
Discount 35,494 0.00% 45,285 0.00% 0.00% Retail loans 102,148 0.35% 97,638 0.40% -0.05% Including: House Mortgage loans 60,537 0.28% 59,399 0.34% -0.06%
Business loans 11,801 0.43% 11,193 0.52% -0.09% Credit card receivables 4,684 1.81% 4,751 1.68% 0.13% Auto loans 7,367 0.18% 6,453 0.18% 0.00% Others* 17,759 0.21% 15,842 0.25% -0.04% Total loans 371,974 0.63% 359,517 0.68% -0.05%
Note: The others under the item of Retail loans mainly include, ordinary house pledged loan,
other house pledged loan, treasury pledged loan, etc.
(d) Changes of loan impairment provision in the reported period
(In RMB million)
Items January-March 2010
Opening balance 3,955 Add: Reserves in the current year (including non-loan provision charges) 119
Less: Reduced interest from impaired loan 19 Less: non-loan provision charges 15 Net provisions in reporting period 85 Add: Recoveries in the current year 393 Add: Exchange difference and other changes (1) Less: Write-off in the current year 63 Ending balance: 4,369
The Bank reports the fully provisioned NPLs satisfying write-off conditions to board of
directors for approval and then writes off the NPLs in accounting term. The write-off loans are
tracked off balance sheet, and left for the Assets Collection Department for follow-up collection and
disposal. For collected write-off loans, litigation fees which are paid in advance by SDB and should
be paid by lenders are subtracted first, outstanding principal is subtracted from the rest and then
unpaid interests. The collected principal will increase the loans impairment balance on the balance
sheet, and the recovered interest and expenses will add interest income and bad loans impairment
provision of receivables of the period.

Page 18 of 26
(e) Overdue and non-accruing loans in the reported period
(In RMB million)
Item March 31 2010 December 31 2009
Balance Percentage to total loans Balance Percentage
to total loans Overdue loans 514 0.14% 164 0.05% Non-accruing loans 2,132 0.57% 2,565 0.71%
Note: a. As of the end of the reporting period, balance of overdue loans increased by 350
million yuan from the beginning of the year to 514 million yuan, primarily because some enterprises
failed to make due payment due to external impacts and other factors.
b. As of the end of the reporting period, balance of non-accruing loans dropped by 433 million
yuan to 2,132 million yuan, largely due to decline of commercial non-accruing loans. The Bank
enhanced loan maturity management and follow-up on status of loan payment and asset quality, and
adopt measures to remind customers to make due payment in time.
(f) Real estate development loan
As of the end of reporting period, Real estate development loan balance was 14.4 billion yuan,
amounting to 3.87% of total loans. The Bank constantly adopts prudential credit policy towards real
estate development loan. As of the end of March 2010, NPL balance in real estate development
loans was 193 million yuan, and the NPL ratio was 1.34%. All NPLs are loans initially made before
2005. New loans made since 2005 were kept in good quality, and the NPL balance was 0.
(g) Collection of NPA
In the first quarter of 2010, the Bank totally collected NPA (including loan and non-loan assets)
of 804 million yuan, including principal collection of 729 million yuan (including non-loan of 2
million yuan). Among the credit assets principal, 393 million yuan was written-off loan principal,
and 334 million yuan was collected from NPL principal which have not been written off. 97% of the
credit assets collection is in cash; the remainder in the manner of repossessed assets. Non-credit
assets were collected 100% in cash.
e. Capital supplementation
To further build up core capital and enhance capital strength, the Bank held the 2009 2nd
Extraordinary Shareholders’ Meeting on June 29 2009, which approved the Proposal of Non-Public
Offering of Shenzhen Development Bank. The plan is to issue to PA Life new shares of no less than
370 million and up to 585 million at 18.26 Yuan per share to raise up to RMB 10,683 million yuan,
which will all be used to supplement core capital after deducting relevant issuance fees. The plan is

Page 19 of 26
subject to approval of CBRC, CIRC, CSRC and other related authorities.
As of March 31 2010, CAR and core CAR of the Bank was 8.66% and 5.46% respectively.
Computed with data at the end of March, and counted in core capital brought by the NPO from PA,
CCAR of the Bank would be over 7% and CAR over 10%. On the basis of the issuance, the Bank
will choose appropriate opportunity to further add tier-2 capital.
(In RMB million)
Item March 31 2010 December 31 2009
Changes over ending 2009
Net capital 33,978 31,905 +6.50% Including: net core capital 21,433 19,854 +7.95% Net risk-weighted assets 392,394 359,508 +9.15% Capital adequacy ratio 8.66% 8.88% -0.22 ppts Core capital adequacy ratio 5.46% 5.52% -0.06 ppts
f. Business development
In the reported period, each business of the Bank developed well.
(1) Corporate business
Commercial business developed well in the first quarter. As of the end of March, commercial
deposit balance grew by 3.4% from the beginning of the year to 396.8 billion yuan, general loan
balance grew by 8.2% to 234.3 billion yuan, and international settlement substantially grew by 52%
to USD 19.1 billion.
In face of upward macro economic environment and requirements of macro control and
regulatory policy, the commercial line focused on three aspects of work: first, endeavoring to
promote the value of small-amount commercial accounts; second, exploring new territory of trade
finance; and third, controlling lending pace and rationally allocating credit resources, in order to
make sure balanced annual credit growth and structure improvement.
In the first quarter, trade finance continued the growing trend, up by 5.81% from the beginning
of the year; trade finance customer number grew by 9% to 6,247; NPL still kept at the low level of
0.38%.
Referring to the mix of trade finance, domestic and international trade finance all recorded
increase. Domestic trade finance grew by 4.7 billion yuan, or 4% from the beginning of the year,
and international trade finance grew by 2.4 billion yuan, or 32%. In regional segmentation, the
South and Central China and East China posted increase of 2.6 billion yuan and 2.7 billion yuan
respectively, as 36% and 38% of the whole bank increase.

Page 20 of 26
Trade finance business in the reporting period:
(In RMB million)
Item March 31 2010 % December 31
2009 % Changes
Domestic trade finance 119,893 92.4% 115,134 93.9% 4.1% Including: South and Central
China 45,986 35.4% 43,622 35.6% 5.4%
East China 28,284 21.8% 26,054 21.2% 8.6% North China & Northeast 38,234 29.5% 38,249 31.2% -0.04% Southwest and other regions 7,389 5.7% 7,209 5.9% 2.5% International trade finance
(including offshore) 9,855 7.6% 7,487 6.1% 31.6%
Total trade finance balance 129,748 100.0% 122,621 100.0% 5.8%
(2) Retail business
2010 is the second year the Retail Banking proceeds with the implementation of the
“Leapfrog Project” on the basis of the outstanding performance achieved in the first year. In 2010,
the Retail sets the annual chief working strategy as “taking the opportunity of new front office
working mode, promoting cross-selling in an all-around manner on the basis of specialty, and
promoting deposit raising ability, value customer running ability, and general profitability”, and
initiated several important projects including “roll-out of front-office working mode (Outlet
Leapfrog Project)”, “sales model reengineering”, and “deposit promoting”. In the first quarter of
2010, business volume and fee business income continued to develop steadily.
The retail lending business adopts the strategy of balance growth. As of the end of 1Q 2010,
retail lending balance (excluding credit card) grew by 5% to 97.4 billion yuan.
In product innovation, the Bank entirely implemented the CBRC Temporary Management
Methods for Individual Loans and enhanced management of loan usage, and upgraded the product
of “E-lending Easy Repaying” and “E-Card Easy Loan”.
Basing on the separate of retail lending business from risk and operations, the Bank
continually improves the whole-process management of retail lending business, builds highly
efficient middle and back supportive office, and promotes process efficiency and customer service
level.
In wealth management business, the Bank actively promotes product innovation and
enhances the brand awareness of wealth management business, strengthens cross-selling and
promotes product selling capability, so as to drive rapid development of wealth management volume
and fee business income. As of the end of 1Q 2010, the wealth management sales volume grew by
409% over the same period of last year to 17 billion yuan. Business developed quickly in the
following areas: sales of banking wealth management product, up by 667% to 15.1 billion yuan,
non-monetary fund sales, up by 260% to 0.55 billion yuan, insurance sales, up by 550% to 0.3
Page 21 of 26
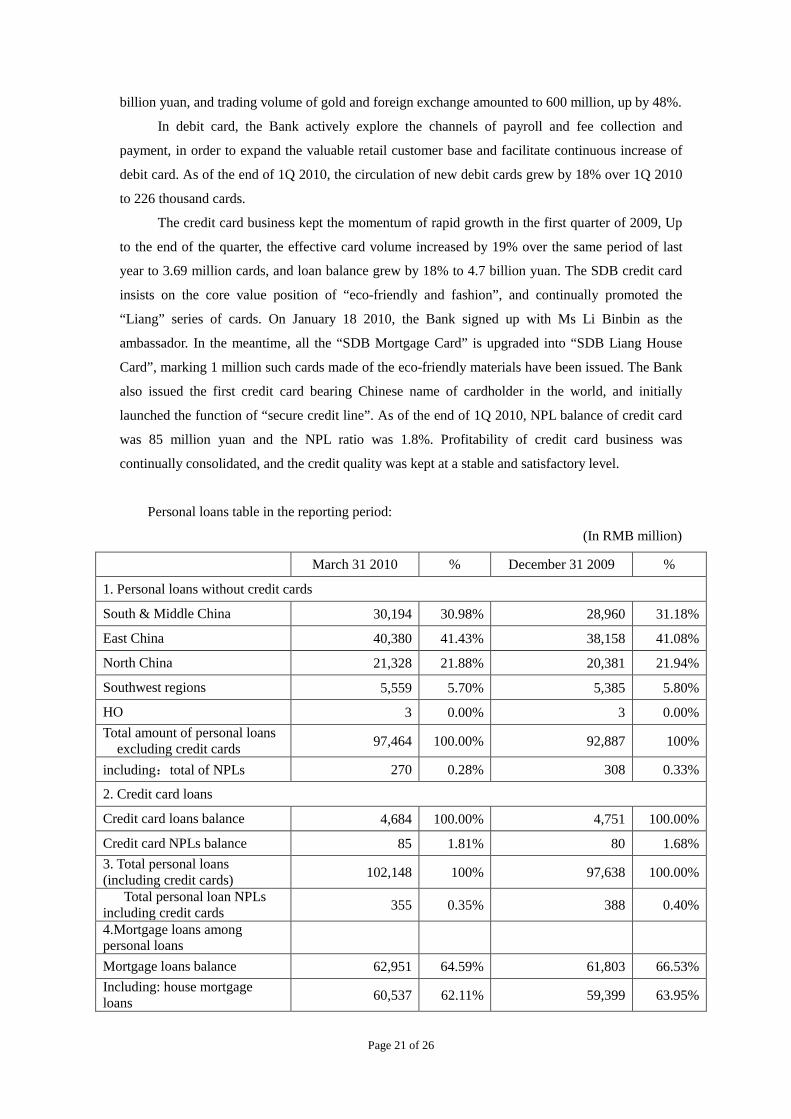
billion yuan, and trading volume of gold and foreign exchange amounted to 600 million, up by 48%.
In debit card, the Bank actively explore the channels of payroll and fee collection and
payment, in order to expand the valuable retail customer base and facilitate continuous increase of
debit card. As of the end of 1Q 2010, the circulation of new debit cards grew by 18% over 1Q 2010
to 226 thousand cards.
The credit card business kept the momentum of rapid growth in the first quarter of 2009, Up
to the end of the quarter, the effective card volume increased by 19% over the same period of last
year to 3.69 million cards, and loan balance grew by 18% to 4.7 billion yuan. The SDB credit card
insists on the core value position of “eco-friendly and fashion”, and continually promoted the
“Liang” series of cards. On January 18 2010, the Bank signed up with Ms Li Binbin as the
ambassador. In the meantime, all the “SDB Mortgage Card” is upgraded into “SDB Liang House
Card”, marking 1 million such cards made of the eco-friendly materials have been issued. The Bank
also issued the first credit card bearing Chinese name of cardholder in the world, and initially
launched the function of “secure credit line”. As of the end of 1Q 2010, NPL balance of credit card
was 85 million yuan and the NPL ratio was 1.8%. Profitability of credit card business was
continually consolidated, and the credit quality was kept at a stable and satisfactory level.
Personal loans table in the reporting period:
(In RMB million)
March 31 2010 % December 31 2009 %
1. Personal loans without credit cards
South & Middle China 30,194 30.98% 28,960 31.18%
East China 40,380 41.43% 38,158 41.08%
North China 21,328 21.88% 20,381 21.94%
Southwest regions 5,559 5.70% 5,385 5.80%
HO 3 0.00% 3 0.00% Total amount of personal loans
excluding credit cards 97,464 100.00% 92,887 100%
including:total of NPLs 270 0.28% 308 0.33%
2. Credit card loans
Credit card loans balance 4,684 100.00% 4,751 100.00%
Credit card NPLs balance 85 1.81% 80 1.68% 3. Total personal loans (including credit cards) 102,148 100% 97,638 100.00%
Total personal loan NPLs including credit cards 355 0.35% 388 0.40%
4.Mortgage loans among personal loans
Mortgage loans balance 62,951 64.59% 61,803 66.53% Including: house mortgage loans 60,537 62.11% 59,399 63.95%

Page 22 of 26
Mortgage NPLs 185 0.19% 217 0.23% Including: house mortgage NPLs 171 0.28% 200 0.34%
Note: The total retail loans exclude the credit card loan which computing the the proportion
of mortgage loan to total retail loans.
As of the end of 1Q 2010, retail NPL balance (excluding credit card, similarly hereinafter)
dropped by 38 million yuan to 270 million yuan, and NPL ratio dropped by 0.05 ppts, or 15.95%, to
0.28%. The retail NPL appeared the trend of monthly stepping down.
(3) Treasury and financial institution business
In the first quarter of 2010, PBC raised the required reserve rate for two sessions, and
moderately controlled money growth through continually adjusting PBC note rate and enhancing
extent of repo. In the meantime, the macro control policy put emphasis on balanced credit lending,
guide rational industry mix adjustment, and managing inflation expectation. Under such macro
environment, the Treasury line further coordinated the whole bank resources, enhanced rapid
joint-action between head quarter and branches, improved management skill and service level, and
promoted multiple development of customer mix, business mix and profit mix. All the works
achieved good results.
Main business activities in 1Q:
◆ The underwriting of debt financing tools made good achievements. In 1Q the bank
successfully underwrote 5 pieces of short-term commercial paper as the main underwriter, saw
substantial increase of sub-underwriting volume of commercial paper and mid-term notes, and
served as an increasingly active market player.
◆ The noble metal business kept solid momentum. The newly launched business of T+D
individual noble metal transaction business was popular at market, with stable increase of account
opening and trading volume. The in-and-out gold vault volume ranked as No.6 in China.
◆ C ontinually served the sm all and m iddle financial institutions. A s of the end of 1Q the B ank
has opened inter-bank settlement business with 6 banks.
(4) Liquidity management
Management of the Bank places a lot of attention on liquidity management. At the end of
March, liquidity of the bank is solid, with CBRC liquidity ratio reached 41.9%, much higher than
the regulatory requirement of 25%. The bank monitors asset liquidity through the liquidity ratio and
other internal measurements.
In order to effectively monitor the risk, the Bank diversifies fund source channels, and monitor
the fund can be raised within 1 month—quick cash. The bank kept an appropriate quick cash
position, in order to deal with the circumstance of severe deposit outflow related to potential
liquidity risk, and conducted stress test each month and make sure meeting the internal requirement.

Page 23 of 26
g. Branches information
In the reporting period, there is 1 new outlet (affiliated to Haikou Branch). Up to March 31
2010, there were 303 operating outlets of the Bank approved by regulator.
The Board of Directors of SDB
April 29, 2010
Attachment:
1. Balance Sheet
2. Income Statement
3. Statement of Cash Flows

Page 24 of 26
Assets: 2010-3-31 2009-12-31
Cash and balances due from central bank 56,488,499 54,243,952
Precious metals 2,946 3,302
Balances due from other financial institutions 11,242,958 15,592,536
Inter-bank placements 5,015,728 5,361,139
Financial assets at fair value through profit or loss 1,352,405 1,132,048
Derivative financial assets 110,577 99,996
Financial assets under resale agreements 57,209,126 40,923,396
Accounts receivable 7,707,730 4,782,161
Interest receivable 1,957,240 1,625,700
Loans and advances 367,604,322 355,562,545
Available-for-sale financial assets 38,308,612 36,998,409
Held-to-maturity investments 36,229,930 34,585,440
Receivables type investments 30,292,100 30,427,100
Long-term equity investments 364,313 392,705
Investment properties 536,627 523,846
Fixed assets 1,918,952 1,714,461
Intangible assets 147,047 156,788
Deferred tax assets 1,532,637 1,582,934
Other assets 1,905,876 2,102,576
Total assets 619,927,625 587,811,034
Liabilities and shareholders’ equityBalances due to other financial institutions 90,722,119 74,139,673
Inter bank takings 9,000,000 7,570,118
Financial liabilities at fair value through profit or loss
Derivative financial liabilities 42,852 21,540
Balances arising from repurchase agreements offinancial assets 12,368,006 13,733,384
Customer deposits 467,614,913 454,635,208
Salaries payable 1,072,549 1,681,728
Tax payable 729,546 652,289
Accounts payable 1,418,486 850,881
Interest payable 2,624,674 2,682,162
Issued subordinated bonds 9,466,200 9,462,714
Provision for litigation 3,370 3,358
Deferred tax liabilities 123,064 94,525
Other liabilities 2,632,020 1,813,845
Total liabilities 597,817,799 567,341,426
Shareholders’ equity:
Share capital 3,105,434 3,105,434
Capital reserve 7,079,172 7,017,072
Revenue reserve 1,283,957 1,283,957
General risk reserve 4,676,276 4,676,276
Retained earnings 5,964,987 4,386,870
Shareholders’ equity 22,109,826 20,469,609Total liabilities and shareholders’ equity 619,927,625 587,811,034
Shenzhen Development Bank Co., Ltd.BALANCE SHEETAs of Mar 31, 2010

Page 25 of 26
3-months ended 3-months ended
Item 2010-3-31 2010-3-31
Operating income 4,084,252 3,760,604Net interest income 3,610,289 3,299,257Interest income 5,934,702 5,872,666
Interest expense 2,324,413 2,573,409
Net fee and commission income 317,610 195,809Fee and commission income 366,699 241,290
Fee and commission expenses 49,089 45,481
Other operating net income 156,353 265,538Investment income / (expenses) 58,549 185,933
Gain / (losses) arising from fair value changes offinancial instruments 9,520 (24,832)
Gain / (losses) arising from fair value changes ofinvestment property 7,304 (2,458)
Exchange gain / (losses) 52,189 78,117
Other operating income 28,791 28,778
Operating expenses 1,969,629 1,725,061Business tax and surcharges 284,743 259,374
Business and administrative expenses 1,684,886 1,465,687
Operating profit before impairment provisions 2,114,623 2,035,543Asset impairment charges 119,472 521,909
Operating profit 1,995,151 1,513,634 Add:Non-operating income 3,082 1,185
Less: Non-operating expense 1,212 (2,300)
Profit before tax 1,997,021 1,517,119 Less: Income tax expense 418,903 395,042
Net profit 1,578,118 1,122,077
Earnings per share Basic earnings per share 0.51 0.36
Diluted earnings per share 0.51 0.36
Other comprehensive income 62,100 (450,738)Total comprehensive income 1,640,218 671,339
Shenzhen Development Bank Co., Ltd. INCOME STATEMENT
For the period ended Mar, 31 2010

Page 26 of 26
3-months ended 3-months ended
Items 2010-3-31 2010-3-31
1. Cash flows from operating activities:
Net increase in customer deposits anddeposits from financial institutions 29,562,150 42,120,909 Net increase in money market takings fromother financial institutions 1,429,882 12,171,590 Net decrease in balances with central bankand other financial institutions 554,746 - Net decrease in money market placements 406,234 - Net increase in accounts payable 567,604 -
Net decrease in balances under purchase andresale agreements - 2,258,366 Cash inflow from receipt of interest, fee andcommission 5,525,798 5,461,874 Cash inflow from other operating activities 1,514,769 1,244,546 Cash inflows from operating activities 39,561,183 63,257,285
Net increase in loans and advances tocustomers 12,519,645 35,855,797
Net increase in balances under purchase andresale agreements 8,944,750 - Net increase in accounts receivable 2,925,569 5,029
Net decrease in balances under sale andrepurchase agreements 1,365,378 7,529,456 Net decrease in accounts payable - 464,702 Cash flow from payment of interest, fee andcommission 2,057,478 3,075,460
Cash flow from payment of staff cost and otherrelated expenses 1,501,590 1,026,817 Payment of all types of taxes 577,282 802,300 Net increase in balances with central bank andother financial institutions - 11,149,037 Net increase in money market placements - 600,053 Cash outflow from other operating activities 1,059,854 42,245 Cash inflows from operating activities 30,951,546 60,550,896
Net cash flow arising from operatingactivities 8,609,637 2,706,389
2. Cash flows from investing activities:
Cash received from redemption of investments53,067,191 21,429,050
Cash received from investment return 305,625 331,725 Cash received from disposal of fixed assetsand investment properties - 13,943 Cash inflows from investing activities 53,372,816 21,774,718
Payments made for investments 60,019,631 24,203,652 Payments made for purchase of fixed assets,intangible assets and construction in progress 104,051 84,932 Cash outflows from investing activities 60,123,682 24,288,584
Net cash flow arising from investingactivities (6,750,866) (2,513,866)
3. Cash flows from financing activities:
Payments made for dividend distribution andsettlement of interests 370,025 254,193 Cash outflows from financing activties 370,025 254,193
Net cash flow arising from investingactivities (370,025) (254,193)
4. Effect of exchange rate changes on cash andcash equivalent - -
5. Net increase / (decrease) in cash and cashequivalent 1,488,746 (61,670)
Add: Cash and cash equivalent at the beginningof the period 54,703,483 37,124,458
6. Cash and cash equivalent at the end of theperiod 56,192,229 37,062,788
Shenzhen Development Bank Co., Ltd.Cash flow statement
For the period ended Mar, 31 2010