Embed Size (px)
Citation preview

Shenzhen Asia Test Technology Co., Ltd.
Report No.
- Page ATT2017SZ0911367F 1 of 57 -
FCC RADIO TEST REPORT FCC ID: RI5SBT5200
Product: SHARPER IMAGE 5.1CH WITH SOUND BAR
Trade Name: SHARPER IMAGE
Model Name: SBT5200
Addition Model: N/A
Prepared for
Dongguan Earson Audio Technology Co., Ltd Chuangye Industrial Area, Guanqiaojiao Community, Wanjiang District,
Dongguan City, Guangdong,China
Prepared by
Shenzhen Asia Test Technology Co.,Ltd. 7 / F, Xinwei Building, Gushu Village, Xixiang Town, Baoan District,
Shenzhen, China

Shenzhen Asia Test Technology Co., Ltd.
Report No.
- Page ATT2017SZ0911367F 2 of 57 -
TEST RESULT CERTIFICATION
Manufacture's Name ............ : Dongguan Earson Audio Technology Co., Ltd
Address ................................. : Chuangye Industrial Area, Guanqiaojiao Community, Wanjiang District, Dongguan City, Guangdong,China
Product description
Product name ........................... : SHARPER IMAGE 5.1CH WITH SOUND BAR
Model and/or type reference : SBT5200
Rating(s) ................................ : DC 12V BY ADAPTER AC 120V/60HZ
Standards ............................. : FCC Part15.249
Test procedure ...............................ANSI C63.10-2013
This device described above has been tested by ATT, and the test results show that the equipment under test (EUT) is in compliance with the FCC requirements. And it is applicable only to the tested sample identified in the report. This report shall not be reproduced except in full, without the written approval of ATT, this document may be altered or revised by ATT, personal only, and shall be noted in the revision of the document. Date of Test ............................................ :
Date (s) of performance of tests ............. : Jul. 02 2017 ~ Jul. 11 2017
Date of Issue ........................................... : Jul.11 2017
Test Result ............................................... : Pass
Reviewed by: Approved by:

Shenzhen Asia Test Technology Co., Ltd.
Report No.
- Page ATT2017SZ0911367F 3 of 57 -
Table of Contents
Page
1 . SUMMARY OF TEST RESULTS 4
1.1 TEST FACILITY 5
1.2 MEASUREMENT UNCERTAINTY 5
2 . GENERAL INFORMATION 6
2.1 GENERAL DESCRIPTION OF EUT 6
2.2 DESCRIPTION OF TEST MODES 7
2.3 TABLE OF PARAMETERS OF TEXT SOFTWARE SETTING 8
2.4 BLOCK DIGRAM SHOWING THE CONFIGURATION OF SYSTEM TESTED 8
2.5 DESCRIPTION OF SUPPORT UNITS(CONDUCTED MODE) 8
2.6 EQUIPMENTS LIST FOR ALL TEST ITEMS 10
3 . ANTENNA REQUIREMENT 11
3.1 STANDARD REQUIREMENT 11
3.2 EUT ANTENNA 11
3.3 CONDUCTED EMISSION MEASUREMENT 12 3.3.1 POWER LINE CONDUCTED EMISSION LIMITS 12 3.3.2 TEST PROCEDURE 13 3.3.3 DEVIATION FROM TEST STANDARD 13 3.3.4 TEST SETUP 13 3.2.5 TEST RESULT 14
3.4 RADIATED EMISSION MEASUREMENT 16 3.4.1 RADIATED EMISSION LIMITS 16 3.4.2 TEST PROCEDURE 17 3.4.3 DEVIATION FROM TEST STANDARD 17 3.4.4 TEST SETUP 18 3.4.5 TEST RESULTS (BELOW 30MHZ) 21 3.4.6 TEST RESULTS (BETWEEN 30 – 1000 MHZ) 22 3.4.7 TEST RESULTS (ABOVE 1000 MHZ) 24
4 . BANDWIDTH TEST 30 4.1 TEST PROCEDURE 30 4.2 DEVIATION FROM STANDARD 30 4.3 TEST SETUP 30 4.4 TEST RESULTS 31
5 . EUT TEST PHOTO 42 APPENDIX-PHOTOGRAPHS OF EUT CONSTRUCTIONAL DETAILS

Shenzhen Asia Test Technology Co., Ltd.
Report No.
- Page ATT2017SZ0911367F 4 of 57 -
1. SUMMARY OF TEST RESULTS Test procedures according to the technical standards:
Test Test Requirement Standard Paragraph Result
Field Strength of Fundamental
FCC PART 15 C section 15.249 (a)
ANSI C63.10: Clause 6.6
PASS
Field Strength of Unwanted Emissions
FCC PART 15 C section 15.249 (a)
section 15.249 (d)
ANSI C63.10: Clause 6.4, 6.6 and 6.7
PASS
Band Edges FCC PART 15 C
section 15.249 (d) ANSI C63.10: Clause 6.9.2
PASS
Occupied Bandwidth FCC PART 15 C section 15.215(c)
ANSI C63.10: Clause 6.9.1
PASS
Conducted Emissions at Mains Terminals
FCC PART 15 C section 15.207
ANSI C63.10: Clause 6.2
PASS
Antenna Requirement FCC PART 15 C section 15.203
FCC PART 15 C section 15.203
PASS

Shenzhen Asia Test Technology Co., Ltd.
Report No.
- Page ATT2017SZ0911367F 5 of 57 -
1.1 TEST FACILITY The test facility is recognized, certified or accredited by the following organizations: The test facility is recognized, certified, or accredited by the following organizations: FCC-Registration No.: 348715 Shenzhen Asia Test Technology Co.,Ltd. EMC Laboratory has been registered and fully described in a report filed with the FCC (Federal Communications Commission). The acceptance letter from the FCC is maintained in our files.
1.2 MEASUREMENT UNCERTAINTY The reported uncertainty of measurement y ± U,where expended uncertainty U is based on a standard uncertainty multiplied by a coverage factor of k=2,providing a level of confidence of approximately 95 %。
No. Item Uncertainty
1 Conducted Emission Test ±1.38dB
2 RF power,conducted ±0.16dB
3 Spurious emissions,conducted ±0.21dB
4 All emissions,radiated(<1G) ±4.68dB
5 All emissions,radiated(>1G) ±4.89dB
6 Temperature ±0.5°C
7 Humidity ±2%

Shenzhen Asia Test Technology Co., Ltd.
Report No.
- Page ATT2017SZ0911367F 6 of 57 -
2. GENERAL INFORMATION
2.1 GENERAL DESCRIPTION OF EUT
EUT Name: SHARPER IMAGE 5.1CH WITH SOUND BAR
Model No.: SBT5200
Addition Model: N/A
Model Differences: N/A
Operation frequency: 2402 MHz to 2480 MHz
Bluetooth Version BT 2.1+EDR
Number of channel: 79 channels
Modulation Type and Antenna Type:
GFSK,π/4DQPSK,8DPSK PCB antenna
H/W No.: V3.0
S/W No.: V4.2
Antenna Gain: 0 dBi
Brand Name: SHARPER IMAGE
Derivative model No.: N/A
Power Supply Range: DC 12V by adapter AC 120V/60Hz
Adapter: M/N:SW018S120150U1 INPUT:100-240V~, 50/60Hz, 0.5a OUTPUT:12Vdc, 1.5A
Power Cord: N/A
Signal Cable: N/A
Description of Channel:
Channel Frequency (MHz) Channel Frequency
(MHz) Channel Frequen
cy (MHz)
01 2402 39 2440 77 2478
02 2403 40 2441 78 2479
03 2404 41 2442 79 2480
04 … 42 …
05 … 43 …
06 … 44 …

Shenzhen Asia Test Technology Co., Ltd.
Report No.
- Page ATT2017SZ0911367F 7 of 57 -
2.2 DESCRIPTION OF TEST MODES
To investigate the maximum EMI emission characteristics generates from EUT, the test system was pre-scanning tested base on the consideration of following EUT operation mode or test configuration mode which possible have effect on EMI emission level. Each of these EUT operation mode(s) or test configuration mode(s) mentioned above was evaluated respectively.
Pretest Mode Description Mode 1 CH1 Mode 2 CH39 Mode 3 CH79 Mode 4 Link
For Conductted Emission
Final Test Mode Description
Mode 4 Link
For Radiated Emission
Final Test Mode Description
Mode 1 CH1 Mode 2 CH39 Mode 3 CH79 Mode 4 Link
Note:
(1) The measurements are performed at the highest, middle, lowest available channels. The EUT use full-charge battery.
(2) Measurements are performed according to C63.10.
(3) The relevant RF Conducted Measurement is performed by a temporary antenna connector, please refer to the Equipment List for the detail
(4) Test perform on all mode, only records worse cases in the test report.
(5) The system shall hop to channel frequencies that are selected at the system hopping rate from a pseudorandomly ordered list of hopping frequencies. Each frequency must be used equally on the average by each transmitter. The system receivers shall have input bandwidths that match the hopping channel bandwidths of their corresponding transmitters and shall shift frequencies in synchronization with the transmitter signals. Example: Frequency used:2402 - 2480 MHz 79 Channels (Ch 1 - Ch 79) Hopping Sequence in Data Mode 55,48,26,33,52,35,50,65,54,67,15,08,64,49,66,53,22,25,63,04,41,05,24,43,73,07,75,28,56,37,60,39,58,69,16,40,21,44 23,42,13,17,46,02,51,03,11,29,77,47,62,27,71,10,68,32,57 12,59,72,30,76,31,18,74,61,14,70,36,06,09,45,19,20,34,38 78,00,01

Shenzhen Asia Test Technology Co., Ltd.
Report No.
- Page ATT2017SZ0911367F 8 of 57 -
2.3 TABLE OF PARAMETERS OF TEXT SOFTWARE SETTING The Applicant provides communication tools software to control the EUT for staying in continous transmitting and receiving mode for testing. There are 79 channels of EUT, and the test carried out at the lowest channel, middle channel and highest channel . During testing channel & power controlling software provided by the customer was used to control the operating channel as well as the output power level. The RF output power selection is for the setting of RF output power expected by the customer and is going to be fixed on the firmware of the final end product power parameters of FHSS
Test software Version Test program: CW6611E_V4.2 Frequency 2402 MHz 2440 MHz 2480 MHz Parameters Default Default Default
2.4 BLOCK DIGRAM SHOWING THE CONFIGURATION OF SYSTEM TESTED Radiated Spurious Emission Test
2.5 DESCRIPTION OF SUPPORT UNITS(CONDUCTED MODE)
The EUT has been tested as an independent unit together with other necessary accessories or support units. The following support units or accessories were used to form a representative test configuration during the tests.
Item Equipment Mfr/Brand Model/Type No. Series No. Note
E-1 SHARPER IMAGE
5.1CH WITH SOUND BAR
N/A SBT5200 N/A EUT
E-2 adapter N/A SW018S120150U1 N/A
Item Shielded Type Ferrite Core Length Note
E-1 EUT
E-2 adapter

Shenzhen Asia Test Technology Co., Ltd.
Report No.
- Page ATT2017SZ0911367F 9 of 57 -
Note:
(1) The support equipment was authorized by Declaration of Confirmation. (2) For detachable type I/O cable should be specified the length in cm in『Length』column.

Shenzhen Asia Test Technology Co., Ltd.
Report No.
- Page ATT2017SZ0911367F 10 of 57 -
2.6 EQUIPMENTS LIST FOR ALL TEST ITEMS
Equipment
No. Instrument Manufacturer Model Name
Serial Number Specification Cal. Data
1 Semi-anechoic chamber
Changzhou Chengyu EC3088 N/A 9*6*6m 10/25/2016
2 Loop Antenna TESEQ HLA6120 35779 9kHz-30MHz 06/05/2017
3 Broadband antenna R&S VULB
9160 VULB91 60-516
30MHz-1500 MHz 10/25/2016
4 Horn antenna R&S BBHA 9120D 10087 1GHz-18GH z 06/05/2017
5 Horn Ant Schwarzbeck BBHA 9170 9170-181 15GHz-26.5GH
z 06/05/2017
6 Test receiver R&S ESCI 101686 9KHz-3GHz 10/25/2016
7 EMI
Measuring Receiver
R&S ESR 101660 9KHz-40GHz 10/25/2016
8 Multi-device controller MF MF-7868 MF78680
8762 N/A 10/25/2016
9 Amplifier EM EM-30180 060538 1GHz-18GH z 10/25/2016
10 Amplifier Schwarzbeck BBV 9719 BBV
9719-663 18GHz-26.5GH
z 06/05/2017
11 Spectrum Analyzer agilent E4440B US44300368 1GHz-26.5GH
z 06/05/2017
12 Test receiver R&S ESCI 101689 9KHz-3GHz 10/25/2016
13 LISN R&S NSLK81 26 8126466 9k-30MHz 10/25/2016
14 LISN Narda L2-16B 5589756 9k-30MHz 10/25/2016
15 Radiated Cable 1# FUJIKURA 5D-2W 01 30MHz-1GHz 10/25/2016
16 Radiated Cable 2# FUJIKURA 10D2W 02 1GHz -25GHz 10/25/2016
17 Conducted Cable 1# FUJIKURA 1D-2W 01 9KHz-30MHz 10/25/2016

Shenzhen Asia Test Technology Co., Ltd.
Report No.
- Page ATT2017SZ0911367F 11 of 57 -
18 SMA Antenna connector Dosin Dosin-SMA N/A N/A 10/25/2016
Note: The SMA antenna connector is soldered on the PCB board in order to perform conducted tests and this SMA antenna connector is listed in the equipment list. The Cal.Interval was one year
3. ANTENNA REQUIREMENT
3.1 STANDARD REQUIREMENT
15.203 requirement: For intentional device, according to 15.203: an intentional radiator shall
be designed to ensure that no antenna other than that furnished by the responsible party shall be used with the device.
3.2 EUT ANTENNA
The EUT antenna is PCB Antenna with 0dBi gain. It comply with the standard requirement.

Shenzhen Asia Test Technology Co., Ltd.
Report No.
- Page ATT2017SZ0911367F 12 of 57 -
3.3 CONDUCTED EMISSION MEASUREMENT 3.3.1 POWER LINE CONDUCTED EMISSION Limits (Frequency Range 150KHz-30MHz)
FREQUENCY (MHz) (dBuV)
Standard Quasi-peak Average
0.15 -0.5 66 - 56 * 56 - 46 * FCC
0.50 -5.0 56.00 46.00 FCC
5.0 -30.0 60.00 50.00 FCC
Note: (1) The tighter limit applies at the band edges. (2) The limit of " * " marked band means the limitation decreases linearly with the
logarithm of the frequency in the range.
The following table is the setting of the receiver
Receiver Parameters Setting Attenuation 10 dB
Start Frequency 0.15 MHz Stop Frequency 30 MHz
IF Bandwidth 9 kHz

Shenzhen Asia Test Technology Co., Ltd.
Report No.
- Page ATT2017SZ0911367F 13 of 57 -
3.3.2 TEST PROCEDURE a. The EUT was placed 0.4 meters from the horizontal ground plane with EUT being connected
to the power mains through a line impedance stabilization network (LISN). All other support equipments powered from additional LISN(s). The LISN provide 50 Ohm/ 50uH of coupling impedance for the measuring instrument.
b. Interconnecting cables that hang closer than 40 cm to the ground plane shall be folded back and forth in the center forming a bundle 30 to 40 cm long.
c. I/O cables that are not connected to a peripheral shall be bundled in the center. The end of the cable may be terminated, if required, using the correct terminating impedance. The overall length shall not exceed 1 m.
d. LISN at least 80 cm from nearest part of EUT chassis. e. For the actual test configuration, please refer to the related Item –EUT Test Photos.
3.3.3 DEVIATION FROM TEST STANDARD No deviation 3.3.4 TEST SETUP
N o t e : 1 .S u p p o r t u n i ts w e r e c o n n e c t e d t o s e c o n d L IS N .
2 .B o t h o f L IS N s ( A M N ) a r e 8 0 c m f r o m E U T a n d a t le a s t 8 0
f r o m o t h e r u n i ts a n d o t h e r m e ta l p la n e s
V e r t ic a l R e f e r e n c eG r o u n d P la n e
4 0 c m
8 0 c m
T e s t R e c e iv e r
H o r iz o n ta l R e f e r e n c eG r o u n d P la n e
E U T
L IS N

Shenzhen Asia Test Technology Co., Ltd.
Report No.
- Page ATT2017SZ0911367F 14 of 57 -
3.2.5 TEST RESULT
EUT: SHARPER IMAGE 5.1CH WITH SOUND BAR Model Name. : SBT5200
Temperature: 26 ℃ Relative Humidity: 54% Pressure: 1010hPa Test Date : 2017-07-09 Test Mode: 4 Phase : L Test Voltage : DC 12V by adapter AC 120V/60Hz
Remark: 1. All readings are Quasi-Peak and Average values. 2. Factor = Insertion Loss + Cable Loss. 3. N/A means All Data have pass Limit

Shenzhen Asia Test Technology Co., Ltd.
Report No.
- Page ATT2017SZ0911367F 15 of 57 -
EUT: SHARPER IMAGE 5.1CH WITH SOUND BAR Model Name. : SBT5200
Temperature: 26 ℃ Relative Humidity: 54% Pressure: 1010hPa Test Date : 2017-07-09 Test Mode: 4 Phase : N Test Voltage : DC 12V by adapter AC 120V/60Hz
Remark: 1. All readings are Quasi-Peak and Average values. 2. Factor = Insertion Loss + Cable Loss. 3. N/A means All Data have pass Limit

Shenzhen Asia Test Technology Co., Ltd.
Report No.
- Page ATT2017SZ0911367F 16 of 57 -
3.4 RADIATED EMISSION MEASUREMENT
3.4.1 Radiated Emission Limits ( FCC 15.209 )
Frequencies (MHz)
Field Strength (micorvolts/meter)
Measurement Distance (meters)
0.009~0.490 2400/F(KHz) 300 0.490~1.705 24000/F(KHz) 30 1.705~30.0 30 30
30~88 100 3 88~216 150 3
216~960 200 3 Above 960 500 3
Note: (1) The tighter limit applies at the band edges. (2) Emission level (dBuV/m)=20log Emission level (uV/m).
LIMITS OF RADIATED EMISSION MEASUREMENT ( FCC 15.249)
Frequency of Emission (MHz)
Field Strength of fundamental
((millivolts /meter)
Field Strength of Harmonics
(microvolts/meter)
2400 - 2483.5 50 500
Notes: (1) Emissions radiated outside of the specified frequency bands, except for harmonics,
shall be attenuated by at least 50 dB below the level of the fundamental or to the general radiated emission limits in Section 15.209, whichever is the lesser attenuation.
Spectrum Parameter Setting Attenuation Auto
Start Frequency 1000 MHz
Stop Frequency 10th carrier harmonic
RB / VB (emission in restricted band) 1MHz / 1MHz for Peak
Receiver Parameter Setting Attenuation Auto
Start ~ Stop Frequency 9kHz~150kHz / RB 200Hz for QP
Start ~ Stop Frequency 150kHz~30MHz / RB 9kHz for QP
Start ~ Stop Frequency 30MHz~1000MHz / RB 120kHz for QP

Shenzhen Asia Test Technology Co., Ltd.
Report No.
- Page ATT2017SZ0911367F 17 of 57 -
3.4.2 TEST PROCEDURE 1)9 kHz to 30 MHz emissions: For testing performed with the loop antenna, testing was performed in accordance to ANSI C63.10. The centre of the loop was positioned 1 m above the ground and positioned with its plane vertical at the specified distance from the EUT, During testing the loop was rotated about its vertical axis for maximum response at each azimuth and also investigated with the loop positioned in the horizontal plane. 2)30 MHz to 1 GHz emissions: For testing performed with the bi-log type antenna, testing was performed in accordance to ANSI C63.10. The measurement is performed with the EUT rotated 360º, the antenna height scanned between 1m and 4m, and the antenna rotated to repeat the measurement for both the horizontal and vertical antenna polarizations. 3)1 GHz to 25 GHz emissions: Test site with RF absorbing material covering the ground plane that met the site validation criterion called out in CISPR 16-1-4:2007 was used to perform radiated emission test above 1 GHz. For testing performed with the horn antenna, testing was performed in accordance to ANSI C63.10. The measurement is performed with the EUT rotated 360º, the antenna height scan between 1m and 4m, and the antenna rotated to repeat the measurement for both the horizontal and vertical antenna polarizations. For the radiated emission test above 1GHz: Place the measurement antenna away from each area of the EUT determined to be a source of emissions at the specified measurement distance, while keeping the measurement antenna aimed at the source of emissions at each frequency of significant emissions, with polarization oriented for maximum response. The measurement antenna may have to be higher or lower than the EUT, depending on the radiation pattern of the emission and staying aimed at the emission source for receiving the maximum signal. The final measurement antenna elevation shall be that which maximizes the emissions. The measurement antenna elevation for maximum emissions shall be restricted to a range of heights of from 1 m to 4 m above the ground or reference ground plane. Both horizontal and vertical antenna polarities were testedand performed pretest to three orthogonal axis. The worst case emissions were reported.
3.4.3 DEVIATION FROM TEST STANDARD No deviation
Shenzhen Asia Test Technology Co., Ltd.
Report No.
- Page ATT2017SZ0911367F 18 of 57 -
3.4.4 TEST SETUP (A)Radiated Emission Test-Up Frequency Below 30MHz
(B)Radiated Emission Test-Up Frequency 30MHz~1GHz

Shenzhen Asia Test Technology Co., Ltd.
Report No.
- Page ATT2017SZ0911367F 19 of 57 -
(C)Radiated Emission Test-Up Frequency Above 1GHz

Shenzhen Asia Test Technology Co., Ltd.
Report No.
- Page ATT2017SZ0911367F 20 of 57 -
Field Strength of Fundamental
Frequency (MHz)
Reading Level
(dBuV/m)
Antenna Factor (dB)
Cable Loss (dB)
amplifier factor (dB)
Emission PK/AV
(dBuV/m)
Horizontal /Vertical
Detector type
Limits PK/AV (dBuV/m)
Margin (dB)
2402 92.27 25.87 6.56 35.1 89.6 H Peak 114 -24.4
2402 83.54 25.87 6.56 35.1 80.87 H AVG 94 -13.13
2440 91.14 25.93 6.64 35.37 88.34 H Peak 114 -25.66
2440 82.09 25.93 6.64 35.37 79.29 H AVG 94 -14.71
2480 93.37 26.05 6.7 35.42 90.7 H Peak 114 -23.3
2480 82.66 26.05 6.7 35.42 79.99 H AVG 94 -14.01
2402 92.15 25.87 6.56 35.1 89.48 V Peak 114 -24.52
2402 81.36 25.87 6.56 35.1 78.69 V AVG 94 -15.31
2440 91.78 25.93 6.64 35.37 88.98 V Peak 114 -25.02
2440 82.56 25.93 6.64 35.37 79.76 V AVG 94 -14.24
2480 93.67 26.05 6.7 35.42 91 V Peak 114 -23
2480 83.27 26.05 6.7 35.42 80.6 V AVG 94 -13.4 For the band-edge test, both hopping-on mode and hopping-off mode had been pre-tested, and only the worst case was recorded in the test report.

Shenzhen Asia Test Technology Co., Ltd.
Report No.
- Page ATT2017SZ0911367F 21 of 57 -
3.4.5 TEST RESULTS (BELOW 30MHz)
EUT: SHARPER IMAGE 5.1CH WITH SOUND BAR Model Name. : SBT5200
Temperature: 20 ℃ Relative Humidtity: 48%
Pressure: 1010 hPa Test Voltage : DC 12V BY ADAPTER AC 120V/60HZ
Test Mode : TX Polarization : --
Freq. Reading Limit Margin State
(MHz) (dBuV/m) (dBuV/m) (dB) P/F
-- -- -- -- PASS
-- -- -- -- PASS
NOTE: The amplitude of spurious emissions which are attenuated by more than 20dB below the permissible value has no need to be reported.
Distance extrapolation factor =40 log (specific distance/test distance)(dB); Limit line = specific limits(dBuv) + distance extrapolation factor.

Shenzhen Asia Test Technology Co., Ltd.
Report No.
- Page ATT2017SZ0911367F 22 of 57 -
3.4.6 TEST RESULTS (BETWEEN 30 – 1000 MHZ)
EUT: SHARPER IMAGE 5.1CH WITH SOUND BAR Model Name : SBT5200
Temperature: 20 ℃ Relative Humidity: 48%
Pressure: 1010 hPa Test Voltage : DC 12V BY ADAPTER AC 120V/60HZ
Test Mode : TX-CH1 Polarization : Vertical
Note:test perform on all mode,"BT 2402” mode is the worst mode and has been reported.
Remark: Factor = Antenna Factor + Cable Loss.

Shenzhen Asia Test Technology Co., Ltd.
Report No.
- Page ATT2017SZ0911367F 23 of 57 -
EUT: SHARPER IMAGE 5.1CH WITH SOUND BAR Model Name : SBT5200
Temperature: 20 ℃ Relative Humidity: 48%
Pressure: 1010 hPa Test Voltage : DC 12V BY ADAPTER AC 120V/60HZ
Test Mode : TX-CH1 Polarization : Horizontal
Remark: Factor = Antenna Factor + Cable Loss.
Note:test perform on all mode,"BT 2402” mode is the worst mode and has been reported.

Shenzhen Asia Test Technology Co., Ltd.
Report No.
- Page ATT2017SZ0911367F 24 of 57 -
3.4.7 TEST RESULTS (ABOVE 1000 MHZ) Note:test perform on BDR&EDR, the worst mode and has been reported.
GFSK
EUT: SHARPER IMAGE 5.1CH WITH SOUND BAR Model Name : SBT5200
Temperature: 20 ℃ Relative Humidity: 48%
Pressure: 1010 hPa Test Voltage : DC 12V BY ADAPTER AC 120V/60HZ
Test Mode : TX-CH1 Polarization : Horizontal
Remark: Factor = Antenna Factor + Cable Loss – Pre-amplifier.

Shenzhen Asia Test Technology Co., Ltd.
Report No.
- Page ATT2017SZ0911367F 25 of 57 -
EUT: SHARPER IMAGE 5.1CH WITH SOUND BAR Model Name : SBT5200
Temperature: 20 ℃ Relative Humidity: 48%
Pressure: 1010 hPa Test Voltage : DC 12V BY ADAPTER AC 120V/60HZ
Test Mode : TX-CH1 Polarization : Vertical
For the band-edge test, both hopping-on mode and hopping-off mode had been pre-tested, and only the worst case was recorded in the test report.
Remark: Factor = Antenna Factor + Cable Loss – Pre-amplifier.

Shenzhen Asia Test Technology Co., Ltd.
Report No.
- Page ATT2017SZ0911367F 26 of 57 -
EUT: SHARPER IMAGE 5.1CH WITH SOUND BAR Model Name : SBT5200
Temperature: 20 ℃ Relative Humidity: 48%
Pressure: 1010 hPa Test Voltage : DC 12V BY ADAPTER AC 120V/60HZ
Test Mode : TX-CH40 Polarization : Horizontal
Remark: Factor = Antenna Factor + Cable Loss – Pre-amplifier.

Shenzhen Asia Test Technology Co., Ltd.
Report No.
- Page ATT2017SZ0911367F 27 of 57 -
EUT: SHARPER IMAGE 5.1CH WITH SOUND BAR Model Name : SBT5200
Temperature: 20 ℃ Relative Humidity: 48%
Pressure: 1010 hPa Test Voltage : DC 12V BY ADAPTER AC 120V/60HZ
Test Mode : TX-CH40 Polarization : Vertical
Remark: Factor = Antenna Factor + Cable Loss – Pre-amplifier.

Shenzhen Asia Test Technology Co., Ltd.
Report No.
- Page ATT2017SZ0911367F 28 of 57 -
EUT: SHARPER IMAGE 5.1CH WITH SOUND BAR Model Name : SBT5200
Temperature: 20 ℃ Relative Humidity: 48%
Pressure: 1010 hPa Test Voltage : DC 12V BY ADAPTER AC 120V/60HZ
Test Mode : TX-CH79 Polarization : Horizontal
Remark: Factor = Antenna Factor + Cable Loss – Pre-amplifier.

Shenzhen Asia Test Technology Co., Ltd.
Report No.
- Page ATT2017SZ0911367F 29 of 57 -
EUT: SHARPER IMAGE 5.1CH WITH SOUND BAR Model Name : SBT5200
Temperature: 20 ℃ Relative Humidity: 48%
Pressure: 1010 hPa Test Voltage : DC 12V BY ADAPTER AC 120V/60HZ
Test Mode : TX-CH79 Polarization : Vertical
For the band-edge test, both hopping-on mode and hopping-off mode had been pre-tested, and only the worst case was recorded in the test report.
Remark: Factor = Antenna Factor + Cable Loss – Pre-amplifier.

Shenzhen Asia Test Technology Co., Ltd.
Report No.
- Page ATT2017SZ0911367F 30 of 57 -
4. BANDWIDTH TEST
4.1 TEST PROCEDURE
a. The EUT was directly connected to the spectrum analyzer and antenna output port as show in
the block diagram below, b. Spectrum Setting : RBW= 100KHz, VBW≧RBW, Sweep time = Auto.
4.2 DEVIATION FROM STANDARD
No deviation.
4.3 TEST SETUP

Shenzhen Asia Test Technology Co., Ltd.
Report No.
- Page ATT2017SZ0911367F 31 of 57 -
4.4 TEST RESULTS
EUT: SHARPER IMAGE 5.1CH WITH SOUND BAR Model Name : SBT5200
Temperature: 25 ℃ Relative Humidity: 60%
Pressure: 1012 hPa Test Voltage : DC 12V BY ADAPTER AC 120V/60HZ
Test Mode : GFSK CH01 / CH40 /CH79
Frequency 20dB Bandwidth (kHz)
Result
2402 MHz 1.0958 PASS 2441 MHz 1.0914 PASS 2480 MHz 1.0914 PASS
CH01
Date: 10.JUL.2017 16:15:39

Shenzhen Asia Test Technology Co., Ltd.
Report No.
- Page ATT2017SZ0911367F 32 of 57 -
CH40
CH79
Date: 10.JUL.2017 16:15:59
Date: 10.JUL.2017 16:16:14

Shenzhen Asia Test Technology Co., Ltd.
Report No.
- Page ATT2017SZ0911367F 33 of 57 -
EUT: SHARPER IMAGE 5.1CH WITH SOUND BAR Model Name : SBT5200
Temperature: 25 ℃ Relative Humidity: 60%
Pressure: 1012 hPa Test Voltage : DC 12V BY ADAPTER AC 120V/60HZ
Test Mode : 8DPSK CH01 / CH40 /CH79
Frequency 20dB Bandwidth (kHz)
Result
2402 MHz 1.3494 PASS 2441 MHz 1.3405 PASS 2480 MHz 1.3422 PASS
CH01
Date: 10.JUL.2017 16:20:39

Shenzhen Asia Test Technology Co., Ltd.
Report No.
- Page ATT2017SZ0911367F 34 of 57 -
CH40
CH79
Date: 10.JUL.2017 16:19:45
Date: 10.JUL.2017 16:20:59

Shenzhen Asia Test Technology Co., Ltd.
Report No.
- Page ATT2017SZ0911367F 35 of 57 -
5. 100 KHZ BANDWIDTH OF FREQUENCY BAND EDGE
APPLICABLE STANDARD
Emissions radiated outside of the specified frequency bands, except for harmonics, shall be attenuated by at least 50 dB below the level of the fundamental or to the general radiated emission limits in §15.209, whichever is the lesser attenuation. TEST PROCEDURE a) Check the calibration of the measuring instrument using either an internal calibrator or a
known signal from an external generator. b) Position the EUT without connection to measurement instrument. Turn on the EUT and
connect its antenna terminal to measurement instrument via a low loss cable. Then set it to any one measured frequency within its operating range, and make sure the instrument is operated in its linear range.
c) Set RBW to 100 kHz and VBW of spectrum analyzer to 300 kHz with a convenient frequency span including 100 kHz bandwidth from band edge.
d) Measure the highest amplitude appearing on spectral display and set it as a reference level. Plot the graph with marking the highest point and edge frequency.
e) Repeat above procedures until all measured frequencies were complete.
5.1 DEVIATION FROM STANDARD
No deviation.
5.2 TEST SETUP
5.3 EUT OPERATION CONDITIONS The EUT tested system was configured as the statements of 2.4 Unless otherwise a special operating condition is specified in the follows during the testing.
Att

Shenzhen Asia Test Technology Co., Ltd.
Report No.
- Page ATT2017SZ0911367F 36 of 57 -
5.4 TEST RESULTS
EUT: SHARPER IMAGE 5.1CH WITH SOUND BAR Model Name : SBT5200
Temperature: 25 ℃ Relative Humidity: 60%
Pressure: 1012 hPa Test Voltage : DC 12V BY ADAPTER AC 120V/60HZ
Test Mode : CH01 / CH39 /CH79
BDR
Note: When PK value is lower than the Average value limit, average not record. For the band-edge test, both hopping-on mode and hopping-off mode had been pre-tested, and only the worst case was recorded in the test report.
Frequency Meter Reading Factor Emission Level Limits Margin Detector Type Comment
(MHz) (dBμV) (dB) (dBμV/m) (dBμV/m) (dB)
2390 49.75 1.05 50.8 74 -23.2 peak Vertical
2390 48.51 1.05 49.56 74 -24.44 peak Horizontal
2483.5 50.06 1.29 51.35 74 -22.65 peak Vertical
2483.5 49.22 1.29 50.51 74 -23.49 peak Horizontal

Shenzhen Asia Test Technology Co., Ltd.
Report No.
- Page ATT2017SZ0911367F 37 of 57 -
EUT: SHARPER IMAGE 5.1CH WITH SOUND BAR Model Name : SBT5200
Temperature: 25 ℃ Relative Humidity: 60%
Pressure: 1012 hPa Test Voltage : DC 12V BY ADAPTER AC 120V/60HZ
Test Mode : CH01 / CH39 /CH79
EDR
Note: When PK value is lower than the Average value limit, average not record. For the band-edge test, both hopping-on mode and hopping-off mode had been pre-tested, and only the worst case was recorded in the test report.
Frequency Meter Reading Factor Emission Level Limits Margin Detector Type Comment
(MHz) (dBμV) (dB) (dBμV/m) (dBμV/m) (dB)
2390 48.75 1.05 49.8 74 -24.2 peak Vertical
2390 48.69 1.05 49.74 74 -24.26 peak Horizontal
2483.5 49.27 1.29 50.56 74 -23.44 peak Vertical
2483.5 48.96 1.29 50.25 74 -23.75 peak Horizontal

Shenzhen Asia Test Technology Co., Ltd.
Report No.
- Page ATT2017SZ0911367F 38 of 57 -
BDR MODE Band Edge, Left Side
Date: 10.JUL.2017 17:06:47
Date: 10.JUL.2017 17:05:37

Shenzhen Asia Test Technology Co., Ltd.
Report No.
- Page ATT2017SZ0911367F 39 of 57 -
Band Edge, Right Side
Date: 10.JUL.2017 17:07:51
Date: 10.JUL.2017 17:08:56

Shenzhen Asia Test Technology Co., Ltd.
Report No.
- Page ATT2017SZ0911367F 40 of 57 -
EDR MODE
Band Edge, Left Side
Date: 10.JUL.2017 18:28:12
Date: 10.JUL.2017 18:28:44

Shenzhen Asia Test Technology Co., Ltd.
Report No.
- Page ATT2017SZ0911367F 41 of 57 -
Band Edge, Right Side
Date: 10.JUL.2017 18:30:31
Date: 10.JUL.2017 18:29:17

Shenzhen Asia Test Technology Co., Ltd.
Report No.
- Page ATT2017SZ0911367F 42 of 57 -
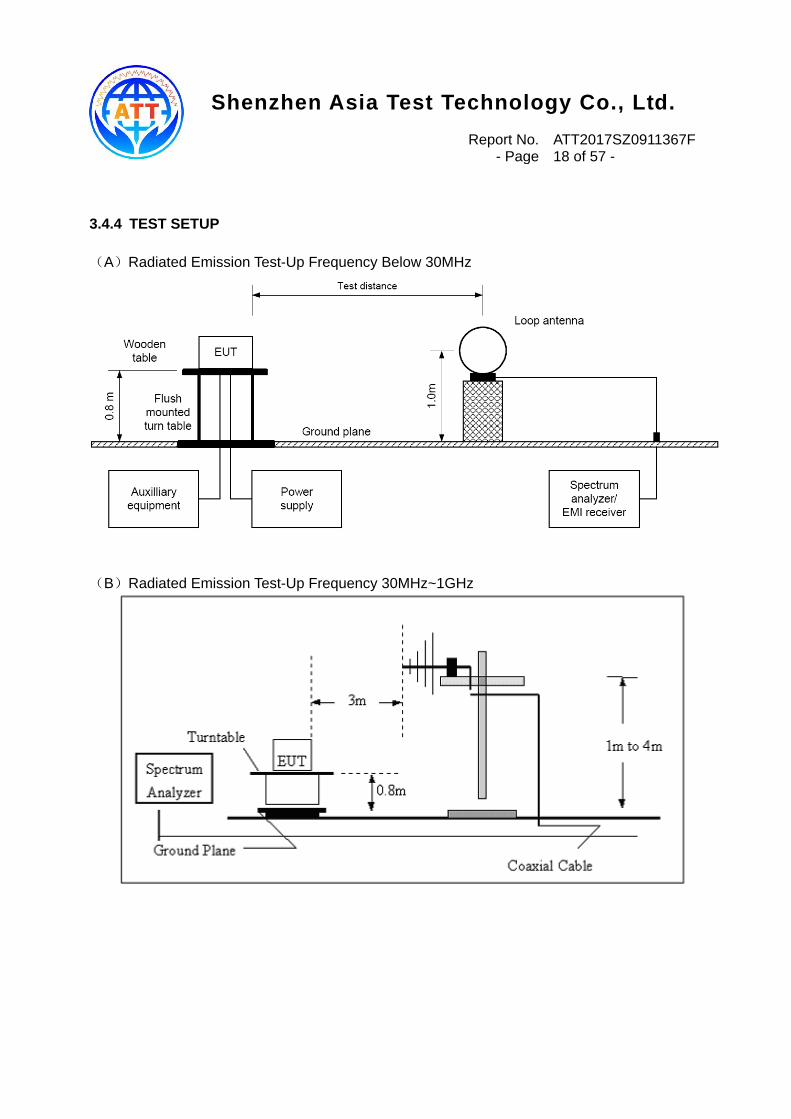
6. EUT TEST PHOTO
Radiated Measurement Photos
30-1000MHz
Above 1GHz
Conducted Measurement Photos

Shenzhen Asia Test Technology Co., Ltd.
Report No.
- Page ATT2017SZ0911367F 43 of 57 -
0.15-30MHz

Shenzhen Asia Test Technology Co., Ltd.
Report No.
- Page ATT2017SZ0911367F 44 of 57 -
EXTERNAL PHOTO

Shenzhen Asia Test Technology Co., Ltd.
Report No.
- Page ATT2017SZ0911367F 45 of 57 -
Shenzhen Asia Test Technology Co., Ltd.
Report No.
- Page ATT2017SZ0911367F 46 of 57 -

Shenzhen Asia Test Technology Co., Ltd.
Report No.
- Page ATT2017SZ0911367F 47 of 57 -

Shenzhen Asia Test Technology Co., Ltd.
Report No.
- Page ATT2017SZ0911367F 48 of 57 -

Shenzhen Asia Test Technology Co., Ltd.
Report No.
- Page ATT2017SZ0911367F 49 of 57 -

Shenzhen Asia Test Technology Co., Ltd.
Report No.
- Page ATT2017SZ0911367F 50 of 57 -

Shenzhen Asia Test Technology Co., Ltd.
Report No.
- Page ATT2017SZ0911367F 51 of 57 -
INTERNAL PHOTO

Shenzhen Asia Test Technology Co., Ltd.
Report No.
- Page ATT2017SZ0911367F 52 of 57 -

Shenzhen Asia Test Technology Co., Ltd.
Report No.
- Page ATT2017SZ0911367F 53 of 57 -
PCB ant.

Shenzhen Asia Test Technology Co., Ltd.
Report No.
- Page ATT2017SZ0911367F 54 of 57 -

Shenzhen Asia Test Technology Co., Ltd.
Report No.
- Page ATT2017SZ0911367F 55 of 57 -

Shenzhen Asia Test Technology Co., Ltd.
Report No.
- Page ATT2017SZ0911367F 56 of 57 -

Shenzhen Asia Test Technology Co., Ltd.
Report No.
- Page ATT2017SZ0911367F 57 of 57 -


![TS13070145-EME 15.247 [BT2.1] T416 · Connector Type : I-PEX ... Schwarzbeck BBHA 9120 D 9120D-456 2012/09/03 2013/09/02 Horn Antenna (14-42G) SHWARZBECK BBHA …](https://img.dokumen.tips/doc/110x75/5b66ed717f8b9a6e1f8e058e/ts13070145-eme-15247-bt21-t416-connector-type-i-pex-schwarzbeck-bbha.jpg)


![BBHA 9120 K - Schwarzbeckschwarzbeck.de/Datenblatt/k9120K.pdf · BBHA 9120 K Datasheet 3/8 Rev. B 1722.111217 Frequency Isotropic gain 1 m Aperture Antenna factor 1 m Aperture [MHz]](https://img.dokumen.tips/doc/110x75/5e05bee484acbe768c39734a/bbha-9120-k-sc-bbha-9120-k-datasheet-38-rev-b-1722111217-frequency-isotropic.jpg)