Embed Size (px)
Citation preview

Shelf Life Prediction Of
Medical Gloves
Presented for the ASTM WG Committee for “Medical Glove Expiration Dating Guidance”
By
Uday Karmarkar
Akron Rubber Development Laboratory, Inc.

Motivation
• Shelf Life Prediction of rubber Medical Products• Clients’ demand for reliable prediction of part
shelf life in the laboratory• Lack of incorporation of aging effects and
chemical degradation• Assessment is often qualitative - based on quality
tests which are very misleading• Address the nonlinear aging effects (Current
FDA/ASTM/ISO Taskgroups)

Importance
• New shelf life prediction criteria• New material development• Safety, security and liability • Material changes due to market trends• Can reduce the number of product tests• Cost of unexpected failure is high

Major Issues for Shelf Life
• What is the Mechanism of Aging ?• How is Aging defined ?• Can the Activation Energy be defined so that the
temperature dependence of the failure can be found ?
• Are the aging mechanisms the same at different temperatures ?
• Can an accelarated test be run in the laboratory ?• Are the mechanisms the same in the laboratory as
in storage ?

Goals• Need a scientific methodology for quantitative life
prediction of elastomers• Shelf life prediction• Establishing the effectiveness of the existing
models

Challenges• Establishing accelerated aging techniques• Establishing the degradation process/mechanisms• Developing measurement techniques• Establishing a basic “practical” model• Establishing accuracy and reliability• Establishing a degradation mechanism or aging
mode• Developing a good methodology which covers all
thin elastomeric materials

Elastomer ProductsAlkali/Acid Electricity
Oil/Solvent
Heat
Mechanical Stress
Light
Radiation
Air
Water
Microbial EnvironmentCorrosion
Environmental Factors
Dust salt water
StructuralMolecular Chemical Transitions Additives Other
Energy
Ozone
Wind Stress(Static & Dynamic)Corrosive mist
Properties
Life Predictions
Physical Chemical Mechanical Electrical
“Natural” Aging

Degradation Process/Mechanism
Thermal MechanicalThermo-Oxidative Hydrolytic
Photo ChemicalPhotooxidative High Energy Radiation
Ozone Side Group EliminationRandom Chain Scission Substitution
Depolymerization Plasticizer LossCrosslinking Filler Bonding Change

Accelerated Aging• The basic requirement for reliable accelerated
aging is that the course of degradation is identical at the storage and test conditions
• Measure minimum two structural parameters at a given temperature, physical properties and chemical analysis (extraction, swelling and analysis by mass spectrophotometer)
• Failure mode evaluation by two different techniques
• Incorporating all the aging conditions similar to storage

Degradation Monitoring Tests
• Modulus - Tensile Test• Ultimate Elongation - Tensile Test• Tensile Strength - Tensile Test• Tear Strength• Strain Energy (“Work to Break”) - Tensile Test• FTIR (Field sample & Lab aged)• Crosslink Density (Wet Chemistry)• GC/MS• Specific Gravity

Life Prediction Models
• Arrhenius Life Prediction• Time Temperature Superposition• ARDL P & K Method (Activation Energy
successive averaging technique)

Time - Temperature Plot
Log hours
0.1 1 10 100 1000
Decreasing Temperature
25
50
75
100
% Property Retention

Arrhenius Approach
Increasing Temperature
Service Rating Temperature
1 / Temperature (Deg K)
Log Time Elevated Temperature Test Points
Life Limit
Typical Arrhenius Shelf Life Prediction Plot for Elastomeric Products

Arrhenius equation
• The Arrhenius Equation has the basic formk = A e -E / RT
where• A = proportionality constant• e = base for natural logarithms• E = Activation Energy• R = the gas constant• T = Absolute Temperature
ln k = - E/ RT + ln A
“In General, for every 10 Deg C that temperature rises, the first order chemical reaction rate doubles”

Arrhenius fit : Practical Issues• An Arrhenius fit provides the worst case estimate
of shelf life• Arrhenius Approach prediction will be better with
lower temperature test data• Lower temperature data need more testing time• The basic assumption is that the dominant mode of
failure is identical at all temperatures and stress levels

Time - Temperature Superpositionat = exp { Ea ( 1 / T(ref) - 1/ T(age) }
where Ea is the activation energy, R= gas constant ( 8.31432 J/K), Tref and Tage are the reference and aging temperatures respectively in Kelvin
Log hours
0.1 1 10 100 1000
Decreasing Temperature
25
50
75
100
% Property Retention
50
607080

Time - Temperature Superposition : Practical Issues
• Need to calculate Activation Energy• Assume the activation energy as 84 - 117 KJ/mole• High sensitivity on “cutoff”
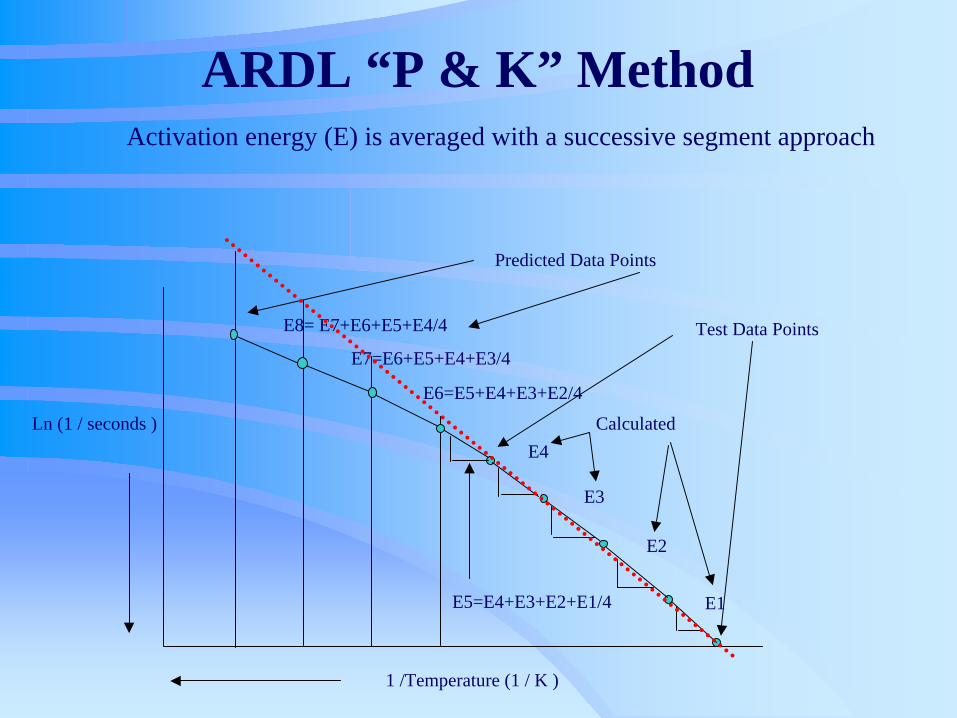
ARDL “P & K” MethodActivation energy (E) is averaged with a successive segment approach
Ln (1 / seconds )
1 /Temperature (1 / K )
E4
E3
E2
E1
Test Data PointsE8= E7+E6+E5+E4/4
Predicted Data Points
E7=E6+E5+E4+E3/4
E6=E5+E4+E3+E2/4
E5=E4+E3+E2+E1/4
Calculated

Successive Activation Energy Extrapolation : Practical Issues
• This method is sensitive to changes in activation energy
• Predictions are made depending upon the actual data available
• This method follows the change in Activation Energy

ARDL Aging ProcedureDeg C 30 min 2 hrs 4 hrs 8 hrs 1 week 2 weeks 4 weeks 6 weeks 8 weeks 10 weeks 24 weeks
80 x x x x x x70 x x x x x x x60 x x x x x x x x x x50 x x x x x x x x x
• Number of test specimens: 13 ( Tensile Test)• Calculate coefficient of variation: CV = s/x (100%)• Typical requirement: Maximum CV = 15%• Correlation Coefficient (R2) of Arrhenius plot
Case I : R2 > 0.97 use Arrhenius extrapolationCase II : R2 < 0.97 use Successive Averaging
technique

Natural Rubber Compounds

Natural rubber - GlovesCompound 1
Data at Data at Data at Data at Data at0.00275 1/ T in K 0.0028303 1/ T in K 0.0029127 1/ T in K 0.00300012 1/ T in K 0.003093 1/ T in K
90 Deg Celsius 80 Deg Celsius 70 Deg Celsius 60 Deg Celsius 50 Deg Celsius
Time Hrs % Property Time Hrs % Property Time Hrs % Property Time Hrs % Property Time Hrs % PropertyRetention Retention Retention Retention Retention
8 95 8 95 8 95 8 95 8 9510 70 17 90 17 90 17 90 17 9013 35 29 80 91 85 91 85 91 8517 0 37 70 120 80 300 80 300 80
70 60 130 70 810 70 6000 6091 30 190 55 1000 60 10000 45100 10 370 25 1500 40 13000 30
600 5 2700 15 16000 15

NR Glove Compound 1: Raw Data
T im e in h o u r s
1 0 1 0 0 1 0 0 0 1 0 0 0 0
% P
rope
rty R
eten
tion
- 1 0
0
1 0
2 0
3 0
4 0
5 0
6 0
7 0
8 0
9 0
1 0 0
9 0 D e g r e e s C e ls iu s8 0 D e g r e e s C e ls iu s7 0 D e g r e e s C e ls iu s6 0 D e g r e e s C e ls iu s5 0 D e g r e e s C e ls iu s

Time for aging to 70 % retention of Tensile Strength
Temperature Deg C 50 60 70 80 90Aging Time (hours) 1342 810 130 37 10

1 / T e m p e ra tu re in K e lv in
0 .0 0 2 70 .0 0 2 80 .0 0 2 90 .0 0 3 00 .0 0 3 10 .0 0 3 20 .0 0 3 30 .0 0 3 40 .0 0 3 5
T e m p e ra tu re in D e g re e s C e ls iu s
ln (1
/ se
cond
s ) t
aken
to re
ach
70 %
Pro
perty
Ret
entio
n
- 2 1 .0
-2 0 .5
-1 9 .5
-1 9 .0
-1 8 .5
-1 7 .5
-1 7 .0
-1 6 .5
-1 5 .5
-1 5 .0
-1 4 .5
-1 3 .5
-1 3 .0
-1 2 .5
-1 1 .5
-1 1 .0
-1 0 .5
-2 0 .0
-1 8 .0
-1 6 .0
-1 4 .0
-1 2 .0
-1 0 .0
Tim
e in
hou
rs (
to re
ach
70 %
)
T e s t D a taA v e ra g e S lo p e P re d ic te d D a taA r rh e n iu s F it
2 0 2 5 4 0 5 0 6 0 7 0 8 0 9 03 0
1 0 9 6 1 3 = 1 1 .5 2 y rs
1 1 6 8 2 8 = 6 .0 7 y rs
2 4 8 8 7
5 6 7 1
1 3 4 2
8 1 0
1 3 0
3 7
1 0
s 4
s 3
s 2
s 1
5
4
3
2
1
s 7
s 6
s 5
s 1 = y 2 -y 1 / x 2 -x 1
s 2 = y 3 -y 2 / x 3 -x 2
s 3 = y 4 -y 3 / x 4 -x 3
s 4 = y 5 -y 4 / x 5 -x 4
s 5 = (s 1 + s 2 + s 3 + s 4 ) / 4
s 6 = (s 2 + s 3 + s 4 + s 5 ) / 4
s 7 = (s 3 + s 4 + s 5 + s 6 ) / 4
5 3 2 2 7
A v e ra g e S lo p e P ro je c t io n T e c h n iq u e A rrh e n iu s F it
Shelf Life Prediction Curve : NR Compound 1

Predicted Shelf Life: NR Glove Compound 1
YearsArrhenius Approach 11.52ARDL P & K Method 6.07

NR: Glove Compound 2: Raw Data
Gloves - Shelf Life Prediction
0
10
20
30
40
50
60
70
80
90
100
110
0.1 10 1000 100000Time (hours)
% S
treng
th R
eten
tion
90 Deg C80 Deg C70 Deg C60 Deg C50 Deg C

Time for Aging to 75 % Retention of Tensile Strength
Temp DegC 90 80 70 60 50Aging Time in Hrs 30 30 30 30 30

NR Glove Compound 2 : Arrhenius Plot
Gloves - Arrhenius Plot
y = -10105x + 15.65R2 = 0.9749
-20.00
-18.00
-16.00
-14.00
-12.00
-10.00
-8.00
-6.00
-4.00
-2.00
0.000.0025 0.0026 0.0027 0.0028 0.0029 0.003 0.0031 0.0032 0.0033 0.0034
Temperature (1 / K)
Ln (
1/S
econ
ds ta
ken
to re
ach
75 %
of t
he o
rigin
ast
reng
th)
TestData
Linear(TestData)

Predicted Shelf Life : NR Glove Compound 2
YearsArrhenius Approach 3.31ARDL P & K Method 1.15

NR Glove Compound 3
Data at Data at Data at0.0028303 1/ T in K 0.002912734 1/ T in K 0.00300012 1/ T in K
80 Deg Celsius 70 Deg Celsius 60 Deg Celsius
Time Hrs % Property Time Hrs % Property Time Hrs % PropertyRetention Retention Retention
72 75.2 168 75.8 336 81.2168 60.2 336 71 504 82.4336 20 504 57.4 672 85.3504 1.7 672 43.8 840 65.4

NR: Compound 3: Raw Data
T im e in h o u rs
1 0 0 1 0 0 0
% P
rope
rty R
eten
tion
0
2 0
4 0
6 0
8 0
1 0 0
6 0 D e g re e s C e lc iu s7 0 D e g re e s C e lc iu s8 0 D e g re e s C e lc iu s

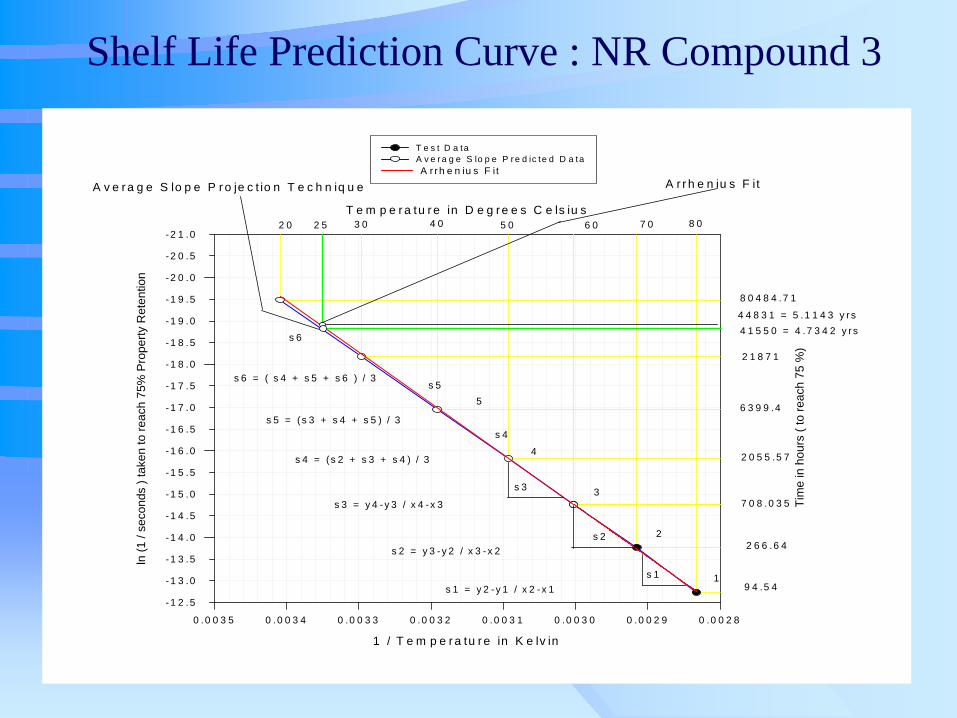
Time for Aging to 75 % Retention of Tensile Strength
Temperture 0C 60 70 80Aging Time in Hrs 708.035 266.6422 94.53996
1 / T e m p e r a tu r e in K e lv in
0 .0 0 2 80 .0 0 2 90 .0 0 3 00 .0 0 3 10 .0 0 3 20 .0 0 3 30 .0 0 3 40 .0 0 3 5
T e m p e r a tu r e in D e g re e s C e ls iu s
ln (1
/ se
cond
s ) t
aken
to re
ach
75%
Pro
perty
Ret
entio
n
- 2 1 .0
-2 0 .5
-1 9 .5
-1 9 .0
-1 8 .5
-1 7 .5
-1 7 .0
-1 6 .5
-1 5 .5
-1 5 .0
-1 4 .5
-1 3 .5
-1 3 .0
-1 2 .5
-2 0 .0
-1 8 .0
-1 6 .0
-1 4 .0
Tim
e in
hou
rs (
to re
ach
75 %
)
T e s t D a taA v e r a g e S lo p e P r e d ic te d D a taA r rh e n iu s F i t
2 0 2 5 4 0 5 0 6 0 7 0 8 03 0
4 4 8 3 1 = 5 .1 1 4 3 y r s4 1 5 5 0 = 4 .7 3 4 2 y r s
2 1 8 7 1
6 3 9 9 .4
2 0 5 5 .5 7
7 0 8 .0 3 5
2 6 6 .6 4
9 4 .5 4
s 4
s 3
s 2
s 1
5
4
3
2
1
s 6
s 5
s 1 = y 2 -y 1 / x 2 -x 1
s 2 = y 3 -y 2 / x 3 -x 2
s 3 = y 4 -y 3 / x 4 -x 3
s 5 = ( s 3 + s 4 + s 5 ) / 3
s 6 = ( s 4 + s 5 + s 6 ) / 3
8 0 4 8 4 .7 1
A v e r a g e S lo p e P r o je c t io n T e c h n iq u e A r r h e n iu s F it
s 4 = ( s 2 + s 3 + s 4 ) / 3
Shelf Life Prediction Curve : NR Compound 3

Predicted Shelf Life : NR Compound 3
Shelf Life Technique YearsArrhenius Approach 5.11ARDL P & K Method 4.73

Real time data
• “ Shelf life Estimate Technique for rubber Medical Gloves” Wunan Huang, Maxxim Medical, Inc

Shelf Life Prediction - Wunan Huang, Maxxim Medical, Inc
0
10
20
30
40
50
60
70
80
90
100
110
1 100 10000Time (hours)
% S
treng
th R
eten
tion
70 Deg C50 Deg C37 Deg C

Arrhenius Plot
y = -9523.8x + 13.548R2 = 0.775
-20.00
-18.00
-16.00
-14.00
-12.00
-10.00
-8.00
-6.00
-4.00
-2.00
0.000.0025 0.0026 0.0027 0.0028 0.0029 0.003 0.0031 0.0032 0.0033
Temperature (1 / K)
Ln (
1/S
econ
ds ta
ken
to re
ach
75 %
of t
he o
rigin
ast
reng
th) Test
Data

Shelf Life Prediction - Maxxim Medical Study
Shelf Life Technique YearsArrhenius Approach 6.22ARDL P & K Method 5.53
Real Time Study 5.6

Segment Activation Energy, KJ/moleShelf LifePredictionTechnique 800C–
700C 700C–600C 600C–500C
500C–400C
400C–300C
ShelfLife,years
Real – timestudy - - - - - 5.6 yrs*
ARDL “P &K” method 110.68 114.43 78.36 101.16** 97.98** 5.53 yrs
ArrheniusApproach**
*101.7 101.7 101.7 101.7 101.7 6.22 yrs
Note: * Real - time shelf life, ** Average of previous three segments, *** total slope basedon regression analysis of the data from all the temperatures.
Shelf Life Prediction - Maxxim Medical Study
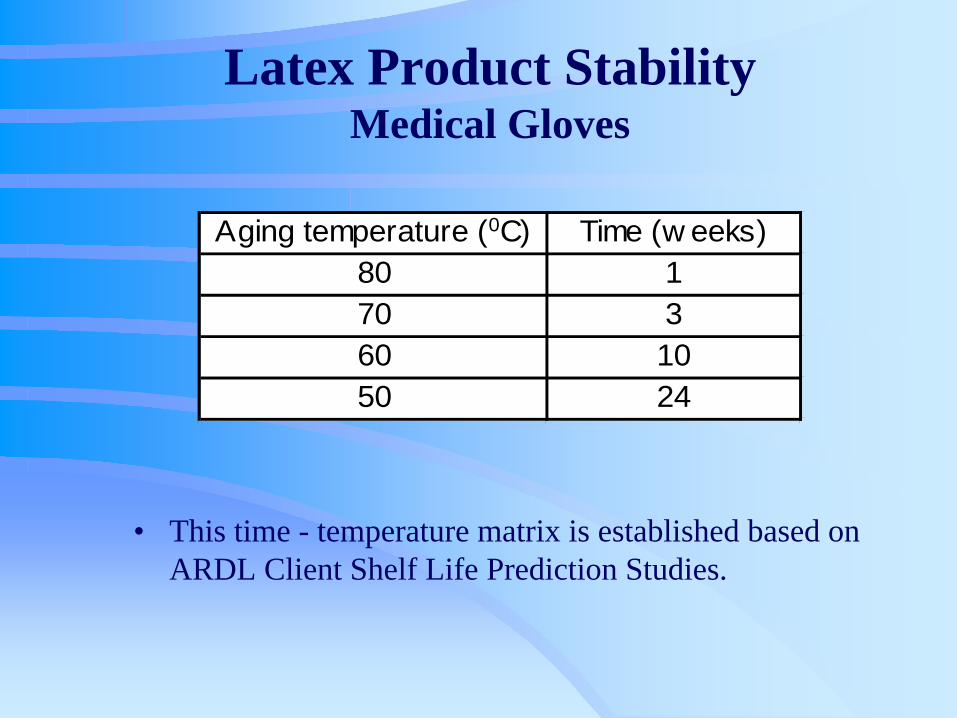
Latex Product Stability Medical Gloves
Aging temperature (0C) Time (w eeks)80 170 360 1050 24
• This time - temperature matrix is established based on ARDL Client Shelf Life Prediction Studies.

Conclusion
• Successive Activation Energy extrapolation along with better obtained property retention data seems to be a good methodology/model for shelf life prediction of elastomers
• It is important to define aging modes/mechanisms• Correlation between storage and lab data should be
established based on a minimum of two testing techniques, preferably one physical test and one chemical test
• Each application should be studied separately for established shelf life prediction methodology

Conclusion (cont..)
• Quantitative shelf life prediction for materials will be a good guide for future specification development
• Sensitivity of the shelf life may be evaluated by modifying the threshold value by ± 10%
• Need more test data for accurate shelf life prediction for thermoplastic elastomers(preferably in 5 degree increments)
• Shelf life prediction as an engineering tool is in the infancy stage of development
• More applications related research is needed to establish the effectiveness of the package on shelf life prediction