Embed Size (px)
Citation preview

PO Box 1390, Skulagata 4120 Reykjavik, Iceland
Shelf life of red fish stored in ice and modified atmosphere(MA) and some aspects on the development of a
Quality Index Method (QIM) scheme for red fish stored in
MAEstela Chichava Juliao Mausse
Ministry of Fisheries - BeiraMozambique
Supervisors: Ms. Tyri ValdimarsdottirMs. Kolbrun Sveinsdott
ABSTRACT
The objectives of the project were to study the shelf life of red fish stored in ice and inmodified atmosphere (MA). In addition, to analyse and define the parameters to beused in the development of a Quality Index Method (QIM) scheme for red fish storedin modified atmosphere.Samples of iced red fish (Sebastes marinus, S. mentella) caught south of Iceland werestored in ice and in a modified atmosphere (60% CO2: 40%N2) two days after captureand investigated with sensory analysis, chemical measurements and microbial counts,during 4 sampling days.Differences in total volatile bases (TVB), trimethylamine (TMA) and trimethylamineoxide (TMAO) values between red fish stored in ice and modified atmosphere werenot significant. The pH of MA samples remained lower than in ice samples.The Total Viable Counts and Pseudomonas in ice samples were much higher than inMA samples.Significant differences in sensory changes during storage of ice and MA samples werefound. The colour of eyes of fish stored in MA had higher scores than iced samples(changes from black to grey colour), and skin colour of fish stored in MA was moreyellow.The iced fish samples reached the limit of acceptance in day 19 according to sensoryevaluation of cooked fish, whereas fish stored in MA reaches that limit in day 21. MAgave a 2 days shelf life extension of red fish.The QIM scheme for red fish stored in ice is not suitable for red fish stored inmodified atmosphere. A slightly modified QIM scheme specific for red fish stored inMA is needed.
Final Project 2000

Mausse
UNU-Fisheries Training Programme 2
TABLE OF CONTENTS
1. INTRODUCTION................................................................................................... 5
2. LITERATURE REVIEW....................................................................................... 62.1 SHELF LIFE OF FISH ............................................................................................... 6
2.1.1 Sensory changes ............................................................................................ 62.2 METHODS TO EVALUATE FISH FRESHNESS............................................................. 8
2.2.1 Sensory evaluation......................................................................................... 82.2.2 Microbiological measurements ................................................................... 102.2.3 Chemical analysis........................................................................................ 11
2.3 MODIFIED ATMOSPHERE PACKAGING (MAP)...................................................... 112.3.1 Characteristics of CO2, O2 and N2 gases .................................................... 122.3.2 MAP of fish and fish products ..................................................................... 122.3.3 Packaging materials and machines............................................................. 13
3. MATERIALS AND METHODS ......................................................................... 133.1 RED FISH ............................................................................................................. 133.2 SAMPLING PLAN FOR ALL MEASUREMENTS ......................................................... 133.3 QUALITY INDEX METHOD (QIM)........................................................................ 143.4 SENSORY EVALUATION OF COOKED RED FISH...................................................... 153.5 PHOTOGRAPHS .................................................................................................... 163.6 MICROBIAL COUNTS............................................................................................ 163.7 CHEMICAL ANALYSIS .......................................................................................... 163.8 DATA ANALYSIS.................................................................................................. 16
4. RESULTS............................................................................................................... 164.1. QIM................................................................................................................... 174.2 TORRY ................................................................................................................ 194.3 MICROBIOLOGICAL COUNTS................................................................................ 214.4 CHEMICAL MEASUREMENTS................................................................................ 23
5. DISCUSSION, CONCLUSIONS AND RECOMMENDATIONS ................... 25
ACKNOWLEDGEMENTS...................................................................................... 27
REFERENCES.......................................................................................................... 27

Mausse
UNU-Fisheries Training Programme 3
LIST OF TABLES AND FIGURES
Table 1: Specific spoilage bacteria for cod and bacterial spoilage compounds (Church 1998)............... 8Table 2: Examples of shelf life of fishery products stored in modified atmosphere (Church 1998, *
Rehbein et al. 1994, ** Dalgaard et al. 1997). ............................................................................... 12Table 3: Statistical analysis of Quality Index scores of ungutted fish stored in ice and MA (average QI
scores with standard deviation)...................................................................................................... 17Table 4: Comments from judges about the main differences (sensory assessment of raw fish) between
the two trials................................................................................................................................... 18Table 5: Statistical analysis of Quality Index scores given for appearance of the skin using the QIM
scheme (average QI scores with standard deviation). .................................................................... 19Table 6: Statistical analysis of Quality Index scores given for colour of the eyes using the QIM scheme
(average QI scores with standard deviation). ................................................................................. 19Table 7: Statistical analysis of Torry sensory scores for flavour of cooked red fish fillets stored in ice
and MA (averages with standard deviation). ................................................................................. 20Table 8: Statistical analysis of Torry sensory scores for odour of cooked fish fillets stored in ice and
MA (averages with standard deviation). ........................................................................................ 20Table 9: Statistical analysis of H2S-producing bacteria counts (averages with standard deviation). ..... 22Table 10: Statistical analysis of non-spoilage micro organisms (white colonies counts) on iron agar
(averages with standard deviation)................................................................................................. 22Table 11: Statistical analysis of total viable counts on L&H agar (averages with standard deviation). 23Table 12: Statistical analysis of Pseudomonas counts on CFC agar (averages with standard deviation).
....................................................................................................................................................... 23Table 13: Statistical analysis of pH measurements (averages with standard deviation). ....................... 24Table 14: Statistical analysis of TMA amount (averages with standard deviation). .............................. 25Table 15: Statistical analysis of TMAO amount (averages with standard deviation). ........................... 25Table 16: Statistical analysis of TVB amount (averages with standard deviation)................................ 25
Figure 1: Combination of grading of raw fish with QIM and assessment of cooked fillet fish (modifiedfrom Hyldig and Nielsen 1977). .................................................................................................... 10
Figure 2 : Flowchart of fish used in the experiment. ............................................................................. 14Figure 3: Average Quality Index scores of ungutted red fish stored in ice and MA based on results from
10-11 judges. On sampling day 2 the samples were the same (iced fish). ..................................... 17Figure 4: Black colour of pupil and convex form of iced fish eye (left) and opaque colour of pupil and
flat form of MA eye (right) on sampling day 7.............................................................................. 18Figure 5: Average scores from QIM scheme given for appearance of skin. On day 2, fish were scored 0
with bright iridescent pigmentation; on day 7 both fish trials were scored 0-1. Score 1 meaningthat the fish skin pigmentation is becoming discoloured. On days 16 and 22, both fish trials werescored 1-2 which means the fish skin appearance was becoming discoloured or dull. The MA fishskin presented higher scores than fish stored in ice on days 16 and 22. ........................................ 18
Figure 6: Average score from QIM scheme given for colour of eyes. On day 2 fish were scored 0(black colour of eyes pupil); On day 7, 16 and 22 eyes of fish stored in MA were scored 1-2(opaque to grey pupil colour). On day 7 fish stored in ice were scored 0-1 and 1-2 on days 16 and22 respectively. Score 1 means opaque pupil eye colour. Score 2 means grey pupil eye colour.Fish stored in MA presented higher scores than fish stored in ice. ................................................ 18
Figure 7: Average Torry flavour scores of cooked red fish fillets stored in ice and MA based onevaluation of 10-11 judges. The figure also shows the linear relationship between Torry score andstorage time in ice and MA. ........................................................................................................... 19
Figure 8: Average Torry odour scores of cooked red fish fillets stored in ice and MA based onevaluation of 10-11 judges. The figure also shows the linear relationship between Torry score andstorage time in ice and MA. ........................................................................................................... 19
Figure 9: Combination of grading raw fish (squares) and assessment of cooked fish stored in ice(circle). Eating quality of the fish .................................................................................................. 21
Figure 10: Combination of grading raw fish (squares) and assessment of cooked fish stored in MA(circle). Eating quality of the fish was regarded as unacceptable on storage day 21, when the Torryscore reached the limit of acceptability (5.5), shown as a dashed line........................................... 21
Figure 11: Relationship between growth of H2S producing bacteria (spoilage bacteria) shown withdashed lines and non-spoilage micro organisms (white colonies) shown with solid lines, during

Mausse
UNU-Fisheries Training Programme 4
storage of red fish in ice and MA. H2S-producing bacterial counts in iced samples were low in thebeginning of storage and absent in MA samples. In both trials the number of H2S producingbacteria constituted a larger percentage of total counts at the end of shelf life and was higher in icefish than in MA fish. ...................................................................................................................... 22
Figure 12: Changes in Total viable counts on L&H agar (solid lines) and Pseudomonas on CFC-agar(dashed line) during storage of red fish in ice and MA. On day 22 TVC in ice samples were higherthan in MA samples (107cfu/g in iced fish and 102-103 cfu/g in MA fish)..................................... 22
Figure 13: Changes in pH during storage of ungutted red fish stored in ice and MA. The pH valuesdecreased until day 7 and then increased in both trials whereas, the pH decreased again in MAsamples from day 16. ..................................................................................................................... 24
Figure 14: Changes in trimethyl-amineoxide (TMAO) during storage of ungutted red fish stored in iceand MA. ......................................................................................................................................... 24
Figure 15: Changes in total volatile bases (TVB) and trimethylamine (TMA) during storage of unguttedred fish stored in ice and MA. The figure shows TVB values increasing during storage of iced fishand decreasing during storage of MA fish. TVB values in iced fish were higher than those on fishstored in MA. TMA values were similar in both trials until day 7. From day 16 TMA amount iniced fish increased whereas decreased in MA fish......................................................................... 24

Mausse
UNU-Fisheries Training Programme 5
1. INTRODUCTION
Consumer goods are the main products exported by Mozambique. About half of thevalue of exports comes from fisheries products such as shrimps, lobsters, crabs andfish, which are exported to Europe.Regulations in the European Union require freshness grading of most fish to bemarketed within the Union. The Fish Inspection Department has to perform qualityinspection of fish, prior to export in order to issue a health certificate in accordancewith EU regulations (EU Directive 1991). On the other hand, the demand for chilledfresh fish is rising as improved refrigeration and transport enables good quality chilledfresh products to become available to larger sections of the population. The rapiddeterioration of chilled fish makes special precautions necessary during processingand distribution. Modified Atmosphere Packaging (MAP) with refrigeration has beenshown to increase the shelf life of chilled fish (Church 1998, Huss 1995).The freshness of fish deteriorates with time, until the product is no longer acceptableto the consumer. Considering that consumers are the ultimate judges of the quality,realistic determination and accurate prediction of shelf life of fresh and lightlypreserved seafood are important to meet consumer demands and to comply withlegislative requirements. In this way, sensory evaluation such as the Quality IndexMethod (QIM) can be an important tool to assess fish freshness by systematicassessment of odour, flavour, appearance and texture of food. Recent studies haveshown that QIM has to be developed for each species and the schemes are made instorage studies (Huss 1995). The aim when developing QIM for each fish species is tohave a linear increase in the Quality Index (QI) with storage time in ice.The development of QIM schemes for fish species caught in Mozambican territorialwaters is a goal for the Mozambican Fish Inspection Department in order: i) to followlaws and regulations, ii) to increase the value of exports by increasing the proportionof high quality fish, iii) to limit losses because of fish spoilage. By using QIM, thefish inspector can give an estimate of the past and remaining storage time. In addition,the knowledge of shelf life of Mozambican fish species would allow fishermen,processors and retailers better control of their markets.
The two main objectives of the present project were:- To study the shelf life of red fish (Sebastes mentella and S. marinus) stored in ice
and in a modified atmosphere- To analyse and define the parameters to be used for the development of a Quality
Index Method (QIM) -scheme for red fish stored in MAThe main research questions to be answered were:- What are the effects of modified atmosphere storage of ungutted red fish on
chemical, microbial and sensory changes compared to red fish stored in ice?- Can modified atmosphere increase the shelf life of red fish?- Is it necessary to develop a QIM scheme for red fish stored in MA separately from
the one existing for red fish stored in ice?
This project work was carried out as part of an on-going project (FAIR CT-97- 3833)at the Icelandic Fisheries Laboratories (IFL) called “Implementation on board ofsystems of atmospheres with variable composition applied to fresh fish. Continuationon shore of the modified atmosphere chain”.

Mausse
UNU-Fisheries Training Programme 6
2. LITERATURE REVIEW
2.1 Shelf life of fish
The shelf life of food is defined as the maximum length of time a given product is fitfor human consumption. For fish, it is the time from when the fish is caught until it isno longer fit to eat (Huss 1995).Most fish are caught in nets, or with lines with baited hooks. Hence it is difficult tocontrol the initial quality of the raw material with any degree of repeatability. Thestress and mechanical damage caused during capture, the structure and composition ofthe fish, pH and storage temperature prior to landing all influence the spoilage rate ofthe fish (Church 1998). Fish, like red meat, spoil because of the combined effects ofenzymatic activity and bacterial growth (Church 1998). These factors all influence thesensory quality of fish during storage time. At the end of the shelf life, odour, flavour,texture, and appearance have become unpleasant.
2.1.1 Sensory changes
The first sensory changes that occur in fish during storage are concerned with theappearance and texture. The characteristic flavour of fish normally develops in thefirst couple of days of storage (Church 1998).It has been estimated that the characteristic sensory changes in fish vary considerablydepending on species and storage method (Huss 1995, Church 1998). Fish spoilagecan be divided into four distinct phases, according to Huss (1995) and Church (1998):- Phase 1: Very fresh, sweet, seaweed and delicate taste- Phase 2: Loss of characteristic odour and taste, flesh neutral (no off-flavours),
texture pleasant- Phase 3: There is a sign of spoilage and a range of volatile, unpleasant-smelling
substances are produced depending on the fish species and type of spoilage(aerobic, anaerobic). One of the volatile compounds may be trimethylamine(TMA) derived from the bacterial reduction of trimethylaminoxide (TMAO).There is a very characteristic “fish” smell. Production of volatile unpleasant-smelling odours/flavours starting with slightly sour, fruity and bitter off-flavours.During later stages sickly sweet, cabbage like, ammonia, sulphurous and rancidsmells develop. The texture becomes either soft and watery or dry and tough
- Phase 4: The fish is spoiled and putridIn phases 1 and 2 the major changes are due to autolytic reactions, but in phases 3 and4 the major changes are due to bacterial activity.
2.1.2 Autolytical and chemical changes
pH fallThe glycogen levels of fish muscles are lower than those of mammalian muscles,mainly due to the stress of capture. As a result, the pH of fish muscle remains highafter death (>6.0) favouring microbial growth and enzymatic activity (Church 1998,Gram and Huss 1996).
Autolytic changesAutolysis or “self-digestion” of fish is due to enzyme activity. Depending on the typeof enzymes and the substrate where it actuates, the changes that can be encountered

Mausse
UNU-Fisheries Training Programme 7
are for instance, belly-bursting, gapping of fillets, softening and loss of fresh fishflavour.
Nucleotide degradationThe levels of adenosine triphosphate, the muscle energy carrier, fall after death.Depending on temperature, fish species and packaging atmosphere, most of the ATPwill be degraded to inosine monophosphate (IMP), as shown below:
ATP-ADP-AMP-IMP----HX-further metabolism-uric acid
As the degradation sequence continues, inosine (I) and later hypoxantine (HX) areproduced. Accumulation of IMP is of particular significance since it is an importantflavour component in fresh fish, and helps mask bitter flavours. HX has a mild bitterflavour, and high levels can make fish taste unacceptable (Church 1998, Huss 1995).
OxidationConsumers perceive rancidity as an unacceptable taste: Typically soapy, stale andlinseed oil flavours are detected. There are two types of rancidity, hydrolytic andoxidative. In the case of hydrolytic rancidity, the off-flavour is caused by free aminoacids and is generally caused by a combination of micro organisms and moisture.Oxidative rancidity is a much more common problem than hydrolytic rancidity.Oxygen attacks unsaturated fatty acids giving hydro peroxides which degrade intooff-flavour compounds (Church 1998).
Bacteriological changesThe first stage of fish spoilage is dominated by endogenous enzymes, whilst thebacterial flora of the gut cavity, gills and skin adapt to the changing environmentalconditions (Church 1998).The wide range of fish species, the vastly different environments from which they areharvested and the variety of the microbiological sampling techniques used, hasresulted in widely ranging reports in numbers of organisms on fish. The bacterial floraof cold water fish is dominated by the psychrotropic Gram negative genera.Organisms involved belong to the genera Acinetobacter, Flavobacterium, Moraxella,Shewanella and Pseudomonas. Members of the Vibrionaceae (Vibrio andPhosphobacterium) and the Aeromonadaceae (Aeromonas spp.) are also commonaquatic bacteria, whilst Gram-positive organisms such as Bacillus, Micrococcus,Clostridium and Lactobacillus can also be found in varying proportions (Huss 1995).Shewan (1962) concluded that the gram-positive Bacillus and Micrococcus dominatein fish from tropical waters. However, others have found that the micro flora ontropical fish is very similar to that on temperate species but with a slightly higher loadof Gram-positive and enteric bacteria (Huss 1995). Many of the organisms present onspoiled fish play no active role in spoilage (Huss 1995).A clear distinction should always be made between “spoilage flora” and “spoilagebacteria”. Spoilage flora refers to the bacteria present on the fish when consideredspoiled, whereas spoilage bacteria are the bacteria responsible for producing the off-odours and off-flavours in the spoiled fish (Church 1998). Specific spoilage flora forcod stored at different temperatures is given in Table 1.

Mausse
UNU-Fisheries Training Programme 8
Table 1: Specific spoilage bacteria for cod and bacterial spoilage compounds (Church1998).
Storagetemp.
Pack Atmosphere Specific SpoilageBacteria
Spoilage compounds
0°C Aerobic S.putrefaciensP.seudomonas
TMA, H2S, HX. CH3SH. ketones. esters.aldehydes
0°C Vacuum S.putrefaciensP.phosphoreum
TMA, H2S, HX. CH3SH. ketones. estersTMA. HX
0°C MAP P.phosphoreum TMA. HX
5°C Aerobic S.putrefaciens TMA, H2S, HX. CH3SH, ketones, esters
5°C Vacuum S.putrefaciens.Aeromonas spp
TMA, H2S, HX, CH3SH, ketones, esters-
5°C MAP Aeromonas spp -
2.2 Methods to evaluate fish freshness
Most of the methods that have been used to estimate the quality of fresh fish measureor evaluate parameters that change, disappear or are formed during deterioration offish. These methods may be divided into several groups such as sensory,microbiological and chemical methods.
2.2.1 Sensory evaluation
Sensory testing must play an important part in any food quality evaluation programmesince the ultimate criterion for judgement is the human response. Sensory evaluationis based on evaluation of appearance, texture, odour and flavour of food. According toHall (1992), measurements of sensory quality are influenced by three variables: (i) thesample under investigation; (ii) the assessment method; and (iii) the judges.Studies have shown that to have a sensory evaluation panel as a precise tool, thejudges have to be carefully selected, the proper physical facilities must be availableand statistical analysis must be used (Larmond 1967). According to the same study.the testing environment may influence the results. Thus, it is generally recommendedthat a special room, in which as many variables as possible is controlled, be used. Thisroom should be noise and odour free and equipped with individual booths to minimisedistraction.For difference testing, it is important to select a cooking method which best permitdetection of a difference, and to avoid preparations which may add flavour to thesamples.According to Larmond (1967) studies have shown that training reduced differences inscoring levels between judges. Kramer (1952) recommended that judges should beselected based on how well they can detect differences, how consistent they are andhow they compare with the panel average.Sensory methods can be either subjective or objective. The subjective methods arebased on the panellist’s preference for a product and bias among panellists is high.Subjective methods are often applied in market research, consumer tests or productdevelopment. Objective methods, on the other hand are used in quality inspection.Sensory methods used in inspection of freshness quality of raw fish usually involve

Mausse
UNU-Fisheries Training Programme 9
grading of the fish quality parameters. The methods must be precise, technicallycorrect and objective rather than subjective. During the last 50 years many schemeshave been developed for sensory analysis of raw fish. The first modern and detailedmethod was developed by the Torry Research Station in Scotland. Today the mostwidely used method for assessment of raw fish in Europe are the EU-scheme and theQuality Index Method (Huss 1995, Luten and Martinsdottir 1997).
EU-schemeIn the EU scheme three grades of freshness are laid down; E, A and B, correspondingto various stages of spoilage. E or extra is the highest possible quality and fish thatdoes not make grade B, is not fit for human consumption. The EU-schemes listdescriptive terms that fit the description of many fish species. There are somespeculations about the usability or reliability of the EU-scheme because it does nottake into account the differences between species, and it only uses general parametersto describe quality characteristics of fish (Luten and Martinsdottir 1997). Whenevaluating the freshness quality of raw fish. It would be practical if a method could beused to predict the remaining shelf life in days. The EU-scheme does not predict theremaining shelf life because it is too general, applying to many different species thatspoil at different rates (Huss 1995).
Quality Index Method (QIM)New seafood freshness quality grading systems have been under development forvarious species. The QIM is one of these systems and is based on well-definedcharacteristic changes that occur in raw fish, such as outer appearance of eyes, skin,gills, and changes that occur in odour and texture. A score from 0 to 3 demerit (index)points is given for each feature. On a developed QIM scheme the score increaseslinearly with storage time in ice. If the maximum storage time in ice is known theideal demerit curve can be used to predict remaining storage time in ice. The idealdemerit curve begins at the zero and its maximum is where the two curves intersecti.e. where the Torry scale has rejected the cooked product (Figure 1). The advantagesof the QIM scheme are that it is an objective method, non-destructive, rapid, cheap touse and its application requires little training. In addition the method can be used topredict remaining storage time. Good training, in combination with detaileddescriptions of the methods, schemes, sampling plan and illustration materials, mayfacilitate the use of sensory evaluation in different parts of the fishery chain.
Development of QIMThe first step in developing a QIM is to perform a parallel sensory analysis of raw fishand cooked fish. The sensory analysis of cooked fish is based on judgement of taste,texture and odour by a trained panel using the Torry scale. The purpose of sensoryevaluation of raw fish is to describe (literally) all detectable aspects of change on/inthe fresh fish during cold storage in ice. This involves a detailed description of allpossible changes or deviations of sensory parameters such as appearance, texture andodour. Any change for a specific parameter has to be described for each evaluationduring the storage trials (Luten and Martinsdottir 1997).

Mausse
UNU-Fisheries Training Programme 10
Figure 1: Combination of grading of raw fish with QIM and assessment of cookedfillet fish (modified from Hyldig and Nielsen 1977).
Figure 1 shows both the assessment of cooked fish and the Quality index. Theselection of parameters of QIM is determined as a combination of the best descriptorsfor the spoiling fish and fulfilling the aim that the sum of points-grading shall give astraight line with respect to stored days in ice (dashed line).The figure also shows the four phases of fish spoilage. In phase1 the fish is very fresh,sweet, seaweed and has a delicate taste and in phase 2 there is loss of characteristicodour and taste, flesh neutral and texture pleasant. During phase 3 there is a sign ofspoilage but fish is still suitable for human consumption and finally in phase 4 the fishis spoiled and putrid and rejected by cooked assessment. Bold line shows the limit ofacceptability (score 4 for cooked assessment).
Torry scaleThe maximum shelf life of fish can be determined by sensory evaluation of cookedsamples. A descriptive 10-point scale developed at the Torry Research Station is oftenused for this purpose. This scale is often referred to as the Torry scale and has beendeveloped for lean, medium fat and fat fish species. The Torry scale is based on thefour phases described in chapter 2.1.1. Scores range from 10 (very fresh in taste andodour) to 3 (spoiled). Figure 1 illustrates how the sensory evaluation of cooked fishmay be combined to freshness grading with the Quality Index Method.
2.2.2 Microbiological measurements
The number of specific spoilage bacteria is related to the remaining shelf life, whichcan be predicted from such numbers (Huss 1995). Different peptone-rich substratescontaining ferric citrate have been used for detection of H2S-producing bacteria suchas Shewanella putrefaciens, which can be seen as black colonies due to precipitationof FeS (Huss 1995).When stored aerobically, levels of 108-109 cfu/g of specific spoilage bacteria in theflesh are required to cause spoilage in iced fish. A much lower level (107 CFU/g) ofP.phosphoreum is needed to spoil chilled fish packed in MA (Gram and Huss 1996).

Mausse
UNU-Fisheries Training Programme 11
2.2.3 Chemical analysis
Valuable information can be gained from knowing the pH of fish flesh. Measurementscan be done using a pH-meter by placing electrodes either directly into the flesh orinto a suspension of fish flesh in distilled water.Most marine fish contain a substance called trimethylamine oxide (TMAO). Certainbacteria that occur naturally on the skin and in the guts of fish and in seawater canbreak down TMAO to trimethylamine (TMA). The amount of TMA produced is ameasure of spoilage activity.Total amount of ammonia, dimethylamine and trimethylamine formed during spoilageof fish is a commonly used estimate of spoilage. A range of methods are used tomeasure total volatile bases (TVB), but in all of them the fish or a extract of the fish,is made alkaline, the bases are distilled off, collected and measured by titration. Thecommission has fixed a reference method for determination of TVB-N based on awater steam distillation of a perchloric acid extract (Oehlenschlager 1997).
2.3 Modified atmosphere packaging (MAP)
Packaging of semi-prepared and prepared fresh food, have become part of the everyday life of modern consumers. They want to see food on their plates as fresh as whenit was first prepared. This interest in fresh foodstuffs is a strong driving force behindthe development of new shelf-life enhancing methods, whereby artificial additivesand preservatives are no longer acceptable. Nowadays, efforts are being made to meetconsumer demands for naturally preserved quality food, handled and processed aslittle as possible (AGA AB 1997).MAP is the packaging of a perishable food product in an atmosphere, which has beenmodified so that its composition is other than that of air (Ooraikul and Stikes 1991).Early work in 1930 demonstrated that 10-20% CO2 in atmosphere surrounding afoodstuff will suppress the growth of Pseudomonas spp and certain other spoilageorganisms, provided that the temperature is maintained at or below 4°C. Thisphysiological effect of CO2 provides the fish technologist with a method forcontrolling the growth of Pseudomonas spp in chilled fish, and consequently increasesits shelf life (Hall 1992).. Using MAP can also improve overall cost-effectiveness because it:
- Increases sales by satisfying the growing demand by consumers for naturallypreserved quality food, without additives and preservatives
- Increases shelf life in the distribution chain by days or even weeks, whichincreases the availability of fresh food to consumers
- Reduces the return of spoiled foodstuffs- The correct gas mixture in MAP maintains high quality by retaining the
original taste, texture and appearance (AGA AB 1997).In spite of all these benefits, some studies have reported problems such as packcollapsing caused by reduction of pressure within a pack, which manifests itself as aconcave surface of the lid of rigid base packs. In high CO2 concentrations problemssuch as discoloration of whole fish; texture changes and drip losses can occur (Church1998). MAP used in retail packs is an expensive technique and it can not replace goodchilling or good hygienic production conditions (Huss 1995). In addition, toxinproduction of Clostridium botulinum is increased under anaerobic conditions whichmay be of importance for the safety of packed fish (Church 1998, Huss 1995).
Mausse
UNU-Fisheries Training Programme 12
Potential problems with MAP and a variety of techniques adopted to minimise themare discussed in detail by Church (1998).
2.3.1 Characteristics of CO2, O2 and N2 gases
The MAP gas mixtures usually consist of normal air gases: carbon dioxide (CO2),nitrogen (N2) and oxygen (O2). CO2 is the most important gas in the field of MAPtechnology. Micro organisms, in particular aerobic bacteria, are strongly affected byCO2. CO2 inhibits microbial activity by effectively dissolving into the food’s liquidphase, thereby reducing its pH and causing changes in permeability and function.Nitrogen is an inert gas; it is primarily used to replace oxygen in packaging andthereby prevents oxidation. Owing to its low solubility in water, N2 also helps toprevent package collapse by maintaining internal volume. For most foodstuffs, thepackage should contain as little oxygen as possible to retard the growth of aerobicmicro organisms and reduce the degree of oxidation (AGA AB 1997).
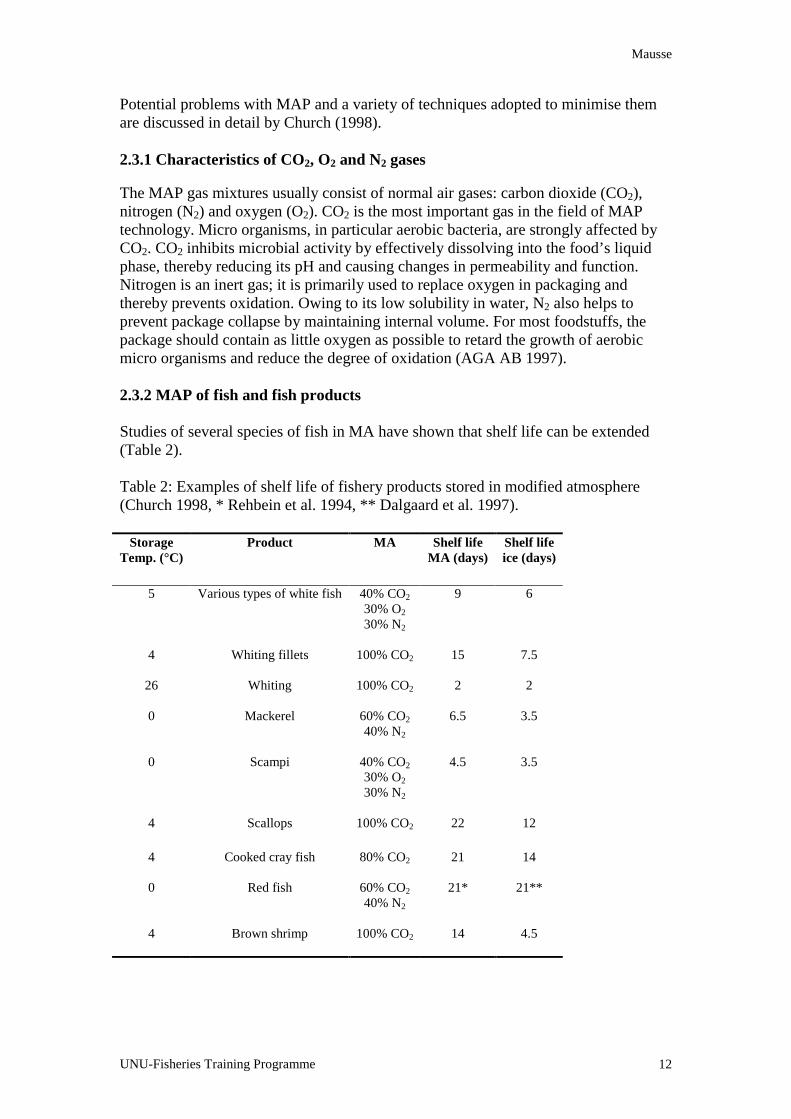
2.3.2 MAP of fish and fish products
Studies of several species of fish in MA have shown that shelf life can be extended(Table 2).
Table 2: Examples of shelf life of fishery products stored in modified atmosphere(Church 1998, * Rehbein et al. 1994, ** Dalgaard et al. 1997).
StorageTemp. (°C)
Product MA Shelf lifeMA (days)
Shelf lifeice (days)
5 Various types of white fish 40% CO230% O230% N2
9 6
4 Whiting fillets 100% CO2 15 7.5
26 Whiting 100% CO2 2 2
0 Mackerel 60% CO240% N2
6.5 3.5
0 Scampi 40% CO230% O230% N2
4.5 3.5
4 Scallops 100% CO2 22 12
4 Cooked cray fish 80% CO2 21 14
0 Red fish 60% CO240% N2
21* 21**
4 Brown shrimp 100% CO2 14 4.5

Mausse
UNU-Fisheries Training Programme 13
2.3.3 Packaging materials and machines
According to AGA AB (1997) packaging materials are of decisive importance forfood quality and shelf life. In order that MA will be maintained during the lifetime ofthe package, several different plastic materials are often combined into a multi-layered structure, each layer having it’s own function. Thus, different plastic materialscan therefore be chosen and combined to achieve: mechanical strength; water vapourbarriers to prevent dehydration and weight loss; gas barrier and gas permeability; anti-fogging properties (the inside of the material should have a surface that does not allowthe formation of water droplets, which reduce transparency); and sealing properties.i.e. capable of sealing into a tight package while retaining material properties evenalong a weld seam.There are 5 main groups of packaging machines used with MAP technologydepending on the type of product (packaged product, packaging material and productvolume).Although these machines are based on different principles, the basic workingoperation is the same: First, a package is formed (or prefabricated packages are used)and filled with the food product. Then, the air in the package is replaced by MA.Finally the package is sealed. These three steps take place either manually orautomatically. The methods used to modify the atmosphere include gas flushing orvacuum extraction and then gas injection (AGA AB 1997).
3. MATERIALS AND METHODS
3.1 Red fish
A total of 270 iced red fish (Sebastes spp) were used in this experiment. The fish werecaught in pelagic haul off the south coast of Iceland and chilled to 0°C in ice. The fisharrived at laboratory on 16/11/00 iced in a container 2 days after capture. The batch of270 fish was divided into 3 groups: 160 fish were stored in MA, 100 fish were storedin ice and 10 fish were used for sampling day 2.For storage in modified atmosphere the 160 fish were iced in 8 plastic boxes (20 fishin each) with holes to allow ice melt drainage and air exchange. The 8 boxes were putin a big container where a 59.7 % CO2: 40.3% N2: 0.123% O2 gas mixture wasinjected to modify the atmosphere. Prior to gas injection, the container was closed andthe two holes (one for oxygen extraction and other for gas mixture injection) werechecked.For ice storage, the 100 fish were iced in a container in alternating layers of ice andfish. Afterwards, the two containers were placed in a cold storage at 0-2°C.Thecontainers were opened 3 times for sampling and ice addition. The gas mixturecomposition was adjusted each time in the MA storage. The temperature of the fishwas measured by locating thermometers in the boxes.
3.2 Sampling plan for all measurements
Two trials were carried out in the experiments. In trial one, whole red fish was storedin ice, and in trial two whole iced red fish was stored in modified atmosphere (60%O2: 40% N2).

Mausse
UNU-Fisheries Training Programme 14
The sensory evaluation of raw (QIM) and cooked (Torry scheme) red fish werecarried out parallel on the sampling days along with measurements of microbialcounts, pH and chemical analysis. Each sampling day, 8 red fish from each trial werecollected. Three fish were analysed whole with QIM, 2 filleted and cooked forsensory evaluation with the Torry scheme, 1 for photographing and 2 for pH,microbial counts and chemical analysis. The flowchart of the fish used in theexperiment is shown in Figure 2.
1 Batch of iced red fish (Sebastes spp) Total 270
Right icing in boxes, amount of fish and
temperature Separation
Sampling on day 2
3 fish for training 3 fish QIM 2 fish Torry scheme2 fish pH, microbial countschemical analysis
sampling days 7, 16 and 22
Evaluated by 10-11 panellists 3 min, 95-100°C
Evaluated by 10-11 panellists
.
Arrival
Checking
10 fish Laboratories 160 fish for storage in MA 100 fish for ice storage
20 fish in each 8 plasticboxes alternating ice/fish
Stack the boxes in a container and inject thegas mixture to modify the atmosphere
Fish placed in a containerwith ice alternating layers
of ice and fish
Place the containers in a cold room (0-2°C)
QIM 3 ice, 3 MA
pH, microbialcounts, chemicalanalysis, 2 ice 2 MA
Sensory evalu-ation of cookedfish 2 ice 2 MA
Photo-graphing 1 ice 1 MA
Sample preparation
Sensory evaluation
Filleting and samplepreparation
Cooking
Sensory evaluationwith Torry Scheme
Figure 2 : Flowchart of fish used in the experiment.
3.3 Quality Index Method (QIM)
A total of 24 red fish were analysed with QIM during the training and evaluationperiod.

Mausse
UNU-Fisheries Training Programme 15
Training of judgesThe training of 11 QIM judges was carried out in one session. The judges were allemployees at the Icelandic Fisheries Laboratories and had experience in assessing fishwith QIM. The judges were introduced to the scheme developed earlier for red fish(Sebastes marinus, S. mentella) stored in ice (Appendix 1).The procedure of evaluation was introduced to the judges and each parameterevaluated was discussed. The judges were informed of the plan to develop a QIMscheme for red fish stored in MA, and were asked to comment on the QIM scheme foriced red fish. The judges observed red fish (the storage time in ice was given) and thescheme was explained to them at the same time.
Sample preparation and QIM evaluationThe fish were collected from the iceboxes and placed on a clean table. The belly sidewas opened to access the internal organs. Each red fish was coded with a numberconsisting of 3 digits that did not indicate the storage time or condition of the fish.For QIM evaluation (6 sessions over 4 sampling days), 21 fish from the two trials atdifferent storage time were evaluated. Fish from both trials (MA and iced) wereevaluated each time. All observations of fish were carried out under standardisedconditions; always in the same room, with as little interruption or distraction aspossible, at room temperature and under electric light.The QIM scheme for red fish (Sebastes mentella, S. marinus) was applied for thesensory analysis of the raw fish. Ten to eleven QIM judges evaluated the fishindividually, and registered their evaluation for each quality parameter in the scheme.The judges had no information about the storage time in ice and MA before theevaluation and were asked to make comments. The evaluation took 20-30 minuteseach time.
3.4 Sensory evaluation of cooked red fish
Training of judgesPrior to the experiment, the panel was trained during one session in the use of theTorry scheme for sensory evaluation. They were all familiar with and had experiencein sensory evaluation of cooked red fish from previous experiments.Sensory analysis of cooked red fish using the Torry scheme for medium fat fish wascarried out parallel to the QIM evaluation. The rejection limit score 5.5 was used forthe Torry scheme. A total of 16 red fish was used for training and assessment with theTorry scheme (see Appendix 2).
Sample preparation and sensory evaluationThe samples were collected from the fillets under the dorsal fin. From each fish 6samples were collected and altogether 12 samples were prepared for each session.The samples were placed in aluminium boxes. Each sample was coded with a numberconsisting of 3 digits that did not indicate storage conditions and were cooked at 95-100°C in a pre-warmed oven, with air circulation and steam for 7 minutes. The boxeswere closed with plastic covers and served to the panel in warm glass containers.Each panellist evaluated 2-3 samples in duplicates per session. For every sample, thepanellists evaluated the attributes using a computer software program (HyperSense1.6 1993-1996, Icelandic Fisheries Laboratories, Reykjavik, Iceland) for datacollection. The evaluation was carried out in 6 sessions over the sampling days. The

Mausse
UNU-Fisheries Training Programme 16
panellists had no information about the storage conditions (storage time, MA or ice)of the samples.
3.5 Photographs
After the fish had been analysed with QIM, one fish from each trial was iced in boxes,where they were stored until photographed (within 3 hours). Thus red fish stored from7 to 22 days in MA or ice were photographed by a professional photographer. In thephotography emphasis was made to highlight the colour and mucus of the skin, colourand form of the eyes and colour and mucus of the gills. Selected photos are intendedto be used with the QIM scheme for red fish stored in MA.
3.6 Microbial counts
In each sampling day, 2 samples from each trial were taken to the MicrobiologicalLaboratory of IFL for microbial counts, performed by the staff. The followingmicrobial counts were carried out: Total plate count on L&H, total and H2S producingbacteria on Iron Agar and Pseudomonas counts on CFC-agar.
3.7 Chemical analysis
TMAO, TMA and TVB from each trial were determined using Flow Injection GasDiffusion Technique (Sadok et al. 1996). The pH of the samples was determined aswell. These measurements were carried out at the Chemistry Laboratory of IFL by thestaff.
3.8 Data analysis
For comparison of two samples a t-Test was applied to test the hypothesis that meansfrom two or more samples are equal, using Microsoft Exel 97. Averages, variance,standard deviations and correlation coefficient were calculated using Microsoft Exel97.The Torry results were analysed using the HyperSense 1.6 software 1993-1996,Icelandic Fisheries Laboratories, Reykjavik, Iceland. Interaction of judges andsamples was assumed and statistical analysis was done using two factor design withinteraction in the analysis of variance (ANOVA) to observe if a significant statisticaldifference existed between samples for each quality attribute assessed. Theprogramme calculates multiple comparisons using Tukeys test.
4. RESULTS
The results from sensory evaluation, chemical measurements and microbial counts arepresented in relation to storage time of red fish in ice and modified atmosphere.

Mausse
UNU-Fisheries Training Programme 17
4.1. QIM
The results from the sensory evaluation of ungutted red fish with QIM scheme areshown in Figure 3. The figure shows the linear relationship between the average QI ofred fish stored in ice and MA.
y = 0,6786x + 0,8237R2 = 0,9739
y = 0,7534x - 0,3195R2 = 0,9943
0
5
10
15
20
0 5 10 15 20 25
Storage days in Ice
Qua
lity
Inde
x
IceMAMAice
Figure 3: Average Quality Index scores of ungutted red fish stored in ice and MAbased on results from 10-11 judges. On sampling day 2 the samples were the same(iced fish).
There was a not statistical difference between average QI scores during storage timeof iced and MA samples, except on sampling day 7 (Table 3).
Table 3: Statistical analysis of Quality Index scores of ungutted fish stored in ice andMA (average QI scores with standard deviation).Storage days in ice Average QI score
IceAverage QI scoreMA
Significance(P)
2 1.16 (0.24) 1.16 (0.24) -7 4.70 (0.58) 6.78 (0.39) 0.00316 12.46 (0.84) 12.07 (1.14) NS *22 15.81 (1.91) 15.18 (0.94) NS **NS: Not significant (p> 0.05)The table shows the significant differences between average QI scores of iced andMA samples on sampling day 7.
The main sensory differences between the two trials commented by judges for theMA fish were yellow colour of skin and grey colour of eyes (Table 4 and Figure 4).
There was not a significant difference for the appearance (colour of skin) between iceand MA samples except on day 16 (Figure 5 and Table 5). when 4 of 11 judgescommented on yellow skin colour of all red fish stored in MA.There was a significant difference in eye colour between the two trials during storagetime (Figure 6 and Table 6). The MA fish samples received higher scores for colourof eyes.
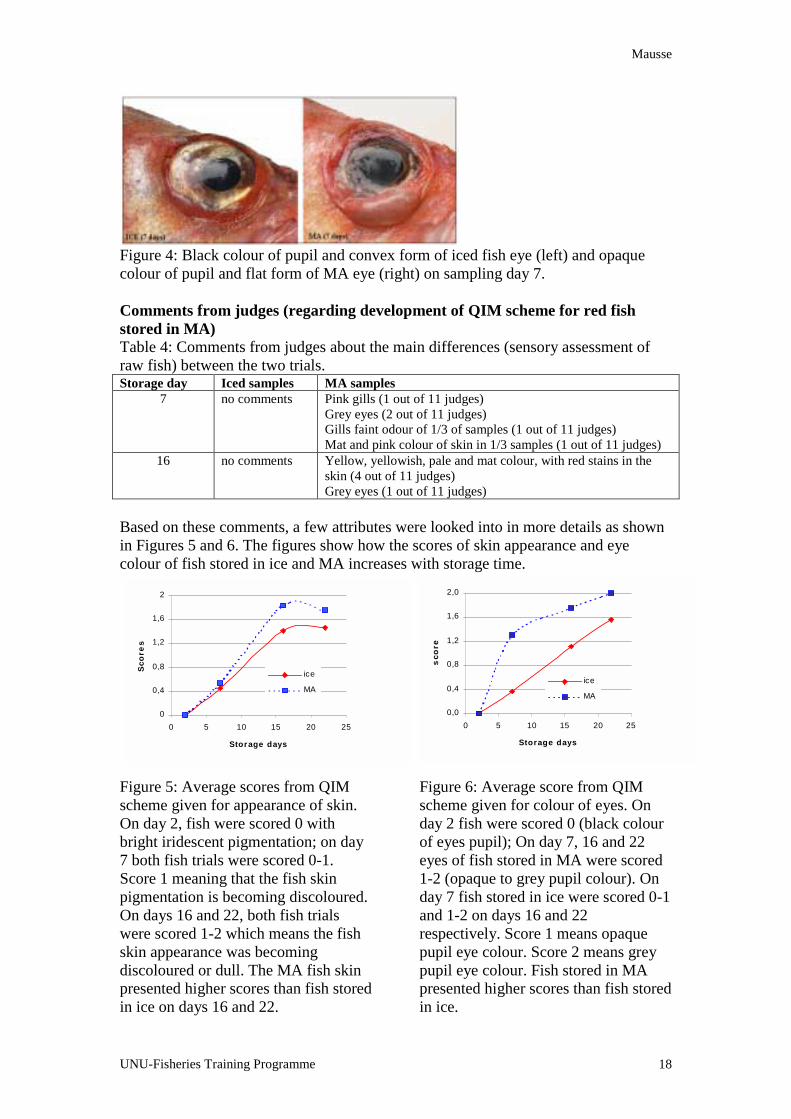
Mausse
UNU-Fisheries Training Programme 18
Figure 4: Black colour of pupil and convex form of iced fish eye (left) and opaquecolour of pupil and flat form of MA eye (right) on sampling day 7.
Comments from judges (regarding development of QIM scheme for red fishstored in MA)Table 4: Comments from judges about the main differences (sensory assessment ofraw fish) between the two trials.Storage day Iced samples MA samples
7 no comments Pink gills (1 out of 11 judges)Grey eyes (2 out of 11 judges)Gills faint odour of 1/3 of samples (1 out of 11 judges)Mat and pink colour of skin in 1/3 samples (1 out of 11 judges)
16 no comments Yellow, yellowish, pale and mat colour, with red stains in theskin (4 out of 11 judges)Grey eyes (1 out of 11 judges)
Based on these comments, a few attributes were looked into in more details as shownin Figures 5 and 6. The figures show how the scores of skin appearance and eyecolour of fish stored in ice and MA increases with storage time.
0
0,4
0,8
1,2
1,6
2
0 5 10 15 20 25
Storage days
Sco
res
ice
MA
0,0
0,4
0,8
1,2
1,6
2,0
0 5 10 15 20 25
Storage days
sco
re
ice
MA
Figure 5: Average scores from QIMscheme given for appearance of skin.On day 2, fish were scored 0 withbright iridescent pigmentation; on day7 both fish trials were scored 0-1.Score 1 meaning that the fish skinpigmentation is becoming discoloured.On days 16 and 22, both fish trialswere scored 1-2 which means the fishskin appearance was becomingdiscoloured or dull. The MA fish skinpresented higher scores than fish storedin ice on days 16 and 22.
Figure 6: Average score from QIMscheme given for colour of eyes. Onday 2 fish were scored 0 (black colourof eyes pupil); On day 7, 16 and 22eyes of fish stored in MA were scored1-2 (opaque to grey pupil colour). Onday 7 fish stored in ice were scored 0-1and 1-2 on days 16 and 22respectively. Score 1 means opaquepupil eye colour. Score 2 means greypupil eye colour. Fish stored in MApresented higher scores than fish storedin ice.

PO Box 1390, Skulagata 4120 Reykjavik, IcelandTable 5: Statistical analysis of Quality Index scores given for appearance of the skinusing the QIM scheme (average QI scores with standard deviation).Storage days Average score ice Average score MA Significance
2 0 (0.00) 0 (0.00) -
7 0.44 (0.24) 0.54 (0.25) NS
16 1.41 (0.05) 1.84 (0.06) 0.01
22 1.47 (0.34) 1.75 (0.43) NS
There was not a significant difference for the appearance (colour of skin) between iceand MA samples except on day 16 where skin colour score of MA samples is higherthan in iced samples.
Table 6: Statistical analysis of Quality Index scores given for colour of the eyes usingthe QIM scheme (average QI scores with standard deviation).Storage days Average score ice MA Significance (p)
2 0.00 (0.00) 0.00 (0.00) -
7 0.37 (0.12) 1.30 (0.28) 0.01
16 1.11 (0.38) 1.76 (0.10) NS
22 1.58 (0.16) 2.00 (0.00) 0.04
The table shows significant differences in eyes colour between the two trials. MA fishsamples received higher scores than iced fish samples.
4.2 Torry
The results of assessment of cooked fish (Figures 7 and 8, Tables 7 and 8) show thatthere is a statistical difference between Torry scores for flavour and odour of the twotrials at storage day 16 and 22. Fish stored in MA maintained better eating quality(higher Torry scores) than fish stored in ice during storage days 7 and 22. Fish storedin ice maintained better eating quality than fish stored in MA on day16.
y = -0,2085x + 10,064R2 = 0,9755
y = -0,2301x + 10,273R2 = 0,9469
3
4
5
6
7
8
9
10
0 5 10 15 20 25Storage days
Tor
ry o
dour
sco
re
Ice
MA
Linear (MA)
Linear (Ice)
y = -0,2414x + 10,129R2 = 0,9749
y = -0,2142x + 9,9564R2 = 0,9993
3
4
5
6
7
8
9
10
0 5 10 15 20 25
Storage days
Tor
ry ta
ste
scor
e
Ice
MA
Linear (Ice)
Linear (MA)
Figure 7: Average Torry flavour scoresof cooked red fish fillets stored in iceand MA based on evaluation of 10-11judges. The figure also shows the
linear relationship between Torry scoreand storage time in ice and MA.Figure 8: Average Torry odour scoresof cooked red fish fillets stored in ice

Mausse
UNU-Fisheries Training Programme 20
and MA based on evaluation of 10-11judges. The figure also shows the
linear relationship between Torry scoreand storage time in ice and MA.
Table 7: Statistical analysis of Torry sensory scores for flavour of cooked red fishfillets stored in ice and MA (averages with standard deviation).Storage days in ice Average score ice Average score MA Significance (P)
2 9.58 (0.41) 9.58 (0.41) -7 8.33 (1.02) 8.40 (0.87) NS *
16 6.76 (1.30) 6.50 (1.48) 0.00122 4.50 (1.36) 5.28 (1.27) 0.010
* Not significant
The table shows significant differences of flavour between the two trials on days 16and 22. Fish stored in MA had better eating quality (higher scores) than fish stored inice on day 22, whereas on day 16 fish stored in ice maintained better eating quality(higher scores) than fish stored in MA.
Table 8: Statistical analysis of Torry sensory scores for odour of cooked fish filletsstored in ice and MA (averages with standard deviation).Storage days in ice Average score ice Average score MA Significance (P)
2 9.60 (0.50) 9.60 (0.50) -7 8.68 (0.65) 8.50 (0.84) NS *
16 7.26 (1.47) 7.15 (0.99) 0.02122 4.74 (1.26) 5.21 (1.07) 0.011
* Not significant.
The table shows significant differences of odour of fish stored in ice and MA on days16 and 22. Iced fish maintained better odour than MA samples on day 16. MAsamples maintained better odour than iced fish on day 22.
The shelf life of fish stored in ice was 19 days (Figure 9) whereas shelf life of fishstored in MA was 21 days (Figure 10).Figures 9 and 10 show the combination of grading raw fish using QIM scheme andassessment of cooked fish using Torry scale during storage days. A score of 5.5 isused as the limit of acceptability as shown with the dashed line.

Mausse
UNU-Fisheries Training Programme 21
0
2
4
6
8
10
2 7 16 22
Storage days
Torr
y sc
ore
0
5
10
15
20
QI
0
2
4
6
8
10
2 7 16 22
Storage days
Torr
y sc
ore
0
5
10
15
20
QI
Figure 9: Combination of grading rawfish (squares) and assessment ofcooked fish stored in ice (circle).Eating quality of the fishwas regarded as unacceptable onstorage day 19, when the Torry scorereached the limit of acceptability (5.5),shown as a dashed line.
Figure 10: Combination of grading rawfish (squares) and assessment ofcooked fish stored in MA (circle).Eating quality of the fish was regardedas unacceptable on storage day 21,when the Torry score reached the limitof acceptability (5.5), shown as adashed line.
4.3 Microbiological counts
There was significant difference between the two trials regarding H2S-producingbacterial counts on day 22 (Table 9), and Pseudomonas count on day 7 (Table 12).The H2S-producing bacterial counts were very low at the beginning of storage in icedsamples and absent in MA samples. On day 16 and 22 the counts were higher in icedsamples than in MA fish (fFgure 11).Total viable counts (TVC) in iced samples were higher than in MA samples (Figure12). When the fish reached the limit of acceptability (sensory score 5.5 Figure 7) TVCin both trials had reached levels of 106-107 cfu/g in iced samples and 102-103 in MAsamples.Pseudomonas were absent on day 2. They were present from day 7 in iced fish andfrom day 16 in fish stored in MA. The Pseudomonas count was higher in fish storedin ice than in MA (Figure 12).

Mausse
UNU-Fisheries Training Programme 22
0
1
2
3
4
5
6
7
0 5 10 15 20 25Storage days
log
cfu/
g
Ice whiteMA whiteIce H2S prod. bac tMA H2S prod. Bac t
0
1
2
3
4
5
6
7
0 5 10 15 20 25Storage days
log
cfu/
g
Ice TVCMA TVCIce PseudomonasMA Pseudomonas
Figure 11: Relationship betweengrowth of H2S producing bacteria(spoilage bacteria) shown with dashedlines and non-spoilage microorganisms (white colonies) shown withsolid lines, during storage of red fish inice and MA. H2S-producing bacterialcounts in iced samples were low in thebeginning of storage and absent in MAsamples. In both trials the number ofH2S producing bacteria constituted alarger percentage of total counts at theend of shelf life and was higher in icefish than in MA fish.
Figure 12: Changes in Total viablecounts on L&H agar (solid lines) andPseudomonas on CFC-agar (dashedline) during storage of red fish in iceand MA. On day 22 TVC in icesamples were higher than in MAsamples (107cfu/g in iced fish and 102-103 cfu/g in MA fish).Pseudomonas were absent on day 2.Pseudomonas counts were present iniced fish from day 7 and from day 16in MA fish. On days 6 and 22Pseudomonas count were higher in fishstored in ice than in MAP.
.
Table 9 shows statistical differences on H2S-producing bacteria counts on day 22between fish stored in ice and MA. Fish stored in ice have higher counts (104-105)than MA fish (102-103).
Table 9: Statistical analysis of H2S-producing bacteria counts (averages with standarddeviation).Storage days average (log cfu/g) ice average (log cfu/g) MA Significance (p)
2 0.65 (0.92) 0.65 (0.92) -7 0.80 (1.13) 0.00 (0.00) NS*
16 4.16 (0.65) 1.24 (1.75) NS*22 4.89 (0.16) 2.09 (0.12) 0.01
Table 10 shows that there was not a significant difference between the two trialsregarding non-spoilage micro organisms (white colonies count).
Table 10: Statistical analysis of non-spoilage micro organisms (white colonies counts)on iron agar (averages with standard deviation).Storage days average (log cfu/g) ice average (log cfu/g) MA Significance (p)
2 1.30 (0.00) 1.30 (0.00) -7 2.49 (0.16) 1.15 (0.21) NS*
16 4.97 (1.07) 1.63 (0.89) NS*22 5.95 (0.12) 3.16 (0.45) NS*

Mausse
UNU-Fisheries Training Programme 23
Table 11: Statistical analysis of total viable counts on L&H agar (averages withstandard deviation).Storage days average (log cfu/g) ice average (log cfu/g) MA Significance (p)
2 1.50 (0.71) 1.50 (0.71) -7 2.74 (0.11) 0.65 (0.92) NS*
16 5.11 (0.33) 1.89 (0.83) NS*22 6.22 (0.14) 3.13 (0.45) NS*
NS* Not significant
TVC was not significantly different between iced fish and MA fish during storage(Table 11).
Table 12: Statistical analysis of Pseudomonas counts on CFC agar (averages withstandard deviation).Storage days average (log cfu/g) ice average (log cfu/g) MA Significance (p)
2 0.00 (0.00) 0.00 (0.00) -7 2.00 (0.06) 0.00 (0.00) 0.01
16 4.25 (0.06) 0.65 (0.92) NS*22 5.45 (0.19) 2.18 (0.67) NS*
NS* Not significant
On day 7 there was a significant difference regarding Pseudomonas counts betweenfish stored in ice and MA, where iced fish had levels of 102cfu/g but were absent inMA fish.
4.4 Chemical measurements
Differences in TMA TMAO and TVB values between ice and MA red fish were notsignificant (p>0.05) (Tables 14, 15 and 16).The pH of MA samples remained lower than in ice samples during the whole trial.Initial pH values decreased until day 7 and then increased with both trials except forMA samples which decreased again from day 16 (Figure 13).TVB increased more rapidly and remained higher in the ice storage samples than inMA samples (Figure 15).TMA values were similar in both trials until day 7. From day 16 TMA amount in icedfish increased whereas, decreased in MA fish (Figure 15).TMAO in both trials decreased up to day 16. From day 16 TMAO started to increaseslightly in ice but some in MA samples (Figure 14).

Mausse
UNU-Fisheries Training Programme 24
6,50
6,60
6,70
6,80
6,90
7,00
7,10
7,20
0 5 10 15 20 25
Storage dayspH
IceMA
Figure 13: Changes in pH during storage of ungutted red fish stored in ice and MA.The pH values decreased until day 7 and then increased in both trials whereas, the pHdecreased again in MA samples from day 16.
0
10
20
30
40
50
60
70
0 5 10 15 20 25
Storage days
mg/
100g
TMAO ice
TMAO MA
0
5
10
15
20
0 5 10 15 20 25
Storage days
mg/
100g
TMA ice
TMA MA
TVB ice
TVB MA
Figure 14: Changes in trimethyl-amineoxide (TMAO) during storage ofungutted red fish stored in ice and MA.The figure shows decreasing TMAOup to day 16 in both trials. From day16 TMAO started to increase in fishstored in ice reaching levels of 48.04mg/100g on day 22. From day 16 thereis a slight increase in MA samplesreaching levels of 66.77 mg/100g onday 22.
Figure 15: Changes in total volatilebases (TVB) and trimethylamine(TMA) during storage of ungutted redfish stored in ice and MA. The figureshows TVB values increasing duringstorage of iced fish and decreasingduring storage of MA fish. TVB valuesin iced fish were higher than those onfish stored in MA. TMA values weresimilar in both trials until day 7. Fromday 16 TMA amount in iced fishincreased whereas decreased in MAfish.
During storage time no significant difference between pH of iced fish and MA wasfound (Table 13).
Table 13: Statistical analysis of pH measurements (averages with standard deviation).Storage days average Ice average MA Significance (p)
2 6.8 (0.04) 6.8 (0.04) -7 6.7 (0.01) 6.6 (0.03) NS*
16 6.9 (0.07) 6.7 (0.00) NS*22 7.1 (0.14) 6.6 (0.14) NS*
NS* Not significant

Mausse
UNU-Fisheries Training Programme 25
No significant difference was found between iced fish and MA fish regarding TMA(Table 14).
Table 14: Statistical analysis of TMA amount (averages with standard deviation).Storage days average (mg/100g) ice average (mg/100g)
MASignificance (p)
2 0.02 (0.00) 0.02 (0.00) -7 0.03 (0.00) 0.03 (0.00) NS*
16 3.29 (1.79) 0.46 (0.02) NS*22 7.33 (4.75) 0.44 (0.13) NS*
NS* Not significant
There were no significant differences on TMAO of fish stored in ice and MAP (Table15).
Table 15: Statistical analysis of TMAO amount (averages with standard deviation).Storage days average (mg/100g) ice average (mg/100g)
MASignificance (p)
7 57.39 (6.02) 62.17 (9.77) NS*16 45.63 (1.22) 41.01 (1.53) NS*22 48.04 (12.85) 66.77 (2.03) NS*
NS* Not significant
There were no significant differences on TVB of fish stored in ice and MAP (Table16).
Table 16: Statistical analysis of TVB amount (averages with standard deviation).Storage days average (mg/100g) ice average (mg/100g)
MASignificance (p)
2 11.08 (1.36) 11.08 (1.36) -7 9.81 (0.45) 10.12 (0.00) NS *
16 11.18 (0.79) 9.27 (0.35) NS *22 17.88 (5.49) 7.45 (0.99) NS *
*NS Not significant
5. DISCUSSION, CONCLUSIONS AND RECOMMENDATIONS
The QI scores showed there was a significant difference between iced and MA fish onsampling day 7. The significantly higher QI scores given for MA fish in storage day 7may be because of changes in skin colour and form of eyes as was reported by thepanellists for the MA fish. These changes in colour of fish stored in MA are notsurprising. Huss (1995) has reported discoloration as a negative effect of CO2 onungutted fish colour. Ooraikul and Stiles (1991) reported discoloration of beef as theeffect of MA.The higher scores given for the eyes of the fresh MA stored fish, implies that thedescriptions and scores for colour of pupil by the QIM scheme for red fish, are notaccurate enough for red fish stored in MA, whereas, the eyes of MA red fish lookedspoiled (score 2) before they were actually spoiled. It can therefore, be concluded thatthe Quality Index Method (QIM) scheme for red fish (Sebastes mentella, S.marinus)
Mausse
UNU-Fisheries Training Programme 26
is not suitable for red fish stored in MA because of rapid changes in eyes and skincolour that occur during MA storage. To overcome this problem, it is necessary toapply different descriptors to describe the changes that occur in colour of eyes andskin of MA stored red fish.
The shelf life of red fish stored in ice was similar to what has been reported byRehbein et al. (1994) for red fish (Sebastes spp) stored in ice, i.e. 3 weeks. The resultsreported here are also similar to what has been reported by Dalgaard et al. (1997) forthe shelf life of MA stored red fish which was rejected at the 21st storage day.In this experiment, MA gave a shelf life extension of 2 days over the ice fish. Thehigh CO2 resistance of P. phosphoreum explained the modest shelf life extension ofMA cod. It can therefore, be concluded that MA can extend shelf life for red fishunder the conditions of this experiment.The level of Pseudomonas in ice samples was always higher than in MA samples. Itsupports the idea that under aerobic iced storage, the flora is composed almostexclusively of Pseudomonas sp. and S. putrefaciens (Gram et al. 1987).The decrease of pH during the first days of storage could be explained by “postmortem” glycolysis that results in the accumulation of lactic acid, which in turnlowers the pH of the muscle. Huss (1995) has reported pH drops from 6.8 to 6.1-6.5 incod and from 6.8 to 5.4-5.6 in tuna and halibut.The higher increase of Total Volatile Bases (TVB) in fish stored in ice compared tofish stored in MA is not surprising since the TVB are produced mainly by H2Sproducing bacteria which were in much higher amounts in iced fish than in MA fish.At the rejection time TVB had not reached the concentration of around 25 mg/100g.Commission decision of 8 March 1995 fixed this value as the limit for rejection oflots (Oehlenschlager 1997), whereas in this study TVB and TMA values are not acriterion for unspoilt fish.It can be concluded that in this study, TVB and TMA measures have not provided auseful index of shelf life.
For MA stored red fish it is necessary to revise the existing QIM schemes for iced redfish. For development of QIM scheme for Mozambican species, it would be necessaryto finish the construction and equipment of the new laboratories in Maputo, Beira andQuelimane which are scheduled to be ready by the first term of this year. In order toensure defined characteristics for different storage time to be incorporated in the QIM,preliminary studies must be conducted in an appropriate way. It is also recommendedto have manuals to support QIM in fish inspection and production. The manuals mustcontain the total plan for evaluation, explanation of the evaluation terms, and colourphotos illustrating the different levels of freshness during the storage time of fish.

Mausse
UNU-Fisheries Training Programme 27
ACKNOWLEDGEMENTS
The author is grateful to ICEIDA for providing a fellowship, to the MozambicanMinistry of Fisheries, to supervisors Tyrí Valdimarsdóttir and Kolbrún Sveinsdóttirfor their help and guidance, to the Library staff for their help in finding references, toTumi Tómasson and Thór Ásgeirsson for their help in English spelling and grammar.The author would like also to acknowledge Jarmila Hermannsdóttir and SigurdurEinarsson for carrying out the microbiological counts and chemical measurements,respectively.
REFERENCES
AGA AB 1997. MAPAX, The Optimal Solution of Modified Atmosphere. Bookletfrom AGA. Sweden. 38 pp.
Church, N. 1998. Feature MAP fish and crustaceans-sensory enhancement. FoodScience and Technology Today 12 (2): 73-82.
Council Directive 91/493/EEC of 22 July 1991 laying down the health conditions forthe production and the placing on market of fishery products. Official Journal 1991.L. 268: 015-034.
Dalgaard, P., Mejlholm, O., Christiansen, T.J. and Huss, H.H. 1997. Importance ofPhotobacterimu phosphoreum in relation to spoilage of modified atmosphere-packedfish products. Letters in Applied Microbiology 24:373-378.
Gram L., Trolle G., Huss, H.H. 1987. Detection of specific spoilage bacteria from fishstored at low (0°C) and high (20°C) temperatures. Int J Food Microbiol 4:65-72.
Gram, L. and Huss, H.H. 1996. Microbial spoilage of fish and fish products.International Journal of Food Microbiology 33:121-137.
Hall, G.M. 1992. Fish Processing Technology,. pp. 89-93; 276-291. London: BlackieAcademic & Professional.
Huss, H. H. 1995. Quality and quality changes in fresh fish. FAO Fisheries Technicalpaper n° 348. pp.51-53. Rome: Food and Agriculture Organization of the UnitedNations.
Hyldig, G. and Nielsen 1997. A rapid sensory method for quality management. M.Sc.thesis. In Sveinsdottir. K. 2000. Quality parameters and development of quality IndexMethod (QIM) scheme for farmed salmon. Reykjavík: University of Iceland, pp.3-5.
Larmond, E. 1967. Food Quality Evaluation: A Review of Sensory Methods. InKreuzer, R. ed. Fish Inspection and Quality Control, pp 172-174; 180-182.USA:Food and Agriculture Organization of the United Nations.
Luten, J.B. and Martinsdottir, E. 1997. QIM: An European tool for fish freshnessevaluation in the fishery chain. In Methods to determine the freshness of fish in

Mausse
UNU-Fisheries Training Programme 28
research and industry, Proceeding of the Final meeting of the concerted Action“Evaluation of Fish Freshness”, AIR3CT94 2283 pp 287-296. Paris: InternationalInstitute of Refrigeration.
Oehlenschlager, J. 1997. Evaluation of Fish Freshness. In Methods to determine thefreshness of fish in research and industry, Proceeding of the Final meeting of theconcerted Action “Evaluation of Fish Freshness” AIR3CT94 2283 pp 92-99. Paris:International Institute of Refrigeration.
Ooraikul, B. and Stiles, M.E. 1991. Modified Atmosphere Packaging of Food, pp. 1-12; 148-294. USA: Elis Horwood series in food science and techhnology.
Regulamento (CE) 2406 1996. Regulamento n°2406/96 do conselho de 36 denovembro de 1996 relativo a fixacao de normas comuns de comercializacao paracertos productos da pesca. Jornal oficial n1 L 334 de 23/12/1996 p. 1-15.
Rehbein, H., Martinsdottir, E., Blomsterberg, F., Valdimarsson, G. andOehlenschlaeger, J. 1994. Shelf life of ice-stored redfish. Sebastes marinus and S.mentella. International Journal of Food Science and Technology 29:303-313.
Sadok, S., Uglow, R.F. and Haswell, S.J. 1996. Determination of trimethylamineoxide in seawater and small volumes of seafood tissue using flow injection analysis.Analytical Chemistry Acta. 85: 334.279.
Shewan, J. M. 1962. The bacteriology of fresh and spoiling fish and some relatedchemical changes. In: J. Hawthorn & J. Muil Leitch eds. Recent advances in foodscience, 1:167-193.
Mausse
UNU-Fisheries Training Programme 29
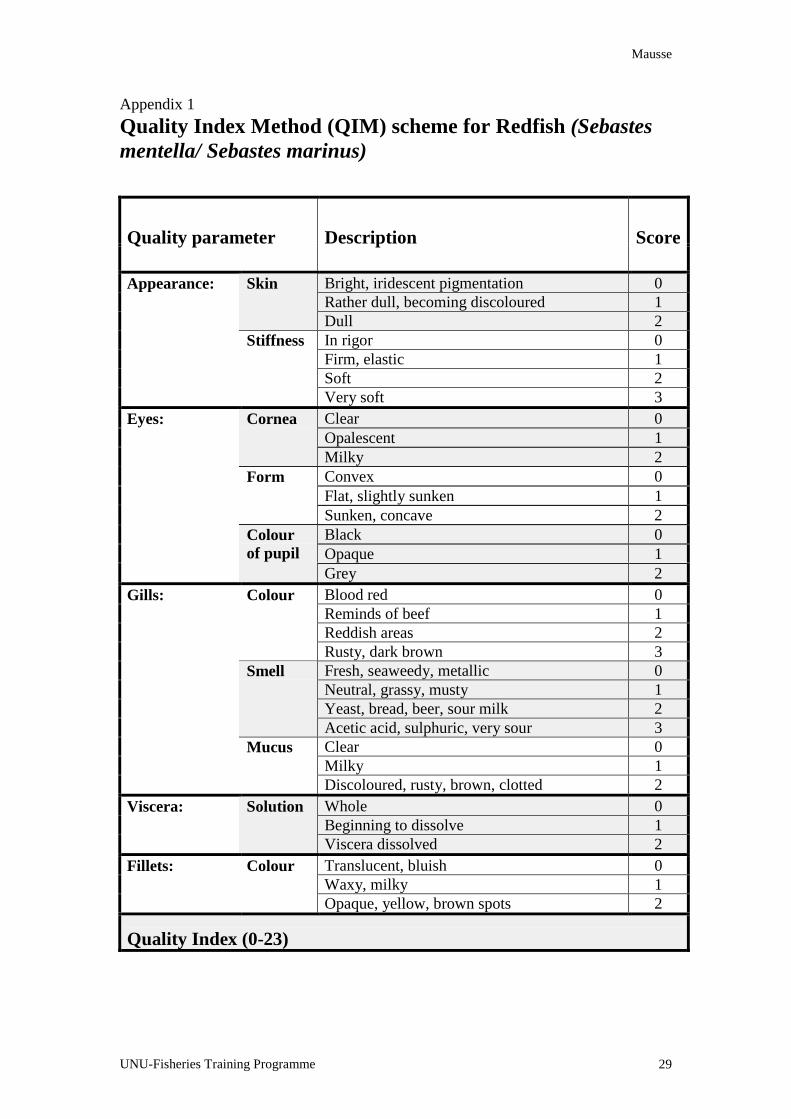
Appendix 1Quality Index Method (QIM) scheme for Redfish (Sebastesmentella/ Sebastes marinus)
Quality parameter Description Score
Bright, iridescent pigmentation 0Rather dull, becoming discoloured 1
Skin
Dull 2In rigor 0Firm, elastic 1Soft 2
Appearance:
Stiffness
Very soft 3Clear 0Opalescent 1
Cornea
Milky 2Convex 0Flat, slightly sunken 1
Form
Sunken, concave 2Black 0Opaque 1
Eyes:
Colourof pupil
Grey 2Blood red 0Reminds of beef 1Reddish areas 2
Colour
Rusty, dark brown 3Fresh, seaweedy, metallic 0Neutral, grassy, musty 1Yeast, bread, beer, sour milk 2
Smell
Acetic acid, sulphuric, very sour 3Clear 0Milky 1
Gills:
Mucus
Discoloured, rusty, brown, clotted 2Whole 0Beginning to dissolve 1
Viscera: Solution
Viscera dissolved 2Translucent, bluish 0Waxy, milky 1
Fillets: Colour
Opaque, yellow, brown spots 2
Quality Index (0-23)

Mausse
UNU-Fisheries Training Programme 30
Appendix 2:Torry scheme for medium fat fish (such as red fish)
- a freshness score sheet for cooked fish-
Score Odour Flavour10 Initially weak odour of boiled cod
liver, fresh oil, starchyBoiled cod liverWatery, metallic
9 Shellfish, seaweed,boiled meat,oil, cod liver
Oily, boiled cod liverSweet, meaty,characteristic
8 Loss of odour,neutral odour
Sweet and characteristic flavoursbut reduced in intensity
7 Woodshavings, woodsap,vanillin
Neutral
6 Condensed milk,Boiled potato
Insipid
5 Milk jug odours,boiled clothes-like
Slight sourness, trace of“off”-flavours, rancid
4 Lactic acid, sour milk,TMA
Slight bitterness, sour,“off”-flavours, TMA,rancid
3 Lower fatty acids (e.g. aceticor butyric acids) composedgrass, soapy, turnipy, tallowy
Strong bitter, rubber,slight sulphide, rancid