Embed Size (px)
Citation preview
Shear Strength and Durability Testing of Adhesive Bonds in Cross-Laminated Timber
Sikora, K. S., McPolin, D. O., & Harte, A. M. (2016). Shear Strength and Durability Testing of Adhesive Bonds inCross-Laminated Timber. Journal of Adhesion, 92(7-9), 758-777. DOI: 10.1080/00218464.2015.1094391
Published in:Journal of Adhesion
Document Version:Peer reviewed version
Queen's University Belfast - Research Portal:Link to publication record in Queen's University Belfast Research Portal
Publisher rightsCopyright © Taylor & Francis Group, LLCThis is an Accepted Manuscript of an article published by Taylor & Francis in The Journal of Adhesion on 06 October 2015, available online:http://www.tandfonline.com/doi/full/10.1080/00218464.2015.1094391
General rightsCopyright for the publications made accessible via the Queen's University Belfast Research Portal is retained by the author(s) and / or othercopyright owners and it is a condition of accessing these publications that users recognise and abide by the legal requirements associatedwith these rights.
Take down policyThe Research Portal is Queen's institutional repository that provides access to Queen's research output. Every effort has been made toensure that content in the Research Portal does not infringe any person's rights, or applicable UK laws. If you discover content in theResearch Portal that you believe breaches copyright or violates any law, please contact [email protected].
Download date:18. Jun. 2018

Shear strength and durability testing of adhesive bonds in cross-laminated timber
K.S. Sikora1*, D.O. McPolin2, A.M. Harte1
1National University of Ireland, Galway, University Road, Galway, Ireland.
2Queen’s University Belfast, University Road, Belfast, BT7 1NN, UK.
Abstract
The paper addresses the quality of the interface and edge bonded joints in layers of cross-
laminated timber (CLT) panels. The shear performance was studied to assess the suitability
of two different adhesives, Polyurethane (PUR) and Phenol-Resorcinol-
Formaldehyde (PRF), and to determine the optimum clamping pressure. Since there is no
established testing procedure to determine the shear strength of the surface bonds between
layers in a CLT panel, block shear tests of specimens in two different configurations were
carried out, and further shear tests of edge bonded specimen in two configurations were
performed. Delamination tests were performed on samples which were subjected to
accelerated aging to assess the durability of bonds in severe environmental conditions. Both
tested adhesives produced boards with shear strength values within the edge bonding
requirements of prEN 16351 for all manufacturing pressures. While the PUR specimens
had higher shear strength values, the PRF specimens demonstrated superior durability
characteristics in the delamination tests. It seems that the test protocol introduced in this
study for crosslam bonded specimens, cut from a CLT panel, and placed in the shearing
tool horizontally, accurately reflects the shearing strength of glue lines in CLT.
* Corresponding author; [email protected]
Keywords
CLT, engineered wood, durability, adhesives for wood, joint design, delamination
1. Introduction
1.1 CLT concept
Construction materials are expected to comply with requirements reaching far beyond a
general utility market. New high-performance materials are required not only to be more
durable and exhibit a longer life, even under severe environmental conditions, but having
consumed less energy during their life cycle. When compared with conventional materials,
they have to be more ecologically friendly and follow sustainability trends. One promising
product, satisfying the criteria of sustainability, is CLT.
CLT is a prefabricated multi-layer engineered panel wood product, with the grain direction
of consecutive layers orthogonally orientated, bonded by gluing their surfaces together
with an adhesive under pressure for a period of time. This specific orientation results in
increased in-plane and out-of-plane strength, rigidity and stability. The degree of
anisotropy in properties and the influence of natural variations, such as knots, are reduced
in comparison with construction timber [1-6]. Load-bearing CLT wall and floor panels are
easily assembled on site to form multi-storey buildings, improving construction and project
delivery time, reducing costs, and maximising efficiency on all levels [2, 7-10].
1.2 Testing of adhesive bond quality

Different standard testing procedures for determining the quality of the interface bond
between the laminations have been established, which are based on determination of local
shear strength and wood failure percentage, according to the standards such as EN 302
[11], EN 392 [12], ASTM D 905 [13]. As pointed out by Steiger et al. [14, 15], only general
principles of the methods of applying shear stress to the bond line are presented in the
relevant standards. In accordance with EN 302 [11], the shear strength of adhesive bonds
is determined by applying a longitudinal tensile force to a single lap joint with close contact
or thick glue lines between two rectangular wooden elements. In EN 392 [12], a cylindrical
bearing is specified that is able to self-align so that the test piece can be loaded at the end-
grain with a stress field uniform in the width direction. A similar shearing tool is proposed
by ASTM 905 [13], however, the difference in comparison with EN 392 [12] is that the
two blocks comprising the specimen are bonded in a staggered (lapped) configuration. In
all these methods, pure shear stress cannot be obtained, but the resulting stress in the bond
line is a combination of shear and normal stresses [14-17]. When the normal stresses are
acting as tensile stresses perpendicular to the bond line, the recorded shear strength values
range considerably below the pure shear stress level, while compression stresses
perpendicular to the grain lead to an overestimation of the shear strength of the bond line.
In order to limit this effect, Steiger et al. [14, 15] developed a prototype of a modified shear
test device, which ensures a clearly defined state of shear loading of the specimens.
Because of these limitations in the methodologies used for assessing adhesive bonds
performance, it is generally accepted that no single test procedure can provide all of the
information to definitively measure bonding quality [18]. Since it is believed that many
factors influence the results including the strength of the wood, the specimen geometry, the

shear tool design, and the rate of loading, wood failure percentage is often recorded in order
to assess the quality of adhesive bond [19]. It provides information whether the superior
strength is in the timber or the bond, but lacks information on the failure behaviour [20].
In order to compare and assess the suitability of different testing protocols for adhesive
bonds, Serrano [17] modelled the adhesive layers in the specimens in accordance with
different codes, including: ASTM-D 905 [13] and EN-302 [11] using a nonlinear softening,
fracture mechanics model. The results showed that the prediction of bond line strength is
highly dependent on the specimen type used and the adhesive properties. On the other hand,
Davalos et al. [21] found the block-shear tests of ASTM D 905 [13], as the most suitable
for obtaining the average interface shear strengths when testing fibre-reinforced plastic
(FRP)-wood bonds, where the combination of various parameters affects measurement.
The stiffness imbalance that arises from the bonding of dissimilar materials was noted as
being an important issue in the shear stress distribution in other studies [22, 23].
Furthermore, when two materials of different stiffness are bonded together, the shear stress
and transverse normal stress in the adhesive layer are responsible for the initiation of the
failure of the adhesively bonding joints near the free ends of adhesively bonding region
where the peak stresses occur [24].
In addition to the mechanical properties of adhesive, other factors influencing adhesive
performance such as temperature, humidity or ageing of the bonds should be taken into
consideration [25-27]. This was evidenced in an extensive study by Raftery et al. [28] on
the hygrothermal compliance of a variety of wood-laminating adhesives when bonding
FRP materials to wood. Raftery et al. [29] also showed that with specific adhesives, cost-
effective thin bond lines have the capacity to resist severe hydrothermal stresses imposed

at the FRP–wood interface. Lavisci et al. [30] examined delamination of thick joints after
accelerated ageing cycles and concluded that the delamination test seemed to be effective
in characterising the performance of the boned joint. Another factor that seemed to have
significant effect on the performance of adhesively bonded timber joints is occurrence of
defects. The empirical and numerical study of the influence of artificial defects on the
capacity of adhesively bonded timber joints by Grunwald et. al [31] demonstrated that
joints with a 50% defect area still achieved a capacity of 70% of that of defect-free joints.
1.3 CLT delamination testing
The provisional European Standard EN 16351:2013 [32] is the first European code strictly
dedicated to CLT that sets out provisions regarding the performance characteristics of CLT
for use in buildings and bridges. According to prEN 16351 [32], the resistance of edge
bonding has to be controlled by means of block shear tests according to EN 392 [12]. For
controlling the adhesion or the resistance against fractures in the bond line, specimens of
defined geometry have to be exposed to a specific series of climatic conditions and
afterwards the delamination of their bond lines has to be determined (more details in
section 2.2).
In accordance with Canadian [33] and U.S. [34] CLT Handbooks, wood failure results from
block shear specimens tested under vacuum-pressure-dry conditions can be used to assess
the bond quality. It is considered that dry wood failures lacked consistency and should not
be considered as a reasonable criterion in assessing the bond quality of CLT panels. Only
the vacuum‐pressure‐dry wood failures showed consistency in assessing the bond quality
of CLT panels [35]. In addition to the influence of timber moisture content and

temperature, factors such as distortion and wane have a negative influence on bonding
strength due to their effect on the bond line geometry. Therefore, in accordance to
ANSI/APA PRG 320-2012 [36], an ‘effective bonding area’, defined as the proportion of
the lamination wide face averaged over its width that is able to form a close bond upon
application of pressure, of 80% is required.
In order to clarify the consequences of the interacting parameters bonding pressure and
spreading rate on CLT production, a comprehensive research project was conducted [3,
37]. Two types of one-component polyurethane (1K-PUR) adhesives, three bonding
pressures of (0.1, 0.3, 0.6) N/mm² and various spreading rate were investigated.
Additionally, the effect of cyclic climatic variations (20 °C / 90 % RH and 30 °C / 40 %
RH; numbers of cycles: 0, 10, 21, 25) on the properties of bonding was also analysed. The
bonding properties were investigated by means of rolling shear tests on whole CLT
elements in bending according to EN 408 [38], block (rolling) shear tests on the single glue
line according to EN 392 [12], and delamination tests according to EN 391 [39]. The
investigated bonding pressures were found to be sufficient to realise adequate bond
qualities provided the thickness variations between boards of the same CLT layer was kept
low. It was found that parameters like warp or twist of the board material showed nearly
no or at least negligible effects on surface bonding. Further, a positive relationship between
bonding pressure and shear strength was observed in cases where the applied spreading
rate was lower than that recommended by the manufacturer or the deviations in thickness
were too high.
1.4 Adhesives systems for CLT
Generally, adhesives are grouped according to their chemistry [25, 40]. However, Frihart
[41] proposed to consider not only the chemical, but also the mechanical response of
adhesives and therefore suggested to differentiate between two main groups: in-situ
polymerised and pre-polymerised adhesives. The in-situ polymerised adhesives contain
relatively rigid, highly crosslinked polymers such as urea-formaldehyde (UF), melamine
formaldehyde (MF), melamine-urea-formaldehyde (MUF), phenol-formaldehyde (PF),
phenol-resorcinol- formaldehyde (PRF), but also polymeric methylene-diphenyl-
diisocyanate (pMDI), where as the second group includes flexible polymers such as
polyurethane (PUR) and polyvinyl acetate (PVAc). These two groups differ significantly
in their ability to distribute moisture induced stress in an adhesive bond resulting in
different failure mechanisms.
The adhesive systems which are allowed for use in CLT production according to prEN
16351 [31], and the Canadian [33] and U.S. [34] CLT Handbooks are:
- phenoplast- and aminoplast-adhesives; these include adhesives primary MUF and PRF,
- one-component polyurethane adhesives (1K-PUR);
- emulsion-polymer-isocyanate adhesive (EPI).
Typical characteristics of these adhesives are presented in Table 1. It should be noted that
while Table 1 gives recommended values for wood moisture content, application rate,
applied pressure, and assembly and pressing times, in practice specific manufacturers’
requirements must be followed.
PRF is a popular adhesive for structural use (commonly used for glulam manufacturing),
which is the cheapest (per kg) among such adhesive systems. However, PRF requires a

higher spreading rate than PUR (approx. 3 times) and EPI, and much longer pressing time
than EPI and PUR. PRF is dark brown, which may be an issue in terms of aesthetic quality,
and contains formaldehyde whereas EPI and PUR are light-coloured and formaldehyde-
free. Due to the chemical reaction with water, PUR produces slight foaming during
hardening. PRF, EPI and PUR are in principal suitable for bonding of finger joints as well
as edge and surface bonding, however EPI, according with prEN 16351 [32], is not allowed
for large finger joints.
1.5. Objectives of the present study
In order to address the quality of the interface bonds in CLT it has been intended to:
- assess the suitability of different adhesives and to determine the optimum clamping
pressure;
- assess the durability of adhesive bonds;
- make recommendations on suitable testing protocol for adhesive bonds in CLT.
2. Materials and methods
In order to realize the objectives of this study, a research program consisting of shear and
delamination tests was carried out. Further, for shear testing, specimens of two geometries
were manufactured, one group of specimens, edge bonded in accordance with prEN 16351
[32], and another group, faced bonded, cut from manufactured CLT panels. Loadings
during shear testing were applied in two different directions for each specimen group, as
shown in Figure 1 (abbreviations for each specimen configuration are also presented).
Specimens for delamination tests were also cut from CLT panels. The delamination tests
followed procedures outlined in prEN 16351 [32]. Two types of adhesives, PUR and PRF,
using four different manufacturing pressures, were used for specimen preparation during
the course of this study.
2.1 Materials
2.1.1 Timber
In order to ensure a uniform moisture content of 12% (measured by Handheld Moisture
Meter GE Protimeter BLD5602 Timbermaster) in the specimens during the testing, boards
of C16 Irish Sitka spruce (Picea sitchensis) were stored in a conditioning chamber (65±5%
R.H., 20±2°C) for 3 months before specimen preparation. Subsequently, all sides of the
boards were planed by a specialised company to cross-sectional dimensions of 94 mm by
30 mm. A tight tolerance on the lamination thickness is required for the production of CLT
due to the thin bond lines used. Because of this, thickness measurements were taken on the
boards immediately after planing to determine whether the required tolerance of 0.1 mm
was achieved. The boards that failed to meet the required tolerance were excluded when
the test specimens were manufactured.
2.1.2 Adhesives
A 1K-PUR adhesive (PURBOND HB S309, Purbond AG, Sempach, Switzerland) and a
two-component PRF adhesive (Prefere 4050 M with hardener Prefere 5750, Dynea UK,
Flintshire, UK, using a ratio of 1:1), formulated for the manufacture of engineered wood
products systems, were used to bond the edges of the shear test specimens. The reasons for
such selection are related to extremes in values of relevant factors between these two
systems: application rate, pressing time and costs. In addition, their structural performance
is considered to be superior to EPI.
2.2 Methodology
2.2.1 Specimen preparation
The adhesive systems were applied on one of the bonded surfaces at the rate of 160 g/m2
for PUR, and on both surfaces at the rate of 400 g/m2 (200 g/m2 on each surface of glue
line) for PRF, as recommended by the adhesive manufacturers. Four different values of
pressure, namely 0.4 N/mm2, 0.6 N/mm2, 0.8 N/mm2 and 1.0 N/mm2, were applied by a
compressive testing machine for 120 minutes for the PUR-bonded specimens and for 16
hours the PRF-bonded specimens. Pressing time is a function of temperature and, as the
ambient laboratory temperature was approximately 17 °C for the PRF-bonded specimens,
the selected pressing time was to ensure compliance with the manufacturer’s
recommended minimum for cold bonding (15 h for 15°C) [42]. The manufacturers
recommend applying pressure from 0.6 N/mm2 to 1.0 N/mm2 for softwoods, for both
adhesives. These were addressed in this study and additionally samples prepared using
lower pressure, 0.4 N/mm2, were tested to assess this lower pressure potential usage that
may facilitate CLT production. After reconditioning (65±5% R.H., 20±2°C), test
specimens were cut to size.
The two sets of specimens, which were edge bonded, had bonded areas of dimensions 30
mm thick and 50 mm wide, in accordance with prEN 16351:2013 [32]. In addition, solid
wood specimens, without glue lines, of the same cross-sectional dimensions were prepared.

In order to prepare specimens for the shear tests of crosslam bonded elements (specimens
bonded orthogonally) and the delamination tests, sample CLT panels of 90 mm (3 layers
of 30 mm) thickness were manufactured. Panels were face-bonded only; there were no
edge bonds in these CLT panels. After reconditioning (for min. 2 weeks to 12% moisture
content), specimens for the shear tests of crosslam bonded elements and for the
delamination tests of glue lines between layers were cut from these panels. These
specimens had cross-sectional dimensions of 30 mm by 50 mm as for edge bonded
specimens. Figure 2 presents schemas of the shear tests specimens for end-grain (a) and
perpendicular to grain loading directions (b) and shear test specimens for crosslam bonded
elements vertical (c) and horizontal (d) loading directions.
Table 2 presents the numbers of shear test specimens for the different bonding pressures,
adhesives and test configurations.
The delamination tests were carried out on 10 specimens of 100 mm by 100 mm by 90 mm
for each adhesive type and manufacturing pressure. The number of specimens for shear
and delamination tests is in accordance with recommendations of ‘Factory production
control for cross laminated timber products’ from prEN 16351:2013 [32].
2.2.2 Shear testing
The shear tests were carried out by applying a compressive force using a shearing tool in
accordance with EN 392 [12]. The cylindrical bearing was able to self-align so that the test
piece could load at the end-grain and perpendicular to grain with a stress field uniform in

the width direction. The EN 392 [12] standard requires loading tested specimens at the end-
grain. However, since in CLT panels the wood grain of each layer are orientated
perpendicular to wood grains of layers with which it is in contact, the shear stresses occur
in different planes. Because of this, tests were carried out with specimens loaded
perpendicular to grain, and for the crosslam specimens. Loads were applied in the vertical
and horizontal directions. Loading was applied under displacement control at a rate of 3
mm/min, ensuring failure after no less than 20 s, which is in accordance with EN 392 [12]
and studies by Steiger et al. [14, 15]. Just after the shearing tests, 50 mm long portions were
cut from each specimen, and weighted in order to determine the density.
For the purpose of the shear testing analyses Student’s t-test was carried out for comparison
of shear strengths results for different manufacturing pressures. As a matter of good
scientific practice, a significance level of 5% was chosen for a two-tailed test for two-
sample unequal variance.
2.2.3 Delamination testing
The test programme and procedure were in accordance with Annex C of prEN 16351:2013
[32]. Test pieces for the glue line delamination tests were placed in a pressure vessel and
submerged in water at a temperature of about 15 °C. Then a vacuum of about 80 kPa was
drawn and held for 30 min. Subsequently, the vacuum was released and pressure of about
550 kPa was applied for 2 h. Later, the test pieces were dried for a period of approximately
15 h in a circulating oven at a temperature of 70±5 °C. After removal from the oven, the
delaminated length for each of the two glue lines was measured around the perimeter of
the specimen. The lower of the wood fibres failure percentages from the two glue lines,
FFmin, and the sum of the two split areas, FFtot, were recorded.
3. Results
3.1 Shear tests
The shear strength 𝑓𝑓𝑣𝑣 was determined for every tested glue line and was calculated in
accordance with the following formula:
𝑓𝑓𝑣𝑣 = 𝐹𝐹𝑢𝑢𝐴𝐴
Equation (1) where:
𝐹𝐹𝑢𝑢 is the ultimate load (in N),
𝐴𝐴 is the sheared area (in mm2).
Figure 3 presents the mean (M), 5-percentile (5%) and standard deviations (SD) of shear
strengths for samples manufactured with different pressures and configurations, and for
solid wood (SW) specimens.
Difference between test methods led to large differences in results. The values for end-
grain loaded specimens on average at least 3 times higher than for other testing
configurations. The differences between edge bonded specimens loaded perpendicular to
grain and crosslam specimens were less pronounced. The 5-percentile shear strengths for
glue lines loaded at end-grain were very consistent for PUR adhesive type, and were
between 7.3 N/mm2 (manufactured with pressure of 0.4, 0.8, 1.0 N/mm2) and 7.6 N/mm2
(manufactured with pressure of 0.6 N/mm2). In addition, these results were in line with the
result for solid wood specimens, which was 7.4 N/mm2. For the equivalent specimens

bonded using the PRF adhesive system, the 5-percentile shear strength values varied more
and were between 6.4 N/mm2 for 0.4 N/mm2 and 8.4 N/mm2 for 1.0 N/mm2 manufacturing
pressure. Standard deviation values were around 0.52 N/mm2 for all edge bonded, end-
grain loaded specimens, 0.36 N/mm2 for perpendicular to grain loaded, 0.23 N/mm2 for
crosslam specimens, vertically placed, and 0.18 N/mm2 for crosslam specimens,
horizontally placed in shear block tool. A mean density of 427.12 kg/m3 with standard
deviation of 42.51 kg/m3 was obtained for all tested samples.
3.2 Delamination of glue lines
The total delamination Delamtot of each test piece was calculated using Equation (2):
𝐷𝐷𝐷𝐷𝐷𝐷𝐷𝐷𝐷𝐷𝑡𝑡𝑡𝑡𝑡𝑡 = 100 𝑙𝑙𝑡𝑡𝑡𝑡𝑡𝑡,𝑑𝑑𝑑𝑑𝑑𝑑𝑑𝑑𝑑𝑑𝑙𝑙𝑡𝑡𝑡𝑡𝑡𝑡,𝑔𝑔𝑑𝑑𝑢𝑢𝑑𝑑𝑑𝑑𝑔𝑔𝑔𝑔𝑑𝑑
[%] Equation (2)
where:
ltot,delam is the total delamination length (in mm),
ltot,glueline is the sum of the perimeters of all glue lines in a delamination specimen (in
mm).
The maximum delamination Delammax of a single glue line in each test piece was
calculated from following Equation (3):
𝐷𝐷𝐷𝐷𝐷𝐷𝐷𝐷𝐷𝐷𝑚𝑚𝑚𝑚𝑚𝑚 = 100 𝑙𝑙𝑑𝑑𝑑𝑑𝑚𝑚,𝑑𝑑𝑑𝑑𝑑𝑑𝑑𝑑𝑑𝑑𝑙𝑙𝑔𝑔𝑑𝑑𝑢𝑢𝑑𝑑𝑑𝑑𝑔𝑔𝑔𝑔𝑑𝑑
[%] Equation (3)
where:
lmax,delam is the maximum delamination length (in mm),
lglueline is the perimeter of one glue line in a delamination specimen (in mm).
The delamination requirement in prEN16351 [31] can be satisfied in one of two ways:
- Condition (1): Delamtot ≤ 10% and Delammax ≤ 40% for all samples
or
- Condition (2) : If condition (1) is not satisfied, the wood failure percentage for each split
glued area, FF, must be ≥ 50% and for the sum of the two split areas must be ≥70% .
In Figure 4, median values are presented of the following results for specimens
manufactured using different pressures: total and maximum delamination, and the lower
of the wood failure percentages from the two glue lines and the sum of the two split areas.
In addition, maximum values of Delamtot and Delammax, and minimum of FFmin and FFtot
of all specimens for different manufacturing pressures are presented.
Delamination condition (1) of prEN 16351 [32] was not satisfied in any of the specimens,
but Condition (2) was fulfilled for specimens manufactured using PUR adhesive with
0.8 N/mm2 pressure and PRF system with 1.0 N/mm2.
4. Discussion
4.1 Bonding strength
4.1.1 The effect of manufacturing pressure
The shear tests results give an indication that the lowest pressure of 0.4 N/mm2 applied
during manufacturing of the specimens is sufficient for Irish Sitka spruce in terms of the
prEN 16351:2013 [31] shear strength requirements for both adhesive systems despite the
manufacturers’ minimum requirement of 0.6 N/mm2. 5-percentile shear strength values for
different test configurations manufactured with different pressures and adhesive systems
PUR and PRF are compared in Figure 5.

The Student’s t-test statistical comparison for the specimens manufactured at different
pressures compared to a reference pressure of 1.0 N/mm2 is given in Table 3. From this
table, it can be seen that for PUR bonded specimens, the processing pressure does not result
in significantly different shear strength results except in the case of edge-bonded specimens
produced using a pressure of 0.4 N/mm2. For the case of PRF crosslam bonded specimens,
clamping pressure has no significant effect on shear strength performance (a minor
deviation was recorded for PRF H for 0.8 N/mm2). However, for edge-bonded specimens
loaded at the end-grain, there is a significant difference when comparing a clamping
pressure of 1.0 N/mm2 with all lower pressures. When compared to the shear strength of
solid wood specimens, PRF E specimens manufactured using a pressure of 1.0 N/mm2,
were slightly higher but not significantly different (Table 4). However, significant
differences were found for PRF P and PUR E & PUR P specimens, as shown in Table 4.
Furthermore, the recordings of wood failure percentages confirmed the observations by
Steiger et al. [14, 15] that for specimens loaded at the end-grain, the values for PUR type
adhesives are generally very high and exhibit a small variation. Figure 6 presents median
wood failure percentage values for different configurations of specimens manufactured
using PUR and PRF adhesives with different pressures.
Generally, the lower wood failure percentages were observed for specimens manufactured
with PRF than for corresponding specimens with PUR, which is in line with effect of PRF

on shear strength. The lower results for the pressure of 0.6 N/mm2 might be associated with
variability within timber.
4.1.2 The effect of adhesive type
Comparison of results between PUR and PRF systems for different clamping pressures and
testing configurations showed insignificant differences in corresponding samples. The
ratios of PUR to PRF 5-percentile shear strengths differ in most cases by less than 10%
(the exception is 22% for crosslam samples manufactured using 0.8 N/mm2 and loaded in
vertically), as presented in Table 5.
There is no general consistency in these results, however, the ratios for crosslam specimens
loaded horizontally are very close to 1.00, giving an indication that adhesive type has no
effect on structural bonding performance, which is confirmed by Student’s t-test. It is very
likely that slight differences in the ratios are determined by wood performance.
4.1.3 Effect of test configuration
For edge bonded specimens, the 5-percentile shear strength values of specimens loaded
through the end-grain are 3.5 times of those loaded perpendicular to grain, which is shown
in Figure 7.
The corresponding ratio for solid wood specimens loaded at the end-grain to those loaded
perpendicular to grain is 2.8. When values of specimens loaded through the end-grain are
compared to crosslam specimens ratios vary between 3 and 6, depending on manufacturing
pressure. It should be noted that the strength ratio for crosslam specimens loaded vertically

to those loaded horizontally varied between 0.64 and 1.00. It is likely that this is associated
with more tilting of the V-type specimens during testing, as these specimens were more
slender than the H specimens. Such a phenomenon was noticed by Steiger et al. [14, 15].
Therefore, it seems that these tests on crosslam bonded specimens placed in the shearing
tool horizontally most accurately reflects the shearing strength of glue lines in CLT. In
addition, the results for the H configuration were slightly more consistent than for the V
configuration, as shown by the standard deviation values.
4.2 Bonding pressure and adhesive type effect on durability
Although delamination results varied significantly between the test pieces, it is very likely
that the mechanism resulting in the delamination of glue lines was the same for all
specimens. In vast majority of cases, delamination occurred in a single glue line on one
side. Since the vacuum-pressure-soak cycle resulted in swelling, which was much higher
in the tangential and radial directions than the longitudinal direction for the timber, it
induced significant internal shear stresses between the bonded surfaces. Furthermore, since
the CLT layers were not edge bondeded, then small gaps are present between adjacent
boards in each layer. Delamination always occurred at the shortest edge board, as seen in
Figure 8 (c).
It seems that median values are the most realistic measure to assess the results of the
delamination tests, since the extreme results are excluded, which may otherwise skew the
overall result. Therefore, the median values of total and maximum delaminations, and total
and maximum wood fibre failures of split surfaces are shown in Figure 9. Although, there

are no noticeable differences between the total and maximum delimitation results for PUR
and PRF adhesive systems, it was observed that the highest manufacturing pressure of 1.0
N/mm2 provided the most durable bonds. This phenomenon was slightly more pronounced
for PUR.
On the other hand, the trends of wood fibre failure percentages, total and minimum, for
PUR and PRF adhesive systems vary considerably. High values for PRF, above 80% for
minimum wood fibre failure for all manufacturing pressures, indicate very good durability
performance of PRF glue lines. For PUR, minimum wood fibre failures were noticeably
low for panels assembled with pressures of 0.4 and 0.6 N//mm2, suggesting poor durability.
However, for specimens manufactured with higher pressures, values of wood fibre failures
were much higher, up to 100% (minimum & total), which pointed out the substantial effect
of bonding pressure on durability of specimens bonded using PUR adhesive. Such
phenomenon might be associated with deeper glue penetration from bonded surfaces inside
wood for specimens manufactured with higher pressure. For the lower manufacturing
pressures when adhesive penetration is shallower, the higher surface of adhesive is directly
exposed to water. Therefore, this effect of increased durability for higher bonding pressure
is much more pronounced for PUR than PRF, because PUR reacts with moisture and PUR
is more valuable to water action than PRF.
5. Conclusions
Based on the investigations presented in this study the following conclusions can be
formulated:

- Both adhesives, PUR and PRF, produced boards with shear strength values within
the requirements of prEN 16351 for all manufacturing pressures. The lowest
pressure of 0.4 N/mm2 applied during manufacturing of the specimens is sufficient
for Irish Sitka spruce in terms of the prEN 16351:2013 shear strength requirements
for edge bonding.
- While the PUR specimens had higher shear strength values than PRF bonded
specimens when the manufacturing pressure was up to 0.8 N/mm2, the durability
characteristics in the delamination tests were unsatisfactory for PUR specimens
manufactured with pressures below 0.8 N/mm2. The PRF specimens demonstrated
superior durability characteristics in the delamination tests, providing satisfactory
results for the pressure of 0.4 N/mm2 applied during manufacturing of the
specimens. Furthermore, it was established that the widths of the narrowest timber
elements in CLT test piece determine the depth of delamination.
- Annex D of prEN 16351:2013 specifies that loading of the parallel bonded
specimens should be applied through the end-grain for testing edge bonds, however,
there is lack of testing protocol, in this standard, for shear strength of surface bonds
in CLT panels. It seems that the test protocol introduced in this study for crosslam
bonded specimens, cut from CLT panel, and placed in the shearing tool
horizontally, accurately reflects to shearing strength of glue lines in CLT. Due to
the relative simplicity of this method, it may be considered as an indicator of shear
strength of bonds between the layers comprising CLT.
Acknowledgments

This work has been carried out as part of the project entitled ‘Innovation in Irish timber
Usage’ (project ref. 11/C/207) funded by the Department of Agriculture, Food and the
Marine of the Republic of Ireland under the FIRM/RSF/COFORD scheme.
References
[1] Jöbstl, R.A., Bogensperger, T., and Schickhofer, G., CIB-W18, St. Andrews, Canada,
p. 41-21-3 (2008).
[2] Brandner R., PhD Thesis, Institute of Timber Engineering and Wood Technology, Graz
University of Technology, p. 467 (2012).
[3] Brandner R., ECOST-MEETING-FP1004-210513-028873, ISBN 1 85790 181 9, p. 3-
36 (2013).
[4] Mestek, P., Kreuzinger, H., and Winter, S., WCTE 2008 - 10th World Conference on
Timber Engineering, Miyazaki, Japan (2008).
[5] Vessby, J., Enquist, B., Petersson, H., and Alsmarker, T., European Journal of Wood
Products, 67, p. 211-218 (2009).
[6] Fortune, A. L., and Quenneville, P., in S. Setunge (ed.) Incorporating sustainable
practise in mechanics and structures of materials, CRC Press (2010).
[7] Leonardo da Vinci Pilot Project., Educational Materials for Designing and Testing
Timber Structures – TEMTIS (2008).
[8] Crespell, P., and Gagnon, S., FPInnovations (2010).
[9] Rimetz, B., ProSales (2011).
[10] Yeh, B., Gagnon, S., Williamson, T., Pirvu, C., Lum, C., and Kretschmann, D., Wood
Design Focus, 22(2), p. 13-21 (2009).
[11] EN 302:2013, CEN (2013).
[12] EN 392:1995, CEN (1995).
[13] ASTM D 905 – 03, ASTM International (2013).
[14] Steiger, R., Gehri, E., and Richter K., Eur. J. Wood Prod. 68, p. 243–256 (2010).
[15] Steiger, R., and Gehri, E., ‘The Future of Quality Control for Wood & Wood Products’
The Final Conference of COST Action E53, Edinburgh (2010).
[16] Wernersson, H., Report TVSM 1006, Lund University, Division of Structural
Materials, Lund, Sweden (1994).
[17] Serrano, E. , Int J Adhes Adhes 24(1), p. 23–35 (2004).
[18] Custodio, J., Broughton, J., and Cruz, H., Int J Adhes Adhes 29, p. 173–185 (2009).
[19] Okkonen, A. E., and River, B. H., Forest Products J 39(1), p. 43-50 (1989).
[20] Sterley, M., Licentiate Thesis KTH – Royal Institute of Technology, Division of
Building Materials (2004).
[21] Davalos, J. F., Qiao, P. Z., and Trimble, B.S., J Comos Tech Res, 22(4), p. 224–231
(2000).
[22] Silva, L. F. M, and Adams, R. D., Int J of Adhes Adhes,27(3), p. 216–26 (2004).
[23] Silva, L. F. M, and Adams, R. D., Int J of Adhes and Adhes, 27(5), p. 362–79 (2007).
[24] Shiuh-Chuan, H., Composite Structures, 47, p. 673-678 (1999).
[25] Stoeckel, F., Konnerth, J., and Gindl-Altmutter, W., Int J Adhes Adhes 45, p. 32–41
(2013).
[26] Klausler, O., Clauß, S., Lubke, L., Trachsel, J., and Niemz, P., Int J Adhes Adhes 44,
p. 57–65 (2013).

[27] Vallée, T., Tannert, T., and Fecht, S., J Adhesion (DOI:
10.1080/00218464.2015.1071255) (2015).
[28] Raftery, G. M, Harte, A. M., and Rodd, P. D. Int J Adhes Adhes 29, p. 101–110 (2009).
[29] Raftery, G. M, Harte, A. M., and Rodd, P. D., Int J Adhes Adhes 29, p. 580–588
(2009).
[30] Lavisci, P., Berti, S., Pizzo, B., Triboulot, P., and Zanuttini, R., Holz Als Roh-Und
Werkstoff, 59, p.145–152 (2001).
[31] Grunwald, C., Fecht, S., Vallée, T., and Tannert, T., Int J Adhes Adhes 55, p. 12–17
(2014).
[32] prEN 16351:2013, CEN (2013).
[33] Gagnon, S., and Pirvu, C., Quebec, Special Publication SP-528E (2011).
[34] Karacabeyli, E., and Douglas, B., Pointe-Claire, Special Publications SP-529E,
(2013).
[35] Casilla, R. C., Pirvu, B. J. Wang, and Lum, C., FPInnovations. Vancuver, Canada
(2011).
[36] ANSI/APA PRG 320-2012, American National Standards Institute (2012).
[37] Brandner R. and Schickhofer G., Research Report, Institute of Timber Engineering
and Wood Technology, Graz University of Technology, Competence Centre holz.bau
forschungs gmbh, p. 76 (2012).
[38] EN 408:2010-07., CEN (2010).
[39] EN 391:2001-10., CEN (2010).
[40] Frihart, C. R., in: Rowell, R. M, (editor), Wood adhesion and adhesives, Boca Raton,
Florida: CRC press; p. 215–78 (2005).

[41] Frihart, C. R., J Adhes Sci Technol 23, p. 601–17 (2009).
[42] Dynea, Technical Data Sheet for Prefere 4050 and hardener Prefere 5750 (2004).

Table 1 Typical characteristics of adhesives for CLT manufacturing [34]
Item Adhesive PRF EPI PUR
Cured adhesive colour Dark Light Light
Component Liquid, two components
Liquid, two components
Liquid, single component
Solids content [%] 50 43 100 Wood moisture
content [%] 6 - 15 6 -15 > 8
Target application rate (single spread)
[g/m2] 375 – 400 275 – 325 100 - 180
Assembly time [min] 40 20 45
Pressing time [min] 420 – 540 60 120 Applied pressure
[N/mm2] 0.8 0.8 0.8 - 1.4
Cost [$/kg] 4.4 7.7 10.6

Table 2 Numbers of shear tests Bonding pressure
[N/mm2]
0.4 0.6 0.8 1.0 Solid wood (unglued)
(SW)
Adhesive type PU
R
PR
F
PU
R
PR
F
PU
R
PR
F
PU
R
PR
F
End-grain (E) 36 18 36 18 36 18 36 18 36
Perpendicular to grain (P) 36 18 36 18 60 18 36 18 36
Crosslam vertical (V) 16 34 16 32 17 30 16 22 -
Crosslam horizontal (H) 16 32 16 32 17 34 16 22 -

Table 3 Student’s t-test p-values for comparison of shear tests results for manufacturing pressure of 1.0 N/mm2 with lower manufacturing pressure for specimens produced with PUR and PRF adhesives in different configurations
Bonding pressure [N/mm2]
Adhesive type & test configuration
0.4 0.6 0.8
PUR E 0.0022 0.6956 0.6737 PRF E 0.0000 0.0000 0.0000 PUR P 0.0007 0.5111 0.0563 PRF P 0.2820 0.7588 0.0667 PUR V 0.1302 0.6126 0.1154 PRF V 0.9875 0.4426 0.9932 PUR H 0.0656 0.2599 0.3789 PRF H 0.6493 0.1923 0.0376
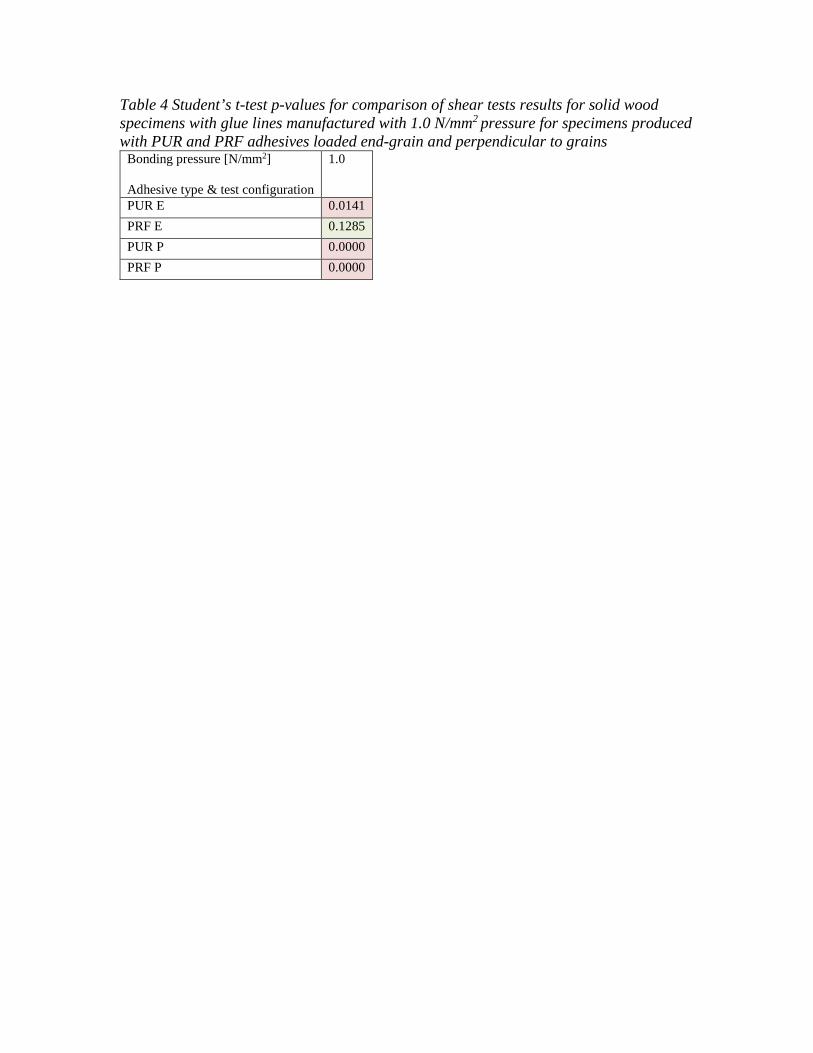
Table 4 Student’s t-test p-values for comparison of shear tests results for solid wood specimens with glue lines manufactured with 1.0 N/mm2 pressure for specimens produced with PUR and PRF adhesives loaded end-grain and perpendicular to grains
Bonding pressure [N/mm2]
Adhesive type & test configuration
1.0
PUR E 0.0141 PRF E 0.1285 PUR P 0.0000 PRF P 0.0000

Table 5 PUR to PRF ratio of 5-percentile shear strength values and Student’s t-test p-values (in brackets) for different manufacturing pressures and test configurations
Bonding pressure [N/mm2]
Test configuration
0.4 0.6 0.8 1.0
E 1.13 (0.0001) 1.07 (0.0000) 1.08 (0.0000) 0.87 (0.0354) P 0.92 (0.0532) 1.04 (0.2914) 1.01 (0.0345) 0.92 (0.0331) V 0.92 (0.6788) 0.92 (0.5347) 1.22 (0.7025) 1.13 (0.0695) H 0.98 (0.0383) 0.96 (0.8608) 0.98 (0.1364) 1.01 (0.0965)
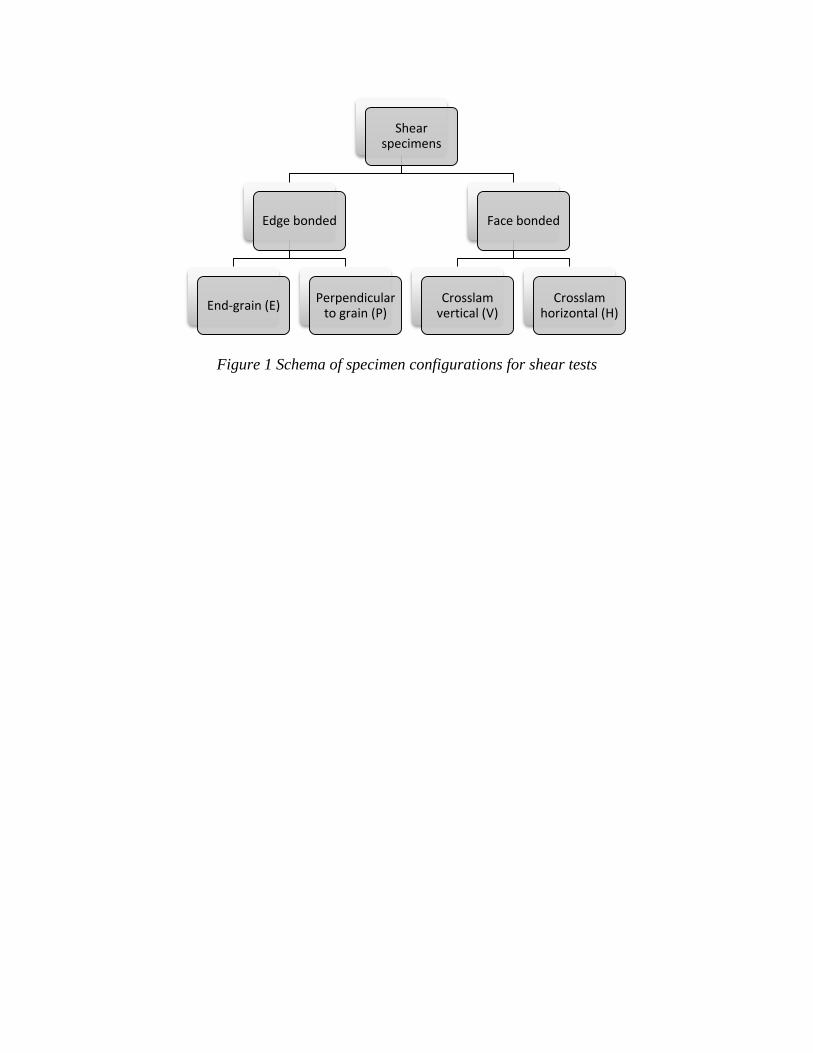
Figure 1 Schema of specimen configurations for shear tests
Shear specimens
Edge bonded
End-grain (E) Perpendicular to grain (P)
Face bonded
Crosslam vertical (V)
Crosslam horizontal (H)

(a) (b) (c) (d) Figure 2 Shear test specimens for: end-grain (a), perpendicular to grain (b) loading, and crosslam bonded elements vertically (c) and horizontally (d) loaded (dimensions in mm)
30
50
50
30
30
50
50
30
NTS

Figure 3 Shear strength values†
† Abbreviations on horizontal axis represent: number – manufacturing pressure in N/mm2, letter - specimen configuration (e.g. 0.4E - specimen manufactured using 0.4 N/mm2, loaded end-grain during shear test)
0
1
2
3
4
5
6
7
8
9
10
M 5% SD M 5% SD M 5% SD M 5% SD M 5% SD M 5% SD M 5% SD M 5% SD M 5% SD M 5% SD M 5% SD M 5% SD M 5% SD M 5% SD M 5% SD M 5% SD M 5% SD M 5% SD
0.4E 0.4P 0.4V 0.4H 0.6E 0.6P 0.6V 0.6H 0.8E 0.8P 0.8V 0.8H 1.0E 1.0P 1.0V 1.0H SWE SWP
Shea
r str
engt
h [N
/mm
2]PUR PRF

Figure 4 Delamination tests results‡
‡ D-mtot is the total delamination Delamtot, D-mmax is the maximum delamination Delammax
0%
10%
20%
30%
40%
50%
60%
70%
80%
90%
100%
Med
ian
Max
Med
ian
Max
Med
ian
Min
Med
ian
Min
Med
ian
Max
Med
ian
Max
Med
ian
Min
Med
ian
Min
Med
ian
Max
Med
ian
Max
Med
ian
Min
Med
ian
Min
Med
ian
Max
Med
ian
Max
Med
ian
Min
Med
ian
Min
D-mtot D-mmax FFmin FFtot D-mtot D-mmax FFmin FFtot D-mtot D-mmax FFmin FFtot D-mtot D-mmax FFmin FFtot
0.4 0.6 0.8 1
Del
amin
atio
n/W
ood
Fibr
e Fa
ilure
PUR PRF
Manufacturing pressure [N//mm2]:

Figure 5 5–percentile shear strength values for different test configurations
0
1
2
3
4
5
6
7
8
9
0.4 0.6 0.8 1.0 SW
Shea
r str
engt
h [N
/mm
2 ]
Manufacturing pressure [N/mm2]
PUR E PRF E PUR P PRF P
PUR V PRF V PUR H PRF H

Figure 6 Median wood failure percentage values for different configurations of specimens manufactured with different pressures
0%
10%
20%
30%
40%
50%
60%
70%
80%
90%
100%
110%
0.4 0.6 0.8 1.0
Woo
d fa
ilure
%
Manufacturing pressure [N/mm2]
PUR E PRF E PUR P PRF P
PUR V PRF V PUR H PRF H

Figure 7 Ratios of 5-percentile shear strength values for different manufacturing
pressures
0
1
2
3
4
5
6
0.4 0.6 0.8 1.0 SWManufacturing pressure [N//mm2]:

(a) (b) (c) Figure 8 Specimen for delamination test before (a)
and after vacuum-pressure cycle (b, c)
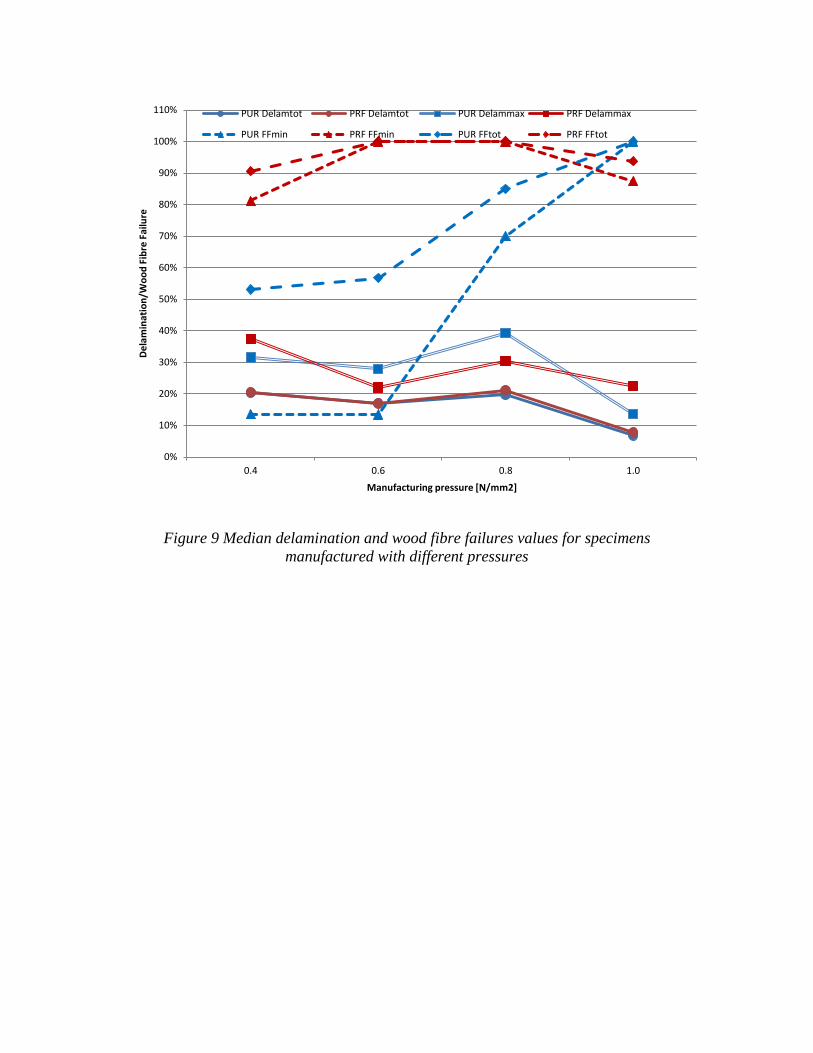
Figure 9 Median delamination and wood fibre failures values for specimens manufactured with different pressures
0%
10%
20%
30%
40%
50%
60%
70%
80%
90%
100%
110%
0.4 0.6 0.8 1.0
Dela
min
atio
n/W
ood
Fibr
e Fa
ilure
Manufacturing pressure [N/mm2]
PUR Delamtot PRF Delamtot PUR Delammax PRF Delammax
PUR FFmin PRF FFmin PUR FFtot PRF FFtot