Embed Size (px)
Citation preview
LETTERdoi:10.1038/nature10089
Sharply increased mass loss from glaciers and icecaps in the Canadian Arctic ArchipelagoAlex S. Gardner1,2, Geir Moholdt3,4, Bert Wouters5, Gabriel J. Wolken6, David O. Burgess7, Martin J. Sharp1, J. Graham Cogley8,Carsten Braun9 & Claude Labine10
Mountain glaciers and ice caps are contributing significantly to pre-sent rates of sea level rise and will continue to do so over the nextcentury and beyond1–5. The Canadian Arctic Archipelago, located offthe northwestern shore of Greenland, contains one-third of the glo-bal volume of land ice outside the ice sheets6, but its contribution tosea-level change remains largely unknown. Here we show that theCanadian Arctic Archipelago has recently lost 61 6 7 gigatonnes peryear (Gt yr21) of ice, contributing 0.17 6 0.02 mm yr21 to sea-levelrise. Our estimates are of regional mass changes for the ice capsand glaciers of the Canadian Arctic Archipelago referring to the years2004 to 2009 and are based on three independent approaches: surfacemass-budget modelling plus an estimate of ice discharge (SMB1D),repeat satellite laser altimetry (ICESat) and repeat satellite gra-vimetry (GRACE). All three approaches show consistent and largemass-loss estimates. Between the periods 2004–2006 and 2007–2009,the rate of mass loss sharply increased from 31 6 8 Gt yr21 to92 6 12 Gt yr21 in direct response to warmer summer temperatures,to which rates of ice loss are highly sensitive (64 6 14 Gt yr21 per 1 Kincrease). The duration of the study is too short to establish a long-term trend, but for 2007–2009, the increase in the rate of mass lossmakes the Canadian Arctic Archipelago the single largest contri-butor to eustatic sea-level rise outside Greenland and Antarctica.
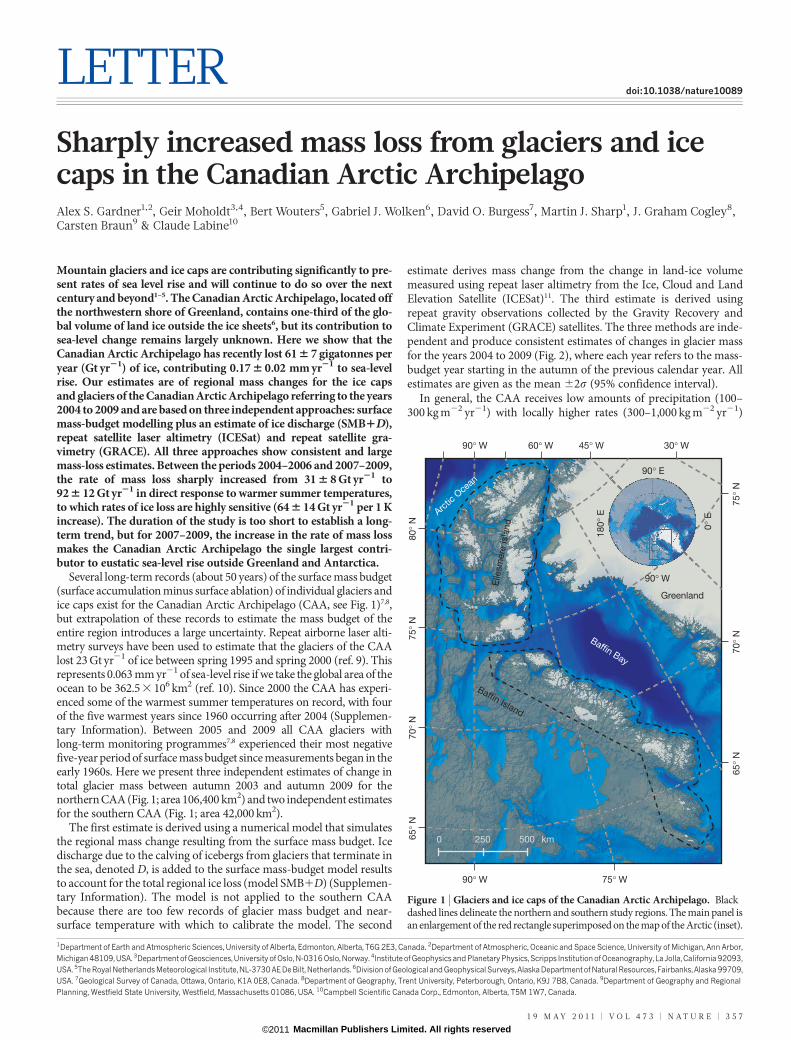
Several long-term records (about 50 years) of the surface mass budget(surface accumulation minus surface ablation) of individual glaciers andice caps exist for the Canadian Arctic Archipelago (CAA, see Fig. 1)7,8,but extrapolation of these records to estimate the mass budget of theentire region introduces a large uncertainty. Repeat airborne laser alti-metry surveys have been used to estimate that the glaciers of the CAAlost 23 Gt yr21 of ice between spring 1995 and spring 2000 (ref. 9). Thisrepresents 0.063 mm yr21 of sea-level rise if we take the global area of theocean to be 362.5 3 106 km2 (ref. 10). Since 2000 the CAA has experi-enced some of the warmest summer temperatures on record, with fourof the five warmest years since 1960 occurring after 2004 (Supplemen-tary Information). Between 2005 and 2009 all CAA glaciers withlong-term monitoring programmes7,8 experienced their most negativefive-year period of surface mass budget since measurements began in theearly 1960s. Here we present three independent estimates of change intotal glacier mass between autumn 2003 and autumn 2009 for thenorthern CAA (Fig. 1; area 106,400 km2) and two independent estimatesfor the southern CAA (Fig. 1; area 42,000 km2).
The first estimate is derived using a numerical model that simulatesthe regional mass change resulting from the surface mass budget. Icedischarge due to the calving of icebergs from glaciers that terminate inthe sea, denoted D, is added to the surface mass-budget model resultsto account for the total regional ice loss (model SMB1D) (Supplemen-tary Information). The model is not applied to the southern CAAbecause there are too few records of glacier mass budget and near-surface temperature with which to calibrate the model. The second
estimate derives mass change from the change in land-ice volumemeasured using repeat laser altimetry from the Ice, Cloud and LandElevation Satellite (ICESat)11. The third estimate is derived usingrepeat gravity observations collected by the Gravity Recovery andClimate Experiment (GRACE) satellites. The three methods are inde-pendent and produce consistent estimates of changes in glacier massfor the years 2004 to 2009 (Fig. 2), where each year refers to the mass-budget year starting in the autumn of the previous calendar year. Allestimates are given as the mean 62s (95% confidence interval).
In general, the CAA receives low amounts of precipitation (100–300 kg m22 yr21) with locally higher rates (300–1,000 kg m22 yr21)
1Department of Earth and Atmospheric Sciences, University of Alberta, Edmonton, Alberta, T6G 2E3, Canada. 2Department of Atmospheric, Oceanic and Space Science, University of Michigan, Ann Arbor,Michigan 48109, USA. 3Departmentof Geosciences, University of Oslo, N-0316 Oslo, Norway. 4Institute of Geophysics and Planetary Physics, Scripps Institution of Oceanography, La Jolla, California 92093,USA. 5The Royal Netherlands Meteorological Institute,NL-3730 AE De Bilt, Netherlands. 6Divisionof Geological and Geophysical Surveys, Alaska Departmentof NaturalResources, Fairbanks, Alaska 99709,USA. 7Geological Survey of Canada, Ottawa, Ontario, K1A 0E8, Canada. 8Department of Geography, Trent University, Peterborough, Ontario, K9J 7B8, Canada. 9Department of Geography and RegionalPlanning, Westfield State University, Westfield, Massachusetts 01086, USA. 10Campbell Scientific Canada Corp., Edmonton, Alberta, T5M 1W7, Canada.
30° W45° W60° W
75° W90° W
90° W
80° N
75° N
75° N
70° N
70° N
65° N
65° N
0 250 500 km
90° E
90° W
180°
E
0° E
Greenland
Baffin Island
Elle
smer
e Is
land
Arctic
Ocean
Baffin Bay
Figure 1 | Glaciers and ice caps of the Canadian Arctic Archipelago. Blackdashed lines delineate the northern and southern study regions. The main panel isan enlargement of the red rectangle superimposed on the map of the Arctic (inset).
1 9 M A Y 2 0 1 1 | V O L 4 7 3 | N A T U R E | 3 5 7
Macmillan Publishers Limited. All rights reserved©2011

concentrated on the east-facing slopes flanking Baffin Bay (Fig. 1).Surface air temperatures over ice masses in the region exceed thefreezing point during only two to three months of the year. Becausethere is generally low interannual variability in precipitation and highvariability in melt production, interannual variability in the regionalsurface mass budget is largely governed by changes in the summersurface energy budget7. These are strongly correlated with summersurface air temperatures12–14, which are, in turn, highly dependent onlocal synoptic conditions15,16. In this study we apply a surface mass-budget model that determines surface melt using the temperature-indexmethod17,18. The model is forced with downscaled19 and bias-correctedtemperature and precipitation fields from the National Centers forEnvironmental Prediction/National Center for Atmospheric Researchreanalysis (Supplementary Information). For the years 2004 to 2009 themodelled mass loss from the surface mass budget (SMB) plus ice dis-charge (D), where D 5 4.6 6 1.9 Gt yr21 (Supplementary Information),of the northern CAA was 34 6 13 Gt yr21 (Fig. 3). The average mass lossfrom the northern CAA was 7 6 18 Gt yr21 for the years 2004 to 2006,increasing to 61 6 18 Gt yr21 for the years 2007 to 2009 with a peak lossof 79 6 30 Gt yr21 in 2008. The difference between the two periods isprimarily due to a 42 Gt yr21 increase in melt production, whichresulted from regionally warmer summer air temperatures in the lowertroposphere. Warmer temperatures also contributed to a 7% decrease insnow fraction. A slight decrease in annual precipitation amount, andchanges in the amount of meltwater retained by the annual snowpack,contributed another 12 Gt yr21 to the increased mass loss.
For both the northern and southern CAA, we derived elevationchanges from ICESat’s Geoscience Laser Altimeter System (GLAS)for the period 2003–2009 (ref. 20). Elevation changes are estimatedrelative to rectangular planes that are fitted to 700-m-long segments ofnear-repeat-track data21. The planes represent a simplified surfacetopography such that multi-temporal elevation measurements thatare slightly offset in location can be compared. We then extrapolateelevation changes to volume changes and convert them to mass
changes using a plausible range of firn and ice densities (Supplemen-tary Information). For the years 2004 to 2009, ICESat results show thatthe northern CAA lost 37 6 7 Gt yr21 and that the southern CAA lost24 6 6 Gt yr21. ICESat results show increases in mass loss between2004–2006 and 2007–2009 of 39 Gt yr21 and 14 Gt yr21 for the northernand southern CAA, respectively. Recent observations in both Alaska22
and Greenland23 have found that marine-terminating glaciers arethinning more rapidly than land-terminating glaciers. To assesswhether the same phenomenon is occurring in the CAA, we separatelydetermined elevation changes for marine- and land-terminatingglacier basins (Supplementary Information). Our results show no dif-ference in the area-averaged rate of elevation change between the twobasin types, suggesting that total ice discharge from marine-termin-ating glaciers has not accelerated in recent years. This gives increasedconfidence in both the extrapolation of ICESat elevation changes andour estimate of ice discharge.
Cum
ulat
ive
mas
s ch
ange
(Gt)
a
b
2003 2004 2005 2006 2007 2008 2009
2003 2004 2005 2006 2007 2008 2009
–300
–200
–100
0
SMB+D
GRACE
ICESat
–200
–150
–100
–50
0
GRACE
ICESat
Year
Figure 2 | Cumulative change in glacier mass between autumn 2003 andautumn 2009. Separate estimates are provided for the northern (a) andsouthern (b) CAA. Error bars represent the 95% confidence interval.
–2,000 –1,500 –1,000 0 500–500
Mass budget (kg m–2 yr–1)
Figure 3 | Modelled surface mass budget of the northern CAA betweenautumn 2003 and autumn 2009. The model resolution of 0.5 km allows us toresolve the highly negative surface mass budgets of the outlet-glacier tongues.
RESEARCH LETTER
3 5 8 | N A T U R E | V O L 4 7 3 | 1 9 M A Y 2 0 1 1
Macmillan Publishers Limited. All rights reserved©2011
Lastly, we derived mass changes for both the northern and southernCAA from GRACE gravity measurements. Mass-change estimatesfrom GRACE agree very well with the other two data sets for thenorthern CAA, with an average mass loss between 2004 and 2009 of39 6 9 Gt yr21. The observations confirm the sharp increase in northernCAA mass loss between 2004–2006 and 2007–2009, with an increase inthe average mass loss of 60 Gt yr21. The southern CAA is estimated tohave lost ice at an average rate of 24 6 7 Gt yr21 over the six-year studyperiod, with a 16 Gt yr21 increase in the rate of loss between the firstthree and last three years, and is in very good agreement with ICESat.The most likely sources of the disagreement between the three methodsare: uncertainties in constraining the terrestrial water storage in theGRACE estimates, the identification of the appropriate end-of-season mass change in the GRACE signal, and fewer ICESat elevationretrievals in 2009 (Supplementary Information).
The error-weighted mean of all mass-change estimates gives a totalmass loss for the CAA of 368 6 41 Gt or 1.01 6 0.11 mm sea-level risefor the years 2004 to 2009. Most of the mass loss came from the northernCAA, which lost 224 6 30 Gt, with the remaining 144 6 28 Gt comingfrom the southern CAA (see Supplementary Figs 1–3 for a furthersubdivision of the mass losses within the northern and southernCAA). We estimate that the majority of the mass loss (about 92%) isdue to meltwater runoff, with a much smaller contribution comingfrom ice discharge from marine-terminating glaciers (about 8%).Three-quarters of all mass loss occurred in the last three years of theobservation period with an average loss of 92 6 12 Gt yr21, or0.25 6 0.03 mm yr–1 sea-level rise. This rate is four times greater thanthe estimated mass loss for CAA over the period 1995 to 2000 (ref. 9).
This increase in mass loss is in direct response to warmer surface airtemperatures in summer, to which the glaciers of the CAA have a highsensitivity. Over the six-year period of our study an additional64 6 14 Gt yr21 of ice was lost to the oceans for every 1 K rise in meansummer surface air temperature. Dividing by the total glacier area givesan area-averaged temperature sensitivity of 2430 6 90 kg m22 yr21 K21,which is two times larger than estimated from glacier surface mass-budget records2,24,25 and is close to sensitivities estimated from regionalclimatology2. The sensitivity to precipitation is much smaller; a 10%increase in precipitation would result in a mass gain of only about5 Gt yr21. Such a low sensitivity to precipitation is in contrast to gla-ciers located in wet maritime regions. For example a 10% increase inprecipitation over the Patagonia icefields, which have a combined icearea that is one-tenth the size of the CAA, would result in a 12 Gt yr21
gain of mass26.To put the mass losses occurring in the CAA into a global per-
spective, the Patagonia icefields lost ice at an average rate of28 6 11 Gt yr21 between April 2002 and December 2006 (ref. 27) withlittle change in the ice-loss trend for the years 2007 to 2009 (J. Chen,personal communication). The glaciers of the Gulf of Alaska lost massat an average rate of 88 6 15 Gt yr21 for the years 2004 to 2006, slow-ing to 70 6 11 Gt yr21 for the years 2007 to 2009 (update to ref. 28).The sharp increase in mass loss from the CAA and the slowdown inloss from the Gulf of Alaska makes the CAA the largest contributor toeustatic sea level rise outside Greenland and Antarctica for the years2007–2009. Because of the high sensitivity to temperature and lowsensitivity to precipitation, the CAA is expected to continue to beone of the largest contributing regions to eustatic sea level rise wellinto the next century and beyond5.
METHODS SUMMARYThe surface mass-budget model was run at a resolution of 500 m by 500 m for theperiod 1949 to 2009 (Supplementary Information). Model results are validatedagainst observations and agree well with in situ point surface mass-budget measure-ments (Supplementary Fig. 4: r 5 0.86, N 5 3,717, standard error 5 350 kg m22).For the four regions with well-established surface mass-budget measurement pro-grammes (Agassiz Ice Cap, north-western Devon Ice Cap, Meighen Ice Cap andWhite Glacier7,8) the model has a very low bias (218 kg m22 yr21) in the glacier-averaged surface mass budget (Supplementary Information). To be consistent with
the other data sets presented in this study, we discuss only mass changes modelledover the ICESat and GRACE operational period between autumn 2003 andautumn 2009.
To recover mass changes from the GRACE measurements we use forward model-ling of mass changes in predefined basins, minimizing the least-squares differencebetween GRACE observations and the forward model in an iterative method(Supplementary Information and refs 29 and 30). To avoid biases from surroundingareas (Supplementary Fig. 1) as a result of the limited spatial resolution and integralcharacter of the GRACE observations, mass changes are modelled for the GreenlandIce Sheet and other areas surrounding the CAA. GRACE measurements were madeavailable by the Center for Space Research (CSR version RL04) and were down-loaded from http://podaac.jpl.nasa.gov/DATA_CATALOG/graceinfo.html.
More details about the data and methods can be found in the SupplementaryInformation.
Received 23 November 2010; accepted 4 April 2011.
Published online 20 April 2011.
1. Meier, M. F. et al. Glaciers dominate eustatic sea-level rise in the 21st century.Science 317, 1064–1067 (2007).
2. Hock, R., de Woul, M., Radic, V. & Dyurgerov, M. Mountain glaciers and ice capsaround Antarctica make a large sea level rise contribution. Geophys. Res. Lett. 36,L07501 (2009).
3. Kaser, G., Cogley, J. G., Dyurgerov, M. B., Meier, M. F. & Ohmura, A. Mass balance ofglaciers and ice caps: consensus estimates for 1961–2004. Geophys. Res. Lett. 33,L19501 (2006).
4. Bahr, D. B., Dyurgerov, M. & Meier, M. F. Sea-level rise from glaciers and ice caps: alower bound. Geophys. Res. Lett. 36, L03501 (2009).
5. Radic, V.&Hock,R.Regionallydifferentiatedcontributionofmountainglaciersandice caps to future sea-level rise. Nature Geosci. 4, 91–94 (2011).
6. Radic, V.& Hock, R.Regional and global volumes ofglaciers derived fromstatisticalupscaling of glacier inventory data. J. Geophys. Res. 115, doi:10.1029/2009JF001373 (2010).
7. Koerner, R. M. Mass balance of glaciers in the Queen Elizabeth Islands, Nunavut,Canada. Ann. Glaciol. 42, 417–423 (2005).
8. Cogley, J. G., Adams, W.P., Ecclestone, M. A., Jung-Rothenhausler, F.& Ommanney,C.S. L.MassbalanceofWhiteGlacier, AxelHeiberg Island,NWT,Canada,1960–91.J. Glaciol. 42, 548–563 (1996).
9. Abdalati, W. et al. Elevation changes of ice caps in the Canadian Arctic Archipelago.J. Geophys. Res. 109, F04007 (2004).
10. Cogley, J. G. et al. Glossary of Glacier Mass Balance and Related Terms. IHP-VIITechnicalDocuments inHydrologyNo. 86 (IACSContribution No.2,UNESCO-IHP,in the press).
11. Zwally,H. J.et al. ICESat’s lasermeasurementsofpolar ice, atmosphere, ocean, andland. J. Geodyn. 34, 405–445 (2002).
12. Lotz, J. R.& Sagar, R.B.Northern Ellesmere Island: anArcticdesert.Geogr. Ann. 44,366–377 (1962).
13. Bradley,R.S.&England, J.Recent climatic fluctuationsof the CanadianHighArcticand their significance for glaciology. Arct. Alp. Res. 10, 715–731 (1978).
14. Hooke, R. L., Johnson, G. W., Brugger, K. A., Hanson, B. & Holdsworth, G. Changes inmass balance, velocity, and surface profile along a flow line on Barnes Ice Cap,1970–1984. Can. J. Earth Sci. 24, 1550–1561 (1987).
15. Gardner, A. S. & Sharp, M. Influence of the Arctic Circumpolar Vortex on the massbalance of Canadian High Arctic glaciers. J. Clim. 20, 4586–4598 (2007).
16. Taylor Alt, B.Developing synoptic analogs for extreme mass balance conditions onQueen Elizabeth Island ice caps. J. Clim. Appl. Meteorol. 26, 1605–1623 (1987).
17. Hock, R. Temperature index melt modelling in mountain areas. J. Hydrol. 282,104–115 (2003).
18. Braithwaite, R. J. Positive degree-day factors for ablation on the Greenland IceSheet studied by energy-balance modeling. J. Glaciol. 41, 153–160 (1995).
19. Gardner, A. S. et al. Near-surface temperature lapse rates over Arctic glaciers andtheir implications for temperature downscaling. J. Clim. 22, 4281–4298 (2009).
20. Zwally, H. J. et al. GLAS/ICESat L1B Global Elevation Data V031, 20 February 2003 to11 October 2009 (National Snow and Ice Data Center, 2010).
21. Moholdt, G., Nuth, C., Hagen, J.O. & Kohler, J. Recent elevation changesof Svalbardglaciers derived from ICESat laser altimetry. Remote Sens. Environ. 114,2756–2767 (2010).
22. Arendt, A. et al. Updated estimates of glacier volume changes in the westernChugach Mountains, Alaska, and a comparison of regional extrapolation methods.J. Geophys. Res. 111, F000436 (2006).
23. Sole, A., Payne, T., Bamber, J., Nienow, P. & Krabill, W. Testing hypotheses of thecause of peripheral thinning of the Greenland Ice Sheet: is land-terminating icethinning at anomalously high rates? Cryosphere 2, 205–218 (2008).
24. Oerlemans, J. et al. Estimating the contribution of Arctic glaciers to sea-levelchange in the next 100 years. Ann. Glaciol. 42, 230–236 (2005).
25. De Woul, M. & Hock, R. Static mass-balance sensitivity of Arctic glaciers and icecaps using a degree-day approach. Ann. Glaciol. 42, 217–224 (2005).
26. Rignot, E., Rivera, A. & Casassa, G. Contribution of the Patagonia icefields of SouthAmerica to sea level rise. Science 302, 434–437 (2003).
27. Chen, J. L., Wilson, C. R., Tapley, B. D., Blankenship, D. D. & Ivins, E. R. Patagoniaicefield melting observed by gravity recovery and climate experiment (GRACE).Geophys. Res. Lett. 34, L22501 (2007).
LETTER RESEARCH
1 9 M A Y 2 0 1 1 | V O L 4 7 3 | N A T U R E | 3 5 9
Macmillan Publishers Limited. All rights reserved©2011
28. Luthcke, S. B., Arendt, A. A., Rowlands, D. D., McCarthy, J. J. & Larsen, C. F. Recentglacier mass changes in the Gulf of Alaska region from GRACE mascon solutions.J. Glaciol. 54, 767–777 (2008).
29. Wouters, B., Chambers, D. & Schrama, E. J. O. GRACE observes small-scale massloss in Greenland. Geophys. Res. Lett. 35, L20501 (2008).
30. van den Broeke, M. et al. Partitioning recent Greenland mass loss. Science 326,984–986 (2009).
Supplementary Information is linked to the online version of the paper atwww.nature.com/nature.
Acknowledgements We thank A. Arendt for reviewing the manuscript andS. Luthcke and A. Arendt for providing the updated glacier mass anomalies forAlaska. We thank H. Blatter, W. Colgan, E. Dowdeswell, M. Huss, S. Marshall andD. Mueller for contributing observational data sets. We thank R. Riva and P. Stocchifor providing glacial isostatic adjustment models. This work was supported byfunding to A.S.G. from NSERC Canada and the Alberta Ingenuity Fund, funding to
G.M. by the European Union 7th Framework Program (grant number 226375)through the ice2sea programme (contribution number 017), and funding to M.J.S.from NSERC and CFCAS (through the Polar Climate Stability Network). The SMBmodelling was conducted using the infrastructure and resources of AICT of theUniversity of Alberta.
Author Contributions A.S.G. developed the study and wrote the paper. A.S.G, G.M. andB.W. all contributed equally to the analysis, using SMB1D, ICESat and GRACE,respectively. G.J.W. provided ice and basin outlines, model topography and created Fig.1. The remaining authors provided in situ measurements. All authors discussed andcommented on the manuscript at all stages.
Author Information Reprints and permissions information is available atwww.nature.com/reprints. The authors declare no competing financial interests.Readers are welcome to comment on the online version of this article atwww.nature.com/nature. Correspondence and requests for materials should beaddressed to A.S.G. ([email protected]).
RESEARCH LETTER
3 6 0 | N A T U R E | V O L 4 7 3 | 1 9 M A Y 2 0 1 1
Macmillan Publishers Limited. All rights reserved©2011