Embed Size (px)
Citation preview

FIRST STEP IN ANALYZING DISTRICT ENERGY OPPORTUNITIES
SHARPENING THE FOCUS & NARROWING THE FRAME

2014/04/29
WORKING WITH AUTHORITIES IN DISTRICT ENERGY
AGENDA
End slide
1. Setting the scene – TRENDS & SHAPING LIVABLE CITIES
2. The role of the City - ENERGY SUPPLY FRAMEWORK
3. Advertising Cities - Examples
4. The energy mapping process incl. GIS
5. Another City Example
6. Questions?

2014/04/29
WORKING WITH AUTHORITIES IN DISTRICT ENERGY
AGENDA
End slide
1. Setting the scene – TRENDS & SHAPING LIVABLE CITIES
2. The role of the City - ENERGY SUPPLY FRAMEWORK
3. Advertising Cities - Examples
4. The energy mapping process incl. GIS
5. Another City Example
6. Questions?

URBANISATION IS A MEGATREND

INCREASING ENERGY USAGE
Source: McKinsey, 2012 Source: International Energy Agency, 2012

INCREASING WASTE PROBLEMS
Source: McKinsey, 2012

Surplus biomass for CHP plant Surplus straw for CHP plant Offshore wind farm Large building Residential building Harbour, unloading of biomass Wastewater treatment and biogas plant Solar heating plant and heat storage Distant building w/solar PV Outskirt building w/ heat pump, solar PV and wind turbine CHP plant fuelled by gas, straw, wood, city waste + heat storage District heating/ cooling plant + cold water storage Industry with process energy and surplus heat
Electricity
District heating
District cooling
Gas
THE HIDDEN BACKBONE OF THE LIVEABLE CITY

2014/04/29
WORKING WITH AUTHORITIES IN DISTRICT ENERGY
AGENDA
End slide
1. Setting the scene – TRENDS & SHAPING LIVABLE CITIES
2. The role of the City - ENERGY SUPPLY FRAMEWORK
3. Advertising Cities - Examples
4. The energy mapping process incl. GIS
5. Another City Example
6. Questions?

HOW DISTRICT ENERGY ASSIST CITES AND ADD VALUE
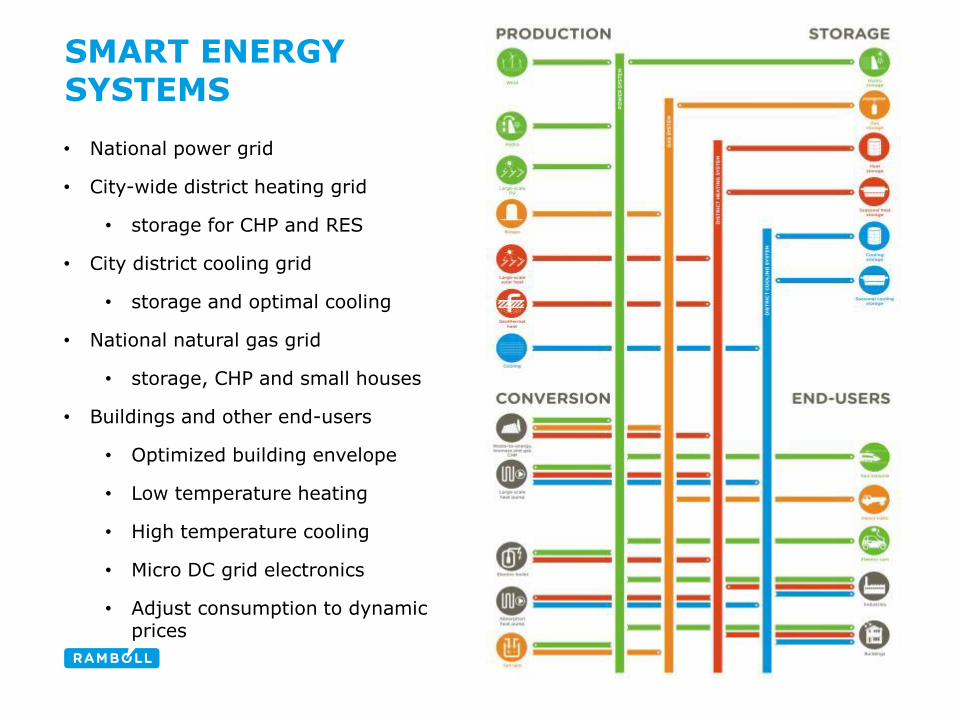
SMART ENERGY SYSTEMS
• National power grid
• City-wide district heating grid
• storage for CHP and RES
• City district cooling grid
• storage and optimal cooling
• National natural gas grid
• storage, CHP and small houses
• Buildings and other end-users
• Optimized building envelope
• Low temperature heating
• High temperature cooling
• Micro DC grid electronics
• Adjust consumption to dynamic prices
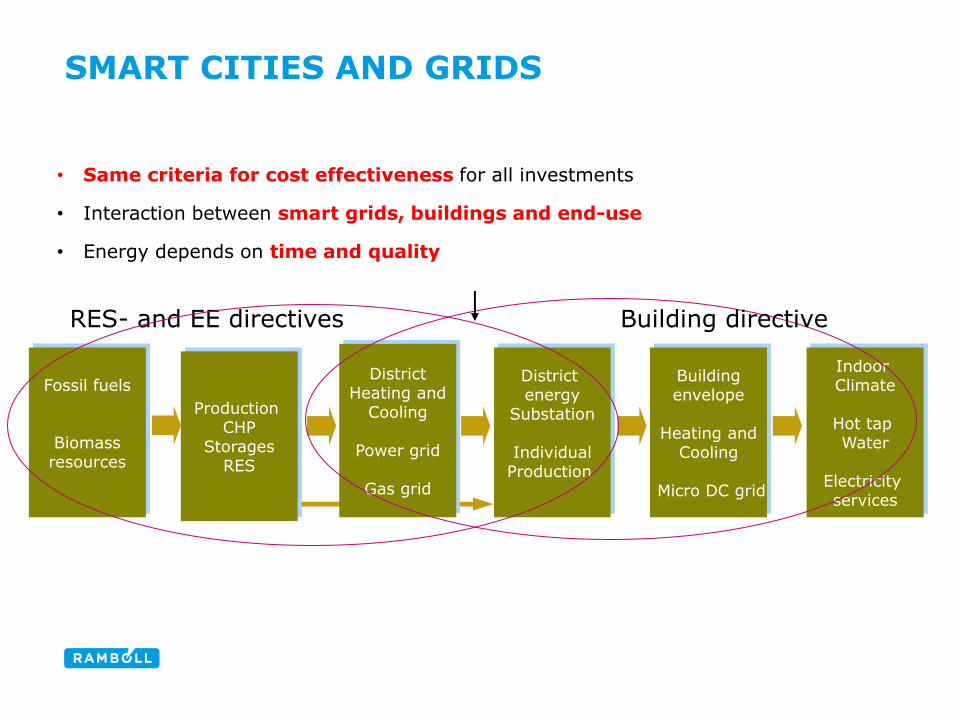
SMART CITIES AND GRIDS
• Same criteria for cost effectiveness for all investments
• Interaction between smart grids, buildings and end-use
• Energy depends on time and quality
Fossil fuels
Biomass resources
Production CHP
Storages RES
District Heating and
Cooling
Power grid
Gas grid
District energy
Substation
Individual Production
Building envelope
Heating and
Cooling
Micro DC grid
Indoor Climate
Hot tap Water
Electricity services
RES- and EE directives Building directive

2014/04/29
WORKING WITH AUTHORITIES IN DISTRICT ENERGY
PLANNING AND REGULATION NEEDED TO OVERCOME MARKET CHALLENGES

2014/04/29
WORKING WITH AUTHORITIES IN DISTRICT ENERGY
STICK ‘N’ CARROT - INCENTIVISE DESIRABLE ACTIONS

2014/04/29
WORKING WITH AUTHORITIES IN DISTRICT ENERGY
AGENDA
End slide
1. Setting the scene – TRENDS & SHAPING LIVABLE CITIES
2. The role of the City - ENERGY SUPPLY FRAMEWORK
3. Advertising Cities - Examples
4. The energy mapping process incl. GIS
5. Another City Example
6. Questions?

NORDHAVNEN
Challenge
Desire to cut carbon emissions
What was done
Proposed zero carbon target by 2025
Illustrated that it was possible and realistic
Effect
Copenhagen continues to introduce green solutions
COPENHAGEN CARBON NEUTRAL BY 2025 DENMARK

COPENHAGEN DISTRICT HEATING SYSTEM DENMARK
Challenge
Utilization of all available heat sources in the Copenhagen region in the most efficient way
What was done
Planning, collaboration, design, implementation, optimization
Effect
One of the largest city-wide district heating systems in the world
Supplies low-carbon heat to one million people

THE LONDON HEAT MAP
Challenge
Provide a basis for new district energy scheme planning.
Data gathering across all boroughs in the Greater London Area
What was done
Demand information was gathered across the GLA as heat mapping reports.
Data then collated into the heat map by a central body.
Effect
Provides a basis for masterplanning and feasibility work.
Platform for recording data regarding existing and planned energy networks
“The London Heat Map has helped in the successful development of district energy projects in the city and ensure that new developments to either connect to local heat networks or future-proof to connect to envisaged networks. The London Heat Map represents the first step in the DE development process that will contribute towards us achieving our goals of delivering 25 % of London's Energy Supply by 2025.” – Peter North, Senior Manager, Programme Delivery, GLA, 2016
http://www.londonheatmap.org.uk/Mapping/

Visualisation: Skidmore, Owings & Merril LLP/MIR.
Challenge
Vision to breathe new life into South Chicago
How to create a liveable and sustainable city for future generations
What was done
Prepared design concept for sustainable energy, water management and waste management
Fossil fuel reduction of 90%, CHP & District Energy
Effect
New way of living
Urban design strategy is key differentiator
Winner of Sustainia Community Award
CHICAGO LAKESIDE – THE FUTURE OF URBAN DESIGN CHICAGO, US

ENERGY MASTERPLAN FOR THE GREATER MANCHESTER AREA, UK
Challenge
New carbon and energy policy commitments
Need for efficient, cost-effective heat
What was done
Developed a district heating energy masterplan across ten authorities
Effect
Provides a basis for decisions about specific projects to be initiated

2014/04/29
WORKING WITH AUTHORITIES IN DISTRICT ENERGY
AGENDA
End slide
1. Setting the scene – TRENDS & SHAPING LIVABLE CITIES
2. The role of the City - ENERGY SUPPLY FRAMEWORK
3. Advertising Cities - Examples
4. The energy mapping process incl. GIS
5. Another City Example
6. Questions?

(DANISH) ENERGY STRUCTURE
POLICY National
EU
PLANNING
National: Energy supply
Regional: Energy supply
Local: Master Planning, Energy supply
PROJECTS
Regional: Waste handling, CHP production, Storage, Heat
Transmission
Local: Heat distribution network, Peak-load production
Strategy
Detail

Data Collection •Develop heat demand and supply map and database
Strategy •Identify opportunities, scenarios and networks
Technical design
•Energy Modelling, plant selection etc
Financial Assessment
•Whole Life Costing
Comparative Assessment of the Scenarios
•Selection Criteria and Ranking
Project Reporting
•Risks and Recommendations
METHODOLOGY FOR (DISTRICT) ENERGY PLANNING
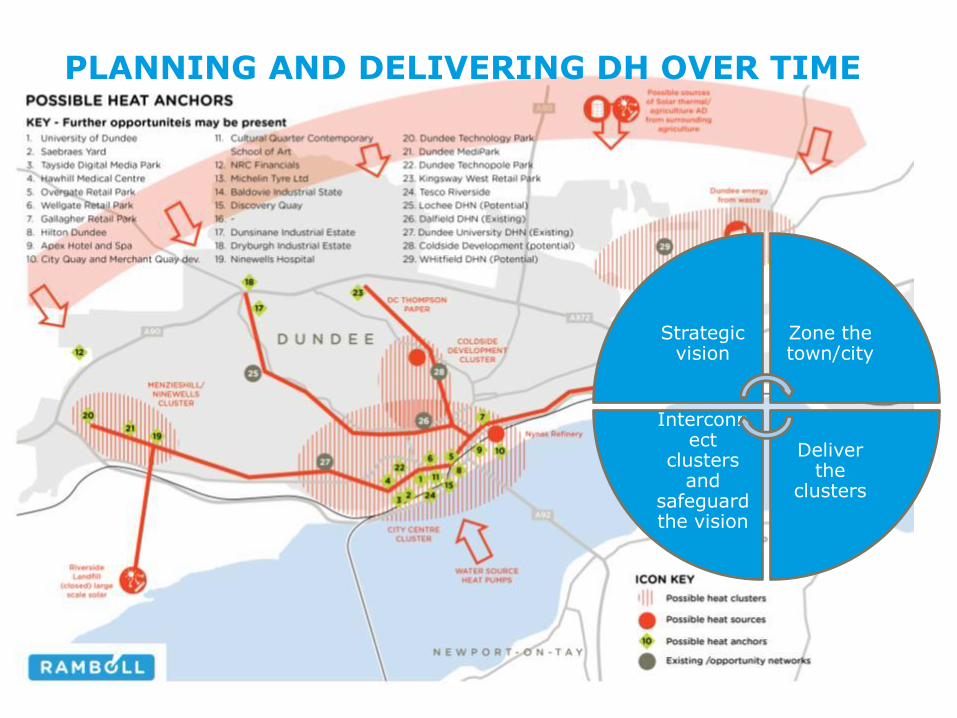
PLANNING AND DELIVERING DH OVER TIME
Content slide, with 3 images
Strategic vision
Zone the town/city
Deliver the
clusters
Interconnect
clusters and
safeguard the vision

GIS - ESTABLISHING A DATABASE

HEAT MAP USES
HEAT MAPPING
•Energy Demand
•Energy Resources
•Prevailing Fuel Sources
•Existing and Planned Networks
IDENTIFICATION OF OPPORTUNITIES
•Geographical proximity of resources/demand
•Fuel poverty
•Future Development
PROJECT PRIORITIES
•List of DH Network opportunities
•Hierarchy of potential projects

GIS – BUILDING BLOCKS
Filtering Filtering Analysis
Opportunity Identification
Supply
Planned Development Layers

GIS – PLANNING TO IMPLEMENTATION
INITIAL MAPPING DE PROJECT IDENTFICATION NETWORK ROUTING AND OPTIMIZATION NETWORK DESIGN CHANGES TO NETWORK THROUGH DESIGN PROCESS CONSTRUCTION DRAWINGS RECORD “AS BUILT” DRAWINGS OPERATION AND MAINTENANCE

WHAT TO BE AWARE OF – REDUCE RISK
28
Planning and future proofing Scale of scheme Heat density in the supplied area Rate of connection to the network Complexity of scheme

2014/04/29
WORKING WITH AUTHORITIES IN DISTRICT ENERGY
AGENDA
End slide
1. Setting the scene – TRENDS & SHAPING LIVABLE CITIES
2. The role of the City - ENERGY SUPPLY FRAMEWORK
3. Advertising Cities - Examples
4. The energy mapping process incl. GIS
5. Another City Example
6. Questions?

FORD SITE – ST PAUL

FORD SITE ENERGY STUDY

2014/04/29
WORKING WITH AUTHORITIES IN DISTRICT ENERGY
AGENDA
End slide
1. Setting the scene – TRENDS & SHAPING LIVABLE CITIES
2. The role of the City - ENERGY SUPPLY FRAMEWORK
3. Advertising Cities - Examples
4. The energy mapping process incl. GIS
5. Another City Example
6. Questions?

CONCLUDING REMARKS
District Energy is a key enabler for liveable cities
The public is instrumental in creating the pre-conditions for District Energy
We all need to be better in communicate-ting the benefits of District Energy

THANK YOU
Pernille M. Overbye
+1 289 834 4426 Mairead Kennedy
+1 226 979 1721 READ MORE ON OUR WEBSITE: WWW.RAMBOLL.COM/ENERGY


