Embed Size (px)
Citation preview

Sharing the Sun: Understanding Community Solar Deployment and Subscriptions
NREL WebinarMay 21, 2020
Jenny Heeter, NRELEric O’Shaughnessy, Clean Kilowatts, LLC Gabriel Chan, University of Minnesota

NREL | 2
Housekeeping
• The slides and a recording will be made available after the webinar– Posted to NREL’s community solar page:
https://www.nrel.gov/state-local-tribal/community-solar.html
• Audio issues?– Try switching from computer to phone audio– If problems persist, contact GoToWebinar technical support at (877) 582-7011.
• Have a question?– Please submit it using the ”Questions” panel in the GoToWebinar interface at
any time.– We will answer as many questions as possible at the end of the webinar.

NREL | 3
Contents
1. Purpose and Scope 2. Market Status 3. Impact of Market Conditions4. The Subscriber Value Proposition5. Looking Forward6. Q&A

1. Purpose and Scope

NREL | 5
Purpose
Community solar allows multiple customers or “subscribers” to purchase the output from a single solar photovoltaic array. Community solar could potentially extend access to solar to customers who could not adopt solar on their own, such as renters and low-income customers. Community solar is one of the fastest growing segments of the U.S. solar photovoltaic market.
This slide deck presents data and analysis from an initial round of data collection for a three-year project studying the U.S. community solar market. The data were collected through a research collaboration between the National Renewable Energy Laboratory, the University of Minnesota, and the Smart Electric Power Alliance. Partners gathered data from public filings, websites, state government websites, and industry collaborators.

NREL | 6
What is Community Solar?
Community solar, for the purposes of this research, refers to a product where the financial benefits of a single solar photovoltaic array are distributed among an exclusive group of customers that have chosen to subscribe to the program.
Financial benefits: All community solar products convey some part of the financial gains of electricity generation to subscribers. Community solar products may also but do not necessarily include non-financial benefits such as environmental benefits (e.g., renewable energy certificates).
Exclusive: All community solar programs are exclusive, meaning that they serve some exclusive set of subscribers within a utility or community choice aggregation service territory.
Chosen: Participation in community solar is always discretionary. Subscribers opt into the program, either through contractual payments or some non-financial transaction.
The Key Criteria

2. Market Status
This section summarizes data on community solar deployment over time, by state, and by project characteristics.

NREL | 8
The Community Solar Market in 2019
By the end of 2019, we estimate that there were at least 2,083 MW-AC of community solar capacity distributed across 1,195 projects in 39 states and Washington, D.C.
Community solar projects active as of end of 2019

NREL | 9
The Rapid Growth of Community Solar
• Cumulative community solar capacity has grown by about 130% year over year since 2010, in other words, capacity has more than doubled on average year over year.
• About 500 MW came online in 2019 alone.
Community solar capacity (MW) by year
Annu
alCu
mul
ativ
e fr
om p
rior y
ear

NREL | 10
More and Larger Projects
Community solar capacity has increased both because more projects have come online and because projects have generally become larger over time.
# of Projects by Year Distributions of Project Capacity by YearNote: Boxes represent the inter-quartile ranges (25%, median, and 75%). Bars represent the minimum and maximum excluding outliers.

NREL | 11
A Few Key States Lead the Community Solar Market
• About 88% of cumulative community solar capacity is located in the top 10 states.
• Massachusetts and Minnesota account for about half of cumulative capacity.
Cumulative community solar capacity (MW) by year

NREL | 12
Different States Have Taken the Lead on Community Solar Deployment
• Colorado was the early state leader, with significant capacity expansions from 2011 to 2015.
• Massachusetts and Minnesota expanded capacity significantly in 2016-2018.
• Florida, Georgia, and New York have emerged as key markets in recent years.
New community solar capacity (MW) by year and state

NREL | 13
Deployment by Utility Type
• Most capacity (79%) and projects (72%) are located in investor-owned utility (IOUs) service territories.
• Deployment of relatively small-scale projects has also been strong in electric cooperatives (Coops) and publicly owned utilities (POUs) and municipal utilities, with more than 320 coop and municipal utility projects deployed.

3. Impact of Market Conditions
This section discusses how market factors have shaped community solar deployment.

NREL | 15
Community Solar State Policies
• 20 states and Washington, DC have passed some form of legislation enabling community solar.
• These programs vary in scope, but they generally all allow for some form of virtual net metering so that subscribers can benefit from their community solar subscriptions.
State-level community solar enabling legislation

NREL | 16
Deployment by State
• About 71% of capacity and 81% of projects are located instates with enabling legislation, dominated by capacity and projects in Colorado, Massachusetts, and Minnesota.
• Legislation is not a prerequisite for a community solar market. There are about 601 MW in 222 projects located in 22 states without enabling legislation.

NREL | 17
Some States Impose System Size Caps
• 14 states with projects and Washington, D.C. set a maximum size for community solar projects.
• Some states have revised project caps over time.
• In Minnesota, projects were initially co-located up to a 5 MW total cap. Since early 2016, projects could not co-locate beyond the 1 MW cap. Project capacities compared to state program system size caps
* Based on 2 MW cap of the Adjustable Block Program. Low-income pilot projects can be larger than this cap.

NREL | 18
States with Program Caps Have Large Amounts of Remaining Capacity
• Programs in 11 states have limited the amount of community solar capacity that can be developed under the policies.
• In Massachusetts and New York, there are limits on how much community solar capacity is eligible for statewide solar incentives.
• Cumulative community solar capacity is not close to the program limit in any of these states.
Installed and remaining capacity in states with program size caps* Program size cap for financial incentives, includes installed capacity of all eligible solar projects

NREL | 19
More Research is Needed to Determine the Impact of Anchor Tenant Rules
• Anchor tenants are large customers that subscribe to a significant portion of a community solar array.
• Anchor tenants can provide more revenue certainty to community solar projects, potentially increasing the ability to finance projects.
• At the same time, anchor tenants can crowd out other smaller subscribers.
• Six states (CA, IL, MD, MN, NC, NY, OR) limit the amount of capacity that can be held by anchor tenants.
• Future research could examine the impact of these rules on project finance, deployment, and other variables.
Project size distributions in states with and without limits on anchor tenants
Note: Boxes represent the inter-quartile ranges (25%, median, and 75%). Bars represent the minimum and maximum excluding outliers.

4. The Subscriber Value Proposition
This section explores data on the community solar value proposition to subscribers.

NREL | 21
Net Present Value Calculation Methodology (1/2)
• Residential subscriber contract data are currently available for over 300 projects.
• For each available contract, we built a cash flow model to calculate the net present value (NPV) of the contract. We needed to make assumptions in order to determine the financial value of a subscription contract, including: – Annual solar facility degradation factor: low scenario 0.75%,
central scenario 0.5%, high scenario 0.30%– Annual utility rate escalation: low scenario 1.5%, central
scenario 2.5%, high scenario 3.5%– Discount rate: low scenario 8.4%, central scenario 6.4%, high
scenario 4.4%

NREL | 22
Assumptions used in NPV Calculation Methodology
• Additional assumptions included:– Standard contract assumptions: We used standard contract
term assumptions (see Appendix) where the contracts did not specify or were flexible within a wide range.
– Retail rates: We used retail rates from the Utility Rate Database and the Energy Information Administration.
– PV production: We calculated PV production using the System Advisor Model.
• This methodology is sensitive to future retail rate changes, solar production, and economic variables. We performed sensitivities around these factors, which are presented in the following slides.

NREL | 23
Residential Payment Terms are Diverse
• Up-front payments are the most common payment structure, offered in about 46% of projects, followed by monthly volumetric payments (22%).
• About 21% of projects offer a hybrid model (combining different up-front and monthly payments).
• About 15% of projects offer multiple payment structures, most commonly a combination of upfront and fixed monthly payments.
• About 8% of projects offered a fixed discount over the customer's electricity rate instead of a payment.
Distribution of Program Payment Methods

NREL | 24
More than 80% of Projects have a Positive Net Present Value (NPV) for Residential Subscribers
• To evaluate the community solar value proposition from the perspective of residential subscribers, we estimated the NPV under the various contracts offered by each project, where data were available. (See the Appendix for details on the NPV modeling assumptions.)
• The median project-level NPV is about +$0.37/W (sensitivity range: +$0.20/W to +$0.46/W) and about 83% (sensitivity range: 74 - 86%) of projects yield a positive NPV, meaning that most projects result in positive net benefits to the customers over the course of the subscription.
Distribution of Project-Level NPVs

NREL | 25
Average Project NPVs are Increasing Over Time
• Project-level NPVs for residential subscribers are changing over time.
• The average project level NPV became positive in 2016 and has continued to remain positive through 2018. Project-Level NPVs, 2012-2018
Note: Boxes represent the inter-quartile ranges (25%, median, and 75%). Bars represent the minimum and maximum excluding outliers.

NREL | 26
Project NPVs Vary by Utility Type and State
• Community solar value propositions may vary due to numerous factors, including local electricity rates, the local solar resource, and contract structures.
• In general, the data suggest that the value proposition is higher for projects located in IOU service territories and is generally higher in Massachusetts and Minnesota than in other states.
• Further analysis is required to understand any outliers in this dataset as well as additional geographic trends.
Distribution of Mean Project-Level NPVs by utility and state, outliers omitted
Note: Boxes represent the inter-quartile ranges (25%, median, and 75%). Bars represent the minimum and maximum excluding outliers. The width indicates the number of projects represented (also indicated by the n = X note).

5. Looking Forward
This section discusses planned projects in key markets that will shape the future of community solar deployment and ways that participants can engage with NREL and DOE on community solar activities.

NREL | 28
Community Solar Capacity in Queue
Operational data come from the NREL/UMN Sharing the Sun Data List. CO: Colorado planned solar capacity only includes projects under Xcel SRC 2018 RFP; IL: Planned capacities include the adjustable block program and solar for all sub-program; MA: Planned capacities include SREC II (converted to AC) and SMART program; MN: Planned capacities only includes projects under Xcel program; NY*: Data are as of Q1 2020, not 2019, planned capacities are converted to AC output. The solid blue represents the cumulative rated AC power output (MW) for community solar in operation by corresponding year in corresponding state. The semi-transparent blue represent capacity in queue.
• As of 2019, five States (CO, IL, MA, MN, and NY) have the most community solar capacity in queue. Over 2,000 MWac in queue
• In addition, Florida has approved the largest 1.5 GW community solar program in March 2020.
Community Solar Capacity – Key States (2019)
Solar DC output capacity has been converted to AC rated output based on 1.3 DC/AC ratio

NREL | 29
Future Community Solar Data Collection
• Is your project missing?• Do you have a large pipeline of projects we should know
about?• Are you willing to share contract information? An NDA is
possible.• Please contact Jenny Heeter to find out how you can
participate in our project:[email protected] or 303-275-4366

National Community Solar Partnership (“NCSP”)
The National Community Solar Partnership is a coalition of community solar stakeholders working to expand access to affordable community solar to every American household by 2025.
20

Community Platform https://ncsp.mobilize.io/
Capabilities Social networking Ideation / Crowdsourcing Partner directory

www.nrel.gov
Thank you
This work was authored in part by the National Renewable Energy Laboratory, operated by Alliance for Sustainable Energy, LLC, for the U.S. Department of Energy (DOE) under Contract No. DE-AC36-08GO28308. Funding provided by the U.S. Department of Energy Office of Energy Efficiency and Renewable Energy Solar Energy Technologies Office. The views expressed in the article do not necessarily represent the views of the DOE or the U.S. Government. The U.S. Government retains and the publisher, by accepting the article for publication, acknowledges that the U.S. Government retains a nonexclusive, paid-up, irrevocable, worldwide license to publish or reproduce the published form of this work, or allow others to do so, for U.S. Government purposes.
NREL/PR-6A20-76853

Appendix
Additional Data and Details on Assumptions

NREL | 34
Subscriber Value Calculations (1/2)
• Additional assumptions and considerations include: – Multiple contract options: For projects that offered multiple contract options,
when conducting analysis weighted by capacity, we used the average value of all contracts offered for that project.
– Hedge value: We also do not quantify any hedge value that community solar subscriptions can provide (i.e. the value of reduced net electricity payment volatility). Instead, we quantify the expected values of subscription contracts and perform sensitivity analysis around key variables (solar degradation factors, retail rate escalation factors, and discount rates).
– Retail rates: Retail rates were collected from the Utility Rate Database (URDB) and the Energy Information Administration, when rates were not available in the URDB.
– Solar production: PV production was calculated using the System Advisor Model using the location of the project or nearest possible location. For projects above 1 MW we assumed 1-axis tracking and for those below 1 MW we assumed fixed tilt.

NREL | 35
Minnesota’s Market is the Largest; Has Significant Capacity in Queue
• Minnesota leads community solar deployment in the U.S., and ranked 1st
in terms of cumulative installed community solar capacity by 2019 Over 660 MWac in operation
• Most community solar in Minnesota is operating in Xcel’s territory 656 MWac in operation 249 MWac in queue
Community Solar Capacity in Minnesota (MWac)
Data Source: 2015-2019: NREL/UMN Sharing the Sun Project Lists; 2019 Planned: Xcel 2019 Annual Report, DOCKET No. 13-867. The planned status includes in construction, in study analysis and in application stage. The solid blue represents the cumulative rated AC power output (MW) for community solar in operation by corresponding year in MN. The semi-transparent blue represent capacity in queue

NREL | 36
Massachusetts in Transition to SMART Program
• By 2019, over 400 MWac of community solar projects were operational 655 MWac planned (623 MWac for
Community Shared projects, 32 MWac for Low Income projects) under the SMART program
• Y/Y growth from 2017 to 2018 slowed down as the state is transitioning from the RPS Solar Carve-Out II program to the Solar Massachusetts Renewable Target (SMART) Program.
Community Solar Capacity Installed in Massachusetts (MWac)
Data Source: 2015-2019: NREL/UMN Sharing the Sun Project Lists; 2019 Planned: MA RPS Solar Carve-Out II Renewable Generation Units; Solar Massachusetts Renewable Target (SMART) Application Update 2019 (O/P): Operational and Planned by 2019 August. The planned status includes approval/pending/under-construction. The solid colors represent the cumulative AC output (MW) for community solar in operation by corresponding year in MA. The semi-transparent colors represent the AC output (MW) of planned community solar projects.
Solar Carve-Out II DC output capacity has been converted to AC rated output based on 1.3 DC/AC ratio

NREL | 37
Pairing Community Solar with Storage in Massachusetts
• SMART program at a glance: There are two community solar components:
o 1) community shared and 2) low income community shared
There is an added incentive for projects paired with battery storage
• 655 MWac community shared projects are planned under SMART 345 MW with battery storage (99 projects)
SMART Community Solar in Massachusetts (MWac)
Data Source: Solar Massachusetts Renewable Target (SMART) Application Update

NREL | 38
New York has Little Community Solar to Date, but a Large Pipeline
• By 2019, 185 MWac of community solar projects were operational. The New York State Energy
Research and Development Authority (NYSERDA) has an ambitious community solar plan.
• The community solar pipeline in New York is above 1000 MWac.
Community Solar Capacity Installed in New York (MWac)
Data Source: 2016-2020: NREL/UMN Sharing the Sun Project List; 2020 Planned: New York Solar Electric Programs Reported by NYSERDAThe planned status includes approved, pending approved, received and submittedThe solid blue represents the cumulative nameplate capacity (MWac) for community solar in operation by September 2019 in NY. The semi-transparent blue represent the nameplate capacity (MWac) of planned community solar projects.
Solar DC output capacity has been converted to AC rated output based on 1.3 DC/AC ratio

NREL | 39
Colorado Market Grows but Installs are Capped
• By 2019, over 92 MWac of community solar projects in operation with more than 60 MWac planned*
• Xcel’ Solar*Reward Community program enables solar gardens ranging in size from 10.1 kW to 2 MW
Community Solar Capacity Installed in Colorado (MWac)
Data Source: 2013-2019 NREL/UMN Sharing the Sun Project List; For Planned data, planned projects are as of 2018 RFP 2019 (O/P): Operational and Planned by 2019. The planned status includes approval/pending/under-construction. The solid blue represents the cumulative nameplate capacity (MWac) for community solar in operation by corresponding year in CO. The semi-transparent blue represent the nameplate capacity (MWac) of planned community solar projects.
Solar DC output capacity has been converted to AC rated output based on 1.3 DC/AC ratio
* The Planned capacity may less than actual planned data because the data were gathered from 2018 RFP, 2019 RFP was not included

NREL | 40
More than 1,500 MW of Community Solar Waitlisted in Illinois’ Adjustable Block Program
• By 2019, there was less than 3 MW of community solar in operation in Illinois.
• The lottery for projects to receive an incentive via the Illinois Power Agency’s Adjustable Block Program resulted in more than 200 MW of community solar.
• An additional ~1,500 MW of community solar was not selected in the lottery process.
Adjustable Block Program Community Solar Capacity Installed in Illinois (MWac)
Data Source: For community solar projects in operation: NREL/UMN Sharing the Sun Project List; for planned community solar: Illinois Power Agency Adjustable Block Program Lottery ResultsThe planned status in this figure represents community solar projects accepted through the lotteryThe solid blue represents the cumulative nameplate capacity (MWac) for solar gardens in operation by 2019 in IL. The semi-transparent blue represent the nameplate capacity (MWac) of planned solar gardens.
Group A and B are divided based on utility territories<3
NREL | 41
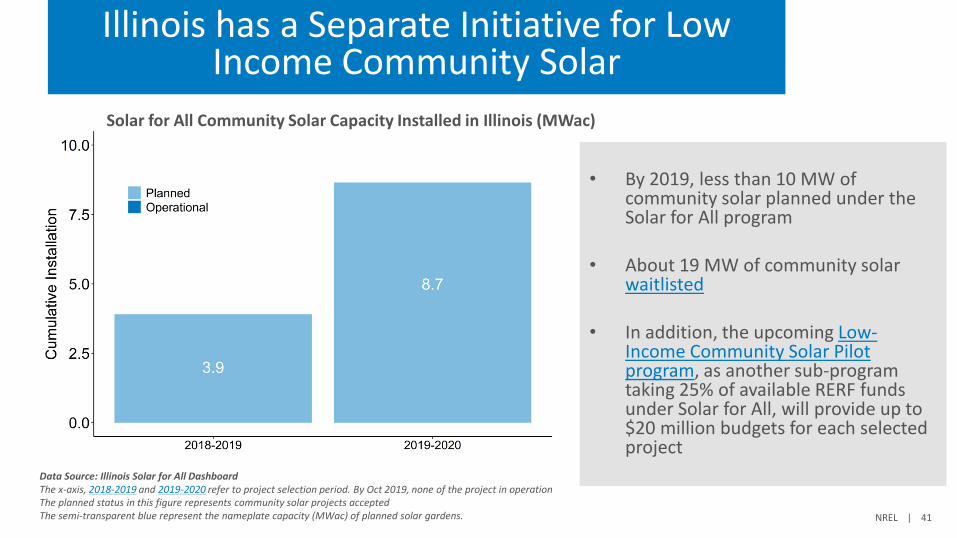
Illinois has a Separate Initiative for Low Income Community Solar
• By 2019, less than 10 MW of community solar planned under the Solar for All program
• About 19 MW of community solar waitlisted
• In addition, the upcoming Low-Income Community Solar Pilot program, as another sub-program taking 25% of available RERF funds under Solar for All, will provide up to $20 million budgets for each selected project
Solar for All Community Solar Capacity Installed in Illinois (MWac)
Data Source: Illinois Solar for All DashboardThe x-axis, 2018-2019 and 2019-2020 refer to project selection period. By Oct 2019, none of the project in operationThe planned status in this figure represents community solar projects acceptedThe semi-transparent blue represent the nameplate capacity (MWac) of planned solar gardens.

NREL | 42
Community Solar Updates –California
• Senate Bill (SB) 43 enacted the Green Tariff Shared Renewables (GTSR) Program in CA. This program has a capped enrollment of 600 MW solar power statewide
• The GTSR program has two components: 1) the Green Tariff and 2) Enhanced Community Renewables. By the end of 2018, less than 5 MW of enhance community renewable has been procured by utilities and the customers enrollment capacity is still zero.
GTSR Capacity Cap and Procured by Utilities, by 2018
Data Source: PG&E,SCE and SDG&E GTSR Monthly Program Progress Report
GT ECR GT ECR GT ECR GT ECRTotal by Program 152.75 4.06 52.75 1.66 60 0 40 2.4Allocation 600 272 269 59
GTSR Procured Solar Capacity Data 2018
Category Total PG&E SCE SDGE

NREL | 43
How are “Queues” Defined
State Queue DefinitionCO Project capacity awarded under the Solar*Reward Community (SRC) program, and
marked as “Not Operation” in the RFP Bidder List.Xcel also updated another SRC queue spread sheet monthly. The SRC queue is specific to SRC projects and accurate as of the last updated date. In this slide, we use the first definition.
IL IL Adjustable Block Program Queue: Lottery results status marked as “Accepted” but not in operationIL Solar for All Program Queue: Project marked as “Selected” but not in operation
MA SREC carve out II: Project marked as “Qualified & Not Operation”SMART: Qualified Units but not operation
MN SRC Program Queue: Project marked as “Active Applications”NY NY Community Solar Queue: Project status marked as “Pipeline”