Embed Size (px)
DESCRIPTION
Shares Investment Malaysia Edition Issue 26
Citation preview

4
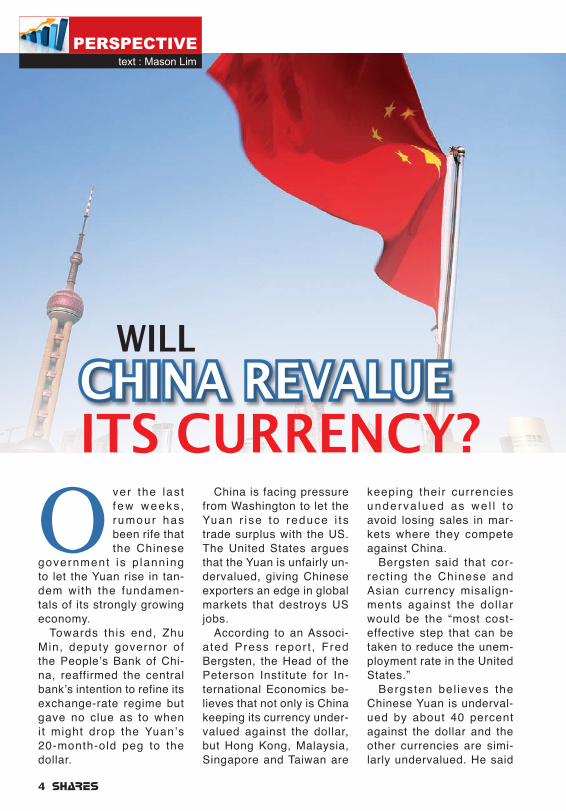
China is facing pressure from Washington to let the Yuan r i se to reduce i t s trade surplus with the US. The United States argues that the Yuan is unfairly un-dervalued, giving Chinese exporters an edge in global markets that destroys US jobs.
According to an Associ-ated Press repor t , Fred Bergsten, the Head of the Peterson Institute for In-ternational Economics be-lieves that not only is China keeping its currency under-valued against the dollar, but Hong Kong, Malaysia, Singapore and Taiwan are
keeping their currencies underva lued as we l l t o avoid losing sales in mar-kets where they compete against China.
Bergsten said that cor-rect ing the Chinese and Asian currency misalign-ments against the dollar would be the “most cost-effective step that can be taken to reduce the unem-ployment rate in the United States.”
Bergsten bel ieves the Chinese Yuan is underval-ued by about 40 percent against the dollar and the other currencies are simi-larly undervalued. He said
O ver the last f ew weeks , rumour has been rife that the Chinese
government is p lann ing to let the Yuan rise in tan-dem with the fundamen-tals of its strongly growing economy.
Towards this end, Zhu Min, deputy governor of the People’s Bank of Chi-na, reaffirmed the central bank’s intention to refine its exchange-rate regime but gave no clue as to when i t might drop the Yuan’s 20-month-old peg to the dollar.
PersPectivetext : Mason Lim
ITS CURRENCY?
WILLCHINA REVALUE CHINA REVALUE
MSHE_4_5_Perspective(ML).indd 4 4/1/10 5:08:14 PM
5
allowing those currencies to r ise aga ins t the do l -la r to the proper leve ls would trim America’s trade deficit by US$100 bil l ion to US$150 billion annually. Last year’s current account deficit totalled US$419.9 billion.
Undervalued, But Revision Likely
If recent statements by Zhu Min were taken into consideration, China might be looking at lett ing the Yuan rise just enough to prevent its economy from over heat ing and let t ing some room for manoeuvr-ing with the US on its own deficit issue with China.
“China should and could import more and keep the surplus small. I think this is good for China and this is good for the world,” said Zhu recently.
S o f a r t h i s y e a r, t h e People’s Bank Of China (PBOC) has twice raised the proportion of deposits that banks must hold in
The United States argues that the Yuan is unfairly undervalued, giving Chinese exporters an edge in global markets...
reserve instead of lending out. The central bank has also drained large volumes of cash from the banking system through open mar-ket operations. But, unlike the central banks of Aus-tralia, Malaysia, Vietnam and India, the PBOC has not changed its benchmark interest rates.
“When we cope with in-f lat ion expectat ions, we are very careful. We want to make sure we main-tain stability, liquidity and growth. We are very care-ful with interest rates. This is a heavy-duty weapon,” Zhu said.
This development has irked some polit icians in the US, who are not im-pressed and have labelled China with other “economic crimes”. Niall Ferguson, a professor of business ad-ministration at the Harvard Business School, said that the administration should brand China a currency manipulator. But he said the impact o f the U.S. -
China trade deficit would not be that significant be-cause Ch ina has many o the r advan tages such as low labour costs that contribute to its huge trade surp lus wi th the Uni ted States.
However, US Treasury Secretary Timothy Geith-ner recently reinstated his be l ie f that China would soon allow its currency to start rising again against the dollar. China allowed the Yuan to apprec ia te by about 20 percent from mid-2005 to mid-2008 but hal ted the r ise after the global economic crisis be-gan to cut deeply into its exports.
“ W e h a v e e n o r m o u s stakes in a strong China,” he said. “And they have enormous stakes in hav-ing access to our markets, being able to sel l goods here.”
While some analysts be-lieve China is getting ready to allow its currency to rise in part to stem growing in-flationary pressures inside the country, various Chi-nese leaders have taken a tough line on the issue. Only time and the Chinese government can te l l on their next plan of action. A rise would favour South East As ian nat ions that re ly on labour intensive businesses, but might hurt those that are planning to invest or already investing in China.
Mason Lim is a Consultant Fi-nancial Analyst.
MSHE_4_5_Perspective(ML).indd 5 4/1/10 5:08:24 PM

6
Corporate Digest
text : Michael Tee
THE PROPERTY COMPANY TO WATCH
SP SETIA –SP SETIA –
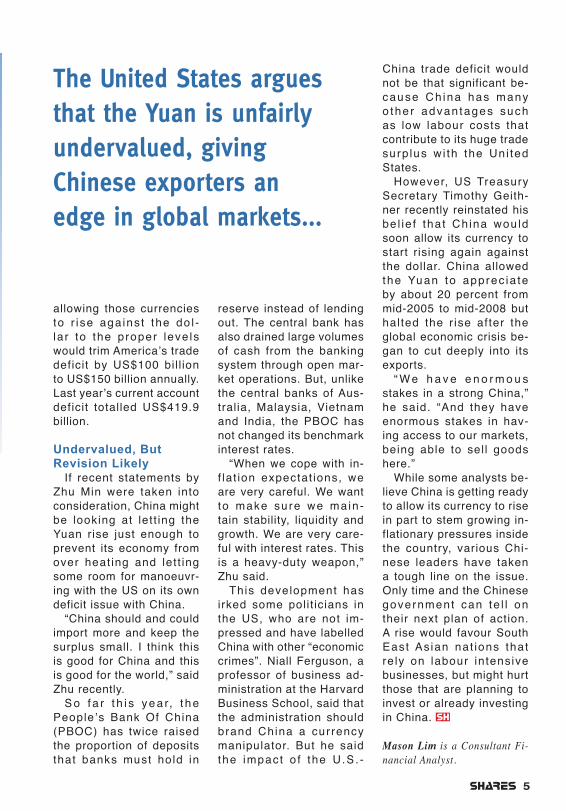
An artist's impression of Camino at Setia Eco Park
crisis period.Their strategic product
mix ensured the continuity of sales momentum with Setia Alam, Setia Eco Park, and Setia Sky Residences being the top performers. The 3 projects' combined sales value was RM441 mil-lion or 55.4% of total sales achieved in FY09.
Good Performance Expected
Analysts are confident that revenues will pick up in 2010 for this company. In 1Q10, its
revenue increased by 22.5% Y-O-Y to RM363.9 million. Improvement in revenue was mainly derived from its property developments namely Setia Alam and Se-tia Eco-Park at Shah Alam, Setia Walk at Pusat Bandar Puchong, Setia Sky Resi-dences at Jalan Tun Razak, Bukit Indah, Setia Indah, Setia Tropika and Setia Eco Gardens in Johor Bahru and Setia Pearl Island in Pen-ang. Historically, SP Setia registered weaker numbers in the 1st half of financial
F o r a p r o p e r t y c o m p a n y, S P Set ia achieved c o m m e n d a b l e sales in 2009 and
followed through its perfor-mance into 2010. As at 31 January 2010, total sales value was RM608 million from 9 projects which was 38.5% of total sales value at-tained in FY09. As compari-son, they achieved histori-cal sales value of RM1,650 million in FY09, lifted by its 5/95 promotional campaign during the global financial
MSHE_6_7_CD.indd 6 4/1/10 5:08:45 PM
7
year. Analysts expect rev-enue to kick in swiftly for the next 3 quarters underpinned by unbilled sales estimated at RM1.5 billion as at end of February.
A l t h o u g h S P S e t i a achieved record sales, vari-ous incentives offered to buyers during the 5/95 pro-motional period had eroded its profit as pre-tax margin dropped by 8.7% in 1Q10. Moving forward, analysts reckon sales chalked up after the launching of their current promotional package i.e. ‘Best of the best’ will not erode its margin as transfer pricing strategy appears to be adopted by SP Setia.
Penang Project Terminated
SP Setia’s unit Setia Prom-enade SB (Promenade) had terminated a 50:50 JV with PPH Resorts (Penang) Sdn Bhd due to among other reasons, failure of common purpose of the joint venture. To recap, in 2006 Prom-enade has entered into an agreement to develop a par-cel of freehold land located adjacent to SP Setia’s Setia Pearl Island project. The development i.e. ‘Setia View’ comprises of bungalow units with total GDV of RM300 million. SP Setia has since filed a writ of summons and statement of claim against its joint venture partner PPH Resorts (Penang) Sdn Bhd to recover RM12.2 million of advances and RM1.7 million development project expen-diture incurred.
Nonetheless, PPH has filed
a counter-action for the re-covery of the sum of RM5.72 million and damages alleged to have been suffered. We believe impact from the ter-mination is minimal as in the event SP Setia failed in counter suiting against PPH, it will suffer about RM13.9 million write off from its bal-ance sheet. No impact to our earnings forecast as we expect future revenue con-tribution from Setia View to kick in upon FY2012. We had excluded Setia View from our RNAV estimation thus our estimation had been reduced to RM4.70 from RM4.72 per share.
New Projects In The Offing
On the KL Eco City project, the privatization agreement is expected to be obtained in August 2010 as DBKL is their partner on profi t sharing basis. The RM6 bil-lion ‘green’ mixed develop-ment project is scheduled for launching in October 2010. Located opposite Mid Valley Megamall, it will be developed over 10 years in 3 phases. The 1st phase launched at the end of this year will possibly consist of office, commercial and retail spaces. The second phase would be condominiums and signature offices in the third phase. The development would be complementing the existing Mid Valley shopping complex and would not in-clude a new retail mall. The infrastructure in the area would be improved with the development of a Sky Bridge
linking KL Eco City to Mid Valley Megamall, creating an indirect linkage from the Abdullah Hukum LRT station and the Mid Valley KTM sta-tion, to the project.
On the International front, it received the Investment Certificate for its Lai Thieu land (26.8ac) @ Binh Duong Province, Vietnam project. Lai Thieu Land is the second JV development with strate-gic partner Becamex IDX in Vietnam. SP is having a 90% stake in Lai Thieu. The piece of land is located approxi-mately 16 kilometres north of Hoh Chi Minh City. The project is drafted for a mixed development worth GDV (gross development value) USD250 million which com-prises of about 1700 units of properties; Launching is expected in 2H10, pending master plan approvals.
Valuations SP Setia’s unbilled sales
were estimated at RM1.5 billion at end of February 2010, which will underpin their earnings for FY10. Growth prospect hinges on the contribution from new markets i.e. Reflection Con-dominium, Sky residences phase 2, KL Eco City as well as the RM1 billion ‘Aeropad, Sabah’ in FY10. Most ana-lysts re-iterate the stock as OUTPERFORM with the tar-get price of RM4.60 pegged by EPS of 19.8sen and PER of 23X. The fair value is at 2.2% discount to the RNAV per share of RM4.70, with Setia View excluded from the RNAV estimation.
MSHE_6_7_CD.indd 7 4/1/10 5:09:07 PM
8
compiled : Sherman KumarHeadliners
Kota Kinabalu and beaches which would appeal to foreign buyer. The group also plans to acquire at least 405ha in prime areas in Selangor and Johor Baru, which include prime locations in Selangor. Judging from Mah Sing's impressive sales of RM516mn for the first 3 months, analysts believe they are well on track to sales target of RM1bn. Analysts interviewed by Business Times reiterate an OUTPERFORM with target price of RM2.40 pegged by for-ward EPS of 23.7sen and PER of 10X which is 9% discount to revised RNAV estimation of RM2.56.
Car Sales On The Rise In February
The Malaysian Automotive Association (MAA) announced that 40,600 vehicles were sold in Feb-10 (+8.7% Y-O-Y) vs. 50,600 units in Jan-10 (+33% Y-O-Y). This is a 20% month-on-month decline due to shorter work days in the fes-tive Chinese New Year period. For Y-T-D Feb-10, auto sales came was at 91,300 units, up 21% Y-O-Y from a low base in 1Q09 (during the global finan-cial crisis).
Coinciding with the view by the Malaysian Automotive As-sociation (MAA), HwangDBS Vickers Research (HDBSVR) expects Mar-10 sales to re-bound M-O-M from a low-base Feb-10. Also, on an annualized basis, this implies a total sale of 550,000 units. Hence, they retain their view of a 2.4% increase in 2010 auto sales (to 550,000 units). HDBSVR
maintains its BUY call on Proton with a price target of RM4.60, which is based on 0.5x CY10F NTA.
Telekom Malaysia To Provide IPTV Services
Telekom Malaysia (TM) signed agreements with 20 content providers yesterday, to supply IPTV content as part of its plan to offer triple play ser-vices on its HSBB (high speed broadband – launched on 24 March 2010) network. These include BBC Knowledge, BBC Lifestyle, CBeebies, Chan-nel News Asia, Star Chinese Movies 2, Star Chinese Chan-nel, Channel [V] Taiwan, and Euronews. TM also partners with Hit Entertainment, CBS, Disney-ABC and Sony Pic-tures Television to offer IPTV viewers the latest movies and TV series through video-on-de-mand (VOD). HDBSVR views this development positively as this would help to enhance the value proposition of its HSBB Internet service.
Where TM’s content is simi-lar to Astro are in the local FTA (free-to-air) channels, which in-clude RTM 1, RTM 2, Bernama TV, TV3, NTV7, 8TV and TV9. HDBSVR retains its view that TM’s HSBB can be a threat to Astro because some consum-ers have been unhappy with Astro’s content, and they may welcome a viable alternative. HDBSVR reiterates a BUY call on TM. This latest news could lend support to TM’s share price. The stock offers 6% net dividend yield, which HDBSVR thinks is sustainable.
PLUS Eyes New Concessions In Asia Pacific
PLUS Expressways Bhd, the country’s largest toll high-way operator, is eyeing more highway concessions in the Asia Pacific region as part of its expansion plans. Its man-aging director Noorizah Abd Hamid said the company is in talks with several countries in the region to build new high-ways or upgrade and maintain existing facilities. Noorizah cited Vietnam as a country with great potential due to its burgeoning population and surging economic growth. As for its newly-revised Key Per-formance Index (KPI), she said it is a new target to achieve since it has already met its previous KPI target. The con-sensus target price attained by Business Times is RM4.01.
Mah Sing Plans To Build Homes In Sabah For MM2H Buyers
Mah Sing is currently sitting in a net cash position, after acquisition of 2 pieces of land early this year for total cash consideration of RM67.2mn. Sitt ing on a cash pile of RM396.62mn as at 31st Dec 2009, they are in a comfort-able position to acquire land in Sabah to build residential homes and villas for foreign buyers interested in Malaysia My Second Home program (MM2H).
Analysts reckon Mah Sing would focus on niche medium to high end residential de-velopment on prime area in
MSHE_8_Headliner.indd 8 4/1/10 5:09:54 PM
14
I t seemed that the mar-ket interpreted the recent rate hike as an indication of more optimistic economic recovery ahead. This was not surprising given Malay-sia’s strong turnaround in its economy in 4Q09.
4Q09 Economic Growth Stronger Than Expected
Malaysia economy moved out of recession in 4Q 2009 by posting a better than expected y-o-y growth of 4.5%, bringing GDP growth of -1.7% y-o-y in 2009. This
was much higher than mar-ket consensus of -2.4% y-o-y. Most economic sec-tors showed positive growth except for mining sector. The better performance was mainly bolstered by manu-facturing and services sec-tors which rose 5.3% y-o-y and 5.1% y-o-y respectively as manufactur ing sector benefited from improving external and domestic de-mand while services sector was alleviated by strong ex-pansion in Finance & Insur-ance sectors and Wholesale & Retail Trade sectors.
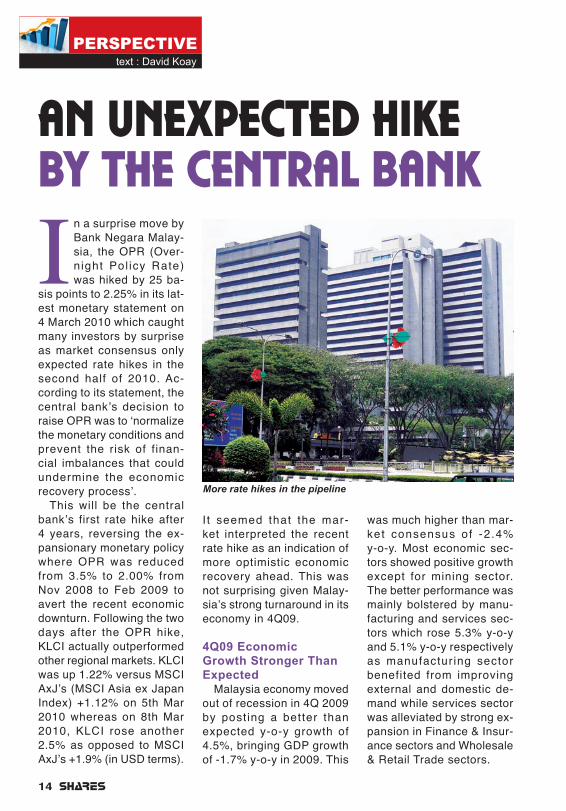
I n a surprise move by Bank Negara Malay-sia, the OPR (Over-night Pol icy Rate) was hiked by 25 ba-
sis points to 2.25% in its lat-est monetary statement on 4 March 2010 which caught many investors by surprise as market consensus only expected rate hikes in the second half of 2010. Ac-cording to its statement, the central bank’s decision to raise OPR was to ‘normalize the monetary conditions and prevent the risk of finan-cial imbalances that could undermine the economic recovery process’.
This will be the central bank’s first rate hike after 4 years, reversing the ex-pansionary monetary policy where OPR was reduced from 3.5% to 2.00% from Nov 2008 to Feb 2009 to avert the recent economic downturn. Following the two days after the OPR hike, KLCI actually outperformed other regional markets. KLCI was up 1.22% versus MSCI AxJ’s (MSCI Asia ex Japan Index) +1.12% on 5th Mar 2010 whereas on 8th Mar 2010, KLCI rose another 2.5% as opposed to MSCI AxJ’s +1.9% (in USD terms).
PersPectivetext : David Koay
AN UNEXPECTED HIKE BY THE CENTRAL BANK
More rate hikes in the pipeline
MSHE_14_15_Perspective(DK).indd 14 4/1/10 5:12:37 PM
15
Meanwhile, construction activities showed significant improvement of +9.2% y-o-y. On the demand side, we saw continuous expansion in pub-lic and private expenditure which increased 1.3% and 1.7% respectively while gross fixed capital formation turn-around to a positive 8.2% y-o-y backed by fiscal stimulus measures after 4 consecutive quarters of decline.
Going forward, we believe the recovery momentum is expected to mainta in over the next few months, backed by strong rebound in exports and industrial production followed by an-ticipated uptick in private expenditure. Based on MI-ER’s (Malaysia Institute of Economic Research) sur-vey, BCI (Business Condi-tions Index) and CSI (Con-sumer Sentiments Index) continued to show improve-ment which was above the 100-point threshold for the third consecutive quarter, indicating recovery in pri-vate expenditure ahead.
A Possible Mild Dent To Loan Growth
There are concerns that interest rate hike will ham-per loan growth as higher borrowing costs could ren-der business activities or investments less attractive and drag down consumer credit. To recap, during the previous rate hike by 80 basis points from 2.7% to 3.5% during the period be-tween Nov 05 and May 06, loan growth actually moder-ated from 9% in Nov 05 to
6% in Oct 06. Nonetheless, we opine that the rate hike impact on loan growth will not be pronounced should there be a total of 50-75 basis point increase in OPR for the entire 2010, as OPR remains considerably low at 2.75% (if OPR rises an-other 50 basis points) as compared to the height of 3.5% in 2006-08. Further-more, strong recovery in loans as evidenced by loan approvals which rose by 41.5% y-o-y in Jan 2010 will also help cushion any drag to loan growth. Thus, loan growth for 2010 is expected to remain healthy at histori-cal average of 7-8% y-o-y.
RM To Rise Against US$
With BNM expected to hike rates in the months to come coupled with US Fed possibly retaining in-terest rates at low levels for an extended period of t ime, RM is expected to appreciate against USD owing to the increasing interest rate differential be-tween Malaysia and US. This is further backed by Malaysian Government’s efforts to consolidate its fiscal position via cuts in operat ing expendi tures, easing of subsidies and sale of government assets coupled with implementa-tion of reform policies aimed at boosting FDIs (Foreign Direct Investments). The appreciation of RM will also bode well for the local capi-tal markets in anticipation of higher foreign funds inflow.
Exports Might Be Dented Temporarily
Having said that, the ap-preciation of RM against other Asian currencies might hurt exports as Malaysia is the first country to raise interest rates in Asia. None-theless, this would be tem-porary as Asian economies are expected to catch up with Malaysia in interest rate hikes later this year.
Malaysia Equity Market Outlook Remains Optimistic
The recent rate hike is a sign of firmer economic re-covery ahead, which bodes well for the equity market. The central bank’s decision to hike rates also demon-strated its commitment to en-sure a sustainable economic recovery by controlling infla-tion expectations in the midst of firmer commodity prices, easing subsidies on price-controlled items and firmer domestic demand. Risks of asset bubble will remain a distant possibility as inflation remains benign.
With more rate hikes in the pipeline, we are not too concerned over the negative impacts to the economy and equity market. The reason being the rate hikes are ex-pected to be gradual while OPR which could reach 2.75% by 2010 remains accommodative as it is still considerably lower than the peak of 3.5% in 2006-2008.
David Koay is an analyst at Fund-supermart.com.
MSHE_14_15_Perspective(DK).indd 15 4/1/10 5:12:47 PM

aaaaaaaaaaaaaaaaaaaaaaaaaaaaaaaaaaaaaaaaaaaaaa
MARKET CAPITALISATION
26 Close in RM, Vol (volume) in ‘00
2 wks Last Mkt CapPage Company...........................Vol Close (‘000)
2 wks Last Mkt CapPage Company...........................Vol Close (‘000)
160 Malayan Banking .......................... 831,226 7.49 RM53,011,696201 Sime Darby.................................... 443,776 8.75 RM52,582,25074 CIMB Group Hldgs ........................ 694,607 14.58 RM51,493,148
191 Public Bank.................................... 341,465 11.80 RM41,676,727162 Maxis ............................................. 449,751 5.32 RM39,900,000
157 MISC ................................................ 68,086 8.44 RM37,674,421120 IOI Corp....................................... 1,075,116 5.48 RM36,514,610213 Tenaga Nasional ........................... 408,544 8.10 RM35,129,70065 Axiata Group ................................. 825,126 3.86 RM32,598,294
104 Genting .......................................... 479,296 6.62 RM24,526,107
181 PPB Group ....................................... 56,821 18.26 RM21,647,230262 Petronas Gas ................................... 74,533 9.90 RM19,589,447139 Kuala Lumpur Kepong.................. 159,558 16.80 RM17,934,08486 Digi.Com .......................................... 22,670 22.70 RM17,649,250
180 PLUS Expressways ....................... 365,043 3.39 RM16,950,000
104 Genting M’sia ................................ 390,089 2.85 RM16,828,65255 AMMB Hldgs ................................. 432,564 5.03 RM14,676,962
226 YTL Corp .......................................... 51,780 7.49 RM14,227,644116 Hong Leong Bank............................ 75,008 8.70 RM13,746,93199 Fraser & Neave Hldgs ..................... 17,409 10.60 RM13,707,326
227 YTL Power Int’l.............................. 454,366 2.19 RM12,943,513257 British American Tobacco ................. 9,598 44.50 RM12,706,085213 Telekom M’sia ............................... 500,803 3.48 RM12,331,380194 RHB Capital.................................... 203,521 5.68 RM12,231,738117 Hong Leong Financial Group........... 37,407 8.58 RM9,032,749
187 Petronas Dagangan ........................ 32,286 9.08 RM9,020,56265 Astro All Asia Networks PLC ....... 310,522 4.27 RM8,199,083
261 Nestlé ................................................ 1,025 34.62 RM8,118,390145 Latexx Partners ............................. 233,247 4.00 RM7,904,240158 MMC Corp........................................ 69,312 2.45 RM7,460,397
154 M’sian Airline System ................... 546,736 2.18 RM7,285,569219 UMW Hldgs ..................................... 88,605 6.31 RM7,063,225143 Lafarge Malayan Cement ................ 78,759 6.44 RM6,872,762119 IJM Corp ........................................ 406,101 4.95 RM6,493,153183 Parkson Hldgs ............................... 120,250 5.96 RM6,177,004
68 Berjaya Sports Toto...................... 237,327 4.46 RM6,025,594103 Gamuda ......................................... 611,200 2.88 RM5,786,660218 UEM Land Hldgs ........................... 986,814 1.54 RM5,609,087263 Tanjong PLC .................................... 29,648 18.82 RM5,499,467152 M’sia Airports Hldgs ..................... 131,960 4.95 RM5,445,000
67 Berjaya Corp............................... 1,211,074 1.69 RM5,375,151105 Genting Plantations...................... 117,347 6.91 RM5,237,40789 EON Capital ..................................... 75,057 7.13 RM4,942,580
256 Batu Kawan ..................................... 11,790 10.80 RM4,708,271256 Berjaya Land...................................... 3,627 4.02 RM4,603,595
61 Alliance Financial Group................ 181,611 2.89 RM4,474,02658 Affin Hldgs ....................................... 97,410 2.95 RM4,408,394
217 Top Glove Corp ............................... 85,187 14.00 RM4,252,612197 SP Setia.......................................... 141,648 4.16 RM4,229,91072 Bursa M’sia ...................................... 52,065 7.92 RM4,186,956
59 AirAsia............................................ 507,941 1.42 RM3,915,991124 JCY Int’l....................................... 1,104,266 1.75 RM3,578,505263 Shell Refining Co............................. 10,376 10.80 RM3,240,000154 M’sian Bulk Carriers........................ 64,777 3.20 RM3,200,00071 Boustead Hldgs ............................... 64,637 3.51 RM3,199,168
261 Oriental Hldgs ...................................8,938 6.05 RM3,127,850130 KLCC Ppty Hldgs ............................42,080 3.28 RM3,063,763131 KNM Group ................................3,329,435 0.73 RM2,923,192264 United Plantations ...........................8,137 13.90 RM2,893,063118 IGB Corp ........................................143,969 1.93 RM2,876,271
119 IJM Land .......................................150,917 2.58 RM2,846,431198 SapuraCrest Petroleum ................146,469 2.37 RM2,829,389212 Tan Chong Motor Hldgs ...............132,116 3.89 RM2,614,080191 Proton Hldgs .................................152,944 4.71 RM2,586,793256 Bintulu Port Hldgs ............................4,201 6.30 RM2,520,000
203 Star Publications ............................42,086 3.35 RM2,474,189135 Kencana Petroleum ......................738,970 1.59 RM2,440,698156 M’sian Resources Corp .............1,731,453 1.69 RM2,300,607172 Multi-Purpose Hldgs ....................900,946 2.39 RM2,300,201259 Kulim ...............................................31,625 7.26 RM2,239,362
85 Dialog Group ................................677,320 1.13 RM2,235,694208 TA Global ......................................197,574 0.45 RM2,166,75082 DRB-Hicom ....................................592,523 1.25 RM2,149,501
216 Titan Chemicals Corp ...................148,018 1.22 RM2,138,294222 WCT ...............................................114,076 2.71 RM2,107,578
258 Guinness Anchor ..............................3,283 6.93 RM2,093,539264 YTL Cement ......................................4,942 4.26 RM2,089,760120 IJM Plantations ..............................26,095 2.57 RM2,059,449112 Hartalega Hldgs ..............................28,366 8.33 RM2,018,459258 Hap Seng Plantations Hldgs .........19,681 2.45 RM1,960,000
206 Supermax Corp ............................340,728 7.20 RM1,931,400260 LPI Capital .........................................1,281 13.74 RM1,906,054170 Mudajaya Group .............................37,748 5.04 RM1,884,960223 Wah Seong Corp ..........................278,254 2.69 RM1,847,331164 Media Prima ..................................177,410 2.15 RM1,835,694
58 Aeon Co ...........................................40,554 5.10 RM1,790,100261 NCB Hldgs .......................................15,893 3.63 RM1,707,018111 Hap Seng Consolidated ..................20,400 2.63 RM1,637,596131 KPJ Healthcare .............................133,152 3.06 RM1,602,375259 KFC Hldgs ..........................................1,203 7.95 RM1,576,286
205 Sunway City ...................................37,946 3.35 RM1,574,339188 Pos M’sia .......................................326,011 2.78 RM1,492,932147 Lingkaran Trans Kota Hldgs ...........21,716 3.00 RM1,491,00063 Ann Joo Resources ........................82,978 2.80 RM1,463,580
220 Unisem ..........................................503,734 2.79 RM1,446,855
257 Carlsberg Brewery M’sia .................7,058 5.04 RM1,431,320163 Media Chinese Int’l ......................212,510 0.84 RM1,414,476256 BIMB Hldgs .....................................15,337 1.32 RM1,408,044134 Keck Seng .......................................69,493 5.79 RM1,397,665155 M’sian Pacific Industries ................30,370 6.63 RM1,391,531
193 QL Resources ..................................41,202 3.43 RM1,358,280150 Lion Industries Corp .....................223,864 1.84 RM1,311,859138 Kossan Rubber Industries ...............41,041 8.20 RM1,310,901258 Hong Leong Industries ........................781 4.66 RM1,310,140263 Ta Ann Hldgs ....................................8,721 6.10 RM1,309,249
215 Time Dotcom .............................2,868,098 0.50 RM1,265,388160 Mah Sing Group ...........................100,280 1.97 RM1,234,887264 UBG ...................................................5,891 2.44 RM1,220,966262 Sarawak Oil Palms ...........................5,612 2.84 RM1,217,014256 Amway Hldgs ......................................720 7.40 RM1,216,456
MEa26_mcap.indd 2010-4-2, 18:281
aaaaaaaaaaaaaaaaaaaaaaaaaaaaaaaaaaaaaaaaaaaaaa
INSIDER TRADES
28 Shareholding includes direct & deemed interest of shareholder
No of Before AfterCompany Buyer/Seller Date Action Shares (m) Price (RM) Sh’hldg (%) Sh’hldg (%)
MAIN MARKET
AMMB Hldgs Employees Provident Fund 04/11/08–26/03/10 Buy 83.338 - --- ---APM Automotive Hldgs Lembaga Tabung Haji 25/02/10–02/03/10 Sell 0.540 - --- ---AirAsia Employees Provident Fund 05/11/08–30/03/10 Buy 19.041 - --- 6.740AirAsia Wellington Mgt Co 07/12/09–25/03/10 Buy 45.731 - --- 7.260Autoair Hldgs Dato’ Liew Choo 15/03/10 Buy 5.901 - --- 25.420
Axiata Group Employees Provident Fund 11/03/10–17/03/10 Sell 3.440 - --- ---Axiata Group Employees Provident Fund 15/03/10–18/03/10 Buy 6.900 - --- 16.530Berjaya Corp Tan Sri Dato’ Seri Vincent Tan 22/02/10–25/02/10 Sell 2.948 - --- 51.870CB Industrial Pdt Hldg Lim Chai Beng 02/03/10 Buy 0.034 - --- 29.980CSC Steel Hldgs Lembaga Tabung Haji 16/03/10–23/03/10 Sell 5.788 - --- 8.652
Compugates Hldgs Goh Kheng Peow 08/03/10–19/03/10 Buy 10.494 0.060 --- 30.660DBE Gurney Resources Fortune Junction 12/03/10–18/03/10 Sell 6.170 - --- 25.520Delloyd Ventures Dato’ IR. HJ. Noor Azmi Bin Jaafar 01/03/10–03/03/10 Sell 0.250 2.98-3.034 --- 12.560Dialog Group Employees Provident Fund 03/03/10–24/03/10 Sell 29.220 - --- 14.340Dialog Group Employees Provident Fund 04/03/10–24/03/10 Buy 11.766 - --- ---
Digi.Com Employees Provident Fund 08/03/10–24/03/10 Buy 2.187 - --- 16.760Dufu Tech Corp Hsu Chin-Shui 08/03/10–10/03/10 Sell 1.330 0.540-0.570 --- 12.790EON Capital Employees Provident Fund 09/02/10–22/03/10 Sell 5.388 - --- 12.720EON Capital Employees Provident Fund 23/02/10–22/03/10 Buy 4.863 - --- ---Ekovest Dato’ Lim Kang Hoo 05/03/10–24/03/10 Buy 1.161 - --- 21.900
Evergreen Fibreboard Lembaga Tabung Haji 03/03/10–19/03/10 Sell 6.052 - --- 7.230Fraser & Neave Hldgs Amanahraya Trustees 11/03/10–23/03/10 Sell 2.274 - --- ---Freight Mgt Hldgs Chew Chong Keat 18/03/10 Sell 2.000 0.830 --- 26.210Gamuda Amanahraya Trustees 17/03/10–26/03/10 Buy 11.030 - --- 6.840Genting Plantations Employees Provident Fund 30/12/08–26/03/10 Buy 12.659 - --- 14.867
Green Packet SMALLCAP World Fund 15/03/10–17/03/10 Buy 10.800 - --- 7.930Hock Seng Lee Employees Provident Fund 08/02/10–26/03/10 Sell 59.252 - --- 6.694Hock Seng Lee Employees Provident Fund 03/03/10–26/03/10 Buy 1.024 - --- 6.694Hong Leong Bank Employees Provident Fund 29/09/09–26/03/10 Buy 53.670 - --- 13.210Hong Leong Bank Employees Provident Fund 29/10/09–26/03/10 Sell 16.944 - --- 13.210
IGB Corp Employees Provident Fund 31/07/09–30/03/10 Buy 49.942 - --- 10.030IGB Corp Employees Provident Fund 08/12/09–30/03/10 Sell 13.913 - --- 10.030IOI Corp Employees Provident Fund 17/09/09–26/03/10 Buy 192.403 - --- 13.820IOI Corp Employees Provident Fund 17/09/09–26/03/10 Sell 164.790 - --- 13.820IOI Corp Progressive Hldgs 05/03/10–29/03/10 Buy 7.350 - --- 40.917
Integrated Rubber Corp MMC Corp 23/02/10–26/03/10 Sell 13.029 - --- 6.760KLCC Ppty Hldgs Employees Provident Fund 01/03/10–23/03/10 Sell 4.224 - --- 12.725KNM Group Employees Provident Fund 29/09/09–18/03/10 Buy 175.631 - --- 10.770KNM Group Employees Provident Fund 29/09/09–26/03/10 Sell 155.882 - --- 10.770Kencana Petroleum Employees Provident Fund 03/03/10–18/03/10 Buy 2.934 - --- 7.230
Kencana Petroleum Employees Provident Fund 03/03/10–25/03/10 Sell 20.570 - --- 7.230Kinsteel Employees Provident Fund 02/02/10–26/03/10 Sell 17.934 - --- 10.820Kuala Lumpur Kepong Employees Provident Fund 29/09/09–25/03/10 Buy 49.123 - --- 15.010Kuala Lumpur Kepong Employees Provident Fund 05/10/09–25/03/10 Sell 50.753 - --- 15.880Lafarge Malayan Cement Employees Provident Fund 03/02/10–18/03/10 Buy 6.203 1.000 --- ---
M’sia Airports Hldgs Employees Provident Fund 10/03/10–12/03/10 Sell 0.695 - --- ---M’sia Airports Hldgs Employees Provident Fund 11/03/10–22/03/10 Buy 20.634 - --- ---M’sian Airline System Employees Provident Fund 11/03/10–17/03/10 Buy 7.341 - --- ---M’sian Resources Corp Employees Provident Fund 08/02/10–26/03/10 Buy 54.733 1.000 --- ---MMC Corp Employees Provident Fund 09/03/10–10/03/10 Sell 2.500 - --- ---
Mah Sing Group AmanahRaya Trustees 25/02/10–25/03/10 Sell 11.791 0.500 --- ---Malayan Banking AmanahRaya Trustees 08/03/10–26/03/10 Sell 18.801 - --- ---Malayan Banking Employees Provident Fund 10/02/10–26/03/10 Buy 85.529 - --- ---
MEa28_mjtrd.indd 2010-4-2, 15:1528

aaaaaaaaaaaaaaaaaaaaaaaaaaaaaaaaaaaaaaaaaaaaaa
HIGHEST YIELD
40 Dividend yield does not include special dividends
259 Hup Seng Industries ...................... 1.50 0.22 6.7 14.7258 Eurospan Hldgs .............................. 0.90 0.11 10.7 12.2257 Classic Scenic ................................. 0.62 0.07 9.1 11.3263 Tek Seng Hldgs .............................. 0.37 0.04 8.5 10.8259 JayCorp ........................................... 0.88 0.0875 9.8 9.9
257 Eng Kah Corp.................................. 2.25 0.2125 20.3 9.4136 Khind Hldgs .................................... 1.08 0.10 5.4 9.3263 Teo Guan Lee Corp ........................ 1.10 0.10 6.5 9.1261 Ni Hsin Resources .......................... 0.23 0.0192 10.6 8.3264 UPA Corp ........................................ 1.42 0.10 7.1 7.0
78 Cocoaland Hldgs ............................ 1.45 0.10 8.8 6.9256 Apollo Food Hldgs.......................... 2.98 0.20 11.4 6.7258 Hing Yiap Group............................. 1.14 0.10 5.0 6.6257 CCM Duopharma Biotech.............. 2.38 0.15 12.1 6.3257 Emivest ........................................... 0.63 0.04 4.7 6.3
261 Padiberas Nasional ........................ 1.96 0.12 5.4 6.1258 Guinness Anchor............................ 6.93 0.41 14.7 5.9256 Acoustech ....................................... 0.80 0.045 16.6 5.6261 Natural Bio Resources ................... 0.54 0.03 16.1 5.6259 JT Int’l ............................................. 5.41 0.30 3.3 5.5
CONSUMERLast
Page Company.........................Close Div PE YIELD
262 Pintaras Jaya .................................. 1.58 0.10 11.0 6.3259 Ireka Corp........................................ 0.79 0.0435 14.9 5.5257 Crest Builder Hldgs ........................ 0.78 0.04 9.0 5.1259 Ken Hldgs........................................ 0.80 0.04 7.8 5.0257 Brem Hldg ....................................... 1.20 0.05 10.8 4.2
59 Ahmad Zaki Resources .................. 0.89 0.035 11.9 3.9262 Protasco .......................................... 1.04 0.04 7.3 3.8222 WCT ................................................ 2.71 0.10 14.3 3.7260 Melati Ehsan Hldgs ........................ 0.70 0.025 6.0 3.668 Bina Puri Hldgs ............................... 1.14 0.04 18.6 3.5
CONSTRUCTIONLast
Page Company.........................Close Div PE YIELD
208 TA Enterprise.................................. 0.71 0.045 13.2 6.3260 LPI Capital ..................................... 13.74 0.85 18.3 6.2263 Syarikat Takaful M’sia ................... 1.35 0.0725 5.6 5.4176 OSK Hldgs....................................... 1.39 0.075 10.4 5.4256 Aeon Credit Svcs............................ 3.92 0.201 9.6 5.1
191 Public Bank ................................... 11.80 0.55 16.6 4.7256 Apex Equity Hldgs.......................... 0.67 0.03 9.3 4.5194 RHB Capital..................................... 5.68 0.2245 10.2 4.0260 MNRB Hldgs ................................... 3.03 0.10 28.5 3.3127 Jerneh Asia ..................................... 2.76 0.08 16.6 2.9
116 Hong Leong Bank........................... 8.70 0.24 15.2 2.8259 Hwang-DBS .................................... 1.77 0.05 15.0 2.8152 M’sia Building Society ................... 1.07 0.03 23.0 2.8117 Hong Leong Financial Group.......... 8.58 0.23 14.3 2.788 ECM Libra Financial Group............. 0.75 0.02 122.1 2.7
FINANCELast
Page Company.........................Close Div PE YIELD
144 Landmarks ..................................... 1.22 0.10 59.9 8.2263 Shangri-La Hotels ......................... 1.87 0.08 23.3 4.3258 Grand Central Enterprises ............. 0.72 0.03 14.4 4.2
HOTELLast
Page Company.........................Close Div PE YIELD
224 Weida ............................................. 0.77 0.075 7.5 9.7263 Tien Wah Press Hldgs ................... 2.15 0.2005 9.6 9.3262 Scanwolf Corp ............................... 0.37 0.03 22.2 8.1257 CYL Corp ........................................ 0.52 0.04 8.9 7.7264 Yi-Lai .............................................. 0.79 0.06 10.7 7.6
264 UAC ................................................ 3.46 0.26 13.1 7.575 CSC Steel Hldgs ............................ 1.77 0.20 7.4 7.3
263 Tecnic Group ................................. 2.28 0.16 7.2 7.0264 White Horse ................................... 1.45 0.10 5.9 6.9258 Greenyield ..................................... 0.24 0.015 9.9 6.3
261 OKA Corp ....................................... 0.64 0.04 9.6 6.3257 Century Bond ................................ 0.66 0.04 6.4 6.1256 APB Resources .............................. 1.11 0.065 5.3 5.9143 Lafarge Malayan Cement ............. 6.44 0.38 16.7 5.9258 Hexza Corp .................................... 0.60 0.035 17.2 5.8
192 Public Packages Hldgs .................. 0.43 0.025 2.6 5.8264 Wellcall Hldgs ................................ 1.29 0.11 12.8 5.4260 Magni-Tech Industries .................. 0.97 0.05 8.3 5.2264 Ya Horng Electronic ...................... 0.96 0.10 7.9 5.2143 LCTH Corp ..................................... 0.34 0.0175 6.1 5.1
263 Tekala Corp ................................... 0.78 0.04 12.9 5.1214 Thong Guan Industries ................. 0.79 0.04 5.8 5.1262 Petronas Gas ................................. 9.90 0.50 21.1 5.1262 Perusahaan Sadur Timah M’sia ..... 3.99 0.20 12.3 5.0262 SCGM ............................................. 0.51 0.025 7.2 4.9
262 Sapura Industrial .......................... 0.62 0.03 8.0 4.8256 BP Plastics Hldg ............................ 0.62 0.03 7.1 4.872 Box-Pak .......................................... 1.47 0.07 7.1 4.8
INDUSTRIAL PRODUCTSLast
Page Company.........................Close Div PE YIELD
147 Lingkaran Trans Kota Hldgs .......... 3.00 0.25 14.6 8.3227 YTL Power Int’l .............................. 2.19 0.13875 20.7 6.386 Digi.Com ...................................... 22.70 1.78 17.6 4.5
192 Puncak Niaga Hldgs ...................... 2.64 0.10 7.6 3.8
INFRASTRUCTURELast
Page Company.........................Close Div PE YIELD
MINING(No Yield)
MEa40_yield.indd 2010-4-2, 18:3740
aaaaaaaaaaaaaaaaaaaaaaaaaaaaaaaaaaaaaaaaaaaaaa
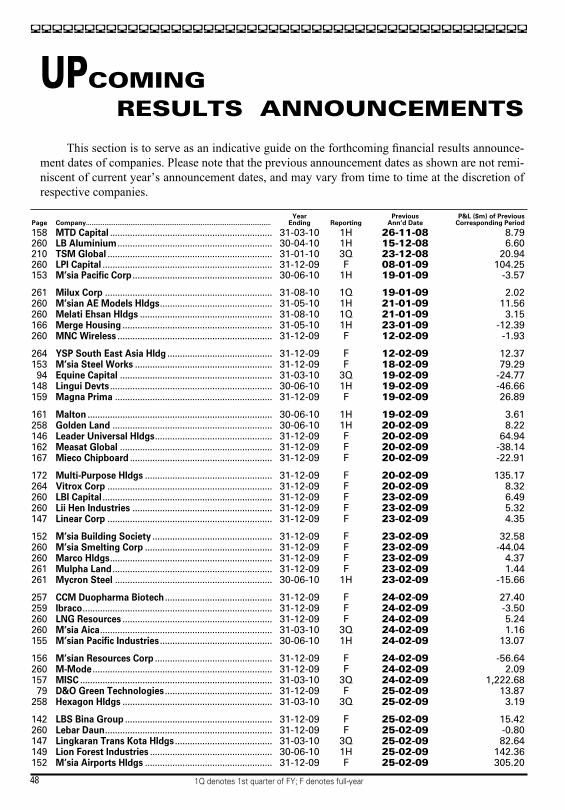
UPCOMING RESULTS ANNOUNCEMENTS
This section is to serve as an indicative guide on the forthcoming financial results announce-ment dates of companies. Please note that the previous announcement dates as shown are not remi-niscent of current year’s announcement dates, and may vary from time to time at the discretion of respective companies.
48 1Q denotes 1st quarter of FY; F denotes full-year
Year Previous P&L ($m) of PreviousPage Company.................................................................................................... Ending Reporting Ann’d Date Corresponding Period
158 MTD Capital ................................................................. 31-03-10 1H 26-11-08 8.79260 LB Aluminium .............................................................. 30-04-10 1H 15-12-08 6.60210 TSM Global .................................................................. 31-01-10 3Q 23-12-08 20.94260 LPI Capital .................................................................... 31-12-09 F 08-01-09 104.25153 M’sia Pacific Corp ........................................................ 30-06-10 1H 19-01-09 -3.57
261 Milux Corp ................................................................... 31-08-10 1Q 19-01-09 2.02260 M’sian AE Models Hldgs............................................. 31-05-10 1H 21-01-09 11.56260 Melati Ehsan Hldgs ..................................................... 31-08-10 1Q 21-01-09 3.15166 Merge Housing ............................................................ 31-05-10 1H 23-01-09 -12.39260 MNC Wireless .............................................................. 31-12-09 F 12-02-09 -1.93
264 YSP South East Asia Hldg .......................................... 31-12-09 F 12-02-09 12.37153 M’sia Steel Works ....................................................... 31-12-09 F 18-02-09 79.2994 Equine Capital ............................................................. 31-03-10 3Q 19-02-09 -24.77
148 Lingui Devts ................................................................. 30-06-10 1H 19-02-09 -46.66159 Magna Prima ............................................................... 31-12-09 F 19-02-09 26.89
161 Malton .......................................................................... 30-06-10 1H 19-02-09 3.61258 Golden Land ................................................................ 30-06-10 1H 20-02-09 8.22146 Leader Universal Hldgs............................................... 31-12-09 F 20-02-09 64.94162 Measat Global ............................................................. 31-12-09 F 20-02-09 -38.14167 Mieco Chipboard ......................................................... 31-12-09 F 20-02-09 -22.91
172 Multi-Purpose Hldgs ................................................... 31-12-09 F 20-02-09 135.17264 Vitrox Corp .................................................................. 31-12-09 F 20-02-09 8.32260 LBI Capital .................................................................... 31-12-09 F 23-02-09 6.49260 Lii Hen Industries ........................................................ 31-12-09 F 23-02-09 5.32147 Linear Corp .................................................................. 31-12-09 F 23-02-09 4.35
152 M’sia Building Society ................................................ 31-12-09 F 23-02-09 32.58260 M’sia Smelting Corp ................................................... 31-12-09 F 23-02-09 -44.04260 Marco Hldgs................................................................. 31-12-09 F 23-02-09 4.37261 Mulpha Land ................................................................ 31-12-09 F 23-02-09 1.44261 Mycron Steel ............................................................... 30-06-10 1H 23-02-09 -15.66
257 CCM Duopharma Biotech ........................................... 31-12-09 F 24-02-09 27.40259 Ibraco............................................................................ 31-12-09 F 24-02-09 -3.50260 LNG Resources ............................................................ 31-12-09 F 24-02-09 5.24260 M’sia Aica..................................................................... 31-03-10 3Q 24-02-09 1.16155 M’sian Pacific Industries ............................................. 30-06-10 1H 24-02-09 13.07
156 M’sian Resources Corp ............................................... 31-12-09 F 24-02-09 -56.64260 M-Mode ........................................................................ 31-12-09 F 24-02-09 2.09157 MISC ............................................................................. 31-03-10 3Q 24-02-09 1,222.6879 D&O Green Technologies ........................................... 31-12-09 F 25-02-09 13.87
258 Hexagon Hldgs ............................................................ 31-03-10 3Q 25-02-09 3.19
142 LBS Bina Group ........................................................... 31-12-09 F 25-02-09 15.42260 Lebar Daun................................................................... 31-12-09 F 25-02-09 -0.80147 Lingkaran Trans Kota Hldgs ....................................... 31-03-10 3Q 25-02-09 82.64149 Lion Forest Industries ................................................. 30-06-10 1H 25-02-09 142.36152 M’sia Airports Hldgs ................................................... 31-12-09 F 25-02-09 305.20
MEa48_upres.indd 2010-4-2, 18:3048
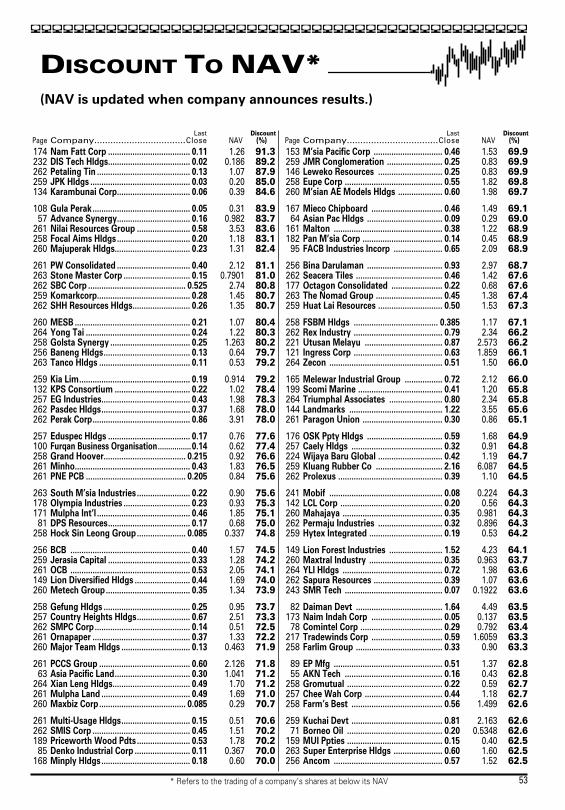
aaaaaaaaaaaaaaaaaaaaaaaaaaaaaaaaaaaaaaaaaaaaaa
DISCOUNT TO NAV*(NAV is updated when company announces results.)
53* Refers to the trading of a company’s shares at below its NAV
Last DiscountPage Company..................................Close NAV (%)
Last DiscountPage Company..................................Close NAV (%)
174 Nam Fatt Corp ..................................... 0.11 1.26 91.3232 DIS Tech Hldgs..................................... 0.02 0.186 89.2262 Petaling Tin .......................................... 0.13 1.07 87.9259 JPK Hldgs ............................................. 0.03 0.20 85.0134 Karambunai Corp................................. 0.06 0.39 84.6
108 Gula Perak............................................ 0.05 0.31 83.957 Advance Synergy................................. 0.16 0.982 83.7
261 Nilai Resources Group ........................ 0.58 3.53 83.6258 Focal Aims Hldgs................................. 0.20 1.18 83.1260 Majuperak Hldgs.................................. 0.23 1.31 82.4
261 PW Consolidated ................................. 0.40 2.12 81.1263 Stone Master Corp .............................. 0.15 0.7901 81.0262 SBC Corp ............................................ 0.525 2.74 80.8259 Komarkcorp.......................................... 0.28 1.45 80.7262 SHH Resources Hldgs.......................... 0.26 1.35 80.7
260 MESB .................................................... 0.21 1.07 80.4264 Yong Tai ............................................... 0.24 1.22 80.3258 Golsta Synergy .................................... 0.25 1.263 80.2256 Baneng Hldgs....................................... 0.13 0.64 79.7263 Tanco Hldgs ......................................... 0.11 0.53 79.2
259 Kia Lim.................................................. 0.19 0.914 79.2132 KPS Consortium .................................. 0.22 1.02 78.4257 EG Industries........................................ 0.43 1.98 78.3262 Pasdec Hldgs........................................ 0.37 1.68 78.0262 Perak Corp............................................ 0.86 3.91 78.0
257 Eduspec Hldgs ..................................... 0.17 0.76 77.6100 Furqan Business Organisation................0.14 0.62 77.4258 Grand Hoover..................................... 0.215 0.92 76.6261 Minho.................................................... 0.43 1.83 76.5261 PNE PCB ............................................. 0.205 0.84 75.6
263 South M’sia Industries ........................ 0.22 0.90 75.6178 Olympia Industries .............................. 0.23 0.93 75.3171 Mulpha Int’l .......................................... 0.46 1.85 75.181 DPS Resources..................................... 0.17 0.68 75.0
258 Hock Sin Leong Group...................... 0.085 0.337 74.8
256 BCB ...................................................... 0.40 1.57 74.5259 Jerasia Capital ..................................... 0.33 1.28 74.2261 OCB ...................................................... 0.53 2.05 74.1149 Lion Diversified Hldgs ......................... 0.44 1.69 74.0260 Metech Group...................................... 0.35 1.34 73.9
258 Gefung Hldgs ....................................... 0.25 0.95 73.7257 Country Heights Hldgs........................ 0.67 2.51 73.3262 SMPC Corp........................................... 0.14 0.51 72.5261 Ornapaper ............................................ 0.37 1.33 72.2260 Major Team Hldgs ............................... 0.13 0.463 71.9
261 PCCS Group ......................................... 0.60 2.126 71.863 Asia Pacific Land.................................. 0.30 1.041 71.2
264 Xian Leng Hldgs................................... 0.49 1.70 71.2261 Mulpha Land ........................................ 0.49 1.69 71.0260 Maxbiz Corp....................................... 0.085 0.29 70.7
261 Multi-Usage Hldgs............................... 0.15 0.51 70.6262 SMIS Corp ............................................ 0.45 1.51 70.2189 Priceworth Wood Pdts ........................ 0.53 1.78 70.285 Denko Industrial Corp ......................... 0.11 0.367 70.0
168 Minply Hldgs........................................ 0.18 0.60 70.0
153 M’sia Pacific Corp ............................... 0.46 1.53 69.9259 JMR Conglomeration ......................... 0.25 0.83 69.9146 Leweko Resources ............................. 0.25 0.83 69.9258 Eupe Corp ............................................ 0.55 1.82 69.8260 M’sian AE Models Hldgs .................... 0.60 1.98 69.7
167 Mieco Chipboard ................................ 0.46 1.49 69.164 Asian Pac Hldgs .................................. 0.09 0.29 69.0
161 Malton ................................................. 0.38 1.22 68.9182 Pan M’sia Corp .................................... 0.14 0.45 68.995 FACB Industries Incorp ...................... 0.65 2.09 68.9
256 Bina Darulaman .................................. 0.93 2.97 68.7262 Seacera Tiles ....................................... 0.46 1.42 67.6177 Octagon Consolidated ....................... 0.22 0.68 67.6263 The Nomad Group .............................. 0.45 1.38 67.4259 Huat Lai Resources ............................. 0.50 1.53 67.3
258 FSBM Hldgs ...................................... 0.385 1.17 67.1262 Rex Industry ........................................ 0.79 2.34 66.2221 Utusan Melayu ................................... 0.87 2.573 66.2121 Ingress Corp ........................................ 0.63 1.859 66.1264 Zecon ................................................... 0.51 1.50 66.0
165 Melewar Industrial Group ................. 0.72 2.12 66.0199 Scomi Marine ...................................... 0.41 1.20 65.8264 Triumphal Associates ........................ 0.80 2.34 65.8144 Landmarks .......................................... 1.22 3.55 65.6261 Paragon Union .................................... 0.30 0.86 65.1
176 OSK Ppty Hldgs .................................. 0.59 1.68 64.9257 Caely Hldgs ......................................... 0.32 0.91 64.8224 Wijaya Baru Global ............................. 0.42 1.19 64.7259 Kluang Rubber Co .............................. 2.16 6.087 64.5262 Prolexus ............................................... 0.39 1.10 64.5
241 Mobif ................................................... 0.08 0.224 64.3142 LCL Corp .............................................. 0.20 0.56 64.3260 Mahajaya ............................................. 0.35 0.981 64.3262 Permaju Industries ............................. 0.32 0.896 64.3259 Hytex Integrated ................................. 0.19 0.53 64.2
149 Lion Forest Industries ........................ 1.52 4.23 64.1260 Maxtral Industry ................................. 0.35 0.963 63.7264 YLI Hldgs ............................................. 0.72 1.98 63.6262 Sapura Resources ............................... 0.39 1.07 63.6243 SMR Tech ............................................ 0.07 0.1922 63.6
82 Daiman Devt ....................................... 1.64 4.49 63.5173 Naim Indah Corp ................................ 0.05 0.137 63.578 Comintel Corp ..................................... 0.29 0.792 63.4
217 Tradewinds Corp ................................ 0.59 1.6059 63.3258 Farlim Group ....................................... 0.33 0.90 63.3
89 EP Mfg ................................................. 0.51 1.37 62.855 AKN Tech ............................................ 0.16 0.43 62.8
258 Gromutual ........................................... 0.22 0.59 62.7257 Chee Wah Corp ................................... 0.44 1.18 62.7258 Farm’s Best ......................................... 0.56 1.499 62.6
259 Kuchai Devt ......................................... 0.81 2.163 62.671 Borneo Oil ........................................... 0.20 0.5348 62.6
159 MUI Ppties ........................................... 0.15 0.40 62.5263 Super Enterprise Hldgs ...................... 0.60 1.60 62.5256 Ancom ................................................. 0.57 1.52 62.5
MEa53_nav.indd 2010-4-2, 18:381
aaaaaaaaaaaaaaaaaaaaaaaaaaaaaaaaaaaaaaaaaaaaaa
$0.80$0.78$0.76$0.74$0.72$0.70
456000 228000
$2.10
$1.50
$0.90
5127000 2563500
$3.00
$2.80
$2.60
$2.40
29200 14600
$3.00
$2.40
$1.80
$1.20
105400 52700
131
K
MA
IN M
AR
KE
T
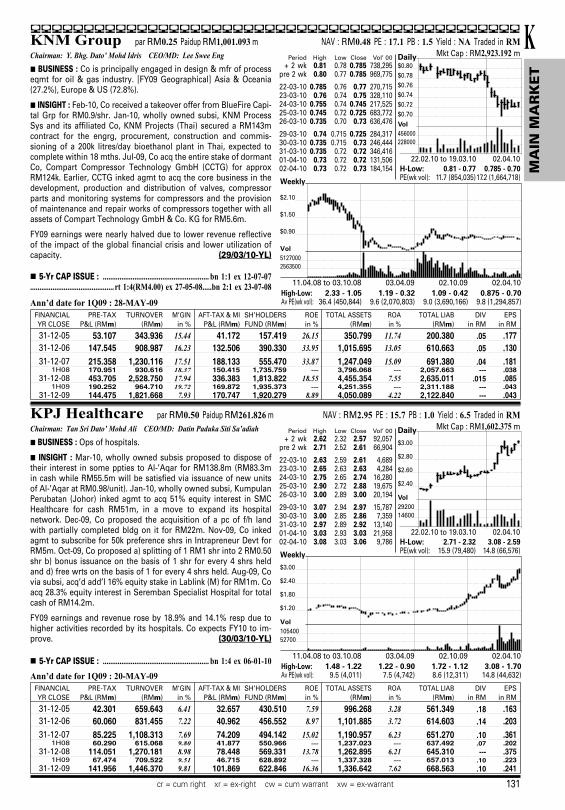
KNM Group par RM0.25 Paidup RM1,001.093 m NAV : RM0.48 PE : 17.1 PB : 1.5 Yield : NA Traded in RMChairman: Y. Bhg. Dato’ Mohd Idris CEO/MD: Lee Swee EngH BUSINESS : Co is principally engaged in design & mfr of process eqmt for oil & gas industry. [FY09 Geographical] Asia & Oceania (27.2%), Europe & US (72.8%).
H INSIGHT : Feb-10, Co received a takeover offer from BlueFire Capi-tal Grp for RM0.9/shr. Jan-10, wholly owned subsi, KNM Process Sys and its affiliated Co, KNM Projects (Thai) secured a RM143m contract for the engrg, procurement, construction and commis-sioning of a 200k litres/day bioethanol plant in Thai, expected to complete within 18 mths. Jul-09, Co acq the entire stake of dormant Co, Compart Compressor Technology GmbH (CCTG) for approx RM124k. Earlier, CCTG inked agmt to acq the core business in the development, production and distribution of valves, compressor parts and monitoring systems for compressors and the provision of maintenance and repair works of compressors together with all assets of Compart Technology GmbH & Co. KG for RM5.6m.
FY09 earnings were nearly halved due to lower revenue reflective of the impact of the global financial crisis and lower utilization of capacity. (29/03/10-YL)
Daily
Vol
Weekly
Vol
22.02.10 to 19.03.10 02.04.10H-Low: 0.81 - 0.77 0.785 - 0.70PE(wk vol): 11.7 (854,035)17.2 (1,664,718)
11.04.08 to 03.10.08 03.04.09 02.10.09 02.04.10High-Low: 2.33 - 1.05 1.19 - 0.32 1.09 - 0.42 0.875 - 0.70Av PE(wk vol): 36.4 (450,844) 9.6 (2,070,803) 9.0 (3,690,166) 9.8 (1,294,857)
Period High Low Close Vol’ 00 + 2 wk 0.81 0.78 0.785 738,295pre 2 wk 0.80 0.77 0.785 969,775
22-03-10 0.785 0.76 0.77 270,71523-03-10 0.76 0.74 0.75 328,11024-03-10 0.755 0.74 0.745 217,52525-03-10 0.745 0.72 0.725 683,77226-03-10 0.735 0.70 0.73 636,476
29-03-10 0.74 0.715 0.725 284,31730-03-10 0.735 0.715 0.73 246,44431-03-10 0.735 0.72 0.72 346,41601-04-10 0.73 0.72 0.72 131,50602-04-10 0.73 0.72 0.73 184,154
Mkt Cap : RM2,923.192 m
Ann’d date for 1Q09 : 28-MAY-09
H 5-Yr CAP ISSUE : ......................................................... bn 1:1 ex 12-07-07............................................. rt 1:4(RM4.00) ex 27-05-08.....bn 2:1 ex 23-07-08
FINANCIAL PRE-TAX TURNOVER M’GIN AFT-TAX & MI SH’HOLDERS ROE TOTAL ASSETS ROA TOTAL LIAB DIV EPSYR CLOSE P&L (RMm) (RMm) in % P&L (RMm) FUND (RMm) in % (RMm) in % (RMm) in RM in RM
31-12-05 53.107 343.936 15.44 41.172 157.419 26.15 350.799 11.74 200.380 .05 .17731-12-06 147.545 908.987 16.23 132.506 390.330 33.95 1,015.695 13.05 610.663 .05 .13031-12-07 215.358 1,230.116 17.51 188.133 555.470 33.87 1,247.049 15.09 691.380 .04 .181
1H08 170.951 930.616 18.37 150.415 1,735.759 --- 3,796.068 --- 2,057.663 --- .03831-12-08 453.705 2,528.750 17.94 336.383 1,813.822 18.55 4,455.354 7.55 2,635.011 .015 .085
1H09 190.252 964.710 19.72 169.872 1,935.373 --- 4,251.355 --- 2,311.188 --- .04331-12-09 144.475 1,821.668 7.93 170.747 1,920.279 8.89 4,050.089 4.22 2,122.840 --- .043
KPJ Healthcare par RM0.50 Paidup RM261.826 m NAV : RM2.95 PE : 15.7 PB : 1.0 Yield : 6.5 Traded in RMChairman: Tan Sri Dato’ Mohd Ali CEO/MD: Datin Paduka Siti Sa’adiahH BUSINESS : Ops of hospitals.
H INSIGHT : Mar-10, wholly owned subsis proposed to dispose of their interest in some ppties to Al-’Aqar for RM138.8m (RM83.3m in cash while RM55.5m will be satisfied via issuance of new units of Al-’Aqar at RM0.98/unit). Jan-10, wholly owned subsi, Kumpulan Perubatan (Johor) inked agmt to acq 51% equity interest in SMC Healthcare for cash RM51m, in a move to expand its hospital network. Dec-09, Co proposed the acquisition of a pc of f/h land with partially completed bldg on it for RM22m. Nov-09, Co inked agmt to subscribe for 50k preference shrs in Intrapreneur Devt for RM5m. Oct-09, Co proposed a) splitting of 1 RM1 shr into 2 RM0.50 shr b) bonus issuance on the basis of 1 shr for every 4 shrs held and d) free wrts on the basis of 1 for every 4 shrs held. Aug-09, Co via subsi, acq’d add’l 16% equity stake in Lablink (M) for RM1m. Co acq 28.3% equity interest in Seremban Specialist Hospital for total cash of RM14.2m.
FY09 earnings and revenue rose by 18.9% and 14.1% resp due to higher activities recorded by its hospitals. Co expects FY10 to im-prove. (30/03/10-YL)
Daily
Vol
Weekly
Vol
22.02.10 to 19.03.10 02.04.10H-Low: 2.71 - 2.32 3.08 - 2.59PE(wk vol): 15.9 (79,480) 14.8 (66,576)
11.04.08 to 03.10.08 03.04.09 02.10.09 02.04.10High-Low: 1.48 - 1.22 1.22 - 0.90 1.72 - 1.12 3.08 - 1.70Av PE(wk vol): 9.5 (4,011) 7.5 (4,742) 8.6 (12,311) 14.8 (44,632)
Period High Low Close Vol’ 00 + 2 wk 2.62 2.32 2.57 92,057pre 2 wk 2.71 2.52 2.61 66,904
22-03-10 2.63 2.59 2.61 4,68923-03-10 2.65 2.63 2.63 4,28424-03-10 2.75 2.65 2.74 16,28025-03-10 2.90 2.72 2.88 19,67526-03-10 3.00 2.89 3.00 20,194
29-03-10 3.07 2.94 2.97 15,78730-03-10 3.00 2.85 2.86 7,35931-03-10 2.97 2.89 2.92 13,14001-04-10 3.03 2.93 3.03 21,95802-04-10 3.08 3.03 3.06 9,786
Mkt Cap : RM1,602.375 m
Ann’d date for 1Q09 : 20-MAY-09
H 5-Yr CAP ISSUE : ......................................................... bn 1:4 ex 06-01-10
FINANCIAL PRE-TAX TURNOVER M’GIN AFT-TAX & MI SH’HOLDERS ROE TOTAL ASSETS ROA TOTAL LIAB DIV EPSYR CLOSE P&L (RMm) (RMm) in % P&L (RMm) FUND (RMm) in % (RMm) in % (RMm) in RM in RM
31-12-05 42.301 659.643 6.41 32.657 430.510 7.59 996.268 3.28 561.349 .18 .16331-12-06 60.060 831.455 7.22 40.962 456.552 8.97 1,101.885 3.72 614.603 .14 .20331-12-07 85.225 1,108.313 7.69 74.209 494.142 15.02 1,190.957 6.23 651.270 .10 .361
1H08 60.290 615.068 9.80 41.877 550.966 --- 1,237.023 --- 637.492 .07 .20231-12-08 114.051 1,270.181 8.98 78.448 569.331 13.78 1,262.895 6.21 645.310 --- .375
1H09 67.474 709.522 9.51 46.715 628.892 --- 1,337.328 --- 657.013 .10 .22331-12-09 141.956 1,446.370 9.81 101.869 622.846 16.36 1,336.642 7.62 668.563 .10 .241
cr = cum right xr = ex-right cw = cum warrant xw = ex-warrant
MEb131.indd 2010-4-2, 17:531

aaaaaaaaaaaaaaaaaaaaaaaaaaaaaaaaaaaaaaaaaaaaaa
$1.65
$1.55
$1.45
339400 169700
$1.40
$1.00
$0.60
946800 473400
$0.73
$0.71
$0.69
14200 7100
$1.30
$1.10
$0.90
$0.70
$0.50
130800 65400
156
M’sian Resources Corp par RM1.00 Paidup RM1,361.306 m NAV : RM0.727 PE : NA PB : 2.3 Yield : NA Traded in RMChairman: Datuk AzIan Mohd Zainol CEO/MD: Mohamed RazeekH BUSINESS : [9M09 Turnover] Engrg & construction (59.6%), ppty devt (27.3%), invs, infrastruc and bldg svcs (13.1%).
H INSIGHT : Nov-09, Co is proposing a rts issue, but the basis and price has not been fixed. Jul-09, Co will award M&E works in Prima Avenue amounting to RM8.6m to KVC Industrial Supplies as the sub-contractor. With lower construction costs, Co is moving into full swing to implement the ongoing construction pjts and ppty devt of more than 4m square feet of commercial space in Kuala Lumpur Sentral. Co will pursue operational excellence and proac-tive margin improvement via value engrg and cost reduction. Nov-08, Co received a Letter of Award from the Govt of M’sia for the “Merekabentuk dan Membina Kerja-Kerja Membaikpulih Muara Sungai dan Kuala Sungai Pahang”, Pahang Darul Makmur (Fasa 1) pjt for RM258.17m.
9M09, Co returned to the black as revenue surged. Increase in sales was booked in all biz segments except for ppty devt which enjoyed a higher revenue recognition in the corresponding period arising from a land sale in KL Sentral devt. Co is confident of remaining profitable in 2009. (26/11/09-XDL)
Daily
Vol
Weekly
Vol
22.02.10 to 19.03.10 02.04.10H-Low: 1.58 - 1.37 1.72 - 1.50PE(wk vol): NA (461,891) NA (865,727)
11.04.08 to 03.10.08 03.04.09 02.10.09 02.04.10High-Low: 1.62 - 0.542 0.903 - 0.444 1.40 - 0.84 1.72 - 1.17Av PE(wk vol): 24.6 (490,346) 9.6 (528,318) NA (727,800) NA (387,079)
Period High Low Close Vol’ 00 + 2 wk 1.50 1.37 1.48 390,933pre 2 wk 1.58 1.49 1.51 532,849
22-03-10 1.51 1.50 1.51 54,12923-03-10 1.51 1.50 1.51 71,81024-03-10 1.52 1.50 1.50 70,97425-03-10 1.52 1.50 1.51 219,13526-03-10 1.51 1.50 1.50 76,029
29-03-10 1.51 1.50 1.50 73,13430-03-10 1.71 1.50 1.59 508,93331-03-10 1.70 1.59 1.65 318,73401-04-10 1.72 1.62 1.68 235,14802-04-10 1.71 1.67 1.69 103,427
Mkt Cap : RM2,300.607 m
Ann’d date for 2H08 : 24-FEB-09
H 5-Yr CAP ISSUE : .......................................... rt 1:2(RM1.12) ex 28-01-10
FINANCIAL PRE-TAX TURNOVER M’GIN AFT-TAX & MI SH’HOLDERS ROE TOTAL ASSETS ROA TOTAL LIAB DIV EPSYR CLOSE P&L (RMm) (RMm) in % P&L (RMm) FUND (RMm) in % (RMm) in % (RMm) in RM in RM
31-12-05 15.169 323.825 4.68 12.407 405.608 3.06 2,034.911 0.61 1,562.613 --- .01631-12-06 30.266 527.929 5.73 33.784 440.107 7.68 1,992.934 1.70 1,486.748 --- .04431-12-07 69.831 903.702 7.73 40.745 705.531 5.78 2,106.264 1.93 1,331.875 .012 .053
1H08 9.333 405.618 2.30 9.467 715.312 --- 2,784.226 --- 2,051.049 --- .01031-12-08 – 42.155 788.552 NA – 56.638 635.167 – 8.92 2,916.011 – 1.94 2,263.630 --- – .062
1H09 11.145 382.839 2.91 12.195 649.389 --- 2,916.687 --- 2,249.758 --- .0139M09 23.127 639.947 3.61 22.212 659.433 --- 3,075.490 --- 2,398.204 --- .024
MAA Hldgs par RM1.00 Paidup RM304.354 m NAV : RM0.83 PE : NA PB : 0.9 Yield : NA Traded in RMChairman: Tunku Dato’ Ya’acob CEO/MD: Muhamad Umar SwiftH BUSINESS : [9M09 Turnover] Invs-linked fund (6.6%), non-invs-linked fund (57.8%), general insurance fund (4%), unit trust fund mgt (1.2%), shrhldrs’ fund & other ops (8.9%), discontinued ops (22.5%), eliminations (-1%).
H INSIGHT : Aug-09, Co entered into sales agmt with KK Point for the disposal of 250k shrs in Valiant ppties for RM182k. Apr-09, the headline disposal price of Co’s biz to AMG Insurance has been revised to RM254.83m. Co is engaged in general & life insurance biz, invs hldg, hire purchase, leasing and other credit svs, unit trust, ppty mgt, fund mgt and invs advisory, security and consultancy svs. As at 31-Mar-09, Co’s ttl assets stood at RM7.6b. Nov-08, Co inked a MOU with AMG Insurance to formalise discussions on the proposed acquisition by AMG its biz at a headline price of RM274.8m.
9M09, Co booked earnings of RM49m as compared to a loss in the corresponding period. Despite the current improvement in the financial mkts, the envt for financial svcs is increasingly competitive but Co will implement plans for re-organising its biz and improve asset quality. (23/11/09-XDL)
Daily
Vol
Weekly
Vol
22.02.10 to 19.03.10 02.04.10H-Low: 0.72 - 0.675 0.745 - 0.675PE(wk vol): NA (10,922) NA (50,125)
11.04.08 to 03.10.08 03.04.09 02.10.09 02.04.10High-Low: 1.34 - 0.56 0.77 - 0.38 0.87 - 0.47 0.83 - 0.65Av PE(wk vol): NA (14,665) NA (26,965) NA (63,804) NA (33,015)
Period High Low Close Vol’ 00 + 2 wk 0.71 0.675 0.70 12,622pre 2 wk 0.72 0.675 0.68 9,222
22-03-10 0.735 0.675 0.72 20,86223-03-10 0.725 0.705 0.705 6,28524-03-10 0.715 0.695 0.705 5,64425-03-10 0.74 0.70 0.735 21,16226-03-10 0.745 0.72 0.72 15,048
29-03-10 0.745 0.72 0.735 14,50030-03-10 0.735 0.71 0.71 4,64531-03-10 0.715 0.705 0.715 4,11001-04-10 0.72 0.70 0.70 3,03002-04-10 0.72 0.71 0.71 4,963
Mkt Cap : RM216.091 m
Ann’d date for 2H08 : 27-FEB-09
H 5-Yr CAP ISSUE : ......................................................... bn 1:1 ex 23-08-06
FINANCIAL PRE-TAX TURNOVER M’GIN AFT-TAX & MI SH’HOLDERS ROE TOTAL ASSETS ROA TOTAL LIAB DIV EPSYR CLOSE P&L (RMm) (RMm) in % P&L (RMm) FUND (RMm) in % (RMm) in % (RMm) in RM in RM
31-12-05 41.133 2,205.420 1.87 42.619 391.366 10.89 6,550.503 0.65 6,157.362 .10 .28831-12-06 3.110 2,283.885 0.14 – 2.176 368.256 – 0.59 7,167.226 – 0.03 6,796.517 .02 – .00731-12-07 – 84.537 2,303.343 NA – 73.767 287.967 – 25.62 7,786.095 – 0.95 7,470.175 --- – .242
1H08 – 34.203 1,039.785 NA – 29.193 254.242 --- 7,552.958 --- 7,269.188 --- – .09631-12-08 – 53.124 2,209.022 NA – 69.998 214.506 – 32.63 7,583.883 – 0.92 7,335.676 --- – .230
1H09 41.518 1,018.745 4.08 37.586 251.356 --- 7,745.778 --- 7,416.360 --- .1239M09 41.627 1,538.420 2.71 49.250 252.825 --- 7,958.397 --- 7,672.544 --- .162
1H09 = 1st half of FY09 9M09 =1st 9 months of FY09
MEb156.indd 2010-4-2, 18:191
aaaaaaaaaaaaaaaaaaaaaaaaaaaaaaaaaaaaaaaaaaaaaa
$0.155
$0.145
$0.135
$0.125
$0.115
300600 150300
$0.45
$0.35
$0.25
$0.15
3311800 1655900
$0.18
$0.175
$0.17
$0.165
10400 5200
$0.18
$0.14
$0.10
302600 151300
196
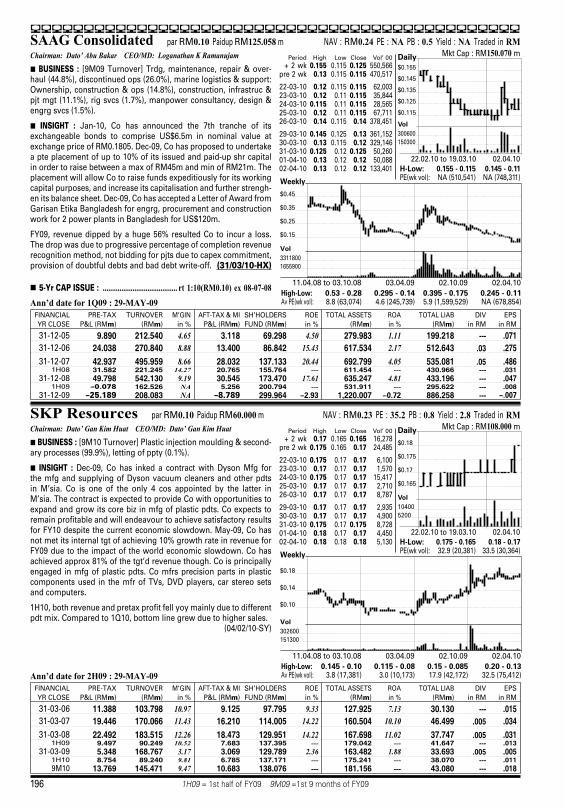
SAAG Consolidated par RM0.10 Paidup RM125.058 m NAV : RM0.24 PE : NA PB : 0.5 Yield : NA Traded in RMChairman: Dato’ Abu Bakar CEO/MD: Loganathan K RamanujamH BUSINESS : [9M09 Turnover] Trdg, maintenance, repair & over-haul (44.8%), discontinued ops (26.0%), marine logistics & support: Ownership, construction & ops (14.8%), construction, infrastruc & pjt mgt (11.1%), rig svcs (1.7%), manpower consultancy, design & engrg svcs (1.5%).
H INSIGHT : Jan-10, Co has announced the 7th tranche of its exchangeable bonds to comprise US$6.5m in nominal value at exchange price of RM0.1805. Dec-09, Co has proposed to undertake a pte placement of up to 10% of its issued and paid-up shr capital in order to raise between a max of RM45m and min of RM21m. The placement will allow Co to raise funds expeditiously for its working capital purposes, and increase its capitalisation and further strengh-en its balance sheet. Dec-09, Co has accepted a Letter of Award from Garisan Etika Bangladesh for engrg, procurement and construction work for 2 power plants in Bangladesh for US$120m.
FY09, revenue dipped by a huge 56% resulted Co to incur a loss. The drop was due to progressive percentage of completion revenue recognition method, not bidding for pjts due to capex commitment, provision of doubtful debts and bad debt write-off. (31/03/10-HX)
Daily
Vol
Weekly
Vol
22.02.10 to 19.03.10 02.04.10H-Low: 0.155 - 0.115 0.145 - 0.11PE(wk vol): NA (510,541) NA (748,311)
11.04.08 to 03.10.08 03.04.09 02.10.09 02.04.10High-Low: 0.53 - 0.28 0.295 - 0.14 0.395 - 0.175 0.245 - 0.11Av PE(wk vol): 8.8 (63,074) 4.6 (245,739) 5.9 (1,599,529) NA (678,854)
Period High Low Close Vol’ 00 + 2 wk 0.155 0.115 0.125 550,566pre 2 wk 0.13 0.115 0.115 470,517
22-03-10 0.12 0.115 0.115 62,00323-03-10 0.12 0.11 0.115 35,84424-03-10 0.115 0.11 0.115 28,56525-03-10 0.12 0.11 0.115 67,71126-03-10 0.14 0.115 0.14 378,451
29-03-10 0.145 0.125 0.13 361,15230-03-10 0.13 0.115 0.12 329,14631-03-10 0.125 0.12 0.125 50,26001-04-10 0.13 0.12 0.12 50,08802-04-10 0.13 0.12 0.12 133,401
Mkt Cap : RM150.070 m
Ann’d date for 1Q09 : 29-MAY-09
H 5-Yr CAP ISSUE : ........................................ rt 1:10(RM0.10) ex 08-07-08
FINANCIAL PRE-TAX TURNOVER M’GIN AFT-TAX & MI SH’HOLDERS ROE TOTAL ASSETS ROA TOTAL LIAB DIV EPSYR CLOSE P&L (RMm) (RMm) in % P&L (RMm) FUND (RMm) in % (RMm) in % (RMm) in RM in RM
31-12-05 9.890 212.540 4.65 3.118 69.298 4.50 279.983 1.11 199.218 --- .07131-12-06 24.038 270.840 8.88 13.400 86.842 15.43 617.534 2.17 512.643 .03 .27531-12-07 42.937 495.959 8.66 28.032 137.133 20.44 692.799 4.05 535.081 .05 .486
1H08 31.582 221.245 14.27 20.765 155.764 --- 611.454 --- 430.966 --- .03131-12-08 49.798 542.130 9.19 30.545 173.470 17.61 635.247 4.81 433.196 --- .047
1H09 – 0.078 162.526 NA 5.256 200.794 --- 531.911 --- 295.622 --- .00831-12-09 – 25.189 208.083 NA – 8.789 299.964 – 2.93 1,220.007 – 0.72 886.258 --- – .007
SKP Resources par RM0.10 Paidup RM60.000 m NAV : RM0.23 PE : 35.2 PB : 0.8 Yield : 2.8 Traded in RMChairman: Dato’ Gan Kim Huat CEO/MD: Dato’ Gan Kim HuatH BUSINESS : [9M10 Turnover] Plastic injection moulding & second-ary processes (99.9%), letting of ppty (0.1%).
H INSIGHT : Dec-09, Co has inked a contract with Dyson Mfg for the mfg and supplying of Dyson vacuum cleaners and other pdts in M’sia. Co is one of the only 4 cos appointed by the latter in M’sia. The contract is expected to provide Co with opportunities to expand and grow its core biz in mfg of plastic pdts. Co expects to remain profitable and will endeavour to achieve satisfactory results for FY10 despite the current economic slowdown. May-09, Co has not met its internal tgt of achieving 10% growth rate in revenue for FY09 due to the impact of the world economic slowdown. Co has achieved approx 81% of the tgt’d revenue though. Co is principally engaged in mfg of plastic pdts. Co mfrs precision parts in plastic components used in the mfr of TVs, DVD players, car stereo sets and computers.
1H10, both revenue and pretax profit fell yoy mainly due to different pdt mix. Compared to 1Q10, bottom line grew due to higher sales. (04/02/10-SY)
Daily
Vol
Weekly
Vol
22.02.10 to 19.03.10 02.04.10H-Low: 0.175 - 0.165 0.18 - 0.17PE(wk vol): 32.9 (20,381) 33.5 (30,364)
11.04.08 to 03.10.08 03.04.09 02.10.09 02.04.10High-Low: 0.145 - 0.10 0.115 - 0.08 0.15 - 0.085 0.20 - 0.13Av PE(wk vol): 3.8 (17,381) 3.0 (10,173) 17.9 (42,172) 32.5 (75,412)
Period High Low Close Vol’ 00 + 2 wk 0.17 0.165 0.165 16,278pre 2 wk 0.175 0.165 0.17 24,485
22-03-10 0.175 0.17 0.17 6,10023-03-10 0.17 0.17 0.17 1,57024-03-10 0.175 0.17 0.17 15,41725-03-10 0.17 0.17 0.17 2,71026-03-10 0.17 0.17 0.17 8,787
29-03-10 0.17 0.17 0.17 2,93530-03-10 0.17 0.17 0.17 4,90031-03-10 0.175 0.17 0.175 8,72801-04-10 0.18 0.17 0.17 4,45002-04-10 0.18 0.18 0.18 5,130
Mkt Cap : RM108.000 m
Ann’d date for 2H09 : 29-MAY-09FINANCIAL PRE-TAX TURNOVER M’GIN AFT-TAX & MI SH’HOLDERS ROE TOTAL ASSETS ROA TOTAL LIAB DIV EPSYR CLOSE P&L (RMm) (RMm) in % P&L (RMm) FUND (RMm) in % (RMm) in % (RMm) in RM in RM
31-03-06 11.388 103.798 10.97 9.125 97.795 9.33 127.925 7.13 30.130 --- .01531-03-07 19.446 170.066 11.43 16.210 114.005 14.22 160.504 10.10 46.499 .005 .03431-03-08 22.492 183.515 12.26 18.473 129.951 14.22 167.698 11.02 37.747 .005 .031
1H09 9.497 90.249 10.52 7.683 137.395 --- 179.042 --- 41.647 --- .01331-03-09 5.348 168.767 3.17 3.069 129.789 2.36 163.482 1.88 33.693 .005 .005
1H10 8.754 89.240 9.81 6.785 137.171 --- 175.241 --- 38.070 --- .0119M10 13.769 145.471 9.47 10.683 138.076 --- 181.156 --- 43.080 --- .018
1H09 = 1st half of FY09 9M09 =1st 9 months of FY09
MEb196.indd 2010-4-2, 18:181
aaaaaaaaaaaaaaaaaaaaaaaaaaaaaaaaaaaaaaaaaaaaaa
$0.52
$0.48
$0.44
$0.40
481800 240900
$0.55
$0.45
$0.35
$0.25
1420200 710100
$0.46
$0.44
$0.42
$0.40
230800 115400
$0.60$0.50$0.40$0.30$0.20$0.10
2931000 1465500
215
T
MA
IN M
AR
KE
T
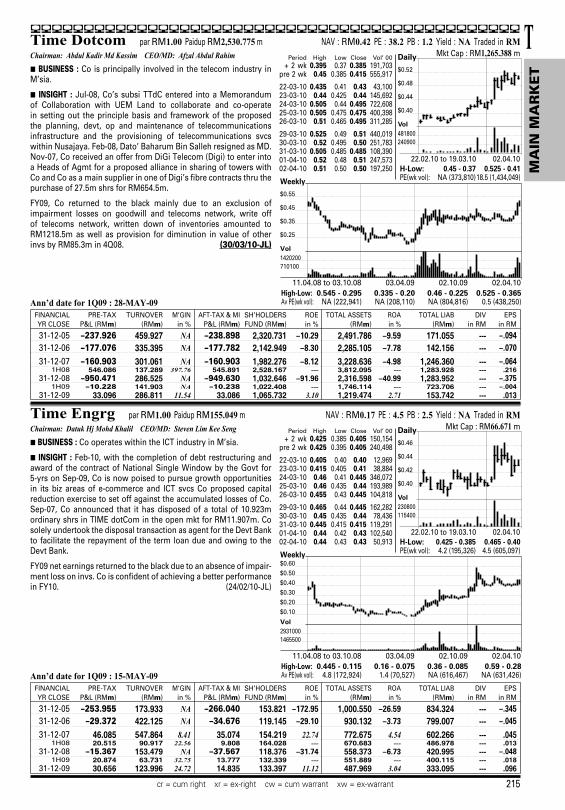
Time Dotcom par RM1.00 Paidup RM2,530.775 m NAV : RM0.42 PE : 38.2 PB : 1.2 Yield : NA Traded in RMChairman: Abdul Kadir Md Kassim CEO/MD: Afzal Abdul RahimH BUSINESS : Co is principally involved in the telecom industry in M’sia.
H INSIGHT : Jul-08, Co’s subsi TTdC entered into a Memorandum of Collaboration with UEM Land to collaborate and co-operate in setting out the principle basis and framework of the proposed the planning, devt, op and maintenance of telecommunications infrastructure and the provisioning of telecommunications svcs within Nusajaya. Feb-08, Dato’ Baharum Bin Salleh resigned as MD. Nov-07, Co received an offer from DiGi Telecom (Digi) to enter into a Heads of Agmt for a proposed alliance in sharing of towers with Co and Co as a main supplier in one of Digi’s fibre contracts thru the purchase of 27.5m shrs for RM654.5m.
FY09, Co returned to the black mainly due to an exclusion of impairment losses on goodwill and telecoms network, write off of telecoms network, written down of inventories amounted to RM1218.5m as well as provision for diminution in value of other invs by RM85.3m in 4Q08. (30/03/10-JL)
Daily
Vol
Weekly
Vol
22.02.10 to 19.03.10 02.04.10H-Low: 0.45 - 0.37 0.525 - 0.41PE(wk vol): NA (373,810)18.5 (1,434,049)
11.04.08 to 03.10.08 03.04.09 02.10.09 02.04.10High-Low: 0.545 - 0.295 0.335 - 0.20 0.46 - 0.225 0.525 - 0.365Av PE(wk vol): NA (222,941) NA (208,110) NA (804,816) 0.5 (438,250)
Period High Low Close Vol’ 00 + 2 wk 0.395 0.37 0.385 191,703pre 2 wk 0.45 0.385 0.415 555,917
22-03-10 0.435 0.41 0.43 43,10023-03-10 0.44 0.425 0.44 145,69224-03-10 0.505 0.44 0.495 722,60825-03-10 0.505 0.475 0.475 400,39826-03-10 0.51 0.465 0.495 311,285
29-03-10 0.525 0.49 0.51 440,01930-03-10 0.52 0.495 0.50 251,78331-03-10 0.505 0.485 0.485 108,39001-04-10 0.52 0.48 0.51 247,57302-04-10 0.51 0.50 0.50 197,250
Mkt Cap : RM1,265.388 m
Ann’d date for 1Q09 : 28-MAY-09FINANCIAL PRE-TAX TURNOVER M’GIN AFT-TAX & MI SH’HOLDERS ROE TOTAL ASSETS ROA TOTAL LIAB DIV EPSYR CLOSE P&L (RMm) (RMm) in % P&L (RMm) FUND (RMm) in % (RMm) in % (RMm) in RM in RM
31-12-05 – 237.926 459.927 NA – 238.898 2,320.731 – 10.29 2,491.786 – 9.59 171.055 --- – .09431-12-06 – 177.076 335.395 NA – 177.782 2,142.949 – 8.30 2,285.105 – 7.78 142.156 --- – .07031-12-07 – 160.903 301.061 NA – 160.903 1,982.276 – 8.12 3,228.636 – 4.98 1,246.360 --- – .064
1H08 546.086 137.289 397.76 545.891 2,528.167 --- 3,812.095 --- 1,283.928 --- .21631-12-08 – 950.471 286.525 NA – 949.630 1,032.646 – 91.96 2,316.598 – 40.99 1,283.952 --- – .375
1H09 – 10.228 141.903 NA – 10.238 1,022.408 --- 1,746.114 --- 723.706 --- – .00431-12-09 33.096 286.811 11.54 33.086 1,065.732 3.10 1,219.474 2.71 153.742 --- .013
Time Engrg par RM1.00 Paidup RM155.049 m NAV : RM0.17 PE : 4.5 PB : 2.5 Yield : NA Traded in RMChairman: Datuk Hj Mohd Khalil CEO/MD: Steven Lim Kee SengH BUSINESS : Co operates within the ICT industry in M’sia.
H INSIGHT : Feb-10, with the completion of debt restructuring and award of the contract of National Single Window by the Govt for 5-yrs on Sep-09, Co is now poised to pursue growth opportunities in its biz areas of e-commerce and ICT svcs Co proposed capital reduction exercise to set off against the accumulated losses of Co. Sep-07, Co announced that it has disposed of a total of 10.923m ordinary shrs in TIME dotCom in the open mkt for RM11.907m. Co solely undertook the disposal transaction as agent for the Devt Bank to facilitate the repayment of the term loan due and owing to the Devt Bank.
FY09 net earnings returned to the black due to an absence of impair-ment loss on invs. Co is confident of achieving a better performance in FY10. (24/02/10-JL)
Daily
Vol
Weekly
Vol
22.02.10 to 19.03.10 02.04.10H-Low: 0.425 - 0.385 0.465 - 0.40PE(wk vol): 4.2 (195,326) 4.5 (605,097)
11.04.08 to 03.10.08 03.04.09 02.10.09 02.04.10High-Low: 0.445 - 0.115 0.16 - 0.075 0.36 - 0.085 0.59 - 0.28Av PE(wk vol): 4.8 (172,924) 1.4 (70,527) NA (616,467) NA (631,426)
Period High Low Close Vol’ 00 + 2 wk 0.425 0.385 0.405 150,154pre 2 wk 0.425 0.395 0.405 240,498
22-03-10 0.405 0.40 0.40 12,96923-03-10 0.415 0.405 0.41 38,88424-03-10 0.46 0.41 0.445 346,07225-03-10 0.46 0.435 0.44 193,98926-03-10 0.455 0.43 0.445 104,818
29-03-10 0.465 0.44 0.445 162,28230-03-10 0.45 0.435 0.44 78,43631-03-10 0.445 0.415 0.415 119,29101-04-10 0.44 0.42 0.43 102,54002-04-10 0.44 0.43 0.43 50,913
Mkt Cap : RM66.671 m
Ann’d date for 1Q09 : 15-MAY-09FINANCIAL PRE-TAX TURNOVER M’GIN AFT-TAX & MI SH’HOLDERS ROE TOTAL ASSETS ROA TOTAL LIAB DIV EPSYR CLOSE P&L (RMm) (RMm) in % P&L (RMm) FUND (RMm) in % (RMm) in % (RMm) in RM in RM
31-12-05 – 253.955 173.933 NA – 266.040 153.821 – 172.95 1,000.550 – 26.59 834.324 --- – .34531-12-06 – 29.372 422.125 NA – 34.676 119.145 – 29.10 930.132 – 3.73 799.007 --- – .04531-12-07 46.085 547.864 8.41 35.074 154.219 22.74 772.675 4.54 602.266 --- .045
1H08 20.515 90.917 22.56 9.808 164.028 --- 670.683 --- 486.978 --- .01331-12-08 – 15.367 153.479 NA – 37.567 118.376 – 31.74 558.373 – 6.73 420.995 --- – .048
1H09 20.874 63.731 32.75 13.777 132.339 --- 551.889 --- 400.115 --- .01831-12-09 30.656 123.996 24.72 14.835 133.397 11.12 487.969 3.04 333.095 --- .096
cr = cum right xr = ex-right cw = cum warrant xw = ex-warrant
MEb215.indd 2010-4-2, 17:561
aaaaaaaaaaaaaaaaaaaaaaaaaaaaaaaaaaaaaaaaaaaaaa
$0.56$0.54$0.52$0.50$0.48$0.46
16200 8100
$0.60
$0.50
$0.40
$0.30
58600 29300
$1.75
$1.65
$1.55
$1.45
$1.35
225400 112700
$1.60
$1.20
$0.80
$0.40
472000 236000
67
B
MA
IN M
AR
KE
T
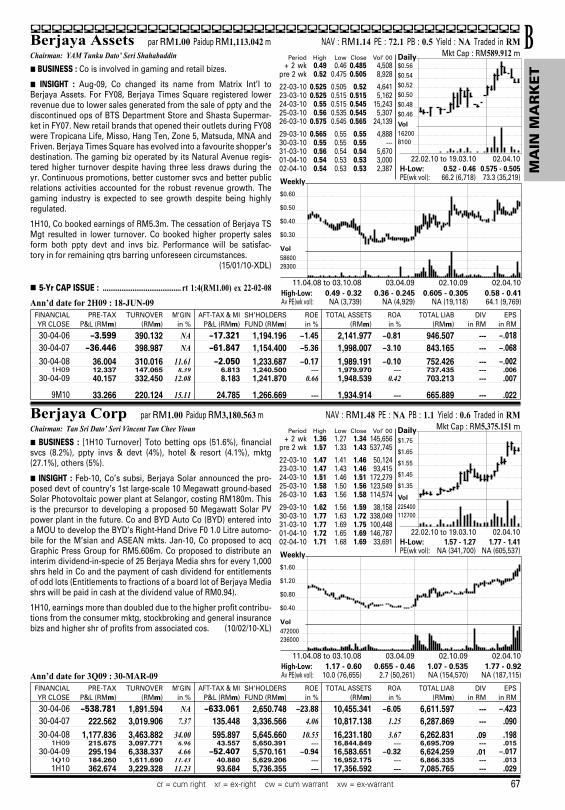
Berjaya Assets par RM1.00 Paidup RM1,113.042 m NAV : RM1.14 PE : 72.1 PB : 0.5 Yield : NA Traded in RMChairman: YAM Tunku Dato’ Seri Shahabuddin H BUSINESS : Co is involved in gaming and retail bizes.
H INSIGHT : Aug-09, Co changed its name from Matrix Int’l to Berjaya Assets. For FY08, Berjaya Times Square registered lower revenue due to lower sales generated from the sale of ppty and the discontinued ops of BTS Department Store and Shasta Supermar-ket in FY07. New retail brands that opened their outlets during FY08 were Tropicana Life, Misso, Hang Ten, Zone 5, Matsuda, MNA and Friven. Berjaya Times Square has evolved into a favourite shopper’s destination. The gaming biz operated by its Natural Avenue regis-tered higher turnover despite having three less draws during the yr. Continuous promotions, better customer svcs and better public relations activities accounted for the robust revenue growth. The gaming industry is expected to see growth despite being highly regulated.
1H10, Co booked earnings of RM5.3m. The cessation of Berjaya TS Mgt resulted in lower turnover. Co booked higher property sales form both ppty devt and invs biz. Performance will be satisfac-tory in for remaining qtrs barring unforeseen circumstances. (15/01/10-XDL)
Daily
Vol
Weekly
Vol
22.02.10 to 19.03.10 02.04.10H-Low: 0.52 - 0.46 0.575 - 0.505PE(wk vol): 66.2 (6,718) 73.3 (35,219)
11.04.08 to 03.10.08 03.04.09 02.10.09 02.04.10High-Low: 0.49 - 0.32 0.36 - 0.245 0.605 - 0.305 0.58 - 0.41Av PE(wk vol): NA (3,739) NA (4,929) NA (19,118) 64.1 (9,769)
Period High Low Close Vol’ 00 + 2 wk 0.49 0.46 0.485 4,508pre 2 wk 0.52 0.475 0.505 8,928
22-03-10 0.525 0.505 0.52 4,64123-03-10 0.525 0.515 0.515 5,16224-03-10 0.55 0.515 0.545 15,24325-03-10 0.56 0.535 0.545 5,30726-03-10 0.575 0.545 0.565 24,139
29-03-10 0.565 0.55 0.55 4,88830-03-10 0.55 0.55 0.55 ---31-03-10 0.56 0.54 0.54 5,67001-04-10 0.54 0.53 0.53 3,00002-04-10 0.54 0.53 0.53 2,387
Mkt Cap : RM589.912 m
Ann’d date for 2H09 : 18-JUN-09
H 5-Yr CAP ISSUE : .......................................... rt 1:4(RM1.00) ex 22-02-08
FINANCIAL PRE-TAX TURNOVER M’GIN AFT-TAX & MI SH’HOLDERS ROE TOTAL ASSETS ROA TOTAL LIAB DIV EPSYR CLOSE P&L (RMm) (RMm) in % P&L (RMm) FUND (RMm) in % (RMm) in % (RMm) in RM in RM
30-04-06 – 3.599 390.132 NA – 17.321 1,194.196 – 1.45 2,141.977 – 0.81 946.507 --- – .01830-04-07 – 36.446 398.987 NA – 61.847 1,154.400 – 5.36 1,998.007 – 3.10 843.165 --- – .06830-04-08 36.004 310.016 11.61 – 2.050 1,233.687 – 0.17 1,989.191 – 0.10 752.426 --- – .002
1H09 12.337 147.065 8.39 6.813 1,240.500 --- 1,979.970 --- 737.435 --- .00630-04-09 40.157 332.450 12.08 8.183 1,241.870 0.66 1,948.539 0.42 703.213 --- .007
9M10 33.266 220.124 15.11 24.785 1,266.669 --- 1,934.914 --- 665.889 --- .022
Berjaya Corp par RM1.00 Paidup RM3,180.563 m NAV : RM1.48 PE : NA PB : 1.1 Yield : 0.6 Traded in RMChairman: Tan Sri Dato’ Seri Vincent Tan Chee Yioun H BUSINESS : [1H10 Turnover] Toto betting ops (51.6%), financial svcs (8.2%), ppty invs & devt (4%), hotel & resort (4.1%), mktg (27.1%), others (5%).
H INSIGHT : Feb-10, Co’s subsi, Berjaya Solar announced the pro-posed devt of country’s 1st large-scale 10 Megawatt ground-based Solar Photovoltaic power plant at Selangor, costing RM180m. This is the precursor to developing a proposed 50 Megawatt Solar PV power plant in the future. Co and BYD Auto Co (BYD) entered into a MOU to develop the BYD’s Right-Hand Drive F0 1.0 Litre automo-bile for the M’sian and ASEAN mkts. Jan-10, Co proposed to acq Graphic Press Group for RM5.606m. Co proposed to distribute an interim dividend-in-specie of 25 Berjaya Media shrs for every 1,000 shrs held in Co and the payment of cash dividend for entitlements of odd lots (Entitlements to fractions of a board lot of Berjaya Media shrs will be paid in cash at the dividend value of RM0.94).
1H10, earnings more than doubled due to the higher profit contribu-tions from the consumer mktg, stockbroking and general insurance bizs and higher shr of profits from associated cos. (10/02/10-XL)
Daily
Vol
Weekly
Vol
22.02.10 to 19.03.10 02.04.10H-Low: 1.57 - 1.27 1.77 - 1.41PE(wk vol): NA (341,700) NA (605,537)
11.04.08 to 03.10.08 03.04.09 02.10.09 02.04.10High-Low: 1.17 - 0.60 0.655 - 0.46 1.07 - 0.535 1.77 - 0.92Av PE(wk vol): 10.0 (76,655) 2.7 (50,261) NA (154,570) NA (187,115)
Period High Low Close Vol’ 00 + 2 wk 1.36 1.27 1.34 145,656pre 2 wk 1.57 1.33 1.43 537,745
22-03-10 1.47 1.41 1.46 50,12423-03-10 1.47 1.43 1.46 93,41524-03-10 1.51 1.46 1.51 172,27925-03-10 1.58 1.50 1.56 123,54926-03-10 1.63 1.56 1.58 114,574
29-03-10 1.62 1.56 1.59 38,15830-03-10 1.77 1.63 1.72 338,04931-03-10 1.77 1.69 1.75 100,44801-04-10 1.72 1.65 1.69 146,78702-04-10 1.71 1.68 1.69 33,691
Mkt Cap : RM5,375.151 m
Ann’d date for 3Q09 : 30-MAR-09FINANCIAL PRE-TAX TURNOVER M’GIN AFT-TAX & MI SH’HOLDERS ROE TOTAL ASSETS ROA TOTAL LIAB DIV EPSYR CLOSE P&L (RMm) (RMm) in % P&L (RMm) FUND (RMm) in % (RMm) in % (RMm) in RM in RM
30-04-06 – 538.781 1,891.594 NA – 633.061 2,650.748 – 23.88 10,455.341 – 6.05 6,611.597 --- – .42330-04-07 222.562 3,019.906 7.37 135.448 3,336.566 4.06 10,817.138 1.25 6,287.869 --- .09030-04-08 1,177.836 3,463.882 34.00 595.897 5,645.660 10.55 16,231.180 3.67 6,262.831 .09 .198
1H09 215.675 3,097.771 6.96 43.557 5,650.391 --- 16,844.849 --- 6,695.709 --- .01530-04-09 295.194 6,338.337 4.66 – 52.407 5,570.161 – 0.94 16,583.651 – 0.32 6,624.259 .01 – .017
1Q10 184.260 1,611.690 11.43 40.880 5,629.206 --- 16,952.175 --- 6,866.335 --- .0131H10 362.674 3,229.328 11.23 93.684 5,736.355 --- 17,356.592 --- 7,085.765 --- .029
cr = cum right xr = ex-right cw = cum warrant xw = ex-warrant
MEb67.indd 2010-4-2, 17:501