Embed Size (px)
Citation preview
Shared Zebra Crossing Study
by S Greenshields, D Allen, I York and R Paradise
3HUPR/T/035/06 Clients Project Reference Number
TfL1618
UNPUBLISHED PROJECT REPORT
TRL Limited
UNPUBLISHED PROJECT REPORT UPR/T/035/06
SHARED ZEBRA CROSSING STUDY Version: Final
by Stuart Greenshields, David Allen, Iain York and Ross Paradise
Prepared for: TfL
Client: Cycling Centre of Excellence
Copyright TRL Limited (August) 2006 This report has been prepared for Transport for London is unpublished and should not be referred to in any other document or publication without the permission of Transport for London. The views expressed are those of the author(s) and not necessarily those of Transport for London.
Approvals
Project Manager
Quality Reviewed

This report has been produced by TRL Limited, under/as part of a Contract placed by Transport for London. Any views expressed are not necessarily those of Transport for London. TRL is committed to optimising energy efficiency, reducing waste and promoting recycling and re-use. In support of these environmental goals, this report has been printed on recycled paper, comprising 100% post-consumer waste, manufactured using a TCF (totally chlorine free) process.
TRL Limited UPR/T/035/06
CIRCULATION LIST
This report has been classified as having a limited circulation. It should not be copied or shown to any other parties without the permission of Transport for London.
Initially copies have been sent to:
1. John Lee

TRL Limited UPR/T/035/06
CONTENTS
Executive summary 4Hi
1 Introduction 5H1
2 Methodology 6H2
2.1 Introduction 7H2 2.2 Literature review 8H2
2.2.1 Regulation 9H2 2.2.2 Design 10H2 2.2.3 Research evidence 11H2
2.3 Analysis of STATS19 data 12H2 2.3.1 Reported collisions 13H3 2.3.2 Additional collision research 14H3
2.4 Observational research 15H3 2.4.1 Site Selection 16H3 2.4.2 Site characteristics 17H4 2.4.3 Video Data 18H5 2.4.4 Video Data Extraction 19H5 2.4.5 Conflict categories 20H6
2.5 Research Questions 21H6 2.5.1 Literature Review Research Questions 22H6 2.5.2 Video Analysis Research Questions 23H7
3 Literature Review 24H8
3.1 Introduction 25H8 3.2 The legal standing of the various crossing types 26H9
3.2.1 General crossing regulations 27H9 3.2.2 Zebra crossings 28H11 3.2.3 Toucan crossings 29H12 3.2.4 Puffin Crossings 30H12 3.2.5 Parallel cycle and pedestrian crossings 31H12
3.3 What are the legal and regulatory frameworks governing the use of Zebra crossings? 32H12 3.3.1 Installation procedure for local authorities 33H13 3.3.2 Signing : Legal Framework 34H13 3.3.3 The colour, size illumination and mounting of traffic signs, globes and posts 35H14 3.3.4 The size and type of road markings including zigzags and give-way lines 36H14 3.3.5 The number and colour of studs and stripes 37H14 3.3.6 Signs 38H15 3.3.7 Criteria for the crossing to be classified as validly operational 39H16
3.4 Problems arising from the definition of use of various crossing types 40H16 3.5 Guidance on the various design standards of pedestrian crossing facilities 41H16
3.5.1 Pedestrian refuges 42H17 3.5.2 Summary of pedestrian crossing design standards 43H18
3.6 Guidance on the various design standards for cycle paths 44H18 3.6.1 Advisory Crossings (non-signalised) 45H20 3.6.2 Signal controlled crossings 46H20 3.6.3 Guidance on the various design standards of cycle facilities 47H20
3.7 Key findings from similar research on different types of crossing (particularly Zebra crossings) 48H21

TRL Limited UPR/T/035/06
3.7.1 Research specifically at cycle crossings 49H22 3.7.2 Shared Crossings 50H24
4 Collision data analysis 51H28
4.1 Introduction 52H28 4.2 National data on collisions at crossings 53H28
4.2.1 Collisions at Zebra crossings 54H28 4.2.2 Collisions at other types of crossing 55H30
4.3 Collisions at each selected review site 56H31 4.3.1 Collision rate data 57H32
4.4 Comparative rate data 58H33 4.4.1 Comparative risk per mile 59H33 4.4.2 Incidents per journey 60H35 4.4.3 Summary 61H37
5 Observational research analysis 62H38
5.1 General statistics 63H38 5.1.1 Cyclist and pedestrian numbers 64H38 5.1.2 Flow timings 65H39 5.1.3 Number and direction of cyclists and pedestrians 66H42 5.1.4 All cyclists walking or cycling across the Zebra crossing 67H42 5.1.5 Walking or cycling cyclists involved in some level of conflict 68H43 5.1.6 Position of conflict 69H43 5.1.7 Visibility 70H44 5.1.8 Review of general findings 71H44
5.2 Research Questions 72H45 5.2.1 What is the rate and severity of conflicts involving cyclists using Zebra crossings
across the sites? 73H45 5.2.2 What is the number of conflicts across sites between cyclists and pedestrians,
cyclists and cyclists and cyclists and vehicles? 74H46 5.2.3 How do the identified cases of conflict (serious and minor) occur? Are there any
similarities between conflicts at each site/ across particular types of site? e.g. the way the cyclist approaches, the presence of pedestrians etc. 75H49
5.2.4 How do the reported cases of collisions compare with the cases of conflict (numbers and descriptions) for each site and across sites? 76H55
5.2.5 Is there a relationship between the speed of cyclists on approach (in conflict situations) and the level of conflict? 77H56
5.2.6 Is there a relationship between the speed of cyclists traversing the crossing and the level of conflict / presence of pedestrians? 78H57
5.2.7 Is there any relationship between site geometry (and visibility splay) at each site and the number of conflicts and number of collisions? 79H57
5.2.8 Is there a relationship between the number of collisions / conflicts and the position of the Zebra along the link? 80H59
5.2.9 Is there a variation in the rate and severity of collisions / conflicts and the time of day e.g. peak / off peak, daylight / after dark? 81H60
5.2.10 Is there a relationship between the number of collisions / conflicts and the number and type of pedestrians using the crossing? 82H61
5.2.11 Summary of research questions key findings 83H62
6 Discussion 84H63
6.1 Introduction 85H63 6.2 Network Implications 86H63

TRL Limited UPR/T/035/06
6.3 Legal 87H63 6.4 Headline findings (chapters 4 and 5) 88H64 6.5 General data 89H64 6.6 Conflicts 90H64 6.7 Injury Collisions 91H65 6.8 Site Specifics 92H65 6.9 Visibility 93H65 6.10 Time of Day 94H65 6.11 Pedestrian flow 95H65 6.12 Design implications 96H66 6.13 Summary 97H67
7 Conclusion 98H68
7.1 Aims and objectives 99H68 7.2 Key Findings and Recommendations 100H68
7.2.1 Cyclist and pedestrian conflicts 101H68 7.2.2 Vehicle and Zebra-user conflict 102H68 7.2.3 Key Findings: Design imperatives 103H69 7.2.4 Key Findings: Legal ramifications 104H69 7.2.5 Key Recommendations: Design Consideration for shared-use Zebra (Tiger)
crossings 105H69 7.3 Next Steps towards trial of shared-use Zebra (Tiger) crossings 106H70 7.4 Further work 107H71
Acknowledgements 108H72
8 References 109H73
Appendix A. 110H76
A.1 Local STATS19 incident textual data for the six review sites 111H76
Appendix B. Zebra diagram 112H79
Appendix C. Location maps with arrows indicating reference for direction of travel 113H80
Appendix D. Cycle flows diagrams 114H83
D.1 Hampton Court Road – Significant Cycle and pedestrian flows diagram 115H83 D.2 New Kings Road – Significant Cycle and pedestrian flows diagram 116H84 D.3 Pall Mall – Significant Cycle and pedestrian flows diagram 117H85 D.4 South Carriage Drive (Hyde Park) – Significant Cyclist and Pedestrians flows map 118H86 D.5 St Georges Circus - Significant Cycle and pedestrian flows diagram 119H87 D.6 Wandsworth Bridge Road - – Significant Cycle and pedestrian flows diagram 120H88
Appendix E. Accepted and Rejected localised STATS19 data at each location 121H89
Appendix F. Video data and conflict analysis instructions 122H90

TRL Limited UPR/T/035/06
Appendix G. Design Considerations 123H94
TRL Limited i UPR/T/035/
Unpublished Project Report Version: Final
Executive summary
Background
Walking and cycling are important sustainable modes of transport in London and are addressed by Transport for London in conjunction with the London Boroughs. The Cycling Centre of Excellence (CCE) is responsible for the facilitation and promotion of cycling in the area in line with the Mayor’s Transport Policy.
Purpose of Study
TfL CCE had been made aware of the existing use of Zebra crossings in some locations by cyclists, an action which is proscribed in the Highway Code. As a result, this study was commissioned to assess the impact of this use on cyclists and other road users and allow the CCE to make an informed decision regarding the next steps towards possible expanded and authorised use of shared-use Zebra (Tiger) crossings by pedestrians and cyclists.
The concept of an authorised shared-use Zebra (Tiger) crossing has often been raised by cycle planners and engineers. Such a crossing would allow a cyclist to cross whilst mounted. This would give cyclists the time saving of Zebras without the local authority incurring the conversion costs to Toucans, if this was considered the appropriate solution. The Zebra guidance to users “to wait until traffic stops before crossing” would be the same.
This report examines the manner in which cyclists presently use Zebra crossings and recommends engineering strategies to mitigate any safety concerns should cyclists be permitted to use them. The report also examines the legal framework surrounding crossings and suggests the changes that might prove necessary to enable a shared-use Zebra (Tiger) crossing type be implemented.
Methodology
The methodology involved an assessment of current literature and law, video analysis of six study sites for conflict analysis, and examination of STATS19 data to examine the causes behind collisions. This allowed the identification of risky behaviours and suggestions as to how these risks could be minimised through engineering in a shared-use Zebra (Tiger) crossing and how this might require legal change.
Legality
The law as it stands does not give cyclists precedence over other vehicles when riding across Zebra crossings, although pedestrians do have precedence in this circumstance. As cycles are technically vehicles they should give precedence to pedestrians at crossings. Cyclists are not prohibited from riding on the part of the crossing that consists of part of the carriageway. However, cyclists who do ride across and are involved in a collision risk being challenged in the courts under a charge of riding dangerously. In addition if the footway on either side of the crossing does not allow for cyclist use then they shall be guilty of the offence of using a vehicle on a footway. Therefore necessary changes to give cyclists similar rights to pedestrians would be to convert the adjacent footways to shared use (and legislation already exists to allow this), and changes to Regulations to give cyclists priority over other vehicles at Zebra crossings. In addition, appropriate signing would need to be agreed by the Department for Transport. Using existing laws, a shared-use crossing could be implemented however cyclists would not have precedence over other vehicles. The local highway authority may be held liable should the design of a shared-use Zebra (Tiger) crossing lead a cyclist to reasonably conclude that they did have precedence leading to an incident.
Costs
Existing controlled carriageway crossings for cyclists use either Toucan or parallel segregated controlled crossing, both require extensive resources of space and capital, and involve ongoing revenue maintenance over and above Zebra crossings due to the controlled signalling involved.
TRL Limited ii UPR/T/035/
Unpublished Project Report Version: Final
Safety Concerns
Key concerns involve the safety of cyclists being involved in conflict situations with vehicular traffic, other cyclists, and pedestrians (especially mobility impaired people), and the primary research in this report investigated this at six different sites around London. The reasons and circumstances behind observed and reported cases of conflict were investigated to identify behaviours (of all involved users) and designs which contribute towards conflict. The elimination of these risky behaviours and designs may help contribute towards a shared-use (Tiger) crossing design which decreases risk to a level similar to that of signalised crossings.
Conflict Research Findings
The findings from the primary research via video data collection from six Zebra sites conclude with practical recommendations for engineering strategies to reduce observed risky behaviours.
The research found that in practice, 87.8% of cyclists at the observed sites presently ride over some or the whole of a Zebra crossing. In total there were 1686 cyclists observed, of which 4 were involved in a level of conflict classed as emergency, no collisions were observed.
Typical hazards related to riding across the crossing may be reduced by careful designs which limit certain behaviours although this may not be appropriate or viable at some locations. Routes which run adjacent to crossings and require cyclists to look behind them before crossing were particularly risky (perhaps due to the difficulty in assessing vehicles coming from behind), as was the blocking of crossings by queuing vehicles which encourage cyclists to weave through them. Vehicles blocking crossings tended to be more prevalent near to junctions and roundabouts. It is an offence for vehicles to stop within the limits of a crossing.
Central reservations provided at existing Zebra crossings are often too small to readily accommodate a cycle. Design standards for disabled users at central reservations should also be suitable for cycle users, and the crossings themselves and approaches to crossings for crossing users should be of sufficient size to accommodate shared use. Crossings for cycle use may benefit from designs which allow adequate time for conflict assessment and avoidance, and this is probably dependent upon cyclist visibility splays. It was found that cyclists tend to avoid high kerbs, this may prove useful in discouraging cyclists from certain risky movements.
Conflict with pedestrians at the observed study sites was generally of a low quantity and level, but increased slightly at crossings with constricted space layouts. Nothing was noted to suggest that existing guidance on shared use areas would prove inadequate. Generally, Zebra crossings were only slightly more risky than Pelican/Toucan/Puffin crossings from analysed STATS19 data.
Recommendations
Given the present high use of Zebra crossings by cyclists, it might be considered that the formalisation of their use, coupled with modifications to reduce risk concerns, would not result in extra risk. However some questions still remain before considering monitored pilot studies. At present it is likely that many cyclists are aware that their actions at Zebra crossings are in breach of the Highway Code and temper their actions accordingly (although it should be noted that this rule in the Highway Code has no statutory backing). Similarly the reactions of cyclists to signing requesting them to stop and look before crossing (as suggested by the CCE) are unknown. Conferring priority to cyclists may alter their actions and a test of this is required.
The reaction and attitude of other groups are also unknown, this includes pedestrians, mobility impaired people, and motorists. In particular motorists may be unaware of a change which confers priority to cyclists and thus fail to stop. It is the suggestion of the Cycling Centre of Excellence that shared-use Zebra (Tiger) crossings would include clear signing for vehicles, with a distinctive marking system for the crossing.
TRL Limited 1 UPR/T/035/06
Unpublished Project Report Version: Final
1 Introduction
Cycling is playing an increasingly important role in London’s transportation system and is recognised to be a sustainable and desirable form of transport in the Mayor’s Transport Strategy (2001). Therefore, it is of key importance that effective facilities are provided for cyclists to contribute towards the Strategy’s health and sustainable travel aims.
In some locations there was considerable anecdotal evidence which suggests that use of Zebra crossings by mounted cyclists occurs without apparent significant problems. In light of this, Transport for London (TfL) commissioned TRL to evaluate the potential use of Zebra crossings by cyclists. At present, Zebra crossings only confer a legal priority on the pedestrian (not cyclist) at the point the pedestrian steps onto the crossing.
Current Highway Code rules imply that to use a Zebra crossing, cyclists should dismount and push their bicycle across. If there were a formalised means of easy crossing for cyclists they would potentially contribute to improvements in route performance for cyclists.
Alongside this, in practice, some Zebra crossings are in regular use by cyclists who do not dismount. There are risks associated with their use of the crossing. As a headline from a review of STATS19 casualty records, 5.7% of cycle casualties in Greater London are on a Zebra crossing.
This study will therefore assess how Zebra crossings are currently used by cyclists in order to consider the safety implications of mounted use in principle and how crossings may be best designed to encourage safe behaviour by all users. The study will primarily focus upon identified conflicts involving cyclists at selected Zebra crossing sites in Greater London.
A shared Zebra crossing for use by pedestrians and cyclists has been nominally termed a ‘Tiger crossing’.
This report is set out as follows:
Chapter 2 – Methodology
Chapter 3 – Literature review
Chapter 4 – Collision data analysis
Chapter 5 – Observational research analysis
Chapter 6 – Discussion
Chapter 7 – Conclusions and recommendations
TRL Limited 2 UPR/T/035/06
Unpublished Project Report Version: Final
2 Methodology
2.1 Introduction
This chapter outlines the methodology used for this research study. In order to assess whether there are specific safety concerns associated with the use of Zebra crossings by cyclists and to address potential design issues, a number of components for the method were identified:
• Literature review of current regulation, design principles and research evidence
• Analysis of STATS19 data to evaluate reported collisions
• Observational research of identified conflicts involving cyclists at selected Zebra crossing sites
For each component of the project, key research questions have been identified from Transport for London’s brief to structure the research process. The following outlines each aspect of the methodology.
2.2 Literature review
Much of the secondary data for this study comes from existing literature, in particular government documents. It is useful to reprise literature in relation to the key questions set in Section 2.5 and a mixture of known reports and those found via the IRRD database, internet searches, and TRL’s internal Knowledge Base system. Other secondary data is found in the STATS19 national and local databases. The literature review for this study aims to gain an understanding and appreciation of the following:
2.2.1 Regulation
To understand the actions that would have to be undertaken to enable cyclists to use Zebra (Tiger) crossings, this report investigates the legal and regulatory frameworks governing the use of Zebra crossings. The various Acts of Parliament and any legal precedence made will determine the legal standing of the various crossing types and any problems that have arisen from their definition.
2.2.2 Design
To evaluate existing design requirements to assist in the consideration of design alterations for shared-use Zebra (Tiger) crossings, the report has reviewed appropriate Traffic Advisory Leaflets, the appropriate LTNs on pedestrian crossing provision and the Design Manual for Roads and Bridges to research the current guidelines.
2.2.3 Research evidence
TRL have also evaluated many similar studies that have been undertaken on different types of crossing which may be pertinent to this research.
2.3 Analysis of STATS19 data
TRL holds a copy of the national STATS19 database, which is the national register of all Police reported injury road incidents in England. Data from recorded casualties involving cyclists on Zebra crossings has been extracted for five years 2000-04 inclusive and used, where feasible, to identify possible trends and any other contributory factors in patterns of cycle casualties. Cyclist casualties on other types of crossing have also been extracted from the national data.

TRL Limited 3 UPR/T/035/06
Unpublished Project Report Version: Final
2.3.1 Reported collisions
In addition to the video analysis undertaken at each the six sites, TRL also reviewed the STATS19 database for any reported collisions, in the last three years, involving cyclists at these sites.
2.3.2 Additional collision research
The original research found the relative risk rates between cyclists and pedestrians at the studied Zebra crossings. Additional research was commissioned to put the findings into context with other types of crossing. This used STATS19 data for London and Great Britain for pedestrian and cyclist reported collisions at Pelican/Toucan/Puffin (they are grouped together in STATS19), Zebra, Side Roads, Pedestrian Phase at traffic signal controlled junctions, and Uncontrolled crossings in comparison with relative journey number and length data from national DfT and London TfL sources. This assumed that the proportion of cyclists and pedestrians at each type of crossing was comparable.
2.4 Observational research
To research and evaluate conflicts involving cyclists at Zebra crossings, the project methodology involved video observation at six Zebra crossings in the Greater London area. This enabled an appreciation of the level and type of conflicts involving cyclists at these types of pedestrian crossing and the reasons for conflicts occurring. This enabled a detailed understanding of the safety implications and design issues associated with the possibility of enabling cyclists to use shared-use Zebra (Tiger) crossings. The following outlines the site selection process.
2.4.1 Site Selection
Many sites were offered by various London Boroughs for inclusion in the study and those with an anecdotally high level of cyclists were put forward for selection by TfL to TRL. Within the budget available for this project, TRL were able to observe six sites in Greater London with one day’s video footage. The chosen sites were chosen for proximity to;
• Road mid-link • Roundabout • Junction
In addition sites were chosen that (where information was known);
• Have the potential for a large number of cyclists • Were preferably on the London Cycle Network • Had the potential to be altered to a design to accommodate cyclists • Had not fundamentally been altered within the last 5 years (so that comparative local
STATS19 data could be examined) • Offered the opportunity for video analysis, and existing night-time lighting • Had a range of high and low pedestrian flows • Had differing numbers of traffic lanes
All Zebra crossings were on roads that have a 30mph speed limit. The six chosen sites (in no particular order) were;
• South Carriage Drive near Hyde Park Corner underground station • New Kings Road near Peterborough Road. • Wandsworth Bridge Road where it is crossed by Hugon Road • Hampton Court Road, west of Kingston Bridge • Pall Mall western Zebra crossing were it crosses Waterloo Place • St Georges Circus roundabout, London Road
TRL Limited 4 UPR/T/035/06
Unpublished Project Report Version: Final
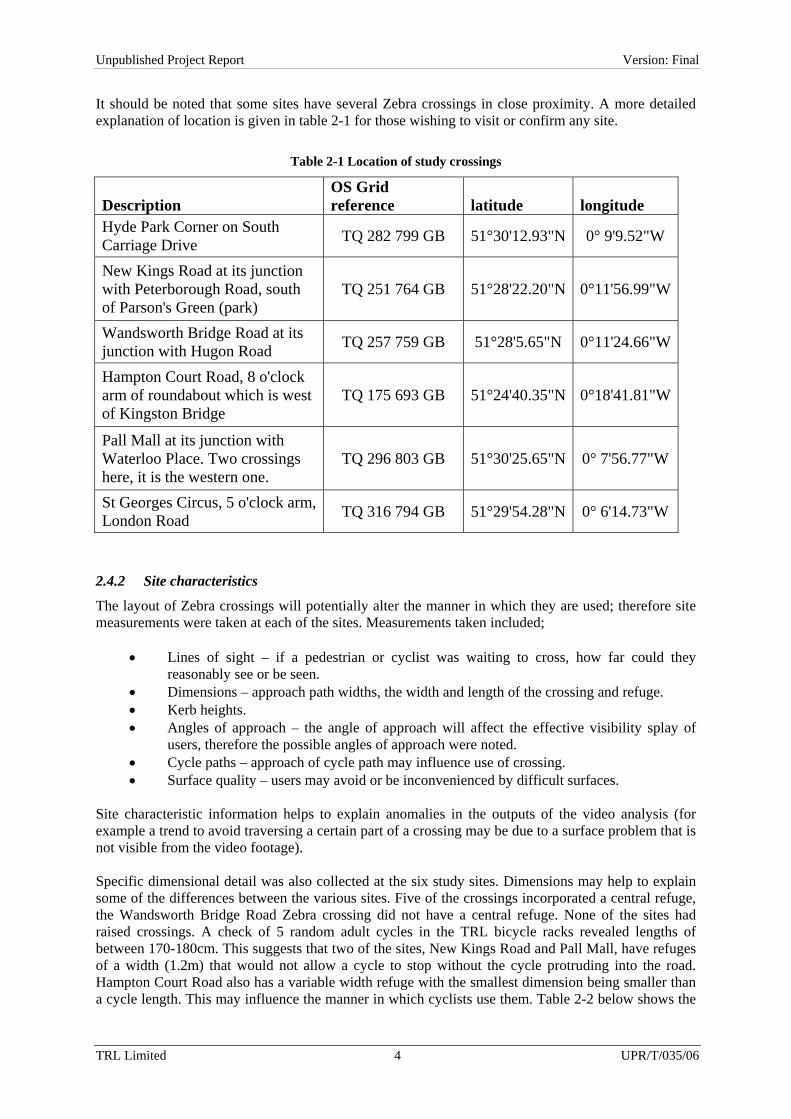
It should be noted that some sites have several Zebra crossings in close proximity. A more detailed explanation of location is given in table 2-1 for those wishing to visit or confirm any site.
Table 2-1 Location of study crossings
Description OS Grid reference latitude longitude
Hyde Park Corner on South Carriage Drive TQ 282 799 GB 51°30'12.93"N 0° 9'9.52"W
New Kings Road at its junction with Peterborough Road, south of Parson's Green (park)
TQ 251 764 GB 51°28'22.20"N 0°11'56.99"W
Wandsworth Bridge Road at its junction with Hugon Road TQ 257 759 GB 51°28'5.65"N 0°11'24.66"W
Hampton Court Road, 8 o'clock arm of roundabout which is west of Kingston Bridge
TQ 175 693 GB 51°24'40.35"N 0°18'41.81"W
Pall Mall at its junction with Waterloo Place. Two crossings here, it is the western one.
TQ 296 803 GB 51°30'25.65"N 0° 7'56.77"W
St Georges Circus, 5 o'clock arm, London Road TQ 316 794 GB 51°29'54.28"N 0° 6'14.73"W
2.4.2 Site characteristics
The layout of Zebra crossings will potentially alter the manner in which they are used; therefore site measurements were taken at each of the sites. Measurements taken included;
• Lines of sight – if a pedestrian or cyclist was waiting to cross, how far could they reasonably see or be seen.
• Dimensions – approach path widths, the width and length of the crossing and refuge. • Kerb heights. • Angles of approach – the angle of approach will affect the effective visibility splay of
users, therefore the possible angles of approach were noted. • Cycle paths – approach of cycle path may influence use of crossing. • Surface quality – users may avoid or be inconvenienced by difficult surfaces.
Site characteristic information helps to explain anomalies in the outputs of the video analysis (for example a trend to avoid traversing a certain part of a crossing may be due to a surface problem that is not visible from the video footage). Specific dimensional detail was also collected at the six study sites. Dimensions may help to explain some of the differences between the various sites. Five of the crossings incorporated a central refuge, the Wandsworth Bridge Road Zebra crossing did not have a central refuge. None of the sites had raised crossings. A check of 5 random adult cycles in the TRL bicycle racks revealed lengths of between 170-180cm. This suggests that two of the sites, New Kings Road and Pall Mall, have refuges of a width (1.2m) that would not allow a cycle to stop without the cycle protruding into the road. Hampton Court Road also has a variable width refuge with the smallest dimension being smaller than a cycle length. This may influence the manner in which cyclists use them. Table 2-2 below shows the
TRL Limited 5 UPR/T/035/06
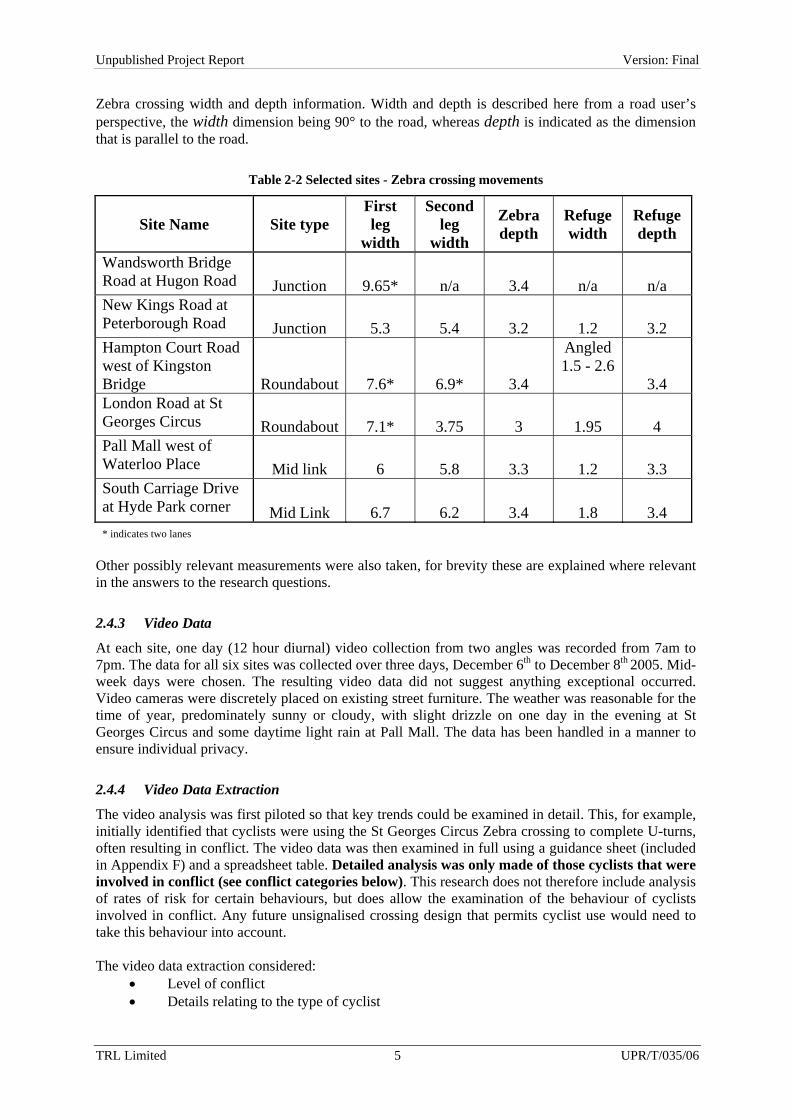
Unpublished Project Report Version: Final
Zebra crossing width and depth information. Width and depth is described here from a road user’s perspective, the width dimension being 90° to the road, whereas depth is indicated as the dimension that is parallel to the road.
Table 2-2 Selected sites - Zebra crossing movements
Site Name Site type First leg
width
Second leg
width
Zebra depth
Refuge width
Refuge depth
Wandsworth Bridge Road at Hugon Road Junction 9.65* n/a 3.4 n/a n/a New Kings Road at Peterborough Road Junction 5.3 5.4 3.2 1.2 3.2 Hampton Court Road west of Kingston Bridge Roundabout 7.6* 6.9* 3.4
Angled 1.5 - 2.6
3.4 London Road at St Georges Circus Roundabout 7.1* 3.75 3 1.95 4 Pall Mall west of Waterloo Place Mid link 6 5.8 3.3 1.2 3.3 South Carriage Drive at Hyde Park corner Mid Link 6.7 6.2 3.4 1.8 3.4 * indicates two lanes
Other possibly relevant measurements were also taken, for brevity these are explained where relevant in the answers to the research questions.
2.4.3 Video Data
At each site, one day (12 hour diurnal) video collection from two angles was recorded from 7am to 7pm. The data for all six sites was collected over three days, December 6th to December 8th 2005. Mid-week days were chosen. The resulting video data did not suggest anything exceptional occurred. Video cameras were discretely placed on existing street furniture. The weather was reasonable for the time of year, predominately sunny or cloudy, with slight drizzle on one day in the evening at St Georges Circus and some daytime light rain at Pall Mall. The data has been handled in a manner to ensure individual privacy.
2.4.4 Video Data Extraction
The video analysis was first piloted so that key trends could be examined in detail. This, for example, initially identified that cyclists were using the St Georges Circus Zebra crossing to complete U-turns, often resulting in conflict. The video data was then examined in full using a guidance sheet (included in Appendix F) and a spreadsheet table. Detailed analysis was only made of those cyclists that were involved in conflict (see conflict categories below). This research does not therefore include analysis of rates of risk for certain behaviours, but does allow the examination of the behaviour of cyclists involved in conflict. Any future unsignalised crossing design that permits cyclist use would need to take this behaviour into account. The video data extraction considered:
• Level of conflict • Details relating to the type of cyclist
TRL Limited 6 UPR/T/035/06
Unpublished Project Report Version: Final
• Details relating to any other party involved in the conflict (vehicles, pedestrians) • Relevant pedestrians in the area (especially those people with limited mobility) • Manner of approach and crossing • Approximate speeds involved • Textual explanation of events
2.4.5 Conflict categories
To evaluate the level of conflict, a 5 point scale was applied to all incidents involving cyclists as shown below. For brevity, the italicised bold wording used at the end of the descriptions is used in the tables of data within the report. Conflict categories: 0 = Discomfort that might be caused to a party typically by close proximity, higher speeds, or
unreliable movement, therefore is subjective. Discomfort. 1 = Precautionary or anticipatory braking or directional change when risk of collision is minimal.
Precaution. 2 = Controlled braking or directional change to avoid collision (but with ample time for manoeuvre).
Controlled. 3 = Sudden emergency actions (such as hard braking or turning) to avoid collision or a near miss.
Emergency. 4 = Collision. Collision. To provide greater context to the evaluation of observed conflicts at each site, the video analysis also involved the collection of the following information:
• Number of cyclists using the Zebra crossing per site • The general pedestrian flow sampled from five minutes per hour of footage per site
2.5 Research Questions Based upon TfL’s requirements in their brief and the methodology produced by TRL, the following research questions were collated for this study by TRL in collaboration with TfL.
2.5.1 Literature Review Research Questions
Regulatory research questions;
1. What is the legal standing of the various crossing types?
2. What are the legal and regulatory frameworks governing the use of Zebra crossings?
3. Are there any problems that have arisen from the definition of use of various crossing types?
Design research questions;
4. What guidance is provided on the various design standards of pedestrian crossing provision?
5. What relevant guidance is provided on the various design standards for cycle paths?
Research evidence;
6. What are the key findings from similar research on different types of crossing (particularly Zebra crossings)?

TRL Limited 7 UPR/T/035/06
Unpublished Project Report Version: Final
2.5.2 Video Analysis Research Questions
1. What is the rate and severity of conflicts involving cyclists using Zebra crossings across the
sites?
2. What is the number of conflicts across sites between cyclists and pedestrians, cyclists and cyclists and cyclists and vehicles?
3. How do the identified cases of conflict (serious and minor) occur? Are there any similarities between conflicts at each site/ across particular types of site? e.g. the way the cyclist approaches, the presence of pedestrians etc.
4. How do the reported cases of collisions compare with the cases of conflict (numbers and descriptions) for each site and across sites?
5. Is there a relationship between the speed of cyclists on approach (in conflict situations) and the level of conflict?
6. Is there a relationship between the speed of cyclists traversing the crossing and the level of conflict / presence of pedestrians?
7. Is there any relationship between site geometry (and visibility splay) at each site and the number of conflicts and number of collisions?
8. Is there a relationship between the number of collisions / conflicts and the position of the Zebra along the link?
9. Is there a variation in the rate and severity of collisions / conflicts and the time of day e.g. peak / off peak, daylight / after dark?
10. Is there a relationship between the number of collisions / conflicts and the number and type of pedestrians using the crossing?
The following chapter details the literature review undertaken for this research study.

TRL Limited 8 UPR/T/035/06
Unpublished Project Report Version: Final
3 Literature Review
3.1 Introduction
This review aims to provide an initial insight into the use of Zebra crossings by cyclists. This may lead to an assessment of the criteria for potentially implementing a shared pedestrian and cycle crossing type based on existing Zebra crossings. This type of shared facility would allow cyclists to cross shared-use Zebra (Tiger) crossings without dismounting. This literature review will identify legal and regulatory frameworks concerning crossings, design guidance on crossings, and past research into the use of pedestrian crossings. The following sections will look at each of these aspects, will inform the findings of the video surveys and will assist in the identification of advantages and disadvantages to the implementation of a shared-use Zebra (Tiger) crossing facility. Details from the literature review helped in better understanding the issues involved at six existing Zebra crossings which were being used by cyclists to cross. Literature was found in the various research databases and from existing knowledge, this was read to identify key points and discard irrelevant texts. The literature was then fully reviewed with reference to the methodology questions. There are a variety of crossing types, all designed for different user types and situations. Table 3-1 is a breakdown of the various types and their characteristics and was compiled by traffic specialists at TRL;
Table 3-1 Crossing types
Name User Construction Advantages Disadvantages Zebra Pedestrians Simple, white
markings and Belisha poles.
• Allows pedestrians to cross once vehicles have come to a stop, therefore potentially more responsive and quicker for pedestrians on low-trafficked roads. • Relatively low cost of installation and maintenance.
• Only allows use by pedestrians • Unsuitable for faster roads • Reliant upon drivers seeing waiting pedestrians and stopping • Can cause traffic congestion when usage is high.
Pelican crossings
Pedestrians Uses push-button signalling demand for pedestrians, road users are controlled by red amber green lights.
• Allows pedestrians to force a break in the traffic by pushing a button • Can be part of a linked traffic light system.
• Can delay traffic in critical areas • Pedestrian aspects are on far side of crossing which may be difficult to see by partially sighted pedestrians • More expensive to install and maintain signalling than Zebras • The time taken for signals to change in favour of waiting pedestrians may be too long.
TRL Limited 9 UPR/T/035/06
Unpublished Project Report Version: Final
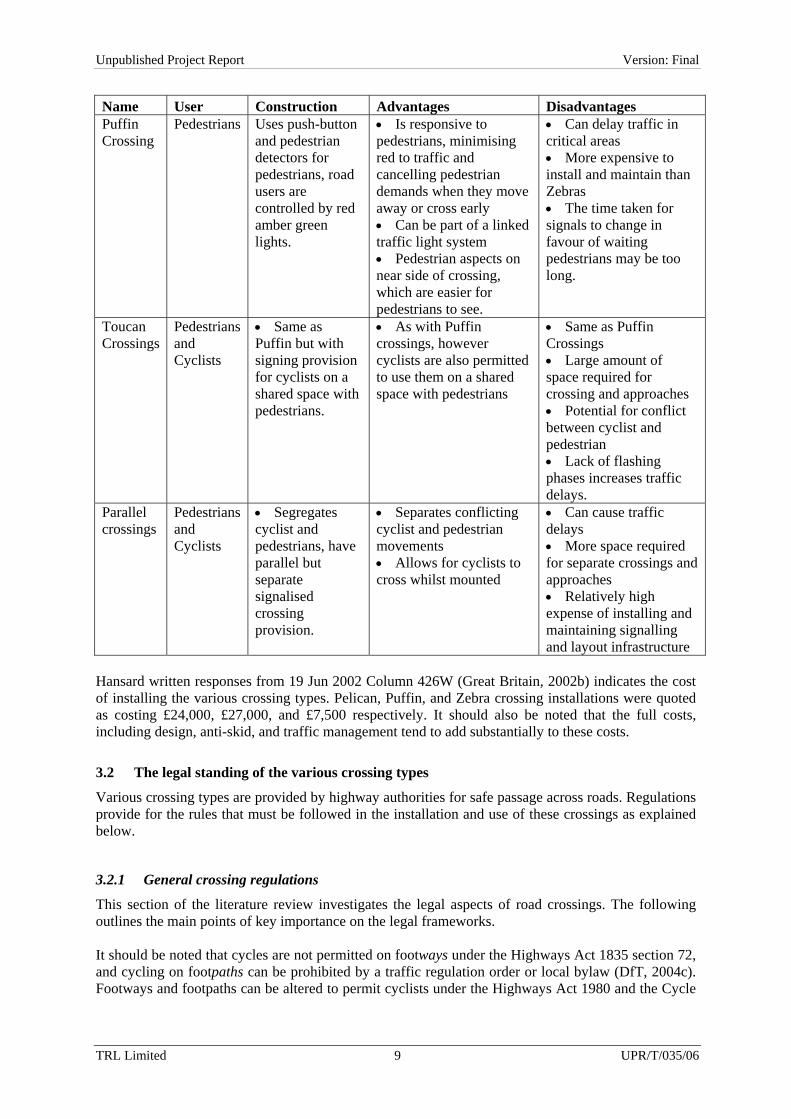
Name User Construction Advantages Disadvantages Puffin Crossing
Pedestrians Uses push-button and pedestrian detectors for pedestrians, road users are controlled by red amber green lights.
• Is responsive to pedestrians, minimising red to traffic and cancelling pedestrian demands when they move away or cross early • Can be part of a linked traffic light system • Pedestrian aspects on near side of crossing, which are easier for pedestrians to see.
• Can delay traffic in critical areas • More expensive to install and maintain than Zebras • The time taken for signals to change in favour of waiting pedestrians may be too long.
Toucan Crossings
Pedestrians and Cyclists
• Same as Puffin but with signing provision for cyclists on a shared space with pedestrians.
• As with Puffin crossings, however cyclists are also permitted to use them on a shared space with pedestrians
• Same as Puffin Crossings • Large amount of space required for crossing and approaches • Potential for conflict between cyclist and pedestrian • Lack of flashing phases increases traffic delays.
Parallel crossings
Pedestrians and Cyclists
• Segregates cyclist and pedestrians, have parallel but separate signalised crossing provision.
• Separates conflicting cyclist and pedestrian movements • Allows for cyclists to cross whilst mounted
• Can cause traffic delays • More space required for separate crossings and approaches • Relatively high expense of installing and maintaining signalling and layout infrastructure
Hansard written responses from 19 Jun 2002 Column 426W (Great Britain, 2002b) indicates the cost of installing the various crossing types. Pelican, Puffin, and Zebra crossing installations were quoted as costing £24,000, £27,000, and £7,500 respectively. It should also be noted that the full costs, including design, anti-skid, and traffic management tend to add substantially to these costs.
3.2 The legal standing of the various crossing types
Various crossing types are provided by highway authorities for safe passage across roads. Regulations provide for the rules that must be followed in the installation and use of these crossings as explained below.
3.2.1 General crossing regulations
This section of the literature review investigates the legal aspects of road crossings. The following outlines the main points of key importance on the legal frameworks. It should be noted that cycles are not permitted on footways under the Highways Act 1835 section 72, and cycling on footpaths can be prohibited by a traffic regulation order or local bylaw (DfT, 2004c). Footways and footpaths can be altered to permit cyclists under the Highways Act 1980 and the Cycle

TRL Limited 10 UPR/T/035/06
Unpublished Project Report Version: Final
Tracks Act 1984 respectively. The 1835 Act referred to carriages, and cycles were classified as a carriage under the Local Government Act 1888. The Zebra, Pelican and Puffin Pedestrian Crossings Regulations and General Directions (1997) give direction on the regulatory frameworks surrounding crossings in accordance with Section 25 of the Road Traffic Regulation Act 1984. The Regulations include: -
• Regulation 18 - Prohibition against the stopping of vehicles on crossings. • Regulation 19 – Pedestrians should not delay when crossing. • Regulation 20 - Prohibition against the stopping of vehicles in controlled areas (not including
a pedal bicycle with or without motor or side car). • Exceptions to regulation 20 - Regulation 20 does not prohibit the driver of a vehicle from
stopping in certain situations. • Regulation 24 - Prohibition against vehicles overtaking at crossings • Regulation 25 – Precedence of pedestrians over vehicles at Zebra crossings.
These regulations aim to ensure that pedestrian safety is maintained upon the various crossing types, whilst not restricting flows of vehicular traffic. Any shared-use Zebra (Tiger) crossing is likely to be defined in an amended version of The Zebra, Pelican and Puffin Pedestrian Crossings Regulations and General Directions (1997). Due to differences in interpretation of law, legal advice was taken from TfL’s corporate lawyers who noted that;
1. Cyclists should dismount when crossing zebra crossings, as they are advised in the Highway Code (Rule 64), even when approaching the zebra crossing from a shared use (pedestrian/cycle) path.
2. Cycling across a zebra crossing is not in itself unlawful, as the crossing forms part of the carriageway. However, cyclists who fail to dismount will be unlawfully riding on the footway as they enter and exit the crossing (unless the area of footway concerned is a shared footway and cycleway).
3. Even when the crossing is approached and exited via a shared use path problems arise if cyclists do not dismount.
4. Precedence is only given to “pedestrians” over vehicles at zebra crossings. Vehicles are not obliged to stop to allow a cyclist who has not dismounted from his bicycle to cross at a zebra crossing.
5. As a cycle is a ‘vehicle’ and pedestrians are to be given precedence over vehicles at zebra crossings, a cyclist who has not dismounted is required to give precedence to any pedestrians using the crossing at the same time. Failure to do so would constitute an offence under s25 Road Traffic Regulation Act 1984.
6. Should a cyclist be involved in an accident while riding over a zebra crossing: • the fact that he has acted in contravention of Rule 64 can be presented in court as evidence that
he was riding dangerously and thus guilty of an offence under s28 Road Traffic Act 1988; and • his failure to comply with the Highway Code also makes it more likely that he would be found
liable in the civil courts for any injury caused. 7. Rule 64 of the Highway Code states that pedestrians should not ride across a pelican, puffin
or zebra crossing. This rule itself does not have statutory backing, but other statutory provisions mean that cyclists who do ride across zebra crossings may be acting unlawfully.
8. It is unlawful to cycle on the footway. Rule 54 of the Highway Code states that: “you MUST NOT cycle on the pavement”. This rule is given statutory force by s72 of the Highways Act 1835 and s85 Local Government Act 1888. The offence of riding a bicycle on the footway incurs a fine at level 2 on the standard scale.

TRL Limited 11 UPR/T/035/06
Unpublished Project Report Version: Final
9. Regulation 25 of the Zebra, Pelican, and Puffin Pedestrian Crossing Regulations 1997 (SI1997/2400) provides that pedestrians have precedence over vehicles at zebra crossings. A person riding a bicycle is not a pedestrian and so the drivers of vehicles are not required to stop to allow a cyclist to cross the crossing.
10. Under s28 of the Road Traffic Act 1988, a person who rides a cycle on a road dangerously is guilty of an offence. A person will be regarded as riding dangerously if the way in which he rides falls far below what would be expected of a competent and careful cyclist, and it would be obvious to a competent and careful cyclist that riding in that way would be dangerous. Failure to comply with the recommendations of the Highway Code (including the recommendation that cyclists should dismount and wheel their cycles over zebra crossings) may be used in evidence in any court proceedings to show that the way in which a cyclist has ridden has fallen below what would be expected of a competent and careful cyclist (s38 Road Traffic Act 1988).
This suggests that, provided that the adjacent footways allow cycle use, and that they give way to pedestrians, cyclists are not breaking the law by riding across a Zebra crossing. Cyclists do not have precedence over other vehicles at Zebra crossings. The provision for experimental traffic orders in The Road Traffic Regulation Act 1984 (Sections 9 and 10) may allow for the testing of shared-use Zebra (Tiger) crossings. It should be noted that there are time limits as to the length of test, and differing arrangements exist for London and outside London. The Highway Code (2004) details the basics about how pedestrians use a crossing, i.e. by pushing the button and responding to the red/green ‘man’ as appropriate. In the case of Zebra crossings they are required to wait on the footway for oncoming traffic to stop before attempting to cross. Regarding rules for cyclists, the code states “Do not ride across a pelican, puffin or zebra crossing. Dismount and wheel your cycle across”. The code makes an exception for Toucan crossings (and cycle only crossings) which are defined and it is noted that cyclists may ride across them. In relation to Zebra crossings in particular it is stated that drivers must look out for people waiting to cross and be ready to slow down or stop to let them cross. They must not fail to give way to pedestrians, and should take all of the standard precautions, such as allowing more time for stopping on wet or icy roads. Provisions for vehicles at crossings are more detailed. It is stated that when queuing in traffic the crossing should be kept clear, and that it is forbidden to park on a crossing or in the area covered by the zigzag lines. It is also not permitted for a vehicle to overtake the vehicle nearest the crossing within the zigzags, whether it is moving or stationery.
3.2.2 Zebra crossings
Zebra crossing Regulations offer pedestrians priority to cross a road (The Zebra, Pelican and Puffin Pedestrian Crossings Regulations and General Directions 1997) on an unsignalised crossing. The legal precedence of the pedestrian over road traffic is established as they set foot upon a crossing; at which point traffic should show deference and wait until pedestrians have negotiated the crossing. The Zebra, Pelican and Puffin Pedestrian Crossings Regulations and General Directions (1997) clarify the situation in Regulation 25: -
• Regulation 25 - Every pedestrian, if he is on the carriageway within the limits of a Zebra crossing, which is not for the time being controlled by a constable in uniform or traffic warden, before any part of a vehicle has entered those limits, shall have precedence within those limits over that vehicle and the driver of the vehicle shall accord such precedence to any such pedestrian.
Problems stemming from Zebra crossing use concern pedestrians that may feel intimidated by the flow of traffic, especially if it has a fast moving flow. Conversely motorists may be delayed as

TRL Limited 12 UPR/T/035/06
Unpublished Project Report Version: Final
pedestrians use the crossing intermittently. There is some variation in advice regarding the appropriateness of a Zebra crossing of a particular road in the guidance contained in LTN1/95 where it states: -
“Zebra Pedestrian Crossings (Zebra Crossings) provide pedestrian crossing points on roads carrying significant amounts of traffic;”
yet later it is suggested that;
“Where a crossing is thought necessary but crossing flows are relatively low and traffic flows are no more than moderate, then a Zebra crossing may be suitable.”
Zebra crossings are suited to lower road speeds and may be inappropriate for many roads (DfT, 1995a, section 4.2.3).
3.2.3 Toucan crossings
The Toucan (two can cross) crossing is designed to be a signalised shared crossing for pedestrians and cyclists, with the same form of pedestrian or cyclist on-crossing detector as the Puffin crossing. Toucan crossings, unlike Zebra crossings, permit the crossing of mounted cyclists. The other fundamental difference is that Toucan crossings are signalised which can result in a delay to crossing and can impact upon traffic management, whilst Zebra crossings are not signalised and require the judgement of the user to cross judiciously. Further details can be found in Local Transport Note 2/95 (DfT, 1995b).
3.2.4 Puffin Crossings
The Puffin Crossing (Pedestrian User Friendly Intelligent Crossing) is a development of the Pelican crossing and so is classed as a ‘Signalised Crossing.’ It has automatic detection of pedestrians to extend or reduce the all-red period as required to suit the crossing speed of the pedestrian. As well as on-crossing detectors, kerbside detectors can cancel a pedestrian demand if the pedestrian walks away from the crossing point, perhaps having crossed the road in a gap in traffic. Further details can be found in Local Transport Note 2/95 (DfT, 1995b).
3.2.5 Parallel cycle and pedestrian crossings
These crossings are normally used where there is high demand by cyclists and/or pedestrians, thus reducing potential conflicts between the two modes of crossing. They are also useful where the cyclists are approaching from a different direction to the pedestrians. As a result they are often preferable to Toucans, however they are non-standard and may be more expensive than Toucans e.g. if they need more poles. (LCDS, 2005) Currently cyclists can ride across ‘Toucan’ crossings and parallel cycle and pedestrian crossings. For all other controlled crossings (Zebra, Pelican, and Puffin) the Highway Code suggests they dismount to cross. Cyclists effectively become pedestrians and must conform to the requirements set out above.
3.3 What are the legal and regulatory frameworks governing the use of Zebra crossings?
This section of the literature review outlines the legal and regulatory frameworks that must be employed by Local Authorities in the implementation of Zebra crossings. This may have a bearing upon the processes necessary for implementing shared-use Zebra (Tiger) crossings. Local authorities are legally required to adhere to government regulations on the design and appropriateness of Zebra crossings. Regulations were devised in the ‘Zebra’ Pedestrian Crossings Regulations 1971’ and amended in ‘Zebra’ Pedestrian Crossings (amendment) Regulations 1990’.
TRL Limited 13 UPR/T/035/06
Unpublished Project Report Version: Final
Subsequent statutory instruments are included in ‘The Zebra, Pelican and Puffin Pedestrian Crossings Regulations and General Directions 1997.’ This document revokes the previous regulations and outlines the necessary traffic signs and roads markings to indicate Zebra crossings and Zebra controlled areas.
3.3.1 Installation procedure for local authorities
Consultation with the police, public notice and written notification to the Secretary of State are necessary before installing or altering a crossing, or removing an existing crossing (DfT, 2003). Care should be taken to note the difference between Law and Regulations which must be followed as opposed to guidance which is best practice advice from the issuing authority and is not enforceable. Zebra crossings should comply with the DfT’s Local Transport Notes 1/95 and 2/95 guidance which cover all aspects of the assessment and design of pedestrian crossings. As with all types of pedestrian facility local authorities also refer to the DfT’s 2002 document ‘Inclusive Mobility – a guide to best practice on access to pedestrian and transport infrastructure.’ If these guidelines are complied with then it will ensure that the criteria to meet the Disability Discrimination Act 1995 are fulfilled. Reference should also be made to the Land Compensation Act 1973 to ensure that there will be no conflicts. Local Authorities do not have the power to establish crossings on Trunk Roads (Road Traffic Regulation Act 1984). Along with compliance with the Local Transport Notes and statutory requirements the Design Manual for Roads and Bridges (DMRB) volume 8 section 5 recommends that the potential site should also be assessed to determine the degree of conflict between pedestrians and vehicles, with consideration also being given to established or popular pedestrian routes. The procedure for establishing that a crossing should be installed is a site assessment resulting in an assessment framework. Framework documents should incorporate site information, photographs, maps, and any other associated information. The outcome of this procedure will determine the crossing type (LTN 1/95). The Traffic Signs Regulations and General Directions 2002 (Great Britain, 2002a) details the current legally enforceable traffic signs and road markings. The document covers standards relating to the manufacture of signs and provides guidance in relation to road layouts. These Regulations replace the 1994 Traffic Signs Regulations and General Directions Regulations and prescribe the traffic signs and road markings to be used on public roads. The Regulations are also the legal basis for prosecutions for offences involving signs, traffic signals and markings. These standards were legally enforceable from 31st January 2003. The London Cycling Design Standards outlines the principles, guidance and standards for design to reduce barriers to cycling in order to support road safety targets and encourage cycling in London. The document covers areas such as the procedures involved in developing a scheme (in chapter 2), associated traffic management, cycle facilities and signs and markings. The standards cover a wide range of aspects relating to cycling as they are aimed at designers of all infrastructure that cyclists will use or that will affect cyclists.
3.3.2 Signing : Legal Framework
The Traffic Signs Regulations and General Directions (Great Britain, 2002a) revokes ‘The Traffic Signs Regulations 1994[4]’ and the ‘Traffic Signs (Amendment) Regulations 1995[5]’. This document details the legal requirements for signs and markings at pedestrian and cycle crossings. For a useful overview of this guidance see chapter 6 of the London Cycling Design Standards (LCDS, 2005) which makes reference to: -
• Categories and uses of road signs
• Signs required to enforce traffic regulation orders
TRL Limited 14 UPR/T/035/06
Unpublished Project Report Version: Final
• General sign design considerations
• Sign installation and mounting
• Surface markings
• Regulatory, warning and informatory signs and markings
• Route guidance, location, and direction signing
The Traffic Signs Manual Chapter 5 (2003b) is also a relevant key text in guidance for determining suitable signing.
3.3.3 The colour, size illumination and mounting of traffic signs, globes and posts
The Zebra, Pelican and Puffin Pedestrian Crossings Regulations stipulate that traffic signs to identify the Zebra must be placed either at or near the crossing, each of which must consist of a globe. The globes must be coloured either yellow or fluorescent yellow and be between 275 and 335mm in diameter. These globes should either be illuminated by a flashing light or a constant light. When mounted the lowest part of the globe should be between 2.1 and 3.1 metres above the surface of the ground. Subject to agreement by a traffic authority a globe may also be placed on a refuge. Where the globes are located on a post the post must be coloured in alternating black and wind bands (each to be between 275 and 335mm wide). The lowest band must be black and can be up to a metre wide. These posts may be internally illuminated and can also be fitted with a backing board or similar means to increase the prominence of the post. A light may also be attached to the post to illuminate the crossing, although a device should also be attached to prevent light from shining onto adjacent premises.
3.3.4 The size and type of road markings including zigzags and give-way lines
Each zigzag should be white and can be illuminated by retro reflecting material. The number of zigzag lines can vary but should be between 8 and 18 lines of 2000mm each (further details may be found in the diagram in appendix B). Where the traffic authority gives permission, however, the number of lines may be reduced to not less than 2 with each line only having to be a metre long. In any case it is not required for one zigzag line to have the same number of lines as another zigzag line on the same crossing. On roads no more than 6 metres wide zigzag lines may be replaced by road markings as detailed in Schedule 6 of the regulations, but any roads that are wider require zigzag lines. Similar to the zigzag lines give-way lines must be coloured white, and may be illuminated by retro reflecting material. As is the case with zigzag lines the traffic authority can also give permission, where it is more practical given the layout of the road, for the angle of the give-way line in relation to, and its distance from, the edge of the crossing may be varied. The maximum distance of 3 metres between the give-way line and the limits of the crossing may also be increased to not more than 10 metres. The IHT guidelines (2000) note that the Pedestrian Crossing Regulations must be adhered to precisely as road marking mistakes often occur on zigzag areas.
3.3.5 The number and colour of studs and stripes
Studs can be provided at crossings and their number may vary. Studs can be either white, silver or light grey although it is not permissible to make them reflective. The studs must be either circular or
TRL Limited 15 UPR/T/035/06
Unpublished Project Report Version: Final
square with either a diameter or sides of between 95mm and 110mm. At their highest then the studs must not project more than 20mm above the surface of the carriageway, and at their edges then they should not project by more than 6mm. The Traffic Signs Manual chapter 5 (2003) allows for studs to be omitted from Zebra crossings. Whilst the number of studs can vary the distance from the centre of one stud to the centre of the next in the same line should not be between 250mm and 715mm. The studs should form two straight lines, and although they are not required to be at right angles to the edge of the carriageway they should be parallel to each other. The stripes on the crossing must be white and can be illuminated by retro reflecting material. If the carriageway provides a reasonable contrast with the white stripes, however, then there is no need to provide black stripes as well. Each stripe should be between 500mm and 715mm in width and be of the same size, although the first stripe at each end of the crossing can be up to 1300mm wide. Where the traffic authority consider it appropriate in terms of the carriageway then it is also permissible for stripes to be between 380mm and 840mm wide. These regulations provide detailed instructions for the legal construction of the Zebra crossing. They also draw on the general guidelines for the assessment and design of pedestrian crossings given in LTN 1/95 and LTN 2/95. These notes make recommendations for the planning designing and installation of pedestrian crossings and should be treated as guidelines only. It has been suggested that yellow stripes may help to distinguish normal Zebra crossings from shared-use Zebra (Tiger) crossings however yellow is normally associated with prohibition (such as parking lines, and hatched boxes), and as such may confuse motorists.
3.3.6 Signs
Chapters 4 and 5 of the Traffic Signs Manual (2004) provides information regarding warning signs and road markings respectively to be used at pedestrian crossings. They detail the standard sign for ‘traffic signals ahead’ (diagram 543 in the manual) – a triangular sign featuring a set of traffic lights. The term ‘traffic signals’ in this context can be used to refer to Pelican, Toucan and Puffin crossings, although not Zebra crossings. A plate, as shown in diagram 573 of the manual, should also be added to the sign where the crossing to which the sign is referring is on another road. When the sign(s) is located on a dual carriageway, the sign should be duplicated on the central reservation of the crossing. The sign detailed in diagram 544 of the Traffic Signs Manual Chapter 4 is the appropriate sign to warn drivers of a crossing. This ‘Zebra crossing ahead’ sign must not be in place for more than three months however. This sign is also not required if the two beacons installed at Zebra crossings are easily visible. Other signs which indicate that pedestrians will be crossing, such as the ‘frail or disabled pedestrians likely to cross road ahead’ (diagram 544.2), ‘children going to school or playground’ (diagram 545), or even ‘pedestrians in road ahead’ (diagram 544.1) are not required at a Zebra crossing, or indeed any other type of signalised crossing. Similarly ‘cycle route’ signs (diagram 950, depicting a bicycle) should also not be used at controlled traffic signals. It might be prudent for a temporary road sign to warn drivers of the change in use of a Zebra were a shared-use Zebra (Tiger) to be implemented. The Traffic Signs Regulations and General Directions (1994 and 2002) provide detailed guidance as to the provision of the light signals and push button components of signalised crossings, such as Zebra and Toucan crossings.

TRL Limited 16 UPR/T/035/06
Unpublished Project Report Version: Final
3.3.7 Criteria for the crossing to be classified as validly operational
For a Zebra crossing to be recognised as such it must be indicated by traffic signs either at or near the crossing and road markings that comply with the criteria outlined in the Zebra, Pelican and Puffin Pedestrian Crossings Regulations 1997. All elements of the crossing should comply with this criteria; alterations from standard should first be approved by the Secretary of State for Transport (Traffic Signs Manual, 2003).
3.4 Problems arising from the definition of use of various crossing types
Despite searches of legal conflict and other types of conflict arising from the definition and use of various crossing types, there appears to be no relevant information. This suggests that the Regulations as they stand are robust.
3.5 Guidance on the various design standards of pedestrian crossing facilities
“A key aspect of crossing design is to consider the movements of pedestrians and cyclists and reduce conflict between these modes.” (LCDS, 2005) The Design manual for Roads and Bridges (DMRB, TA 68/96) points towards Local Transport Notes 1/95 and 2/95 regarding the design and assessment of pedestrian crossings. As mentioned above, LTN 1/95 recommends the practices to be followed when planning at-grade pedestrian crossings and LTN 2/95 recommends the practices to be followed when designing and installing at-grade pedestrian crossings. Design standards from LTN 2/95 include advice on: - • Proximity to junctions:
• Approach to a side road: 20 metres for a signalised crossing or 5 metres (minimum) for a Zebra crossing
• Minor approach road: crossing should be sited away from ‘GIVEWAY’ or ‘STOP’ signs • Approach to a roundabout: Zebra crossings are preferred for pedestrians • Traffic Signal Controlled Junction: Signal controlled is often used but links with other
signalling systems should be considered.
• Visibility: Pedestrians must be able to see traffic and be visible to it. Table 3-2 sets out the desired sight lines:
Table 3-2 Visibility distances
85 percentile approach speed (to nearest 10 kph) Visibility distance
50 kph (30 mph) 70 metres
60 kph (37 mph) 95 metres
70 kph (43 mph) 125 metres
85 kph (53 mph) 165 metres
100 kph (62 mph) 225 metres
120 kph (75 mph) 300 metres

TRL Limited 17 UPR/T/035/06
Unpublished Project Report Version: Final
Source: Adapted from DMRB TA 12/81 • Crossing width: • The minimum width for Zebra, Pelican of Puffin pedestrian crossings is 2.4 metres but this can
be increased to up to 10.1 metres subject to demand and authorisation • Guard railing • Crossing approaches surfaces for footways and carriages • Facilities for disabled persons • Lighting • Signing • Provision for bus stops • Street furniture • Pedestrian refuge islands Guidance is also given specifically for Zebra crossings and signal-controlled crossings although this is superseded by The Zebra, Pelican and Puffin Pedestrian Crossings Regulations and General Directions (1997). The IHT guidelines (2000) also comment on the design of pedestrian crossing facilities with the ideal crossing facility possessing the following characteristics: • Pedestrians should feel safe – taking into account vehicle speed • Location – crossing points should coincide with pedestrian desire lines • Direction/directness of the facility • Minimal use of pedestrian barriers • Capacity to accommodate peak demand • Opportunity – crossings should respond quickly and safely to pedestrian demand
3.5.1 Pedestrian refuges
The Zebra, Pelican and Puffin Pedestrian Crossings Regulations and General Directions 1997 state that refuges on Zebra crossings are for use by pedestrians and that the section either side of the refuge should be treated as separate crossings. The only extra provision for refuges that it details is that a globe can be placed on the refuge as well as on each side of the crossing. In relation to Pelican and Puffin crossings these regulations also state that an additional traffic sign (which conforms to the regulations) may be placed on the refuge or central reservation. The 2003 Local Transport Note (The design of pedestrian crossings, LTN 2/2003) regarding the design of pedestrian crossings describes refuges as a relatively low cost way to improve crossing facilities for pedestrians. This Note stresses that refuges must have a minimum width of 1.2 metres and be ‘sufficiently large,’ i.e. if the crossing is near a school then it should be larger than the standard to accommodate the number of children that are likely to cross at the same time. In terms of safety for pedestrians the Note also states that the width of the carriageway (suggested 4 to 4.5 metres) takes into account the need for vehicles not to pass too close to the refuge. Additional safety precautions outlined include the possibility that cyclists may be overtaken alongside a refuge, which the design of the refuge needs to take into consideration, and the fact that guard railing should be considered where refuges are not located on a clear desire line. The 1995 Local Transport Note on the assessment of pedestrian crossings stipulates that pedestrian refuges may also have a positive impact on traffic calming, which is also recognised by the DfT in their 2004 report ‘Policy, Planning and Design for Walking and Cycling.’ The document lists ‘right-turn refuges’ and central refuges’ as techniques to calm traffic and ‘redistribute space.’ In this respect refuges are seen to increase perceptions of safety to pedestrians as well as reducing the likelihood that motorists will attempt to overtake cyclists, due to the reduced road width. The report also states that central refuges encourage pedestrians to cross at points where there is good visibility. The Policy,

TRL Limited 18 UPR/T/035/06
Unpublished Project Report Version: Final
Planning and Design for Walking and Cycling also note that, in respect to safety, the ‘potential for conflict between pedestrians and cyclists should be minimised.’ It does not, however, directly propose how this should be achieved although further on in the document it states that central refuges should have a width of at least two metres to safely accommodate cyclists, wheelchair users and pedestrians.
3.5.2 Summary of pedestrian crossing design standards
The important documents relating to crossing design standards are LTN 1/95 for planning at-grade pedestrian crossings and LTN 2/95 for designing and installing at-grade pedestrian crossings. Further, London-specific advice is available from the LCDS (2005) and IHT guidance, and very technical advice is available in the Design Manual for Roads and Bridges. The Zebra, Pelican and Puffin Pedestrian Crossings Regulations and General Directions (1997) supersede other guidance in relation to Zebra crossings. Key points to note include visibility distances, road speeds, dimensions, desire lines, safety, and central refuges. The standards listed in this section reveal that previous work has focussed upon a number of likely factors relevant to this study. The visibility splay of pedestrians at crossings should be at least 70 metres at 30mph roads. This is important because this 70 metres will allow time for the pedestrian and motorist to recognise each other and take appropriate action. The characteristics of pedestrians and cyclists are different in a number of ways but are likely to relate to speed, stopping distance, and the ability to move backwards (or not). This may therefore require that a longer visibility splay is required by cyclists when using the crossing. The video analysis work may reveal this if a correlation exists between visibility splay and the severity or type of conflict. Central refuges are used to split Zebra crossings into two to provide a refuge for pedestrians to wait for the other lane of traffic to stop. These refuges are often around 1.2m in width which may provide adequate space for a few pedestrians to stand and wait. This brings several potential problems in that cyclists may have difficulty in stopping in time if riding across the crossing, and the small width of the refuge may leave the ends of the cycle exposed to conflict with passing traffic. Video studies at crossings with central refuges will reveal if such behaviour exists. Existing road signing may be largely sufficient for a change of use of Zebra crossings from pedestrian use only to a shared-use Zebra (Tiger) crossing, however additional warning signs require the authorisation of the Secretary of State. Yellow markings which might help to differentiate shared-use Zebra (Tiger) crossings from pedestrian only crossings may confuse drivers as the colour is usually used to signify prohibition.
3.6 Guidance on the various design standards for cycle paths
Conversion of a footpath to a cycle track requires that conversion orders are made under Section 3 of the Cycle Tracks Act 1984 and the Cycle Tracks Regulations 1984 (SI1984/1431). Design advice relating to cycle facility design come from three main sources ‘Guidelines for Cycle Audit and Cycle Review’ (IHT, 1998), ‘Cycle-Friendly Infrastructure: Guidelines for Planning and Design’ (IHT, 1997) and the recent London Cycling Design Standards (2005). The IHT (1997) document is a joint publication with DETR (now DfT) the Bicycle Association and the Cyclists Touring Club. Its aim is not to be a design guide for cycle facilities but to, “make the general highway infrastructure safer and more convenient for cyclists.” Much of the work here relates to junctions yet in relation to crossings key principles set out are:
• Safety and continuity – Around three quarters of cyclists’ casualties occur at or near to junctions. Safe passage must be ensured when crossing.

TRL Limited 19 UPR/T/035/06
Unpublished Project Report Version: Final
• Crossings can be junctions – Crossings are often junctions for cyclists and the need to accommodate a range of manoeuvres should be incorporated into crossing design.
• Design principles – Cyclists should not be outside driver’s normal field of view.
• Previous guidance – Road humps can be incorporated into some crossings to improve safety and clarify priorities.
These key principles tie in with the infrastructure requirements set out by IHT (1998) (in collaboration with the Welsh Office, DETR, The Scottish Office and the Department of the Environment for Northern Ireland), they are: -
1) Coherence – The cycling infrastructure should form a coherent entity, linking all significant trip origins and destinations; routes should be continuous and consistent in standard.
2) Directness – Routes should be as direct as possible, based on desire lines – detours and delays will deter use
3) Attractiveness – Routes must be attractive to cyclists on subjective as well as objective criteria: Lighting, personal safety, aesthetics, noise and integration with the surrounding area are important.
4) Safety – Designs should minimise casualties and perceived danger for cyclists and other road users.
5) Comfort – cyclists need smooth well-maintained surfaces, flush kerbs, regular sweeping, and gentle gradients; routes must be convenient to use and avoid complicated manoeuvres and interruptions
To make these criteria more accessible in terms of design guidelines the following determinants are necessary (based on a Level of Service):
• Motor vehicle flow and composition
• Motor vehicle speed
• Junctions (type and frequency)
• Width of the lane/path, car parking and protected space
• Convenience (gradient, directness, continuity and signing)
• Riding surface
• Attractiveness and personal security These measures translate into practical design guidance for signalised and non-signalised crossings.

TRL Limited 20 UPR/T/035/06
Unpublished Project Report Version: Final
3.6.1 Advisory Crossings (non-signalised)
For cyclists to cross minor roads (under 400 vehicles per hour (vph)) it is advised that an unsignalled crossing be used and priority should be given to the cyclist where possible using give way signs (IHT, 1997). If it is not possible to prioritise the cyclist, refuges in the road should be used where they do not restrict other cyclists on the road. For major roads (1,500 vph), advisory crossings are an option with central islands where suitable, taking into account sight lines and vehicle speeds. Further measures to improve driver awareness from LCDS (2005) include:
• Road narrowings (with 90° approaches for cyclists)
• Traffic calming measures to reduce vehicle speeds, including width restrictions and humps
• Use of coloured surfaces and cycle symbols
• Improved alignment of cycle track All these design measures highlight the fact that crossings should be acceptable in terms of safety and waiting times. As noted above, it is not recommended for cyclists to ride over Zebra crossings. Cyclists also must not cycle on the adjacent footway or footpath without it first being converted to shared use. To allow cyclists to cross a road a ‘Toucan’ crossing may be installed or a priority cycle crossing installed.
3.6.2 Signal controlled crossings
It is likely that cyclists need to be provided with a signalised crossing where vehicle flows are above 1,000 vph, or speed limits are over 40mph (IHT, 1997). LCDS recommends that un-signalised crossings be considered where possible, taking into account safety, traffic flow, speed and demand. Where these issues cannot be resolved a signalised crossing is needed.
3.6.2.1 Toucan Crossings
The Toucan (two can cross) crossing is designed to be a shared crossing for pedestrians and cyclists, with the same form of pedestrian or cyclist on-crossing detector as a Puffin crossing. Segregation is possible through approach barriers and the use of different colours but these may inhibit desire lines. (LCDS, 2005). The recommended minimum width for Zebra crossings is 2.4 metres, whereas for Toucans it is 4.0 metres (TfL, 2004).
3.6.2.2 Parallel Crossings
The ‘parallel’ crossing is recommended by IHT (1997) where, “cyclist and pedestrian flows are high and the predominant cyclist movement is straight across.”. This involves providing a separate set of cycle crossing facilities up to 5 metres from the pedestrian crossing. These reduce the conflict between cyclists and pedestrians and may be preferred to Toucan crossings, for this reason they are, however, more expensive. For all crossings, local environmental parameters need to be taken into account.
3.6.3 Guidance on the various design standards of cycle facilities
The Cyclists' Touring Club (CTC) gives advice on the design of cycle facilities (CTC Policy Handbook, 2004) and has made the following suggestions in relation to cycle infrastructure :-
i. Signalled junctions are often preferable to roundabouts. However mini-

TRL Limited 21 UPR/T/035/06
Unpublished Project Report Version: Final
roundabouts may be used as a speed control measure in traffic calming schemes and this may benefit cyclists.
ii. Loop-detectors controlling traffic signals should be tuned to detect cyclists.
iii. All new schemes should be audited for cycle friendliness and as much of the
existing transport network should be reviewed for cycle friendliness as possible. Crossings used by cyclists are often sited away from a busy road traffic junction (which cyclists if they remained on the carriageway might otherwise use). Cyclists may need to rejoin the carriageway following use of the facility. Facilities sited away from the road way should consider the following: - i. Subways and overbridges should be of high quality with good sightlines, sensible gradients, lighting and sufficient width. Converted footways are generally disliked by pedestrians and cyclists and should be avoided by transport planners. Low cost schemes to convert existing subways into shared use facilities are rarely satisfactory. Overbridges should be cycle friendly and not have steps. ii. Toucan crossings are shared light controlled crossings. They allow cyclists and pedestrians to cross roads in safety, and are a good example of workable and cost effective facilities.
Sources for further information are shown below:
Cyclists at Roundabouts Continental Design Geometry, (DETR) TAL 9/97
Cyclists and Major Roads, CTC 1992
Cycle Friendly Infrastructure, CTC, BA etc. 1996
Advanced Stop Lines for Cyclists: The Role of Central Cycle Lane Approaches and Signal Timings, TRL Report 181
Cyclists and Roundabouts Report Update, CTC 1993
Cycle Audit and Review, IHT 1998
Joint Statement on Providing for Walking and Cycling, Pedestrians’ Association and CTC 1995
Toucan Crossings, (DETR) TAL 10/93
3.7 Key findings from similar research on different types of crossing (particularly Zebra crossings)
From the available research literature on crossings, there is much discussion of the safety of pedestrians and cyclists at crossings. This is unsurprising as;
“British accident statistics show that more than 80% of pedestrian casualties occurred while pedestrians were crossing the carriageway and, that more than 12% of these pedestrian casualties were at or within 50m of a Pelican or Zebra crossing.” (Hunt, 1998)
TRL Limited 22 UPR/T/035/06
Unpublished Project Report Version: Final
Hunt’s paper notes the preference given to Pelican crossings over Zebra crossings in the 1970, 80s and 90s. He notes that;
“For the past two decades Pelicans have been preferred to Zebra crossings both because they were prompted as having superior safety records but also because the signals enabled traffic engineers to control traffic movements and restrict pedestrian occupation on the carriageway.”
Subsequently, there has been a shift in the trends for Killed and Seriously Injured (KSI’s) accidents at these crossing types. This is given chronologically as;
• An increase in pedestrian casualties at or close to Pelican crossings during the period from 1975 to 1985 where there was an increase in the number of Pelican crossings.
• A decrease in pedestrian casualties at or close to Zebra crossings during the period from 1975 to 1985 where there was a decrease in the number of Zebra crossings.
• A decrease in pedestrian casualties at both Zebra and Pelican crossings between 1985 and 1995.
• For Zebra crossings there are fewer accidents ‘within 50 metres of crossings but not on crossing’ than ‘on crossing’; this is not the case for Pelican crossings
• between 1990 and 1995 pedestrian casualties at Pelican crossings reduced at a similar rate to the reduction in pedestrian casualties in built up areas; over the same period pedestrian casualties at Zebra crossings continued to reduce more rapidly than the reduction for built up areas – this is unlikely to be explained by a reduced number of Zebra crossings.
Figures for the study also show that 13% of pedestrian casualties in built-up areas continue to occur at Zebra and Pelican crossings, which are promoted as ‘safe’ crossing places. Over time vehicle and pedestrian flows change and this must be factored into any analysis of pedestrian accidents and casualties. The estimates of crossing numbers against casualties indicates similar accident occurrences at Pelican and Zebra crossings, yet for Zebras accidents on the crossing are higher than accidents within 50 metres the crossing. When taking into account pedestrian flow there is little effect on accident frequency at Pelican crossings. At Zebras it appears that higher pedestrian flows do not result in higher accident numbers, bearing in mind that Zebras are used on low to medium vehicle flow roads and Pelicans are commonly used on higher speed roads. This may indicate that drivers are more aware of the risks of pedestrians at Zebra crossings and alter their behaviour appropriately (Hunt, 1998). Hunt (1998) recommends that the key factors to consider when considering pedestrian casualties at the two crossing types are;
1. vehicle speed 2. changes in layout or road surfacing around the crossing 3. variations in pedestrian or vehicle flow (or both) 4. the casualties in the wider road network.
Peirce, Wall, Bartlett and Osborn’s work (1998) focuses on pedestrians at signalised crossings. 31 fatal accidents were investigated with most being caused by a vehicle passing through a green signal and failing to avoid the pedestrian. Few involved the vehicle passing through a red light.
3.7.1 Research specifically at cycle crossings
Gårder, Leden and Pulkkinens (1998) study in Sweden looks at the before and after effects of reconstructing four bicycle crossings (by elevating them to a similar level to footpaths) and red paving

TRL Limited 23 UPR/T/035/06
Unpublished Project Report Version: Final
them to make them more visible. Altering a cycle crossing in such a way has a marked effect on a number of issues at the crossing. These are considered below.
3.7.1.1 Speed
Introducing raised crossings led to reduced vehicle speeds of 10 to 15 km/h, and by 40% for right-turning motor vehicles. Cycling speeds were affected by gradient and perceived safety. Steep ramps leading to crossings reduced cycle speed whilst an elevated crossing increased speed by 13% on average where it had been at-grade beforehand. Speeds remained constant at other crossings.
3.7.1.2 Safety
The altered layout of the crossing (and adjoining cycle lane) had the effect of increasing bicycle flow by an estimated 50%. This altered the relationship between flow and reported accidents in that there is an inverse relationship between bicycle flow and relative risk (reported accidents). A 50% increase in flow reduces the relative risk by about 24%. However, this increased flow would create an expected increase in reported accidents by around 15%. In addition, in terms of perceived safety, cyclists reported an average 20% improvement in safety from their own viewpoint.
3.7.1.3 Conflict studies
The total number of conflicts was reduced from 39 per 100 hours of observation before reconstruction to 20 after reconstruction. The number of conflicts involving cyclists was decreased by about 20%, the number of conflicts involving motorists by 60% and the number involving pedestrians by 80%. Reduced speeds among motorists, and better visibility and shorter crossing width for pedestrians are given as important reasons for this change.
3.7.1.4 Accident Data
In the period before reconstruction (67+ months) there were 160 accidents involving bicyclist and 127 in the after period (34 months) bearing in mind the increased flows of cyclists at the crossings.
3.7.1.5 Conclusion
Gårder, Leden and Pulkkinens’ (1998) article makes a number of points that are relevant to this literature review. Firstly, that cycle paths can be made reasonably safe if all cycle crossings are raised and painted a bright colour. Secondly, the speed of cyclists must also be kept relatively low in complicated environments.
An unpublished TRL report (TRL, 2000) by Pedler and Davies for the DETR looked at conflicts between cyclists and vehicles at cycle crossings at T-junctions. The method of assessing conflict was broadly similar to that of this study, except that the lowest level of conflict, discomfort, was excluded. Across an average of 6 crossings, 5.13 per hundred of cyclists would become involved in a conflict with a vehicle at the crossing, although with a standard deviation of 4.2 there were large differences between sites. The 2004 TRL report written for TfL “Review of procedures associated with the development and delivery of measures designed to improve safety and convenience for cyclists” (TRL, 2004) contained information primarily concerning on-road cycle facilities, however some mention

TRL Limited 24 UPR/T/035/06
Unpublished Project Report Version: Final
was made of a cycle crossing at Park Lane which dramatically reduced STATS19 recorded cyclist injuries.
3.7.2 Shared Crossings
Analysis of the use of Toucan crossings across a range of local authorities (DfT, 2003) identified no problems for pedestrians or cyclists in sharing the same crossing area. Observations showed that where segregated areas for pedestrians and cyclists exist both parties use the most convenient site, regardless of whether it was designated as for use by cyclists or pedestrians. Due to the extra expense of installing a segregated approach it was not recommended. An attitude survey carried out by TRL for the DfT in 1997, however, identified that 12% of cyclists compared to 4% of pedestrians mentioned the need for a segregated approach. Despite some users mentioning that crossings should be segregated, 93% of those using the crossing said that they felt safe. No differences were found between the attitudes of pedestrians and cyclists, or between age ranges and levels of mobility. The survey (TRL, 1997) identified that of the 514 users observed, 55% of pedestrians and 65% of cyclists were correctly positioned in the kerb-side detection area before crossing. Approximately 30% of users waited outside the detection area, and so it was suggested that the detection area should have a depth of at least 1.5 metres. Pedestrians tended to be more careful than cyclists when crossing - more pedestrians than cyclists used the green signal to help them cross and waited for the audible bleep before crossing. Both groups felt safe when crossing however, and very few cyclists or pedestrians were bothered about sharing the crossing. Whilst pedestrians tended to be more cautious when crossing, differences in crossing behaviour were site specific, relating largely to the physical layout of the crossing and the volume of traffic on the carriageway (TRL, 1997). Trevelyan and Ginger’s 1989 study gives some useful references to cyclists on cycle and cycle/pedestrian crossings in the UK. Data from 13 study sites revealed that there were no accidents between pedestrians and cyclists on twelve crossings. Indeed when considering design factors the authors note that;
“It is clear that cyclists and pedestrians do share existing unmodified Pelican and Zebra crossings without apparent difficulty.”
And later;
“It is apparent that there are relatively few occasions when pedestrians and cyclists actually coincide on the crossing.”
This observation is made even when cyclists do not make ‘proper’ use of the crossings. It is noted that cyclists cross;
“after the end of the period when pedestrians (or cycles) are invited to cross;” It is also significant to note that pedestrians on the shared crossings.
“Show little regard for the differentiation between pedestrian and cycle sections.” From these results, it is clear that the use of crossing facilities is dependent upon the individual’s perception of the crossing and personal desire line. Some pedestrians and cyclists do exercise caution on crossings, much more so than others do. This section indicates that cycle speed and vehicle speed affect conflicts. Finally, the research mentioned that cyclists use crossings to make turns that enable them to join the main

TRL Limited 25 UPR/T/035/06
Unpublished Project Report Version: Final
carriageway (Trevelyan and Gingers, 1989). Evidence of this should be analysed with regards to risky behaviour in the video analysis.

TRL Limited 26 UPR/T/035/06
Unpublished Project Report Version: Final
Literature Review – A summary The literature review has provided a basis for determining the crossing types, the laws that allow them, the Regulations and guidance which shapes them, and prior research regarding their actual use including attitudes and risky behaviour. The relative advantages and disadvantages of the different types of crossing have been identified. The Zebra crossing is characterised by being quickly operational by user demand, and costing less in installation charges, but not being suitable for faster roads and can cause traffic delays where flows of users is high. There are types of crossing available to the cyclist including the Toucan (Two-can cross on a shared area) and Parallel crossings (where pedestrians and cyclists are segregated), both of which allow pedestrian use. The fundamental difference between these types of crossing and Zebra crossings are the red-amber-green traffic signals and user aspects. The laws pertaining to Zebra crossings is the Road Traffic Regulation Act 1984 which is further defined in the Zebra, Pelican and Puffin Pedestrian Crossings Regulations and General Directions (1997). The wording basically gives pedestrians precedence at crossings. As cyclists who ride their cycle are counted as vehicles, they do not have precedence at crossings. Whilst cyclists are not proscribed from cycling on the carriageway part of the crossing in law, it is recommended in the Highway Code that cyclists dismount and this recommendation could be used in a court to argue that a cyclist was acting dangerously thus be prosecuted under dangerous driving laws. Also, unless the adjacent footways are converted to shared use, their use by cyclists is proscribed by law because cycles are technically vehicles and vehicles are not permitted to use them. Local authorities install Zebra crossings on roads that are not trunk roads after consultation with the Police, public notice, and written notice to the Secretary of State. There is guidance contained in Local Transport Notes 1/95 and 2/95, and other relevant guidance includes the DfT’s 2002 document ‘Inclusive Mobility’ and the Land Compensation Act 1973. The Design Manual for Roads and Bridges, Volume 8, Section 5, should also be reviewed by engineers. Further cycle facility guidance for London comes in the London Cycling Design Standards (2005). There are specific rules relating to the layout and signing of Zebra crossings. Signing for Zebra crossings is contained in the Traffic Signs Regulations and General Directions 2002 (Great Britain, 2002a) and the Traffic Signs Manual Volume 5. New signing would require DfT approval. The Zebra, Pelican and Puffin Pedestrian Crossings Regulations and General Directions (1997) outlines the layout of Zebra crossings. There does not appear to be any legal conflict on record regarding the definition of use of the various crossing types, which suggests that the laws and regulations are robust. Zebra crossings may be provided with a refuge between lanes. This refuge must be a minimum of 1.2 metres or sufficiently large for anticipated flows (for example, those near a school). Due to the need for motorists to observe pedestrians at a crossing and stop in time to allow them to cross, a visibility distance of 70m on a 30mph speed limited road is recommended at Zebra crossings by the Zebra, Pelican and Puffin Pedestrian Crossings Regulations and General Directions (1997). For shared-use Zebra (Tiger) crossings to have any real benefit, the routes to the crossing would also be accessible to cyclists to provide a coherent and continuous network. This often involves the conversion of an existing footpath to allow cycle use and this is possible under Section 3 of the Cycle Tracks Act 1984 and the Cycle Tracks Regulations 1984 (SI1984/1431). There is various guidance
TRL Limited 27 UPR/T/035/06
Unpublished Project Report Version: Final
published by the IHT and TfL relating to cycle infrastructure which should prove useful to engineers and planners including the ‘Guidelines for Cycle Audit and Cycle Review’ (IHT, 1998), ‘Cycle-Friendly Infrastructure: Guidelines for Planning and Design’ (IHT, 1997) and the recent London Cycling Design Standards (2005). The CTC also provide guidance for cycle infrastructure. Toucan crossings allow for the shared-use of a crossing by cyclists and pedestrians. Their width is wider than Zebra crossings, which are only for pedestrians, at a minimum 2.4 metres for Zebras and 4.0 metres for Toucans. Pedestrian crossings have come under academic scrutiny in a number of studies. Hunt (1998) looked at Zebra and Pelican casualties and estimated that casualties are similar however collisions at Zebras appear to occur more within the confines of the crossing rather than outside compared to Pelicans. Coupled with Peirce, Wall, Bartlett and Osborn’s work (1998) which indicates that most pedestrian fatalities at signalised crossings occur with a vehicle passing a green light suggest that pedestrians may become impatient to wait for the lights to change and risk a crossing. Gårder, Leden and Pulkkinens (1998) looked at cycle crossings and found that raised crossings reduced vehicle speeds. A ramp for cyclists also reduced their speed. They also found an inverse relationship between cycle numbers and collisions, and cycle facility improvements increased usage. Their report makes a number of points that are relevant to this literature review. Firstly, that cycle paths can be made reasonably safe if all cycle crossings are raised and painted a bright colour. Secondly, the speed of cyclists must also be kept relatively low in complicated environments Research on Toucan crossings identified no problems between cyclists and pedestrians at shared-use crossings (DfT, 2003). Four percent of pedestrians and twelve percent of cyclists felt that shared-use crossings should be segregated, and attitudes amongst users were to different depending upon age or mobility level. TRL/DfT, 1997). Trevelyan and Ginger’s 1989 study noted that there are few incidents between cyclists and pedestrians at unmodified Pelican and Zebra crossings. They also note that users have little regard for segregation where provided. Differences were noted between the level of caution exercised by different pedestrian and cycling individuals. Cyclists were also observed using the crossing to make turns onto the main carriageway.

TRL Limited 28 UPR/T/035/06
Unpublished Project Report Version: Final
4 Collision data analysis
4.1 Introduction
As part of this research study, TRL has reviewed recorded collisions involving cyclists on Zebra crossings and other types of crossing to identify any trends and or contributory factors in the patterns of cyclist collisions, relative to other users.
The details of road traffic incidents reported to the Police are recorded and stored in the STATS19 database. Data from this form is held locally and nationally and used to inform safety studies. Incidents involving pedestrians and cyclists are recorded in STATS19 if they occur on the highway. Because of the need for the Police to record each incident, it is likely that many minor incidents are not recorded because they do not come to their attention. Studies indicate that a minority of incidents, 32%, are actually recorded (Transport and Road Research Laboratory, 1989). Furthermore, data entry is defined quite rigidly therefore the full circumstances of each individual case cannot be encapsulated in the STATS19 data entry form. For this reason textual data (a short paragraph by the attending Police officer) is often added. This often allows a greater insight into the individual circumstances of each case. The STATS19 data collated for this study comes from the local and the national databases.
4.2 National data on collisions at crossings
National STATS19 data was analysed from 2000 to 2004 (5 year time period). All the references to data are for this time period unless otherwise stated. This data includes the absolute numbers of recorded slight, serious, and fatal incidents involving cyclists and pedestrians at Zebra crossings, and similar incidents at crossings that were not Zebras. These are separated by Britain as a whole, and the Metropolitan Police District (MPD) as a proxy for London. London was highlighted due to the different levels of walking and cycling in the Capital compared to other areas of Britain, and that given the location of the research sites this would give the most accurate data. These recorded incidents all took place within a 50 metre geographical location from a crossing. It would be preferable to only include those collisions on the crossing however the STATS19 data only allows the generation of data within a 50m radius and because of this the figures are possibly artificially high. Due to the large number of cases it is not possible to review the textual descriptions for each reported case.
4.2.1 Collisions at Zebra crossings
During the five year period reviewed, it is found that cyclist KSI (Killed and Seriously Injured) casualties at Zebra crossings in London account for between 47% and 54% of the British total. Similarly, incidents involving pedestrians at Zebra crossings in London account for 41% to 45% percent of all pedestrian Zebra crossing incidents in Britain. However as the total number of crossings of all types, and the number of crossings across them in Britain, are unknown the significance of this cannot be stated. The specific reasons for this high proportion of collisions is unknown, but are likely to be effects of the number of cycle and pedestrians trips, high levels of traffic, and number of crossings in the Metropolitan area. It should be noted that cyclist incidents at Zebras are far fewer in number than pedestrian incidents. The yearly mean average of pedestrian KSIs in Britain at Zebra crossings was 384.6 with a standard deviation of 28.8, and the cyclist mean average KSIs in Britain was 66 with a standard deviation of 9.9 in the years 2000 to 2004. This does not necessarily indicate that cycling is less dangerous than walking. The accident rates, i.e. the number of collisions per cyclist and pedestrian using the crossing, would provide an insight into the relative safety of the facilities for each type of user. As shown in Figure 4-1 below, there are no observable trends in the corresponding cyclist figures. On average there were 37 London KSI casualties per year among cyclists using Zebra crossings in 2000
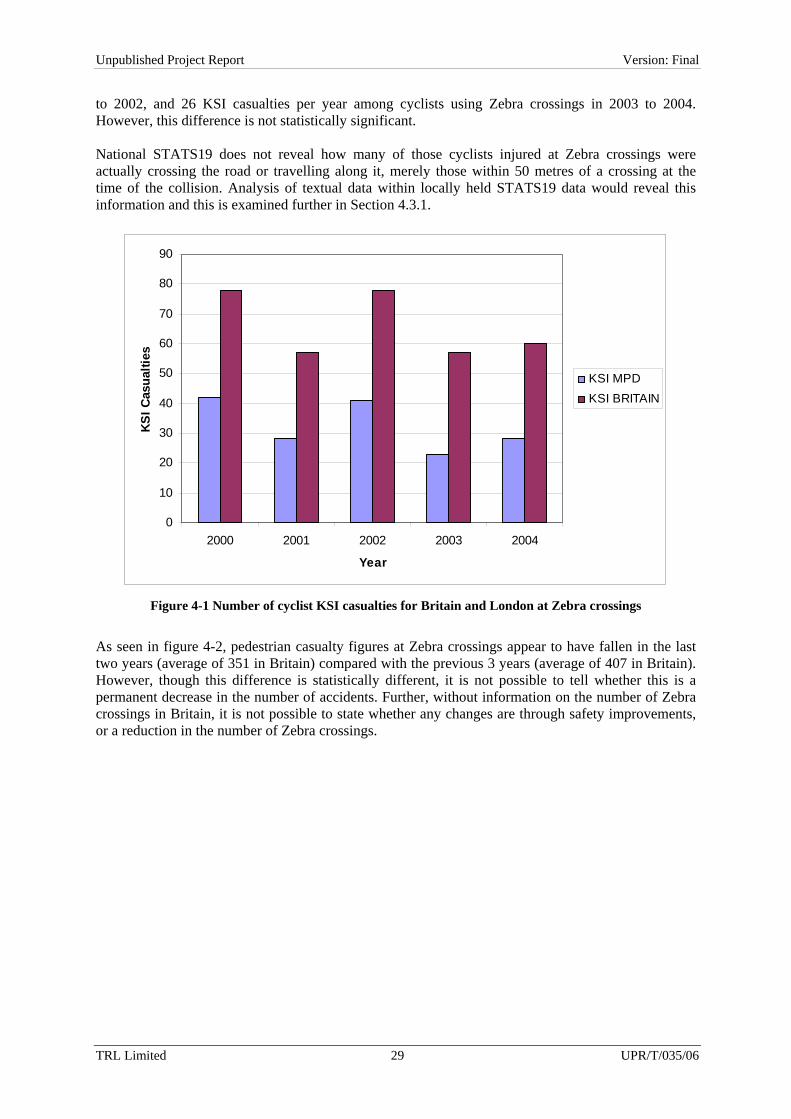
TRL Limited 29 UPR/T/035/06
Unpublished Project Report Version: Final
to 2002, and 26 KSI casualties per year among cyclists using Zebra crossings in 2003 to 2004. However, this difference is not statistically significant. National STATS19 does not reveal how many of those cyclists injured at Zebra crossings were actually crossing the road or travelling along it, merely those within 50 metres of a crossing at the time of the collision. Analysis of textual data within locally held STATS19 data would reveal this information and this is examined further in Section 4.3.1.
0
10
20
30
40
50
60
70
80
90
2000 2001 2002 2003 2004
Year
KSI C
asua
lties
KSI MPDKSI BRITAIN
Figure 4-1 Number of cyclist KSI casualties for Britain and London at Zebra crossings
As seen in figure 4-2, pedestrian casualty figures at Zebra crossings appear to have fallen in the last two years (average of 351 in Britain) compared with the previous 3 years (average of 407 in Britain). However, though this difference is statistically different, it is not possible to tell whether this is a permanent decrease in the number of accidents. Further, without information on the number of Zebra crossings in Britain, it is not possible to state whether any changes are through safety improvements, or a reduction in the number of Zebra crossings.

TRL Limited 30 UPR/T/035/06
Unpublished Project Report Version: Final
0
50
100
150
200
250
300
350
400
450
2000 2001 2002 2003 2004
Year
KSI C
asua
lties
KSI MPDKSI BRITAIN
Figure 4-2 Number of pedestrian KSI casualties for Britain and MPD at Zebra crossings
4.2.2 Collisions at other types of crossing Figures 4-3 and 4-4 illustrate the number of cyclist and pedestrian KSIs at all road crossings, other than Zebra crossings, in the MPD and in Britain.
0
500
1000
1500
2000
2500
3000
2000 2001 2002 2003 2004
Year
KSI
cas
ualti
es
KSI MPDKSI BRITAIN
Figure 4-3 Cyclist KSI casualties at crossings other than Zebras in Britain and the MPD
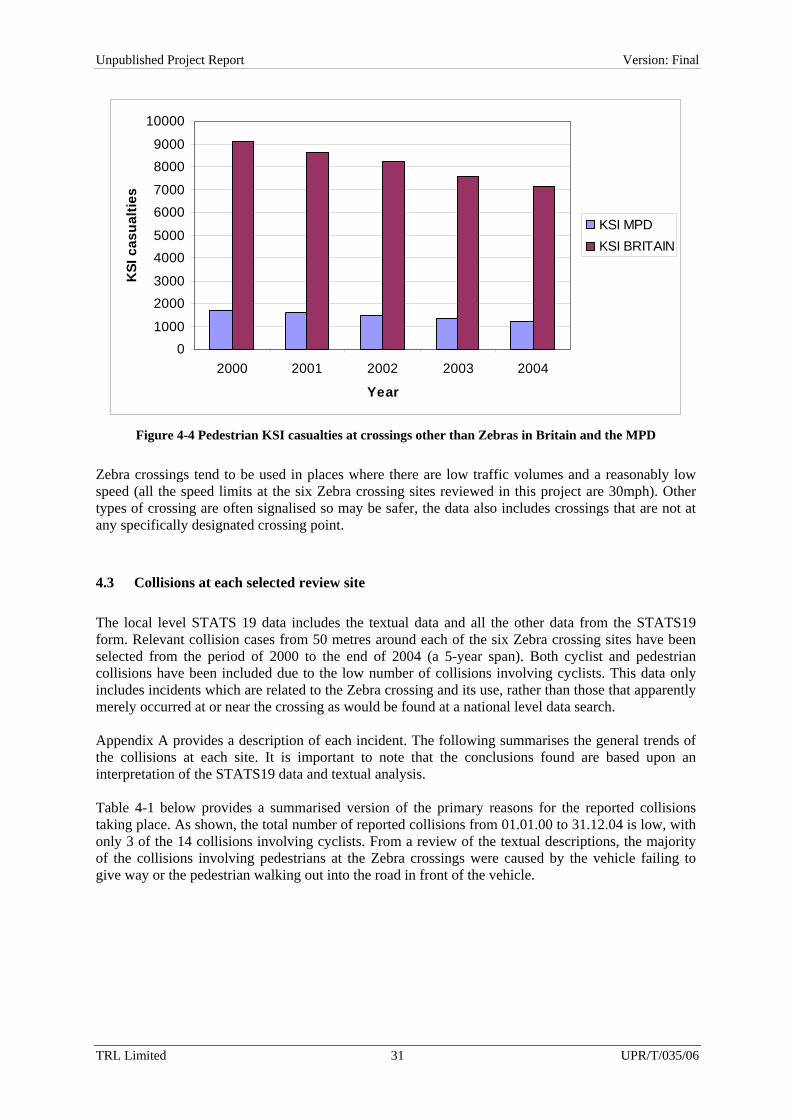
TRL Limited 31 UPR/T/035/06
Unpublished Project Report Version: Final
01000
20003000
40005000
60007000
80009000
10000
2000 2001 2002 2003 2004
Year
KSI
cas
ualti
es
KSI MPDKSI BRITAIN
Figure 4-4 Pedestrian KSI casualties at crossings other than Zebras in Britain and the MPD
Zebra crossings tend to be used in places where there are low traffic volumes and a reasonably low speed (all the speed limits at the six Zebra crossing sites reviewed in this project are 30mph). Other types of crossing are often signalised so may be safer, the data also includes crossings that are not at any specifically designated crossing point.
4.3 Collisions at each selected review site The local level STATS 19 data includes the textual data and all the other data from the STATS19 form. Relevant collision cases from 50 metres around each of the six Zebra crossing sites have been selected from the period of 2000 to the end of 2004 (a 5-year span). Both cyclist and pedestrian collisions have been included due to the low number of collisions involving cyclists. This data only includes incidents which are related to the Zebra crossing and its use, rather than those that apparently merely occurred at or near the crossing as would be found at a national level data search. Appendix A provides a description of each incident. The following summarises the general trends of the collisions at each site. It is important to note that the conclusions found are based upon an interpretation of the STATS19 data and textual analysis. Table 4-1 below provides a summarised version of the primary reasons for the reported collisions taking place. As shown, the total number of reported collisions from 01.01.00 to 31.12.04 is low, with only 3 of the 14 collisions involving cyclists. From a review of the textual descriptions, the majority of the collisions involving pedestrians at the Zebra crossings were caused by the vehicle failing to give way or the pedestrian walking out into the road in front of the vehicle.
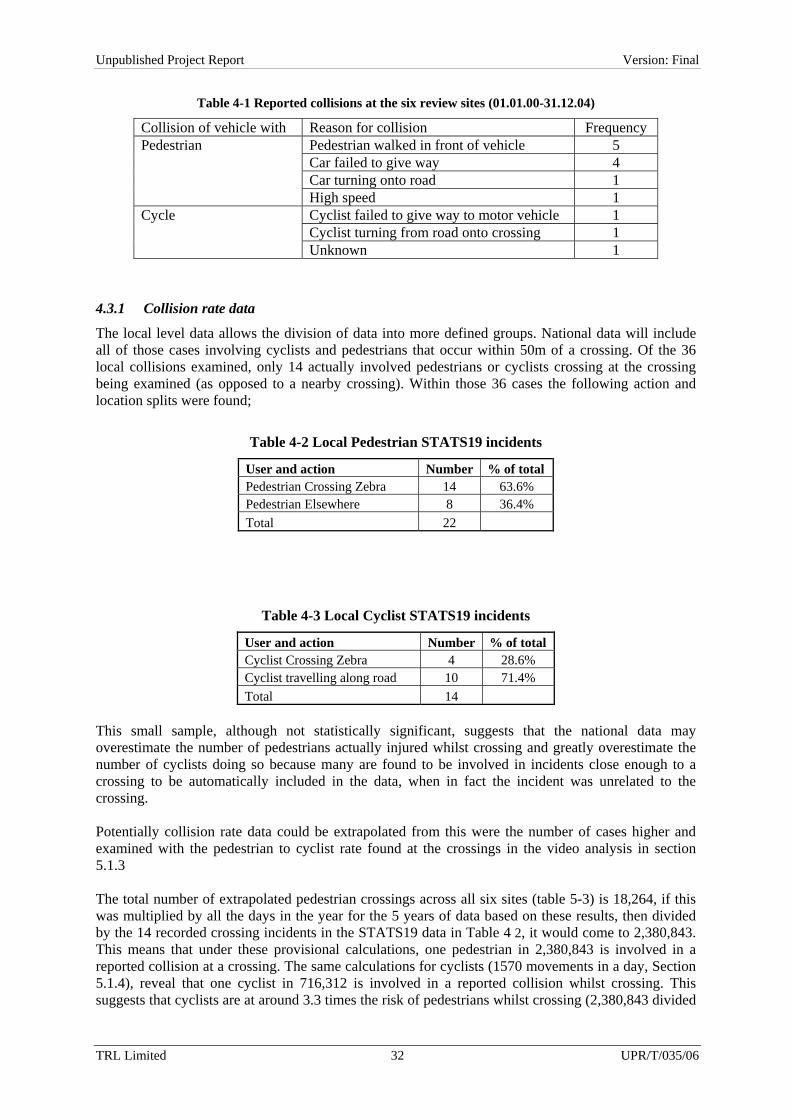
TRL Limited 32 UPR/T/035/06
Unpublished Project Report Version: Final
Table 4-1 Reported collisions at the six review sites (01.01.00-31.12.04)
Collision of vehicle with Reason for collision Frequency Pedestrian walked in front of vehicle 5 Car failed to give way 4 Car turning onto road 1
Pedestrian
High speed 1 Cyclist failed to give way to motor vehicle 1 Cyclist turning from road onto crossing 1
Cycle
Unknown 1
4.3.1 Collision rate data
The local level data allows the division of data into more defined groups. National data will include all of those cases involving cyclists and pedestrians that occur within 50m of a crossing. Of the 36 local collisions examined, only 14 actually involved pedestrians or cyclists crossing at the crossing being examined (as opposed to a nearby crossing). Within those 36 cases the following action and location splits were found;
Table 4-2 Local Pedestrian STATS19 incidents
User and action Number % of total Pedestrian Crossing Zebra 14 63.6% Pedestrian Elsewhere 8 36.4% Total 22
Table 4-3 Local Cyclist STATS19 incidents
User and action Number % of total Cyclist Crossing Zebra 4 28.6% Cyclist travelling along road 10 71.4% Total 14
This small sample, although not statistically significant, suggests that the national data may overestimate the number of pedestrians actually injured whilst crossing and greatly overestimate the number of cyclists doing so because many are found to be involved in incidents close enough to a crossing to be automatically included in the data, when in fact the incident was unrelated to the crossing. Potentially collision rate data could be extrapolated from this were the number of cases higher and examined with the pedestrian to cyclist rate found at the crossings in the video analysis in section 5.1.3 The total number of extrapolated pedestrian crossings across all six sites (table 5-3) is 18,264, if this was multiplied by all the days in the year for the 5 years of data based on these results, then divided by the 14 recorded crossing incidents in the STATS19 data in Table 4 2, it would come to 2,380,843. This means that under these provisional calculations, one pedestrian in 2,380,843 is involved in a reported collision at a crossing. The same calculations for cyclists (1570 movements in a day, Section 5.1.4), reveal that one cyclist in 716,312 is involved in a reported collision whilst crossing. This suggests that cyclists are at around 3.3 times the risk of pedestrians whilst crossing (2,380,843 divided
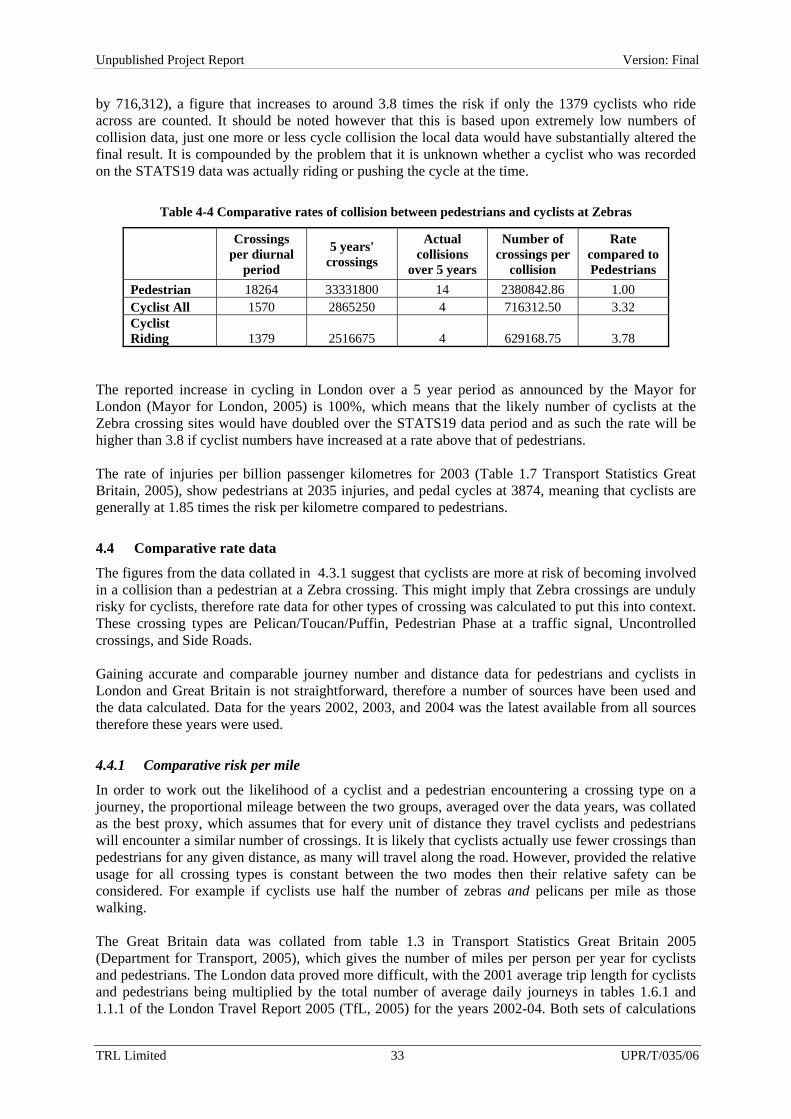
TRL Limited 33 UPR/T/035/06
Unpublished Project Report Version: Final
by 716,312), a figure that increases to around 3.8 times the risk if only the 1379 cyclists who ride across are counted. It should be noted however that this is based upon extremely low numbers of collision data, just one more or less cycle collision the local data would have substantially altered the final result. It is compounded by the problem that it is unknown whether a cyclist who was recorded on the STATS19 data was actually riding or pushing the cycle at the time.
Table 4-4 Comparative rates of collision between pedestrians and cyclists at Zebras
Crossings per diurnal
period
5 years' crossings
Actual collisions
over 5 years
Number of crossings per
collision
Rate compared to Pedestrians
Pedestrian 18264 33331800 14 2380842.86 1.00 Cyclist All 1570 2865250 4 716312.50 3.32 Cyclist Riding 1379 2516675 4 629168.75 3.78
The reported increase in cycling in London over a 5 year period as announced by the Mayor for London (Mayor for London, 2005) is 100%, which means that the likely number of cyclists at the Zebra crossing sites would have doubled over the STATS19 data period and as such the rate will be higher than 3.8 if cyclist numbers have increased at a rate above that of pedestrians. The rate of injuries per billion passenger kilometres for 2003 (Table 1.7 Transport Statistics Great Britain, 2005), show pedestrians at 2035 injuries, and pedal cycles at 3874, meaning that cyclists are generally at 1.85 times the risk per kilometre compared to pedestrians.
4.4 Comparative rate data
The figures from the data collated in 4.3.1 suggest that cyclists are more at risk of becoming involved in a collision than a pedestrian at a Zebra crossing. This might imply that Zebra crossings are unduly risky for cyclists, therefore rate data for other types of crossing was calculated to put this into context. These crossing types are Pelican/Toucan/Puffin, Pedestrian Phase at a traffic signal, Uncontrolled crossings, and Side Roads. Gaining accurate and comparable journey number and distance data for pedestrians and cyclists in London and Great Britain is not straightforward, therefore a number of sources have been used and the data calculated. Data for the years 2002, 2003, and 2004 was the latest available from all sources therefore these years were used.
4.4.1 Comparative risk per mile
In order to work out the likelihood of a cyclist and a pedestrian encountering a crossing type on a journey, the proportional mileage between the two groups, averaged over the data years, was collated as the best proxy, which assumes that for every unit of distance they travel cyclists and pedestrians will encounter a similar number of crossings. It is likely that cyclists actually use fewer crossings than pedestrians for any given distance, as many will travel along the road. However, provided the relative usage for all crossing types is constant between the two modes then their relative safety can be considered. For example if cyclists use half the number of zebras and pelicans per mile as those walking. The Great Britain data was collated from table 1.3 in Transport Statistics Great Britain 2005 (Department for Transport, 2005), which gives the number of miles per person per year for cyclists and pedestrians. The London data proved more difficult, with the 2001 average trip length for cyclists and pedestrians being multiplied by the total number of average daily journeys in tables 1.6.1 and 1.1.1 of the London Travel Report 2005 (TfL, 2005) for the years 2002-04. Both sets of calculations

TRL Limited 34 UPR/T/035/06
Unpublished Project Report Version: Final
reveal the proportional distance split between pedestrians and cyclists and these figures are used in all calculations. STATS19 data is used to calculate the KSI and slight casualty figures for the Metropolitan Police District (as a proxy for London) and Great Britain for cyclists and pedestrians and it should be carefully noted that unlike the previous calculations in Table 4-4, this data has not been ‘cleaned’ of collisions that merely happened to be in the area of the crossing thus introducing a level of over-representation into the data. Providing that the levels of over-representation are equal between types of crossing, the difference between types of crossing should be similar even if the numbers used are inevitably lower. This comparative rate is worked out against the comparative distance rate for the same. This allows the comparative risk rate between cyclists and pedestrians at a number of different crossing types to be calculated. The STATS19 data is split by pedestrians and cyclists crossings at Zebra crossings, Pedestrian phase at traffic signal junctions, uncontrolled areas, and side roads. Unfortunately it was not possible to disaggregate Pelican, Toucan, and Puffin crossings therefore they are categorised together.
Table 4-5 Great Britain comparative risk data
Stats19 data (2002, 2003, 2004 total)
Great Britain
Pedestrian Cyclist
Pedestrian to cyclist
mileage proportion 1 cyclist = X pedestrians
(from national
data)
Number of cyclist injuries
if rate was equal to
pedestrians
How many times more dangerous
cycling is than walking in terms of
mileage at facility
Zebra 1098 195 196 0.995 Pelican, Toucan, Puffin. 2693 354 480 0.736 Ped Phase 2133 407 380 1.069 Uncontrolled 2311 993 412 2.407 Side Road 4818 1987
5.602
860 2.310
Table 4-6 London comparative risk data
Stats19 data (2002, 2003, 2004 total)
London
Pedestrian Cyclist
Pedestrian to cyclist
mileage proportion 1 cyclist = X pedestrians
(from London
data)
Number of cyclist injuries
if rate was equal to
pedestrians
How many times more dangerous
cycling is than walking in terms of
mileage at facility
Zebra 470 92 111.905 0.822 Pelican. Toucan, Puffin.
423 56 100.714 0.556
Ped Phase 961 210 228.81 0.918 Uncontrolled 250 83 59.524 1.394 Side Road 937 347
4.2
223.095 1.555
TRL Limited 35 UPR/T/035/06
Unpublished Project Report Version: Final
The data reveals that the relative risk between pedestrians and cyclists at each type of crossing facility in London and Great Britain is broadly similar, which gives confidence to the findings (i.e. Zebras in Great Britain are 0.99 times more dangerous and 0.82 times more dangerous in London based upon the calculations). The data suggests that cyclists compared to pedestrians are relatively safest at Pelican/Toucan/Puffin crossings, and at the highest relative risk at uncontrolled crossings and side roads. The data also shows the relative popularity of cycling to walking in London compared to Great Britain.
4.4.2 Incidents per journey
In order to assess risk by journey, the number of journeys per mode per year in Great Britain and London was calculated. Table 1.4 of Transport Statistics Great Britain 2005 reveals that there were an average of 246 walking trips and 15 bicycle trips per person per year in 2004. This was extrapolated against the mid-2004 Great Britain population of 58.124 million (ONS, http://www.statistics.gov.uk/CCI/nugget.asp?ID=6 [accessed 10/04/2006]) then minus the 7,429,000 for London in 2004 as of table 6.1.1. in the London Travel Report 2005. Similar data can be calculated for London which has differing travel patterns to the rest of the UK. This data used journeys by walking and cycling per day in London in table 1.1.1 of the London Travel Report 2005 as 5.6 million walking trips and 0.4 million cycling trips respectively in 2004. This figure was calculated against the number of days in the year (365), then divided by the London population of 7,429,000 in 2004 (as of table 6.1.1. in the London Travel Report 2005). This gave broadly similar results to the Great Britain walking and cycling trip data, of 275 walking journeys and 19.6 cycling journeys per person per year. The number of journeys over the three data years by walking and cycling was divided by the number of incidents at each facility type over the three STATS19 data years to reveal the number of STATS19 reportable incidents that occurred per x journeys. It should be noted that the STATS19 data may record a person as a cyclist but does not reveal if that person was cycling at the time. Levels of accident risk in Greater London (London Road Safety Unit, 2004) indicates the number of Zebra and Pelican Crossings (including Toucan and Puffin crossings) in London as 2448 and 2267 respectively. Therefore, assuming that the chance of crossing per journey or mile was similar, there should be 1.08 times more incidents at Zebra crossings than Pelican/Toucan/Puffin crossings. In reality there are far more Pelican/Toucan/Puffin incidents over the 3 data years than at Zebra crossings, with 1384 Pelican/Toucan/Puffin incidents, and 470 Zebra incidents for pedestrians and 266 and 92 for cyclists respectively in London. This suggests that Zebra crossings are relatively safer, however in the absence of more reliable crossing rate data at Pelican and Toucan crossings this cannot be assumed. In addition, the accident rate could be affected by the location of each type of crossing, for example a higher proportion of zebra crossings could be on roads with lower speed limits. It is not possible to take account of these other possibly confounding factors within this analysis.

TRL Limited 36 UPR/T/035/06
Unpublished Project Report Version: Final
Table 4-7 Great Britain risk per journey
Stats19 data (2002, 2003, 2004 total)
Journeys per person per year
Journeys per year (population of 50695000 in 2003)
Number of trips needed to generate one
STATS19 incident at each facility
Great Britain
Pedestrian Cyclist Pedestrian Cyclist Pedestrian Cyclist Pedestrian Cyclist Zebra 1098 195 34,073,689 779,923
Pelican, Toucan, Puffin 2693 354
13,892,651 429,619
Ped Phase 2133 407 17,540,042 373,673 Uncontrolled 2311 993 16,189,057 153,157 Side Road 4818 1987
246 15 12,470,970,000 760,425,000
7,765,237 76,540
Table 4-8 London risk per journey
Stats19 data (2002, 2003, 2004 total)
Journeys per person per year
Journeys per year (population of 7429000 in
2004)
Number of trips needed to generate one
STATS19 incident at each facility
London
Pedestrian Cyclist Pedestrian Cyclist Pedestrian Cyclist Pedestrian Cyclist Zebra 470 92 13,040,266 4,748,100 Pelican, Toucan, Puffin 423 56
14,489,184 7,800,450
Ped Phase 961 210 6,377,653 2,080,120 Uncontrolled 250 83 24,515,700 5,262,954 Side Road 937 347
275 19.6 2,042,975,000 145,608,400
6,541,009 1,258,862 Recorded STATS19 incidents by journey suggests that in all cases pedestrians are at lower risk of being involved in a STATS19 incident per journey than a cyclist. Assuming that cyclists’ rate of usage of each type of crossing is the same, in London, Pelican/Toucan/Puffin crossings are revealed as the least risky crossing point, with Zebra crossings being less risky than pedestrian phase at traffic signal junction (Ped Phase) crossing. Comparison of the results found in Table 4-7 for risk per journey and those found earlier for crossing risk at Zebra crossings for cyclists and pedestrians per crossing reveal that although the absolute amount of incidents is different as might be expected due to the number of potential crossings per journey, the proportion of reporting between the modes is surprisingly similar. There is a risk of one pedestrian STATS19 recorded Zebra crossing incident per 13,040,266 journeys in London compared to 2,380,843 for the six study sites, a multiplication of 5.5, a similar calculation for cyclists (4748100 / 716312) reveals a figure of 6.23. This suggests that the risk per crossing rates found for the study Zebra crossings are reasonably accurate. The comparative collision data reveals that under the assumptions used within this modelling exercise, Zebra crossings are relatively safer for cyclists than Pedestrian Phase at traffic signal junction crossings. However, the reliability of these predictions could be improved by knowledge of the number of each type of crossing in existence and the number of cyclists and pedestrians using each one.
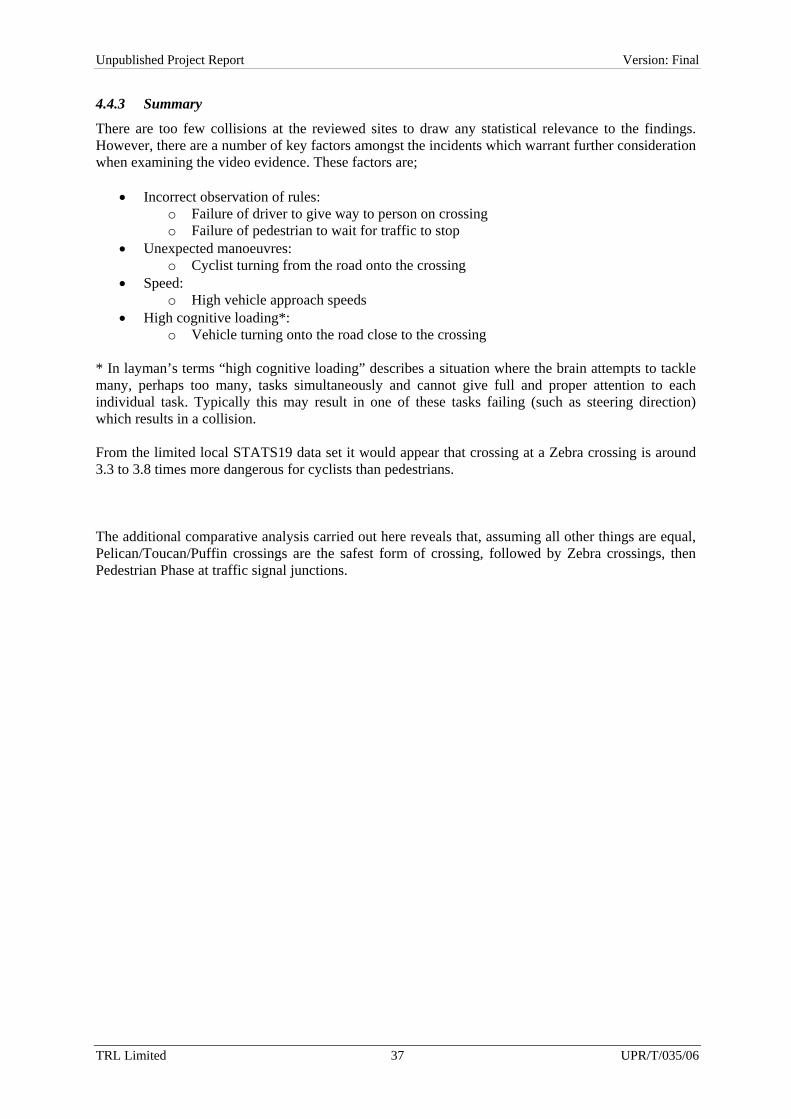
TRL Limited 37 UPR/T/035/06
Unpublished Project Report Version: Final
4.4.3 Summary
There are too few collisions at the reviewed sites to draw any statistical relevance to the findings. However, there are a number of key factors amongst the incidents which warrant further consideration when examining the video evidence. These factors are;
• Incorrect observation of rules: o Failure of driver to give way to person on crossing o Failure of pedestrian to wait for traffic to stop
• Unexpected manoeuvres: o Cyclist turning from the road onto the crossing
• Speed: o High vehicle approach speeds
• High cognitive loading*: o Vehicle turning onto the road close to the crossing
* In layman’s terms “high cognitive loading” describes a situation where the brain attempts to tackle many, perhaps too many, tasks simultaneously and cannot give full and proper attention to each individual task. Typically this may result in one of these tasks failing (such as steering direction) which results in a collision. From the limited local STATS19 data set it would appear that crossing at a Zebra crossing is around 3.3 to 3.8 times more dangerous for cyclists than pedestrians. The additional comparative analysis carried out here reveals that, assuming all other things are equal, Pelican/Toucan/Puffin crossings are the safest form of crossing, followed by Zebra crossings, then Pedestrian Phase at traffic signal junctions.
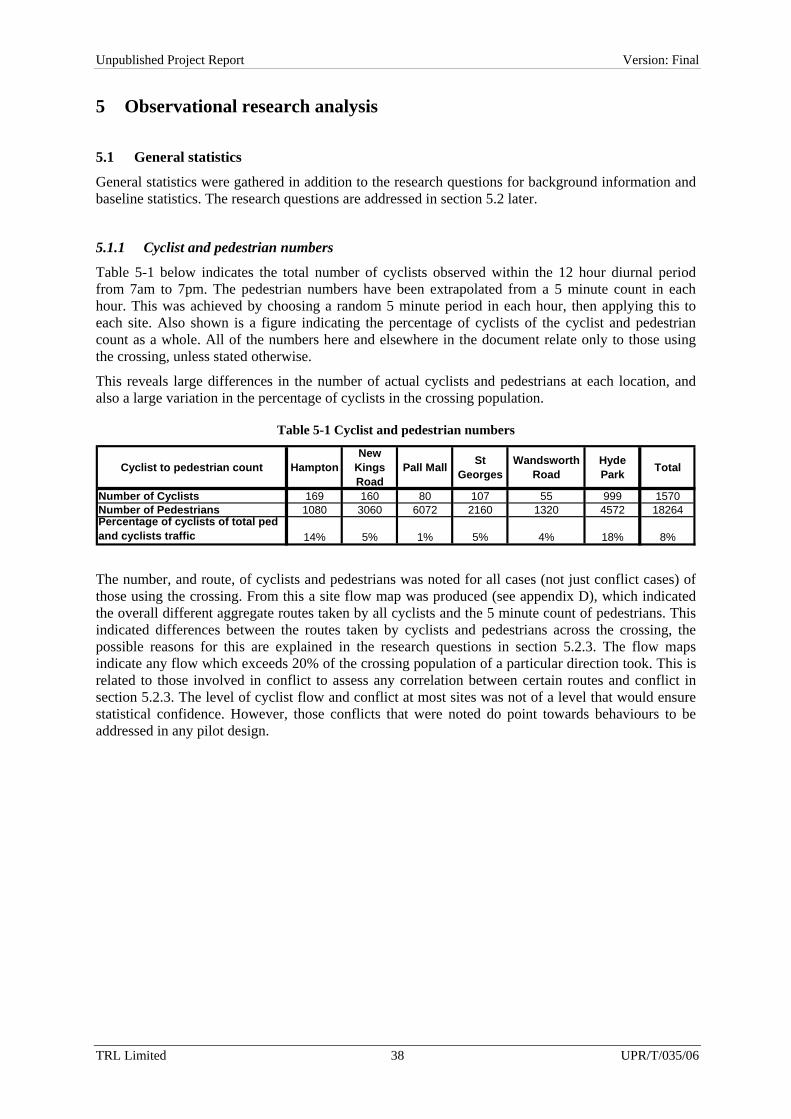
TRL Limited 38 UPR/T/035/06
Unpublished Project Report Version: Final
5 Observational research analysis
5.1 General statistics
General statistics were gathered in addition to the research questions for background information and baseline statistics. The research questions are addressed in section 5.2 later.
5.1.1 Cyclist and pedestrian numbers
Table 5-1 below indicates the total number of cyclists observed within the 12 hour diurnal period from 7am to 7pm. The pedestrian numbers have been extrapolated from a 5 minute count in each hour. This was achieved by choosing a random 5 minute period in each hour, then applying this to each site. Also shown is a figure indicating the percentage of cyclists of the cyclist and pedestrian count as a whole. All of the numbers here and elsewhere in the document relate only to those using the crossing, unless stated otherwise.
This reveals large differences in the number of actual cyclists and pedestrians at each location, and also a large variation in the percentage of cyclists in the crossing population.
Table 5-1 Cyclist and pedestrian numbers
Cyclist to pedestrian count HamptonNew
Kings Road
Pall Mall St Georges
Wandsworth Road
Hyde Park Total
Number of Cyclists 169 160 80 107 55 999 1570Number of Pedestrians 1080 3060 6072 2160 1320 4572 18264Percentage of cyclists of total ped and cyclists traffic 14% 5% 1% 5% 4% 18% 8% The number, and route, of cyclists and pedestrians was noted for all cases (not just conflict cases) of those using the crossing. From this a site flow map was produced (see appendix D), which indicated the overall different aggregate routes taken by all cyclists and the 5 minute count of pedestrians. This indicated differences between the routes taken by cyclists and pedestrians across the crossing, the possible reasons for this are explained in the research questions in section 5.2.3. The flow maps indicate any flow which exceeds 20% of the crossing population of a particular direction took. This is related to those involved in conflict to assess any correlation between certain routes and conflict in section 5.2.3. The level of cyclist flow and conflict at most sites was not of a level that would ensure statistical confidence. However, those conflicts that were noted do point towards behaviours to be addressed in any pilot design.

TRL Limited 39 UPR/T/035/06
Unpublished Project Report Version: Final
5.1.2 Flow timings
Flow timings of pedestrians and cyclists can better explain the level of conflict between cyclists and pedestrians. The number of pedestrians and cyclists using the crossing per hour was counted. Hyde Park Corner (South Carriage Drive) in figure 5-1 showed a marked increase in cyclist flow during the morning peak and a large overall flow. Cyclists accounted for around half of crossings during the first few hours of the day. This suggests the route is used by commuters. Conversely pedestrian flows were higher during the day.
Hyde Park Corner
0
200
400
600
800
Hour of Day
Num
ber o
f obs
erve
d cy
clis
tan
d pe
dest
rians
Pedestrians 72 240 396 468 576 456 492 564 348 408 300 252
Cyclists 101 263 190 46 23 32 21 27 25 48 93 130
07:00 08:00 09:00 10:00 11:00 12:00 13:00 14:00 15:00 16:00 17:00 18:00
Figure 5-1 Number of observed cyclists and pedestrians per hour at Hyde Park Corner
Hampton Court in figure 5-2 has a high variation in pedestrian numbers but relatively uniform cyclist numbers.
Hampton Court Road
0
50
100
150
200
Hour of Day
Num
ber o
f obs
erve
d cy
clis
tan
d pe
dest
rians
Pedestrians 48 72 72 96 60 120 132 72 96 84 84 144
Cyclists 11 19 18 10 14 9 14 13 12 13 19 17
07:00 08:00 09:00 10:00 11:00 12:00 13:00 14:00 15:00 16:00 17:00 18:00
Figure 5-2 Number of observed cyclists and pedestrians per hour at Hampton Court Road

TRL Limited 40 UPR/T/035/06
Unpublished Project Report Version: Final
New Kings Road in figure 5-3 has high pedestrian flows in travel-to-work times and a low proportion of cyclists.
New Kings Road
0
200
400
600
Hour of Day
Num
ber o
f obs
erve
d cy
clist
s an
d pe
destr
ians
Pedestrians 96 444 324 168 168 228 192 120 528 312 216 264
Cyclists 10 28 18 12 8 7 3 7 13 12 17 21
07:00 08:00 09:00 10:00 11:00 12:00 13:00 14:00 15:00 16:00 17:00 18:00
Figure 5-3 Number of observed cyclists and pedestrians per hour at New Kings Road
Pall Mall in figure 5-4 has very high pedestrian flows and relatively low cycle flows.
Pall Mall
0
200400
600
800
1000
Hour of Day
Num
ber o
f obs
erve
d cy
clist
s an
d pe
destr
ians
Pedestrians 48 312 612 348 120 516 696 708 936 516 780 480
Cyclists 5 13 13 6 4 7 4 1 2 5 5 15
07:00 08:00 09:00 10:00 11:00 12:00 13:00 14:00 15:00 16:00 17:00 18:00
Figure 5-4 Number of observed cyclists and pedestrians per hour at Pall Mall

TRL Limited 41 UPR/T/035/06
Unpublished Project Report Version: Final
St Georges Circus in figure 5-5 appears to have a high proportion of cyclist flows which match the flow rate of pedestrians to some extent. The timing of flows suggests this route is used for commuting.
St Georges Circus
0
20
40
60
Hour of Day
Num
ber o
f obs
erve
d cy
clis
tan
d pe
dest
rians
Pedestrians 1 13 19 25 7 9 15 17 18 18 16 22
Cyclists 7 13 10 3 5 7 6 4 8 10 15 19
07:00 08:00 09:00 10:00 11:00 12:00 13:00 14:00 15:00 16:00 17:00 18:00
Figure 5-5 Number of observed cyclists and pedestrians per hour at St Georges Circus
Wandsworth in figure 5-6 below has very low cycle flows but high pedestrian flows.
Wandsworth
050
100
150200250
Hour of Day
Num
ber o
f obs
erve
d cy
clist
s an
d pe
destr
ians
Pedestrians 60 120 204 60 84 84 156 60 180 156 72 84
Cyclists 5 3 3 5 2 5 2 0 4 10 4 12
07:00 08:00 09:00 10:00 11:00 12:00 13:00 14:00 15:00 16:00 17:00 18:00
Figure 5-6 Number of observed cyclists and pedestrians per hour at Wandsworth Bridge Road
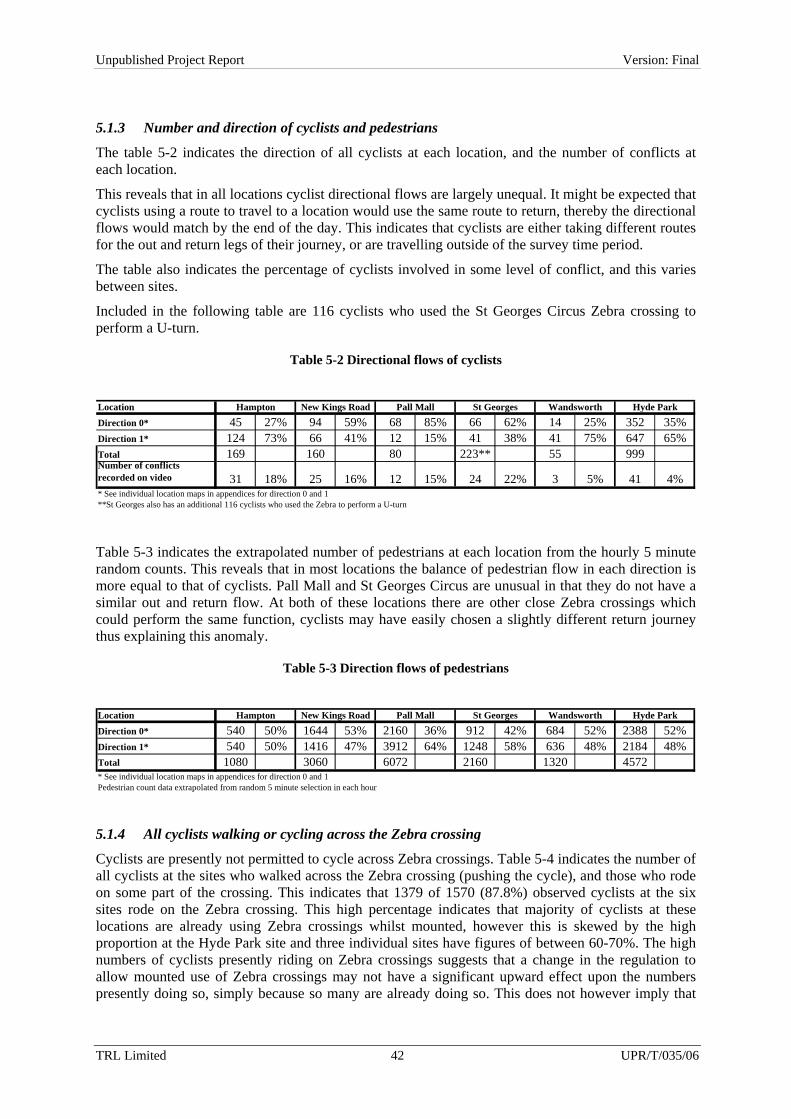
TRL Limited 42 UPR/T/035/06
Unpublished Project Report Version: Final
5.1.3 Number and direction of cyclists and pedestrians
The table 5-2 indicates the direction of all cyclists at each location, and the number of conflicts at each location.
This reveals that in all locations cyclist directional flows are largely unequal. It might be expected that cyclists using a route to travel to a location would use the same route to return, thereby the directional flows would match by the end of the day. This indicates that cyclists are either taking different routes for the out and return legs of their journey, or are travelling outside of the survey time period.
The table also indicates the percentage of cyclists involved in some level of conflict, and this varies between sites.
Included in the following table are 116 cyclists who used the St Georges Circus Zebra crossing to perform a U-turn.
Table 5-2 Directional flows of cyclists
Location
Direction 0* 45 27% 94 59% 68 85% 66 62% 14 25% 352 35%Direction 1* 124 73% 66 41% 12 15% 41 38% 41 75% 647 65%Total 169 160 80 223** 55 999Number of conflicts recorded on video 31 18% 25 16% 12 15% 24 22% 3 5% 41 4%* See individual location maps in appendices for direction 0 and 1**St Georges also has an additional 116 cyclists who used the Zebra to perform a U-turn
Wandsworth Hyde ParkHampton New Kings Road Pall Mall St Georges
Table 5-3 indicates the extrapolated number of pedestrians at each location from the hourly 5 minute random counts. This reveals that in most locations the balance of pedestrian flow in each direction is more equal to that of cyclists. Pall Mall and St Georges Circus are unusual in that they do not have a similar out and return flow. At both of these locations there are other close Zebra crossings which could perform the same function, cyclists may have easily chosen a slightly different return journey thus explaining this anomaly.
Table 5-3 Direction flows of pedestrians
Location
Direction 0* 540 50% 1644 53% 2160 36% 912 42% 684 52% 2388 52%Direction 1* 540 50% 1416 47% 3912 64% 1248 58% 636 48% 2184 48%Total 1080 3060 6072 2160 1320 4572* See individual location maps in appendices for direction 0 and 1Pedestrian count data extrapolated from random 5 minute selection in each hour
New Kings RoadHampton Hyde ParkWandsworthSt GeorgesPall Mall
5.1.4 All cyclists walking or cycling across the Zebra crossing
Cyclists are presently not permitted to cycle across Zebra crossings. Table 5-4 indicates the number of all cyclists at the sites who walked across the Zebra crossing (pushing the cycle), and those who rode on some part of the crossing. This indicates that 1379 of 1570 (87.8%) observed cyclists at the six sites rode on the Zebra crossing. This high percentage indicates that majority of cyclists at these locations are already using Zebra crossings whilst mounted, however this is skewed by the high proportion at the Hyde Park site and three individual sites have figures of between 60-70%. The high numbers of cyclists presently riding on Zebra crossings suggests that a change in the regulation to allow mounted use of Zebra crossings may not have a significant upward effect upon the numbers presently doing so, simply because so many are already doing so. This does not however imply that
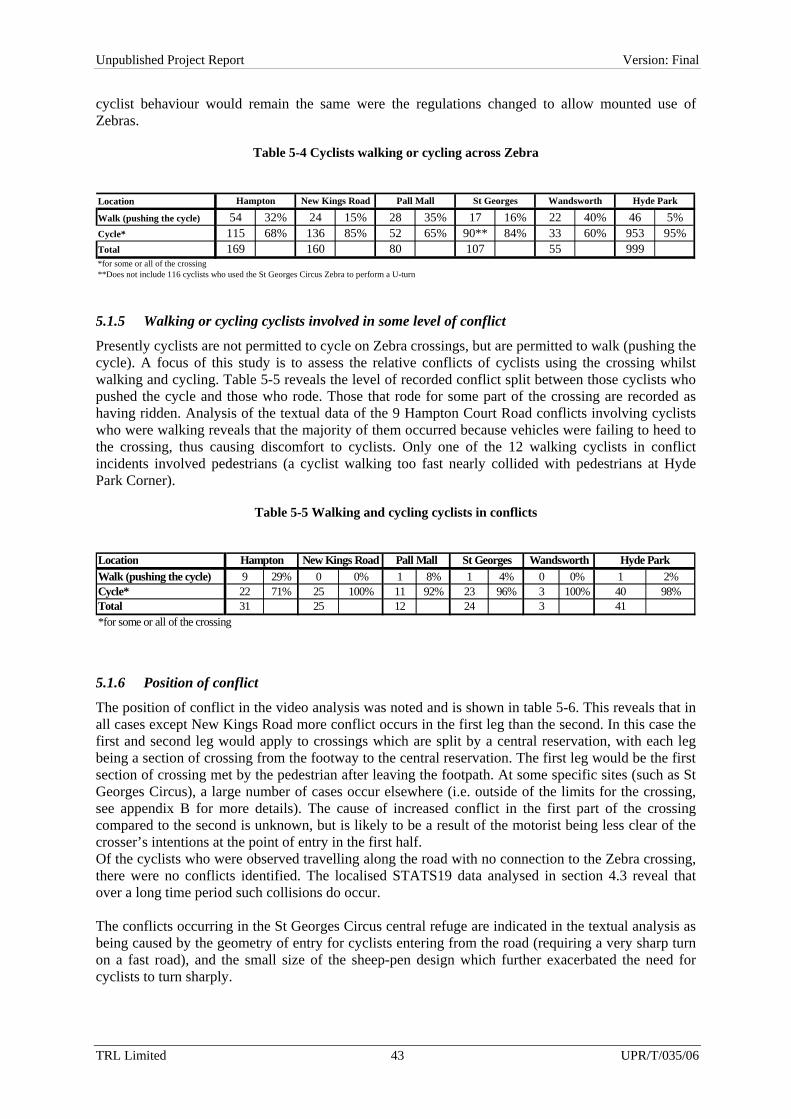
TRL Limited 43 UPR/T/035/06
Unpublished Project Report Version: Final
cyclist behaviour would remain the same were the regulations changed to allow mounted use of Zebras.
Table 5-4 Cyclists walking or cycling across Zebra
Location
Walk (pushing the cycle) 54 32% 24 15% 28 35% 17 16% 22 40% 46 5%Cycle* 115 68% 136 85% 52 65% 90** 84% 33 60% 953 95%Total 169 160 80 107 55 999*for some or all of the crossing**Does not include 116 cyclists who used the St Georges Circus Zebra to perform a U-turn
Wandsworth Hyde ParkHampton New Kings Road Pall Mall St Georges
5.1.5 Walking or cycling cyclists involved in some level of conflict
Presently cyclists are not permitted to cycle on Zebra crossings, but are permitted to walk (pushing the cycle). A focus of this study is to assess the relative conflicts of cyclists using the crossing whilst walking and cycling. Table 5-5 reveals the level of recorded conflict split between those cyclists who pushed the cycle and those who rode. Those that rode for some part of the crossing are recorded as having ridden. Analysis of the textual data of the 9 Hampton Court Road conflicts involving cyclists who were walking reveals that the majority of them occurred because vehicles were failing to heed to the crossing, thus causing discomfort to cyclists. Only one of the 12 walking cyclists in conflict incidents involved pedestrians (a cyclist walking too fast nearly collided with pedestrians at Hyde Park Corner).
Table 5-5 Walking and cycling cyclists in conflicts
LocationWalk (pushing the cycle) 9 29% 0 0% 1 8% 1 4% 0 0% 1 2%Cycle* 22 71% 25 100% 11 92% 23 96% 3 100% 40 98%Total 31 25 12 24 3 41*for some or all of the crossing
Hampton New Kings Road Pall Mall St Georges Wandsworth Hyde Park
5.1.6 Position of conflict
The position of conflict in the video analysis was noted and is shown in table 5-6. This reveals that in all cases except New Kings Road more conflict occurs in the first leg than the second. In this case the first and second leg would apply to crossings which are split by a central reservation, with each leg being a section of crossing from the footway to the central reservation. The first leg would be the first section of crossing met by the pedestrian after leaving the footpath. At some specific sites (such as St Georges Circus), a large number of cases occur elsewhere (i.e. outside of the limits for the crossing, see appendix B for more details). The cause of increased conflict in the first part of the crossing compared to the second is unknown, but is likely to be a result of the motorist being less clear of the crosser’s intentions at the point of entry in the first half. Of the cyclists who were observed travelling along the road with no connection to the Zebra crossing, there were no conflicts identified. The localised STATS19 data analysed in section 4.3 reveal that over a long time period such collisions do occur. The conflicts occurring in the St Georges Circus central refuge are indicated in the textual analysis as being caused by the geometry of entry for cyclists entering from the road (requiring a very sharp turn on a fast road), and the small size of the sheep-pen design which further exacerbated the need for cyclists to turn sharply.

TRL Limited 44 UPR/T/035/06
Unpublished Project Report Version: Final
Table 5-6 Position of conflict
Hampton New Kings Road
Pall Mall
St Georges Circus
Wandsworth Road Hyde Park Grand Total
First part of crossing 20 10 6 4 2 28 70Second part of crossing 11 15 5 2 1 10 44Central Refuge 0 0 0 4 0 0 4Outside of crossing area 0 0 1 14 0 3 18Total 31 25 12 24 3 41 136% at first part of crossing 65% 40% 50% 17% 67% 68% 51%
5.1.7 Visibility
Visibility at each site was reviewed using a standard of being able to see a pedestrian at the entrance to a crossing from the same side of the road, 70m upstream on the nearside pavement, and visa-versa. A researcher visited each site and assessed the visibility, using a clear view as good, slightly obscured or difficult to see as reasonable, and heavily or completely obscured as poor. This is indicated in table 5-7.
Table 5-7 Visibility at crossings
Hyde Park
Pall Mall
Hampton Court Road
St Georges Circus
Wandsworth Bridge Road
New Kings Road
Vehicle direction A Good Good Reasonable Good Good ReasonableVehicle direction B Good Good Poor Poor Good GoodPedestrian direction 1 Good Good Reasonable Good Good GoodPedestrian direction 2 Good Good Poor Poor Good Good
5.1.8 Review of general findings • Cyclist number and proportion compared to pedestrians at Zebra crossings varies greatly, with
55~999 cyclists using a crossing in a 12 hour diurnal period, and cyclists forming 1~18% of the total number of crossing users.
• Cycle flows tend to be tidal at some sites suggesting they are used as routes to work, others are more random. Furthermore these flows are less equal than pedestrians, suggesting different routes are taken on return journeys.
• The percentage of conflicts at each site is variable, from 4~18% of cyclists observed in some level of conflict.
• The majority of cyclists (87.8%) ride for some or all of the crossing across the sites. • More cyclists who cycled across the Zebra were involved in conflict in absolute numbers, however
much of this is due to more cyclists riding across than walking. • More conflict occurs in the first leg of a crossing than other places, in most cases.
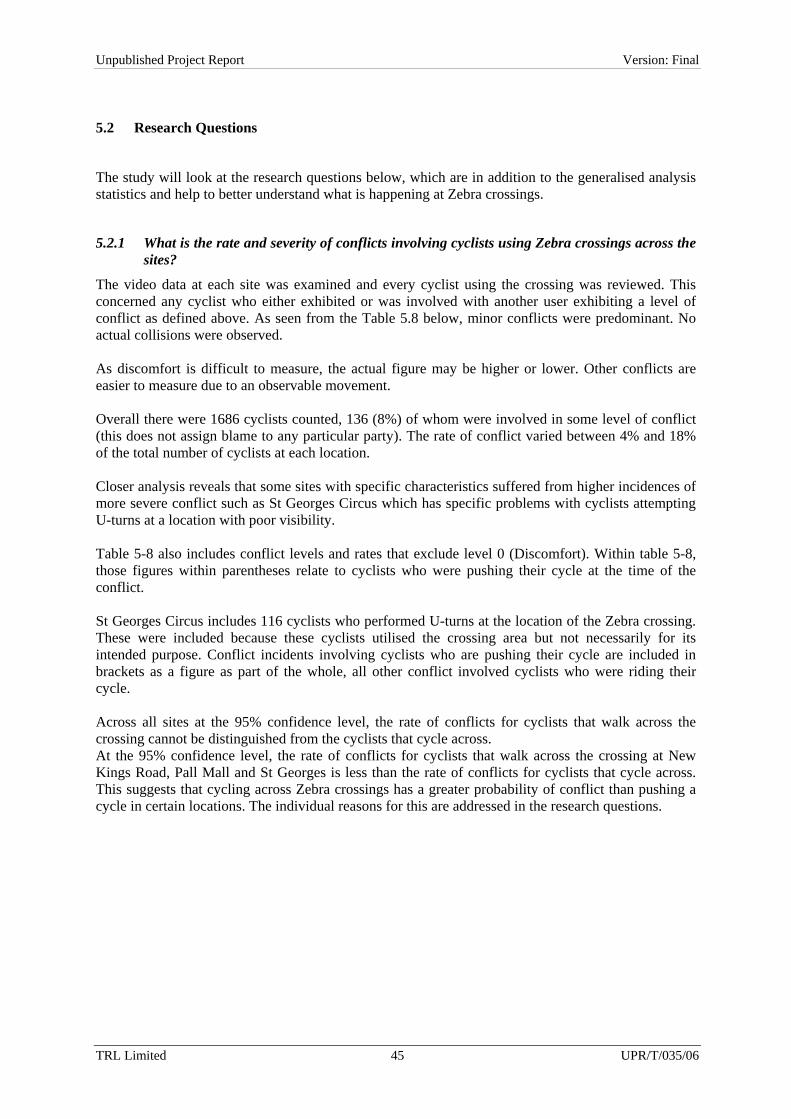
TRL Limited 45 UPR/T/035/06
Unpublished Project Report Version: Final
5.2 Research Questions
The study will look at the research questions below, which are in addition to the generalised analysis statistics and help to better understand what is happening at Zebra crossings.
5.2.1 What is the rate and severity of conflicts involving cyclists using Zebra crossings across the sites?
The video data at each site was examined and every cyclist using the crossing was reviewed. This concerned any cyclist who either exhibited or was involved with another user exhibiting a level of conflict as defined above. As seen from the Table 5.8 below, minor conflicts were predominant. No actual collisions were observed. As discomfort is difficult to measure, the actual figure may be higher or lower. Other conflicts are easier to measure due to an observable movement. Overall there were 1686 cyclists counted, 136 (8%) of whom were involved in some level of conflict (this does not assign blame to any particular party). The rate of conflict varied between 4% and 18% of the total number of cyclists at each location. Closer analysis reveals that some sites with specific characteristics suffered from higher incidences of more severe conflict such as St Georges Circus which has specific problems with cyclists attempting U-turns at a location with poor visibility. Table 5-8 also includes conflict levels and rates that exclude level 0 (Discomfort). Within table 5-8, those figures within parentheses relate to cyclists who were pushing their cycle at the time of the conflict. St Georges Circus includes 116 cyclists who performed U-turns at the location of the Zebra crossing. These were included because these cyclists utilised the crossing area but not necessarily for its intended purpose. Conflict incidents involving cyclists who are pushing their cycle are included in brackets as a figure as part of the whole, all other conflict involved cyclists who were riding their cycle. Across all sites at the 95% confidence level, the rate of conflicts for cyclists that walk across the crossing cannot be distinguished from the cyclists that cycle across. At the 95% confidence level, the rate of conflicts for cyclists that walk across the crossing at New Kings Road, Pall Mall and St Georges is less than the rate of conflicts for cyclists that cycle across. This suggests that cycling across Zebra crossings has a greater probability of conflict than pushing a cycle in certain locations. The individual reasons for this are addressed in the research questions.
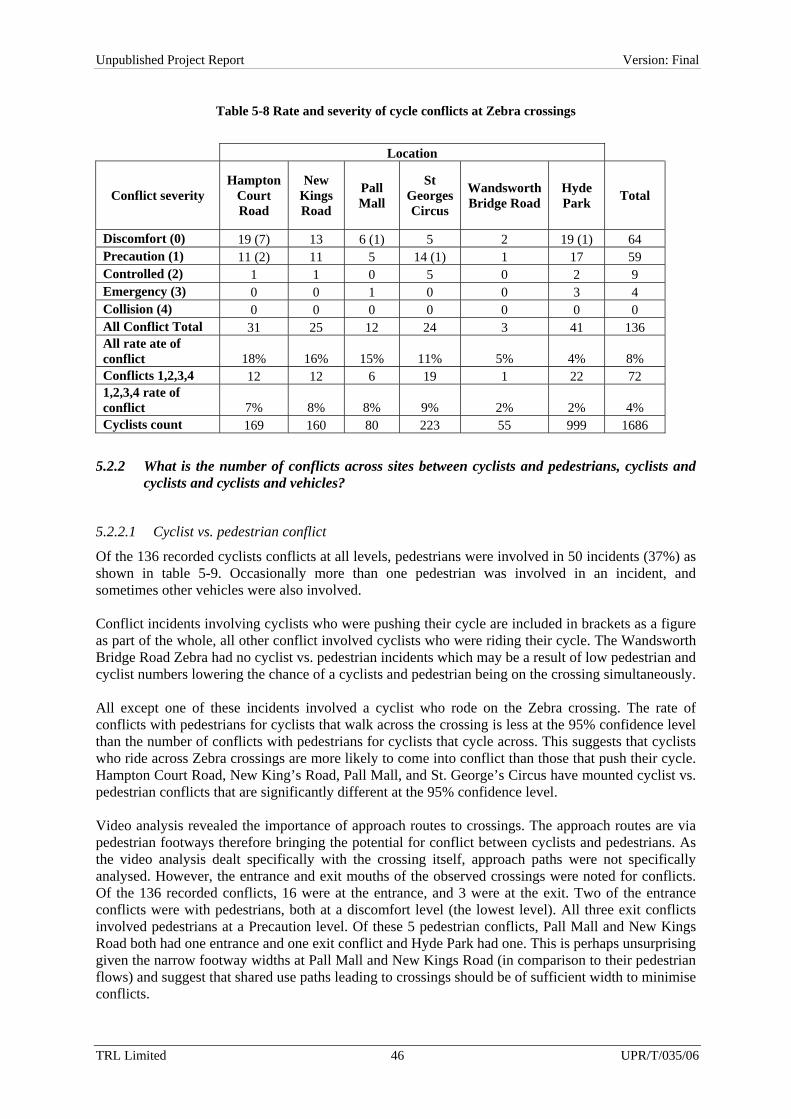
TRL Limited 46 UPR/T/035/06
Unpublished Project Report Version: Final
Table 5-8 Rate and severity of cycle conflicts at Zebra crossings
Location
Conflict severity Hampton
Court Road
New Kings Road
Pall Mall
St Georges Circus
Wandsworth Bridge Road
Hyde Park Total
Discomfort (0) 19 (7) 13 6 (1) 5 2 19 (1) 64 Precaution (1) 11 (2) 11 5 14 (1) 1 17 59 Controlled (2) 1 1 0 5 0 2 9 Emergency (3) 0 0 1 0 0 3 4 Collision (4) 0 0 0 0 0 0 0 All Conflict Total 31 25 12 24 3 41 136 All rate ate of conflict 18% 16% 15% 11% 5% 4% 8% Conflicts 1,2,3,4 12 12 6 19 1 22 72 1,2,3,4 rate of conflict 7% 8% 8% 9% 2% 2% 4% Cyclists count 169 160 80 223 55 999 1686
5.2.2 What is the number of conflicts across sites between cyclists and pedestrians, cyclists and cyclists and cyclists and vehicles?
5.2.2.1 Cyclist vs. pedestrian conflict
Of the 136 recorded cyclists conflicts at all levels, pedestrians were involved in 50 incidents (37%) as shown in table 5-9. Occasionally more than one pedestrian was involved in an incident, and sometimes other vehicles were also involved. Conflict incidents involving cyclists who were pushing their cycle are included in brackets as a figure as part of the whole, all other conflict involved cyclists who were riding their cycle. The Wandsworth Bridge Road Zebra had no cyclist vs. pedestrian incidents which may be a result of low pedestrian and cyclist numbers lowering the chance of a cyclists and pedestrian being on the crossing simultaneously. All except one of these incidents involved a cyclist who rode on the Zebra crossing. The rate of conflicts with pedestrians for cyclists that walk across the crossing is less at the 95% confidence level than the number of conflicts with pedestrians for cyclists that cycle across. This suggests that cyclists who ride across Zebra crossings are more likely to come into conflict than those that push their cycle. Hampton Court Road, New King’s Road, Pall Mall, and St. George’s Circus have mounted cyclist vs. pedestrian conflicts that are significantly different at the 95% confidence level. Video analysis revealed the importance of approach routes to crossings. The approach routes are via pedestrian footways therefore bringing the potential for conflict between cyclists and pedestrians. As the video analysis dealt specifically with the crossing itself, approach paths were not specifically analysed. However, the entrance and exit mouths of the observed crossings were noted for conflicts. Of the 136 recorded conflicts, 16 were at the entrance, and 3 were at the exit. Two of the entrance conflicts were with pedestrians, both at a discomfort level (the lowest level). All three exit conflicts involved pedestrians at a Precaution level. Of these 5 pedestrian conflicts, Pall Mall and New Kings Road both had one entrance and one exit conflict and Hyde Park had one. This is perhaps unsurprising given the narrow footway widths at Pall Mall and New Kings Road (in comparison to their pedestrian flows) and suggest that shared use paths leading to crossings should be of sufficient width to minimise conflicts.

TRL Limited 47 UPR/T/035/06
Unpublished Project Report Version: Final
Table 5-9 Cyclist vs. pedestrian conflict
Hampton Court Road
New Kings Road
Pall MallSt
Georges Circus
Wandsworth Bridge Road
Hyde Park Total
Discomfort (0) 4 7 4 0 0 5 (1) 20Precaution (1) 2 5 2 8 0 9 26Controlled (2) 1 0 0 1 0 0 2Emergency (3) 0 0 1 0 0 1 2Collision (4) 0 0 0 0 0 0 0Cyclist vs. Pedestrian Conflict Total
7 12 7 9 0 15 50
All types of conflict Total 31 25 12 24 3 41 136
Total Cyclists count 169 160 80 223 55 999 1686
% conflict situations that are cyclist vs. pedestrian
23% 48% 58% 38% 0% 37% 37%
% total cyclists involved in a conflict with a pedestrian
4% 8% 9% 4% 0% 2% 3%
Location
5.2.2.2 Cyclist vs. cyclist conflict
The number of cyclist vs. cyclist conflicts is extremely low as shown in table 5-10 and tends to involve changes in direction to avoid each other with little chance of collision. The likely cause of this low number of conflicts are the low levels of cyclists in opposing directions. All cyclist vs. cyclist conflicts involved cyclists who rode across the crossing.
Table 5-10 Cyclist vs. cyclist conflict
Severity Hampton Court Road
Hyde Park
New Kings Road Pall Mall St Georges
CircusWandsworth Bridge Road Total
Discomfort (0) 0 1 0 0 0 0 1Precaution (1) 2 3 1 0 3 0 9Controlled (2) 0 0 0 0 1 0 1Emergency (3) 0 0 0 0 0 0 0Collision (4) 0 0 0 0 0 0 0
Total 2 4 1 0 4 0 11
Location
5.2.2.3 Cyclist vs. vehicle (car, HGV, motorcycle, Light Goods)
Cyclist conflicts involving vehicles such as cars, HGVs, motorcycles, and light goods vehicles occurred 98 times (72% of all conflicts) in table 5-11. It should be noted that some of these conflicts also involved other cyclists and pedestrians in the same incident.
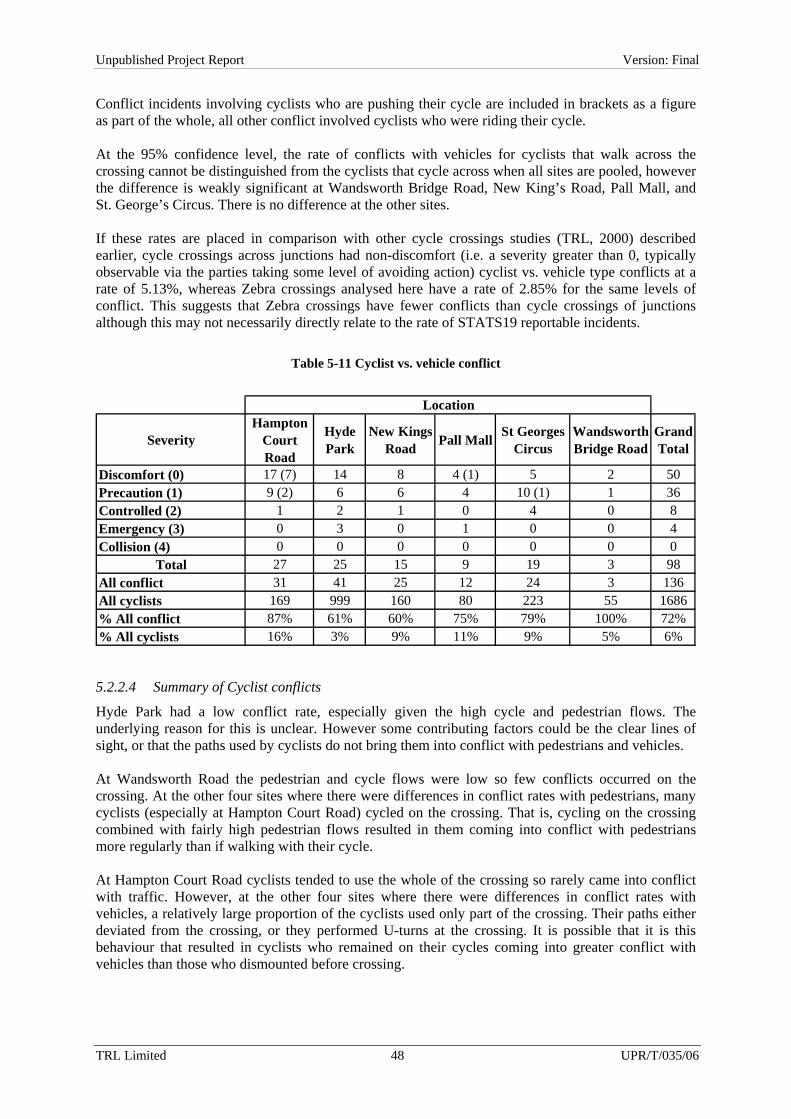
TRL Limited 48 UPR/T/035/06
Unpublished Project Report Version: Final
Conflict incidents involving cyclists who are pushing their cycle are included in brackets as a figure as part of the whole, all other conflict involved cyclists who were riding their cycle. At the 95% confidence level, the rate of conflicts with vehicles for cyclists that walk across the crossing cannot be distinguished from the cyclists that cycle across when all sites are pooled, however the difference is weakly significant at Wandsworth Bridge Road, New King’s Road, Pall Mall, and St. George’s Circus. There is no difference at the other sites. If these rates are placed in comparison with other cycle crossings studies (TRL, 2000) described earlier, cycle crossings across junctions had non-discomfort (i.e. a severity greater than 0, typically observable via the parties taking some level of avoiding action) cyclist vs. vehicle type conflicts at a rate of 5.13%, whereas Zebra crossings analysed here have a rate of 2.85% for the same levels of conflict. This suggests that Zebra crossings have fewer conflicts than cycle crossings of junctions although this may not necessarily directly relate to the rate of STATS19 reportable incidents.
Table 5-11 Cyclist vs. vehicle conflict
SeverityHampton
Court Road
Hyde Park
New Kings Road Pall Mall St Georges
CircusWandsworth Bridge Road
Grand Total
Discomfort (0) 17 (7) 14 8 4 (1) 5 2 50Precaution (1) 9 (2) 6 6 4 10 (1) 1 36Controlled (2) 1 2 1 0 4 0 8Emergency (3) 0 3 0 1 0 0 4Collision (4) 0 0 0 0 0 0 0
Total 27 25 15 9 19 3 98All conflict 31 41 25 12 24 3 136All cyclists 169 999 160 80 223 55 1686% All conflict 87% 61% 60% 75% 79% 100% 72%% All cyclists 16% 3% 9% 11% 9% 5% 6%
Location
5.2.2.4 Summary of Cyclist conflicts
Hyde Park had a low conflict rate, especially given the high cycle and pedestrian flows. The underlying reason for this is unclear. However some contributing factors could be the clear lines of sight, or that the paths used by cyclists do not bring them into conflict with pedestrians and vehicles. At Wandsworth Road the pedestrian and cycle flows were low so few conflicts occurred on the crossing. At the other four sites where there were differences in conflict rates with pedestrians, many cyclists (especially at Hampton Court Road) cycled on the crossing. That is, cycling on the crossing combined with fairly high pedestrian flows resulted in them coming into conflict with pedestrians more regularly than if walking with their cycle. At Hampton Court Road cyclists tended to use the whole of the crossing so rarely came into conflict with traffic. However, at the other four sites where there were differences in conflict rates with vehicles, a relatively large proportion of the cyclists used only part of the crossing. Their paths either deviated from the crossing, or they performed U-turns at the crossing. It is possible that it is this behaviour that resulted in cyclists who remained on their cycles coming into greater conflict with vehicles than those who dismounted before crossing.
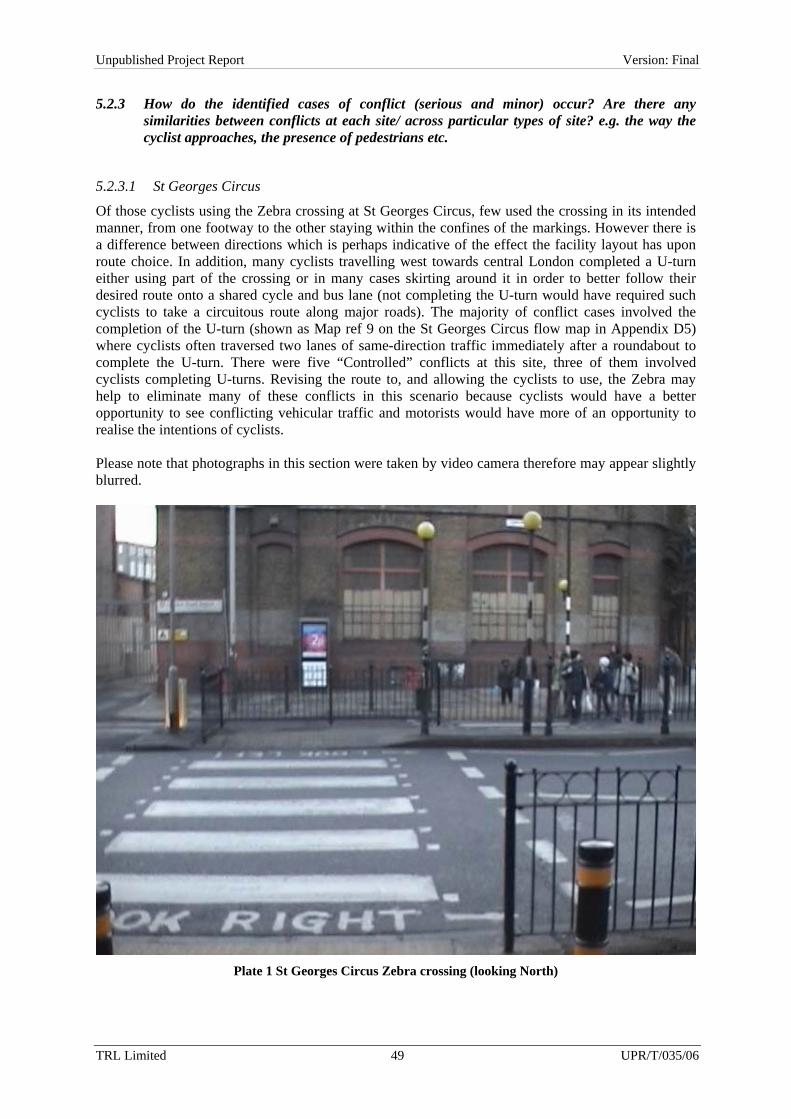
TRL Limited 49 UPR/T/035/06
Unpublished Project Report Version: Final
5.2.3 How do the identified cases of conflict (serious and minor) occur? Are there any similarities between conflicts at each site/ across particular types of site? e.g. the way the cyclist approaches, the presence of pedestrians etc.
5.2.3.1 St Georges Circus
Of those cyclists using the Zebra crossing at St Georges Circus, few used the crossing in its intended manner, from one footway to the other staying within the confines of the markings. However there is a difference between directions which is perhaps indicative of the effect the facility layout has upon route choice. In addition, many cyclists travelling west towards central London completed a U-turn either using part of the crossing or in many cases skirting around it in order to better follow their desired route onto a shared cycle and bus lane (not completing the U-turn would have required such cyclists to take a circuitous route along major roads). The majority of conflict cases involved the completion of the U-turn (shown as Map ref 9 on the St Georges Circus flow map in Appendix D5) where cyclists often traversed two lanes of same-direction traffic immediately after a roundabout to complete the U-turn. There were five “Controlled” conflicts at this site, three of them involved cyclists completing U-turns. Revising the route to, and allowing the cyclists to use, the Zebra may help to eliminate many of these conflicts in this scenario because cyclists would have a better opportunity to see conflicting vehicular traffic and motorists would have more of an opportunity to realise the intentions of cyclists. Please note that photographs in this section were taken by video camera therefore may appear slightly blurred.
Plate 1 St Georges Circus Zebra crossing (looking North)
TRL Limited 50 UPR/T/035/06
Unpublished Project Report Version: Final
The central refuge at this location has a “sheep-pen” design which prevents direct movement across the Zebra. In some cases this caused minor conflict between cyclists and pedestrians or other cyclists. Also the layout would prevent many of the cyclists completing the U-turn at the site from entering the central refuge (as this would require a 180 degree sharp turn from a busy road), thereby requiring them to wait in a small patch of tarmac just beyond the central refuge whilst waiting for an opportunity to turn. The Northbound lane of the road passing through the Zebra is a shared use bus and cycle lane. Many of the cyclists travelling in that direction chose to enter this road directly from the central refuge rather than completing the crossing to the opposite footpath, then remounting and rejoining the road. This has the advantage of efficiency, it also allows the cyclists time to enter the vehicle stream in advance of traffic in a similar manner to that of an ASL or priority junction because traffic stops to allow them to use the crossing. In addition to U-turn incidents, two “Controlled” conflicts occurred, one due to a taxi pulling across the Zebra, the other involved a cyclist travelling the wrong direction down a road from the crossing and conflicting with another cyclist. The footways at either side of the road are relatively wide and no conflict was noticed with pedestrians at these points. St Georges Summary
• Cycle routes to the Zebra should avoid conflict with traffic • Central refuges and sheep-pens (where they are deemed necessary) should be of sufficient
size and shape to accommodate pedestrian and cyclist movements. • Entering the road from the central refuge is positive as it acts as a priority junction
(because traffic stops to allow the cyclist to cross, which gives the cyclist the opportunity to join the carriageway ahead of vehicles).
• Entering the central refuge from the road can be hazardous because the refuge and crossing is being used effectively as a right-turn junction in a location that is not signed as such (so drivers may be unaware of the manoeuvre cyclists wish to perform), furthermore the central refuge is too small to allow for a turn into it at a reasonable speed.
• Wide footways minimise pedestrian conflict
5.2.3.2 Pall Mall
Pall Mall had a high proportion of pedestrians to cyclists and has narrow footways at both sides, this brought conflict between pedestrians and cyclists, perhaps indicating that at high flow levels more space is required to accommodate cyclists and pedestrians. Many cyclists appeared to travel up Waterloo Place from the south, and are constricted from direct movement due to a raised central reservation. Using the Zebra properly would have required mounting the footway on one side and dismounting on the other. Many cyclists took advantage of the fact that the central refuge on the Zebra was not raised and altered their course to arc through it. However, when performing this manoeuvre many came into conflict with vehicles passing along Pall Mall. The only “Emergency” conflict at this location involved a similar incident where a cyclist, apparently confused by the one-way road and looking in the opposite direction, performs an emergency stop upon noticing a van travelling in the correct direction. The van had noticed the cyclist in advance and had stopped appropriately. No cyclist in a video analysis conflict waited in the central refuge. The central refuge at Pall Mall is 1.2 metres, which is too small to accommodate a cycle and may have influenced the cyclist’s decision not to stop.

TRL Limited 51 UPR/T/035/06
Unpublished Project Report Version: Final
Pall Mall Summary • Pedestrian conflict will occur with small footways and high flow rates • Cyclists will avoid an upstanding kerb if an suitable alternative is available • Routes to the Zebra should control conflict with road traffic • Facilities should be designed that allow for cyclist behaviour • Routes for cyclists should be designed that allow for their movement at a realistic design
speed • Unusual road layout warnings should be communicated to users • Good practice should provide for central refuges which are wide enough to accommodate
cycles
Plate 2 Pall Mall (looking West)
5.2.3.3 Hampton Court Road
Pedestrians and cyclists alike were particularly good at passing properly from one side of the road to the other using the Zebra crossing at this location. The reasons for this are unknown but may be influenced by the limitation on routes from the Zebra area and the relatively high (12cm) kerb (making straight-across the most convenient route) and that both directions of traffic are two lane on a busy road. This may encourage crossing users to cross properly in order to reduce their time in the path of road traffic. Conflict often occurs at this location due to vehicles queuing at the roundabout to the immediate North blocking the Zebra crossing. Cyclists would attempt to filter through stopped traffic on this two-lane section. The only “Controlled” conflict at this location involved a vehicle in the outside lane moving across the Zebra whilst a cyclist was on the crossing, filtering across blocking traffic on the nearside lane, this necessitated the cyclist to swerve around this vehicle to avoid a collision. It is likely that queuing traffic on the nearside lane reduced the visibility of the cyclist and motorist. Some conflict occurred between cyclists and pedestrians on the crossing, a wider crossing or a separate cycle lane might avoid these problems. Many cyclists entered the area of road before the central reservation from the offside of the road and then utilised the second leg of the Zebra to cross, presumably to connect with the cycle track on the other side. Speculatively this point was chosen by cyclists because of the dropped kerb that would allow entry to the cycle path, and the inferred protection and priority that the Zebra would give them from traffic. No cyclist appeared to have difficulty in entering the area from the offside in contrast to

TRL Limited 52 UPR/T/035/06
Unpublished Project Report Version: Final
St Georges Circus where a similar manoeuvre caused conflict. The likely reason for this is that the St Georges Circus Zebra is placed immediately after a tight curve whereas the Hampton Court Road is straight from the south immediately preceding the Zebra. Of 31 conflicts observed on the video analysis for this site, 23 related to cyclists using the crossing in a northern direction which only had 45 crossings (27% of the total) in the day, indicating that around half were involved in some level of conflict. The possible explanation for this high figure is the roundabout immediately east of the crossing and the limited car visibility splay. Also cyclists coming from Kingston Bridge would be required to look behind them to see approaching cars. Hampton Court Road Summary
• Pedestrians and cyclists will take their most convenient route, having regard for safety • Kerb height may have some influence on proper use of the crossing • Traffic moving along the road should avoid stopping on the crossing and obscuring
pedestrians or cyclists on the crossing • Wider crossings would allow easier passage of cyclists and pedestrians using the crossing • A clear line of sight before a central reservation would allow cyclists to enter it from the
offside of a lane • A clear line of visibility for road and crossing users would allow users to see each other
and avoid conflict • Approaches that require a cyclist to look behind them before turning onto the junction
should be avoided
Plate 3 Hampton Court Road (looking North-East)
5.2.3.4 New Kings Road
Pedestrians using the New Kings Road Zebra crossing did so with high fidelity to the rules (89% in both directions use the crossing properly without cutting corners). The high kerbstones (12cm on one side) and junction next to the crossing may have influenced this. Many cyclists however used the dropped kerb on the northern side of the crossing to enter or exit the Zebra with the opposite end of

TRL Limited 53 UPR/T/035/06
Unpublished Project Report Version: Final
their journey being directly via Peterborough Road. This is the cause of some conflict with vehicles with cyclists often diverting from the crossing and filtering across road traffic that is caught in congestion. Conflict also occurs with pedestrians on the crossing. The only “Controlled” conflict occurred when a cyclist on the crossing was apparently cautious as to the intentions of a vehicle driver emerging from Peterborough Road and quickly dismounted. Cyclists in conflict tend not to wait in the central refuge (18 of 25 conflict cases passed through the refuge but did not stop). As with Pall Mall, the refuge is only 1.2 metres in width which may have deterred stopping.
Plate 4 New Kings Road (looking West)
New Kings Road Summary
• Cyclists appear to take the most convenient route, this should be managed (by either managing the route taken by cyclists or the traffic on the road) if this route causes conflict
• High kerbs can be used to influence cycle and pedestrian route • More space on and around the Zebra should reduce conflict with pedestrians • It may be good practice to provide refuges which are large enough to accommodate
cyclists
5.2.3.5 Wandsworth Bridge Road
This crossing recorded very low crossing rates, 55 cyclists in one day, and only 3 cases of conflict, therefore little can be noted regarding behaviour at the site. Those travelling West on the Stephendale Road (shown in dashed line in figure 5-7) on the LCN network tended to avoid using the dropped kerb of the Zebra crossing on the west side and diverted directly back onto Hugon Road, this makes a small deviation from the intended use of a Zebra which is to travel from one side to the other. This route would allow them to leave and re-enter Hugon Road from the correct side of the road with little detour. Those travelling in the opposite direction (shown in the solid line figure 5-7) tended to use the crossing properly even though this involved a considerable detour. The probable reason for this revolves around the route to the crossing and the relative benefit this presents to the cyclist compared to the perceived risks involved in crossing in another manner.
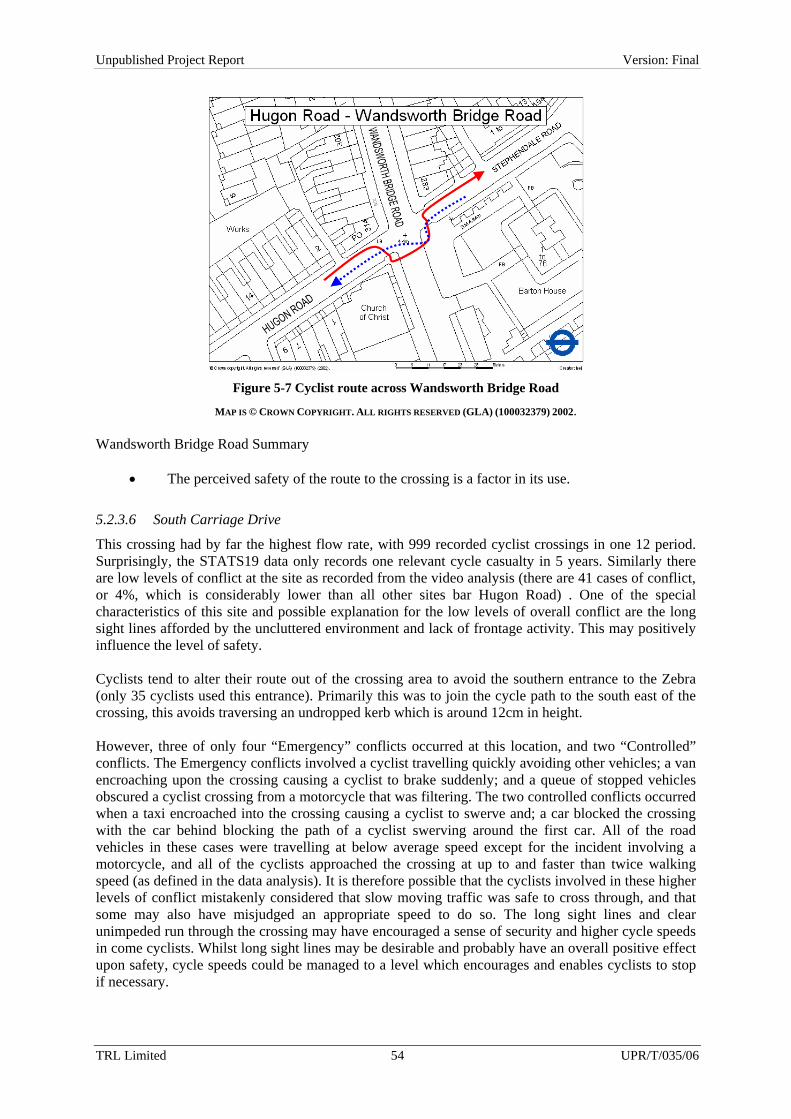
TRL Limited 54 UPR/T/035/06
Unpublished Project Report Version: Final
Figure 5-7 Cyclist route across Wandsworth Bridge Road
MAP IS © CROWN COPYRIGHT. ALL RIGHTS RESERVED (GLA) (100032379) 2002. Wandsworth Bridge Road Summary
• The perceived safety of the route to the crossing is a factor in its use.
5.2.3.6 South Carriage Drive
This crossing had by far the highest flow rate, with 999 recorded cyclist crossings in one 12 period. Surprisingly, the STATS19 data only records one relevant cycle casualty in 5 years. Similarly there are low levels of conflict at the site as recorded from the video analysis (there are 41 cases of conflict, or 4%, which is considerably lower than all other sites bar Hugon Road) . One of the special characteristics of this site and possible explanation for the low levels of overall conflict are the long sight lines afforded by the uncluttered environment and lack of frontage activity. This may positively influence the level of safety. Cyclists tend to alter their route out of the crossing area to avoid the southern entrance to the Zebra (only 35 cyclists used this entrance). Primarily this was to join the cycle path to the south east of the crossing, this avoids traversing an undropped kerb which is around 12cm in height. However, three of only four “Emergency” conflicts occurred at this location, and two “Controlled” conflicts. The Emergency conflicts involved a cyclist travelling quickly avoiding other vehicles; a van encroaching upon the crossing causing a cyclist to brake suddenly; and a queue of stopped vehicles obscured a cyclist crossing from a motorcycle that was filtering. The two controlled conflicts occurred when a taxi encroached into the crossing causing a cyclist to swerve and; a car blocked the crossing with the car behind blocking the path of a cyclist swerving around the first car. All of the road vehicles in these cases were travelling at below average speed except for the incident involving a motorcycle, and all of the cyclists approached the crossing at up to and faster than twice walking speed (as defined in the data analysis). It is therefore possible that the cyclists involved in these higher levels of conflict mistakenly considered that slow moving traffic was safe to cross through, and that some may also have misjudged an appropriate speed to do so. The long sight lines and clear unimpeded run through the crossing may have encouraged a sense of security and higher cycle speeds in come cyclists. Whilst long sight lines may be desirable and probably have an overall positive effect upon safety, cycle speeds could be managed to a level which encourages and enables cyclists to stop if necessary.

TRL Limited 55 UPR/T/035/06
Unpublished Project Report Version: Final
South Carriage Drive Summary
• Long sight lines appear to contribute towards a lower level of recorded casualties however they may encourage more risky behaviour such as high cycle approach speeds, and this is reflected in the incidents of more serious conflicts observed at this site.
• Cyclists will alter their route to avoid kerb upstands • Cars should be discouraged from encroaching onto the crossing • Cycle crossing speeds should be managed
5.2.4 How do the reported cases of collisions compare with the cases of conflict (numbers and descriptions) for each site and across sites?
Appendix D contains a description of each STATS19 reported incident at each of the six sites for the time period of 2000 to 2004, individual cases were examined and those that were not relevant were deleted, typically this involved reported incidents that were within 20m of a Zebra thus were highlighted in the STATS19 data, but in reality were at another facility. The relevant cases are described in Appendix A. It is important to note that the number of reported cases (14) is small and statistically insignificant at any given site.
5.2.4.1 Hampton Court Road west of Kingston Bridge site
One reported STATS19 incident here of a pedestrian struck by a car failing to stop. Analysis of the textual descriptions of conflicts in the video analysis of the 31 conflict cases at this site, 26 involved vehicles either stopping on the crossing and causing an obstruction, passing whilst cyclists are on the crossing, or failing to stop. This suggests that the characteristics of the reported incident are not uncommon and could be addressed to improve safety.
5.2.4.2 Wandsworth Bridge Road at Hugon Road site
Three reported STATS19 incidents here, two of which involved children crossing heedlessly, a third which involved an adult being struck by a vehicle turning onto Wandsworth Bridge Road. Analysis of textual description of the video analysis shows only three cases, one of which involved a vehicle turning onto Wandsworth Bridge Road from Hugon Road (a similar incident to a recorded STATS19 incident).
5.2.4.3 New Kings Road at Peterborough Road
The two recorded STATS19 incidents at this site involved pedestrians crossing without heeding to traffic, one of whom was intoxicated. The textual data does not reveal similar incidents.
5.2.4.4 Hyde Park Corner at South Carriage Drive
One recorded STATS19 incident at this location involved a cyclist crossing in front of a vehicle and being struck. Some of the video analysis recorded similar incidents, with cyclists using the crossing and vehicle drivers failing to give way in 20 of the total 41 cases.
5.2.4.5 Pall Mall at Waterloo Place
Five recorded STATS19 incidents at this location. One incident involved a cyclist riding off the pavement into the path of an oncoming vehicle, another of the cyclist using the Zebra crossing as a junction to turn right. This closely mirrors observed behaviour in the video with cyclists not adequately observing other vehicles on the road in 9 out of 12 video cases resulting in conflict. Video data analysis reveals that seven of these nine cases of conflict involved cyclists joining Pall Mall from Waterloo Place and cutting across the lane of traffic to use the crossing instead of travelling down Pall
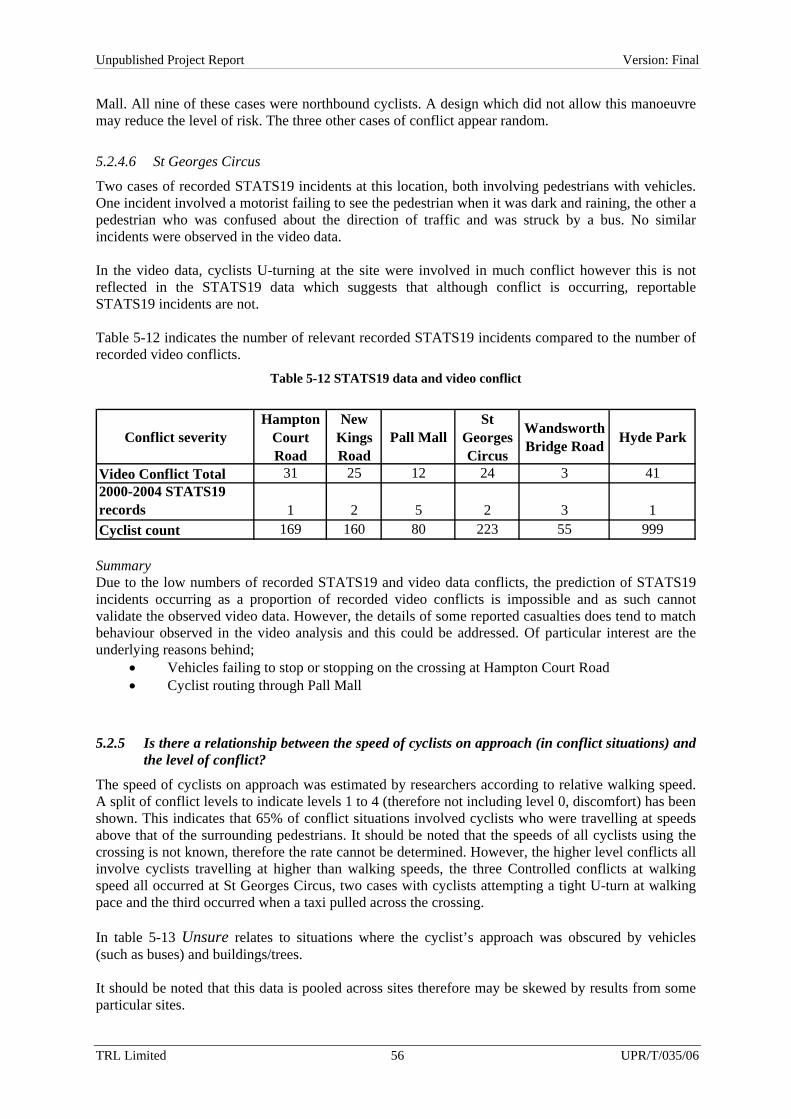
TRL Limited 56 UPR/T/035/06
Unpublished Project Report Version: Final
Mall. All nine of these cases were northbound cyclists. A design which did not allow this manoeuvre may reduce the level of risk. The three other cases of conflict appear random.
5.2.4.6 St Georges Circus
Two cases of recorded STATS19 incidents at this location, both involving pedestrians with vehicles. One incident involved a motorist failing to see the pedestrian when it was dark and raining, the other a pedestrian who was confused about the direction of traffic and was struck by a bus. No similar incidents were observed in the video data. In the video data, cyclists U-turning at the site were involved in much conflict however this is not reflected in the STATS19 data which suggests that although conflict is occurring, reportable STATS19 incidents are not. Table 5-12 indicates the number of relevant recorded STATS19 incidents compared to the number of recorded video conflicts.
Table 5-12 STATS19 data and video conflict
Conflict severityHampton
Court Road
New Kings Road
Pall MallSt
Georges Circus
Wandsworth Bridge Road Hyde Park
Video Conflict Total 31 25 12 24 3 412000-2004 STATS19 records 1 2 5 2 3 1Cyclist count 169 160 80 223 55 999 Summary Due to the low numbers of recorded STATS19 and video data conflicts, the prediction of STATS19 incidents occurring as a proportion of recorded video conflicts is impossible and as such cannot validate the observed video data. However, the details of some reported casualties does tend to match behaviour observed in the video analysis and this could be addressed. Of particular interest are the underlying reasons behind;
• Vehicles failing to stop or stopping on the crossing at Hampton Court Road • Cyclist routing through Pall Mall
5.2.5 Is there a relationship between the speed of cyclists on approach (in conflict situations) and the level of conflict?
The speed of cyclists on approach was estimated by researchers according to relative walking speed. A split of conflict levels to indicate levels 1 to 4 (therefore not including level 0, discomfort) has been shown. This indicates that 65% of conflict situations involved cyclists who were travelling at speeds above that of the surrounding pedestrians. It should be noted that the speeds of all cyclists using the crossing is not known, therefore the rate cannot be determined. However, the higher level conflicts all involve cyclists travelling at higher than walking speeds, the three Controlled conflicts at walking speed all occurred at St Georges Circus, two cases with cyclists attempting a tight U-turn at walking pace and the third occurred when a taxi pulled across the crossing. In table 5-13 Unsure relates to situations where the cyclist’s approach was obscured by vehicles (such as buses) and buildings/trees. It should be noted that this data is pooled across sites therefore may be skewed by results from some particular sites.
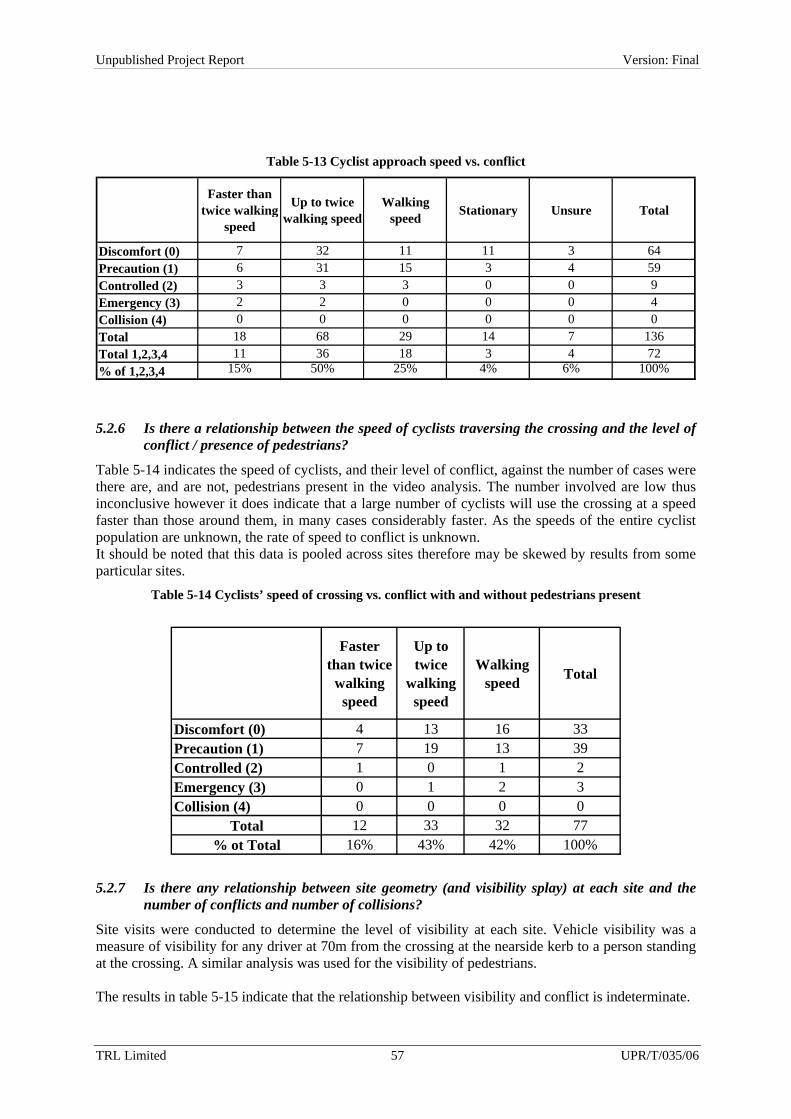
TRL Limited 57 UPR/T/035/06
Unpublished Project Report Version: Final
Table 5-13 Cyclist approach speed vs. conflict
Faster than twice walking
speed
Up to twice walking speed
Walking speed Stationary Unsure Total
Discomfort (0) 7 32 11 11 3 64Precaution (1) 6 31 15 3 4 59Controlled (2) 3 3 3 0 0 9Emergency (3) 2 2 0 0 0 4Collision (4) 0 0 0 0 0 0Total 18 68 29 14 7 136Total 1,2,3,4 11 36 18 3 4 72% of 1,2,3,4 15% 50% 25% 4% 6% 100%
5.2.6 Is there a relationship between the speed of cyclists traversing the crossing and the level of conflict / presence of pedestrians?
Table 5-14 indicates the speed of cyclists, and their level of conflict, against the number of cases were there are, and are not, pedestrians present in the video analysis. The number involved are low thus inconclusive however it does indicate that a large number of cyclists will use the crossing at a speed faster than those around them, in many cases considerably faster. As the speeds of the entire cyclist population are unknown, the rate of speed to conflict is unknown. It should be noted that this data is pooled across sites therefore may be skewed by results from some particular sites.
Table 5-14 Cyclists’ speed of crossing vs. conflict with and without pedestrians present
Faster than twice
walking speed
Up to twice
walking speed
Walking speed Total
Discomfort (0) 4 13 16 33Precaution (1) 7 19 13 39Controlled (2) 1 0 1 2Emergency (3) 0 1 2 3Collision (4) 0 0 0 0
Total 12 33 32 77% ot Total 16% 43% 42% 100%
5.2.7 Is there any relationship between site geometry (and visibility splay) at each site and the number of conflicts and number of collisions?
Site visits were conducted to determine the level of visibility at each site. Vehicle visibility was a measure of visibility for any driver at 70m from the crossing at the nearside kerb to a person standing at the crossing. A similar analysis was used for the visibility of pedestrians. The results in table 5-15 indicate that the relationship between visibility and conflict is indeterminate.

TRL Limited 58 UPR/T/035/06
Unpublished Project Report Version: Final
A researcher visited each site and assessed the visibility, using a clear view as good, slightly obscured or difficult to see as reasonable, and heavily or completely obscured as poor. Explanations of vehicle directions and pedestrian directions at each site can be seen in the appendices.
Table 5-15 “Traditional” visibility splays related to conflict
Hyde Park Pall MallHampton
Court Road
St Georges Circus
Wandsworth Bridge Road
New Kings Road
Vehicle direction A Good Good Reasonable Good Good ReasonableVehicle direction B Good Good Poor Poor Good GoodPedestrian direction 1 Good Good Reasonable Good Good GoodPedestrian direction 2 Good Good Poor Poor Good GoodConflict Total 41 12 31 24 3 25Cyclists count 999 80 169 223 55 160Rate of conflict 4% 15% 18% 11% 5% 16% Cyclists approach the Zebra entry point from a number of different angles as seen from the flow maps in the appendices. The conflict analysis noted the approach method of cyclists in conflict at the crossing. In table 5-16, 180° to view traffic means that the cyclist would have had to look behind them to view the first lane of traffic they would come across (i.e. they were travelling in the same direction as the traffic), and includes those that were travelling along the path and the road. 90° to view traffic means that the approach method was at right angles to the road, 0° to view traffic means that the cyclist was travelling on the path with the nearest lane of traffic approaching them. 0° to view conflicting traffic means those cyclists who travelled up the offside of a lane and crossed, therefore oncoming traffic was directly in their field of view. Table 5-16 indicates that field of view from a cyclist’s perspective has an effect upon the number of conflicts, but not necessarily rate. Those cyclists who have to look behind them before crossing were involved in 57% of conflicts, 17% of conflicts involved those at right angles to the traffic, 13% (7% and 6%) were facing the traffic on approach, and 13% of cases were indeterminable due to impeding objects obscuring the camera angle (such as buses and trees). Caution should be taken as the rate of each type of approach angle is unknown, therefore whilst those looking behind them before crossing have higher numbers involved in conflict, the percentage of all cyclists completing this manoeuvre involved in conflict may actually be lower than those involved in other manoeuvres. All of the “emergency” level conflicts and over half of the “controlled” level conflicts occurred with cyclists who had to look behind them to view traffic. This suggests that angle of approach is related to level of observed conflict. It should be noted that this data is pooled across sites therefore may be skewed by results from some particular sites.

TRL Limited 59 UPR/T/035/06
Unpublished Project Report Version: Final
Table 5-16 View to traffic before crossing vs. conflict
180° to view
traffic
90° to view traffic
0° to view traffic
0° to view conflicting
traffic (from offside of
traffic lane)
Unsure Total
Discomfort (0) 38 9 2 6 9 64Precaution (1) 31 12 7 1 8 59Controlled (2) 5 2 1 1 0 9Emergency (3) 3 0 0 0 1 4Collision (4) 0 0 0 0 0 0Total 77 23 10 8 18 136% of Total 57% 17% 7% 6% 13% 100% Existing methods of measuring visibility from a pedestrian perspective may not be entirely applicable to cyclists. The ability of cyclist to easily view potentially conflicting traffic is affected by angle of approach, therefore any design which seeks to minimise this inconvenience should avoid layouts which allow cyclists to enter the crossing after having to view conflicting traffic behind them before making the decision to cross. This is compounded by the evidence earlier that many conflict cyclists are travelling to and crossing Zebra crossings at speed and that the majority of cyclists ride across the Zebra crossing, which would mean that many cyclists are viewing the road behind them whilst moving forward at a location that may have fixed furniture and moving pedestrians to contend with. Any design that must necessarily include such a layout might consider cycle speed reduction measures (to allow a longer viewing, decision, and braking time) in conjunction with arranging the approach angle to at least right angles to the road before the crossing entry.
5.2.8 Is there a relationship between the number of collisions / conflicts and the position of the Zebra along the link?
The location type split of a Zebra crossing at a mid-link, near a roundabout, or near a junction, appear to have little statistical bearing upon the amount of observed conflict. Interestingly only the mid-link crossings have Emergency conflicts, the individual explanations for these were explained earlier in section 5.2.3. Evidence from the textual analysis leads more towards individual site characteristics and the manner in which they are used as affecting conflict. This suggests that Zebra crossings used by mounted cyclists in proximity to certain types of highway feature (mid-link, near a roundabout, or near a junction) are not relatively more or less likely to have conflicts than each other, but are affected by individual characteristics.
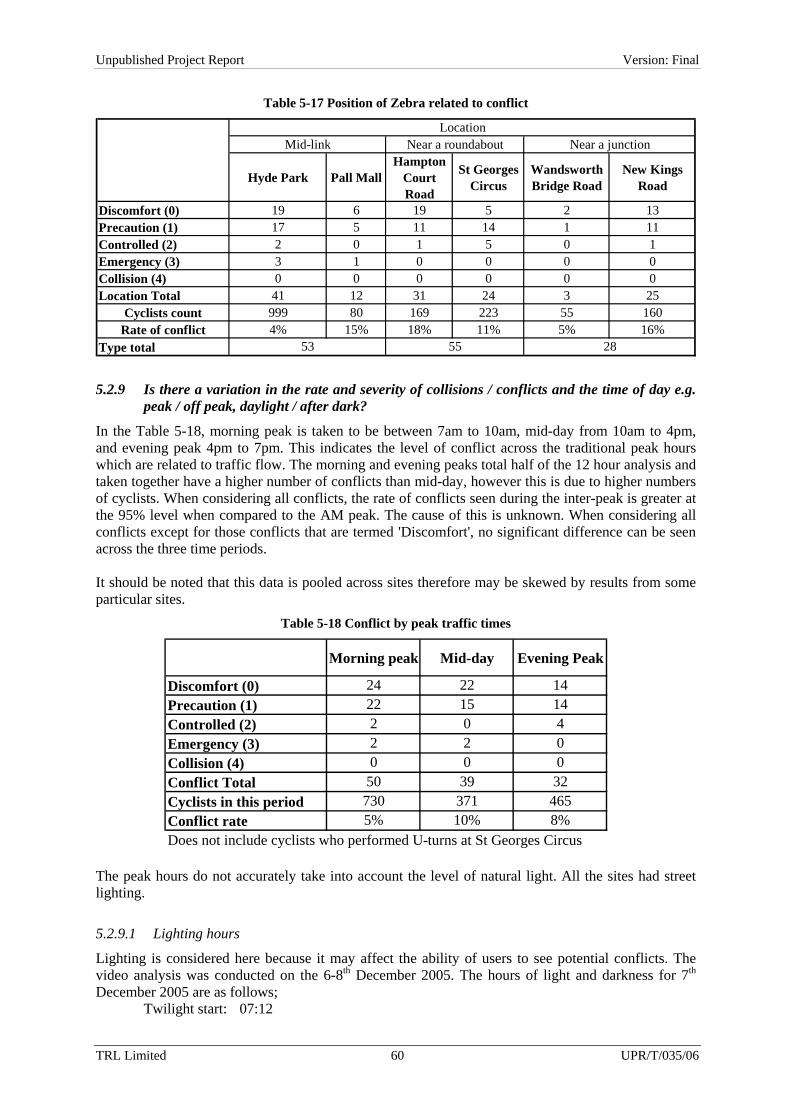
TRL Limited 60 UPR/T/035/06
Unpublished Project Report Version: Final
Table 5-17 Position of Zebra related to conflict
Hyde Park Pall MallHampton
Court Road
St Georges Circus
Wandsworth Bridge Road
New Kings Road
Discomfort (0) 19 6 19 5 2 13Precaution (1) 17 5 11 14 1 11Controlled (2) 2 0 1 5 0 1Emergency (3) 3 1 0 0 0 0Collision (4) 0 0 0 0 0 0Location Total 41 12 31 24 3 25
Cyclists count 999 80 169 223 55 160Rate of conflict 4% 15% 18% 11% 5% 16%
Type total
Location
285553
Near a junctionNear a roundaboutMid-link
5.2.9 Is there a variation in the rate and severity of collisions / conflicts and the time of day e.g. peak / off peak, daylight / after dark?
In the Table 5-18, morning peak is taken to be between 7am to 10am, mid-day from 10am to 4pm, and evening peak 4pm to 7pm. This indicates the level of conflict across the traditional peak hours which are related to traffic flow. The morning and evening peaks total half of the 12 hour analysis and taken together have a higher number of conflicts than mid-day, however this is due to higher numbers of cyclists. When considering all conflicts, the rate of conflicts seen during the inter-peak is greater at the 95% level when compared to the AM peak. The cause of this is unknown. When considering all conflicts except for those conflicts that are termed 'Discomfort', no significant difference can be seen across the three time periods. It should be noted that this data is pooled across sites therefore may be skewed by results from some particular sites.
Table 5-18 Conflict by peak traffic times
Morning peak Mid-day Evening Peak
Discomfort (0) 24 22 14Precaution (1) 22 15 14Controlled (2) 2 0 4Emergency (3) 2 2 0Collision (4) 0 0 0Conflict Total 50 39 32Cyclists in this period 730 371 465Conflict rate 5% 10% 8%Does not include cyclists who performed U-turns at St Georges Circus
The peak hours do not accurately take into account the level of natural light. All the sites had street lighting.
5.2.9.1 Lighting hours
Lighting is considered here because it may affect the ability of users to see potential conflicts. The video analysis was conducted on the 6-8th December 2005. The hours of light and darkness for 7th December 2005 are as follows;
Twilight start: 07:12

TRL Limited 61 UPR/T/035/06
Unpublished Project Report Version: Final
Sunrise: 07:51 Sunset: 15:52 Twilight end: 16:32
All cyclist numbers were collected in 15 minute sections, therefore the timings of the following table are matched to the closest real Twilight and sunrise/sunset times in table 5-19. Cyclists involved in conflict were recorded to the minute and second, but are matched to all cyclist numbers in 15 minute bins in order to collect comparable rate data. When considering all conflicts, and all conflicts excluding Discomfort, no significant difference can be seen across the three light levels periods.
Table 5-19 Lighting hours related to conflict
Darkness0700-0715
Twilight0715-0800
Daytime0800-1545
Twilight1545-1630
Darkness1630-1900
Discomfort (0) 0 3 46 3 12Precaution (1) 2 3 36 2 16Controlled (2) 0 2 2 1 4Emergency (3) 0 0 3 1 0Collision (4) 0 0 0 0 0Conflict Total 2 8 87 7 32Cyclists in this period 22 117 951 54 422Conflict rate 9% 7% 9% 13% 8%Does not include cyclists who performed U-turns at St Georges Circus
Individual analysis of sites in table 5-20 reveal that Hampton Court Road was the only site to suffer morning darkness conflicts, Wandsworth Bridge Road’s three conflicts all occurred during the evening darkness. This may point to individual lighting issues. Most of Pall Mall’s conflicts occurred during the daytime. Generally traffic speeds anywhere would decrease during peak periods due to congestion, thus having higher speeds in the inter-peak period. The possibility that higher speeds lead to higher levels of daytime conflict cannot be discounted.
Table 5-20 Conflict by time of day at each location
Locations Darkness0700-0715
Twilight0715-0800
Daytime0800-1545
Twilight1545-1630
Darkness1630-1900 Grand Total
Hampton Court Road 2 1 20 0 8 31Hyde Park 0 0 28 2 11 41New Kings Road 0 2 18 1 4 25Pall Mall 0 0 11 1 0 12St Georges Circus 0 5 10 3 6 24Wandsworth 0 0 0 0 3 3Grand Total 2 8 87 7 32 136
5.2.10 Is there a relationship between the number of collisions / conflicts and the number and type of pedestrians using the crossing?
Any pedestrians with mobility issues were noted in the textual analysis of the video data, however the numbers were so small that reliable statistics cannot be used. A total pedestrian count was taken for each site, based up a random 5 minute count in each hour. This same random 5 minutes was then

TRL Limited 62 UPR/T/035/06
Unpublished Project Report Version: Final
applied to each site. A rate between the number of cyclist conflicts and number of pedestrians is shown in table 5-21. The rate of conflict for cyclists does not appear to be correlated to the number of pedestrians.
Pall Mall Hyde Park New Kings Road
St Georges Circus Hampton Wandsworth
Road
Number of conflicts 12 41 25 24 31 3Number of Pedestrians 6072 4572 3060 2160 1080 1320Rate of conflict 0.2% 0.9% 0.8% 1.1% 2.9% 0.2%
Table 5-21 Rate of conflict related to pedestrian numbers
5.2.11 Summary of research questions key findings
• Most observed conflicts were of a low level, with no conflicts at a collision level observed and 4
out of 136 conflicts (2.9%) being at “Emergency” level. • Pedestrians were involved in 37% of conflict situations, with many being at a “Precaution” level,
constricted shared areas exacerbate this. • 72% of conflicts involved a motor vehicle, including all emergency conflicts, it is thought that
visibility and the route taken to the crossing affect this. • Individual sites have individual characteristics and problems, some of these are uniform such as
routes to the crossing (which affect visibility and exposure), small shared areas (constricted spaces lead to conflict), and kerb heights (avoidance or use of kerbs).
• Cyclists involved in conflicts are generally travelling faster than pedestrians • Visibility is linked to conflict with vehicles, a cyclist looking behind to view traffic before turning
across a Zebra being at most risk, this reduces as visibility increases. • The location of a Zebra in a network (link, roundabout, junction) appears to have little bearing on
conflict, whereas individual characteristics do. • Lighting appeared sufficient at the sites and time of day, and thus natural lighting conditions, had
little effect upon collisions, however daytime cyclists are statistically more likely to be involved in collision, this effect may also be due to vehicle speeds.
• Very few mobility impaired persons were observed in the study therefore their interaction with cyclists at Zebra crossings cannot be known.
• There appears no correlation between pedestrian numbers and cyclist conflict.
TRL Limited 63 UPR/T/035/06
Unpublished Project Report Version: Final
6 Discussion
6.1 Introduction
Transport for London’s Cycling Centre of Excellence wish to increase the convenience of cycling in London and one of the ways in which they propose to do this is via the minimisation of delay and risk to cyclists. Cyclists are not presently permitted to use Zebra crossings. Alternatives to Zebra crossings include Toucan crossings however these are expensive to build and maintain due to signalling equipment. Zebra crossings offer a cheaper alternative to Toucan crossings and do not carry the same time penalty for users. Many LCN routes cross Zebra crossings, but cyclists are advised in the Highway Code to dismount and walk for this part of their journey. Therefore the Cycling Centre of Excellence commissioned TRL to investigate the conflicts that cyclists become involved in at Zebra crossing via video analysis with a view towards the design of a Zebra crossing which would accommodate mounted cyclists without expensive signalisation or an increase in risk. This correctly used the assumption that a large number of cyclists were presently using Zebra crossings whilst mounted thus their movement through crossing areas could be observed without bringing additional or unnecessary risk to cyclists. The observed behaviour of these cyclists through Zebra crossing facilities enabled the identification of risky behaviours caused in part by the design and layout of crossings. The analysis revealed which design features were involved in risky outcomes. A review of these design features will form a basis for any pilot scheme that might be launched. A review of collision data and literature was performed to ensure that suitable analysis was undertaken.
6.2 Network Implications
Delays to the network for all users, including cyclists and pedestrians, are addressed by Part 2 of the Traffic Management Act 2004 (Great Britain, 2004) which obliges local authorities to keep traffic moving. Therefore the delays to all users by different road facilities are important. Work has been carried out in other studies which models the delay at crossings to those using the highway and those using the crossing. It is known that the flow and distribution of each type of user is important in assessing delay, and that different types of crossing are suitable in different situations. It is recommended that a traffic engineer is consulted regarding the complex calculations needed to assess suitable crossing types for each situation.
6.3 Legal
According to the advice provided by TfL’s corporate lawyers, the only barrier to cyclists using Zebra crossings to cross is that it is a contravention of Rule 64 in the Highway Code. Whilst the Highway Code has no statutory backing, it could be argued in a court of law that any conflict arising from such use could be deemed dangerous and prosecuted as such. This Rule would therefore require change, or Tiger crossings would require adding to the Highway Code specifically. Cyclists are vehicles in law and as such do not have priority over vehicles at crossings. The 1984 Act states that;
25.-(1) The Secretary of State may make regulations with respect to the precedence of vehicles and pedestrians respectively, and generally with respect to the movement of traffic (including pedestrians), at and in the vicinity of crossings.
The wording here is important, “precedence of vehicles and pedestrians respectively” does not specifically give precedence to any one group, but can give precedence regarding these groups. In the Regulations as they stand, pedestrians are given precedence over vehicles, however modified

TRL Limited 64 UPR/T/035/06
Unpublished Project Report Version: Final
Regulations might allow for the precedence of certain vehicles (namely cycles) over vehicles should this approach be deemed necessary. The layout and signs used on the roads are subject to Regulations, if suitable shared-use Zebra (Tiger) crossings signing and layouts are formulated, Regulations may simply be changed. Footways are only for the use of pedestrians unless they have been converted to allow shared use. Laws and Regulations exist to allow for this.
6.4 Headline findings (chapters 4 and 5)
Chapter 4 revealed existing local, London, and national STATS19 data on crossing collisions resulting in injury. This revealed that cyclist injuries at Zebra crossings do occur and as such are a problem, however rate data is not known. The local STATS19 data contained useful textual data relating to reported incidents at the observation locations relating to cyclists and pedestrians. This was useful to identify the type of collisions that occur at Zebra crossings generally and at the individual sites. This information was used to inform the data collection process. Chapter 5 contains the primary data collated for this project which was collated from video data and site visits. Research questions were chosen because they covered areas identified from the literature review, from the local STATS19 textual data, and areas considered to be potentially interesting given the type of movements occurring at Zebra crossings. Some research questions returned more definite answers than others.
6.5 General data
General data recorded the number of cyclists and pedestrians. The rate and number of cyclists to pedestrians varies from site to site and throughout the day. The majority of cyclists, as found is section 5.1.4 (87.8%) ride across Zebra crossings, implying that the Highway Code rule 64 is either not known by these users or are generally ignored. The number of cyclists to pedestrians varies across sites, with cyclists at Pall Mall forming 1% of cycle and pedestrian traffic, but 18% of cycle and pedestrian traffic at Hyde Park, with an average across sites as 8.6%. This differs from an Atkins study (Atkins, 2005) of Side road crossings which identified an average of 17.65%.
6.6 Conflicts
The number of cyclists involved in some level of conflict was 136 of a total of 1570 cyclists (8.66%). This total figure increases if the 116 cyclists using the St Georges Circus Zebra crossing to U-turn are included. It should be cautioned that just under half of these conflicts measured discomfort as a subjective measurement, whereas more serious conflicts involved the measurement of movement involved in avoidance and is therefore more objective. The number of serious conflicts involving controlled or emergency manoeuvres was actually very low at 13 (0.83% of 1570). All conflicts were recorded that involved a cyclist, cyclists were involved in conflict with other users including pedestrians, other cyclists, and motor vehicles using the road. Generally there was little difference to the rate of conflict between those pushing their cycle across the road and those riding their cycle, however conflict with pedestrians is higher for those who cycle and the majority of walking cyclists involved in conflict with a motor vehicle were with vehicles which impeded flow across the Zebra crossing by temporarily stopping on it. Therefore riding across a Zebra crossing is more likely to result in conflict in some cases.

TRL Limited 65 UPR/T/035/06
Unpublished Project Report Version: Final
On a like-for-like basis, this study revealed that non-discomfort conflicts between mounted cyclists and vehicles at Zebra crossings is 2.67% of cyclists (45 1,2,3,4 level conflicts amongst 1686 observed cyclists). At a study of Side road crossings by TRL (TRL, 2000) with similar conflict criteria this rises to 5.13% of cyclists, and a similar Atkins report at Side road crossings with similar conflict criteria reveals that 1.38% of cyclists were involved in conflict.
6.7 Injury Collisions
Conflicts which result in personal injury on the road should be reported via the STATS19 system and this is the measure of collisions which count towards targets therefore are extremely important. Cyclists appear at higher risk than pedestrians at Zebra crossings from the limited local STATS19 data examined, further research put this into context and revealed that Zebras are comparatively more risky for cyclists to pedestrians compared to a similar analysis with Pelicans, but less risky than side roads and uncontrolled crossings.
6.8 Site Specifics
The site specific data is interesting and it is the individual characteristics which impact upon the level of conflict. The primary data was analysed to look for unusual outcomes which in turn were related to individual site characteristics which were likely to have had a causal relationship to undesirable results. Positive and negative characteristics of the analysis sites are summarised, these summaries may help to avoid or encourage certain behaviours for the benefit of safety and cyclist convenience if used in new site design.
6.9 Visibility
Visibility is hard to measure because different users will have different levels of visibility. Traditionally visibility at Zebra crossing (for those using the crossing) is based upon a pedestrian using the crossing. It might be assumed that a pedestrian can stop and look more easily than a cyclist because of the moving mass of the cycle and rider and the ability of pedestrians to turn more quickly and in a tighter circle. Although rate data is unavailable, the results suggest that those that have a limited view of other users (such as those that must look behind them before crossing) due to the geometry and layout of the site may be more at risk than those with a good view. This leads to advice that cyclists should be given routes to crossings that increase their ability to see sources of conflict, and/or be slowed sufficiently to enable the timely completion of such activities. This might include 90° approach angles or jug handle approaches. Due to the conflicts with pedestrians, a slowing of cyclists, if not at walking pace, is preferable to higher speeds. The crossing should also be sufficiently visible to drivers.
6.10 Time of Day
Time of day appears to have little bearing upon the rate of conflict, other than a slight increase in daytime conflicts. The reason for this is unknown but may relate to the type of user using the crossings (both vehicles on the road and cyclists and pedestrians on the crossing). When time of day is split into timings which reflect levels of natural light (such as twilight and daylight) which might affect visibility, there appears to be very little difference between times. This suggests that the levels of provided light at the six sites (from lampposts and ambient lighting from buildings) is reasonably sufficient.
6.11 Pedestrian flow
Pedestrian flow varied greatly at different sites. This did not appear to have any significant impact upon the level of conflict. It might be posited that higher numbers of pedestrians would lead to higher

TRL Limited 66 UPR/T/035/06
Unpublished Project Report Version: Final
potential numbers of conflict, and conversely that higher numbers of pedestrians would lead to greater caution amongst cyclists, however the data does not allow such interplays to be analysed therefore no real conclusions can be drawn.
6.12 Design implications
The literature review examined a number of design features, such as different crossing types, cycle routes, and signing. As all of the cycle routes were fairly uniform with regards to crossing type (they were all Zebras) and signing (they all conformed to regulations), the only real differential measurement is the cycle route to the crossing and the individual characteristics of the crossing. This means that the effects of signing were not measured although potential signs for a shared-use Zebra (Tiger) and changes required for additional signing are noted. This in part related to the difficulty in measuring the efficacy of signing from video analysis. The efficacy of signing in practice may be more readily measured in laboratory conditions where participants can be observed and then questioned, indeed, changes to crossing user and road user signs may not even be necessary. This approach may be suitable when or if different signing is introduced for revised Zebra (Tiger) crossings, which may include suggestions from TfL to substitute the white colour of a Zebra crossing or Belisha pole with a yellow colour. An example of potential issues is that yellow paint may not be distinguishable from white paint under yellow street lighting. Temporary signing to advise users of the change in use may be necessary and may also provide an opportunity to remind cyclists to stop before crossing. The individual design characteristics appear to have the greatest impact upon conflict, advice has been noted in the text to avoid those characteristics that are likely to causally result in conflict and lean towards those characteristics in the same data set which appear to offer lower levels and numbers of conflict. Routes to the Zebra crossing appears to have an effect upon the ability of cyclists to accurately see potential conflicts and the speed of conflict. Allowing cyclists to use Zebra (Tiger) crossings whilst mounted would be ineffective without changes which allow cycle paths to join Zebra (Tiger) crossings. The effect of a change to allow cyclists to ride up to shared-use Zebra (Tiger) crossings is unknown as long approach paths were not analysed in the video analysis, and whilst a large number of cyclists presently cycle across Zebra crossings anyway, a large number also avoid the entry or exit kerb to the crossing, possibly to avoid waiting pedestrians or to better fit their desire line. By allowing cycle paths to lead to shared-use Zebra (Tiger) crossings and leading desire lines across it, there is a potential for conflict with waiting pedestrians over and above the low levels observed in the video analysis. A design of crossing and approach similar to Toucan crossings might be appropriate as these have been found to have a minimum of cyclist vs. pedestrian conflicts on the crossing or approach (TRL, 1993). Differences between Toucan and ‘Tiger’ crossings would therefore be limited to the traffic signalling involved, if cyclists wait for vehicles to stop (as with Toucan crossings) then conflict should also be minimised with vehicles. Practically the width of a Toucan is placed at a minimum of 4.0 metres, whereas a Zebra is at 2.4 metres (TfL, 2004). The six Zebra crossings studied as part of this study were between 3 and 3.4 metres wide (see Table 2-2), if this is representative then typically it may be necessary to widen shared-use Zebra (Tiger) crossings to match Toucan crossing widths. Kerbs can beneficially be used to control cyclist movement to a limited extent, both to discourage entry to certain areas or to encourage entry at others. Signs for pedestrians and cyclists are contained in Chapter 5 of the Traffic Signs Manual (TSM) and some of these may be applicable, without modification, to indicate to cyclists that they may use a Zebra crossing. Sign 956 of the TSM indicates a route for pedestrians and cyclists without separation, which may be applicable to signs on posts and bollards, whilst road marking diagram 1057 could be used on the crossing itself.

TRL Limited 67 UPR/T/035/06
Unpublished Project Report Version: Final
Design should recognise cyclist behaviour, primarily their desire to minimise distance and time, and to maintain momentum. Gårder et al (1998) suggest that ramped approaches to crossings can be used to control cycle speeds. This may be appropriate in some locations although it should be noted that none of the six research sites were at a similar level to the footpath. A pilot scheme would help to better understand this potential for conflict. A pilot scheme may be introduced as an experimental traffic order under section 6 (for Greater London) and section 1 (elsewhere) of the Road Traffic Regulation Act 1984. Approval by the DfT would be required for any variation to the Regulations. Crossings are part of a network and will be used if they confer the optimum utility to users over alternatives. Where Zebra crossings form part of the cycle network their conversion to accommodate cycles may be appropriate. The characteristics of pedestrians and cyclists are different in a number of ways but are likely to relate to speed, stopping distance, and the ability to move backwards (or not). This may therefore require that a longer visibility splay is required by cyclists when using the crossing. The video analysis work revealed the correlation between (cyclist) visibility splay and the severity or type of conflict. Cyclists have different visibility splay requirements to pedestrians because they often approach the crossing from the carriageway, rather than at 90 degrees to the carriageway. Central refuges are used to split Zebra crossings into two to provide a refuge for pedestrians to wait for the other lane of traffic to stop. These refuges are often around 1.2m in width (i.e. the gap between lanes, not along the carriageway) which is probably sufficient for a few pedestrians to stand and wait. This brings several potential problems in that cyclists may have difficulty in stopping in time if riding across the crossing, and the small width of the refuge may leave the ends of the cycle exposed to conflict with passing traffic. The video analysis was used to examine this. Existing road signing may be largely sufficient for a change of use of Zebra crossings from pedestrian use only to a shared-use Zebra (Tiger) crossing, however additional warning signs require the authorisation of the Secretary of State. Yellow markings which might help to differentiate shared-use Zebra (Tiger) crossings from pedestrian-only crossings may confuse drivers as the colour is usually used with prohibition.
6.13 Summary
This study has provided a greater understanding of the manner in which cyclists are presently using Zebra crossings. A large majority of cyclists are presently using Zebra crossings whilst mounted therefore a change in the Regulations to give priority to cyclists may not increase the absolute rate of those doing so, however an unknown effect is any change in behaviour brought about by this change in Regulation. Changes or new build at any crossing to a Tiger design may require site by site permission or a new and separate category of Tiger crossing complete with Regulations and guidance notes. The research suggests that cycling across a Zebra crossing is not necessarily more dangerous than pushing the cycle across however there are a number of caveats to this including care as to the route and speed to Zebra crossings and to keep vehicles from blocking the crossing, especially on routes with more than one lane of traffic in each direction. It may be prudent to include signs instructing cyclists to stop before crossing and give passing traffic (if present) the opportunity to stop before proceeding. This would increase the time available to all parties to properly comprehend the surrounding environment thus better avoid conflict. Time of day and present lighting levels appear sufficient, signing however is unknown and changes to signing and user behaviour to revised signs would need further research.
TRL Limited 68 UPR/T/035/06
Unpublished Project Report Version: Final
7 Conclusion
7.1 Aims and objectives
The key aim of this report is to investigate the manner in which cyclists presently use existing Zebra crossings and to better understand how shared-use Zebra (Tiger) crossings might be used by mounted cyclists were their use permitted. This was achieved by video analysis of six sites within London which looked at conflicts which mounted and unmounted cyclists encountered whilst crossing. The report then investigates the individual and general underlying causes of these conflicts. This enables the identification of risky observed behaviour in conjunction with different road layouts, subsequently these risky behaviours and layouts can be mitigated via design which limits the ability of these conflicts to occur.
The report also examines the legal frameworks surrounding Zebra crossings and any likely changes necessary to implement shared-use Zebra (Tiger) crossings.
7.2 Key Findings and Recommendations
7.2.1 Cyclist and pedestrian conflicts
There were few observed conflicts between cyclists and other cyclists (0.65% of cyclists, as shown in Table 5-10 if 1686 cyclists have a total of 11 conflicts with other cyclists) and pedestrians (3% of cyclists as shown in Table 5 9), and those that did occur between vulnerable users (such as other cyclists and pedestrians) were generally of a low conflict level. The majority of cyclists (87.8% in Section 5.1.4) at the study sites rode across Zebra crossings for part or all of the crossing, most of which were not involved in any conflicts. It was found that, were specific behaviours limited through controls in the built environment, cycling across the observed Zebras in their present form is not necessarily more dangerous than pushing the cycle. These controls are listed below in the Design Imperatives subsection. Research by Trevelyan and Ginger (1989) also indicates that pedestrians and cyclists share crossings with few problems.
7.2.2 Vehicle and Zebra-user conflict
The rate of conflict with vehicles for cyclists crossing the examined Zebra crossings was more than the level found for pedestrians when the number of crossings by each user are divided by the number of actual recorded incidents on the crossing over a defined time period. To put this into context cyclists are generally at 1.85 times more risk than pedestrians and crossings are inherently risky (see Section 4.3.1). To put risk rates into context, the relative rates between different crossing types were measured (in Section 4.3.1, readers should note the underlying assumptions) and found that Pelican/Toucan/Puffin type crossings are the safest form of crossing (both in terms of the number of crossings needed to produce one collision and the comparative risk compared with pedestrians at the same facility type), followed by Zebra crossings then Pedestrian Phase crossings in terms of comparative risk with pedestrians. Uncontrolled crossings and crossings at junctions are far more risky based upon the calculations. The video analysis (see Section 5) provided a basis for determining risky behaviours and baseline information. Although the actions of cyclists were they conferred priority at a crossing is unknown, an assumption is made that many of the movements would be similar to those found at the observed sites. This allowed useful insights into methods of mitigating safety concerns were shared-use Zebra (Tiger) crossings implemented.

TRL Limited 69 UPR/T/035/06
Unpublished Project Report Version: Final
It was found (in Section 5.1.8) that generally more incidents occur on the first leg of a crossing unless there are other overriding risks. The reasons for this were not investigated but may be related to visibility of all users and a motorist’s comprehension of a Zebra crossing user’s intentions at the point of entry to the crossing.
7.2.3 Key Findings: Design imperatives
Cyclists who use Zebra crossings whilst mounted are more likely at some site layouts to come into conflict with pedestrians and vehicles than those who push their cycle across. This is primarily due to certain types of behaviour in the built environment which can be minimised or avoided by utilising design principles on the built environment which do not allow certain user behaviours including;
• Routes to shared-use Zebra (Tiger) crossings which necessitate the observation of traffic from behind before crossing
• Routes to or from shared-use Zebra (Tiger) crossings which allow the cyclist to divert outside of the crossing area
• Vehicles stopping on the shared-use Zebra (Tiger) crossing Other factors in addition to those listed above were considered however their impact and applicability were lower. They have been listed separately below in the Design Considerations subsection.
7.2.4 Key Findings: Legal ramifications
The design and implementation of pedestrian crossings is controlled by legal restrictions. Experimental crossings would need the prior approval of the DfT. Thereafter, if the experimental shared-use Zebra (Tiger) crossings were to prove successful, regulatory changes would be needed to confer priority to cyclists at shared-use Zebra (Tiger) crossings (if this was deemed appropriate), and for the signs at crossings. Also the Highway Code would require amendment to describe shared-use Zebra (Tiger) crossings. If the decision is taken by TfL to pursue Tiger crossings;
• The approval of the DfT will be needed for experiments • Regulatory changes made to confer priority to cyclists (if deemed appropriate) • The areas adjacent to the entry points of shared-use Zebra (Tiger) crossings should be
converted to shared use • The Regulations should be changed to allow for any necessary signing and layout designs
Local Highway Authorities have a standard duty of care in the consideration and design of the highway network under their jurisdiction.
7.2.5 Key Recommendations: Design Consideration for shared-use Zebra (Tiger) crossings
The following recommendations are made; • Good practice for central refuges should allow for a sufficient size and geometry to
accommodate cycles and pedestrians. Inclusive Mobility (Great Britain, 2002) indicates refuge sizes suitable for wheelchair users, these sizes may also be appropriate for cycles given average cycle lengths
• Entrance and exit footpaths to shared-use Zebra (Tiger) crossings should be of sufficient size to accommodate cycles and pedestrians, taking into account likely flows of each, similarly the limits of the crossing should be of sufficient width to minimise cyclist and pedestrian conflict
• Consideration be given to designs which allow the cyclist adequate time to assess, decide, and brake before crossing, this may involve cyclist speed management measures to bring speeds within a design speed

TRL Limited 70 UPR/T/035/06
Unpublished Project Report Version: Final
• Consideration be given to signing, both to permit cycling over shared-use Zebra (Tiger) crossings (or certain Zebra crossings), and to remind cyclists and pedestrians of the need to wait for vehicles to stop before crossing. This signing might be placed on the Belisha poles
• High kerbs outside of the entrance and exit to the crossing will discourage users from taking a route other than within the confines of the crossing
• Consideration should be given to designs which allow cyclists to enter the traffic stream from the central refuge (but not from the road into the central refuge)
• Visibility splay considerations should be taken from a cyclist’s perspective • At Toucans in other research, cyclist vs. pedestrian conflict appears minimal, it may be
prudent to provide for a crossing width similar to that of Toucan crossings. A previous study (TRL, 1993) revealed that conflicts at Toucans between cyclists and pedestrians were minimal, therefore it would appear prudent to follow similar dimensions (minimum 4.0 metres) in pilot shared-use Zebra (Tiger) crossing designs to minimise the potential for cyclist vs. pedestrian conflicts. Other concerns and potential mitigations are outlined in Appendix G.
7.3 Next Steps towards trial of shared-use Zebra (Tiger) crossings
TfL have expressed an interest in progressing shared-use Zebra crossings towards implementation at trial sites. The DfT have (via email correspondence) expressed some reservations as to the actions of cyclists were they conferred priority at Zebra crossings and the attitudes of other crossing users and motorists with the potential for these factors to reduce safety. The DfT’s approval is required before experimental trials can begin therefore it is recommended that any further move prioritises actions which lead to DfT approval. There are a number of workstreams which are likely to require completion through the trialling and implementation stage, and assuming that each stage is successful they are;
• Assessment of behavioural change risks of conferring priority to cyclists (including propensity to stop before crossing, which might include reactions to signing)
• Assessment of other crossing users (motorists, mobility groups, pedestrians) attitudes to this change
• Approval of experimental shared-use Zebra (Tiger) crossing by DfT • Selecting a suitable trial site/s • Defining and designing suitable design layouts • Defining and designing suitable signing • Safety auditing of sites (including all normal safety audit stages, not just design) • Construction/modification of site • Dissemination of information to public • Opening of site with immediate monitoring • Monitoring of behaviour after a bedding-in period with comparable methodology to this
study • Long term STATS19 monitoring
Should these trials prove successful and a decision is made to allow shared-use Zebra (Tiger) crossings to become a general or special crossing type, further steps may include;
• Permanent changes made to law • Guidance written and issued for shared-use Zebra (Tiger) crossings and possibly some
manner of dissemination of information to the public. • Long term monitoring of any implemented nationwide shared-use Zebra (Tiger) crossings
(over and above local testing).

TRL Limited 71 UPR/T/035/06
Unpublished Project Report Version: Final
7.4 Further work
In the progression of shared-use Zebra (Tiger) crossings the following steps will be required;
• Assessment of behavioural change risks of conferring priority to cyclists This might use planned-behaviour research methods to assess behavioural change.
• Assessment of other crossing users (motorists, mobility groups, pedestrians) attitudes to
this change This might include attitudinal surveys.
• Selecting a suitable trial site/s • Defining and designing suitable design layouts This would include using the design considerations found in this study.
• Defining and designing suitable signing This might include testing various signs with real subjects in laboratory conditions.
• Opening of site with immediate monitoring This could involve on-site or video analysis of the use of the site immediately following opening, this would allow the experiment to be stopped or modified should untoward consequences be found.
• Monitoring of behaviour after a bedding-in period with comparable methodology to this
study This would involve similar analysis to this study so that direct comparisons can be made with the observed data.
• Long term STATS19 monitoring Data gathering over a longer term will allow statistical analysis of STATS19 data which is also used in road safety targets. Ideally the experimental shared-use Zebra (Tiger) sites would reveal an absolute or rate reduction on KSI figures.
• Guidance written and issued for shared-use Zebra (Tiger) crossings The experiences gained from this study and following work on experimental shared-use Zebra (Tiger) crossings could be used to create a Traffic Advisory Leaflet or similar.
• Long term monitoring of implemented nationwide shared-use Zebra (Tiger) crossings
(over and above local testing) This testing would be similar to that of the long-term STATS19 experimental testing but over a larger (and therefore probably more statistically significant) dataset. This would reveal the efficacy of the crossing and the guidance.
TRL Limited 72 UPR/T/035/06
Unpublished Project Report Version: Final
Acknowledgements The work described in this report was carried out in the Sustainable Communities Group of TRL Limited. The authors are grateful to Stuart Reid who carried out the quality review and auditing of this report.
We would also like to take the opportunity to thank the various local representatives of London Boroughs at the observed Zebra crossing sites for their cooperation and permission. This includes;
Royal Parks (Hyde Park)
Westminster Borough Council (Pall Mall)
Richmond Borough Council (Hampton Court Road)
Transport for London (St Georges Circus)
Hammersmith and Fulham Borough Council (Wandsworth Bridge Road & New Kings Road)
TRL Limited 73 UPR/T/035/06
Unpublished Project Report Version: Final
8 References
ATKINS, 2005. A3 West Hill Cycling Scheme Monitoring Study (draft copy, commissioned for TfL). London : Atkins.
CTC, 2004. CTC policy handbook. Online : www.ctc.org.uk/resources/ Campaigns/PolicyHandbook_March_2004.doc [accessed December 2005]
DEPARTMENT FOR TRANSPORT, 1986. Local Transport Note 2/86 Shared use by cyclists and pedestrians. London : HMSO
DEPARTMENT FOR TRANSPORT, 1989. Local Transport Note 1/89 Making way for cyclists. London : HMSO
DEPARTMENT FOR TRANSPORT, 1995a. Local Transport Note 1/95 The Assessment of Pedestrian Crossings. London : HMSO
DEPARTMENT FOR TRANSPORT, 1995b. Local Transport Note 2/95 The Design of Pedestrian Crossings. London : HMSO
DEPARTMENT FOR TRANSPORT, 2002. TAL 6/02 Inclusive Mobility: A Guide to Best Practice on Access to Pedestrian and Transport Infrastructure. London : HMSO
DEPARTMENT FOR TRANSPORT, 2003a. Local Transport Note 2/2003 The design of pedestrian crossings. London : HMSO
DEPARTMENT FOR TRANSPORT, 2003b. Traffic Signs Manual Chapter 5. London : HMSO
DEPARTMENT FOR TRANSPORT, 2004a. TAL 1/04 Policy, Planning and Design for Walking and Cycling. London : HMSO
DEPARTMENT FOR TRANSPORT, 2004b. Traffic Signs Manual Chapter 4. London : HMSO
DEPARTMENT FOR TRANSPORT, 2004c. LTN 2/04 Adjacent and Shared Use Facilities for Pedestrians and Cyclists. London : HMSO
DEPARTMENT FOR TRANSPORT, 2005. Transport Statistics Great Britain 2005. London : HMSO
DfT DSA (2004) The Highway Code online: 0Hhttp://www.highwaycode.gov.uk/ [accessed December 2005]
GÅRDER, P., LEDEN, L., AND PULKKINEN U, (c1998). Measuring the Safety Effect of Raised Bicycle Crossings Using a New Research Methodology. Transportation Research Record 1636. 98 (1360), 64 - 70.
GREAT BRITAIN, 1835. Highways Act 1835. London
GREAT BRITAIN, 1971. Zebra Pedestrian Crossings Regulations 1971. London : HMSO
GREAT BRITAIN, 1972. Road Traffic Act 1972 (c. 20). London : HMSO
GREAT BRITAIN, 1973. Land Compensation Act 1973 (c.26). London : HMSO
TRL Limited 74 UPR/T/035/06
Unpublished Project Report Version: Final
GREAT BRITAIN, 1984a. Cycle Tracks Act 1984 (c. 28). London : HMSO
GREAT BRITAIN, 1984b. Cycle Tracks Regulations 1984 (SI1984/1431). London : HMSO
GREAT BRITAIN, 1984c. Road Traffic Regulation Act 1984 (c. 27). London : HMSO
GREAT BRITAIN, 1990. Zebra Pedestrian Crossings (amendment) Regulations 1990. London : HMSO
GREAT BRITAIN, 1994a. The Traffic Signs Regulations 1994. London : HMSO
GREAT BRITAIN, 1994b. The Traffic Signs Regulations and General Directions 1994. HMSO: London.
GREAT BRITAIN, 1995a. Disability Discrimination Act 1995 (c.50). London : HMSO
GREAT BRITAIN, 1995b. The Traffic Signs (Amendment) Regulations and General Directions 1995. London : HMSO.
GREAT BRITAIN, 1997. The Zebra, Pelican and Puffin Pedestrian Crossings Regulations and General Directions 1997. London : HMSO.
GREAT BRITAIN, 2002a. The Traffic Signs Regulations and General Directions 2002. London : HMSO.
GREAT BRITAIN, 2002b. Hansard Responses to Parliament 19th June 2002 Column 426W. [online] 1Hhttp://www.publications.parliament.uk/pa/cm200102/cmhansrd/vo020619/text/20619w26.htm [accessed 30/03/2006].
GREAT BRITAIN, 2004. Traffic Management Act 2004 (c. 18). London : HMSO
GREATER LONDON AUTHORITY, 2001. The Mayor's Transport Strategy. London : GLA.
HIGHWAYS AGENCY, 2006. Design Manual for Roads and Bridges. London : HMSO.
HUNT, J. (1998) A Review of the Comparative Safety of Uncontrolled and Signal Controlled Midblock Pedestrian Crossings in Great Britain. Swedish National Road and Transport Research Institute Safety of Vulnerable Road Users - Especially in Urban Areas: A. VTI conference 10A part 2.
IHT, 1998. Guidelines for Cycle Audit and Cycle Review. London : IHT.
IHT, the Bicycle Association, the Cyclist's Touring Club and the Department of Transport , 1997. Cycle friendly infrastructure. London : IHT.
INSTITUTION OF HIGHWAYS AND TRANSPORTATION, 2000. Guidelines for Providing for Journeys on Foot. London : IHT.
MAYOR FOR LONDON, 2005. Mayor announces doubling of cycle journeys in London. [online] 2Hhttp://www.london.gov.uk/view_press_release.jsp?releaseid=5944 [accessed 31/03/2006].
TRANSPORT AND ROAD RESEARCH LABORATORY, 1989. Research Report 220 Pedal accident study - a hospital based study. Crowthorne.
TRANSPORT FOR LONDON, 2004a. Streetscape Guidance. London : TfL.

TRL Limited 75 UPR/T/035/06
Unpublished Project Report Version: Final
TRANSPORT FOR LONDON, 2004b. Levels of Accident Risk in Greater London. London Road Safety Unit, London : TfL.
TRANSPORT FOR LONDON, 2005a. London Travel Report 2005. London : TfL.
TRANSPORT FOR LONDON, 2005b. London Cycling Design Standards. London : TfL.
TREVELYAN, P. AND GINGER, M. (1989) Cyclists use of pedestrian and cycle/pedestrian crossings. TRRL Contractor Report 173.
TRL, 1993. Toucan crossings for cyclists and pedestrians. Crowthorne: TRL (Project Report 47).
TRL, 1997. Pedestrians' and cyclists' attitudes to Toucan Crossings. Crowthorne: TRL, (TRL277).
TRL, (Peirce, J. et al), 1998. Pedestrians at Traffic Signals: final report. Crowthorne : TRL, (PR/TT/089/98).
TRL, 2000. Cycle Tracks – Crossings of minor roads. Crowthorne : TRL, (PR/T/028/2000).
TRL, 2004. Review of procedures associated with the development and delivery of measures designed to improve safety and convenience for cyclists – final report. Crowthorne : TRL, (PR/T/128/04).

TRL Limited 76 UPR/T/035/06
Unpublished Project Report Version: Final
Appendix A.
A.1 Local STATS19 incident textual data for the six review sites
Casualty data for the period 01.01.00-31.12.04
Road Hampton Court Road/Kingston Bridge Reference 0101TW00413 Date 07/08/2001 Description Car hit pedestrian who was crossing at Zebra. Severity Slight Contributory factors Pedestrian was crossing normally, car failed to give way to the pedestrian
on the crossing. Weather Fine and dry Road Wandsworth Bridge Road/Hugon Road Reference 0102FH00855 Date 22/11/2002 Description Child stepped in front of car. Severity Serious Contributory factors Pedestrian crossed road heedlessly and was hit by a car going ahead
normally. Weather Fine Road Wandsworth Bridge Road/Hugon Road Reference 0100FH00030 Date 04/01/2000 Description Car turned right and struck pedestrian. Severity Slight Contributory factors Pedestrian was crossing road normally, car driver turned right
injudiciously. Weather Dark and raining Road Wandsworth Bridge Road/Hugon Road Reference 010FH00309 Date 23/04/2001 Description Child crossing road on way home from school struck by speeding
motorcycle. Severity Slight Contributory factors Pedestrian crossed road heedless of traffic and was injured by vehicle
travelling too fast for environment. Weather light and fine Road New Kings Road/Peterborough Road Reference 0100FH00853 Date 18/10/2000 Description Pedestrian hit by car. Severity Slight Contributory factors Pedestrian crossed road heedlessly and was hit by a car going ahead
normally. Weather Fine, but road was wet, dark.
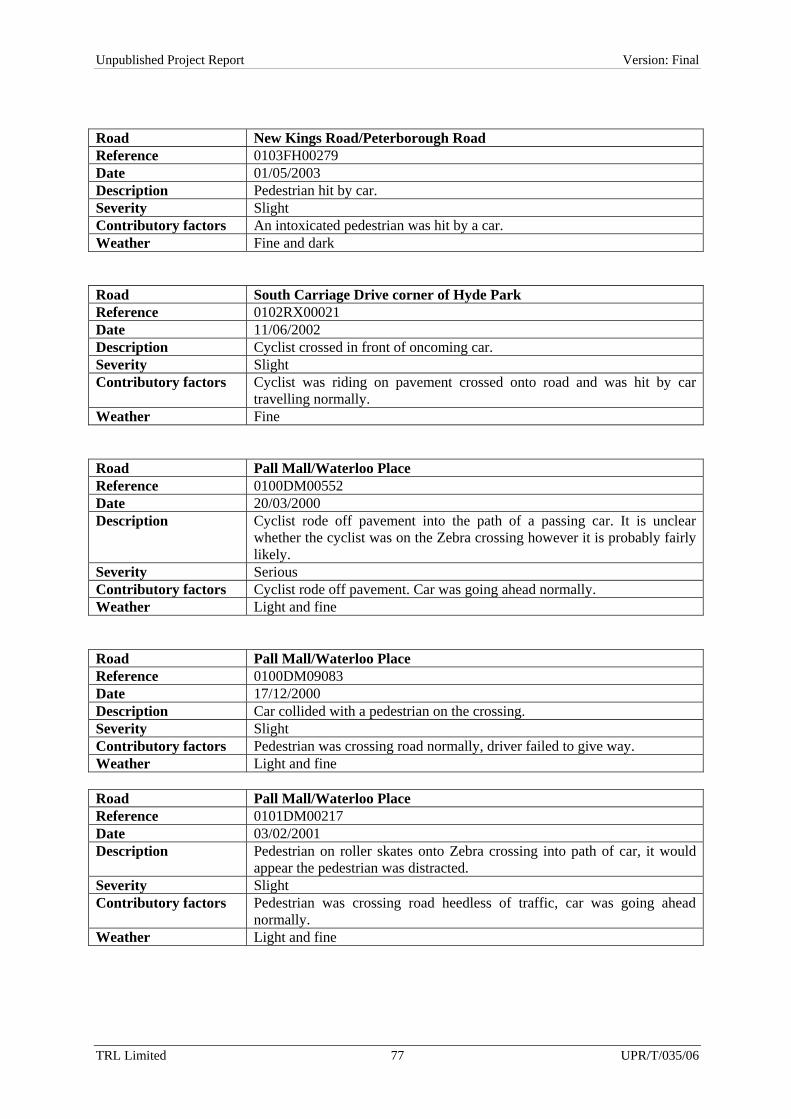
TRL Limited 77 UPR/T/035/06
Unpublished Project Report Version: Final
Road New Kings Road/Peterborough Road Reference 0103FH00279 Date 01/05/2003 Description Pedestrian hit by car. Severity Slight Contributory factors An intoxicated pedestrian was hit by a car. Weather Fine and dark Road South Carriage Drive corner of Hyde Park Reference 0102RX00021 Date 11/06/2002 Description Cyclist crossed in front of oncoming car. Severity Slight Contributory factors Cyclist was riding on pavement crossed onto road and was hit by car
travelling normally. Weather Fine Road Pall Mall/Waterloo Place Reference 0100DM00552 Date 20/03/2000 Description Cyclist rode off pavement into the path of a passing car. It is unclear
whether the cyclist was on the Zebra crossing however it is probably fairly likely.
Severity Serious Contributory factors Cyclist rode off pavement. Car was going ahead normally. Weather Light and fine Road Pall Mall/Waterloo Place Reference 0100DM09083 Date 17/12/2000 Description Car collided with a pedestrian on the crossing. Severity Slight Contributory factors Pedestrian was crossing road normally, driver failed to give way. Weather Light and fine Road Pall Mall/Waterloo Place Reference 0101DM00217 Date 03/02/2001 Description Pedestrian on roller skates onto Zebra crossing into path of car, it would
appear the pedestrian was distracted. Severity Slight Contributory factors Pedestrian was crossing road heedless of traffic, car was going ahead
normally. Weather Light and fine
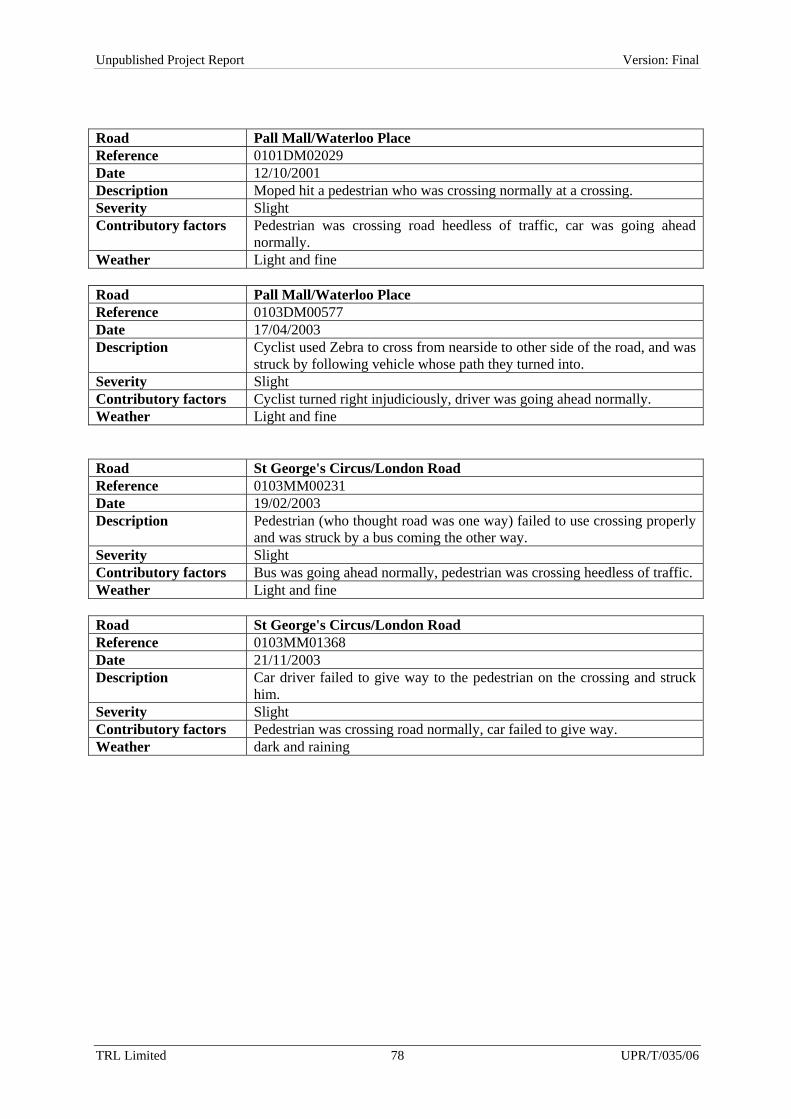
TRL Limited 78 UPR/T/035/06
Unpublished Project Report Version: Final
Road Pall Mall/Waterloo Place Reference 0101DM02029 Date 12/10/2001 Description Moped hit a pedestrian who was crossing normally at a crossing. Severity Slight Contributory factors Pedestrian was crossing road heedless of traffic, car was going ahead
normally. Weather Light and fine Road Pall Mall/Waterloo Place Reference 0103DM00577 Date 17/04/2003 Description Cyclist used Zebra to cross from nearside to other side of the road, and was
struck by following vehicle whose path they turned into. Severity Slight Contributory factors Cyclist turned right injudiciously, driver was going ahead normally. Weather Light and fine Road St George's Circus/London Road Reference 0103MM00231 Date 19/02/2003 Description Pedestrian (who thought road was one way) failed to use crossing properly
and was struck by a bus coming the other way. Severity Slight Contributory factors Bus was going ahead normally, pedestrian was crossing heedless of traffic. Weather Light and fine Road St George's Circus/London Road Reference 0103MM01368 Date 21/11/2003 Description Car driver failed to give way to the pedestrian on the crossing and struck
him. Severity Slight Contributory factors Pedestrian was crossing road normally, car failed to give way. Weather dark and raining

TRL Limited 79 UPR/T/035/06
Unpublished Project Report Version: Final
Appendix B. Zebra diagram Diagram to Schedule 1, Part 2 of The Zebra, Pelican and Puffin Pedestrian Crossings Regulations and General Directions 1997
Figure 8-1 Zebra crossing dimensions

TRL Limited 80 UPR/T/035/06
Unpublished Project Report Version: Final
Appendix C. Location maps with arrows indicating reference for direction of travel
Figure 8-2 Key to Hampton Court Road
Figure 8-3 Key to Pall Mall

TRL Limited 81 UPR/T/035/06
Unpublished Project Report Version: Final
Figure 8-4 Key to Wandsworth Bridge Road
Figure 8-5 Key to New Kings Road

TRL Limited 82 UPR/T/035/06
Unpublished Project Report Version: Final
Figure 8-6 Key to St Georges Circus
Figure 8-7 Key to South Carriage Drive (Hyde Park)
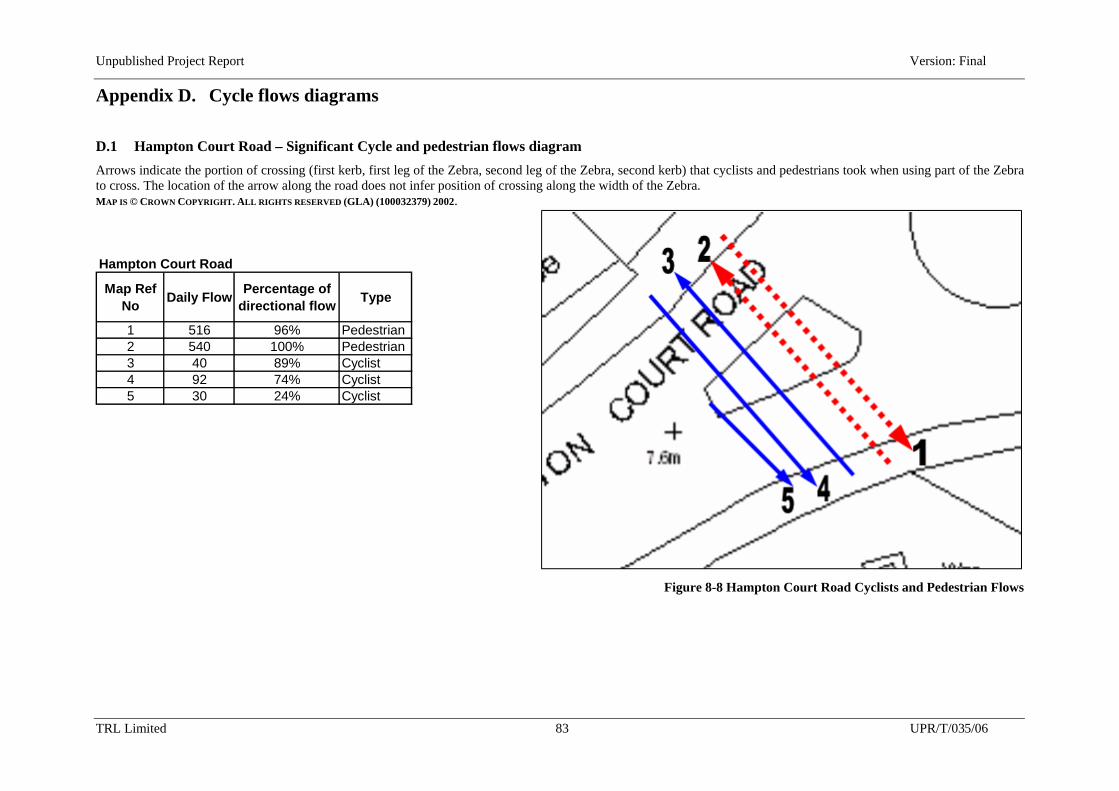
Unpublished Project Report Version: Final
TRL Limited 83 UPR/T/035/06
Hampton Court Road
Map Ref No Daily Flow Percentage of
directional flow Type
1 516 96% Pedestrian2 540 100% Pedestrian3 40 89% Cyclist4 92 74% Cyclist5 30 24% Cyclist
Appendix D. Cycle flows diagrams
D.1 Hampton Court Road – Significant Cycle and pedestrian flows diagram Arrows indicate the portion of crossing (first kerb, first leg of the Zebra, second leg of the Zebra, second kerb) that cyclists and pedestrians took when using part of the Zebra to cross. The location of the arrow along the road does not infer position of crossing along the width of the Zebra. MAP IS © CROWN COPYRIGHT. ALL RIGHTS RESERVED (GLA) (100032379) 2002.
Figure 8-8 Hampton Court Road Cyclists and Pedestrian Flows
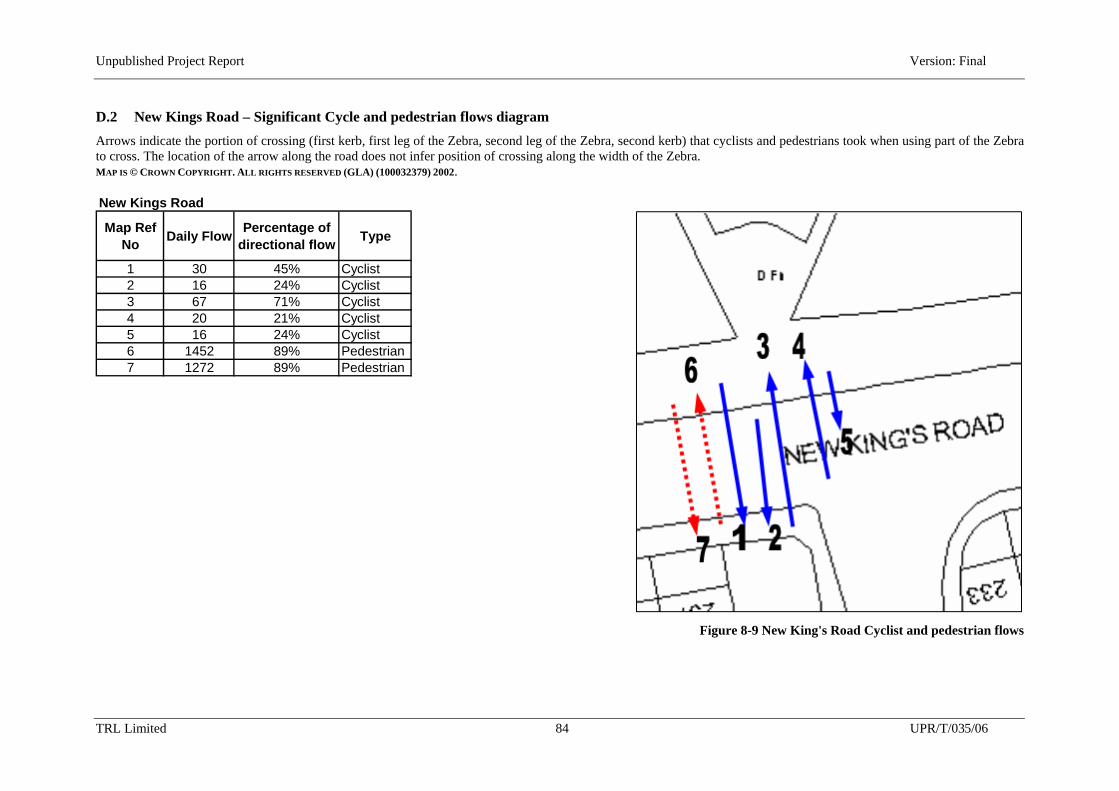
Unpublished Project Report Version: Final
TRL Limited 84 UPR/T/035/06
New Kings Road
Map Ref No Daily Flow Percentage of
directional flow Type
1 30 45% Cyclist2 16 24% Cyclist3 67 71% Cyclist4 20 21% Cyclist5 16 24% Cyclist6 1452 89% Pedestrian7 1272 89% Pedestrian
D.2 New Kings Road – Significant Cycle and pedestrian flows diagram Arrows indicate the portion of crossing (first kerb, first leg of the Zebra, second leg of the Zebra, second kerb) that cyclists and pedestrians took when using part of the Zebra to cross. The location of the arrow along the road does not infer position of crossing along the width of the Zebra. MAP IS © CROWN COPYRIGHT. ALL RIGHTS RESERVED (GLA) (100032379) 2002.
Figure 8-9 New King's Road Cyclist and pedestrian flows
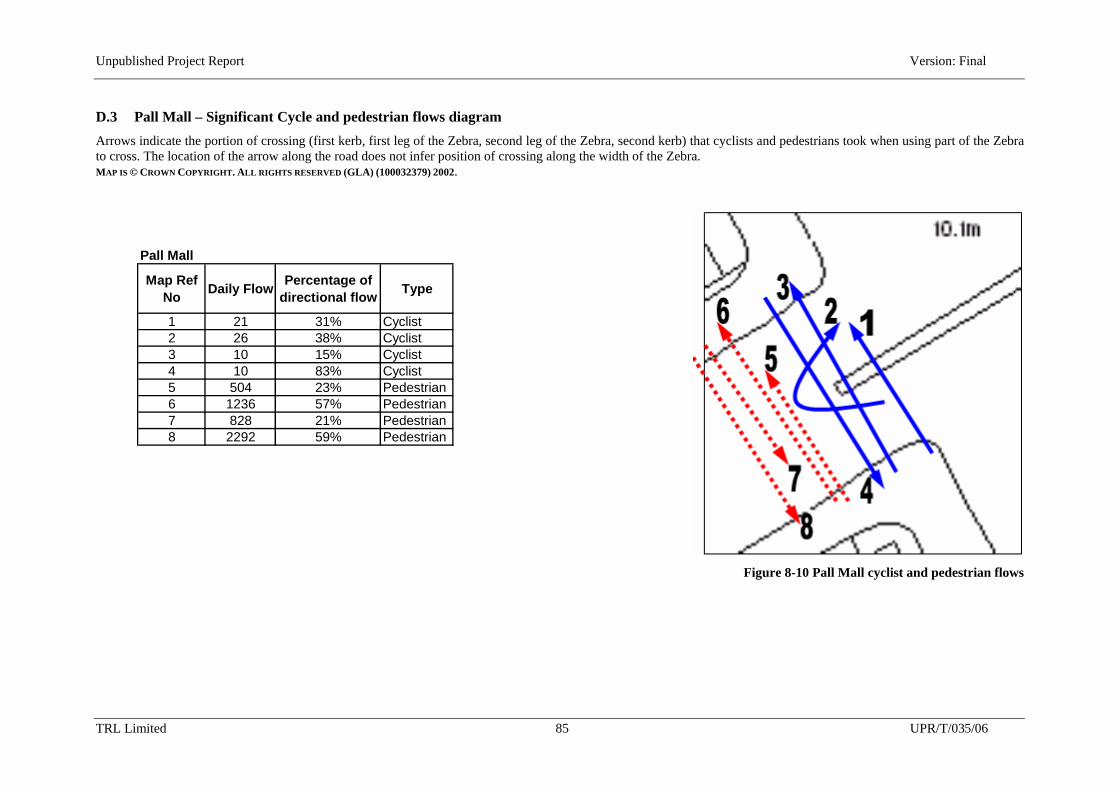
Unpublished Project Report Version: Final
TRL Limited 85 UPR/T/035/06
D.3 Pall Mall – Significant Cycle and pedestrian flows diagram Arrows indicate the portion of crossing (first kerb, first leg of the Zebra, second leg of the Zebra, second kerb) that cyclists and pedestrians took when using part of the Zebra to cross. The location of the arrow along the road does not infer position of crossing along the width of the Zebra. MAP IS © CROWN COPYRIGHT. ALL RIGHTS RESERVED (GLA) (100032379) 2002.
Figure 8-10 Pall Mall cyclist and pedestrian flows
Pall Mall
Map Ref No Daily Flow Percentage of
directional flow Type
1 21 31% Cyclist2 26 38% Cyclist3 10 15% Cyclist4 10 83% Cyclist5 504 23% Pedestrian6 1236 57% Pedestrian7 828 21% Pedestrian8 2292 59% Pedestrian

Unpublished Project Report Version: Final
TRL Limited 86 UPR/T/035/06
South Carriage Drive
Map Ref No Daily Flow Percentage of
directional flow Type
1 35 10% Cyclist2 78 22% Cyclist3 181 51% Cyclist4 264 41% Cyclist5 149 23% Cyclist6 150 23% Cyclist7 2016 92% Pedestrian8 1788 75% Pedestrian
D.4 South Carriage Drive (Hyde Park) – Significant Cyclist and Pedestrians flows map Arrows indicate the portion of crossing (first kerb, first leg of the Zebra, second leg of the Zebra, second kerb) that cyclists and pedestrians took when using part of the Zebra to cross. The location of the arrow along the road does not infer position of crossing along the width of the Zebra. MAP IS © CROWN COPYRIGHT. ALL RIGHTS RESERVED (GLA) (100032379) 2002.
Figure 8-11 South Carriage Drive cyclist and pedestrian flows
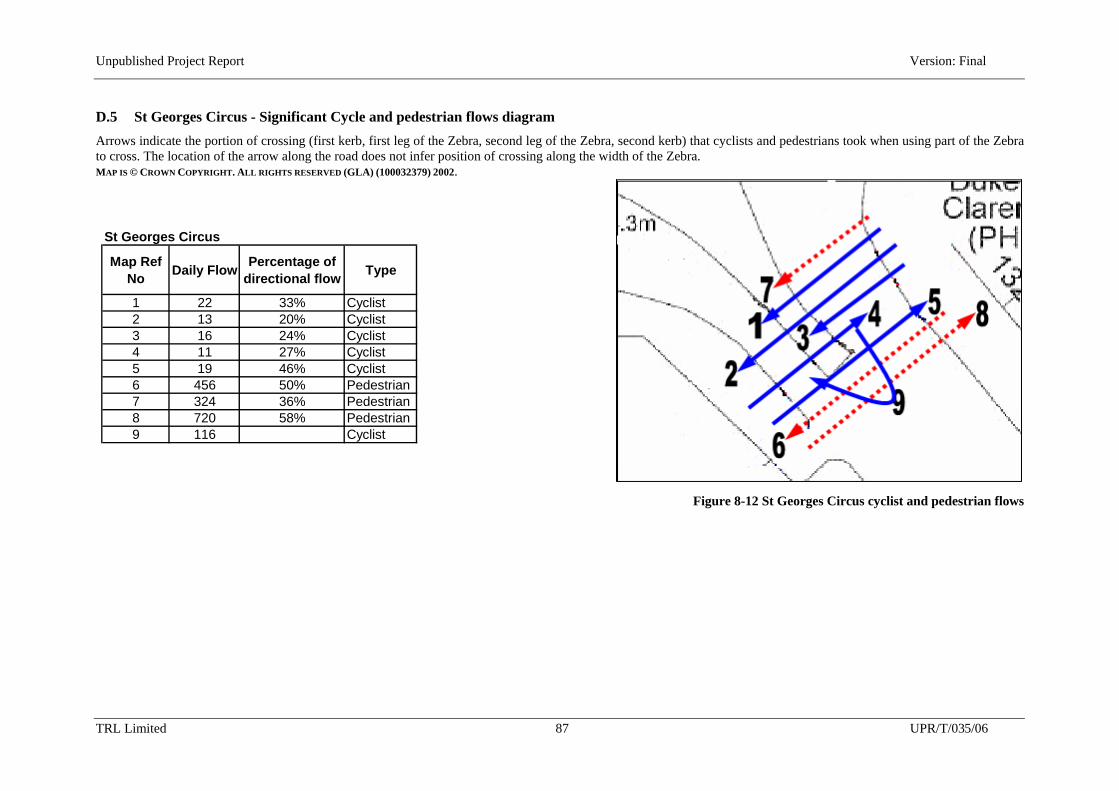
Unpublished Project Report Version: Final
TRL Limited 87 UPR/T/035/06
St Georges Circus
Map Ref No Daily Flow Percentage of
directional flow Type
1 22 33% Cyclist2 13 20% Cyclist3 16 24% Cyclist4 11 27% Cyclist5 19 46% Cyclist6 456 50% Pedestrian7 324 36% Pedestrian8 720 58% Pedestrian9 116 Cyclist
D.5 St Georges Circus - Significant Cycle and pedestrian flows diagram Arrows indicate the portion of crossing (first kerb, first leg of the Zebra, second leg of the Zebra, second kerb) that cyclists and pedestrians took when using part of the Zebra to cross. The location of the arrow along the road does not infer position of crossing along the width of the Zebra. MAP IS © CROWN COPYRIGHT. ALL RIGHTS RESERVED (GLA) (100032379) 2002.
Figure 8-12 St Georges Circus cyclist and pedestrian flows
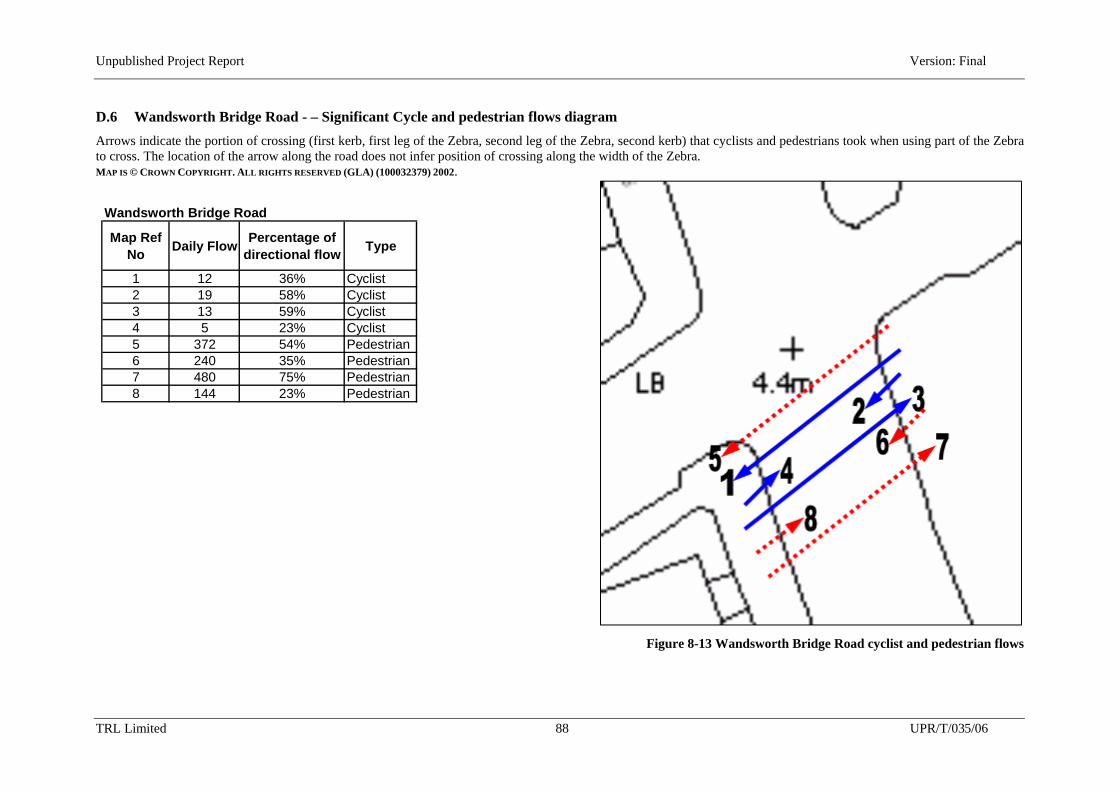
Unpublished Project Report Version: Final
TRL Limited 88 UPR/T/035/06
Wandsworth Bridge Road
Map Ref No Daily Flow Percentage of
directional flow Type
1 12 36% Cyclist2 19 58% Cyclist3 13 59% Cyclist4 5 23% Cyclist5 372 54% Pedestrian6 240 35% Pedestrian7 480 75% Pedestrian8 144 23% Pedestrian
D.6 Wandsworth Bridge Road - – Significant Cycle and pedestrian flows diagram Arrows indicate the portion of crossing (first kerb, first leg of the Zebra, second leg of the Zebra, second kerb) that cyclists and pedestrians took when using part of the Zebra to cross. The location of the arrow along the road does not infer position of crossing along the width of the Zebra. MAP IS © CROWN COPYRIGHT. ALL RIGHTS RESERVED (GLA) (100032379) 2002.
Figure 8-13 Wandsworth Bridge Road cyclist and pedestrian flows
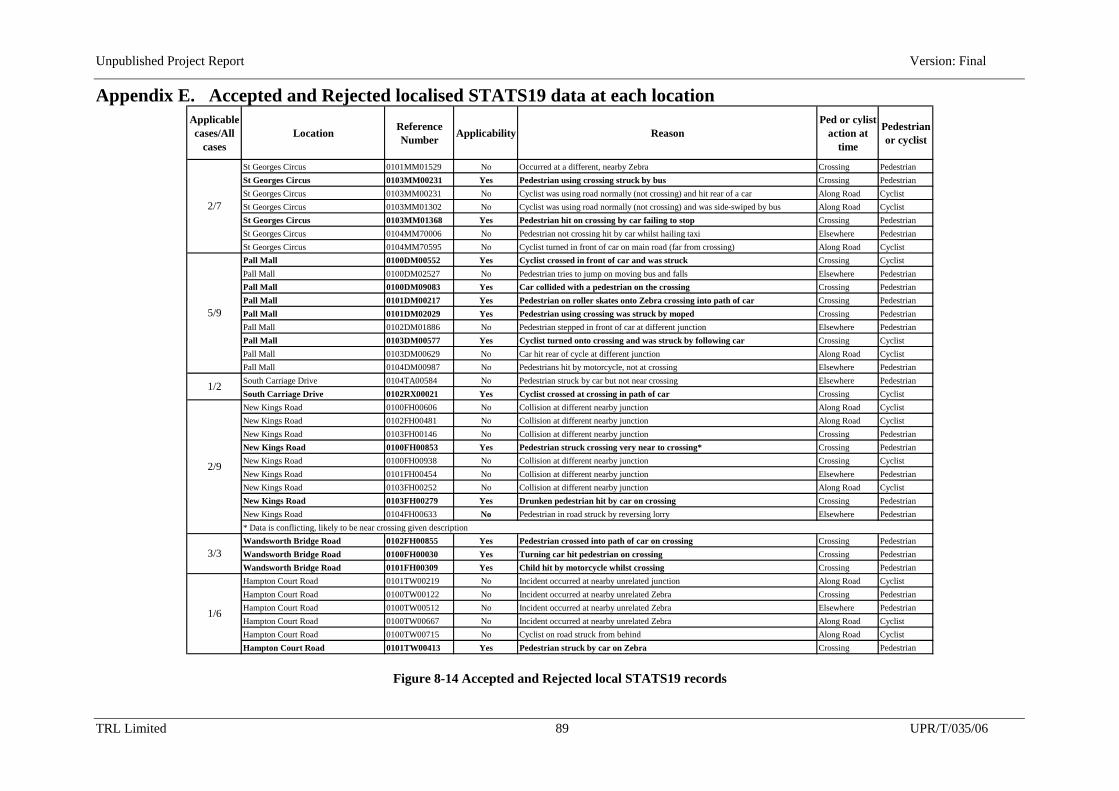
Unpublished Project Report Version: Final
TRL Limited 89 UPR/T/035/06
Appendix E. Accepted and Rejected localised STATS19 data at each location Applicable cases/All
casesLocation Reference
Number Applicability ReasonPed or cylist
action at time
Pedestrian or cyclist
St Georges Circus 0101MM01529 No Occurred at a different, nearby Zebra Crossing PedestrianSt Georges Circus 0103MM00231 Yes Pedestrian using crossing struck by bus Crossing PedestrianSt Georges Circus 0103MM00231 No Cyclist was using road normally (not crossing) and hit rear of a car Along Road CyclistSt Georges Circus 0103MM01302 No Cyclist was using road normally (not crossing) and was side-swiped by bus Along Road CyclistSt Georges Circus 0103MM01368 Yes Pedestrian hit on crossing by car failing to stop Crossing PedestrianSt Georges Circus 0104MM70006 No Pedestrian not crossing hit by car whilst hailing taxi Elsewhere PedestrianSt Georges Circus 0104MM70595 No Cyclist turned in front of car on main road (far from crossing) Along Road CyclistPall Mall 0100DM00552 Yes Cyclist crossed in front of car and was struck Crossing CyclistPall Mall 0100DM02527 No Pedestrian tries to jump on moving bus and falls Elsewhere PedestrianPall Mall 0100DM09083 Yes Car collided with a pedestrian on the crossing Crossing PedestrianPall Mall 0101DM00217 Yes Pedestrian on roller skates onto Zebra crossing into path of car Crossing PedestrianPall Mall 0101DM02029 Yes Pedestrian using crossing was struck by moped Crossing PedestrianPall Mall 0102DM01886 No Pedestrian stepped in front of car at different junction Elsewhere PedestrianPall Mall 0103DM00577 Yes Cyclist turned onto crossing and was struck by following car Crossing CyclistPall Mall 0103DM00629 No Car hit rear of cycle at different junction Along Road CyclistPall Mall 0104DM00987 No Pedestrians hit by motorcycle, not at crossing Elsewhere PedestrianSouth Carriage Drive 0104TA00584 No Pedestrian struck by car but not near crossing Elsewhere PedestrianSouth Carriage Drive 0102RX00021 Yes Cyclist crossed at crossing in path of car Crossing CyclistNew Kings Road 0100FH00606 No Collision at different nearby junction Along Road CyclistNew Kings Road 0102FH00481 No Collision at different nearby junction Along Road CyclistNew Kings Road 0103FH00146 No Collision at different nearby junction Crossing PedestrianNew Kings Road 0100FH00853 Yes Pedestrian struck crossing very near to crossing* Crossing PedestrianNew Kings Road 0100FH00938 No Collision at different nearby junction Crossing CyclistNew Kings Road 0101FH00454 No Collision at different nearby junction Elsewhere PedestrianNew Kings Road 0103FH00252 No Collision at different nearby junction Along Road CyclistNew Kings Road 0103FH00279 Yes Drunken pedestrian hit by car on crossing Crossing PedestrianNew Kings Road 0104FH00633 No Pedestrian in road struck by reversing lorry Elsewhere Pedestrian
Wandsworth Bridge Road 0102FH00855 Yes Pedestrian crossed into path of car on crossing Crossing PedestrianWandsworth Bridge Road 0100FH00030 Yes Turning car hit pedestrian on crossing Crossing PedestrianWandsworth Bridge Road 0101FH00309 Yes Child hit by motorcycle whilst crossing Crossing PedestrianHampton Court Road 0101TW00219 No Incident occurred at nearby unrelated junction Along Road CyclistHampton Court Road 0100TW00122 No Incident occurred at nearby unrelated Zebra Crossing PedestrianHampton Court Road 0100TW00512 No Incident occurred at nearby unrelated Zebra Elsewhere PedestrianHampton Court Road 0100TW00667 No Incident occurred at nearby unrelated Zebra Along Road CyclistHampton Court Road 0100TW00715 No Cyclist on road struck from behind Along Road CyclistHampton Court Road 0101TW00413 Yes Pedestrian struck by car on Zebra Crossing Pedestrian
* Data is conflicting, likely to be near crossing given description
3/3
1/6
2/7
5/9
1/2
2/9
Figure 8-14 Accepted and Rejected local STATS19 records
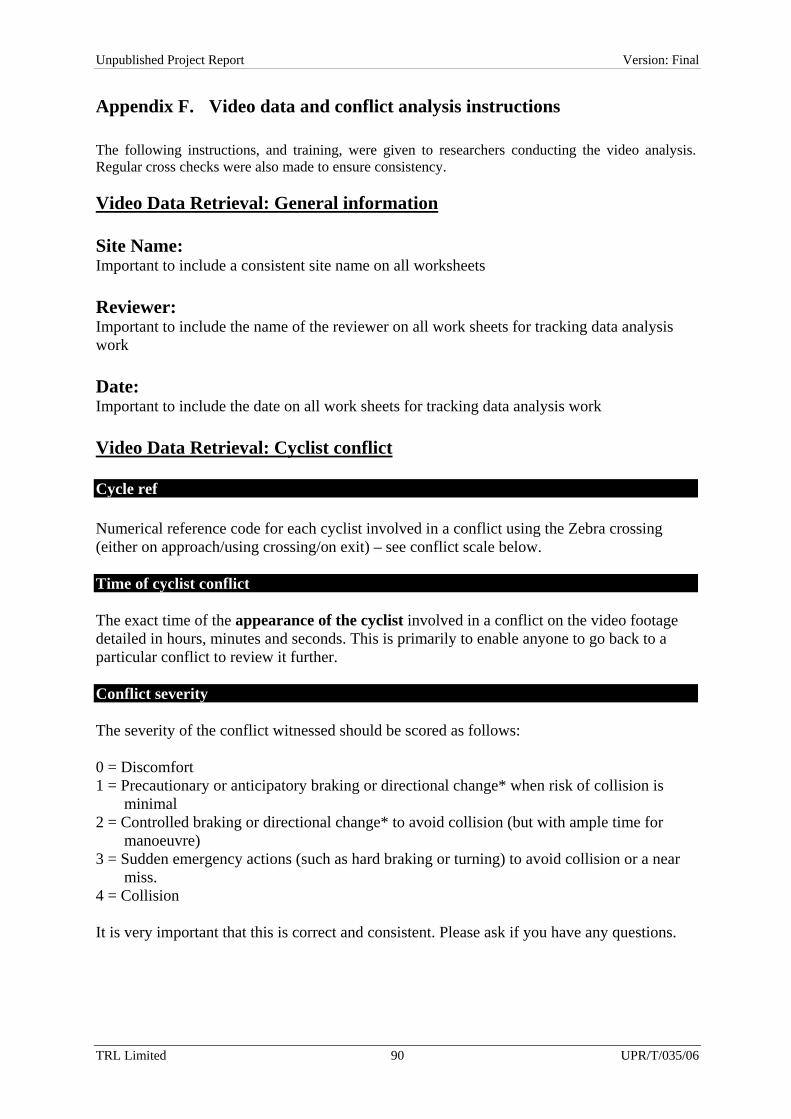
Unpublished Project Report Version: Final
TRL Limited 90 UPR/T/035/06
Appendix F. Video data and conflict analysis instructions The following instructions, and training, were given to researchers conducting the video analysis. Regular cross checks were also made to ensure consistency. Video Data Retrieval: General information Site Name: Important to include a consistent site name on all worksheets Reviewer: Important to include the name of the reviewer on all work sheets for tracking data analysis work Date: Important to include the date on all work sheets for tracking data analysis work Video Data Retrieval: Cyclist conflict Cycle ref Numerical reference code for each cyclist involved in a conflict using the Zebra crossing (either on approach/using crossing/on exit) – see conflict scale below. Time of cyclist conflict The exact time of the appearance of the cyclist involved in a conflict on the video footage detailed in hours, minutes and seconds. This is primarily to enable anyone to go back to a particular conflict to review it further. Conflict severity The severity of the conflict witnessed should be scored as follows: 0 = Discomfort 1 = Precautionary or anticipatory braking or directional change* when risk of collision is
minimal 2 = Controlled braking or directional change* to avoid collision (but with ample time for
manoeuvre) 3 = Sudden emergency actions (such as hard braking or turning) to avoid collision or a near
miss. 4 = Collision It is very important that this is correct and consistent. Please ask if you have any questions.

Unpublished Project Report Version: Final
TRL Limited 91 UPR/T/035/06
Crossing route This uses a method of measuring which cordons a cyclist travels across. Use the following table to construct a 5 number sequence. first kerb first half of
crossing second half of crossing
second kerb Direction
This means they travel over the first dropped kerb of the Zebra.
This means they travel over the first part of the Zebra (if it has a central refuge).
This means they travel over the second half of the Zebra (if it has a central refuge).
This means they travel over the exit dropped kerb of the Zebra.
Mark one direction 1, the other 0, as indicated on the map.
Mark as a 1 for affirmative, 0 for negative
Mark as a 1 for affirmative, 0 for negative
Mark as a 1 for affirmative, 0 for negative
Mark as a 1 for affirmative, 0 for negative
Mark as 1 for one direction, 0 for the other
This would mean that a cyclists travelling from the path on one side, across most of the crossing but diverting up the road just before the kerb on the other side, in direction 1 would be described as 11101. Conflict with? This indicates who the cyclist was in conflict with. The direction is either “A” or “B”. “A” means that conflicting traffic was coming from the right of the cyclist as they crossed the road, “B” indicates that traffic was coming from their left. Please use the vehicle type descriptions in the dropdown box to indicate which vehicles were in conflict. The first vehicles should be the ones in most or nearest conflict. Vehicles and people from other directions are dealt with below. Other direction Write in textually other vehicles or people that the cyclist comes into conflict with. Especially include pedestrians or cyclists which may be travelling in the same or opposite direction. Level of traffic This indicates the relative level of traffic at the time of the conflict. Low might mean one or two vehicles in the vicinity, medium might mean quite a few vehicles but in free flow. High would mean a lot of traffic which may start to back up. Use the drop down menus. Type of Cyclist This is a guess regarding the type of cyclist. This could be;
1. Non-professional – A cyclist travelling to work or for leisure 2. Professional – A cyclist who uses the cycle as part of their work (i.e. a courier) 3. School – A schoolchild on their way to school. A school uniform could be the best
indicator of this. Use the drop down menus. Age
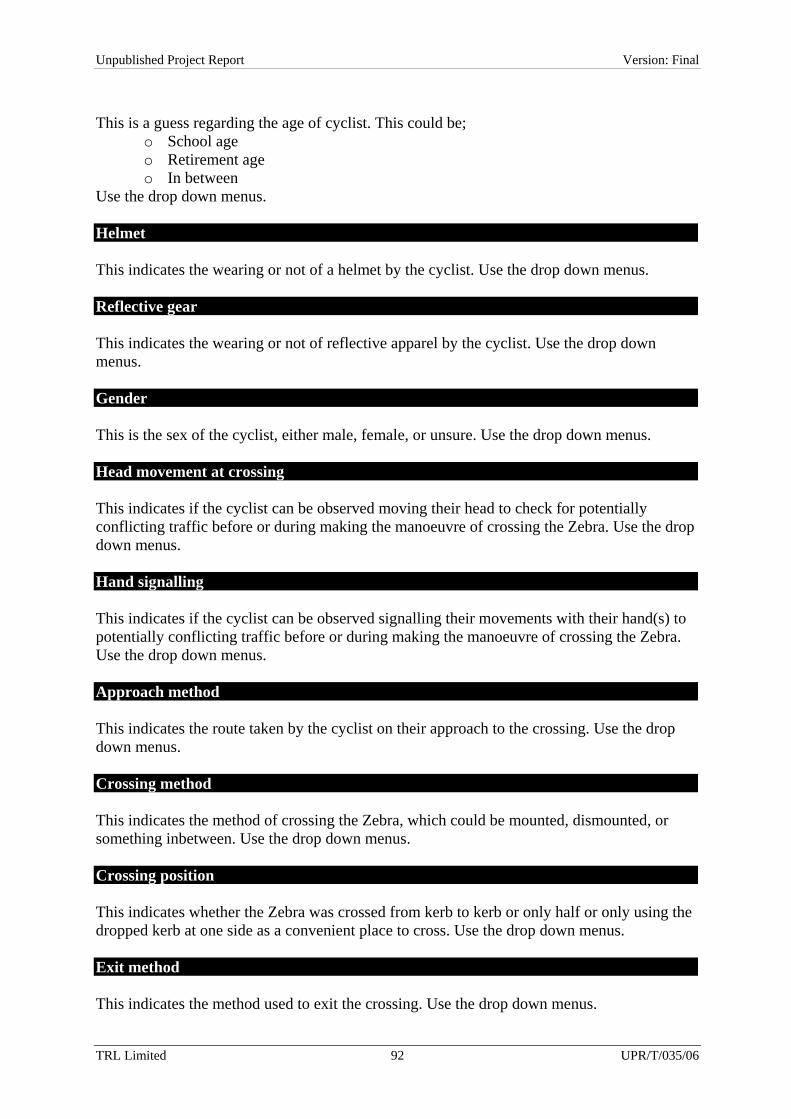
Unpublished Project Report Version: Final
TRL Limited 92 UPR/T/035/06
This is a guess regarding the age of cyclist. This could be;
o School age o Retirement age o In between
Use the drop down menus. Helmet This indicates the wearing or not of a helmet by the cyclist. Use the drop down menus. Reflective gear This indicates the wearing or not of reflective apparel by the cyclist. Use the drop down menus. Gender This is the sex of the cyclist, either male, female, or unsure. Use the drop down menus. Head movement at crossing This indicates if the cyclist can be observed moving their head to check for potentially conflicting traffic before or during making the manoeuvre of crossing the Zebra. Use the drop down menus. Hand signalling This indicates if the cyclist can be observed signalling their movements with their hand(s) to potentially conflicting traffic before or during making the manoeuvre of crossing the Zebra. Use the drop down menus. Approach method This indicates the route taken by the cyclist on their approach to the crossing. Use the drop down menus. Crossing method This indicates the method of crossing the Zebra, which could be mounted, dismounted, or something inbetween. Use the drop down menus. Crossing position This indicates whether the Zebra was crossed from kerb to kerb or only half or only using the dropped kerb at one side as a convenient place to cross. Use the drop down menus. Exit method This indicates the method used to exit the crossing. Use the drop down menus.

Unpublished Project Report Version: Final
TRL Limited 93 UPR/T/035/06
Approximate speed of cyclist on approach This indicates, as a rough proportion to walking speed, the relative speed or cyclists recorded on their final approach to the Zebra. Use the drop down menus. Approximate speed of cyclist in using crossing As above, but for cyclists on the crossing. Use the drop down menus. Does cyclist wait in refuge? This indicates whether the cyclist waits in the refuge or passes straight through it. Entry to clearance time (in seconds) This indicates the time taken to cross the Zebra from the first point of entry to the clearance time (in seconds). Ignore cases that do not travel from kerb to kerb. Textual description of location of possibly relevant pedestrians at or before time of conflict Pedestrians might alter or influence the path of cyclists in conflict situations. Please give a description of possibly relevant pedestrians in conflict situations. Approx Speed of vehicles in conflict This is a guess regarding the relative speed of vehicles prior to the collision situation. Use the drop down menus. Textual description of conflict This is a short paragraph to cover any potentially relevant points that the rest of the data entry sheet either did not cover or did not cover sufficiently.
Unpublished Project Report Version: Final
TRL Limited 94 UPR/T/035/06
Appendix G. Design Considerations The following outlines the primary design considerations for Tiger crossings and how this might be realised or confounded in the components of a crossing. Primary Consideration Cyclist conflict with pedestrian A crossing is often at a point where routes will merge and diverge, this crossing action creates the potential for conflict between pedestrians and cyclist users that makes the crossing different from a normal shared use path. This could be mitigated by the use of adequate or segregated space, so that movements of others are easily seen and anticipated, and avoiding action can be taken. A particular concern is cyclist movement from behind a pedestrian, as the speeds of cyclists are typically higher than pedestrians, the pedestrian may inadvertently move into the path of the cyclist resulting in a collision. This factor is especially heightened with pedestrians that have limited sensory awareness. Avoidance of others necessarily involves the speed of users therefore designs would be required to limit speeds to that which can be used to negotiate the crossing without causing adverse conflict to others. Adequate space involves the waiting areas at either side of the crossing, the crossing itself, the central reservation, and the approach paths to the crossing. Consideration should also be given to vegetation and the built environment which may act to shield the view of users to the detriment of safety. Primary Consideration Crossing user conflict with highway user Highway users are typically driving cars or larger vehicles, these vehicles take time, thus distance, to stop and sudden movements from the crossing user may not allow for sufficient braking time before collision. This risk could be mitigated by increasing the field of view of users, especially given the typical viewing range of a cyclist and a motorist. This is not always practicable given space considerations. The ability of a fast-moving cyclist to come into view of a car driver in adequate time to brake safely Pedestrian movement are safer because the pedestrian may move backwards easily, and can accelerate and stop easily, thus avoid a potential conflict. The handling and size characteristics of a cycle may not lend itself well to avoidance manoeuvres at crossings. Primary Consideration Priority Priority at Zebra crossings is conferred to the pedestrian once the highway user has stopped, there is the potential for confusion in that cyclists may believe that they have absolute priority, thus will advance onto the crossing without waiting for traffic to stop, and that this action will lead to collision. Mitigation against this potential hazard could come from signage or signalling. Primary Consideration Fear of injury Crossing users may feel uneasy about the potential for conflict with others and may stop using the crossing altogether. Mitigation may come in the form of larger flow areas and lower cycle speeds. Cyclists may feel uneasy about using the crossing for any one of the potential problems noted here, this would undermine the benefits of introducing Shared Use Zebra Crossings.