Embed Size (px)
Citation preview

___________________________________________________________________________
2019/ISOM/SYM/004 Session 1.2
Shared Prosperity and Narrowing the Income Gaps in the Context of Global and Regional Perspective
Submitted by: Institut Masa Depan Malaysia
Symposium on Priorities for APEC 2020Langkawi, Malaysia
9 December 2019
Symposium on
Priorities for
APEC 2020
9 December 2019
by
Mohd Nizam Mahshar
Chief Executive Officer
Institut Masa DepanMalaysia
SHARED PROSPERITY AND NARROWING THE INCOME GAPS IN THE CONTEXT OF GLOBAL
AND REGIONAL PERSPECTIVE
“Inequality of outcome among today’s generation is the source of the unfair advantage received by the next generation. If we are concerned about equality of opportunity tomorrow, we need to be concerned about inequality of outcome today.”
Tony Atkinson; Anthony B. Atkinson (2015); Inequality What Can
Be Done?; Harvard University Press
1

Malaysia’s Shared Prosperity Vision
1. Development for all – Restructuring Economy
2. Addressing Wealth and Income Disparities – Addressing inequalities acrossincome groups, ethnicities, regions and supply chains
3. United, Prosperous and Dignified Nation - Nation building and become aneconomic centre of Asia
APEC’S Mission Statement
The primary goal is to support sustainable economic growth and prosperity in the Asia-Pacific region.
2

Inequality – A Destructive Cycle
Nations in DisparityDifferent national trajectories show risingglobal inequality is not inevitable.
Class Disparity RisingThe income growth in each income group increasedbut the Top earner income grew faster than Middleand Bottom class.
Rising InequalityDespite growth in the emerging world, there is a sharp rising inequality between world individuals
Inequality CrisisWorld is is moving to higher inequalityfrontier and to reach crisis and unrest in thenext 2 decades
Stagnation of growth for the bottom
The income share of Bottom 50% has slightlyincreased but static in decade. Dumbing downand less innovation.
Bottom earners lagging behind
The Bottom class increased at a slower rate of 150%compared to Top income group of more than 200%
Top 1% controlIn recent decades, the distribution of income focused on top 10%. Top 1% captured twice global income growth as the bottom 50% since 1980.
Imbalance growthBottom 50% only captured 12% of total growth, top 1% captured 27% of total growth.
What does it mean by Global Inequality 3

Public Vs Private Capital Dynamics
PRIVATE CONTROLIn both rich and emerging nations since1980, very large transfers of public toprivate wealth occurred in nearly allcountries.
CHINA AND POVERTYDespite liberalization of industry and improvedtrade capabilities via free trade, the growth ofhousehold income in China increased morethan income groups in USA and France thusChina was more able to manage poverty.
CAPITAL DYNAMICPrivately or public owned capital dynamicchanged in the last 3 decades. Economicinequality is largely driven by the unequalownership of capital. Capital also meansintellectual property, assess, technology andpolitical access.
GOVERNMENTS LESS ABLE TO MANAGE INEQUALITY
Public wealth is now negative or close to zero inrich countries while national wealth hassubstantially increased. As it is widelyinstitutionalised, it is the role of governments totackle inequality; thus created greatimplications for wealth inequality amongindividuals
How Capital contributes to Inequality 4

Seven Deadly Sins of Inequality
Technological IlliteracyCountries with higher use and adaptation totechnologies have higher exponential growth leavinglow technology countries lagging further behind
Hardcore PovertyOne month Swiss spending can cover 7 years for aman in Central African Republic. Inequalitydemonstrated by the divide between the ultra richwith famine and hunger still happening.
Social ImmobilityThe Global Database on IntergenerationalMobility (GDIM) shows mobility in emergingcountries is slower and family background(with wealth) is the most key factor thatpushed intergenerational mobility.
Dumbing the dumbSchool life expectancy in Australia is 22.5 yearswhile most poor countries averages 5 years.
Social ConflictDisparity will create distrust and insecurity;while class disparity creates significant effectto conflict; ethnic disparity aggravates it.
Life ExpectancyIn several African countries, one and a half out often children born today will die before they arefive years old. In Europe and East Asia; only 1 in250 children will die before he or she is 5 years old
Deprivation of Basic Human NeedsNumbers of emerging countries moving intohigh income and developed countries still haveaveragely below 2% of its population nothaving access to basic human needs i.e. accessto water, health and education.
5
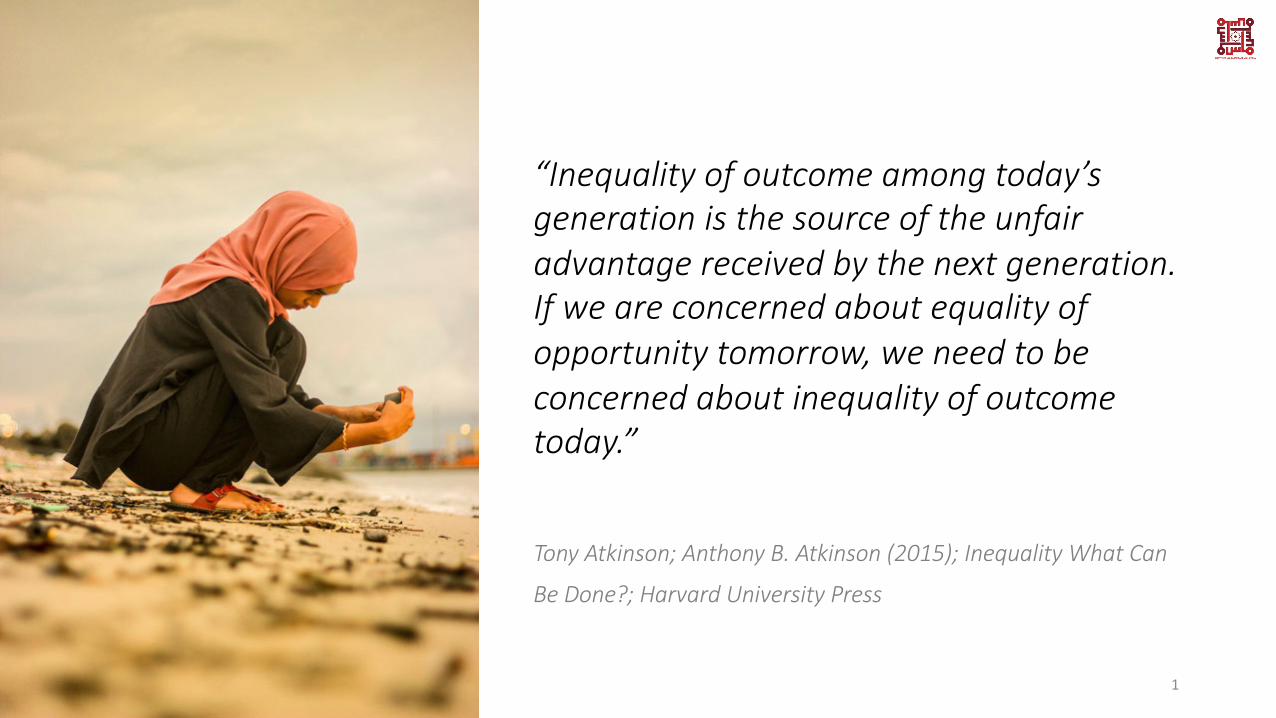
Global Inequality in Living Conditionsbetween the world’s worst off and best off countries
Data source: All data for 2017 is taken from various UN publications. Historical estimates for 1800 are from OECD – How was life? And Our World in Data. Licensed by CC-BY by the author Max Roser. 6

Why Inequality continues to be there and how to manage it?
Growth brought inequalityThe global inequality of today is largely the creation of modern economic growth. Health progress creates inequality in health just as economic progress creates economic inequality.
Atkinson
Progress creates InequalityIt brings together two important elements of well-being: health and prosperity. It is about “the endless dance between progress and inequality, about how progress creates inequality, and how inequality can sometimes be helpful . . . and sometimes unhelpful” to progress (p. xiii).
Deaton, Great Escapes.
Who prospers, who’sthe loser ?The extent of global inequality – it is who youare, and where you are
We are far more prosperous than before;
why complain ?“For thousands of years, those who were lucky enough to escape death in childhood faced years of grinding poverty.”
Deaton, Great Escapes
7

8
Aligning Malaysia’s Vision 2030in pursuit of Shared Prosperity for Asia Pacific agenda
8
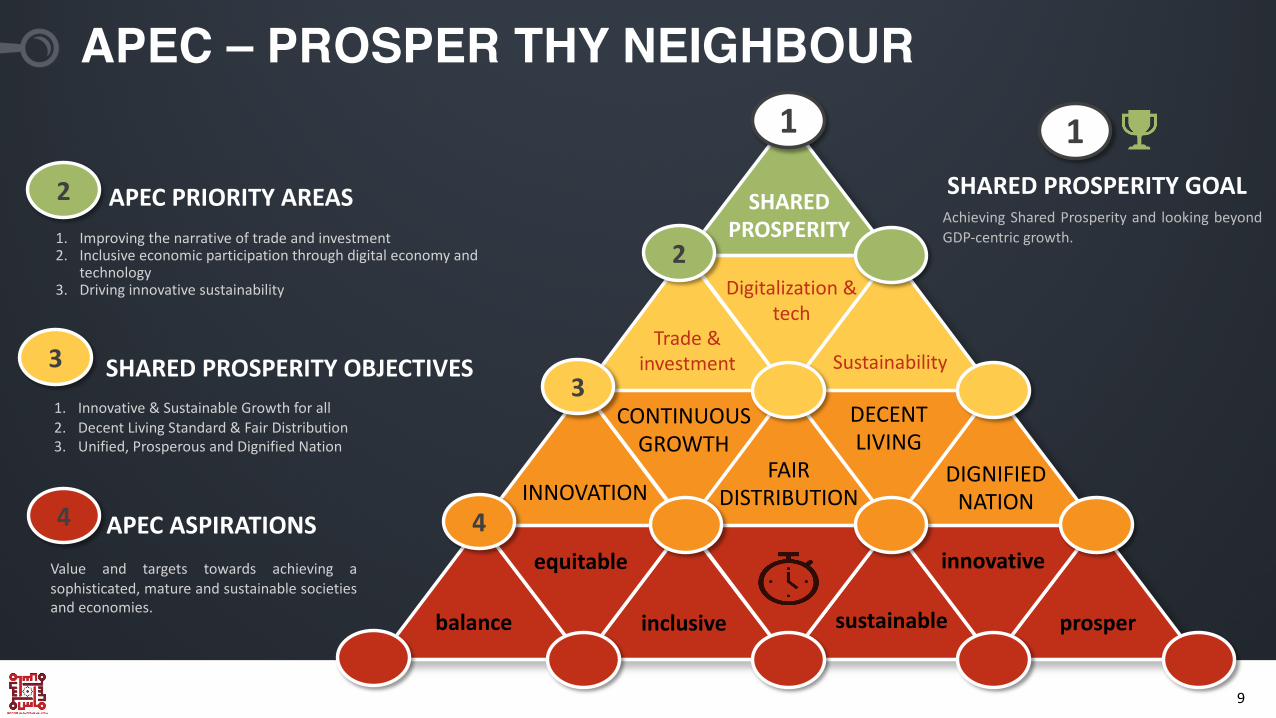
APEC – PROSPER THY NEIGHBOUR
SHARED PROSPERITY GOALAchieving Shared Prosperity and looking beyondGDP-centric growth.
SHARED PROSPERITY OBJECTIVES1. Innovative & Sustainable Growth for all2. Decent Living Standard & Fair Distribution3. Unified, Prosperous and Dignified Nation
APEC ASPIRATIONSValue and targets towards achieving asophisticated, mature and sustainable societiesand economies.
APEC PRIORITY AREAS1. Improving the narrative of trade and investment2. Inclusive economic participation through digital economy and
technology3. Driving innovative sustainability
1
SHAREDPROSPERITY
INNOVATION
CONTINUOUSGROWTH
FAIR DISTRIBUTION
DECENTLIVING
DIGNIFIEDNATION
Digitalization & tech
Trade & investment Sustainability
balance
equitable
inclusive sustainable
innovative
prosper
2
3
44
3
2
1
9
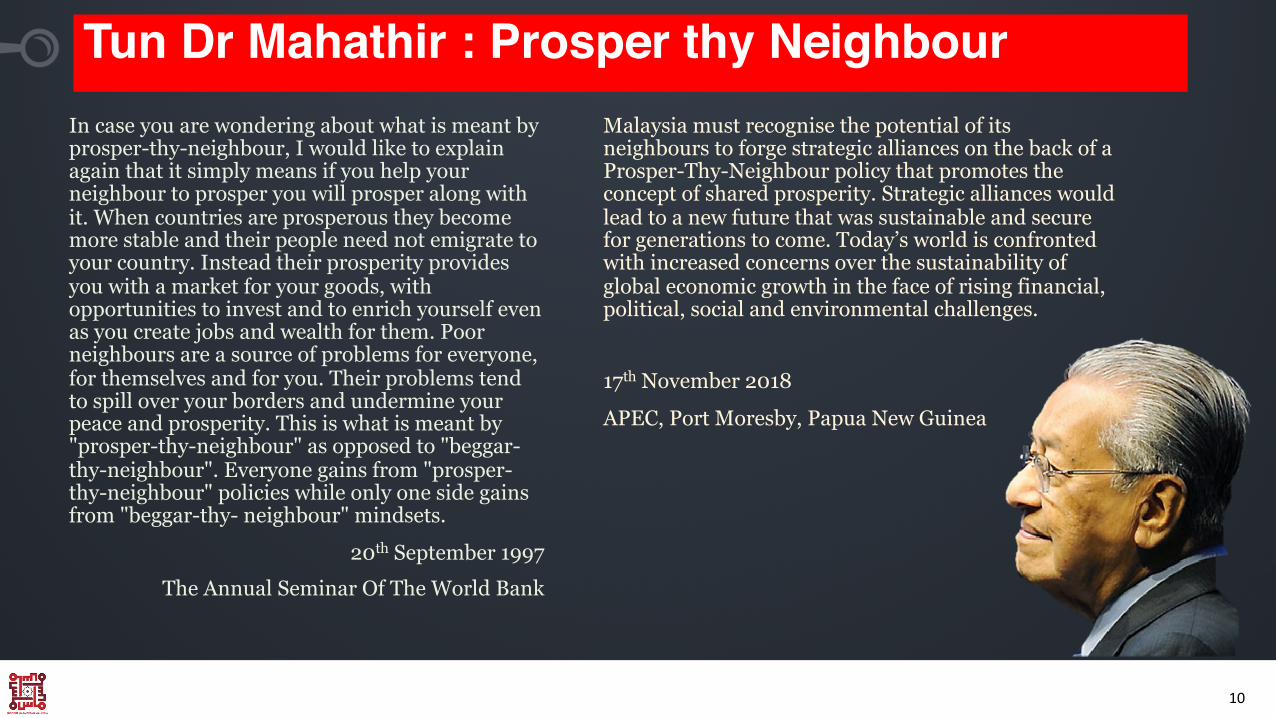
Tun Dr Mahathir : Prosper thy NeighbourMalaysia must recognise the potential of its neighbours to forge strategic alliances on the back of a Prosper-Thy-Neighbour policy that promotes the concept of shared prosperity. Strategic alliances would lead to a new future that was sustainable and secure for generations to come. Today’s world is confronted with increased concerns over the sustainability of global economic growth in the face of rising financial, political, social and environmental challenges.
17th November 2018
APEC, Port Moresby, Papua New Guinea
In case you are wondering about what is meant by prosper-thy-neighbour, I would like to explain again that it simply means if you help your neighbour to prosper you will prosper along with it. When countries are prosperous they become more stable and their people need not emigrate to your country. Instead their prosperity provides you with a market for your goods, with opportunities to invest and to enrich yourself even as you create jobs and wealth for them. Poor neighbours are a source of problems for everyone, for themselves and for you. Their problems tend to spill over your borders and undermine your peace and prosperity. This is what is meant by "prosper-thy-neighbour" as opposed to "beggar-thy-neighbour". Everyone gains from "prosper-thy-neighbour" policies while only one side gains from "beggar-thy- neighbour" mindsets.
20th September 1997 The Annual Seminar Of The World Bank
10
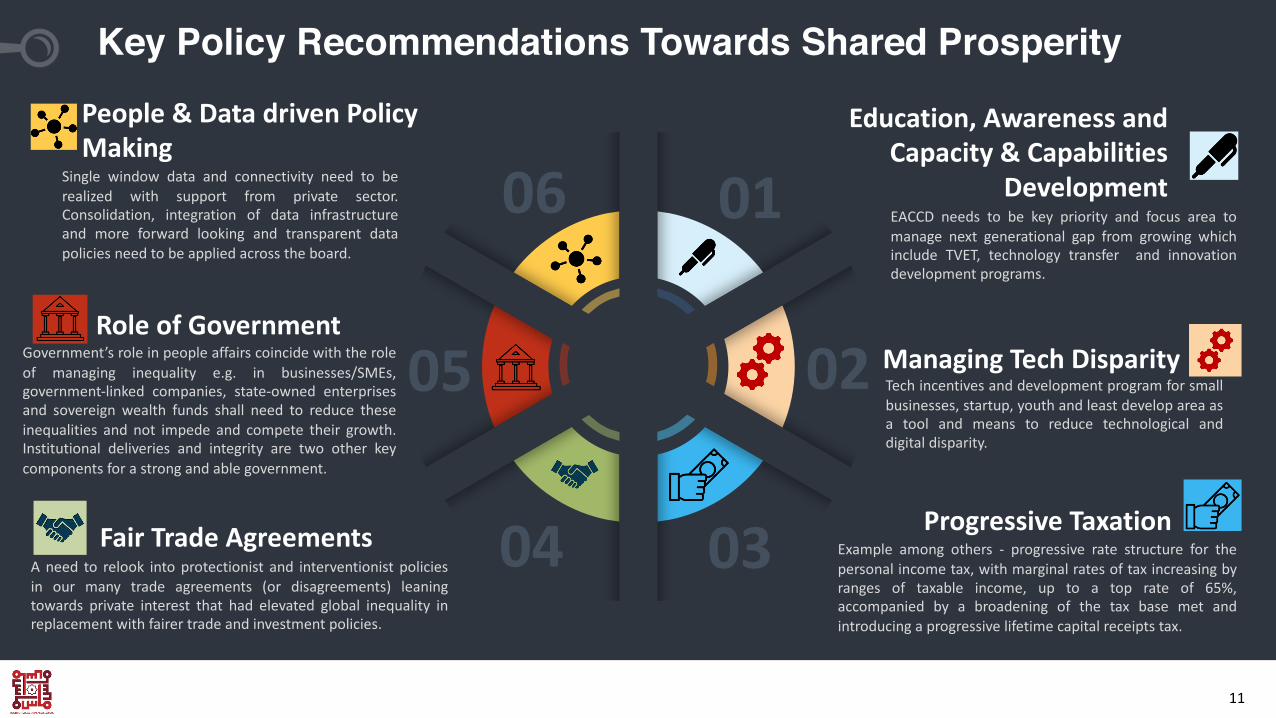
Key Policy Recommendations Towards Shared Prosperity
People & Data driven PolicyMaking
Single window data and connectivity need to berealized with support from private sector.Consolidation, integration of data infrastructureand more forward looking and transparent datapolicies need to be applied across the board.
Role of GovernmentGovernment’s role in people affairs coincide with the roleof managing inequality e.g. in businesses/SMEs,government-linked companies, state-owned enterprisesand sovereign wealth funds shall need to reduce theseinequalities and not impede and compete their growth.Institutional deliveries and integrity are two other keycomponents for a strong and able government.
Fair Trade AgreementsA need to relook into protectionist and interventionist policiesin our many trade agreements (or disagreements) leaningtowards private interest that had elevated global inequality inreplacement with fairer trade and investment policies.
Education, Awareness and Capacity & Capabilities
DevelopmentEACCD needs to be key priority and focus area tomanage next generational gap from growing whichinclude TVET, technology transfer and innovationdevelopment programs.
Managing Tech DisparityTech incentives and development program for smallbusinesses, startup, youth and least develop area asa tool and means to reduce technological anddigital disparity.
Progressive TaxationExample among others - progressive rate structure for thepersonal income tax, with marginal rates of tax increasing byranges of taxable income, up to a top rate of 65%,accompanied by a broadening of the tax base met andintroducing a progressive lifetime capital receipts tax.
06 01
02
0304
05
11

Key Policy Recommendations Towards Shared Prosperity (cont’d)Living Wage and Decent living standard
Moving from a minimum wage approach; livingwage is a targeted standard in equivalent togeographical costs of living align to overalldevelopment plan.
Transforming the Vulnerable
Rationalization of welfare and support policieson vulnerable and marginalized groups toincrease more capacity and capabilitiesdevelopment for a more long term mobilityoutcome.
Regional inclusivityGDP centric growth has made the focus of economies tomajor economies and key economies city centers; aconcentrated and non-distributive developmentcontributing further to higher regional disparity, A moreinclusive regional development plan is needed.
Remolding Business and Industry Ecosystem forward
Managing lagging economies include providingsupport for industries to move into future andtechnology and knowledge based economy. Thisinvolves ecosystem changes and mindset change
Economic Cooperation in Future economy
Economic cooperation towards forward economyincludes technological transfer, R&D funding andaggressive talent development.
Building Future WorkersA mismatch of industrial and talent development havebeen a long standing issue. This hinders the push ofcountries moving their technological frontier and huge lossof skilled talent pool to migration.
07
08
0910
11
12
12

Digital Disparity – the double edge sword of technology• The ongoing Fourth Industrial Revolution comprised of automation,
digitization, cloud computing and the internet of things could bring about much needed benefits to the region in the form of better jobs, more connectivity, improved services like healthcare and education and more business and investment.
• On average, the number of broadband subscription in developing countries is ¼ against no of broadband subscription of developed countries in Asia. The existing lack of broadband connectivity in developing countries at Asia Region means that the utilization and adoption of AI and other technologies based on internet will continue to be uneven.
• Nearly 90% of all internet searches now go through Google. Facebook and Google together account for 58% of all digital ads, which is where most ad money goes these days. They are also the first stops for many Americans seeking news (93% receive news online), and Amazon is now the first stop for a third of all American consumers seeking to buy anything.
• The so call perception that digital era would reduce the barrier entry and provide jumpstart equalizing monopoly; in the end itself trap by a mammoth of monopoly too big to control.
Would digital economy and technology provide better economic inclusivity ?
As Said
The Reality
The Perception
13

Appendices Data and References
14

In recent decades, the distribution of income has been focusing the on top 10% community in nearly all countries, but at different speeds.Half of the income nation owned by Top 10% in India and USA-Canada
0
10
20
30
40
50
60
1980 1990 2000 2010 2011 2012 2013 2014 2015 2016
Top 10% income shares across the world, 1980-2016
China India USA-Canada Russia Europe
Sources: World Inequality Report, 2018 & analysis by Institut MASA 15

The income share of Bottom 50% has slightly increased but static in decade. The share of global income of Bottom 50% was less than 10% or 2 times lower than Top 1%
0
5
10
15
20
25
1980 1990 2000 2010 2011 2012 2013 2014 2015 2016
The Growth of Share Global Income between Top 1% and Bottom 50%
Bottom 50% Share Top 1% Share
16Sources: World Inequality Report, 2018 & analysis by Institut MASA

In last decade, the growth of income for all income class has increased but at different speeds.The momentum of income growth for Middle and Bottom class has increased but at a slower rate of 150% compared to Top income group of more than 200%
0
50
100
150
200
250
Bottom10
Bottom40
Middle60
Top 10 Top 1 Top0.01
Top0.001
Total income growth by percentile across all world regions, 1980-2016
17Sources: World Inequality Report, 2018 & analysis by Institut MASA

Income inequality at different speed in many parts of the worldTop 10% income shares across the world, 1980 - 2016
18Source: World Inequality Report, 2018

World is moving towards a higher inequality frontierTop 10% income shares across the world, 1980 - 2016
19Source: World Inequality Report, 2018

US vs. Europe: Huge rise of inequality in the US but stagnation of bottom 50% average income
20Source: World Inequality Report, 2018

The rise of private capital and the fall of public capital in rich countries, 1970 - 2016
21Source: World Inequality Report, 2018

Despite liberalization of industry and improved trade capabilities via free trade, the growth of household income in China increased more than income group in USA and France
4.6%
0.1%0.8%
6.2%
1.0% 0.9%
7.7%
2.3%
1.1%
8.8%
3.3%
1.6%
0.0%
1.0%
2.0%
3.0%
4.0%
5.0%
6.0%
7.0%
8.0%
9.0%
10.0%
China USA France
Average annual national income growth by income group in China, France and the US, 1980-2015
Bottom 50% Middle 40% Top 10% Top 1%
22Sources: World Inequality Report, 2018 & analysis by Institut MASA

The existing lack of broadband connectivity in developing countries at Asia Region means that the utilization and adoption of AI and other technologies based on internet will continue to be unevenThe number of broadband subscription in developing countries at Asia is ¼ total of number broadband subscription in developed country in Asia
32
29
26
1413
8
3
0
5
10
15
20
25
30
35
Japan China Singapura Vietnam Thailand Malaysia Indonesia
Fixed Broadband Subscription, % of Total Population, 2018
Sources: ITU World Telecommunication/ICT Indicators Database & analysis by Institut MASA 23