Embed Size (px)
Citation preview
Shaping change in insurance
Munich Re equity story
March 2018
Image: Getty Images/fStop

Shaping change in insurance –
Why invest in Munich Re
2Munich Re – March 2018
Strong track record
Successfully dealing with challenging economic
conditions – We remain a strong partner for
clients and reliable for shareholders, delivering
on our promises
Business strategy
Focus on insurance risks safeguarding
sustainable value creation –
Complementary business profiles limiting
correlation to capital market development
Rigorous risk management
Based on a high level of diversification, actively
managing the low-yield environment and strictly
budgeting all our insurance risks
Strong capital position
Continuously built up over years – Continuing
the long-term track record of attractive capital
repatriation while keeping the flexibility to seize
opportunities for profitable growth
Equity story

Munich Re at a glance –
Key financials
3Munich Re – March 2018
Munich Re 2016 2015 2014 2013 2012
Gross written premiums €bn 48.9 50.4 48.8 51.1 52.0Operating result €m 4,025 4,819 4,028 4,398 5,349Taxes on income €m –760 –476 312 –108 –878Consolidated result €m 2,581 3,122 3,171 3,333 3,204Investments €bn 219.4 215.1 218.9 202.2 213.8Return on equity % 8.1 10.0 11.3 12.5 12.5Equity €bn 31.8 31.0 30.3 26.2 27.4Off-balance-sheet reserves1 €bn 17.3 16.0 17.4 8.7 11.0Net technical provisions €bn 202.2 198.5 198.4 187.7 186.1Staff at 31 December 43,428 43,554 43,316 44,665 45,437
Our shares
Earnings per share € 16.0 18.7 18.3 18.5 17.9Dividend per share € 8.60 8.25 7.75 7.25 7.00Amount distributed €m 1,338 1,329 1,293 1,254 1,255Share price at 31 December € 179.65 184.55 165.75 160.15 136.00Market capitalisation at 31 December €bn 28.9 30.8 28.7 28.7 24.4No. of shares at year-end m 161.1 166.8 172.9 179.3 179.3
1 Including amounts attributable to minority interests and policyholders.
Equity story

Business strategy – Realising synergies and economies of
scope by combining primary and reinsurance under one roof
Equity story
Munich Re – March 2018 4
€bn
ERGO
Life and Health Germany
9.2 (19%)
Reinsurance
Property-casualty
17.8 (36%)
ERGO
P-C Germany
3.2 (7%)
ERGO
International
5.0 (10%)
Reinsurance – Well positioned to manage the
current market environment and drive innovation
P-C: Efficiently running the traditional book, steady
expansion of innovative products/solutions – strong
reserving position
Life and Health: Strong position in all major markets –
increasing contribution from initiatives portfolio
ERGO – Strategy Programme well on track,
increasing earnings contribution
Life and Health Germany: Continuously improving risk/
return profile, comprehensive management of back book
P-C Germany: Attractive business mix
International: Strong presence in selected developed
markets, capture opportunities in growth markets
Reinsurance
Life and Health
13.6 (28%)
TOTAL
€48.9bn
1 Gross written premium as at 31.12.2016.
Agile business model – Segmental breakdown

Reinsurance – Well positioned to manage the
current market environment and drive innovative solutions
5Munich Re – March 2018
Mark
ets
Products
New
Esta
blis
hed
Established New
Emerging
markets
Solutions
for emerging
risksNew
products/
risk-related
servicesRisk
Solutions
Incremental
innovations
Tailor-made
solutions
Under-
insurance
in developed
markets
Traditional
reinsurance
ILLUSTRATIVE
Traditional reinsurance
Successfully managing
the soft cycle
Risk Solutions
Continuous growth in
specialty and niche business
Innovation
Steady expansion of
innovative products/solutions
TOTAL1
€4.8bn
TOTAL1,3
~€650m
1 Premiums as at 31.12.2016. 2 Life (traditional and strategic initiatives): €10bn, traditional P-C: €13bn. Both without health business.3 Munich Re (Group); indirect effects on traditional business not included.
TOTAL1,2
€23bn
Equity story

Traditional p-c reinsurance –
Portfolio profitability protected by disciplined underwriting …
6Munich Re – March 20181 Related to premium volume in 2016. 2 Gross premium written as at 31.12.2016. 3 January renewals.
Equity story
Profitable core business
Preferential client access
Leading risk know-how
Superior diversification
Stringent cycle management
~50% private placements1
~2/3 direct client business
~30% tailor-made solutions1
Comprehensive service offering
As regards perils, forms of cover, regions, short/long-tail
Strong u/w discipline and conservatism in reserving
Deliberate portfolio shifts to less commoditised business
Traditional portfolio relatively resilient to pressure on rates – Diversification provides flexibility in managing the portfolio
TOTAL2
€13bn
–0.1
1.0
2.4
0.2
–2.4
–1.6
–0.9–0.5
0.8
2010 2011 2012 2013 2014 2015 2016 2017 2018
Renewals – Nominal price changes %
3

… and rigorous portfolio/cycle management –
Ensures portfolio profitability above cost of capital
7Munich Re – March 20181 Bubble size reflects gross premiums written in 2013 (grey) – 2016 (blue). 2 Economic profit.
2013 2016
Other
Casualty
Property
Property
Continuous reduction
as economic profitability
declined
Casualty
Less pricing pressure –
increased relative
contribution to value
generation
CAGR: ~–6%
CAGR: ~+11%
CAGR: ~–3%
0% Share in value generation2 100%
Low
P
ricin
g p
ressure
Hig
h
Other
ILLUSTRATIVE
Casualty
Property
Premium development
Equity story
Portfolio management based on economic management principles1
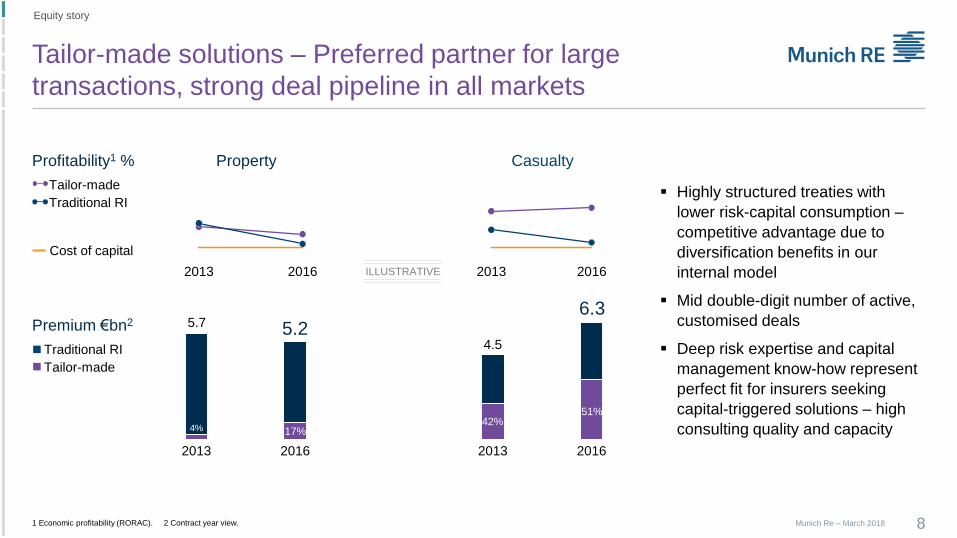
Tailor-made solutions – Preferred partner for large
transactions, strong deal pipeline in all markets
8Munich Re – March 20181 Economic profitability (RORAC). 2 Contract year view.
2013 2016
Cost of capital
Tailor-made
Traditional RI
Profitability1 %
2013 2016 ILLUSTRATIVE
Highly structured treaties with
lower risk-capital consumption –
competitive advantage due to
diversification benefits in our
internal model
Mid double-digit number of active,
customised deals
Deep risk expertise and capital
management know-how represent
perfect fit for insurers seeking
capital-triggered solutions – high
consulting quality and capacity
2013 2016 2013 2016
Traditional RI
Tailor-made
Premium €bn2 5.7 5.24.5
6.3
4% 17%42%
51%
Property Casualty
Equity story

Risk Solutions – Active portfolio management and
investments to secure strong earnings contribution
9Munich Re – March 2018
Equity story
94.1
87.9
83.8
88.6
90.3
95.4
2011 2012 2013 2014 2015 2016
3.43.8 4.0 4.2
5.0
22 23 24 2528 27
2011 2012 2013 2014 2015 2016
Share in % of totalP-C book
0.2
0.5
0.70.5 0.5
0.2
26
42
32
25 23
2011 2012 2013 2014 2015 2016
Share in% of totalP-C book
Gross earned premiums1 Combined ratio1 Underwriting result1% €bn
Drivers in 2016
Gross earned premiumsConsolidation following strong growth in past years –
Exit from financial institutions business at American Modern
Combined ratioHartford Steam Boiler with highest result contribution – Burdening
effect from run-off business, IT investments and outlier losses
TOTAL
€4.8bn
1 Management view, not comparable with IFRS reporting.

Significant focus on innovation … … with significant impact on business already today
Munich Re fosters innovation throughout the global
organisation – Strong focus on tangible business impact
10Munich Re – March 20181 Munich Re (Group); indirect effects on traditional business not included.
Innovation
infrastructureInnovation scouting
Innovation labs
Ideation
Corporate partnering
Innovation
enablerData analytics
Agile IT
Collaboration
Innovation-related
business already sizeable
Risk carrier for established
and new (digital) insurance
and non-insurance companies
Provider of integrated risk
services (e.g. sensor-based)
Tailored risk solutions
and white-label products
Data analytics-based services
Innovation
areas New (re)insurance products
New business models
New clients and demands
New risk-related services
1
2
3
4
Equity story
TOTAL1
~€650m

Strong long-term growth in cyber (re)insurance expected –
Munich Re with leading-edge expertise and market presence
11Munich Re – March 2018
GWP global cyber insurance market1
1 Estimates based on different external sources (Marsh & McLennan, Barbican Insurance, Allianz).
GWP Munich Re cyber portfolio US$ mUS$ bn
Reinsurance: First mover and global market leader
Dynamic growth through joint projects with cedents
Steady growth in the US
Strong accumulation models
Primary insurance: Specialised single-risk taker
Hartford Steam Boiler: Established player in US
for SMEs and individuals
Corporate Insurance Partner: Focus on larger corporate
clients – Cooperation with IT providers and Beazley
New (re)insurance products1
0
5
10
2015 2016 2019 2020
RoWUS
126 135
191
263
2013 2014 2015 2016
Reinsurance
Primary insurance
Equity story

Reinsurance Life – Core business supplemented by
well established initiatives
12Munich Re – March 2018
Equity story
Retu
rnLow
er Overweight
Neutral
Underweight
Unique
Compared to competitors
Mortality
Asset protection
Asia
Longevity
FinMoRe
Morbidity
Hig
her
ILLUSTRATIVE
RiskHigher Lower
IFRS technical result
420
359
279335
€487m
2012 2013 2014 2015 2016
Adjusted Target €400m

ERGO – Well on track to become
a significant earnings contributor
13Munich Re – March 2018
41
273
530~600+
2016 2017 … 2020 2021
€m
Leaner and
more efficient
structures
Transforming
the business
model
Convincing solutions,
committed to
profitable growth
Fit Digital Successful!
Increasing IFRS net profit1ERGO Strategy Programme/International Strategy
1 From 2017, figures include primary insurance business of Munich Health.
Equity story

2005 2008 2011 2014 2017
Strong balance sheet supports sound profitability, …
14Munich Re – March 20181 As at 30.9.2017.
Strong capitalisation according to all metrics
Medium
Low High
€25bnunrealised investment gains1
Rock-solid reserving position
RoE exceeds cost of capital
~10% > ~8%
16
12
8
4
0
Average cost of capital
Value creation
13-year average RoE Average cost of capital
%
Equity story
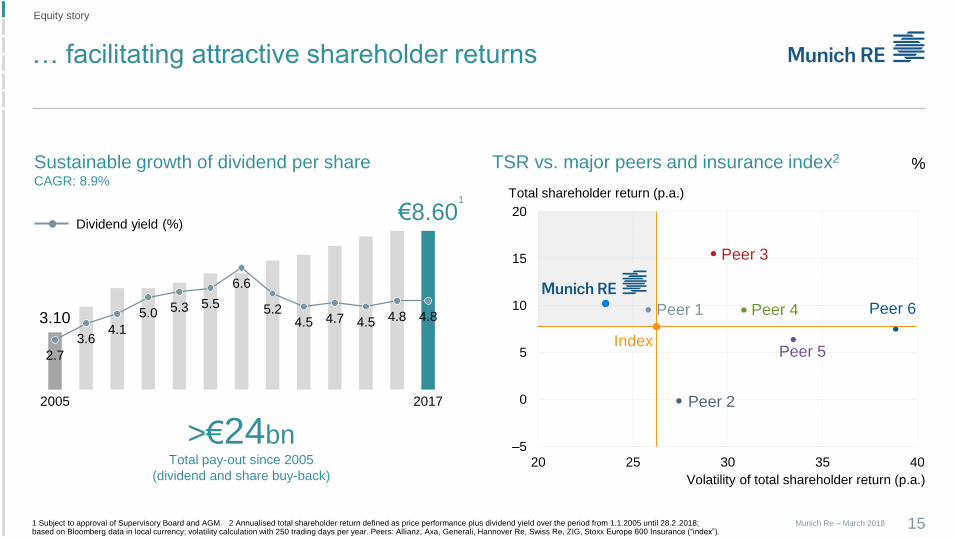
… facilitating attractive shareholder returns
15Munich Re – March 2018
TSR vs. major peers and insurance index2 %
1 Subject to approval of Supervisory Board and AGM. 2 Annualised total shareholder return defined as price performance plus dividend yield over the period from 1.1.2005 until 28.2.2018; based on Bloomberg data in local currency; volatility calculation with 250 trading days per year. Peers: Allianz, Axa, Generali, Hannover Re, Swiss Re, ZIG, Stoxx Europe 600 Insurance (“index”).
Sustainable growth of dividend per shareCAGR: 8.9%
Total pay-out since 2005
(dividend and share buy-back)
>€24bn
3.10
€8.60
2.7
3.64.1
5.0 5.3 5.5
6.6
5.24.5 4.7 4.5 4.8 4.8
2005 2017
Equity story
Dividend yield (%)
1
Peer 5
Peer 3
Peer 2
Peer 4 Peer 6Peer 1
Index
–5
0
5
10
15
20
20 25 30 35 40
Total shareholder return (p.a.)
Volatility of total shareholder return (p.a.)

Munich Re – March 2018 16
Group
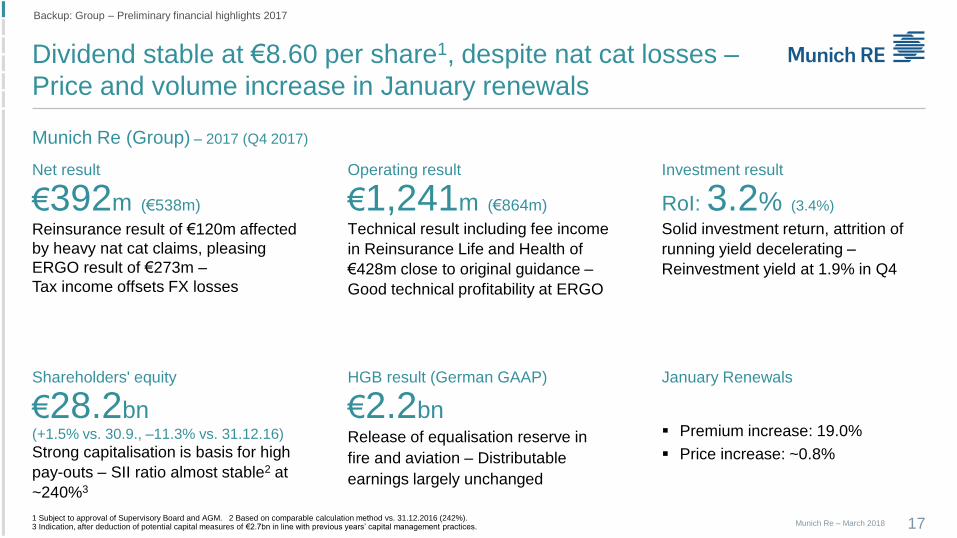
Dividend stable at €8.60 per share1, despite nat cat losses –
Price and volume increase in January renewals
Backup: Group – Preliminary financial highlights 2017
17
Munich Re (Group) – 2017 (Q4 2017)
Investment result
RoI: 3.2% (3.4%)
Solid investment return, attrition of
running yield decelerating –
Reinvestment yield at 1.9% in Q4
Shareholders' equity
€28.2bn(+1.5% vs. 30.9., –11.3% vs. 31.12.16)
Strong capitalisation is basis for high
pay-outs – SII ratio almost stable2 at
~240%3
HGB result (German GAAP)
€2.2bnRelease of equalisation reserve in
fire and aviation – Distributable
earnings largely unchanged
January Renewals
Premium increase: 19.0%
Price increase: ~0.8%
1 Subject to approval of Supervisory Board and AGM. 2 Based on comparable calculation method vs. 31.12.2016 (242%). 3 Indication, after deduction of potential capital measures of €2.7bn in line with previous years’ capital management practices.
Net result
€392m (€538m)
Reinsurance result of €120m affected
by heavy nat cat claims, pleasing
ERGO result of €273m –
Tax income offsets FX losses
Operating result
€1,241m (€864m)
Technical result including fee income
in Reinsurance Life and Health of
€428m close to original guidance –
Good technical profitability at ERGO
Munich Re – March 2018

Short-term earnings pressure
mitigated by strong balance sheet
Part of the valuation reserves realised as a result of usual
portfolio turnover
Ongoing releases of loss reserves without weakening
resilience against future volatility
1 Basic losses, in % of net earned premiums, adjusted for corresponding commission effects.
Investment result
Lower reinvestment yieldsOngoing disposal gains
P-C reinsurance – Release of loss reserves1
Reinsurance cycleStrong reserving position
2.83.7
5.8
4.4
5.9
7.2
5.5
2010 2011 2012 2013 2014 2015 2016
1.6 1.2 0.7 1.8 2.6 2.7 2.6
711
22
15
31
2628
2010 2011 2012 2013 2014 2015 2016
Net disposal gains Unrealised gains
€bn %
Conservative accounting translates into earnings as a result of ordinary business activity
Munich Re – March 2018 18
Backup: Group – Strong balance sheet

Strong capital position according to all metrics facilitates
financial flexibility, including high shareholder distribution
Solvency II IFRS German GAAP/Rating
277302
267%
2014 2015 2016
30.3 31.0 €31.8bn
2014 2015 2016
9.1
9.8€10.1bn
2014 2015 2016
High-quality eligible own funds
Tier 2
8%Tier 1
90%
Tier 3
2%
TOTAL
€40.7bn
SII ratio well above target capitalisation Sound shareholders’ equity
Debt leverage1 among the
lowest in the insurance industry
13.613.4
12.6%
2014 2015 2016
Strengthened equalisation provision largely
protects HGB earnings
Substantial capital buffer2 supports AA rating
AA
A AAA
Ratingagencies
1 Strategic debt (senior, subordinated and other debt) divided by total capital (strategic debt + equity). 2 S&P capital. Munich Re – March 2018 19
Backup: Group – Capital position

IFRS capital position9M 2017
Munich Re – March 2018 20
Backup: Group – IFRS capital position
Equity €m
Subordinated debt
Senior and other debt2
Equity
Capitalisation €bn
1 Strategic debt (senior, subordinated and other debt) divided by total capital (strategic debt + equity). 2 Other debt includes Munich Re bank borrowings and other strategic debt.
Debt leverage1 (%)
Equity 31.12.2016 31,785 Change Q3
Consolidated result –146 –1,436
Changes
Dividend –1,333 0
Unrealised gains/losses –92 –94
Exchange rates –1,570 –501
Share buy-backs –743 –272
Other –131 –65
Equity 30.9.2017 27,770 –2,369
Unrealised gains/losses Exchange rates
FX effect mainly driven by US$Fixed-interest securities
9M: –€120m Q3: –€103m
Non-fixed-interest securities
9M: €36m Q3: €8m
31.0 31.8 32.2 30.1 27.8
4.4 4.2 4.22.8
2.8
0.4 0.4 0.4
0.40.3
13.4 12.6 12.49.5 10.1
2015 2016 31.3.2017 30.6.2017 30.9.2017
10.1%

Significant increase in local result of parent company
safeguards financing of capital repatriation
21Munich Re – March 20181 Changes in restrictions on distribution.
Backup: Group – German GAAP capital position
3.3 –2.3
3.4 –0.3 €4.2bn
Distributable earnings31.12.2015
HGB result2016
Distributable earnings31.12.2016
2.6 –0.3
1.6 –0.5€3.4bn
HGB result2015
Underwritingresult
Investmentresult
Other HGB result2016
Average 2009–2016
–1.9 2.1
Dividend/
buy-back
Other1
Higher major losses, lower reserve releases
Intragroup disposal gains (2016) vs.
write-down on ERGO (2015)
Relief in equalisation provision expected in 2017
Economic earnings 2016 – Munich Re (Group)
Outlook 2017: In the range of IFRS result target
22Munich Re – March 2018
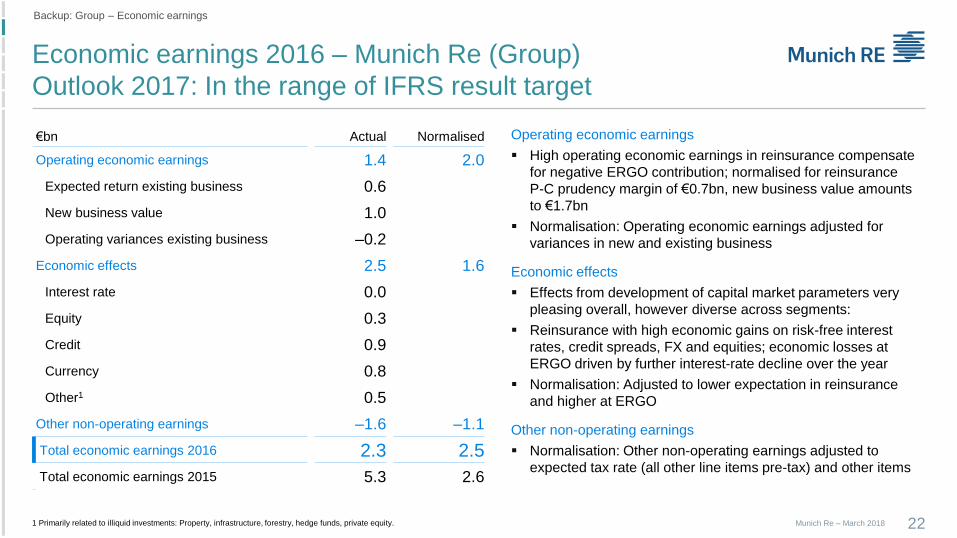
€bn Actual Normalised
Operating economic earnings 1.4 2.0
Expected return existing business 0.6
New business value 1.0
Operating variances existing business –0.2
Economic effects 2.5 1.6
Interest rate 0.0
Equity 0.3
Credit 0.9
Currency 0.8
Other1 0.5
Other non-operating earnings –1.6 –1.1
Total economic earnings 2016 2.3 2.5
Total economic earnings 2015 5.3 2.6
Operating economic earnings
High operating economic earnings in reinsurance compensate
for negative ERGO contribution; normalised for reinsurance
P-C prudency margin of €0.7bn, new business value amounts
to €1.7bn
Normalisation: Operating economic earnings adjusted for
variances in new and existing business
Economic effects
Effects from development of capital market parameters very
pleasing overall, however diverse across segments:
Reinsurance with high economic gains on risk-free interest
rates, credit spreads, FX and equities; economic losses at
ERGO driven by further interest-rate decline over the year
Normalisation: Adjusted to lower expectation in reinsurance
and higher at ERGO
Other non-operating earnings
Normalisation: Other non-operating earnings adjusted to
expected tax rate (all other line items pre-tax) and other items
1 Primarily related to illiquid investments: Property, infrastructure, forestry, hedge funds, private equity.
Backup: Group – Economic earnings

P&L attribution – Pleasing economic earnings overall
Reinsurance compensates for adverse development at ERGO
23Munich Re – March 2018
Backup: Group – Economic earnings
Munich Re (Group) 2016
€bnReinsurance
LifeReinsurance
P-CERGO
L/H GermanyERGO
P-C GermanyERGO
InternationalMunichHealth
Munich Re(Group)
Operating economic earnings 1.1 0.7 –0.4 –0.1 –0.1 0.1 1.4
Expected return existing business 0.1 0.2 0.1 0.0 0.1 0.0 0.6
New business value 1.2 –0.5 0.2 0.0 0.1 0.1 1.0
Operating variances existing business –0.2 1.0 –0.7 –0.1 –0.2 0.0 –0.2
Economic effects 0.8 2.0 –0.1 –0.1 –0.2 0.1 2.5
Other non-operating earnings –0.3 –0.6 –0.5 0.0 –0.2 0.0 –1.6
Total economic earnings 1.7 2.1 –1.0 –0.2 –0.5 0.2 2.3
Capital measures –2.3
Changes in other own funds items 0.0
Change in SII eligible own funds 0.0
24Munich Re – March 2018
Strong SII ratio
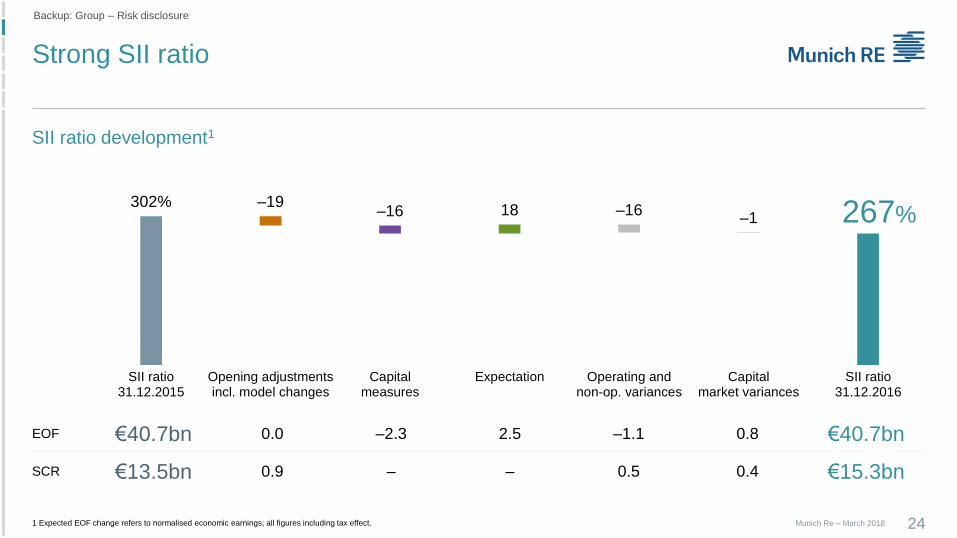
1 Expected EOF change refers to normalised economic earnings; all figures including tax effect.
Backup: Group – Risk disclosure
SII ratio development1
302% –19–16 18 –16
–1
SII ratio31.12.2015
Opening adjustmentsincl. model changes
Capitalmeasures
Expectation Operating andnon-op. variances
Capitalmarket variances
SII ratio31.12.2016
EOF €40.7bn 0.0 –2.3 2.5 –1.1 0.8 €40.7bn
SCR €13.5bn 0.9 – – 0.5 0.4 €15.3bn
267%
Given high levels of uncertainty,
risk profile remains relatively stable
25Munich Re – March 2018
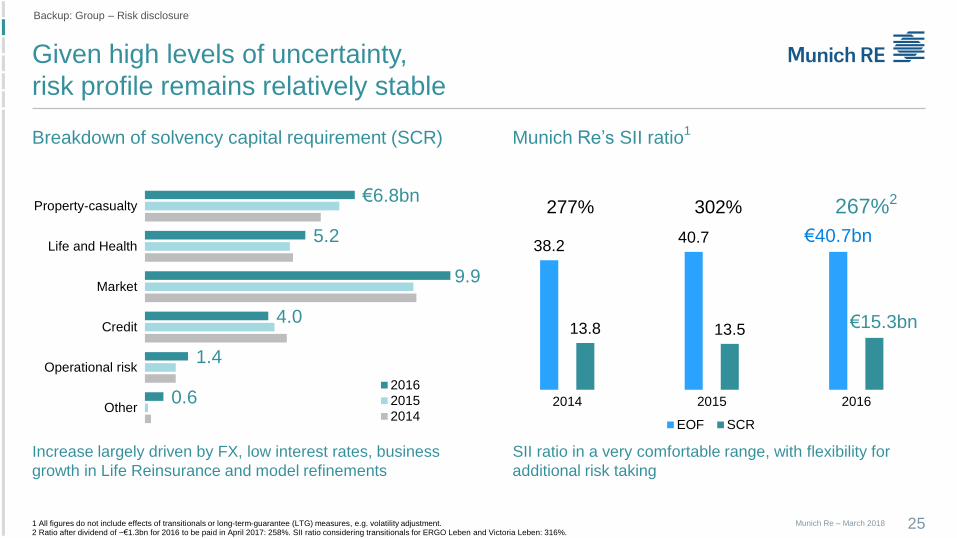
Breakdown of solvency capital requirement (SCR)
302% 267%2
38.240.7 €40.7bn
13.8 13.5 €15.3bn
2014 2015 2016
EOF SCR
Munich Re’s SII ratio1
SII ratio in a very comfortable range, with flexibility for
additional risk taking
Increase largely driven by FX, low interest rates, business
growth in Life Reinsurance and model refinements
Backup: Group – Risk disclosure
277%€6.8bn
5.2
9.9
4.0
1.4
0.6
Property-casualty
Life and Health
Market
Credit
Operational risk
Other
2016
2015
2014
1 All figures do not include effects of transitionals or long-term-guarantee (LTG) measures, e.g. volatility adjustment. 2 Ratio after dividend of ~€1.3bn for 2016 to be paid in April 2017: 258%. SII ratio considering transitionals for ERGO Leben and Victoria Leben: 316%.

Breakdown of solvency capital requirement (SCR)
by risk category and segment
26Munich Re – March 2018
Backup: Group – Risk disclosure
1 Capital requirements for associated insurance undertakings and other financial sectors, e.g. institutions for occupational retirement provisions.
Group
Delta
RI ERGO MH Div.
2016 RemarksRisk category (€bn) 2015 2016 2016 2016 2016
Property-casualty 6.3 6.8 +0.4 6.7 0.4 – –0.3 Appreciation of US$
Life and Health 4.7 5.2 +0.5 4.3 1.2 0.3 –0.6
Market 8.7 9.9 +1.2 5.9 6.5 – –2.5 Low-interest-rate environmentModel reflects negative interest rates
Credit 4.2 4.0 –0.1 2.6 1.6 – –0.2
Operational risk 1.0 1.4 +0.4 0.9 0.8 0.1 –0.4 Reassessment of cyber scenarios
Other1 0.1 0.6 +0.5 0.4 0.2 0.0 0.0 Change in disclosure
Simple sum 25.1 27.9 +2.8 20.8 10.7 0.4 –4.0
Diversification –9.3 –10.0 –0.7 –7.7 –2.4 0.0 Diversification benefit: 36%
Tax –2.3 –2.6 –0.3 –2.2 –1.0 –0.1
Total SCR 13.5 15.3 +1.8 10.9 7.3 0.3 –3.2
Low interest-rate environment largest determinant of SCR changes
Property-casualty risk – High global diversification, both
within nat cat risks and between major and basic losses
27Munich Re – March 2018
Backup: Group – Risk disclosure
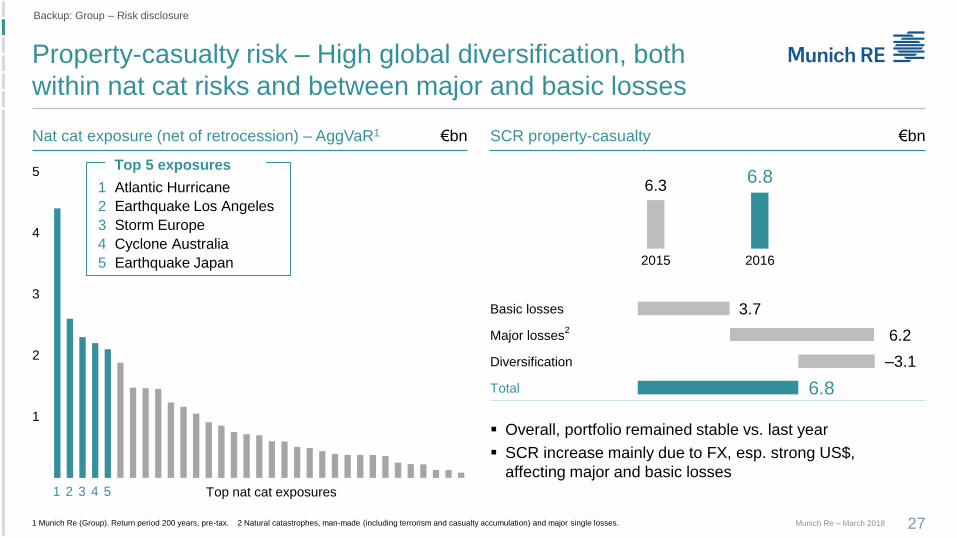
1 Munich Re (Group). Return period 200 years, pre-tax. 2 Natural catastrophes, man-made (including terrorism and casualty accumulation) and major single losses.
Nat cat exposure (net of retrocession) – AggVaR1 €bn SCR property-casualty €bn
1
2
3
4
5
Top nat cat exposures
1 Atlantic Hurricane
2 Earthquake Los Angeles
3 Storm Europe
4 Cyclone Australia
5 Earthquake Japan
Top 5 exposures
1 2 3 4 5
6.36.8
2015 2016
Basic losses
Major losses2
Diversification
Total
3.7
6.2
–3.1
6.8
Overall, portfolio remained stable vs. last year
SCR increase mainly due to FX, esp. strong US$,
affecting major and basic losses

Development of Munich Re’s Solvency II ratio
28Munich Re – March 2018
Backup: Group – Risk disclosure
SII ratio %Munich Re actions
>220%: Above target capitalisation
Capital repatriation
Increased risk-taking
Holding excess capital to meet external constraints
140% – 175%: Below target capitalisation
Tolerate (management decision) or
If necessary, take management action (e.g. risk transfer, scaling-down of activities; raising of hybrid capital)
<140%: Sub-optimal capitalisation
Take risk-management action (e.g. risk transfer, scaling-down of activities; raising of hybrid capital) or
In exceptional cases, tolerate situation (management decision)
175% – 220%: Target capitalisation
Optimum level of capitalisation
220%
175%
140%
100%
2010 2011 2012 2013 20141 2015 2016
267%
1 Transition into SII metric.

267
284
248
246
240
282
251
266
265
247
263
279
Sensitivities of SII ratio
29Munich Re – March 2018
SII ratio – Sensitivity %
Ratio as at 31.12.2016
Interest rate +50bps1
Interest rate –50bps1
Spread +100bps GOV2
Spread +100bps CORP2
Equity markets +30%
Equity markets –30%
FX –20%
Inflation +100bps3
Atlantic Hurricane4
UFR –50bps
Volatility adjustment
220175
1 Parallel shift until last liquid point, extrapolation to unchanged UFR. 2 Due to diversification, spread sensitivity simultaneously stressing GOV and CORP spreads (226%) is lower than the sum of shown separate sensitivities. 3 Based on CPI inflation. 4 Based on 200-year event.
Backup: Group – Risk disclosure

Actual versus expected comparison –
Loss-monitoring yields consistent picture across years
Reinsurance group – Comparison of incremental expected losses with actual reported losses1 €m
Legend: Green Actuals below expectation Solid line Actuals equal expectation
Red Actuals above expectation Dotted line Actuals are 50% above/below expectations
By exposure year By line of business
1 Reinsurance group losses as at Q4 2016, not including parts of Risk Solutions, special liabilities and major losses (i.e. events of over €10m or US$ 15m for Munich Re's share). Munich Re – March 2018 30
Actual losses consistently below actuarial expectations – Very strong reserve position
Backup: Group – Reserving position
2015
2014
20132012
2011
20102009
2008
2007
2006 and prior
10
100
1,000
10,000
10 100 1,000 10,000
Expected reported loss
Actual reported loss
Aviation
CreditEngineering
Fire
Marine
Motor
Personal accident
Risks other Property
Third-party-liability
100
1,000
10,000
100 1,000 10,000
Expected reported loss
Actual reported loss
Actuals for first run-off year
(2015) are 10% below
expectations – consistent
with picture in previous years
Very stable actual versus
expected development
per line of business

Positive run-off result without weakening
resilience against future volatility
Backup: Group – Reserving position
Ultimate losses1 (adjusted to exchange rates as at 31.12.2016) €m
Accident year (AY)
Date ≤2006 2007 2008 2009 2010 2011 2012 2013 2014 2015 2016 Total
31.12.2006 51,505
31.12.2007 51,659 12,711
31.12.2008 51,145 12,928 14,191
31.12.2009 50,478 12,824 14,440 13,936
31.12.2010 49,900 12,742 14,383 13,891 14,335
31.12.2011 49,694 12,704 14,083 13,385 14,522 18,544
31.12.2012 49,193 12,320 13,924 13,243 14,388 18,646 15,168
31.12.2013 49,125 12,064 13,751 13,216 14,475 18,307 14,972 15,076
31.12.2014 48,894 11,978 13,471 12,890 14,512 17,901 14,742 15,325 15,089
31.12.2015 48,588 11,744 13,330 12,663 14,318 17,771 14,519 15,270 15,128 14,361
31.12.2016 48,339 11,771 13,241 12,618 14,081 17,298 14,482 14,953 15,089 14,408 15,336
CY 2016 run-
off change248 –27 89 45 237 473 37 317 39 –48 – 1,412
CY 2016 run-
off change (%) 0.5 –0.2 0.7 0.4 1.7 2.7 0.3 2.1 0.3 –0.3 – 0.8
Prior-year releases of €1.4bn
driven by reinsurance portfolio
Favourable actual vs.
expected comparison
facilitates ultimate
reductions for prior years
Reserve position remains
strong
Reinsurance2 €1,268m
ERGO €144m
Ultimate reduction
1 Basic and major losses; accident year split partly based on approximations. 2 Thereof €1,148m basic and €120m major losses. Munich Re – March 2018 31

Munich Re (Group) – Outstanding bonds
32Munich Re – March 2018
Backup: Group – Outstanding bonds
Senior and subordinated bonds1
Nominal volume Coupon rate p. a. Emission/Issue Maturity First possible redemption date
€900m Until 2022 6.25%, thereafter variable 2012 2042 26 May 2022
£450m Until 2022 6.625%, thereafter variable 2012 2042 26 May 2022
€1,000m Until 2021 6.00%, thereafter variable 2011 2041 26 May 2021
£300m Until 2018 7.625%, thereafter variable 2003 2028 21 June 2018
US$342m 7.45% 1996 2026
Maturity pattern €m Currency pattern %
694
2,411
25
0-5 5-10 10-15 15-20 20-25 25-30 30-35 undated
1 As at 30 September 2017. Bonds with a nominal value below €100m not considered. In addition, Munich Re has placed some natural catastrophe bonds.
USD
11
GBP
27
EUR
62
TOTAL
€3.1bn
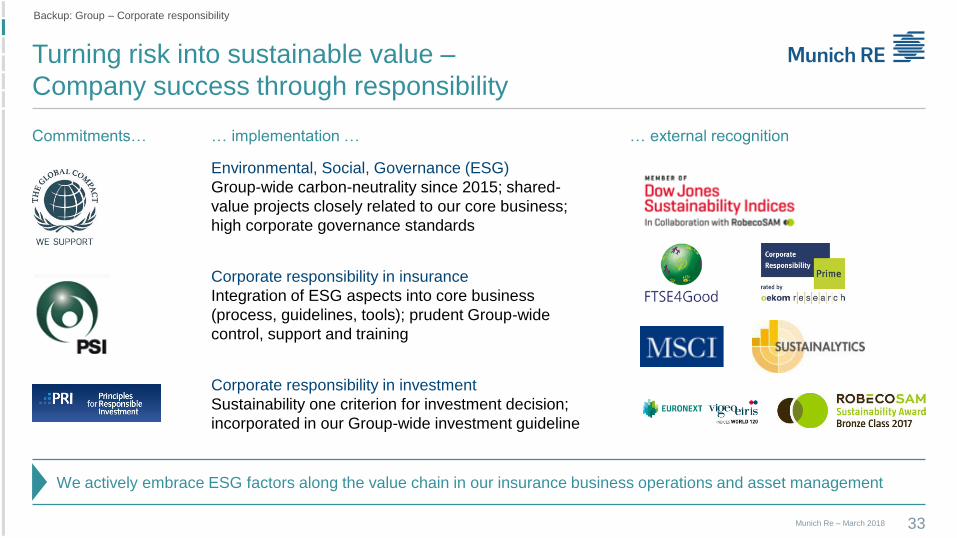
Turning risk into sustainable value –
Company success through responsibility
33
… implementation … … external recognitionCommitments…
Environmental, Social, Governance (ESG)
Group-wide carbon-neutrality since 2015; shared-
value projects closely related to our core business;
high corporate governance standards
Corporate responsibility in insurance
Integration of ESG aspects into core business
(process, guidelines, tools); prudent Group-wide
control, support and training
Corporate responsibility in investment
Sustainability one criterion for investment decision;
incorporated in our Group-wide investment guideline
We actively embrace ESG factors along the value chain in our insurance business operations and asset management
Munich Re – March 2018
Backup: Group – Corporate responsibility

34Munich Re – March 2018
Reinsurance

Munich Re – Leading global reinsurer
35Munich Re – March 2018
Backup: Reinsurance
Rank Company Country Net reinsurance premiums written 2016 (US$ m)
1 Swiss Re Switzerland 33,570
2 Munich Re Germany 31,8393 Hannover Re Germany 15,363
4 Berkshire Hathaway Re USA 13,917
5 SCOR France 13,231
6 Reinsurance Group of America USA 9,249
7 Lloyd’s UK 8,959
8 China Re China 7,514
9 Everest Re Bermuda 5,271
10 MS&AD Holdings Japan 5,181
11 Partner Re Bermuda 4,954
12 General Ins. Corp. of India India 4,675
13 Transatlantic Holdings Inc. USA 3,969
14 Korean Re South Korea 3,891
15 XL Catlin Bermuda 3,527
16 Mapfre Re Spain 2,946
17 Sompo Japan 2,874
18 Tokio Marine Japan 2,685
19 Maiden Re Bermuda 2,655
20 R+V Versicherung Germany 2,302
Total top 40 200,973
Source: Standard & Poor's, September 2017.
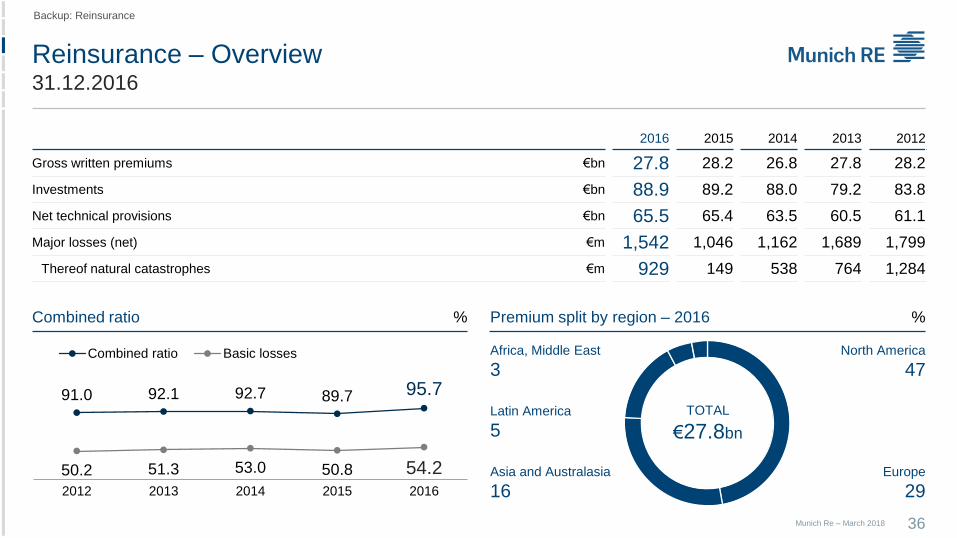
Reinsurance – Overview31.12.2016
36Munich Re – March 2018
Backup: Reinsurance
2016 2015 2014 2013 2012
Gross written premiums €bn 27.8 28.2 26.8 27.8 28.2
Investments €bn 88.9 89.2 88.0 79.2 83.8
Net technical provisions €bn 65.5 65.4 63.5 60.5 61.1
Major losses (net) €m 1,542 1,046 1,162 1,689 1,799
Thereof natural catastrophes €m 929 149 538 764 1,284
Combined ratio % Premium split by region – 2016 %
91.0 92.1 92.7 89.7 95.7
50.2 51.3 53.0 50.8 54.22012 2013 2014 2015 2016
Combined ratio Basic losses Africa, Middle East
3North America
47
Asia and Australasia
16
Latin America
5TOTAL
€27.8bn
Europe
29
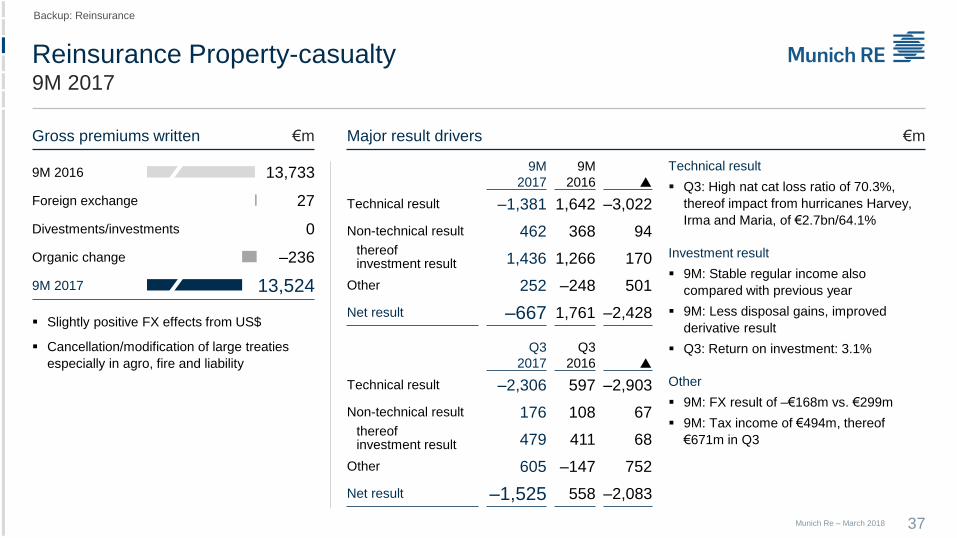
Reinsurance Property-casualty9M 2017
37Munich Re – March 2018
Backup: Reinsurance
Gross premiums written €m Major result drivers €m
9M 2016 13,733
Foreign exchange 27
Divestments/investments 0
Organic change –236
9M 2017 13,524
9M
2017
9M
2016
Technical result –1,381 1,642 –3,022
Non-technical result 462 368 94thereof investment result 1,436 1,266 170
Other 252 –248 501
Net result –667 1,761 –2,428
Q3
2017
Q3
2016
Technical result –2,306 597 –2,903
Non-technical result 176 108 67thereof investment result 479 411 68
Other 605 –147 752
Net result –1,525 558 –2,083
Slightly positive FX effects from US$
Cancellation/modification of large treaties
especially in agro, fire and liability
Technical result
Q3: High nat cat loss ratio of 70.3%,
thereof impact from hurricanes Harvey,
Irma and Maria, of €2.7bn/64.1%
Investment result
9M: Stable regular income also
compared with previous year
9M: Less disposal gains, improved
derivative result
Q3: Return on investment: 3.1%
Other
9M: FX result of –€168m vs. €299m
9M: Tax income of €494m, thereof
€671m in Q3

Backup: Reinsurance
Munich Re – March 2018 38
Combined ratio9M 2017
%Combined ratio
2015 89.7
2016 95.7
9M 2017 117.3
Q3 2017 160.9
Expense ratio Basic losses Major losses
50.8
54.2
54.5
54.1
6.2
9.1
30.3
75.0
32.6
32.4
32.6
31.8
Major losses Nat cat Man-made
Reservereleases1
Normalised combined ratio2
9M 2017 30.3 25.2 5.0 –5.9 100.4
Q3 2017 75.0 70.3 4.7 –6.0 99.9
Ø Annual
expectation ~12.0 ~8.0 ~4.0 ~–4.078.6
88.4
99.8
92.5
101.997.1
93.9
160.9
Q42015
Q12016
Q22016
Q32016
Q42016
Q12017
Q22017
Q32017
1 Basic losses prior years, already adjusted for directly corresponding sliding-scale and profit commission effects. 2 Based on 4%-pts. reserve releases. 9M 2017 adjusted for several larger prior-year commission effects of 0.6%-pts.

Traditional book and Risk Solutions complement
each other and provide diversification
39Munich Re – March 2018
Total P-C book % Traditional Risk Solutions
1 Gross premiums written property-casualty reinsurance as at 31.12.2016 (31.12.2015). 2 Aviation, marine and credit. 3 Part of Special and Financial Risks providing solutions for large corporate clients.
%
Tailor-made
solutions
23 (18)
Other
traditional business
50 (54)
Risk
Solutions
27 (28)
TOTAL1
€18bn
TOTAL
€13bn
Casualty
47 (47)
Specialty2
9 (10)
Other property
34 (33)
Nat cat XL
10 (10)
Watkins
8 (9)
Specialty
markets
13 (13)
American Modern
22 (23)
Corporate
Insurance Partner3
12 (13)
Hartford
Steam Boiler
21 (19)
Other
24 (23)
TOTAL
€5bn
Well balanced portfolio from a regional and line-of-business perspective
Well balanced traditional portfolio
Slight shift from specialty lines to other
property
Dominated by US business – More than 50%
HSB top-line growth driven by new innovative
products
Demand for tailor-made solutions
compensates for the reduction in other
traditional business
Risk Solutions an important pillar for
top-line contribution
%
Backup: Reinsurance

Well balanced portfolio as basis
for sustainable earnings generation
40Munich Re – March 2018
Traditional Portfolio developments
1 Traditional reinsurance, incl. tailor-made solutions. Allocation based on management view, not comparable with IFRS reporting.
%
Casualty motor
28 (27)
Aviation
1 (1)
Property ex
nat cat XL
27 (26)
TOTAL
€13bn
Facultative
9 (9)
XL
17 (19)
Proportional
74 (72)
Increase in proportional business supports earnings resilience
Share increases
Proportional casualty motor and
property – following the realisation
of profitable business opportunities
during the year
Accordingly, ongoing shift towards
proportional business
Share decreases
Deliberate reductions in marine
(offshore energy)
Growth in casualty ex motor below
portfolio average
Continued reduction of more volatile
XL portfolio
TOTAL
€13bn
Marine
3 (4)
Credit
5 (5)
Agro
7 (7)
Casualty ex motor
19 (20)
Property
nat cat XL
10 (10)
Backup: Reinsurance

%
1 Gross premiums written. Economic view – not fully comparable with IFRS figures. 2 Total refers to total p-c book, incl. remaining business.
January renewals – Roughly half of total P-C book
up for renewal, regional focus on Europe
Total property-casualty book1
41
%
Remaining business
29
July renewals
15
January renewals
47
April renewals
9
Regional allocation of January renewals
TOTAL
€8bn
%Nat cat shares of renewable portfolio2
TOTAL
€18bn
10
25
19
13
90
75
81
87
January
April
July
Total
Nat cat Other perils
Worldwide
24
Asia/Pacific/Africa
12North America
27
Europe
33
Latin America
3
Munich Re – March 2018
Backup: Reinsurance – January renewals

Substantial rate increases in loss-affected business –
attractive business opportunities lead to top-line growth
42
January renewals 2018
% 100 –14.3 85.7 5.4 27.9 119.0
€m 8,327 –1,190 7,138 446 2,327 9,909
Change in premium +19.0%
Thereof price movement1 ~ +0.8%Thereof change in exposure for our share +18.2%
Overall portfolio profitability clearly improved
Total renewablefrom 1 January
Cancelled Renewed Increase on renewable
Newbusiness
Estimatedoutcome
Positive price change for the
first time in four years
Nat cat losses in 2017 stop
downward trend –
substantial rate increases in
loss-affected business,
stabilisation elsewhere
Significant top-line growth,
seizing various opportunities
in proportional casualty and
property business, …
… including a few very large
transactions
1 Price movement is risk-adjusted, i.e. includes claims inflation/loss trend and is adjusted for portfolio mix effects. Furthermore, price movement is calculated on a wing-to-wing basis (including cancelled and new business).
Munich Re – March 2018
Backup: Reinsurance – January renewals

Munich Re utilising all ART channels as instrument for risk
management and expanded product range
43Munich Re – March 2018
Munich Re channels to tap alternative capacity sources
1 Munich Re structured and arranged transactions. 2 Including indemnity retrocession, ILW/derivatives, risk swaps, cat bonds and the sidecars including Eden Re. Selection of main scenarios.
Broadened distribution channels to ART markets to increase flexibility of Munich Re balance sheet –
relationship-based approach allows for scaling-up
Additional cat bond of
US$ 190m issued
(Queen Street XII)
Broadened investor base
for fully collateralised
cover of Munich Re peak-
zone risk
Eden Re II renewed with
2017 series at previous
year’s level (US$ 360m)
Broader investor base
and cession with four
lines of business
Queen Street programmeSidecar programme1 Retrocession – Protection per nat cat scenario2 €m
Retrocession use reflects favourable market terms and strong Munich Re capital base
0
500
1,000
1,500
2014 2015 2016 2017
Australia Cyclone US Windstorm NE US Windstorm SE
Combining Munich Re’s unique value proposition in managing peak risk with client access to institutional investor capacity
Taking advantage of new sources of capital for clients and Munich Re’s own book
Munich Re ILS service for third parties completes offer as customised stand-alone service or integrated into traditional solutions
Enhanced risk management and client offerings on basis of ART channels
Backup: Reinsurance

Munich Re's maximum in-force nat cat protection
44Munich Re – March 2018
Munich Re's maximum in-force nat cat protection as at January 2017 €m
As at January 2017. Protection before reinstatement premiums.EU other perils including Earthquake Turkey.
500
1,000
1,500
US windstormnortheast
US windstormsoutheast
US earthquake EU windstorm EU other perils Japan earthquake Australia cyclone
Cat bonds
Risk swaps
Sidecars
Indemnity retro
0
Benefiting from favourable market environment Broadening of relationship to end-investors
Backup: Reinsurance

Outstanding insurance-linked securities (ILS) –Munich Re's Capital Partners unit is a recognised player in the ILS market
45Munich Re – March 2018
Transaction Closing Maturity Volume Perils covered
For
clientsPandemic Emergency
Financing Facility
7/2017 7/2020 US$ 225m
US$ 95m
Class A – Pandemic influenza, Coronavirus
Class B – Filovirus, Coronavirus, Lassa Fever, Rift
Valley Fever, and Crimean Congo Hemorrhagic Fever
Lion Re II DAC 6/2017 7/2021 €200m Europe Windstorm, Italy Earthquake, Europe Flood
Vitality Re VIII Re Ltd. 1/2017 1/2021 US$ 200m US health risks
Vitality Re VII Re Ltd. 1/2016 1/2020 US$ 200m US health risks
Bosphorus 2 Re Ltd. 8/2015 8/2018 US$ 100m Earthquake Turkey
Azzurro Re I DAC 6/2015 1/2019 €200m Italy Earthquake
Fonden 8/2017 8/2020 US$ 150m Class A – Mexico Earthquake
8/2017 12/2019 US$ 100m Class B – Atlantic Hurricane
8/2017 12/2019 US$ 110m Class C – Pacific Earthquake
For
Munich
Re’s
book1
Eden Re II Ltd. (Series 2018-1) 12/2017 3/2022 US$ 300m Various perils
Eden Re II Ltd. (Series 2017-1) 12/2016 3/2021 US$ 360m Various perils
Queen Street XII Re DAC 5/2016 4/2020 US$ 190m Hurricane US & Windstorm Europe
Queen Street XI Re DAC 12/2015 6/2019 US$ 100m Hurricane US & Cyclone Australia
Queen Street X Re DAC 3/2015 6/2018 US$ 100m Hurricane US & Cyclone Australia
Generation of fee
income
Active investor in
the primary and
secondary market
Improvement of
own risk/return
profile and cost
efficiency
Utilisation of
unexhausted risk
budgets
Offering one-stop
shopping to clients
as sponsors
1 Excluding private transactions.
Backup: Reinsurance
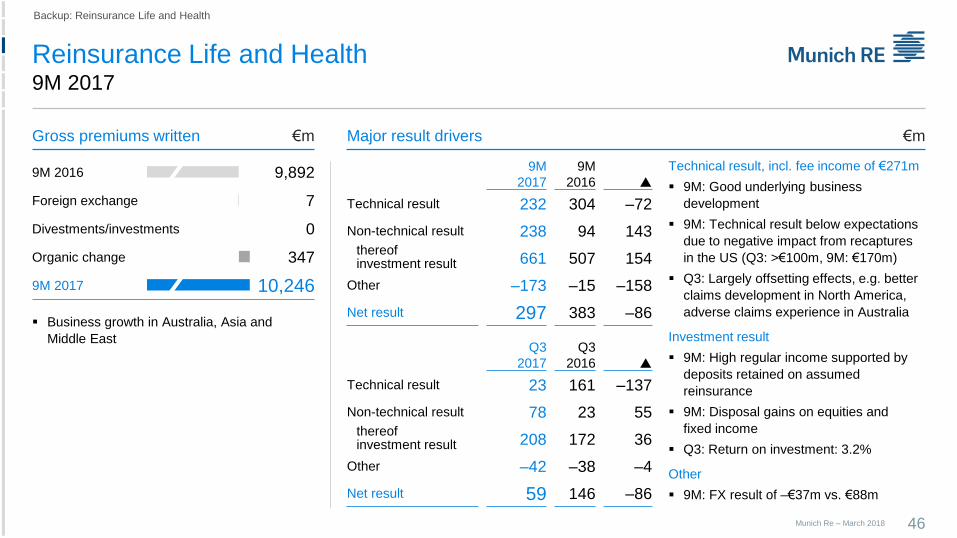
Reinsurance Life and Health9M 2017
46Munich Re – March 2018
Backup: Reinsurance Life and Health
Gross premiums written Major result drivers €m
9M 2016 9,892
Foreign exchange 7
Divestments/investments 0
Organic change 347
9M 2017 10,246
9M
2017
9M
2016
Technical result 232 304 –72
Non-technical result 238 94 143thereof investment result 661 507 154
Other –173 –15 –158
Net result 297 383 –86
Q3
2017
Q3
2016
Technical result 23 161 –137
Non-technical result 78 23 55thereof investment result 208 172 36
Other –42 –38 –4
Net result 59 146 –86
Business growth in Australia, Asia and
Middle East
Technical result, incl. fee income of €271m
9M: Good underlying business
development
9M: Technical result below expectations
due to negative impact from recaptures
in the US (Q3: >€100m, 9M: €170m)
Q3: Largely offsetting effects, e.g. better
claims development in North America,
adverse claims experience in Australia
Investment result
9M: High regular income supported by
deposits retained on assumed
reinsurance
9M: Disposal gains on equities and
fixed income
Q3: Return on investment: 3.2%
Other
9M: FX result of –€37m vs. €88m
€m

Well diversified global portfolio
47Munich Re – March 2018
North American overweight reflective of size of reinsurance markets – Biometric risk exposure dominated by mortality
90%
10%
Latin America
30%70%
Australia
90%
10% South Africa
40%
60%
Asia
30%
10%
60%
United Kingdom
65%35%
Canada
85%
15%
USA
25%
65%
10%
Continental Europe
Size of bubbles indicative of present value of future claims.
Mortality 65 %
Morbidity 25 %
Longevity 10 %
NA 60 %
Europe 20 %
Asia 10 %
Australia 5 %
Africa / LA 5 %
Backup: Reinsurance Life

Financially Motivated Reinsurance –
Well established value proposition, strong demand prevails
48Munich Re – March 2018
Backup: Reinsurance Life – Initiative portfolio
€mGross premiums written Technical result and fee income NBV1
Demand will remain high
Transaction types will vary by geographical region
Number, size and type of transactions are difficult to predict and will
vary on an annual basis
Expectations going forward
Geographically well diversified portfolio
Lower result from scheduled termination of some large treaties
2016 new business again exceptional; approx. 25 new transactions,
including large portfolio transaction in Australia
New business value dominated by APAC and Europe,
including 8 SII-related treaties
Portfolio development
1 2012–14 MCEV, from 2015 Solvency II.
4,5364,109
3,356 3,313
2,232
41 3833 31
22
2012 2013 2014 2015 2016
% of total
43
70 65 66
36
49
49 62 70
41
92
119 127136
77
19 2837 34 15
2012 2013 2014 2015 2016
Technical result Fee income
% of total
82
129
73
214
257
14
2216
23 22
2012 2013 2014 2015 2016
% of total
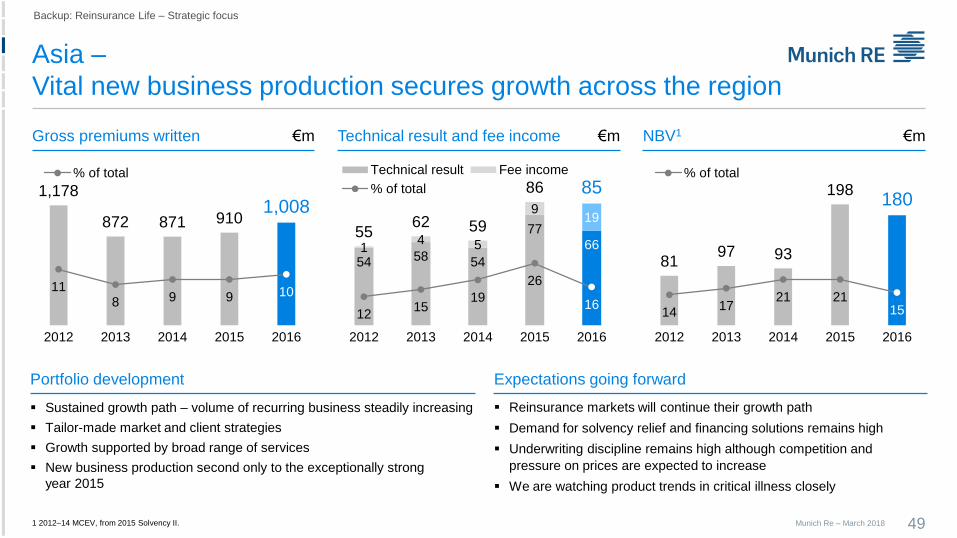
Asia –
Vital new business production secures growth across the region
49Munich Re – March 2018
€mGross premiums written Technical result and fee income NBV1
Reinsurance markets will continue their growth path
Demand for solvency relief and financing solutions remains high
Underwriting discipline remains high although competition and
pressure on prices are expected to increase
We are watching product trends in critical illness closely
Expectations going forward
Sustained growth path – volume of recurring business steadily increasing
Tailor-made market and client strategies
Growth supported by broad range of services
New business production second only to the exceptionally strong
year 2015
Portfolio development
1 2012–14 MCEV, from 2015 Solvency II.
Backup: Reinsurance Life – Strategic focus
1,178
872 871 9101,008
118 9 9 10
2012 2013 2014 2015 2016
% of total
54 58 54
77
6614 5
919
5562 59
86 85
1215
19
26
16
2012 2013 2014 2015 2016
Technical result Fee income
% of total
8197 93
198180
1417
21 2115
2012 2013 2014 2015 2016
% of total
€m€m
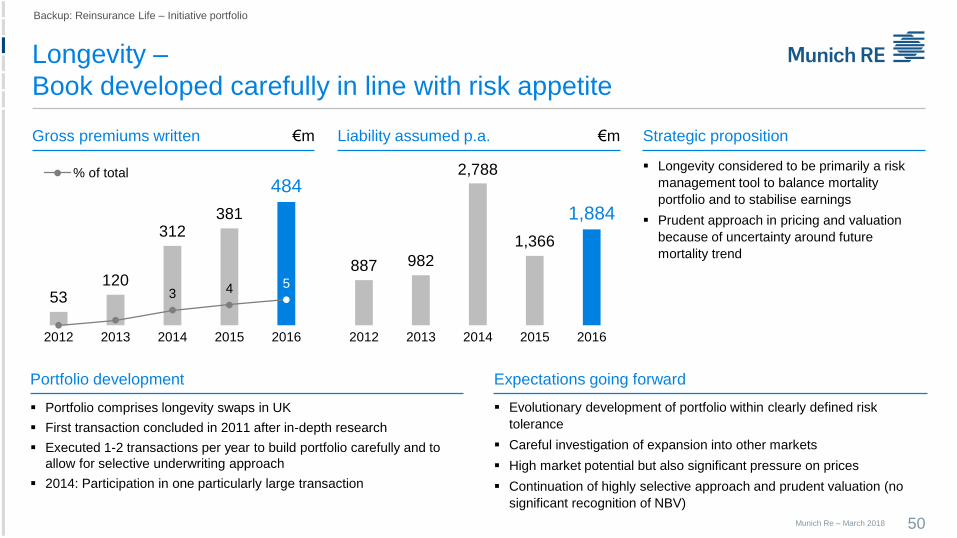
Longevity –
Book developed carefully in line with risk appetite
50Munich Re – March 2018
Gross premiums written Liability assumed p.a. Strategic proposition
Evolutionary development of portfolio within clearly defined risk
tolerance
Careful investigation of expansion into other markets
High market potential but also significant pressure on prices
Continuation of highly selective approach and prudent valuation (no
significant recognition of NBV)
Expectations going forward
Portfolio comprises longevity swaps in UK
First transaction concluded in 2011 after in-depth research
Executed 1-2 transactions per year to build portfolio carefully and to
allow for selective underwriting approach
2014: Participation in one particularly large transaction
Portfolio development
Longevity considered to be primarily a risk
management tool to balance mortality
portfolio and to stabilise earnings
Prudent approach in pricing and valuation
because of uncertainty around future
mortality trend
Backup: Reinsurance Life – Initiative portfolio
€m€m
53120
312381
484
3 4 5
2012 2013 2014 2015 2016
% of total
887 982
2,788
1,366
1,884
2012 2013 2014 2015 2016

Asset protection –
Comprehensive solutions to non-biometric financial risks
51Munich Re – March 2018
€mIFRS contribution margin1 Product portfolio Strategic proposition
Existing book dominated by Asia/Japan
Current opportunities mainly in Europe and Asia/Japan
Active exploration of business potential in North America
Expectations going forward
Portfolio continues to gain significance
Growing contribution to NBV
Portfolio development
Wide range of tailor-made solutions
Legal, regulatory and structuring expertise
State-of-the-art in-house hedging platform
Solutions to Basel III and Solvency II needs
Resolution of accounting asymmetry
ALM solutions for smaller players, i.e.
reinsurance solutions for business with
significant market risk
Development of modern savings products
1 Part of non-technical-result, incl. insurance-related investment result.
Backup: Reinsurance Life – Initiative portfolio
30 30
37
26
44
2012 2013 2014 2015 2016

New business profitability31.12.2016
52Munich Re – March 2018
Backup: Reinsurance Life
yearsRORAC spread1 IRR spread1 Payback period2
1 Spread in addition to reference rate (weighted-average swap yield curves), after tax. 2 Number of years it takes to amortise the total investment in new business through future (undiscounted) earnings distributable to shareholders.
%%
0
5
10
15
20
2012 2013 2014 2015 2016
0%
5%
10%
15%
20%
2012 2013 2014 2015 2016
0%
5%
10%
15%
20%
2012 2013 2014 2015 2016
Lower share of business with shorter durations
(as typically the case for FinMoRe) slightly
increased payback period compared with 2015
Very good new business profitability relative to
economic risk capital (RORAC spread)
New business profitability relative to total
investment in new business (IRR spread)
influenced composition of new business portfolio

Munich Re – March 2018 53
ERGO

ERGO – Overview31.12.2016
54Munich Re – March 2018
Backup: ERGO
2016 2015 2014 2013 2012
Gross written premiums €bn 16.0 16.5 16.7 16.7 17.1
Investments €bn 135.4 131.0 135.5 126.7 124.9
Net technical provisions €bn 133.6 130.3 132.4 125.1 122.8
Combined ratio p-c Germany % 97.0 97.9 95.3 96.7 98.0
Combined ratio p-c International % 98.0 104.7 97.3 98.7 99.8
Premium split by region – 2016 % Distribution channels Germany – New business 2016 %
Banks/other
5Tied agents
55
Broker
22
Direct
18
Rest of World
14Germany
74
UK
3
Belgium
2
Poland
7
TOTAL
€16.0bn

ERGO Strategy Programme (ESP) – Financial impact
55Munich Re – March 2018
Backup: ERGO
59
182
316
443
536
3096
167227
279
2016 2017 2018 2019 2020
Gross Net2
Annual cost savings €m
1 After policyholder participation and taxes, including impact of investments, savings, premium growth and other cost effects on net income. 2 After policyholder participation and taxes.
–244
–110
–4
106203
2016 2017 2018 2019 2020
Net profit impact of ESP overall1 €m
–302–259
–199–148
–99
2016 2017 2018 2019 2020
Net profit impact of investments2 €m
P-C Germany – Combined ratio %
9899
96
9392
97
2016 2017 2018 2019 2020
ESP GuidanceActual

ERGO Life and Health Germany9M 2017
56Munich Re – March 2018
Backup: ERGO
9M 2016 6,823
Foreign exchange –9
Divestments/investments 0
Organic change 51
9M 2017 6,865
Gross premiums written €m Major result drivers €m
Life: –€80m
Decline in regular premium driven by
ordinary attrition, while single premium
decreased mainly due to lower product sales
Health: +€115m
Positive development in comprehensive and
supplementary insurance; travel increased
by €17m
Technical result
9M: Enhanced profitability in life, health and
direct business
9M: Improvements in life driven by one-offs
in 2016
Investment result
9M: Significantly lower derivatives result
(mainly interest-rate hedging)
Q3: Low disposal gains (financing of ZZR
mainly in Q1 2017)
Q3: Return on investment: 2.6%
Other
9M: Restructuring expenses in 2016
Q3: Impacted by strategic investments
9M
2017
9M
2016
Technical result 316 207 109
Non-technical result 146 331 –185thereof investment result 3,130 3,698 –568
Other –353 –519 166
Net result 109 19 90
Q3
2017
Q3
2016
Technical result 106 5 101
Non-technical result 28 10 18thereof investment result 774 895 –121
Other –137 –64 –73
Net result –3 –49 46
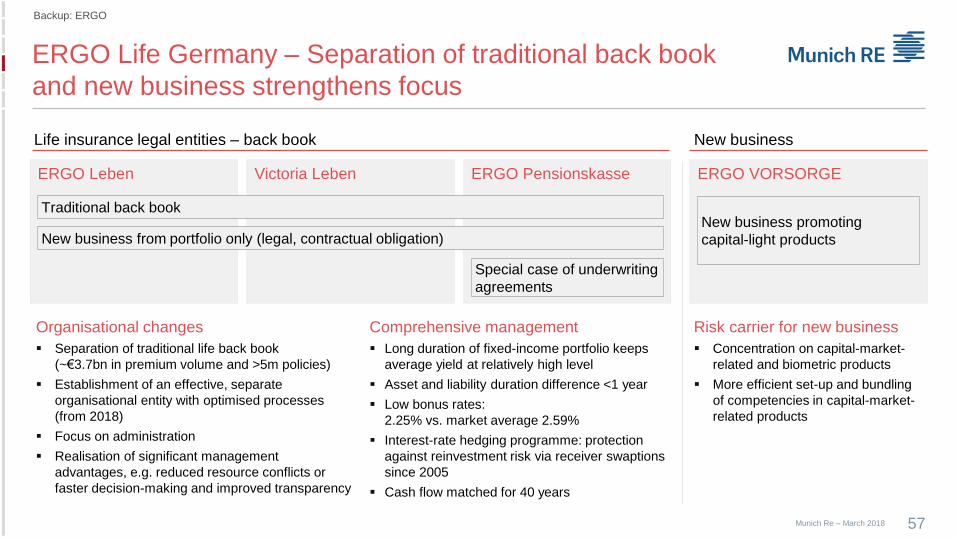
ERGO Life Germany – Separation of traditional back book
and new business strengthens focus
57Munich Re – March 2018
ERGO VORSORGE
Life insurance legal entities – back book
ERGO Leben Victoria Leben ERGO Pensionskasse
Traditional back book
New business from portfolio only (legal, contractual obligation)New business promoting
capital-light products
Organisational changes
Separation of traditional life back book
(~€3.7bn in premium volume and >5m policies)
Establishment of an effective, separate
organisational entity with optimised processes
(from 2018)
Focus on administration
Realisation of significant management
advantages, e.g. reduced resource conflicts or
faster decision-making and improved transparency
New business
Special case of underwriting
agreements
Risk carrier for new business
Concentration on capital-market-
related and biometric products
More efficient set-up and bundling
of competencies in capital-market-
related products
Comprehensive management
Long duration of fixed-income portfolio keeps
average yield at relatively high level
Asset and liability duration difference <1 year
Low bonus rates:
2.25% vs. market average 2.59%
Interest-rate hedging programme: protection
against reinvestment risk via receiver swaptions
since 2005
Cash flow matched for 40 years
Backup: ERGO

3.92
2.54
0.00
0.25
0.50
0.75
1.00
1.25
1.50
1.75
2.00
2.25
2.50
2.75
3.00
3.25
3.50
3.75
4.00
2011 2013 2015 2017 2019 2021
Reference rate
Increase
Stable
Decrease
1.00
3.00
4.00
2.00
Guarantee level
ERGO Life Germany –
Key figures and ZZR
1 German GAAP figures for ERGO Leben, Victoria Leben and ERGO Direkt Leben. 2 Based on interest-rate scenarios. 3 German GAAP figures.
Key figures1
0%
2%
4%
2016 2020
Average yield vs. average guarantee
Reinvestment
yield
Average
yield
Average
guarantee
2016 ~1.3 ~3.4 ~2.4
2015 ~1.8 ~3.4 ~2.7
2014 ~2.6 ~3.6 ~3.0
%
ILLUSTRATIVE
ZZR reference rate – Projection2 %
Key financials3 – €bn Free RfB Terminal bonus fund Unrealised gains Accumulate ZZR
2016 1.2 1.1 13.7 3.6
2015 0.9 1.6 12.2 2.5
2014 1.0 1.7 14.6 1.5
ZZR – Low interest-rate reserve
Local GAAP reserve against
low interest rates
Expected accumulated ZZR
in 2017: ~€5bn
Partly financed through
unrealised gains – positive
impact on IFRS earnings when
realised
Effect on IFRS net income
in 2016: +€22m
avg. yield
avg. guarantee
Munich Re – March 2018 58
ILLUSTRATIVE
Backup: ERGO

4.9
3.6
2.6 2.52.2
Peer 1 ERGO Peer 2 Peer 3 Peer 4
ERGO Health Germany – Stabilise comprehensive insurance,
strengthen supplementary insurance
59Munich Re – March 2018
1.6
0.8 0.6 0.60.5
ERGO Peer 1 Peer 2 Peer 3 Peer 4
MARKET
VOLUME
€7bn
ERGO
21.0%
Comprehensive insurance
ERGO number 2 in German market –
stable results and stable political
environment
Market view on comprehensive insurance1
1 Gross premiums written as at 31.12.2015. Source: PKV Verband.
Market view on supplementary insurance1
ERGO business mix – Gross premiums written
MARKET
VOLUME
€29bn
ERGO
12.4%
€bn
€bn
2530
75
70
2006 2016
%
€5.2bn
€4.4bn
Supplementary insurance
ERGO clear market leader –
expansion in long-term care and
direct insurance
Backup: ERGO
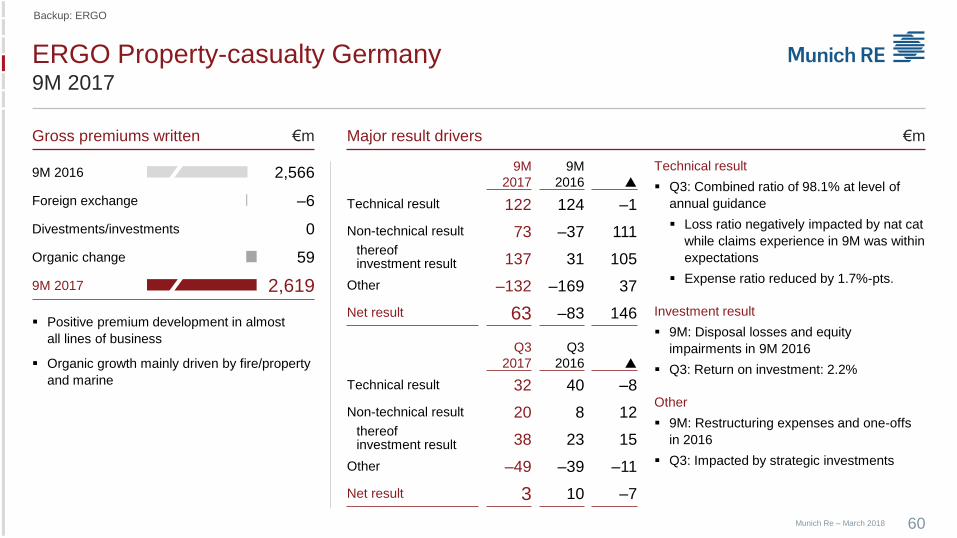
ERGO Property-casualty Germany9M 2017
60Munich Re – March 2018
Backup: ERGO
9M 2016 2,566
Foreign exchange –6
Divestments/investments 0
Organic change 59
9M 2017 2,619
Gross premiums written €m Major result drivers €m
Positive premium development in almost
all lines of business
Organic growth mainly driven by fire/property
and marine
9M
2017
9M
2016
Technical result 122 124 –1
Non-technical result 73 –37 111thereof investment result 137 31 105
Other –132 –169 37
Net result 63 –83 146
Q3
2017
Q3
2016
Technical result 32 40 –8
Non-technical result 20 8 12thereof investment result 38 23 15
Other –49 –39 –11
Net result 3 10 –7
Technical result
Q3: Combined ratio of 98.1% at level of
annual guidance
Loss ratio negatively impacted by nat cat
while claims experience in 9M was within
expectations
Expense ratio reduced by 1.7%-pts.
Investment result
9M: Disposal losses and equity
impairments in 9M 2016
Q3: Return on investment: 2.2%
Other
9M: Restructuring expenses and one-offs
in 2016
Q3: Impacted by strategic investments

ERGO Property-casualty Germany9M 2017
Munich Re – March 2018 61
Backup: ERGO
2015 97.9
2016 97.0
9M 2017 96.6
Q3 2017 98.1
€mCombined ratio % Gross premiums written
TOTAL
€2,619m
Expense ratio Loss ratio
Personal accident
473
Liability
465
Other
304Motor
586
Fire/property
477
Legal protection
313
64.7
61.9
63.3
66.5
33.2
35.1
33.2
31.6
103.9
98.6
93.3
96.1
100.0 99.1
92.7
98.1
Q42015
Q12016
Q22016
Q32016
Q42016
Q12017
Q22017
Q32017

ERGO International9M 2017
62Munich Re – March 2018
Backup: ERGO
Gross premiums written €m Major result drivers €m
9M 2016 3,768
Foreign exchange –5
Divestments/investments –84
Organic change 71
9M 2017 3,750
9M
2017
9M
2016
Technical result 121 14 107
Non-technical result 48 156 –108thereof investment result 264 438 –174
Other –117 –155 39
Net result 52 15 37
Q3
2017
Q3
2016
Technical result 97 13 84
Non-technical result 14 49 –35thereof investment result 89 118 –29
Other –81 –42 –40
Net result 30 20 10
Life: –€271m
Italy: Sale of entity in Q2 2016
Less new business in Poland and Austria
P-C: +€215m
Increase mainly driven by motor business
in Poland and Baltics, as well as ATE
acquisition
Health: +€38m
Growth driven by Belgium and Spain
Technical result
Q3: Good combined ratio of 91.5%,
pleasing technical improvements overall in
claims as well as costs (e.g. Poland with
higher motor profitability) – annual
guidance improved from ~98% to ~97%
Investment result
9M: Lower result from derivatives and
regular income (lower asset base due to
disposal of Italian entity in 2016)
Q3: Lower impact from disposals and
derivatives compared with 2016
Q3: Return on investment: 2.1%
Other
9M: Several one-offs and restructuring
expenses in 2016
Q3: Negative tax effects

ERGO International – Property-casualty, including Health9M 2017
Munich Re – March 2018 63
Backup: ERGO
2015 104.7
2016 98.0
9M 2017 95.5
Q3 2017 91.5
115.3
94.3
101.5
95.8
100.2
96.3
98.7
91.5
Q42015
Q12016
Q22016
Q32016
Q42016
Q12017
Q22017
Q32017
€mCombined ratio1 % Gross premiums written
TOTAL
€3,123m
%Combined ratio 9M 20171
Expense ratio Loss ratio
Legal protection
504Greece
185
Other
788Poland
920
Turkey
141Spain
585
94.4 92.7 98.082.7
113.395.5
Poland Spain Legalprotection
Greece Turkey Total
1 Only short-term health business.
65.3
64.9
64.5
60.7
39.4
33.1
31.0
30.8

International strategy embedded in ERGO Strategy
Programme (ESP) to achieve ambitious goals
64Munich Re – March 2018
Establishing leaner and more effective
structures to ensure swift execution
Laying the foundations for
transforming the business model
Committing to profitable growth
Best practice exchange Interregional transfer of capabilities,
e.g. implementation of adapted
“iMonitor” from Poland in Turkey
Regional cooperation Integration of back offices, e.g. in
Baltics and Poland
Accelerated innovation Digital delivery, e.g. via omni-channel
communication to customers in India
Fit Digital Successful!
Foster strong market positions
Establish efficient global business
models
Exploit growth market exposure
Portfolio
Central steering with dedicated
responsibilities
Governance
Commercial business Strengthen commercial business
internationally
Pure digital player Roll-out of nexible in attractive markets
Identify value drivers in an
interlocked business model between
ERGO entities and Munich Re
Interlocked business model reinsurance/primary insurance
Munich Health primary insurance business to be managed by ERGO in 2017
Backup: ERGO

ERGO International portfolio focuses on three pillars
65Munich Re – March 20181 ATE acquisition effective 1 June 2016; hence, only half year of ATE premium included. 2 Respective German and international business; D.A.S. including Italian JV. 3 ERGO share.
4 Step-up during 2016; premiums based on average share during the year. 5 In focus segment 6 Thereof German LPI business: €401m. 7 Thereof German travel business: €182m.
Strong presence in
selected developed markets
GWP, 2016 €m
Market position5
Focus segment
1,17814%
2Non-lifePoland
Leverage existing scale to
strengthen organic growth
Country
Legal protection
Market
presence in
18 countries
Travel
Market
presence in
24 countries
Pure Digital Player
Mobility Solutions
ShareRank
627 LifeAustria9%
4
206 Non-lifeBaltics5%
3
194 Non-lifeGreece1
8%
1
Specialised global
business expertise
GWP, 2016 €m
1,1466
Efficient management and
expansion of global businesses
Existing global businesses2
4527
Promising exposure in
prioritised growth markets
GWP3, 2016 €m Segment
China 25 Life
Capture opportunities
in growth markets
JVs
India4 270 Non-life
Vietnam 11 Non-life
Thailand 21 Non-life
Launch new global businesses
Expected CAGR, 2016–20, %
70
21
16
8
Turkey 249 Non-life
Subsidiaries
10
Backup: ERGO

Munich Re – March 2018 66
Investments

Investment result9M 2017
Munich Re – March 2018
Backup: Investments
67
3-month reinvestment yield
Q3 2017 2.0%
Q2 2017 1.8%
Q1 2017 2.0%
Q3 2017Write-ups/
write-downsDisposal
gains/losses Derivatives
Fixed income3 –2 115 116
Equities –37 142 –95
Commodities/inflation 10 6
Other –55 2 10
9M 2017Write-ups/
write-downsDisposal
gains/losses Derivatives
Fixed income3 –4 1,028 –16
Equities –72 702 –373
Commodities/inflation 39 –19
Other –122 10 –3
Investment result (€m) Q2 2017 Return1 Q3 2017 Return1 9M 2017 Return1 9M 2016 Return1
Regular income 1,720 3.0% 1,527 2.7% 4,881 2.8% 5,001 2.8%
Write-ups/write-downs –49 –0.1% –84 –0.1% –160 –0.1% –284 –0.2%
Disposal gains/losses 432 0.7% 259 0.5% 1,739 1.0% 1,823 1.0%
Derivatives2 –87 –0.1% 37 0.1% –412 –0.2% –196 –0.1%
Other income/expenses –127 –0.2% –151 –0.3% –421 –0.2% –402 –0.2%
Investment result 1,889 3.2% 1,589 2.8% 5,629 3.2% 5,942 3.4%
Total return 0.8% 2.5% 1.0% 9.3%
1 Annualised return on quarterly weighted investments (market values) in %. Impact from dividends on regular income 0.2%-pts in Q3 and 0.5%-pts in Q2.2 Result from derivatives without regular income and other income/expenses. 3 Thereof interest-rate hedging ERGO: Q3 –€6m/–€1m (gross/net); 9M –€144m/–€19m (gross/net).

Return on investment by asset class and segment9M 2017
68Munich Re – March 2018
Backup: Investments
1 Annualised. 2 Including management expenses.
%1 Regular income Write-ups/-downs Disposal result Extraord. derivative result Other inc./exp. RoI ᴓ Market value (€m)
Afs fixed-income 2.3 0.0 0.3 0.0 0.0 2.6 129,047
Afs non-fixed-income 4.1 –0.6 5.7 0.0 0.0 9.2 16,432
Derivatives 6.3 0.0 0.0 –31.1 –0.4 –25.2 1,763
Loans 3.0 0.0 1.5 0.0 0.0 4.5 65,016
Real estate 5.8 –1.8 0.1 0.0 0.0 4.0 7,216
Other2 3.2 0.2 0.0 0.0 –4.2 –0.8 13,135
Total 2.8 –0.1 1.0 –0.2 –0.2 3.2 232,610Reinsurance 2.7 –0.1 0.7 0.1 –0.3 3.1 89,471
ERGO 2.9 –0.1 1.2 –0.4 –0.2 3.3 143,139
3.4%
3.0%
4.1%
2.6%2.9% 2.7%
4.7%
2.7% 2.7%
3.6%3.2%
2.8%
3.2%
Q4 2014 Q1 2015 Q2 2015 Q3 2015 Q4 2015 Q1 2016 Q2 2016 Q3 2016 Q4 2016 Q1 2017 Q2 2017 Q3 2017
Return on investment Average

Investment portfolio9M 2017
Munich Re – March 2018
Backup: Investments
69
Portfolio management in Q3
Ongoing geographic diversification
Increase in corporate bond exposure
Slight decrease in structured products,
covered bonds and bank bonds
Further increase in equity exposure
Investments in infrastructure (wind park)
1 Fair values as at 30.9.2017 (31.12.2016). 2 Deposits retained on assumed reinsurance, deposits with banks, investment funds (excl. equities), derivatives and investments in renewable energies and gold. 3 Net of hedges: 6.5% (5.0%). 4 Market value change due to a parallel downward shift in yield curve by one basis point-considering the portfolio size of assets and liabilities (pre-tax). Negative net DV01 means rising interest rates are beneficial.
Investment portfolio1 %
Land and buildings
3.3 (2.9)
Fixed-interest securities
55.3 (56.3)
Shares, equity funds andparticipating interests3
7.1 (6.1)
Loans
27.9 (28.5)
TOTAL
€229bn
Miscellaneous2
6.4 (6.2)
Reinsurance
ERGO
Munich Re (Group)
Assets Liabilities
5.9 (5.9)
8.8 (9.3)
7.8 (8.0)
4.9 (4.6)
9.5 (10.6)
7.6 (8.1)
Assets
–1
–11
–12
NetLiabilities
41 (45)
112 (121)
153 (166)
42 (43)
123 (143)
165 (185)
Portfolio duration1 DV011,4 €m

70Munich Re – March 2018
Backup: Investments
Investment portfolioH1 2017 – Fixed-interest securities and miscellaneous
Approximation – not fully comparable with IFRS figures. Fair values as at 30.6.2017 (31.12.2016). 2 Non-fixed derivatives. 3 Non-fixed property funds and non-fixed bond funds.
Investment portfolio %
Miscellaneous %
% Fixed-interest securities1
% Loans1
Fixed-interest securities
55.8 (56.3)
Loans
27.6 (28.5)
TOTAL
€230bn
Miscellaneous
6.5 (6.2)
Pfandbriefe/Covered bonds
14 (15)
Corporates
16 (16)
Banks
2 (3)
Governments/Semi-government
63 (62)
TOTAL
€128bn
Structured products
3 (4)
TOTAL
€15bn
Deposits on reinsurance
36 (36)
Bank deposits
27 (20)
Investment funds3
11 (15)
Derivatives2
7 (11)
Other
19 (19)
Loans to policyholders/
mortgage loans
11 (10)
Pfandbriefe/Covered bonds
45 (44)
Banks
3 (4)
Governments/Semi-government
40 (41)
TOTAL
€63bnCorporates
1 (1)
Cash/Other
1 (0)

Fixed-income portfolio
Munich Re – March 2018 71
%
Structured products
2 (2)
Loans to policyholders/mortgage loans
3 (3)
Governments/
semi-government
54 (53)
Pfandbriefe/covered bonds
23 (24)
Corporate bonds
11 (11)
Cash/other
4 (4)
Bank bonds
2 (3)
TOTAL
€199bn
%Regional structure
Fixed-income portfolioH1 2017 – Allocation and regional structure
Backup: Investments
Without With Total
policyholder participation 30.6.2017 31.12.2016
Germany 4.7 24.0 28.8 28.2
US 14.0 1.3 15.3 16.0
France 2.3 5.7 8.0 8.0
UK 2.9 2.3 5.2 5.3
Canada 4.0 0.4 4.4 4.5
Netherlands 1.3 3.1 4.4 4.3
Supranationals 0.7 3.3 4.0 4.0
Spain 1.0 1.5 2.5 2.8
Australia 2.0 0.5 2.5 2.4
Italy 0.8 1.5 2.3 2.4
Belgium 0.7 1.7 2.3 2.3
Austria 0.4 1.8 2.1 2.0
Ireland 0.6 1.4 1.9 2.0
Norway 0.3 1.3 1.6 1.5
Sweden 0.2 1.3 1.5 1.6
Other 7.7 5.3 13.1 12.6
Total 43.5 56.5 100.0 100.0
Approximation – not fully comparable with IFRS figures. Fair values as at 30.6.2017 (31.12.2016).

72Munich Re – March 2018
Fixed-income portfolioH1 2017 – Rating and maturity structure
Rating structure Market value
(€bn)
AAA
(%)
AA A BBB BB <BB NR
Total 199.1 46 23 12 12 2 – 5
Governments/semi-government 106.7 46 32 12 9 2 – –
Pfandbriefe/covered bonds 46.1 75 19 4 1 – – 1
Corporate bonds (excluding bank bonds) 21.7 1 7 26 53 11 1 1
Bank bonds 5.0 0 7 41 45 6 0 2
Structured products 4.1 57 30 8 2 – 0 3
Maturity structure Average maturity
(years)
0-1 years
(%)
1-3 years 3-5 years 5-7 years 7-10 years >10 years n.a.
Total 9.7 9 13 12 12 16 35 2
Governments/semi-government 11.3 8 13 9 11 14 46 –
Pfandbriefe/covered bonds 8.0 5 10 15 17 25 28 –
Corporate bonds (excluding bank bonds) 6.9 9 20 23 15 14 20 –
Bank bonds 3.4 21 36 19 13 6 5 –
Backup: Investments

Fixed-income portfolioH1 2017 – Corporate bonds and bank bonds
73Munich Re – March 2018
Backup: Investments
%Corporate bonds – Sector breakdown
30.6.2017 31.12.2016
Utilities 17.6 18.5
Industrial goods and services 12.8 12.5
Oil and gas 11.7 11.8
Telecommunications 8.6 8.8
Financial services 7.4 7.1
Healthcare 6.7 6.4
Technology 5.8 5.0
Food and beverages 4.5 4.9
Basic resources 3.8 3.9
Automobiles 3.8 3.8
Media 3.6 3.8
Retail 3.4 3.9
Personal and household goods 3.2 2.9
Other 7.1 6.7
1 Classified as Tier 1 and upper Tier 2 capital for solvency purposes. 2 Classified as lower Tier 2 and Tier 3 capital for solvency purposes. Approximation – not fully comparable with IFRS figures. Fair values as at 30.6.2017 (31.12.2016).
%Regional breakdown of bank bonds
%Investment category of bank bonds
TOTAL
€5.0bn
Senior
82 (82)
Subordinated2
11 (12)
Loss-bearing1
7 (6)
Total
Senior bonds Subordinated Loss-bearing 30.6.2017 31.12.2016US 32.6 5.1 0.6 38.3 38.6
Germany 15.0 1.6 4.3 20.9 23.3UK 7.8 0.6 0.3 8.7 7.6Ireland 7.2 0.1 0.0 7.3 6.8France 2.6 0.9 1.8 5.3 4.3Canada 2.1 0.6 0.0 2.7 2.8Jersey 2.3 0.0 0.0 2.3 2.4Austria 0.8 0.5 0.0 1.3 1.2Belgium 1.3 0.0 0.0 1.3 1.1Other 10.4 1.3 0.1 11.8 11.8

On and off-balance-sheet reserves (gross)9M 2017
74Munich Re – March 2018
Backup: Investments
1 Unrealised gains/losses from unconsolidated affiliated companies, valuation at equity and cash-flow hedging. 2 Excluding reserves from owner-occupied property.
€m 31.12.2015 31.12.2016 31.3.2017 30.6.2017 30.9.2017
Market value of investments 230,529 236,153 235,399 229,737 229,149
Total reserves 25,969 28,496 26,180 24,743 24,565
On-balance-sheet reserves
Fixed-interest securities 7,886 8,649 7,815 7,658 7,496
Non-fixed-interest securities 2,446 2,924 3,311 2,917 3,011
Other on-balance-sheet reserves1 201 186 201 191 196
Subtotal 10,533 11,759 11,327 10,766 10,702
Off-balance-sheet reserves
Real estate2 2,273 2,413 2,450 2,450 2,516
Loans and investments (held to maturity) 12,610 13,591 11,692 10,761 10,589
Associates 553 733 711 767 758
Subtotal 15,436 16,738 14,853 13,977 13,863
Reserve ratio 11.3% 12.1% 11.1% 10.8% 10.7%

Sensitivities to interest rates, spreads and equity markets9M 2017
75Munich Re – March 2018
Backup: Investments
1 Rough calculation with limited reliability assuming unchanged portfolio as at 30.9.2017. After rough estimation of policyholder participation and deferred tax; linearity of relations cannot be assumed. Approximation – not fully comparable with IFRS figures. 2 Sensitivities to changes of spreads are calculated for every category of fixed-interest securities, except government securities with AAA ratings. 3 Worst-case scenario assumed, including commodities: impairment as soon as market value is below acquisition cost. Approximation – not fully comparable with IFRS figures.
Sensitivity to risk-free interest rates – Basis points –50 –25 +50 +100
Change in gross market value (€bn) +8.1 +4.0 –7.5 –14.6
Change in on-balance-sheet reserves, net (€bn)1 +1.9 +0.9 –1.8 –3.4
Change in off-balance-sheet reserves, net (€bn)1 +0.4 +0.2 –0.4 –0.7
P&L impact (€bn)1 –0.0 –0.0 +0.0 –0.0
Sensitivity to spreads2 (change in basis points) +50 +100
Change in gross market value (€bn) –5.3 –10.3
Change in on-balance-sheet reserves, net (€bn)1 –1.1 –2.1
Change in off-balance-sheet reserves, net (€bn)1 –0.3 –0.5
P&L impact (€bn)1 –0.0 –0.1
Sensitivity to equity and commodity markets3 –30% –10% +10% +30%
EURO STOXX 50 (3,595 as at 30.9.2017) 2,516 3,235 3,954 4,673Change in gross market value (€bn) –5.3 –1.8 +1.8 +5.4
Change in on-balance-sheet reserves, net (€bn)1 –1.4 –0.6 +1.0 +3.0
Change in off-balance-sheet reserves, net (€bn)1 –0.8 –0.3 +0.3 +0.8
P&L impact (€bn)1 –1.8 –0.4 +0.0 +0.2

Munich Re – March 2018 76
Shareholder
information
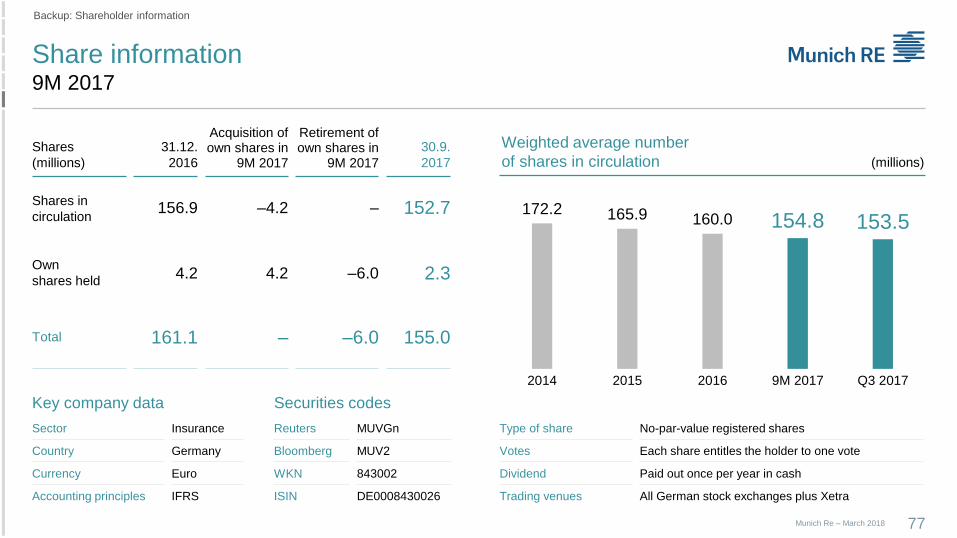
Share information9M 2017
77
Backup: Shareholder information
Munich Re – March 2018
Key company data
Sector Insurance
Country Germany
Currency Euro
Accounting principles IFRS
Securities codes
Reuters MUVGn
Bloomberg MUV2
WKN 843002
ISIN DE0008430026
Type of share No-par-value registered shares
Votes Each share entitles the holder to one vote
Dividend Paid out once per year in cash
Trading venues All German stock exchanges plus Xetra
Shares
(millions)
31.12.
2016
Acquisition of own shares in
9M 2017
Retirement of own shares in
9M 2017
30.9.
2017
Shares in
circulation156.9 –4.2 – 152.7
Own
shares held4.2 4.2 –6.0 2.3
Total 161.1 – –6.0 155.0
Weighted average number
of shares in circulation (millions)
172.2 165.9 160.0 154.8 153.5
2014 2015 2016 9M 2017 Q3 2017

Mission of Investor & Rating Agency Relations
78Munich Re – March 2018
Responsibility
Munich Re’s communication with the capital market /
financial community
Main objective
Active communication to support a fair capital-market valuation of
Munich Re shares and outstanding bonds
External communication
Increase transparency
on financial performance, strategy and expectations about future
perspectives within the principles of a credible, accurate, complete
and timely provision of relevant information
Target
Achieving a fair valuation and optimising the cost of capital by
increasing information efficiency between Munich Re and the
financial community while developing a relationship of trust with
our investor base
Internal communication
Transmission
of investors’ and creditors’ demands, and the capital markets’
perception of Munich Re, to management and staff
Target
Support management in the setting of ambitious targets as well as
in the execution of a value-based and shareholder-oriented
strategy
We aim to enhancing Munich Re’s visibility and attractiveness in the international financial community
Backup: Shareholder information
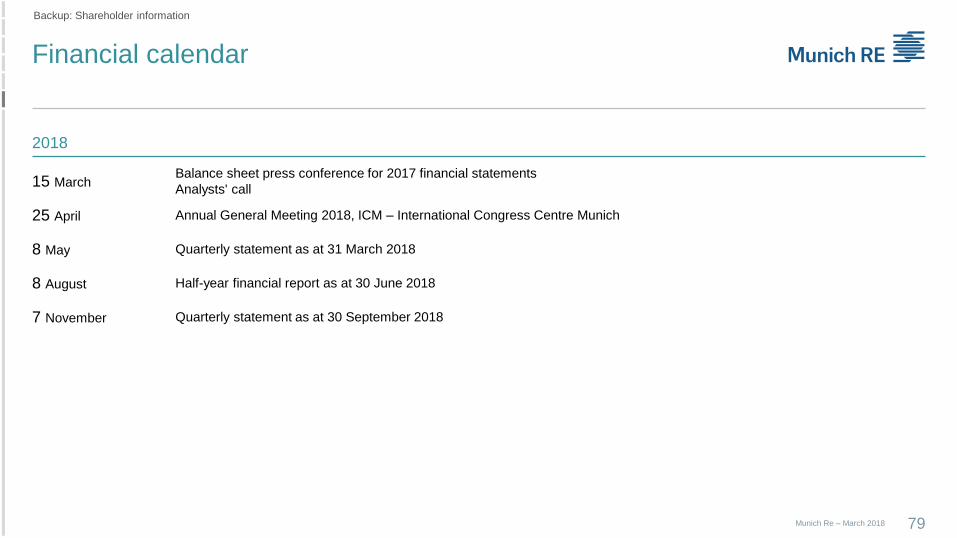
Financial calendar
79Munich Re – March 2018
Backup: Shareholder information
2018
15 MarchBalance sheet press conference for 2017 financial statements
Analysts' call
25 April Annual General Meeting 2018, ICM – International Congress Centre Munich
8 May Quarterly statement as at 31 March 2018
8 August Half-year financial report as at 30 June 2018
7 November Quarterly statement as at 30 September 2018
For information, please contact
80Munich Re – March 2018
Backup: Shareholder information
Investor Relations Team
Christian Becker-Hussong
Head of Investor & Rating Agency Relations
Tel.: +49 (89) 3891-3910
E-mail: [email protected]
Thorsten Dzuba
Tel.: +49 (89) 3891-8030
E-mail: [email protected]
Christine Franziszi
Tel.: +49 (89) 3891-3875
E-mail: [email protected]
Britta Hamberger
Tel.: +49 (89) 3891-3504
E-mail: [email protected]
Ralf Kleinschroth
Tel.: +49 (89) 3891-4559
E-mail: [email protected]
Andreas Silberhorn
Tel.: +49 (89) 3891-3366
E-mail: [email protected]
Ingrid Grunwald
Tel.: +49 (89) 3891-3517
E-mail: [email protected]
Angelika Rings
Tel.: +49 (211) 4937-7483
E-mail: [email protected]
Münchener Rückversicherungs-Gesellschaft | Investor & Rating Agency Relations | Königinstraße 107 | 80802 München, Germany
Fax: +49 (89) 3891-9888 | E-mail: [email protected] | Internet: www.munichre.com
Disclaimer
81Munich Re – March 2018
This presentation contains forward-looking statements that are based on current assumptions and forecasts of the
management of Munich Re. Known and unknown risks, uncertainties and other factors could lead to material differences
between the forward-looking statements given here and the actual development, in particular the results, financial situation and
performance of our Company. The Company assumes no liability to update these forward-looking statements or to make them
conform to future events or developments.
The primary insurance units of the disbanded Munich Health field of business are now recognised in the ERGO International
segment, units with reinsurance business in the Reinsurance Life and Health segment. Previous year’s figures were adjusted
to ensure comparability.


![Index2 [seidencompany.com] · 6/8/2016 · Title: Index2.tif Author: toms Created Date: 20160523134446Z](https://img.dokumen.tips/doc/110x75/6004a81a8c277e327f02998a/index2-682016-title-index2tif-author-toms-created-date-20160523134446z.jpg)


![index2 [] · Title: index2.pdf Author: ralleway Created Date: 2/19/2009 11:41:38 AM](https://img.dokumen.tips/doc/110x75/6004ac0d4a446a5c22152391/index2-title-index2pdf-author-ralleway-created-date-2192009-114138-am.jpg)


![INDEX2 [更新済み] · 2012-11-03 · Title: INDEX2 [更新済み] Created Date: 8/5/2011 12:26:32 PM](https://img.dokumen.tips/doc/110x75/5f9c4c40f212e0406319fbe5/index2-2012-11-03-title-index2-created-date-852011.jpg)


