Embed Size (px)
Citation preview

© 2012 Cisco and/or its affiliates. All rights reserved. Cisco Confidential 1
Shape Your Business For the Future:
Powering Transformation With
Cisco
Stephen Thomas Misa
Country General Manager

© 2012 Cisco and/or its affiliates. All rights reserved. Cisco Confidential 2
Our World is Changing… Market Transitions Wait for No One
Businesses Networked IT
as Differentiator
Economic Recovery…
GDP Growth
Speed, Scale, Flexibility, Replication
Productivity
Public Sector Spending
Broadband
Global Competition
Information Economy Networked Economy
Social Networking
Innovation
New Threats…
Evolving Everyday
Technology & Business
ArchitectureEmerging Markets
Safety & Security
Natural Disasters

© 2012 Cisco and/or its affiliates. All rights reserved. Cisco Confidential 3
Cisco® VNI Forecast research is an ongoing initiative to predict global traffic growth. This study focuses on consumer and
business mobile data traffic and its key drivers.
Source: Cisco VNI Global Mobile Data Traffic Forecast, 2011–2016
Global Mobile
Speed Data
Global Forecast
Data

© 2012 Cisco and/or its affiliates. All rights reserved. Cisco Confidential 4
Source: Cisco VNI Global Forecast, 2011–2016
More Devices
More Internet Users
Faster Broadband Speeds
More Rich Media Content
Growth Catalysts
Nearly 19 Billion Connections 4-Fold Speed Increase
3.4 Billion Internet Users 1.2 Million Video Minutes/Second

© 2012 Cisco and/or its affiliates. All rights reserved. Cisco Confidential 5
• One trillion gigabytes
• Approximately 1021
(1,000,000,000,000,000,000,000 bytes)
1.3 Zettabytes is equal to:
• 10X More than all IP traffic generated in 2008 (121 exabytes)
• 38 Million DVDs per hour
By 2016, global IP
traffic will reach an
annual run rate of
1.3 zettabytes per year
What is a zettabyte?
Source: Cisco VNI Global Forecast, 2011–2016

© 2012 Cisco and/or its affiliates. All rights reserved. Cisco Confidential 6
By 2016, global mobile
data traffic will reach an
annual run rate of 130
exabytes per year.
© 2011 Cisco and/or its affiliates. All rights reserved. Cisco Public 6
Source: Cisco Visual Networking Index (VNI) Global Mobile Data Traffic Forecast, 2011–2016
• 130X More than all IP traffic generated in 2000
• 33 Billion DVDs
• 813 Quadrillion SMS text messages
130 Exabytes
is equal to:

© 2012 Cisco and/or its affiliates. All rights reserved. Cisco Confidential 7
North America
2.9 Billion by 2016
CAGR 14.1%
Western Europe
2.6 Billion by 2016
CAGR 13.2%
Central/Eastern Europe
1.3 Billion by 2016
CAGR 10.2%
Latin America
1.6 Billion by 2016
CAGR 12.2%
Middle East & Africa
1.8 Billion by 2016
CAGR 10.4%
Asia Pacific
8.7 Billion by 2016
CAGR 14.1%
Source: Cisco VNI Global Forecast, 2011–2016

© 2012 Cisco and/or its affiliates. All rights reserved. Cisco Confidential 8
North America
269 Million by 2016
CAGR 1.6%
Western Europe
319 Million by 2016
CAGR 2.5%
Central/Eastern Europe
197 Million by 2016
CAGR 7.7%
Latin America
287 Million by 2016
CAGR 11.0%
Middle East & Africa
542 Million by 2016
CAGR 16.1%
Asia Pacific
1.7 Billion by 2016
CAGR 13.2%
Source: Cisco VNI Global Forecast, 2011–2016

© 2012 Cisco and/or its affiliates. All rights reserved. Cisco Confidential 9
• In 2010, PCs generated 97% of consumer Internet traffic. This will fall to
87% by 2015―demonstrating the impact that an increasing number and
variety of devices like tablets and smartphones are having on how
consumers and business users access and use the Internet.
• By 2015, TVs will account for over 10% of global consumer Internet traffic
(up from just 3% in 2010), and TVs will represent 18% of Internet video
traffic (up from only 7% in 2010).
• This forecasted growth demonstrates the impact of web-enabled TVs as
a viable online option for many consumers and the continued evolution of
video on the internet from low-quality clips to high-quality programs and
movies.
So let’s look at WHAT we’re connecting to the network with…

© 2012 Cisco and/or its affiliates. All rights reserved. Cisco Confidential 10
=
=
Tablet
Internet-Enabled 3DTV
Internet-Enabled HDTV
64-bit Laptop/PC
Gaming Consoles
1.2 X (monthly 32-bit laptop fixed traffic)
= 4.1 X (monthly 32-bit laptop fixed traffic)
= 2.0 X (monthly 32-bit laptop fixed traffic)
= 3.2 X (monthly 32-bit laptop fixed traffic)
3.4 X (monthly 32-bit laptop fixed traffic)
Source: Cisco VNI Global Forecast, 2011–2016

© 2012 Cisco and/or its affiliates. All rights reserved. Cisco Confidential 11
North America
3.5-Fold growth
11 to 37 Mbps
Western Europe
3.8-Fold growth
11 to 42 Mbps
Central/Eastern Europe
3.1-Fold growth
10 to 29 Mbps
Latin America
2.8-Fold growth
4.2 to 12 Mbps
Middle East & Africa
2.5-Fold growth
3.4 to 8.4 Mbps
Asia Pacific
4.4-Fold growth
8.1 to 36 Mbps
Source: Cisco VNI Global Forecast, 2011–2016

© 2012 Cisco and/or its affiliates. All rights reserved. Cisco Confidential 12
10 Mbps5 Mbps
2 Online Video
(HD Streams)
1 SD Business
Videoconference
1 Online Music
Stream
3 Online Video
(HD Streams)
1 Business Desktop
Conference Call
4 Online Music
Streams
1 Online Gaming
Stream
Source: Cisco VNI Global Forecast, 2011–2016
74% of all broadband connections by 2016
44% of all broadband connections by 2016

© 2012 Cisco and/or its affiliates. All rights reserved. Cisco Confidential 13
10 Mbps5 Mbps 100 Mbps
Source: Cisco VNI Global Forecast, 2011–2016
74% of all broadband connections by 2016
44% of all broadband connections by 2016
3% of all broadband connections by 2016
Online Video (HD movie download) Online Video (HD movie download) Online Video (HD movie download)
20 minutes 2 minutes41 minutes
© 2012 Cisco and/or its affiliates. All rights reserved. Cisco Confidential 14
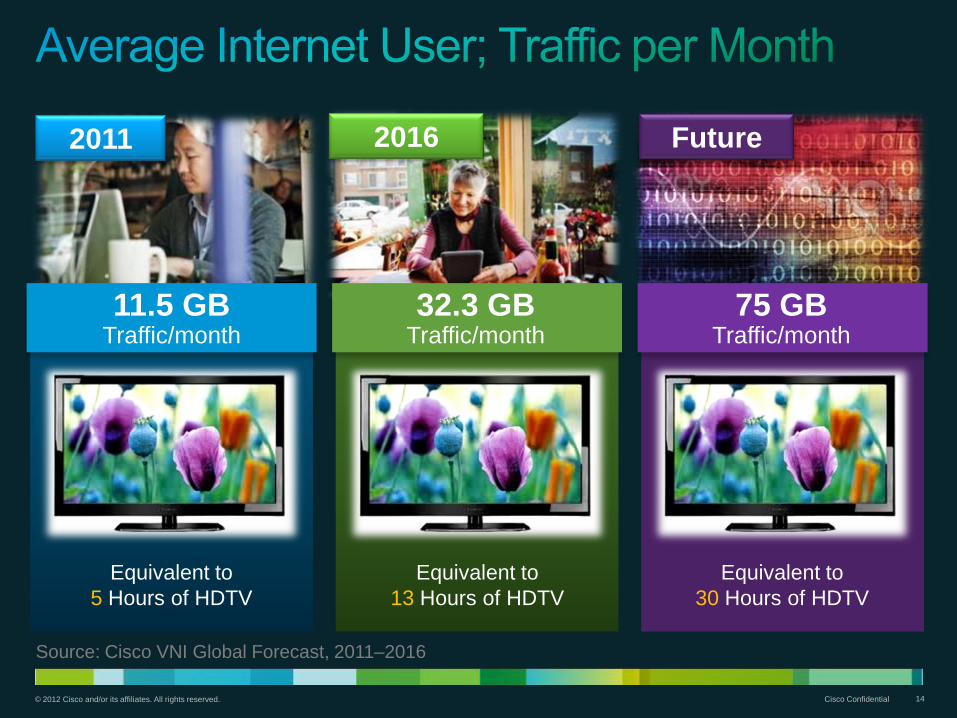
20162011 Future
Source: Cisco VNI Global Forecast, 2011–2016
11.5 GBTraffic/month
32.3 GBTraffic/month
75 GBTraffic/month
Equivalent to
5 Hours of HDTV
Equivalent to
13 Hours of HDTV
Equivalent to
30 Hours of HDTV

© 2012 Cisco and/or its affiliates. All rights reserved. Cisco Confidential 15
2016
83.7 GB Traffic/month
2011
26.2 GB Traffic/month
150 GB Traffic/month
Future
Source: Cisco VNI Global Forecast, 2011–2016
Equivalent to
11 Hours of HDTVEquivalent to
34 Hours of HDTVEquivalent to
61 Hours of HDTV

© 2012 Cisco and/or its affiliates. All rights reserved. Cisco Confidential 16
0.0
0.5
1.0
1.5
2.0
2.5
3.0
3.5
4.0
4.5
5.0
2011 2012 2013 2014 2015 2016
Exab
yte
s p
er
Mo
nth
Mobile VoIP (0.3%)
Mobile Gaming (1.5%)
Mobile File Sharing (6.0%)
Mobile M2M (4.0%)
Mobile Web/Data (18.5%)
Mobile Video (69.8%)
APAC Mobile
Source: Cisco Visual Networking Index (VNI) Global Mobile Data Traffic Forecast, 2011–2016
(Figures in
legend refer
to traffic
share in
2016.)
84% CAGR 2011–2016

© 2012 Cisco and/or its affiliates. All rights reserved. Cisco Confidential 17
By 2016, nearly three-
fourth’s (70 %) of the
APAC’s mobile data
traffic will be video.
Mobile video traffic will
double every
year between 2011
and 2016.
© 2011 Cisco and/or its affiliates. All rights reserved. Cisco Public 17
Source: Cisco Visual Networking Index (VNI) Global Mobile Data Traffic Forecast, 2011–2016

© 2012 Cisco and/or its affiliates. All rights reserved. Cisco Confidential 18
The is based on measured datacenter traffic, independent analyst equipment projections, and relevant academic studies.
Global data modeling of datacenter and cloud computing
for businesses and consumers.
Global Cloud Readiness
Forecasting Global Cloud Traffic / Gauging Cloud Transformation
Global Cloud Index
Broadband Penetration
Upload / Download Speeds
Network Latency
Global Datacenter/Cloud Trends
>45M speed tests from 150 countries30 TBs of monthly traffic from 10 DCs

© 2012 Cisco and/or its affiliates. All rights reserved. Cisco Confidential 19
Forecasting and Analysis
Datacenter and Cloud Traffic• Growing global datacenter traffic volumes
• Increasing percentage of global cloud traffic
Workload Transition and Economics• Increasing virtualization / apps to the cloud
• Gaining bottom-line savings via cloud networks
Cloud Readiness• Comparing regional networking metrics
• Identifying cloud service requirements

© 2012 Cisco and/or its affiliates. All rights reserved. Cisco Confidential 20
0.0
0.5
1.0
1.5
2.0
2.5
3.0
3.5
4.0
4.5
5.0
2010 2011 2012 2013 2014 2015
Zett
ab
yte
s /
Year
33% CAGR 2010–2015
Datacenter Traffic Quadruples From 2010 to 2015
4.8 ZB
1.1 ZB
1.5 ZB
2.1 ZB
2.9 ZB
3.7 ZB

© 2012 Cisco and/or its affiliates. All rights reserved. Cisco Confidential 21
Traffic Equivalencies
66.7 Trillion
• hours of streaming music
15.5 Trillion
• hours of business web conferencing with webcam
4.8 Trillion
• hours of online high-definition (HD) video streaming
© 2012 Cisco and/or its affiliates. All rights reserved. Cisco Confidential 22
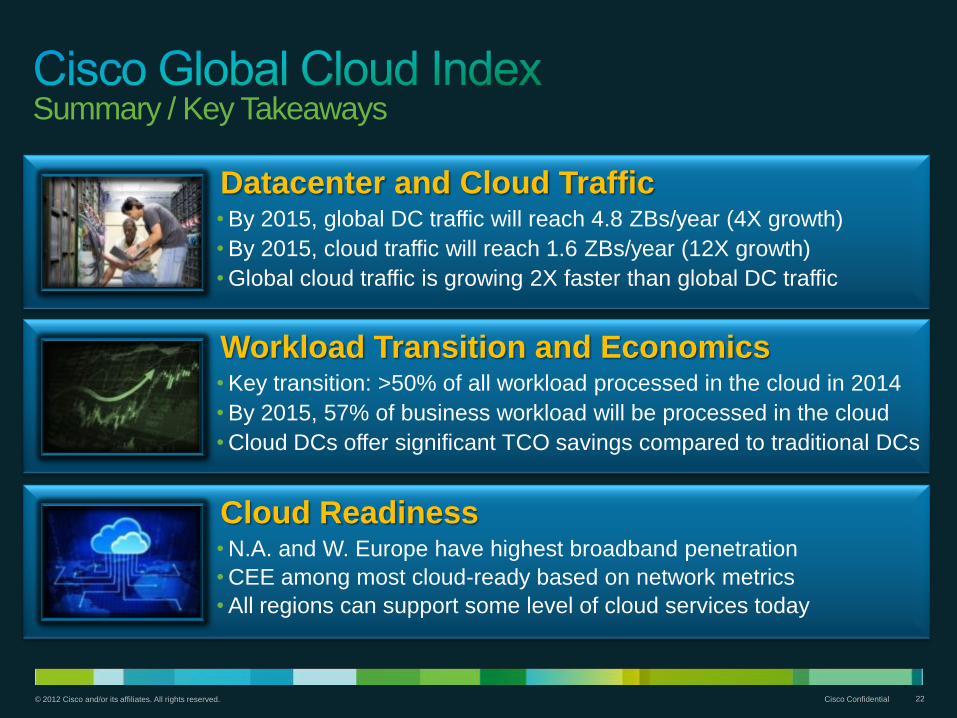
Summary / Key Takeaways
Datacenter and Cloud Traffic• By 2015, global DC traffic will reach 4.8 ZBs/year (4X growth)
• By 2015, cloud traffic will reach 1.6 ZBs/year (12X growth)
• Global cloud traffic is growing 2X faster than global DC traffic
Workload Transition and Economics• Key transition: >50% of all workload processed in the cloud in 2014
• By 2015, 57% of business workload will be processed in the cloud
• Cloud DCs offer significant TCO savings compared to traditional DCs
Cloud Readiness• N.A. and W. Europe have highest broadband penetration
• CEE among most cloud-ready based on network metrics
• All regions can support some level of cloud services today

© 2012 Cisco and/or its affiliates. All rights reserved. Cisco Confidential 23
Source: Akamai State of the Internet Report Q4 2011

© 2012 Cisco and/or its affiliates. All rights reserved. Cisco Confidential 24
Source: Akamai State of the Internet Report Q4 2011

© 2012 Cisco and/or its affiliates. All rights reserved. Cisco Confidential 25
• Source: Akamai State of the Internet Report Q4 2011

© 2012 Cisco and/or its affiliates. All rights reserved. Cisco Confidential 26
Source: Akamai State of the Internet Report Q4 2011

© 2012 Cisco and/or its affiliates. All rights reserved. Cisco Confidential 27Cisco Confidential 27© 2011 Cisco and/or its affiliates. All rights reserved.
Use Devices

© 2012 Cisco and/or its affiliates. All rights reserved. Cisco Confidential 28Cisco Confidential 28© 2011 Cisco and/or its affiliates. All rights reserved.
to the Internet
By 2020 there will be

© 2012 Cisco and/or its affiliates. All rights reserved. Cisco Confidential 29Cisco Confidential 29© 2011 Cisco and/or its affiliates. All rights reserved.
to the Internet
By 2020 there will be

© 2012 Cisco and/or its affiliates. All rights reserved. Cisco Confidential 30Cisco Confidential 30© 2011 Cisco and/or its affiliates. All rights reserved.
over
In
wirelesslywill be delivered
of the world’s
video
wi l l be

© 2012 Cisco and/or its affiliates. All rights reserved. Cisco Confidential 31
Is your infrastructure
ready for that?
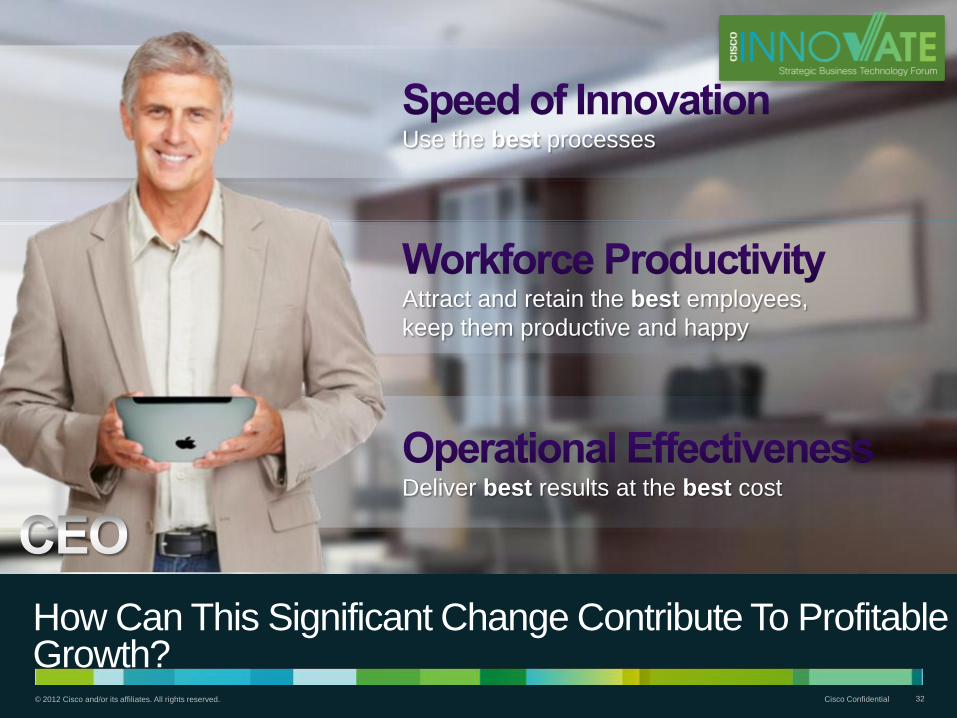
© 2012 Cisco and/or its affiliates. All rights reserved. Cisco Confidential 32
Use the best processes
Attract and retain the best employees,
keep them productive and happy
Deliver best results at the best cost
How Can This Significant Change Contribute To Profitable Growth?
© 2012 Cisco and/or its affiliates. All rights reserved. Cisco Confidential 33
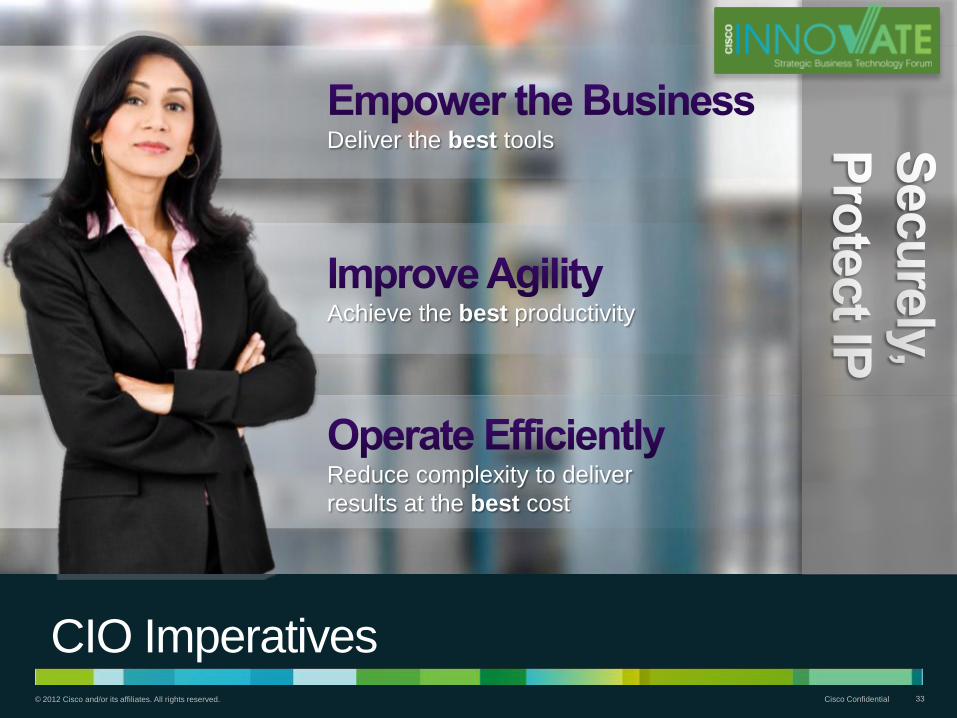
CIO Imperatives
Deliver the best tools
Achieve the best productivity
Reduce complexity to deliver
results at the best cost

© 2012 Cisco and/or its affiliates. All rights reserved. Cisco Confidential 34
Don’t Forget the EmployeesMillennials Change the Game
college students and young
professionals would accept
a lower-paying job that had
more flexibility

© 2012 Cisco and/or its affiliates. All rights reserved. Cisco Confidential 35
What If You Could Solve It All?CEO Aspirations, CIO Imperatives and End-User Requirements
What if I could speed innovation by opening my
network and collaborating with customers and
partners…
While lowering IT cost and complexity?
What if I could let my employees have
greater freedom and choice….
While protecting Intellectual Property?
What if I could let my team work their
way…
Without compromising the way
my business works?

© 2012 Cisco and/or its affiliates. All rights reserved. Cisco Confidential 36
Thank you.


![DONAR Decentralized Server Selection for Cloud …...–UltraDNS –Akamai Global Traffic Management Doesn’t [Akamai/UltraDNS/etc] Already Do This? •Existing approaches use alternative,](https://img.dokumen.tips/doc/110x75/5f8fbafba5325b08ec59ec71/donar-decentralized-server-selection-for-cloud-aultradns-aakamai-global.jpg)