Embed Size (px)
Citation preview
SHANGHAITECH SEM WORKING PAPER SERIES
No. 2021-005
Revisit the Real Impact of China’s Send-down Movement
on Rural Education
Guan Gong
Shanghai University of Finance and Economics, IASFE at Hubei University of Economics
Gordon G. Liu
National School of Development, Peking University
Ding Lu
School of Entrepreneurship and Management, ShanghaiTech University
James G. Wen
Trinity College
Huizhong Zhou
Western Michigan University
June 30, 2021
https://ssrn.com/abstract=3876228
School of Entrepreneurship and Management
ShanghaiTech University
http://sem.shanghaitech.edu.cn
Electronic copy available at: https://ssrn.com/abstract=3876228
1
Revisit the Real Impact of China’s Send-down Movement
on Rural Education
By GUAN GONG, GORDON G. LIU, DING LU, JAMES G. WEN, HUIZHONG ZHOU *
Chen et al. (2020) claim a positive causal effect of the send-down movement on rural
education during China’s Cultural Revolution. Their result hinges on a highly
sensitive key variable: education attained by the treatment cohorts, which is found
to be treated with upward bias and inconsistently coded. We show that when these
errors are corrected, the claimed positive effect is substantially diminished or even
turns negative. Using Chen et al.’s original data and model, our analysis reveals
that the send-down movement actually increased rural illiteracy rate, which raises
serious concerns about the robustness and policy implications of their findings.
(JEL: I25, O15, R23)
* Gong: Institute for Advanced Research, Shanghai University of Finance and Economics; IASFE at Hubei University of Economics (email:
[email protected]); Liu: National School of Development, Peking University (email: [email protected]); Lu: School of
Entrepreneurship and Management, ShanghaiTech University (email: [email protected]); Wen: Trinity College (email:
[email protected]); Zhou: Department of Economics, Western Michigan University (email: [email protected]).
Electronic copy available at: https://ssrn.com/abstract=3876228

2
The send-down movement was a state-enforced program that resettled millions of urban youths
in the countryside during China’s Cultural Revolution. Between 1968 and 1978, more than 16
million urban youths, mostly 16-17 years old, were forced to leave their homes and sent to rural
areas, including many impoverished remote places (Gu and Hu, 1996). These sent-down youths
(SDYs) suffered from hard manual labor, poor living conditions, and mental trauma. According to
official statistics, from 1974 to 1979—the second half of the movement—more than 25,000 SDYs
died in their prime years, mostly from “abnormal causes,” including suicide, political prosecution,
and violent crime (Liu, 2008, p. 864). Numerous cases of SDYs’ abuse, rape, and suicide were
reported, which provoked mass protests and hunger strikes. The damage to SDYs’ health, careers,
families, and children extended beyond that period and continues today (Bernstein, 1977; Liu,
2008; Xie, Jiang, and Greenman, 2008; Yang and Li, 2011; Zhou, 2013).
In “Arrival of Young Talent: The Send-Down Movement and Rural Education in China” (Chen
et al., 2020), the authors claim to find that the arrival of SDYs significantly increased rural
children’s educational attainment. They further infer that this unintended consequence of the
movement is related to the “contribution of human capital accumulation in rural areas to China’s
subsequent economic growth” (p. 3395).
In this paper, we show that Chen et al.’s claims are groundless and contradict historical records.
Their core econometric result is built on a substantially sensitive key variable—the educational
attainment of treatment cohorts, which is assessed with upward bias due to mismeasurement and
miscoding errors. When such errors are corrected, their claimed positive effect is substantially
diminished— or even turns negative.1
In Section I, we explain how both the quantity and quality of education attained by the study
cohorts, or “treatment group,” are inflated, which leads to potential upward bias for Chen et al.’s
results (2020). First, they acknowledge that the schooling years required for completing primary,
junior high, and senior high schools were reduced from the previous 6, 3, and 3 years (or 6-3-3),
respectively, to a 5-2-2 system for the study cohorts. However, they continue to use the 6-3-3
system to measure education, which inflates the schooling years accumulatively by 1, 2 and 3,
respectively, of primary, junior high, and senior high school graduates in the study cohorts. In
addition, because the quality of education was significantly lower during the Cultural Revolution,
1 Appendix provides a guide to data access and STATA codes for replicating the results in this paper.
Electronic copy available at: https://ssrn.com/abstract=3876228

3
the simple use of schooling years as a measure of education attained by the treatment cohorts leads
to even more severe inflation. In fact, in response to the poor education quality during that period,
the Chinese government had to launch a nationwide campaign of remedial education in 1982,
which required all staff and workers who graduated from junior and senior high schools between
1968 and 1980 to retake basic junior high school courses unless they could pass the tests for these
courses (Ministry of Education, 1982).
In Section II, we show that when the quantitative and qualitative errors in measuring education
are corrected, the positive effect of SDYs on rural education claimed by Chen et al. (2020) is
substantially reduced or even turns negative. Chen et al. (2021) state that the error term is
independently distributed. However, this is not the case, and econometrically does not help
eliminate the upward bias given their identification strategy via SDY density. We show that the
quantitative error is correlated with the dependent variable and the qualitative error is typically
multiplicative. These measurement errors are clearly responsible for the claimed positive impact
of SDYs on rural education. Our findings in this section invalidate Chen et al.’s (2020) result.
In Section III, we examine Chen et al.’s (2020) published Replication Data, which show further
incoherency. Using the model and programing codes in their Replication Data, we find that the
send-down movement actually increased rural illiteracy—a finding that is hard to reconcile with
Chen et al.’s claim of human capital spillover from SDYs to rural children.
In Section IV, we show the existence of many coding inconsistencies in Chen et al.’s (2020)
Replication Data. Our analysis demonstrates that correcting only a small portion of their
inconsistently coded data among the treatment cohorts—for counties at or above the 95th
percentile of the SDY density distribution—results in an estimated SDY effect of the opposite
sign. This exercise raises concerns about the extent to which Chen et al.’s result hinges on
incoherent data processing.
To summarize, our analysis shows that Chen et al.’s (2020) claim that the send-down
movement contributed to rural education is not supported by the data they assembled, and it is
further conditional on the data’s being improperly coded and processed. In the final section, we
challenge Chen et al.’s assumptions and claims, which are not only poorly grounded from a
research perspective, but also run counter to historical and institutional facts. We question whether
SDYs—the majority of whom were victims of the ruined education system during the send-down
movement—possessed sufficient human capital to pass on to rural children. The movement
Electronic copy available at: https://ssrn.com/abstract=3876228
4
prevented 16.47 million youths from pursuing further studies, which amounts to an education loss
of 70.27 million person-years (Gong et al. 2020). Such a loss is four times as large as the “17.6
million increase in person-years of schooling in rural areas” Chen et al. (2000, p. 3410) claim. In
light of such a sharp cost-benefit contrast, we cast serious doubt on what the policy implications—
intended or unintended—would be, based on their claimed findings, for other developing
countries.
I. Inflated Educational Attainment During the Cultural Revolution
To examine how the send-down movement impacts rural education, Chen et al. (2020)
constructed two variables, county-level SDY density as an explanatory variable and the
educational attainment of affected children as a dependent variable. County-level SDY density is
the ratio of the number of SDYs who arrive at the county to its population in 1964. Educational
attainment is measured by the years of schooling attained by the treatment group, which includes
rural children born between 1956 and 1969. A control group includes rural children born between
1946 and 1955, whose educational attainment is measured in the same way as the treatment group.
A cohort difference-in-differences (DID) identification strategy is applied (the regression model
is equation 1 presented in Section II).
In Chen et al. (2020), schooling years are coded as follows: “Assume that people received 6
years of education if they graduated from primary school. If they dropped out of primary school,
we coded the number as 3. We coded higher-level schooling years in a similar fashion” (p. 3404).
Schooling years coded in this way substantially exaggerate the education actually attained by the
treatment cohorts, in terms of both quantity and quality.
In terms of quantity, the above coding obviously over-counts the years the treatment cohorts
are in school. It is well documented by both official records and scholarly research that the
primary-junior-senior school years were compressed from the traditional 6-3-3 system down to a
5-2-2 system, from 1969 through the end of the Cultural Revolution. Thus, the paper’s coding
method inflates the schooling years of the treatment group by one year for primary-school
graduates, two years for junior high and three years for senior high. Changes in the education
system are acknowledged by Chen et al. (2020, p. 3405). However, they choose to impute the
schooling years of the treatment cohorts as if they had experienced the same schooling system as
the control cohorts. Chen et al. (2021) claim that this discrepancy in schooling years is an
Electronic copy available at: https://ssrn.com/abstract=3876228

5
uncorrelated error. This is not true. We show in the next section that the coding errors are correlated
with the dependent variable, and that they significantly affect the empirical results.
Taking schooling years as a measure of education represents more severe inflation of education
attained by the treatment cohorts, in addition to the over-counting problem. The quality of the
cohorts’ education was significantly deteriorated during the Cultural Revolution, which
dramatically lowered the quality of education in China. To comprehend the severity of quality
deterioration in the education of treatment cohorts, it is necessary to give a brief account of how
the Revolution assaulted education on all fronts, including teachers, curricula, schooling time, and
moral principles, for more than ten years.
The Cultural Revolution began in 1966 with a violent wave of attacking and stigmatizing
intellectuals, including professors and teachers. Many of them were publicly criticized, humiliated,
and physically abused by the Red Guards; some were beaten to death or forced to commit suicide
(Wang, 2009; Meng and Gregory, 2002). All schools in China were closed for about 2 years. When
they reopened in 1968, schools were no longer a place friendly for teaching and learning. Teachers
were wary of teaching, for fear of being accused of spreading bourgeois ideas, while students did
not want to learn after being bombarded with propaganda that promoted Maoist hostility and the
rejection of scholarship (Mao, 1969). The school curricula were drastically watered down to
emphasize ideological indoctrination. Standard scientific courses (physics, chemistry, or biology)
were eliminated with a small part of their contents merged into “practical courses” of “Basic
Agricultural Knowledge” and “Basic Industrial Knowledge” (Han, 2001; Zhou, 2004). A large
chunk of class time gave way to long laboring hours in factories and farms.
The poor quality of education received by the cohorts during the Cultural Revolution is best
summarized by the former leader Deng Xiaoping, who lamented in 1977 that “nowadays the
graduates of the best senior high schools in Beijing only attained education at the same level as
the previous first-year students in junior high” (Qian, 2018). A nationwide survey conducted in
1982 on staff and workers who completed junior or senior high schools between 1968 and 1980
revealed that most of them could not pass certification tests at junior high level. The failure rate in
Guangzhou city, for instance, was over 90 percent among 93,996 persons tested (Gao, 1983).
While Chen et al. (2021) admit the poor quality of education in urban schools during the years
under investigation, they argue that it is not as important in rural areas because rural education was
not good before the Cultural Revolution to begin with. They also claim that combining standard
Electronic copy available at: https://ssrn.com/abstract=3876228

6
scientific courses into more practical courses “could be more useful in the less-developed rural
areas” (p. 10). We find these arguments to dispute concern about the reduced quality of education
to be groundless. Attacks on schools and education took the form of nationwide political
campaigns and swept across both urban and rural areas. It is absurd to presume that rural education
was immune to such attacks simply because it was not as good as urban education.
In fact, qualitative adjustment of years of education in rural areas is even more necessary than
in urban areas. A rapid expansion in rural education occurred during the Cultural Revolution,
which makes schooling years an even more inflated measure of education attainment in that period.
The Fourth Five-Year Plan (1971-1975) called for at least 5 years of universal education in the
countryside, from the previous system of 4 years of junior primary and 2 years of senior primary
schools (Zhou, 2004). With the revolutionary fervor characteristic of the time, school enrollment
experienced a great leap forward. Between 1965 and 1976, primary school enrollment increased 29.1
percent, and that of secondary school rose 6.25 times. Much of this expansion occurred in rural areas:
The rural share of junior high enrollment rose from 33.7 percent to 75.2 percent, and that of senior
high from 9.0 percent to 62.3 percent (Zhang, 1984, pp. 1001-1021). Although the number of graduates
increased dramatically, the schools were woefully understaffed and underequipped, and lacked
sufficient qualified teachers, teaching facilities, and materials. The official slogan was “Running
schools by all means and forms,” and schools were forced to be operated on a half-day basis (Shi
and Li, 2008, p. 440-441).
TABLE 1— CHANGES OF PRIMARY AND SECONDARY SCHOOLS 1978-1984
1978 1984 Changes (%)
Primary
Number of schools Rural 916,000 798,000 -12.9
Urban 33,323 55,740 67.3
Enrolment (10,000) Rural 12,879 11,451 -11.1
Urban 1,745 2,106 20.6
Junior High
Number of schools Rural 107,103 65,003 -39.3
Urban 6,027 10,900 80.9
Enrolment (10,000) Rural 3,872 2,674 -30.9
Urban 1,124 1,190 5.9
Senior High
Number of schools Rural 36,003 6,691 -81.4
Urban 13,212 10,627 -19.6
Enrolment (10,000) Rural 949 199 -79.0
Urban 604 491 -18.7
Source: Compiled from National Bureau of Statistics of China (1985) and National Bureau of Statistics of China (2010).
Electronic copy available at: https://ssrn.com/abstract=3876228

7
The poor quality of rural schools was quickly revealed when the education authorities reestablished
quality standards after the Cultural Revolution. As shown in Table 1, between 1978 and 1984, all
categories of schools in rural areas were substantially scaled back in both the numbers of schools and
enrollment, while in urban areas only senior high schools contracted and to a much lesser extent. Rural
senior high schools experienced the largest fall—a drop of 81.4 percent in the number of schools and
79 percent in enrollment—which indicates that those numbers had been stretched by disregarding
quality: The higher the number of schools, the lower the quality (National Bureau of Statistics of
China, 1985, 2010).
II. Econometric Consequences of Inflated Educational Attainment
How does inflation of the treatment cohorts’ educational attainment affect Chen et al.’s (2020)
econometric results? We now show that any rational adjustments to the schooling-year variable
would invalidate the key result, whereby SDYs contribute to rural education.
At the core of Chen et al.’s (2020) econometric analysis is an estimation of the impact of
county-level SDY density on the schooling years of affected cohorts. Their cohort difference-in-
differences (DID) model is
(1) 𝑌𝑖,𝑔,𝑐,𝑝∗ = 𝛽0 + 𝛽1%𝑆𝐷𝑌𝑐,𝑝 × 𝐼(1956 ≤ 𝑔 ≤ 1969) + 𝛽2𝑋𝑖,𝑔,𝑐,𝑝 + 𝜆𝑐
+𝜇𝑔,𝑝 + Λ𝑐 × 𝜇𝑔 + 𝜀𝑖,𝑔,𝑐,𝑝,
where 𝑌𝑖,𝑔,𝑐,𝑝∗ refers to a true value of educational attainment for individual 𝑖 of cohort g in county
c of province p; %𝑆𝐷𝑌𝑐,𝑝 is the density of SDYs who arrived at county c of province p; Xi,g,c,p is a
vector of individual-level controls, and 𝜆𝑐 represents county fixed effects. To account for
unobservable heterogeneous cohort trends that may be correlated with %𝑆𝐷𝑌𝑐,𝑝 , the equation
includes province-cohort fixed effects, 𝜇𝑔,𝑝 , and the interaction terms between county base
education (before SDYs’ arrival) and cohort dummies, Λ𝑐 × 𝜇𝑔 . The primary parameter of interest
in this equation is 𝛽1, which indicates the impact of arriving SDYs on the educational attainment
of cohorts born between 1956 and 1969.
The true value of educational attainment, 𝑌𝑖,𝑔,𝑐,𝑝∗ , is not observed. Chen et al. (2020) use
schooling years coded from census data to proxy for 𝑌𝑖,𝑔,𝑐,𝑝∗ . Chen et al. (2021) argue that any
coding errors can be framed as measurement errors in the dependent variable. Let 𝑌𝑖,𝑔,𝑐,𝑝 denote
Electronic copy available at: https://ssrn.com/abstract=3876228

8
coded schooling years. Then the measurement error is 𝜂𝑖,𝑔,𝑐,𝑝 = 𝑌𝑖,𝑔,𝑐,𝑝 − 𝑌𝑖,𝑔,𝑐,𝑝∗ . Substituting this
into (1) yields
(2) 𝑌𝑖,𝑔,𝑐,𝑝 = 𝛽0 + 𝛽1%𝑆𝐷𝑌𝑐,𝑝 × 𝐼(1956 ≤ 𝑔 ≤ 1969) + 𝛽2𝑋𝑖,𝑔,𝑐,𝑝 + 𝜆𝑐
+𝜇𝑔,𝑝 + Λ𝑐 × 𝜇𝑔 + 𝜂𝑖,𝑔,𝑐,𝑝 + 𝜀𝑖,𝑔,𝑐,𝑝.
Chen et al. (2021) argue that if the measurement error, 𝜂𝑖,𝑔,𝑐,𝑝 , is not correlated with
%𝑆𝐷𝑌𝑐,𝑝 × 𝐼(1956 ≤ 𝑔 ≤ 1969), the estimate of 𝛽1 is not biased. They also argue that coding
schooling years following the 6-3-3 system instead of the 5-2-2 system “is no more than cohort
fixed effects,” which are controlled for in the regressions.
However, as we show below, measurement errors in education are not independent — they are
correlated with the dependent variable 𝑌𝑖,𝑔,𝑐,𝑝 . In addition, errors in quality are typically
multiplicative rather than additive, which cannot be addressed by cohort fixed effects. Therefore,
measurement errors in Chen et al.’s (2020) study do bias the estimate of 𝛽1, and therefore require
correction.
We first consider quality adjustments to the education measure, leaving errors in over-counting
schooling years unadjusted. As we discuss in Section I, an error in the quality of education is more
severe than an error in quantity. Approaches to deriving quality-adjusted years of schooling are
typically multiplicative, i.e., to multiply schooling years by a factor, such as test scores reflecting
learning outcome (Schoellman, 2012; Kaarsen, 2014; Filmer et al., 2020). Following this practice,
measurement error in education quality can be accounted for by 𝑌𝑖,𝑔,𝑐,𝑝∗ = 𝜂𝑖,𝑔,𝑐,𝑝 × 𝑌𝑖,𝑔,𝑐,𝑝, where
𝜂𝑖,𝑔,𝑐,𝑝 is the quality adjustment factor.2 Substituting this equation into (1), we have
(3) 𝑌𝑖,𝑔,𝑐,𝑝 = 𝛾0 + 𝛾1 ×%𝑆𝐷𝑌𝑐,𝑝 × 𝐼(1956 ≤ 𝑔 ≤ 1969) + 𝛾2 × 𝑋𝑖,𝑔,𝑐,𝑝
+𝜆�̃� + 𝜇𝑔,�̃� + Λ�̃� × 𝜇𝑔 ̃ + 𝜀𝑖,𝑔,𝑐,�̃�,
where 𝛾𝑗 ≡ 𝛽𝑗 𝜂𝑖,𝑔,𝑐,𝑝⁄ , j=0, 1, and 2; for other variables, �̃� represents the original variable 𝑞
divided by 𝜂𝑖,𝑔,𝑐,𝑝.
The multiplicative error generates two problems in estimating model (3). First, there is an
amplification bias if the mean value of 𝜂𝑖,𝑔,𝑐,𝑝 is between 0 and 1—i.e., the estimated 𝛾1 > the true
parameter 𝛽1. The deterioration of education quality during the Cultural Revolution means that
2
The relationships may take more complex forms, for instance, 𝑌𝑖,𝑔,𝑐,𝑝∗ = 𝜂𝑖,𝑔,𝑐,𝑝 × 𝑌𝑖,𝑔,𝑐,𝑝
𝜃 , where 𝜃 is between 0 and 1.
Electronic copy available at: https://ssrn.com/abstract=3876228

9
𝜂𝑖,𝑔,𝑐,𝑝 is less than 1 for the treatment group. Hence, using regression model (3) results in an
overestimate of 𝛽1, the true effect of SDYs on rural children’s educational attainment. Typically,
the higher the variation in 𝜂𝑖,𝑔,𝑐,𝑝 , the greater the efficiency loss in the estimate. Second, an
endogeneity problem is imbedded in regression model (3) whereby the error term 𝜀𝑖,𝑔,𝑐,�̃� is
correlated with the cohort-effect regressors 𝜆�̃� and Λ�̃� × 𝜇𝑔 ̃ . This is because education quality
adjustment here applies only to the treatment group but not to the control group. Therefore,
multiplicative measurement error, 𝜂𝑖,𝑔,𝑐,𝑝 , may not only amplify the impact of SDYs on rural
education but also result in an estimated 𝛽1 of the opposite sign.
To study how quality adjustment would affect the result, we set the quality adjustment factor
to 1—i.e., 𝜂𝑖,𝑔,𝑐,𝑝 = 1—for the control group, and 𝜂𝑖,𝑔,𝑐,𝑝 < 1 for the treatment group in estimating
equation (3). The nationwide campaign for remedial education after the Cultural Revolution
mandated that all staff who graduated from junior and senior high schools between 1968 and 1980
must meet the minimum standards of junior high education by passing tests or taking remedial
courses at that level (Ministry of Education et al.,1982). This implies that 9 schooling years of
education during that period were considered equivalent to only 5 schooling years of primary
school education, giving rise to a discount factor of 0.56. With this figure as a reference point, we
consider discount factors 𝜂𝑖,𝑔,𝑐,𝑝 ranging from 0.9 through 0.4 in estimating the effect of SDYs on
rural education. Results are reported in Table 2.
TABLE 2—THE EFFECT OF SDYS ON EDUCATIONAL ATTAINMENT IN RURAL AREAS WITH QUALITY ADJUSTMENT FOR TREATED COHORTS
UNDER THE 6-3-3 SCHOOLING SYSTEM
Dependent variable Years of schooling
Coded by
Chen et al.
(2020)
Recoded by quality adjustment factor
η=0.9 η=0.8 η=0.7 η=0.6 η=0.5 η=0.4
(1) (2) (3) (4) (5) (6) (7)
Local density of received SDYs 3.237 2.442 1.646 0.851 0.055 -0.740 -1.535
affected cohorts (0.701) (0.635) (0.579) (0.537) (0.511) (0.505) (0.519)
Observations 2,775,858 2,775,858 2,775,858 2,775,858 2,775,858 2,775,858 2,775,858
R-squared 0.293 0.264 0.244 0.242 0.266 0.320 0.398
Mean Y of the treatment group 7.190 6.471 5.752 5.033 4.314 3.595 2.876
County FE
Province-cohort FE
Base education cohort FE
Note: Clustered standard errors are in parentheses.
Source: Integrated and cleaned data from Replication Data for Chen et al. (2020): https:// doi.org/10.3886/E119690V1. STATA codes for
replicating the results are in Appendix.
Electronic copy available at: https://ssrn.com/abstract=3876228

10
Column (1) displays Chen et al.’s (2020) estimation. Columns (2)-(7) display the estimated
coefficient 1 and its standard error when the quality adjustment factor η ranges from 0.9 to 0.4.
When η gets smaller, �̂�1 falls from 2.442 when η = 0.9 to a near-zero value of 0.055 when η = 0.6,
and goes further down to 1.535 when η = 0.4. Specifically, when the treatment group’s education
quality is equivalent to 70 percent of the control group’s education quality for each schooling year,
�̂�1 is 0.851—in sharp contrast to the benchmark value of 3.237 in Chen et al. When the quality
factor is set to 0.5, �̂�1 becomes negative at 0.740. When η goes further down to 0.4, �̂�1 is negative
and statistically significant (1.535 with a standard error 0.519). As quality adjustment gets larger,
the positive impact of SDYs on rural education dwindles, turns negative, and then turns
significantly negative.
We next examine the impact of over-counting schooling years on the estimation of 1, leaving
quality unadjusted. Contrary to Chen et al.’s (2021) claim, the errors of counting 5-2-2 schooling
years as 6-3-3 are by no means independently distributed; they are correlated with schooling years
coded using the 6-3-3 rule—i.e., 𝑐𝑜𝑣(𝜂𝑖,𝑔,𝑐,𝑝, 𝑌𝑖,𝑔,𝑐,𝑝) ≠ 0.
It is straightforward to show that the counting errors depend on measured schooling years. For
those who actually completed 5-year primary school, the coding of 6 years generates an error of 1
additional year. Similarly, measurement errors for junior and senior high school graduates are 2
and 3 additional years, respectively. Assuming that all 0-coded cases are error-free and that there
are no dropouts, we can write the measurement error as
(4) 𝜂𝑖,𝑔,𝑐,𝑝 = 𝑌𝑖,𝑔,𝑐,𝑝 − 𝑌𝑖,𝑔,𝑐,𝑝∗ =
{
0,
1 + 𝜔𝑖,𝑔,𝑐,𝑝,
2 + 𝜔𝑖,𝑔,𝑐,𝑝,
3 + 𝜔𝑖,𝑔,𝑐,𝑝,
𝑖𝑓 𝑌𝑖,𝑔,𝑐,𝑝 = 0;
𝑖𝑓 𝑌𝑖,𝑔,𝑐,𝑝 = 6;
𝑖𝑓 𝑌𝑖,𝑔,𝑐,𝑝 = 9;
𝑖𝑓 𝑌𝑖,𝑔,𝑐,𝑝 ≥ 12,
where 𝜔𝑖,𝑔,𝑐,𝑝 refers to random disturbances with a mean of 0.
Directly incorporating the measurement errors in equation (4) into the regression model (2)
would be complicated. However, a linear approximation of the error function (4) can help
demonstrate the impact of the measurement error on the degree of bias and the statistical
significance of 1. The error function (4) can be approximated by the following linear relation:
(5) 𝜂𝑖,𝑔,𝑐�̂� = 0.2299 × 𝑌𝑖,𝑔,𝑐,𝑝,
which implies that the coefficient of correlation between the measurement errors and the measured
schooling years is 0.2299. The above equation also implies that 𝑌𝑖,𝑔,𝑐,𝑝∗ = 0.7701 × 𝑌𝑖,𝑔,𝑐,𝑝.
Electronic copy available at: https://ssrn.com/abstract=3876228

11
The fitted relationship (5) translates equation (2) to the same functional form as in equation
(3), and the corresponding η is 0.7701. We can therefore run regression model (3) in a similar way.
Column (2) of Table 3 displays the estimation results. The estimate �̂�1 , 1.408, is nearly 56.5
percent smaller than 3.237 in Column (1), the estimate in Chen et al. (2020); the estimate also
becomes less statistically significant. A simple implication of this finding is that counting errors
are by no means independent. Column (3) displays the results from directly coding schooling
years for the treatment group following the 5-2-2 system instead of the 6-3-3 system. It shows a
much smaller estimate: �̂�1 = 1.197.
TABLE 3—THE EFFECT OF SDYS ON EDUCATIONAL ATTAINMENT IN RURAL AREAS WITH SCHOOLING YEARS RECODED TO THE 5-2-2 SCHOOLING
SYSTEM AND QUALITY ADJUSTMENT FOR TREATED COHORTS
Dependent variable Years of schooling
Coded by
Chen et al.
(2020)
Recoded by
simulated linear
model (5)
Recoded by
adjusting 6-3-3
to 5-2-2
Recoded by adjusting 6-3-3 to 5-2-2 and quality
adjustment factor
η=0.9 η=0.8 η=0.7 η=0.6
(1) (2) (3) (4) (5) (6) (7)
Local density of received SDYs 3.237 1.408 1.197 0.606 0.014 -0.577 -1.169
affected cohorts (0.701) (0.565) (0.536) (0.509) (0.493) (0.488) (0.495)
Observations 2,775,858 2,775,858 2,775,858 2,775,858 2,775,858 2,775,858 2,775,858
R-squared 0.293 0.241 0.244 0.242 0.256 0.289 0.340
Mean Y of the treatment group 7.190 5.537 5.689 5.120 4.552 3.983 3.414
County FE
Province-cohort FE
Base education cohort FE
Note: Clustered standard errors are in parentheses.
Source: Integrated and cleaned data from Replication Data for Chen et al. (2020): https:// doi.org/10.3886/E119690V1. STATA codes for
replicating the results are in Appendix.
We are now ready to adjust both quality and quantity errors in measuring educational
attainment. The results are reported in Columns (4)-(7) of Table 3. With moderate quality
adjustment, the estimate �̂�1 is reduced to near zero (0.014) when η = 0.8, and becomes negative (-
0.577) when η = 0.7.
III. Arrival of SDYs and Illiteracy Rates
In our initial attempt in Gong et al. (2020) to adopt a 5-2-2 coding system for the treatment
group to re-estimate model (1), the estimate �̂�1 is -0.421 and insignificant for the rural sample
(Column (3) of Table 4). However, using the same 5-2-2 coding and the same subsample, Chen et
Electronic copy available at: https://ssrn.com/abstract=3876228

12
al. (2021) estimate �̂�1 to be 2.233 and significant (Column (2) of Table 4).3 To probe this puzzling
difference, we carefully reexamined Chen et al.’s program codes and Replication Data. It turns out
that the difference primarily arises from the different methods for handling schooling years that
are coded as 0 in the Replication Data. These observations represent 10.28 percent in the treatment
cohorts; i.e., 𝑌𝑖,𝑔,𝑐,𝑝 = 0. As Chen et al. (2020) do not reveal how the 0 codes are imputed from the
census data, Gong et al. (2020) provide a plausible interpretation whereby those individuals with
𝑌𝑖,𝑔,𝑐,𝑝 = 0 for 1956 i 1969 might be school dropouts, and accordingly convert the code 0 to
2.5 for the treatment cohorts. In comparison, the estimation in Chen et al. (2021) suggests that in
the Replication Data the 0 codes mean zero years of schooling rather than observations with
insufficient information—for example, missing data or unanswered survey questions—or school
dropouts.4
With this understanding, it seems counterintuitive that our 5-2-2 coding exercise in Gong et al.
(2020), in which a schooling year of 0 is raised to 2.5, generates a �̂�1 that is lower than the estimate
from the otherwise identical exercise in Chen et al. (2021). The change in schooling year from 0
to 2.5 is supposed to boost the treated cohorts’ educational attainment. Why, then, does such a
change result in an insignificantly negative �̂�1? It has to do with the distribution of individuals
with 0 schooling year over the sample counties.
We thus call those with 𝑌𝑖,𝑔,𝑐,𝑝 = 0 illiterate. We find that for the rural sample, the illiteracy
rate was 23.5 percent for cohorts in the control group vis-à-vis 10.2 percent in the treatment group.
Significantly, for cohorts in both groups, only about one in five illiterate persons lived in counties
where the SDY densities were above average. That ratio reveals an important fact: The rural areas
where more SDYs were assigned had generally been more developed in terms of basic education
well before their arrival. Such a pattern can be demonstrated in terms of schooling years as well.
To illustrate, we present two graphs in Figure 1 that depict the average schooling years on the left
3
It appears that Chen et al. (2021) incorrectly use 5-2-2 coding for all cohorts in both groups, resulting a lower mean Y of the control group (as
in Table 3, Column 2) and an estimated �̂�1 higher than what we found in Column 9 of Table 2 using 5-2-2 coding only for the treated cohorts.
However, this overestimated value for �̂�1 is still 31 percent smaller than the benchmark effect �̂�1 =3.237 found in Chen et al. (2020). 4
According to official records, nationwide primary school enrollment accounted for 84.7 percent of age groups in 1965 and the ratio rose to
96.8 percent in 1975 (National Bureau of Statistics, 2010), which implies that the enrollment rate should be about 91 percent for the cohorts in the
treatment group.
Electronic copy available at: https://ssrn.com/abstract=3876228

13
and illiteracy rates on the right for counties where SDY densities are in upper, middle, and lower
levels.5 The vertical line at 1955 refers to the latest cohort in the control group.
FIGURE 1. THE EFFECT OF SDYS ON ILLITERACY AND EDUCATIONAL ATTAINMENT OF RURAL CHILDREN
The graphs reveal a clear pattern: Counties with higher SDY densities had persistently
performed better than those with lower SDY densities well before the arrival of SDYs, in terms of
both schooling years and illiteracy rates. The arrival of SDYs did not alter this pattern. In Gong
et al. (2020) we present a detailed account that shows that the key explanatory variable—county-
level SDY density—is positively correlated with the economic conditions and development levels
of the county. Counties that are wealthier and closer to cities receive more SDYs. Therefore, a
positive estimate of �̂�1 does not necessarily indicate SDYs’ contribution to education. Rather, it is
very likely driven by unobserved heterogeneities that are correlated with the movement in the
Cultural Revolution across counties.6
The distribution of illiteracy rates helps resolve the puzzle whereby recoding 0 to 2.5 for the
treatment group led to an insignificantly negative �̂�1: For every illiterate individual in areas with
above-average SDY densities, there were four such individuals in areas with below-average SDY
densities. When all 0 were coded as 2.5, the average schooling years in low SDY-density counties
increased more than that in high SDY-density counties, which leveled out the difference in
5
Data source and STATA codes for generating the graphs in Figure 1 are provided in Appendix. The upper, middle, and lower levels are
respectively corresponding to the densities of SDYs on the top 25%, between top 25% and lower 25%, and on lower 25%. Schooling years in the
left graph is based on Chen et al. (2020) without any adjustments shown to be necessary in the previous section. 6
To identify the net SDY-density effect, model (1) controls unobservable heterogeneous cohort trends that are possibly correlated with SDY
densities by including province-cohort fixed effects and the interaction terms between county base education (before SDYs’ arrival) and cohort
dummies.
Electronic copy available at: https://ssrn.com/abstract=3876228
14
schooling years between counties with high and low SDY densities and thereby rendered the
estimated 𝛽1 smaller or negative.
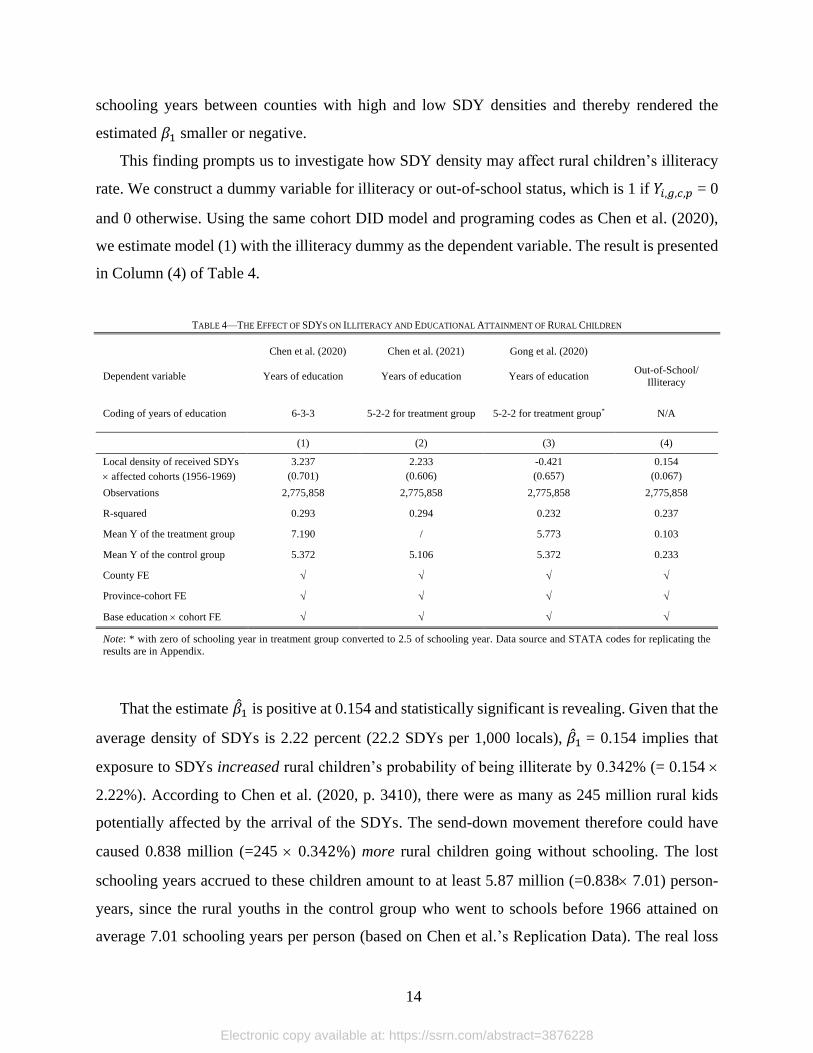
This finding prompts us to investigate how SDY density may affect rural children’s illiteracy
rate. We construct a dummy variable for illiteracy or out-of-school status, which is 1 if 𝑌𝑖,𝑔,𝑐,𝑝 = 0
and 0 otherwise. Using the same cohort DID model and programing codes as Chen et al. (2020),
we estimate model (1) with the illiteracy dummy as the dependent variable. The result is presented
in Column (4) of Table 4.
TABLE 4—THE EFFECT OF SDYS ON ILLITERACY AND EDUCATIONAL ATTAINMENT OF RURAL CHILDREN
Chen et al. (2020) Chen et al. (2021) Gong et al. (2020)
Dependent variable Years of education Years of education Years of education Out-of-School/
Illiteracy
Coding of years of education 6-3-3 5-2-2 for treatment group 5-2-2 for treatment group* N/A
(1) (2) (3) (4)
Local density of received SDYs 3.237 2.233 -0.421 0.154
affected cohorts (1956-1969) (0.701) (0.606) (0.657) (0.067)
Observations 2,775,858 2,775,858 2,775,858 2,775,858
R-squared 0.293 0.294 0.232 0.237
Mean Y of the treatment group 7.190 / 5.773 0.103
Mean Y of the control group 5.372 5.106 5.372 0.233
County FE
Province-cohort FE
Base education cohort FE
Note: * with zero of schooling year in treatment group converted to 2.5 of schooling year. Data source and STATA codes for replicating the
results are in Appendix.
That the estimate �̂�1 is positive at 0.154 and statistically significant is revealing. Given that the
average density of SDYs is 2.22 percent (22.2 SDYs per 1,000 locals), �̂�1 = 0.154 implies that
exposure to SDYs increased rural children’s probability of being illiterate by 0.342% (= 0.154
2.22%). According to Chen et al. (2020, p. 3410), there were as many as 245 million rural kids
potentially affected by the arrival of the SDYs. The send-down movement therefore could have
caused 0.838 million (=245 0.342%) more rural children going without schooling. The lost
schooling years accrued to these children amount to at least 5.87 million (=0.838 7.01) person-
years, since the rural youths in the control group who went to schools before 1966 attained on
average 7.01 schooling years per person (based on Chen et al.’s Replication Data). The real loss
Electronic copy available at: https://ssrn.com/abstract=3876228
15
of schooling years must be much higher if we take into account all the lost educational
opportunities till 1980, the Census year. The life-long human capital that would otherwise have
been accumulated by those illiterate rural residents is a palpable loss compared to the marginal
increase of schooling years claimed to be found by Chen et al. (2020) as the result of the movement.
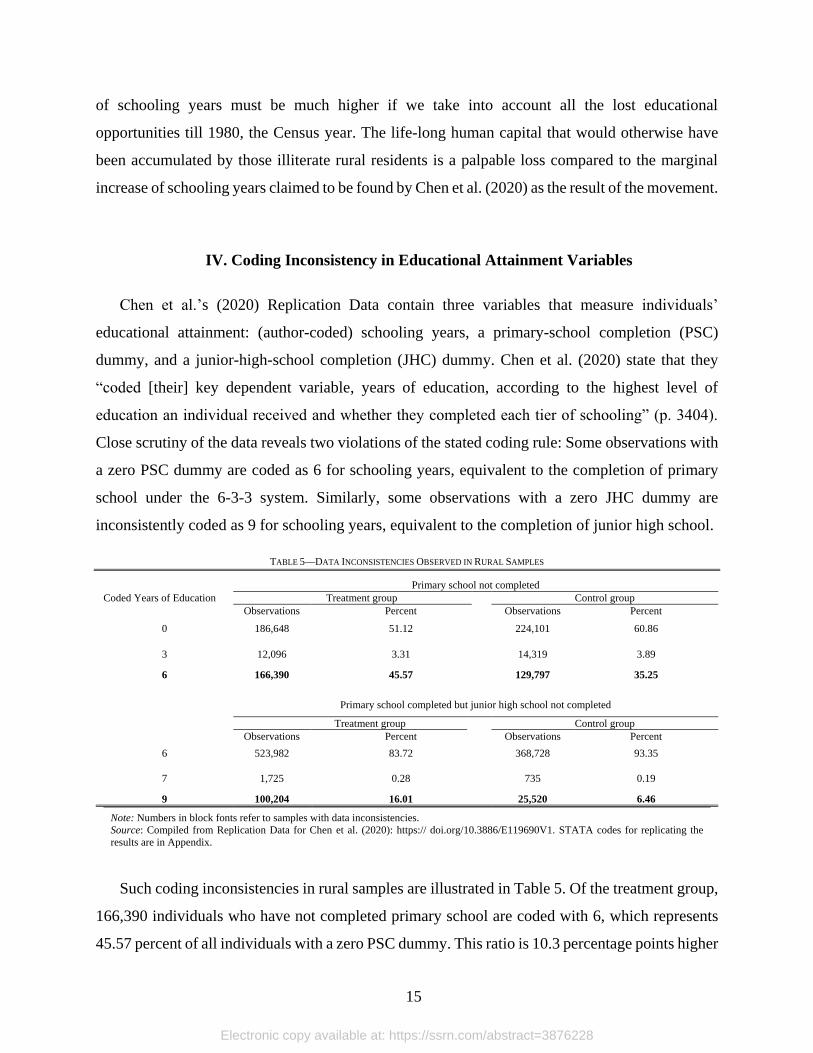
IV. Coding Inconsistency in Educational Attainment Variables
Chen et al.’s (2020) Replication Data contain three variables that measure individuals’
educational attainment: (author-coded) schooling years, a primary-school completion (PSC)
dummy, and a junior-high-school completion (JHC) dummy. Chen et al. (2020) state that they
“coded [their] key dependent variable, years of education, according to the highest level of
education an individual received and whether they completed each tier of schooling” (p. 3404).
Close scrutiny of the data reveals two violations of the stated coding rule: Some observations with
a zero PSC dummy are coded as 6 for schooling years, equivalent to the completion of primary
school under the 6-3-3 system. Similarly, some observations with a zero JHC dummy are
inconsistently coded as 9 for schooling years, equivalent to the completion of junior high school.
TABLE 5—DATA INCONSISTENCIES OBSERVED IN RURAL SAMPLES
Coded Years of Education
Primary school not completed
Treatment group Control group
Observations Percent Observations Percent
0 186,648 51.12 224,101 60.86
3 12,096 3.31 14,319 3.89
6 166,390 45.57 129,797 35.25
Primary school completed but junior high school not completed
Treatment group Control group
Observations Percent Observations Percent
6 523,982 83.72 368,728 93.35
7 1,725 0.28 735 0.19
9 100,204 16.01 25,520 6.46
Note: Numbers in block fonts refer to samples with data inconsistencies.
Source: Compiled from Replication Data for Chen et al. (2020): https:// doi.org/10.3886/E119690V1. STATA codes for replicating the
results are in Appendix.
Such coding inconsistencies in rural samples are illustrated in Table 5. Of the treatment group,
166,390 individuals who have not completed primary school are coded with 6, which represents
45.57 percent of all individuals with a zero PSC dummy. This ratio is 10.3 percentage points higher
Electronic copy available at: https://ssrn.com/abstract=3876228

16
than that of the control group, which is 35.25 percent. Likewise, for those in the treatment group
who have completed primary school but not junior high school, 100,204 are coded as 9, which
represents 16.01 percent of all individuals in this category. In comparison, only 6.46 percent of
those in this category are coded as 9 in the control group. Clearly, the coding inconsistency is
biased in favor of the treatment group in the measurement of educational attainment. Individuals
with coding inconsistency amount to 15.2 percent (= 166,390 + 100,204 + 129,797 + 25,520) /
2,775,858) of the rural sample.
To check whether the extent of coding inconsistencies is within an acceptable range of error,
we need a benchmark for evaluation. We use national data from the China Compendium of
Statistics 1949-2008 (National Bureau of Statistics, 2010) to calculate nationwide school dropout
rates from the 1950s to the 1980s.7 We then match the annual data on school dropout rates to the
years that are relevant to the cohorts in this study.
To get the school dropout rates for each cohort, we use the numbers of school-registered
children and the numbers of school dropouts imputed from the samples with consistent coding in
the Replication Data: Primary school dropouts are those whose PSC code is 0 and schooling-year
code is 3, and junior high dropouts are those whose PSC code is 1, JHC code is 0, and schooling-
year code is 7. Thus the dropout rate is the number of imputed dropouts divided by the number of
school-enrolled persons in each cohort. The results are listed in Column (2), Table 6.
TABLE 6—SCHOOL DROPOUT RATES COMPARED
School Cohorts in
National dropout rate
inferred from China
Compendium of Statistics
Rural samples’ dropout rate
based on Replication Data
Rural samples’ dropout
rate after adjustments for
data inconsistency
(1) (2) (3)
Primary Control group
13.12
1.95
19.58
Treatment group
6.96
0.74
10.96
Junior high Control group
6.79
0.33
11.76
Treatment group 8.24 0.19 11.00
Note: Inconsistent cases described in Table 5 are treated as dropouts in adjustments for data inconsistency.
Source: Compiled and imputed from Replication Data for Chen et al. (2020): https://doi.org/10.3886/E119690V1 and National Bureau of
Statistics (2010). STATA codes for replicating the results are in Appendix.
7
The China Compendium of Statistics 1949-2008 provides yearly data on current-year student enrollment, new student enrollment, and
graduates of schools at all levels. We infer that current-year dropouts = previous-year number of student enrollment + current-year new student
enrollment current-year number of graduates current-year number of student enrollment. The current-year dropout rate is defined as current-
year dropouts divided by current-year number of student enrollment. Each cohort’s primary school dropout rate is the moving average of N years
of dropout rates up to the year corresponding to the graduation age of that cohort, where N=6 or 5 depending on the 6-3-3 or 5-2-2 system prevailing
during that period. Each cohort’s junior high dropout rate is also imputed the same way, except that N=3 or 2 depending on the prevailing schooling-
year system.
Electronic copy available at: https://ssrn.com/abstract=3876228
17
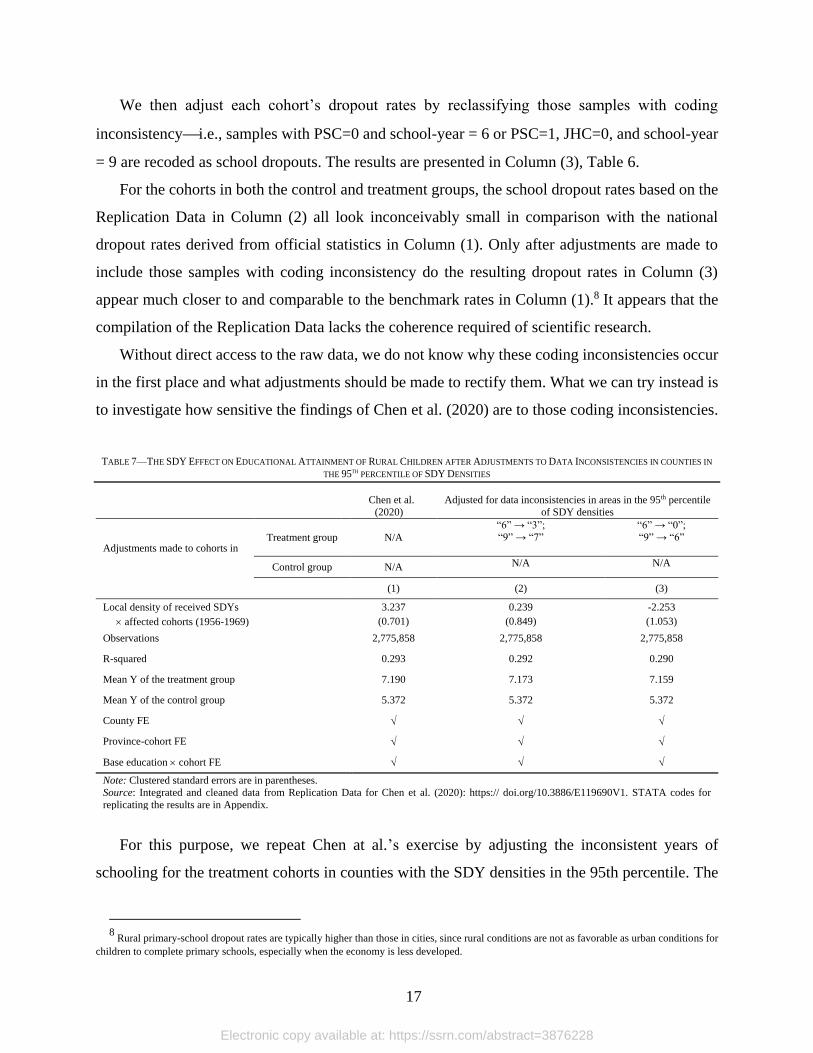
We then adjust each cohort’s dropout rates by reclassifying those samples with coding
inconsistencyi.e., samples with PSC=0 and school-year = 6 or PSC=1, JHC=0, and school-year
= 9 are recoded as school dropouts. The results are presented in Column (3), Table 6.
For the cohorts in both the control and treatment groups, the school dropout rates based on the
Replication Data in Column (2) all look inconceivably small in comparison with the national
dropout rates derived from official statistics in Column (1). Only after adjustments are made to
include those samples with coding inconsistency do the resulting dropout rates in Column (3)
appear much closer to and comparable to the benchmark rates in Column (1).8 It appears that the
compilation of the Replication Data lacks the coherence required of scientific research.
Without direct access to the raw data, we do not know why these coding inconsistencies occur
in the first place and what adjustments should be made to rectify them. What we can try instead is
to investigate how sensitive the findings of Chen et al. (2020) are to those coding inconsistencies.
TABLE 7—THE SDY EFFECT ON EDUCATIONAL ATTAINMENT OF RURAL CHILDREN AFTER ADJUSTMENTS TO DATA INCONSISTENCIES IN COUNTIES IN
THE 95TH PERCENTILE OF SDY DENSITIES
Chen et al.
(2020)
Adjusted for data inconsistencies in areas in the 95th percentile
of SDY densities
Adjustments made to cohorts in Treatment group N/A
“6” → “3”;
“9” → “7”
“6” → “0”;
“9” → “6”
Control group N/A N/A N/A
(1) (2) (3)
Local density of received SDYs 3.237 0.239 -2.253
affected cohorts (1956-1969) (0.701) (0.849) (1.053)
Observations 2,775,858 2,775,858 2,775,858
R-squared 0.293 0.292 0.290
Mean Y of the treatment group 7.190 7.173 7.159
Mean Y of the control group 5.372 5.372 5.372
County FE
Province-cohort FE
Base education cohort FE
Note: Clustered standard errors are in parentheses.
Source: Integrated and cleaned data from Replication Data for Chen et al. (2020): https:// doi.org/10.3886/E119690V1. STATA codes for
replicating the results are in Appendix.
For this purpose, we repeat Chen at al.’s exercise by adjusting the inconsistent years of
schooling for the treatment cohorts in counties with the SDY densities in the 95th percentile. The
8
Rural primary-school dropout rates are typically higher than those in cities, since rural conditions are not as favorable as urban conditions for
children to complete primary schools, especially when the economy is less developed.
Electronic copy available at: https://ssrn.com/abstract=3876228

18
number of adjusted samples accounts for 0.44% of observations and 0.67% of observations in the
treatment group.
Recoding observations with inconsistencies as dropouts results in an insignificant �̂�1 = 0.239
(Column (2) of Table 7). Recoding observations with inconsistencies in terms of not attending
primary or junior high school, which is consistent with PSC=0 or JHC=0, results in �̂�1 = -2.253,
which is statistically significant (Column (3) of Table 7). Adjustments to correct coding
inconsistencies for only a very small proportion of the sample appear to drastically change—and
even nullify—the Chen et al.’s key finding. This raises concerns regarding the extent to which the
finding hinges on the incoherence of data processing.
V. Conclusion and Discussion
In a footnote, Chen et al. (2020) hint a sensible interpretation of their benchmark empirical
results: “This coding method is designed to approximate the true number of years of education,
……. The system was compressed to 5-2-2 during the Cultural Revolution and gradually
restored to 6-3-3 after its end. …… If we observe that SDYs have a positive effect on our
imputed ‘years of education,’ we should interpret it as either a higher education level or a
higher probability of graduation” (p. 3405). However, in the main body of text, they go beyond
that interpretation to claim that “the arrival of the SDYs significantly increased local rural
children’s years of schooling” and that “the effect of the SDYs resulted in an increase of 17.6
million person-years of schooling in rural areas” (p. 3410) and infer that the send-down movement
made “the contribution of human capital accumulation in rural areas to China’s subsequent
economic growth” in the reform era (p. 3395).
We show that their mismeasurement, and in turn inflation, of the educational attainment of the
treatment cohorts has far more serious consequences on the results than their limited scope of
interpretation. Firstly, when measurement errors in both education quantity and education quality
are corrected, the claimed positive effect diminishes or becomes negative. Secondly, employing
the same model and data as Chen et al. (2020) and treating zero schooling year as illiteracy, we
find that SDYs actually increased the illiteracy rate, which contrasts sharply with Chen et al.’s
claimed human capital spillover from SDYs to rural children. Thirdly, a closer examination of the
Electronic copy available at: https://ssrn.com/abstract=3876228

19
authors’ Replication Data reveals a large number of coding inconsistencies—for example, some
individuals who did not complete primary school were assigned 6 years of schooling. Correcting
just a small portion of the coding inconsistencies results in a negative SDY effect, which raises
concerns about the extent to which Chen et al.’s finding hinges on incoherent data processing.
It is not surprising that Chen et al. (2020) fail to find an “unintended effect on rural education—
i.e., how the large-scale arrival of SDYs benefited the approximately 245 million school-age
children in rural China at the time” (Chen et al., p. 3394), because their main assumptions and
claims run counter to well-documented and widely accepted historical records. While we focus on
the pitfalls in their econometric analysis and data processing, it is worth highlighting some key
historical facts here.9
There is overwhelming evidence that the send-down movement was disastrous and inhumane
that crippled the education of millions of young people and disrupted the lives of nearly every
family in China (Li, Rosenzweig, and Zhang, 2010; Xie, Jiang, and Greenman, 2008; Zhou, 2013;
Yang and Li, 2011; Zhou and Hou, 1999). A national conference held in 1973 acknowledged that
one-third of SDYs could not earn their living and 40 percent lived in substandard shelters (Bonnin
2013, p. 95). By the end of the Cultural Revolution, more than 50 percent of SDYs in 13 (out of
27) provinces could not earn their living; in 5 of these provinces, this ratio was as high as 70 to 80
percent (Liu 2009, pp. 668-69). These figures show that most SDYs were in an extreme plight,
unable to develop or pass on human capital. A lament by senior government officials at the time
best summarizes the policy’s failure: the huge amount of fiscal money spent on the movement over
a decade was only in exchange for the so-called “four discontents” – those of SDYs, their parents,
the peasants, and the government itself (Liu, 2009, p. 851; Bonnin, 2013, p.135).
If any policy implications can be drawn from such a movement, the direct costs associated
with the education of SDYs—the main target of the movement—must be fully considered, but
regrettably are ignored by Chen et al. (2020). Using public annual data on student enrollment, the
number of graduates, and the percentages of graduates who continued their education in the 1960s
and 1970s, we calculate what the counterfactual educational attainment would be of the 16.47
million SDYs if they were not sent down. Based on our calculation, the total education loss for
SDYs amounts to 70.27 million person-years (Gong et al., 2020). Such a loss is fourfold as large
9
In a separate paper (Gong et al., 2020), we present more detailed historical and institutional facts.
Electronic copy available at: https://ssrn.com/abstract=3876228

20
as the “17.6 million increase in person-years of schooling in rural areas” claimed in Chen et al.
(2020, p. 3410).10
SDYs who were swept out of their hometowns to unfamiliar villages by revolutionary fervor
were unlikely to be able to exert a spillover of human capital to rural children. Upon their arrival,
most were not welcome by or even faced hostility from villagers, children included. The hostility
came from not only the economic stress they brought to the locals’ living but also the
overwhelming tides of anti-intellectuals and anti-education sentiment during the Cultural
Revolution. Instead of educating others, SDYs were sent down with the central purpose of being
“re-educated” by farmers, as the government officially called for. In Chairman Mao’s words, as
quoted in Chen et al. (2020, p. 3398), “It is very necessary for the urban educated youth to go to
the countryside to be re-educated by the poor farmers!” SDYs were re-educated by means of being
condemned to hard labor and criticized for their so-called bourgeois thoughts, behavior, and
lifestyle. This belies the presumption that SDYs could contribute to rural human capital
accumulation.
10
Chen et al. (2020) overstate the total population in their defined treatment group. Derived from Table 2 in their paper (p. 3406), the total
population of this treatment group should be 181.58 million in all of the 1,843 counties with SDY information, which account for 90.4 percent of
the counties targeted for this study. Even if counties without SDY information are added and assumed to have the same population density of treated
cohorts as in counties with SDY information, it is clear that the total population of the treatment group cannot be more than 200.9 million
(=181.58/0.904), much lower than the 245 million claimed.
Electronic copy available at: https://ssrn.com/abstract=3876228
21
REFERENCES
An, Na. 2004. “Evolution of China’s Education System over 100 Years” (“Zhongguo xuezhi
bainian bianqian,” in Chinese), Research in Education (jiaoxue yanjiu), 27(6): 524-526.
Bernstein, Thomas. 1977. Up to the Mountains and Down to the Villages: The Transfer of Youth
from Urban to Rural China. Yale University Press.
Bonnin, Michel. 2013. The Lost Generation: The Rustication of China’s Educated Youth (1968-
1980), translated by Krystyna Horko, The Chinese University Press.
Chen, Yi, Ziying Fan, Xiaomin Gu, and Li-an Zhou. 2020. “Arrival of Young Talent: The Send-
Down Movement and Rural Education in China,” American Economic Review 110(11): 3393-3430.
Chen, Yi, Ziying Fan, Xiaomin Gu, and Li-an Zhou. 2021. “Arrival of Young Talent: The Send-
Down Movement and Rural Education in China: Reply,” SSRN Paper ID3787288.
Chen, Yi, Sheng Jiang, and Li-An Zhou. 2020. “Estimating Returns to Education in Urban China:
Evidence from a Natural Experiment in Schooling Reform.” Journal of Comparative Economics
48(1): 218–33.
Filmer, Deon, Halsey Rogers, Noam Angrist, and Shwetlena Sabarwal. 2020. “Learning-
adjusted years of schooling (LAYS): Defining a new macro measure of education,” Economics of
Education Review 77.
Gao, Bin. 1983. “On the Issue of Raising Pedagogical Quality of High Schools” (“Guanyu tigao
zhongxue jiaoxue zhiliang de wenti,” in Chinese), Journal of Capital Normal University (Social
Science Edition, 1983, Issue 04: 89-95.
Gong Gong, Gordon Liu, Ding Lu, James Wen, and Huizhong Zhou. 2020. “Was China’s
Send-Down Movement Really a Blessing for Rural Education and Economic Development?”
ShanghaiTech SEM Working Paper No. 2020-012, SSRN Paper ID3750613.
Gu, Hongzhang and Mengzhou Hu. 1996. The Beginning and End of China’s Send-Down
Movement of Educated Youths (Zhongguo zhishiqingnian shangshan xiaxiang shimo, in Chinese),
China Procuratorate Press.
Kaarsen, Nicolai. 2014. “Cross-Country Differences in the Quality of Schooling.” Journal of
Development Economics. 107: 215-224.
Han, D. 2001. Impact of the Cultural Revolution on Rural Education and Economic Development:
The Case of Jimo County. Modern China 27 (1), 59-90.
Hannum, Emily. 1999. “Political Change and the Urban-Rural Gap in Basic Education in China,
1949–1990.” Comparative Education Review 43 (2): 193–211.
Huang, Renxian. 2003. History of Education in China (Zhongguo jiaoyushi, in Chinese), Fujian
People’s Press.
Electronic copy available at: https://ssrn.com/abstract=3876228
22
Li, Hongbin, Mark Rosenzweig, and Junsen Zhang. 2010. “Altruism, Favoritism, and Guilt in
the Allocation of Family Resources: Sophie’s Choice in Mao’s Mass Send-Down Movement.”
Journal of Political Economy, 118 (1): 1-38.
Liu, Ya-qiu. 2008. “A Study on Traumas of Educated Youths and Rural-Urban Relationship”
(Zhiqing kunan yu chengxiang guanxi yanjiu, in Chinese), Bulletin of Qinghua University –
Philosophy and Social Sciences (Qinghua Daxue Xuebao), 23 (2): 135-150.
Liu, Xiaomeng. 2009. History of China’s ‘Educated Youth’: The Big Wave (Zhongguo zhiqing
shi: dachao, in Chinese), Contemporary China Publishing House.
MacFarquhar, Roderick and John K. Fairbank eds. 1991. The Cambridge History of China.
Volume 15, The People’s Republic of China, Part 2. Cambridge University Press.
Mao, Tse-Tung (Zedong). 1969. “Comrade Mao Tse-Tung on Educational Work: Education
Must Serve Proletarian Politics and be Combined with Productive Labor,” Chinese Education,
2:1-2, 35-67. dx.doi.org/10.2753/CED1061-193202010235.
Mao, Zedong. 1966. “Notes on the Report of Further Improving the Army’s Agricultural Work
by the Rear Service Department of the Military Commission,” May 7, 1966.
https://china.usc.edu/mao-zedong-“notes-report-further-improving-army’s-agricultural-work-
rear-service-department-military.
Meng, Xin, and R. G. Gregory. 2002. “The Impact of Interrupted Education on Subsequent
Educational Attainment: A Cost of the Chinese Cultural Revolution.” Economic Development and
Cultural Change 50 (4): 935–59.
Ministry of Education. 1981. “Notification on Some Issues of the Remedial Program for Staff
and Workers on Junior High School Education” (Guanyu zhigong chuzhong wenhua buke gongzuo
ruogan wenti de tongzhi, in Chinese), https://code.fabao365.com/law_264540_2.html.
Ministry of Education. 2015. “Main Events of Education in Fifty Years” (Jiaoyu wushi nian
dashi ji, in Chinese). http://old.moe.gov.cn/publicfiles/business/htmlfiles/moe/moe_163
/index.html.
Ministry of Education, All-China Federation of Trade Unions, Central Committee of
Communist Youth League, National Administrative Commission for Staff Education, and
State Labor Bureau. 1982. “Joint Notification on Effectively Optimizing Remedial Program for
Young Staff and Workers on Basic Education and Technical Training” (Guanyu qieshi gaohao
qingzhuangnian zhigong wenhua jishu buke gongzuo de lianhe tongzhi, in Chinese),
https://code.fabao365.com/law_264540_2.html.
National Bureau of Statistics of China. 1985. China Rural Statistical Yearbook (zhongguo
nongcun tongji nianjian, in Chinese). China Statistics Press.
National Bureau of Statistics of China. 2010. China Compendium of Statistics 1949-2008. China
Statistics Press.
Electronic copy available at: https://ssrn.com/abstract=3876228

23
Qian, Jiang. 2018. “Classes of 1977-78 – Celebrating 40th Anniversary of Reopening of
Universities and Colleges (Duju tese de qiqi-qiba ji daxuesheng, in Chinese),” Review of History
of the Party, www.zgdsw.com/newsx.asp?id=460.
Schneider, Silke L. 2016. “The Conceptualisation, Measurement, and Coding of Education in
German and Cross-National Surveys,” GESIS Survey Guidelines. Mannheim, Germany: GESIS –
Leibniz Institute for the Social Sciences. doi: 10.15465/gesis-sg_en_020.
Schoellman, Todd. 2012. “Education Quality and Development Accounting.” The Review of
Economic Studies. 79(1): 388–417. https://doi.org/10.1093/restud/rdr025
Shi, Yun, and Danhui Li. 2008. The History of the People’s Republic of China, Volume 8 (in
Chinese). The Chinese University of Hong Kong, Hong Kong.
Wang, Hui, W. Liang. 2014. “Development of Rural Basic Education During the Cultural
Revolution and Its Historical Perspective” (“wenge” Shiqi nongcun puji jiaoyu de fazhan jiqi lishi
renshi, in Chinese),” Journal of Inner Mongolia Normal University (Education Science), 27 (12):
1-4.
Wang, Youqin. 2009. “The Horror of ‘Red August’” (Kongbu de ‘hong bayue’, in Chinese),
Yanhuang Chun Qiu, 2009 no. 9, yhcqw.com/33/8055.html.
Wong, William Sheh. 1976. “The Educational Thought of Mao Tse-tung,” Social Studies, 67:1,
27-29, DOI: 10.1080/00220973.1943.11019449.
Xie, Yu, Yang Jiang, and Emily Greenman. 2008. “Did send-down experience benefit youth?
A reevaluation of the social consequences of forced urban–rural migration during China’s Cultural
Revolution.” Social Science Research 37 (2008): 686–700.
Yang, Dongping. 2005. “Evolution of China’s Education System and Education Policies
(Zhongguo jiaoyu zhidu he jiaoyu zhengce de bianqian, in Chinese),”
www.aisixiang.com/data/6728-2.html.
Yang, Juan and Shi Li. 2011. “Impact of Send-down Experience on Income of the Sent-down
Youth (Xiaxiang jingli dui zhiqing shouru de yingxiang, in Chinese), World Economic Papers,
2011 No. 5: 50-63.
Yeh, K.C.1984, “Macroeconomic Changes in the Chinese Economy During the Readjustment.”
China Quarterly, 100: 691-716.
Zhang, Jian. 1984. China Education Yearbook 1949-1981. China Encyclopedia Press.
Zhou, Quanhua. 2004. “The Education Revolution during the ‘Cultural Revolution’ (‘wenhua da
geming’ qijian de jiaoyu geming, in Chinese),” in Guo Dehong, Wang Haiguang, and Hangang
eds. Historical Event Reader of the People’s Republic of China (zhonghua renmin gongheguo
zhuanti shigao, in Chinese), vol. III, Sichuan People’s Press, 353-384.
Electronic copy available at: https://ssrn.com/abstract=3876228

24
Zhou, Weina. 2013. “How Does a Traumatic Experience During Youth Affect Life Later? The
Long-term Impact of the Send-down Program During the Chinese Cultural Revolution,” Dalhousie
University. https://editorialexpress.com/cgi-bin/conference/download.cgi.
Zhou, Xueguang and Liren Hou. 1999. “Children of the Cultural Revolution: The State and the
Life Course in the People's Republic of China.” American Sociological Review, 64(1):12-36.
Electronic copy available at: https://ssrn.com/abstract=3876228

25
Appendix: Code and Data for Replication
In this Appendix, we provide STATA codes for interested readers to replicate and verify our
results, together with a guide to data access.
Data source
1. The data on the “sent-down youths” (SDYs), rural residents and the 1990 population
census of China used in this paper is from the integrated and cleaned dataset provided by Chen,
Fan, Gu and Zhou (2020). “census_1990_clean.dta” is the data file and can be downloaded from
openICPSR repository for the American Economic Association Data and Code Repository under
the project reference number: openicpsr-119690, or be accessed via:
https://www.openicpsr.org/openicpsr/project/119690/version/V1/view.
The data is deposited in the folder “SourceData”.
2. The data on primary and secondary schools and enrollment (1978-1984) is drawn upon
two Chinese books “China Compendium of Statistics 1949-2008” (China Statistics Press) and
“China Rural Statistical Yearbook 1985” (China Statistics Press). The electronic versions of
books can be downloaded from: https://www.cnki.net/. The numbers are used to generate Table 1
(Changes of Primary and Secondary Schools 1978-1984) and Table 6 Column 1 (School Dropout
Rates Compared) in our paper.
Software
Data and replication code are provided in Stata format. Stata 14 or later is generally
adequate. Software preparation follows instructions provided by Chen et al. (2020):
https://www.openicpsr.org/openicpsr/project/119690/version/V1/view?path=/openicpsr/1
19690/fcr:versions/V1/README.pdf&type=file#
You may also need to install user-written command:
ssc install logout, replace.
Do files
1. Place “census_1990_clean.dta” and all related do-files labels in the working directory.
2. Run “SDY_Effect_Census1990.do”. This do-file is built on the code
“1_Table_Census_1990.do" in the AEA Data and Code Repository provided by Chen et al.
Electronic copy available at: https://ssrn.com/abstract=3876228
26
(2020). This do-file carries out the analysis using the “census_1990_clean.dta” dataset and
generate the following outputs in order:
- Table2.txt Columns (1)-(7) (The Effect of SDYs on Educational Attainment in Rural Areas
with Quality Adjustment for Treated Cohorts under the 6-3-3 Schooling System)
- Table3.txt Columns (1)-(7) (The Effect of SDYs on Educational Attainment in Rural Areas
with Schooling Years Recoded to the 5-2-2 Schooling System and Quality Adjustment for
Related Cohorts)
- Table4.txt Columns (3)--(4) (The effect of SDYs on Illiteracy and Educational Attainment
of Rural Children)
- Table5_pannelA.txt and Table5_pannelB.txt (Data Inconsistencies Observed in Rural
Samples)
- Table6_primary.txt,Table6_junior.txt, Table6_primary_adj.txt, and Table6_junior_adj.txt,
(Columns (2)--(3) in Table 6: School Dropout Rates Compared)
- Table7.txt Columns (1)--(3) (The SDY Effect on Educational Attainment of Rural Children
after Adjustments to Data Inconsistencies in Counties in the 95th Percentile of SDY Densities)
- Figure1_1.txt and Figure1_2.txt. These two generated data files are for plotting Figure 1
(The Effect of SDYs on Illiteracy and Educational Attainment of Rural Children) using the code
“Figure.do”.
3. Run “Figure.do”. This do-file plots Figure 1 in the paper.
- Figure1_1.pdf (Average Schooling Years by Cohort and SDY's Density)
- Figure1_2.pdf (Ratio of Zero Schooling Year by Cohort)
STATA code “SDY_Effect_Census1990.do”
********************************************************************************
* Step 1: Data Preparation
********************************************************************************
use "census_1990_clean.dta", clear
*******************
*Control:1946-1955*
*Treat: 1956-1969*
*******************
gen treat = inrange(year_birth,1956,1969) if inrange(year_birth,1946,1969)
drop if treat == .
******************
* Define Globals *
******************
global var_abs_cohort "region1990 prov#year_birth c.primary_base#year_birth c.junior_base#year_birth"
Electronic copy available at: https://ssrn.com/abstract=3876228

27
global var_abs_cohort2 "region1990 prov#year_birth c.primary_base_older#year_birth /*
*/ c.junior_base_older#year_birth"
sort countyid, stable
by countyid: gen id_cty = _n
sum sdy_density if id_cty == 1 & rural == 1, detail
gen idx_sdy_p95 = sdy_density >= r(p95) // 95th percentile index for sdy densisty
label variable idx_sdy_p95 "95th percentile of sdy density"
keep if rural==1 // We only use the rural sample
********************************************************************************
* Step 2: Results
********************************************************************************
*********************************************************************************************
* Table 2: The Effect of SDYs on Educational Attainment in Rural Areas with Quality Adjustment for Treated Cohorts
* under the 6-3-3 Schooling System
* Columns (1)--(7) where column (1) is the replication of the main result in Chen et al. (2020)
********************************************************************************************
forvalues i = 1/7 {
gen yedu2_`i'= yedu*(1-(`i'-1)/10)*treat + yedu*(1-treat)
reghdfe yedu2_`i' c.sdy_density#c.treat male han_ethn if (rural==1& year_birth<=1969 & /*
*/ year_birth >= 1946 ), absorb($var_abs_cohort) cluster(region1990)
summ yedu2_`i' if e(sample) & treat== 1
local mean = r(mean)
if (`i' == 1) outreg2 using "Table2.txt", replace se nonotes nocons noaster nolabel text /*
*/ addstat(Mean,`mean') keep(c.sdy_density#c.treat )
if (`i'!= 1) outreg2 using "Table2.txt", append se nonotes nocons noaster nolabel text /*
*/ addstat(Mean,`mean') keep(c.sdy_density#c.treat)
}
******************************************************************************************
* Table 3: The Effect of SDYs on Educational Attainment in Rural Areas with Schooling
* Years Recoded to the 5-2-2 Schooling System and Quality Adjustment for Related Cohorts
* Columns (1)--(7) where column (1) is the replication of the main result in Chen et al. (2020)
*******************************************************************************************
gen yedu_522 = yedu
replace yedu_522 = 2.5 if treat ==1 & yedu ==3
replace yedu_522 = 5 if treat ==1 & yedu == 6
replace yedu_522 = 6 if treat ==1 & yedu == 7
replace yedu_522 = 7 if treat ==1 & yedu == 9
replace yedu_522 = 8 if treat ==1 & yedu == 10
replace yedu_522 = 9 if treat ==1 & yedu == 12
replace yedu_522 = yedu-3 if treat ==1 & yedu > 12
forvalues i = 1/7 {
if (`i'==1) gen yedu3_`i'= yedu
if (`i' == 2) gen yedu3_`i' = 0.7701*yedu*treat + yedu*(1-treat)
if (`i' > 2) gen yedu3_`i' = yedu_522*(1-(`i'-3)/10)*treat + yedu_522*(1-treat)
reghdfe yedu3_`i' c.sdy_density#c.treat male han_ethn if (rural==1& year_birth<=1969 & /*
*/ year_birth >= 1946 ) , absorb($var_abs_cohort) cluster(region1990)
summ yedu3_`i' if e(sample) & treat== 1
local mean = r(mean)
if (`i' == 1) outreg2 using "Table3.txt", replace se nonotes nocons noaster nolabel text /*
Electronic copy available at: https://ssrn.com/abstract=3876228

28
*/ addstat(Mean,`mean') keep(c.sdy_density#c.treat )
if (`i'!= 1) outreg2 using "Table3.txt", append se nonotes nocons noaster nolabel text /*
*/ addstat(Mean,`mean') keep(c.sdy_density#c.treat)
}
******************************************************************************************
* Table 4: The effect of SDYs on Illiteracy and Educational Attainment of Rural Children
* Columns (3)--(4)
*******************************************************************************************
gen yedu_prv = yedu // generate enducation in Gong et al (2020)
replace yedu_prv = yedu-primary_graduate-junior_graduate-(yedu>=12) if treat==1&primary_graduate == 1
replace yedu_prv = 2.5 if treat==1&primary_graduate ~= 1
gen yedu_0 = (yedu == 0) // illiteracy dummy
forvalues i = 3/4 {
if (`i'==3) gen yedu4_`i'= yedu_prv
if (`i' == 4) gen yedu4_`i' = yedu_0
reghdfe yedu4_`i' c.sdy_density#c.treat male han_ethn if (rural==1& year_birth<=1969 & /*
*/ year_birth >= 1946 ), absorb($var_abs_cohort) cluster(region1990)
summ yedu4_`i' if e(sample) & treat== 1
local mean1 = r(mean)
summ yedu4_`i' if e(sample) & treat== 0
local mean2 = r(mean)
if (`i' == 3) outreg2 using "Table4.txt", replace se nonotes nocons noaster nolabel /*
*/ text addstat(Mean_treat,`mean1', Mean_contl, `mean2') keep(c.sdy_density#c.treat )
if (`i'!= 3) outreg2 using "Table4.txt", append se nonotes nocons noaster nolabel /*
*/ text addstat(Mean_treat,`mean1',Mean_contl, `mean2') keep(c.sdy_density#c.treat)
}
********************************************************************************************
* Table 5: Data Inconsistencies Observed in Rural Samples
********************************************************************************************
* ssc install logout
logout, save(Table5_pannelA) word replace: bysort treat: tab yedu if (primary_graduate==0)
logout, save(Table5_pannelB) word replace: bysort treat: tab yedu if (primary_graduate == 1 & /*
*/ junior_graduate == 0)
*******************************************************************************************
* Table 6: School Dropout Rates Compared
* Columns (2)-(3)
*******************************************************************************************
gen idx_primy_drop = (yedu == 3) // primary-school dropout index
label variable idx_primy_drop "primary school dropout"
logout, save(Table6_primary) word replace: bysort treat: tab idx_primy_drop if yedu ~= 0
gen idx_junior_drop = (yedu == 7) // junior-high dropout index
label variable idx_junior_drop "junior high dropout"
logout, save(Table6_junior) word replace: bysort treat: tab idx_junior_drop if yedu > 6
gen idx_primy_drop_adj = (yedu == 3|(yedu==6 & primary_graduate == 0)) // adjusted primary-school dropout index
label variable idx_primy_drop_adj "adjusted primary school dropout"
Electronic copy available at: https://ssrn.com/abstract=3876228
29
logout, save(Table6_primary_adj) word replace: bysort treat: tab idx_primy_drop_adj if yedu ~= 0
gen idx_junior_drop_adj = (yedu == 7| (yedu ==9 & junior_graduate == 0)) // junior-high dropout index
label variable idx_junior_drop_adj "adjusted junior high dropout"
logout, save(Table6_junior_adj) word replace: bysort treat: tab idx_junior_drop_adj if yedu > 6
********************************************************************************************
* Table 7: The SDY Effect on Educational Attainment of Rural Children after Adjustments to Data Inconsistencies
* in Counties in the 95th Percentile of SDY Densities
* Columns (2)-(3)
********************************************************************************************
* adjusted schooling years for inconsistent data, 6 to 3 and 9 to 7
gen yedu_69_adj_37 = yedu
replace yedu_69_adj_37 = 3 if treat == 1 & primary_graduate ~= 1 & yedu == 6 & idx_sdy_p95 == 1
replace yedu_69_adj_37 = 7 if treat == 1 & junior_graduate == 0 & yedu == 9 & idx_sdy_p95 == 1
* adjusted schooling years for inconsistent data, 6 to 0 and 9 to 6
gen yedu_69_adj_06 = yedu
replace yedu_69_adj_06 = 0 if treat == 1 & primary_graduate ~= 1 & yedu == 6 & idx_sdy_p95 == 1
replace yedu_69_adj_06 = 6 if treat == 1 & junior_graduate == 0 & yedu == 9 & idx_sdy_p95 == 1
forvalues i = 1/3 {
if (`i'== 1) gen yedu7_`i'= yedu
if (`i'== 2) gen yedu7_`i'= yedu_69_adj_37
if (`i' == 3) gen yedu7_`i' = yedu_69_adj_06
reghdfe yedu7_`i' c.sdy_density#c.treat male han_ethn if (rural==1& year_birth<=1969 & /*
*/ year_birth >= 1946 ), absorb($var_abs_cohort) cluster(region1990)
summ yedu7_`i' if e(sample) & treat== 1
local mean1 = r(mean)
summ yedu7_`i' if e(sample) & treat== 0
local mean2 = r(mean)
if (`i' == 1) outreg2 using "Table7.txt", replace se nonotes nocons noaster nolabel /*
*/ text addstat(Mean_treat,`mean1', Mean_contl, `mean2') keep(c.sdy_density#c.treat )
if (`i'!= 1) outreg2 using "Table7.txt", append se nonotes nocons noaster nolabel /*
*/ text addstat(Mean_treat,`mean1',Mean_contl, `mean2') keep(c.sdy_density#c.treat)
}
****************************************************************************************
* Inputs for Figure 1:
* The Effect of SDYs on Illiteracy and Educational Attainment of Rural Children
****************************************************************************************
sum sdy_density if id_cty == 1, detail
gen sdy_25lth = (sdy_density < r(p25))
label variable sdy_25lth "lower density regions of SDYs"
gen sdy_50th = (sdy_density >= r(p25) & sdy_density < r(p75))
label variable sdy_50th "middle density regions of SDYs"
gen sdy_75hth = (sdy_density >= r(p75))
label variable sdy_75hth "upper density regions of SDYs"
outsum yedu year_birth sdy_25lth if year_birth == 1946 & sdy_25lth == 1 using "Figure1_1.txt", replace
outsum yedu year_birth sdy_50th if year_birth == 1946 & sdy_50th == 1 using "Figure1_1.txt", append
outsum yedu year_birth sdy_75hth if year_birth == 1946 & sdy_75hth == 1 using "Figure1_1.txt", append
Electronic copy available at: https://ssrn.com/abstract=3876228

30
forvalues i = 1947/1969 {
outsum yedu year_birth sdy_25lth if year_birth == `i' & sdy_25lth == 1 using "Figure1_1.txt", append
outsum yedu year_birth sdy_50th if year_birth == `i' & sdy_50th == 1 using "Figure1_1.txt", append
outsum yedu year_birth sdy_75hth if year_birth == `i' & sdy_75hth == 1 using "Figure1_1.txt", append
}
*****************************************************************************************
bysort year_birth sdy_25lth sdy_50th sdy_75hth yedu_0: gen ns0 = _N
label variable ns0 "observations by birthyear density and education zero"
bysort year_birth sdy_25lth sdy_50th sdy_75hth: gen ns = _N
label variable ns "observations by birthyear density"
gen ratio_0 = ns0/ns
outsum ratio_0 year_birth sdy_25lth if year_birth==1946& yedu == 0 & sdy_25lth == 1 using "Figure1_2.txt", replace
outsum ratio_0 year_birth sdy_50th if year_birth==1946& yedu == 0 & sdy_50th == 1 using "Figure1_2.txt", append
outsum ratio_0 year_birth sdy_75hth if year_birth==1946& yedu == 0 & sdy_75hth == 1 /*
*/ using "Figure1_2.txt", append
forvalues i = 1947/1969 {
outsum ratio_0 year_birth sdy_25lth if year_birth==`i'& yedu == 0 & sdy_25lth == 1 using "Figure1_2.txt", append
outsum ratio_0 year_birth sdy_50th if year_birth==`i'& yedu == 0 & sdy_50th == 1 using "Figure1_2.txt", append
outsum ratio_0 year_birth sdy_75hth if year_birth==`i'& yedu == 0 & sdy_75hth == 1 using "Figure1_2.txt", append
}
STATA code “Figure.do”
/*
This do-file plots the figure 1 in the paper.
Input data files:
Figure1_1.txt, generated from SDY_Effect_Census1990.do
Figure1_2.txt, generated from SDY_Effect_Census1990.do
Output files:
Figure1_1.pdf, Average Schooling Years by Cohort and SDY's Density
Figure1_2.pdf, Ratio of Zero Schooling Year by Cohort
*/
*****************************************************************************************
* Figure 1.1: Average Schooling Years by Cohort and SDY's Density
*****************************************************************************************
insheet using "Figure1_1.txt", clear
keep if inrange(_n,2,12)
destring, force replace
drop v1
xpose, clear
drop v2 v4 v6 v8 v10
sort v3 v5 v7 v9 v11
twoway line v1 v3 if v5==1, lpattern(dash_dot) lwidth(thick) lcolor(gs8) yaxis(1) ///
| | line v1 v3 if v7 == 1, lpattern(longdash_dot) lwidth(thick) lcolor(blue) yaxis(1) ///
| | line v1 v3 if v9 == 1, lpattern(solid) lwidth(thick) lcolor(black) yaxis(1) ///
| |, graphregion(fcolor(gs16) lcolor(gs16)) plotregion(lcolor(gs16) margin(zero)) ///
legend(label(1 "lower density regions of SDYs") label(2 "middle density regions of SDYs") ///
label(3 "upper density regions of SDYs")) ///
xlabel(1945(1)1970, labsize(small) angle(45) format(%12.0f)) xtitle("Birth Cohort") ///
ylabel(4.5(0.5)8, labsize(small) angle(0) format(%12.0f)) ytitle(" Years of Schooling") ///
Electronic copy available at: https://ssrn.com/abstract=3876228
31
xline(1955) ///
title("Average Schooling Years by Cohort and SDY's Density",size(medium))
graph export "Figure1_1.pdf",replace
*****************************************************************************************
* Figure 1.2: Ratio of Zero Schooling Year by Cohort
*****************************************************************************************
insheet using "Figure1_2.txt", clear
keep if inrange(_n,2,12)
destring, force replace
drop v1
xpose, clear
drop v2 v4 v6 v8 v10
sort v3 v5 v7 v9 v11
twoway line v1 v3 if v5==1, lpattern(dash_dot) lwidth(thick) lcolor(gs8) yaxis(1) ///
| | line v1 v3 if v7 == 1, lpattern(longdash_dot) lwidth(thick) lcolor(blue) yaxis(1) ///
| | line v1 v3 if v9 == 1, lpattern(solid) lwidth(thick) lcolor(black) yaxis(1) ///
| |, graphregion(fcolor(gs16) lcolor(gs16)) plotregion(lcolor(gs16) margin(zero)) ///
legend(label(1 "lower density regions of SDYs") label(2 "middle density regions of SDYs") ///
label(3 "upper density regions of SDYs")) ///
xlabel(1945(1)1970, labsize(small) angle(45) format(%12.0f)) xtitle("Birth Cohort") ///
ylabel(0.03(0.05)0.3, labsize(small) angle(0) format(%12.02f) axis(1)) ytitle("Ratio") ///
xline(1955) ///
title("Ratio of Zero Schooling Year by Cohort",size(medium) margin(zero))
graph export "Figure1_2.pdf", replace
Electronic copy available at: https://ssrn.com/abstract=3876228


![[XLS]tax.vermont.govtax.vermont.gov/sites/tax/files/documents/SPAN Data List... · Web view015-005-10947 015-005-10091 015-005-11649 015-005-10773 015-005-11222 015-005-10889 015-005-11109](https://img.dokumen.tips/doc/110x75/5ac161e67f8b9a5a4e8d129a/xlstax-data-listweb-view015-005-10947-015-005-10091-015-005-11649-015-005-10773.jpg)


![[005-2016-MINEDU]-[18-03-2016 12_19_52]-005-Convenio N° 005-2016-MINEDU](https://img.dokumen.tips/doc/110x75/577c7d821a28abe0549f0579/005-2016-minedu-18-03-2016-121952-005-convenio-n-005-2016-minedu.jpg)