Embed Size (px)
Citation preview
13th World Conference on Earthquake Engineering Vancouver, B.C., Canada
August 1-6, 2004 Paper No. 3231
SHAKING TABLE MODEL TESTING ON DYNAMIC SOIL-STRUCTURE INTERACTION SYSTEM
Xilin Lu1, Peizhen Li2, Yueqing Chen3 and Bo Chen4
SUMMARY Shaking table model tests on dynamic Soil-Structure Interaction (SSI) system are described in this paper. In the design and fabrication of the test models, the similitude formulas and similitude factors of all physical quantities are studied. Through controlling the ratio between diameter of the container and plan size of the structure, and using a flexible container, the box effect resulted from the boundary conditions is minimized. The simulation design of soil boundary is proved considerably effective in present SSI tests. Nine specimens are designed and fabricated, including 5 pile foundations, 3 box foundations and 1 fixed base. Single column with mass block on top and 12-story cast-in-place R.C. frame model are used as superstructure, and Shanghai soft soil is employed as model soil. The test results are analyzed and simulated in detail with ANSYS program. The simulation results show that the three-dimensional finite element model is proper for the analysis of SSI problem. In the simulation analysis, commonly used equivalent linearity model is chosen to consider the non-linearity of soil, and the changing-status non-linearity on soil-structure interface is considered by surface-to-surface contact element. The flexible soil container and influence of gravity are also simulated properly in the analysis. Key Words: Soil-structure interaction, Shaking table, Model testing, Nonlinear behavior.
INTRODUCTION In the last 30 years, the effect of SSI on earthquake response of structures has attracted an intensive interest among researchers and engineers. Most of these researches focus on theoretical study and analysis, while less has been done on the experimental study. More importantly, many theoretical outcomes have not been verified to achieve a general accuracy for practical use. In the recent decade some countries such as Japan and America have set a start to carry out site tests and shaking table model tests on dynamic SSI system (References [1]~[8]). With the development of model similitude theory and structural seismic testing technology, shaking table model test has played more and more important role 1 Professor, State Key Lab. for Disaster Reduction in Civil Eng., Tongji Univ., Shanghai, 200092, China.
Email: [email protected] 2 Lectuer, State Key Lab. for Disaster Reduction in Civil Eng., Tongji Univ., Shanghai, 200092, China. 3 Associate Professor, Institute of Civil Eng., Wuhan Univ., Wuhan, 430072, China. 4 Engineer, Office of Guangzhou Construction Science & Technology Committee, Guangzhou, 510030,
China.

on the research of SSI. However, this kind of test is rather difficult due to its complexity. This paper presents the shaking table model tests on dynamic SSI system in detail, including similitude design of test models, simulation of soil boundary condition, design and fabrication of test models, arrangement of measuring points and test loading schedules. The summary of test results is presented briefly as well. Based on shaking table model tests and combining general-purpose finite element program ANSYS, three-dimensional finite element analysis on soil-structure test is also described in this paper.
SHAKING TABLE TESTS AND RESULTS Similitude Design of Models The reliability of model tests depends on whether the model can represent the real behavior of the prototype system. In the shaking table model test on SSI, similitude law should also be taken into account. However, only similitude design of superstructure and foundation is generally taken into account in former tests, while the similitude simulation of soil is often ignored due to the complexity and particularity of soil (see Aso [1]). A certain kind of material, such as sand, is often selected as soil material. So there is rather large difference between model and real SSI system. In order to reproduce the real behavior of prototype furthest, similitude design of the test model is performed herein. The test objectives and arrangement are shown in Table 1.
Table 1 Test Objectives and Arrangement
Phase Test
Code Model Scale
Soil Foundation Superstructure Test Content
FF20S FF20 FF10
1/20 1/20 1/10
Uniform Soil Uniform Soil Uniform Soil
- - -
- - -
FF FF FF
Ⅰ PC20S PC20 PC10 BC20 BC10
1/20 1/20 1/10 1/20 1/10
Uniform Soil Uniform Soil Uniform Soil Uniform Soil Uniform Soil
Pile Pile Pile Box Box
Column with Mass Column with Mass Column with Mass Column with Mass Column with Mass
SPSI SPSI SPSI SBSI SBSI
PS20 PS10 BS10
1/20 1/10 1/10
Layered Soil Layered Soil Layered Soil
Pile Pile Box
12-Story Frame 12-Story Frame 12-Story Frame
SPSI SPSI SBSI
Ⅱ
S10 1/10 - - 12-Story Frame FS Note: (1) Test Content: FF--Test of free field; SPSI--Test of soil-pile foundation-superstructure interaction; FS--Test of a frame structure on the fixed base; SBSI--Test of soil-box foundation-superstructure interaction; (2) When a single column with mass block on its top is used as superstructure, the mass block is adjusted in the test. To study the seismic characteristics and response of the dynamic SSI system, the similitude design of test models is based on the following principles. (1) The same similitude relation is applied to soil, foundation and superstructure. (2) Distortion of gravity is permitted. The method of adding additional weight is not adopted in present study in that it is almost impossible to be realized in soil and pile foundations. (3) Parameters of dynamic loads are controlled to meet the performance requirements of shaking table. (4) Requirements of construction and capacity of equipment must be accessible in laboratory. Consequently, non-gravity model with similitude rules controlled materials is adopted in present test. Similitude formulas and similitude factors of all physical quantities are induced from Bockingham π theorem (see Table 2). A 12-story cast-in-place frame is used as prototype superstructure, and Shanghai soft soil is selected as prototype soil. Thus, the prototype system can be regarded as a typical small high-
rise building system of Shanghai. The scales of models are 1/10 and 1/20, respectively. The similitude factor of mass density is 1, and the similitude factors of elasticity modulus for both soil and structure are 1/4.
Table 2 Dynamic Similitude Relation of Models Similitude Factor
Physical Quantity Similitude Formula Soil Foundation Superstructure
Remark
Material Parameter
Strainε Stressσ
Young’s modulus E Poisson ratioμ
Densityρ
Sε=1.0 Sσ=SE
SE Sμ=1.0
Sρ
1 1/4 1/4 1 1
1 1/4 1/4 1 1
1 1/4 1/4 1 1
CP
CP
CP
Geometry Parameter
Length l Area S
Linear displacement X Angular displacement β
Sl
SS=Sl2
SX=Sl Sβ=1.0
1/10 1/100 1/10
1
1/10 1/100 1/10
1
1/10 1/100 1/10
1
CP
Load Parameter
Concentrated force P Area load q
SP=SESl2
Sq=SE 1/400 1/4
1/400 1/4
1/400 1/4
Dynamic Parameter
Mass m Rigidity k
Time t Frequency f Damping c Velocity v
Acceleration a
Sm=SρSl3
Sk=SESl St=(Sm/Sk)
1/2
Sf=1/St Sc=Sm/St Sv=Sl/St Sa=Sl/St
2
1/1000 1/40 0.2 5
0.005 0.5 2.5
1/1000 1/40 0.2 5
0.005 0.5 2.5
1/1000 1/40 0.2 5
0.005 0.5 2.5
CPDL CPDL
CPDL Note: CP-- Control parameter of model design; CPDL-- Control parameter of dynamic load Simulation of Soil Boundary Condition The simulation of soil boundary condition plays a key role in the validity of the test design. In shaking table tests, model soil cannot be held in an infinite dimension box. Due to wave reflection on the boundary and variation of system vibration mode, certain error so called ‘box effect’ will occur in test results. In order to reduce the box effect, a flexible container and the proper constructional details are designed in model test, and the ratio between ground plane diameter D and structure plane size d is taken as 5 by controlling the size of the structure plane (Lou [9]). The cylindrical container is 3000mm in diameter and its lateral rubber membrane is 5mm in thickness, and the reinforcement of Φ4@60 is used to strengthen the outside of the container. The lateral side of the cylinder is fixed with the upper ring plate and the base plate by bolt. The upper ring plate is supported by four columns fixed on the base plate. Height adjustable screw rod is installed on the column to adjust the upper plate to horizontality and adjust the cylinder to a proper state. A universal joint is installed on the column top to enable the ring plate to displace laterally. The base plate is made of steel plate. In order to minimize relative slip between the soil and the container on the base surface, a kind of crushed rock is bonded to the base steel plate by epoxy resin to make the surface rough. Fig.1 shows the flexible container used in present test. In order to verify the rationality of the flexible container simulation method, three free field-shaking table tests are performed. Shanghai soft soil is used as the model soil. The soil in test FF20s, FF20 and FF10 is 0.8m, 0.8m and 1.6m in depth respectively. The container with soil is excited with two levels of intensity of El Centro earthquake record and Shanghai artificial wave. Fig.2 shows the curves of relation between the amplification coefficient and the boundary distance (the amplification coefficient is the ratio between the acceleration peak value of each measuring point on the soil

surface and the acceleration peak value excited at the container base). In the figure, it is obvious that the boundary influence exists in the region near the boundary, whereas, the acceleration amplification coefficient of each measuring point tends to uniformity in the region certain distance off the boundary, which indicates that the boundary influence becomes insignificant. Fig.3 shows the acceleration time-history curves of soil surface measuring point S19 and S6 under EL1 excitation. Measuring point S19 is in the center, while measuring point S6 is 0.6m off the boundary. The consistency of two acceleration time-history curves demonstrates that the boundary influence on measuring point S6 is very small. The same phenomenon is found when comparing the response of corresponding measuring points in soil at a certain depth. This indicates that the design of the container is rational in minimizing the box effect, although the boundary condition still brings some influence on the edge region.
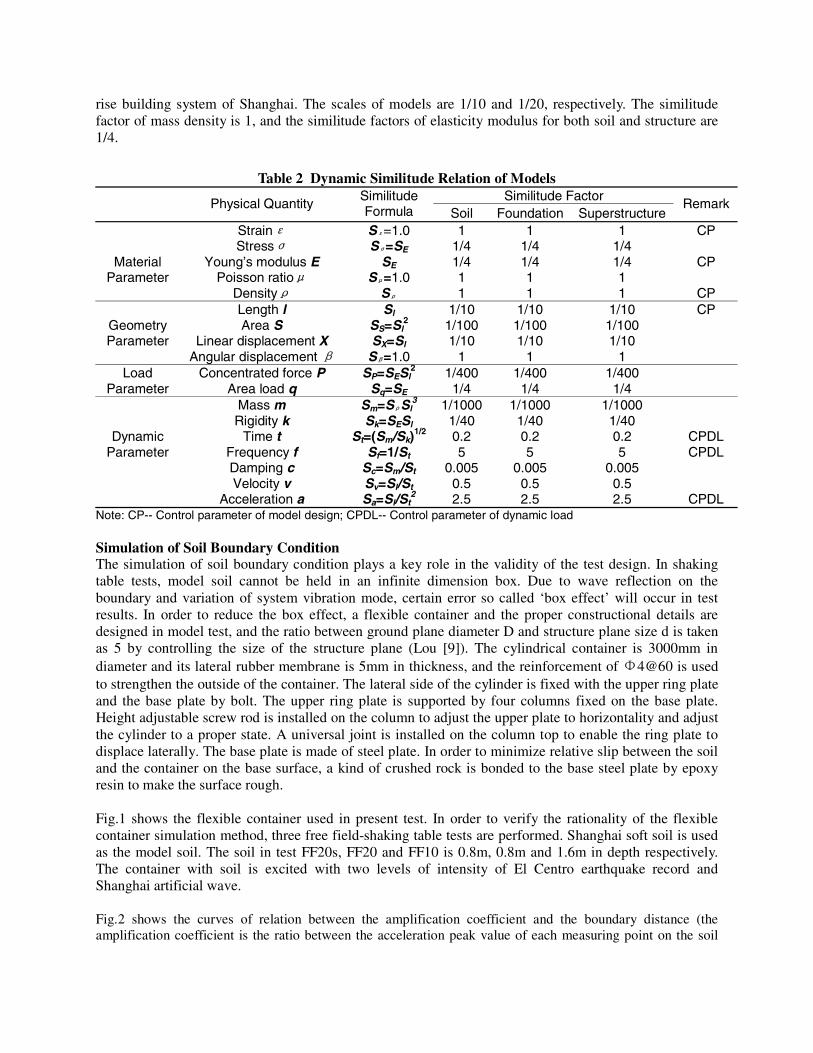
Design and Fabrication of the Models Having taken the test purpose, test condition, model material, and construction technique into account, 3x3-group piles foundation and box foundation are adopted in present tests. Foundation and soil are designed according to the similitude relation. The scaling factors of two models are 1/10 and 1/20, respectively. The tests are implemented in two phases (see Table 1). In the first phase, a single column with mass block on top is used as superstructure. In order to simulate different superstructures, the mass block on the column top is adjusted to change the dynamic characteristics. Four kinds of mass blocks, namely, A (80kg), B (160kg), C (320kg) and D (480kg), are used in 1/10 model tests; while A (10kg), B (20kg), C (40kg) and D (60kg) are used in 1/20 model tests. In the second phase, a 12-story reinforced concrete
300 600 900 1200 15000.0
0.4
0.8
1.2
1.6 EL1 EL2 SH1 SH2
Am
plifi
catio
n C
oeff
icie
nt o
f Acc
.Distance of Measuring Point to Boundary (mm)
Fig.2 Relationship between Acceleration Amplification Coefficient of Each Points on
Soil Surface and its Location (Test FF10) Fig.1 Sketch of Flexible Container
Used in Present Test
Fig.3 Acceleration Time-history of Measuring Point S19, S6 in Test FF20S under Excitation EL1
0 1 2 3 4 5 6
-0.2
-0.1
0.0
0.1
0.2
0.3 S6 S19
Acc
eler
atio
n(g
)
Time(sec)
Fig.5 Typical dd GG γ~0 and dD γ~
curves of Shanghai soft soil
1E-6 1E-5 1E-4 1E-3 0.010.00
0.25
0.50
0.75
1.00
D-rd
G-rd
Gd
/ G0
rd
0
4
8
12
16
D (%
)
frame structure with single span is employed to simulate the superstructure. The layout and reinforcement details of the models are shown in Fig.4.
22
Shaking Direction
55
44
Shaking Direction
33
1 1
Mass
2 2
Shaking Direction
11
Mass
t1
3-3
L
t1 t1
B5 B5
5-5
G1
B9 G2
4-4
F1
B8
B6
B7 F2
2-2
B6
E
B4 E
B1
1-1
B3
C
B2 D
33
5 5
44
Parameter 1/10 model 1/20 model H 1600 800
H1 300 150 H2 300 150 h1 1500 750 h2 100 50 h3 1200 600 h4 360 180 h5 3600 1800 C 180 90 D 140 70 E 45 22.5 F1 30 15 F2 60 30 G1 50 25 G2 60 30 L 650 325 t1 50 25 t2 60 30 t3 40 20 B1 Φ12 Φ6 B2 Φ4@80 Φ2.11@40 B3 Φ2.11 Φ1.20 B4 Φ0.9@15 Φ[email protected] B5 Φ1.6@15 Φ[email protected] B6 Φ2.11 Φ1.20 B7 Φ0.9@20 Φ0.71@10 B8 Φ2.11 Φ1.20 B9 Φ0.9@15 Φ[email protected]
Fig.4 Model Layout and Reinforcement Detail
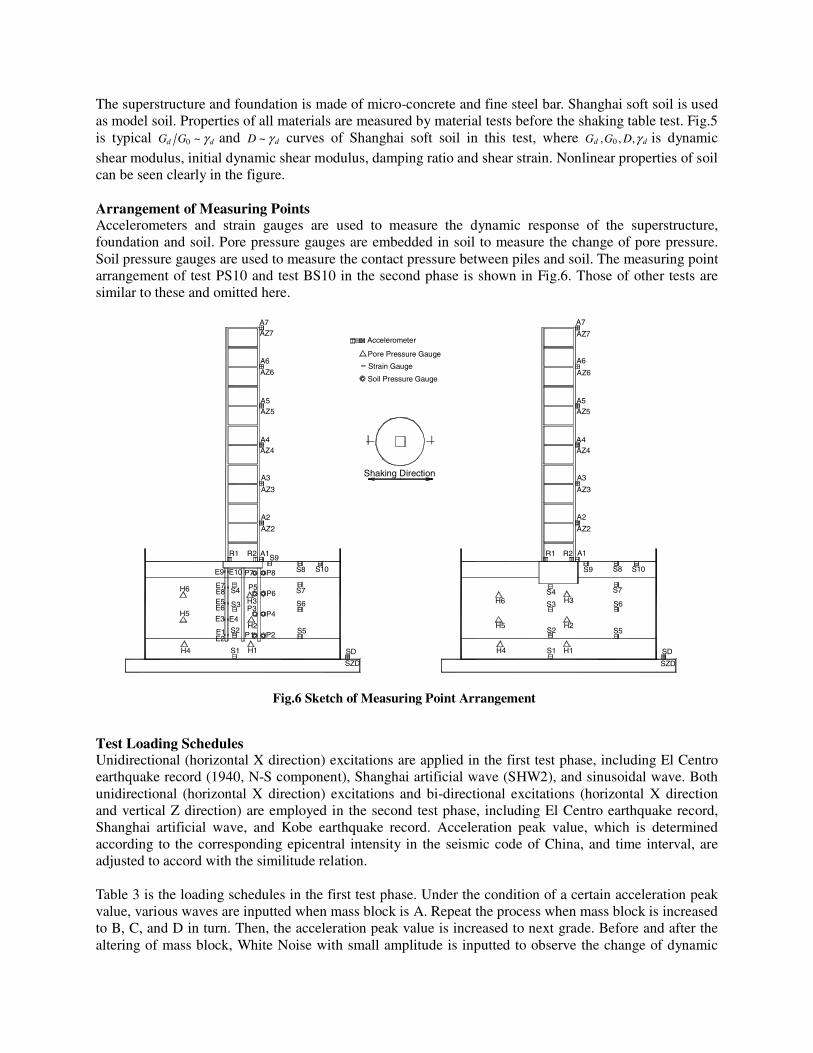
The superstructure and foundation is made of micro-concrete and fine steel bar. Shanghai soft soil is used as model soil. Properties of all materials are measured by material tests before the shaking table test. Fig.5 is typical dd GG γ~0 and dD γ~ curves of Shanghai soft soil in this test, where dd DGG γ,,, 0 is dynamic shear modulus, initial dynamic shear modulus, damping ratio and shear strain. Nonlinear properties of soil can be seen clearly in the figure. Arrangement of Measuring Points Accelerometers and strain gauges are used to measure the dynamic response of the superstructure, foundation and soil. Pore pressure gauges are embedded in soil to measure the change of pore pressure. Soil pressure gauges are used to measure the contact pressure between piles and soil. The measuring point arrangement of test PS10 and test BS10 in the second phase is shown in Fig.6. Those of other tests are similar to these and omitted here.
Test Loading Schedules Unidirectional (horizontal X direction) excitations are applied in the first test phase, including El Centro earthquake record (1940, N-S component), Shanghai artificial wave (SHW2), and sinusoidal wave. Both unidirectional (horizontal X direction) excitations and bi-directional excitations (horizontal X direction and vertical Z direction) are employed in the second test phase, including El Centro earthquake record, Shanghai artificial wave, and Kobe earthquake record. Acceleration peak value, which is determined according to the corresponding epicentral intensity in the seismic code of China, and time interval, are adjusted to accord with the similitude relation. Table 3 is the loading schedules in the first test phase. Under the condition of a certain acceleration peak value, various waves are inputted when mass block is A. Repeat the process when mass block is increased to B, C, and D in turn. Then, the acceleration peak value is increased to next grade. Before and after the altering of mass block, White Noise with small amplitude is inputted to observe the change of dynamic
Pore Pressure Gauge
Shaking Direction
Accelerometer
Strain Gauge
Soil Pressure Gauge
S2
S1
S3
S4
H4
H5
H6
S5
H1
H3
H2
S6
S7
SZD
SD
R1 R2
S9
A1
AZ2
S8 S10
AZ7
A2
AZ3
A3
A4AZ4
AZ5A5
AZ6
A6
A7
P8E10 P7E9
E1
H4
E2
E6E5
H5E3
H6 E8E7
P2S2 S5P1
H1S1
S3 H3
H2
P3E4
P4
P5S4 P6S6
S7
SZD
SD
S10
S9R2R1 A1
S8
AZ7
A2
AZ2
AZ3
A3
A4AZ4
AZ5A5
AZ6
A6
A7
Fig.6 Sketch of Measuring Point Arrangement

characteristics of the soil-structure system. Due to the limitation of paper length, the loading schedules of the second test phase are omitted here.
Table 3 Test Schedules Excitation Code Peak Value of Acceleration (g)
Excitation Wave Mass A Mass B Mass C Mass D Prototype 1:20
Model 1:10
Model White Noise WN1 WN3 WN5 WN7 0.07 0.07
El Centro Wave EL1a EL1b EL1c EL1d 0.1 0.488 0.244 Shanghai Artificial
Wave SH1a SH1b SH1c SH1d 0.1 0.488 0.244
Sinusoidal Wave F1a F1b F1c F1d 0.1 0.488 0.244 White Noise WN2 WN4 WN6 WN8 0.07 0.07 White Noise WN9 WN11 WN13 WN15 0.07 0.07
El Centro Wave EL2a EL2b EL2c EL2d 0.2 0.976 0.488 Shanghai Artificial
Wave SH2a SH2b SH2c SH2d 0.2 0.976 0.488
White Noise WN10 WN12 WN14 WN16 0.07 0.07 White Noise WN17 WN19 WN21 WN23 0.07 0.07
El Centro Wave EL3a EL3b EL3c EL3d 0.3 1.464 0.732 Shanghai Artificial
Wave SH3a SH3b SH3c SH3d 0.3 1.464 0.732
White Noise WN18 WN20 WN22 WN24 0.07 0.07 Summary of Test Results The container and model fixed on the shaking table is shown in Fig.7. The summary of some important findings from SSI system tests is presented as follows. It should be noted that only parts of test evidences are described here due to the limitation of paper length. (1) The phenomena of shaking table tests show that the tests reproduce the earthquake damage on the whole. The settlement of the structure occurs during excitation. The incline of structure is little for SSI system with pile foundation. However the settlement and incline are much larger for SSI system with box foundation, and sometimes the incline is so large as to turnover. The degree of settlement and incline has close relation with characteristics of soil. No crack appears on the superstructure when excitation is slight, and the crack on the superstructure is slight even when the excitation is moderate. There is not any crack on box foundation, while many horizontal bending cracks are distributed along the pile on pile foundation, system. (2) Comparison of dynamic characteristics shows that the natural frequency of the SSI system under the soft soil condition is lower than that of the structure on the fixed base by 20~60 percent, and the damping ratio of the system is 1.5~6 times of that of the structure material. Table 4 shows the frequency and damping ratio of some test results measured in test PS10. (3) Due to the effect of SSI, the mode shape of the SSI system under the soft soil condition is greatly different from that of the structure on the fixed base. Fig.8 shows the mode shape curves of each test phase measured in test PS20. It is obvious from this figure that there are rocking and swing at the foundation. (4) It is commonly considered that field soil will magnify vibration transformed from bedrock. But it is observed in tests that soft soil can filter and isolate vibration. Taking test PC10 as example, S7, S6, S5 are measuring points in soil, with the same plane location while depth increase gradually. S8 is a measuring point on container base. Fig.9 shows acceleration time-history and corresponding Fourier spectra of each

measuring point under EL1a excitation. When the vibration wave travels upwards, soft soil filters most of the high-frequency components, leaves behind the low-frequency components and minimizes the peak value of the acceleration. Similar results can be observed in each test under each excitation.
Table 4. Frequency and Damping Ratio (Test PS10) SSI System
No. Excitation
Code Freq. (Hz)
Damping Ratio
(%)
Freq. of Structure on
Fixed Base(Hz)
1 1WN 2.643 9.816 3.273 10 10WN 2.139 12.586 3.147 16 16WN 1.636 16.616 2.895 22 22WN 1.384 15.964 2.644 28 28WN 1.258 17.198 2.267 34 34WN 1.133 21.770 2.014 40 40WN 1.133 18.636 1.762
(5) Due to the vibration feedback from the superstructure, the spectral components of the foundation motion are changed and the motion of foundation is different from that of free field. The motion of foundation in SSI system is smaller. The components around the natural frequency of the system are enhanced and some frequency components are weakened. (6) The whole system response of the acceleration amplitude is in ‘K’ shape in height (see Fig.10). The response of the foundation top is smallest, while the response of the superstructure is larger than that of the foundation top. With increasing of the input acceleration, the amplification factors of the acceleration peak value are reduced due to the non-linearity of soil. (7) The acceleration response at the top of the superstructure consists of rocking and swing of the foundation, and the deformation of the structure. Fig.11 shows the acceleration time-history and corresponding Fourier spectra of each component when EL1a excites in test PC20S. The total
0.0
0.4
0.8
1.2
1.6
0.0 0.2 0.4 0.6 0.8
Ground Surface
EL1a EL2a EL3a
Amplification factor of Acc. amplitude
Hei
ght (
m)
Fig.10 Distribution of the Amplification Factors of the Acceleration Amplitude (Test PC20S,
Mass A, Excited by Different El Centro Wave)
0.2
0.4
0.6
0.8
1.0
1.2
1.4
1.6
1.8
2.0
2.2
2.4
2.6
-1.0 -0.5 0.0 0.5 1.0
Ground Surface
1WN 10WN 16WN 22WN 28WN
Hei
ght
(m)
0.2
0.4
0.6
0.8
1.0
1.2
1.4
1.6
1.8
2.0
2.2
2.4
2.6
0.0 0.5 1.0
Ground Surface
1WN 10WN 16WN 22WN 28WN
Hei
ght
(m)
(a) The First Mode Shape (b) The Second Mode Shape Fig.8 Mode Shape Curves in Test PS20
Fig.7 Photograph of Container and Model (The Second Test Phase)
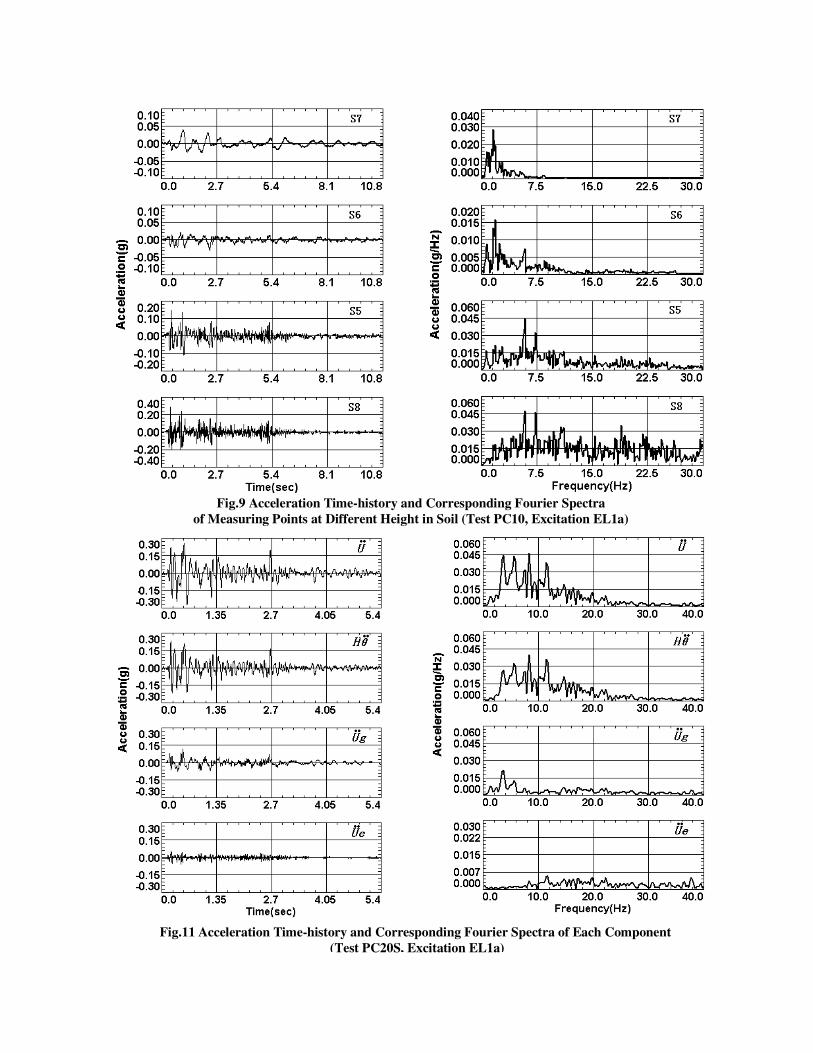
Fig.9 Acceleration Time-history and Corresponding Fourier Spectra of Measuring Points at Different Height in Soil (Test PC10, Excitation EL1a)
Fig.11 Acceleration Time-history and Corresponding Fourier Spectra of Each Component (Test PC20S, Excitation EL1a)

acceleration u&& , rocking component θ&&H , swing component gu&& and deformation component of the
superstructure eu&& are shown from above to below in the figure. It can clearly be seen that the rocking and the swing components are the main parts of the acceleration response. Therefore, it is necessary to take the rocking and the swing into account in analysis when the foundation is in soft soil. (8) The distribution of the strain amplitude along the pile is the shape where the large strain is at the top of the pile and the small strain is at the tip of the pile (see Fig.12). And the distribution of the contact pressure on the pile-soil interface is the shape where the small pressure is at the top and the large pressure is at the bottom (see Fig.13).
(9) The response of the system under the excitation of Shanghai artificial wave is obviously larger than that under the excitation of El Centro wave and Kobe wave. (10) Vertical excitations have little effect on the responses of the dynamic soil-structure interaction. Through these tests, abundant experimental data are obtained, which can be used to verify the results of theoretical and analytical research, and improve or put forward better computational models and analytical methods. The present work provides the basis for further research.
COMPUTER SIMULATION ON THE TESTS Modeling Method Simulation of flexible container The lateral rubber membrane of the container is meshed by shell element in modeling. The base plate of the container is fixed with shaking table by bolt, and proper measures are taken to make the surface of the base plate rough in test. So the relative slip between the soil and the bottom of the container can be ignored and the bottom of soil can be considered as fixed in modeling. The reinforcement loops outside the container are used to provide radial rigidity and permit soil to deform as horizontal shear layer in test. In modeling, the reinforcement loops can be considered that the nodes along the container perimeter with same height have the same displacement in excitation direction (X-axis direction of shaking table), which can be realized by coupling of degrees of freedom in ANSYS program. Dynamic constitutive model of soil and simulation of material nonlinearity In this paper, equivalent linearization model of soil is adopted. In calculation, assume a pair of shear
600
500
400
300
200
100
00 100 200 300 400 500
Strain amplitude on pile (¡Á10£-6)
EL1 EL2 EL3 EL4 EL5 EL6
Dep
th (
mm
)
Fig.12 Distribution of the Strain Amplitude on Pile (Test PS20, Excited by Different El Centro Wave)
600
500
400
300
200
100
00 3 6 9 12 15
Contact pressure amplitude (kPa)
EL1 EL2 EL3 EL4 EL5 EL6
Dep
th (m
m)
Fig.13 Distribution of the Contact Pressure Amplitude on the Pile-soil Interface (Test PS20,
Excited by Different El Centro Wave)
(10-6)

modulus Gd1 and damping ratio D1 for each layer of soil, calculate corresponding effective shear strain γd1, then find out corresponding shear modulus Gd2 and damping ratio D2 in the relationship curves of Gd /G0-γd and D-γd, respectively (see Fig.5). The curve of Gd /G0-γd denotes the relationship between the effective shear strainγd and the ratio of shear modulus Gd and the initial shear modulus G0 , while the curve of D-γd denotes the relationship between the damping ratio D and the effective shear strainγd. Repeat the above steps until the differences between twice results of the shear modulus and the damping ratio are in allowable range. In calculation, 0.65 times of the maximal shear strain is taken asγd (Wang [10]). In ANSYS program, there is a kind of parametric design language named APDL, which is a scripting language. Users can use it to automate common tasks or even build models in terms of parameters. The equivalent linearity model is realized in ANSYS program by using the APDL, and the calculation of material nonlinearity is realized automatically. Simulation of the change-status nonlinearity on soil-structure interfaces Due to the material characteristics difference between the soil and concrete, there are sliding and splitting phenomena on the soil-structure interface when interface stress increases to a certain level, and the gappy interface could reclose under a certain load condition. Earlier researchers adopted interface elements such as Goodman element, lamina element and lamina soil element to simulate this changing-status nonlinearity on the interfaces of soil and structure (foundation). In ANSYS program, contact analysis is realized by overlaying a thin layer of elements upon the contact interface of analysis model. The soil surface is taken as contact surface, while the structure (foundation) surface as target surface due to its larger rigidity. Contact elements and target elements are formed on the contact surface and the target surface, respectively. Then, the corresponding contact elements and target elements are taken as one contact pair by defining the same real constant number. Rational parameters are chosen to simulate the status of sticking, sliding, splitting or reclosing on the soil-structure interface. Damping model In SSI system, the damping ratio of soil is usually larger than that of superstructure. So the damping ratio of soil and superstructure should adopt different value. A material-damping ratio inputting method is given in ANSYS program. Using this method, different damping ratio can be inputted according to different material. Using the material-damping input method can take different damping ratio of soil and superstructure into account. Consideration of gravity The initial stress produced by gravity has large influence on the status of contact. Great error will occur if the gravity is not taken into account in the dynamic calculation. The contrast of contact pressure time-history on the center of the foundation bottom between taking gravity into account and not taking is shown in Fig.14. It is
Fig.14 Contact Pressure Time-history on Center of Foundation Bottom (BC20 Test Model)
(a) Taking Gravity into Account
0 1 2 3 46990
7000
7010
7020
7030
7040
Con
tact
pre
ssur
e (P
a)
Time (s)(b) Not Taking Gravity into Account
0 1 2 3 4-40
0
40
80
120
160
Con
tact
pre
ssur
e (P
a)
Time (s)

obvious that the contact pressure of taking gravity into account is larger than that of not taking gravity into account. And separation between the soil and the foundation bottom occurs when not taking gravity into account, while no separation occurs when taking gravity into account that agrees with the test results. In this paper, gravity is applied as a dynamic load in calculation. Before the seismic wave is applied, gravity is applied on the system as a vertical acceleration field and transient analysis is carried out. After the response drove to a constant value, the seismic wave and gravity are applied to the system together and the transient analysis continued without pause. The dynamic response can be obtained by subtracting the constant value from the total response. Fig.15 shows meshing of PS10 test model satisfying the above modeling principles. Verification of the Model Some acceleration time-history curves of computational results and test results of the PS10 test are given in Fig.16. The code EL1 in the Fig.16 denotes the excitation of El Centro wave, whose peak value of acceleration is 0.093g. It shows that the acceleration time-history curves of corresponding points are approximately coincident. It’s verified that the computational model is rational and appropriate for research on SSI.
Fig.16 Comparison between calculation and test result (PS10 test model, under excitation of EL1)
0.0 1.5 3.0 4.5 6.0 7.5-0.2
-0.1
0.0
0.1
0.2
Acc
eler
atio
n (g
)
Time (s)
A7_test result A7_calculation
0.0 1.5 3.0 4.5 6.0 7.5-0.2
-0.1
0.0
0.1
0.2 S8_test result S8_calculation
Time (s)
Acc
eler
atio
n (g
)
0.0 1.5 3.0 4.5 6.0 7.5-0.10
-0.05
0.00
0.05
0.10
Acc
eler
atio
n (g
)
Time (s)
S2_calculation S2_test
0.0 1.5 3.0 4.5 6.0 7.5-0.10
-0.05
0.00
0.05
0.10
Acc
eler
atio
n (g
)
Time (s)
S6_calculation S6_test
Fig.15 Meshing of test model (PS10)
X
Y
Z
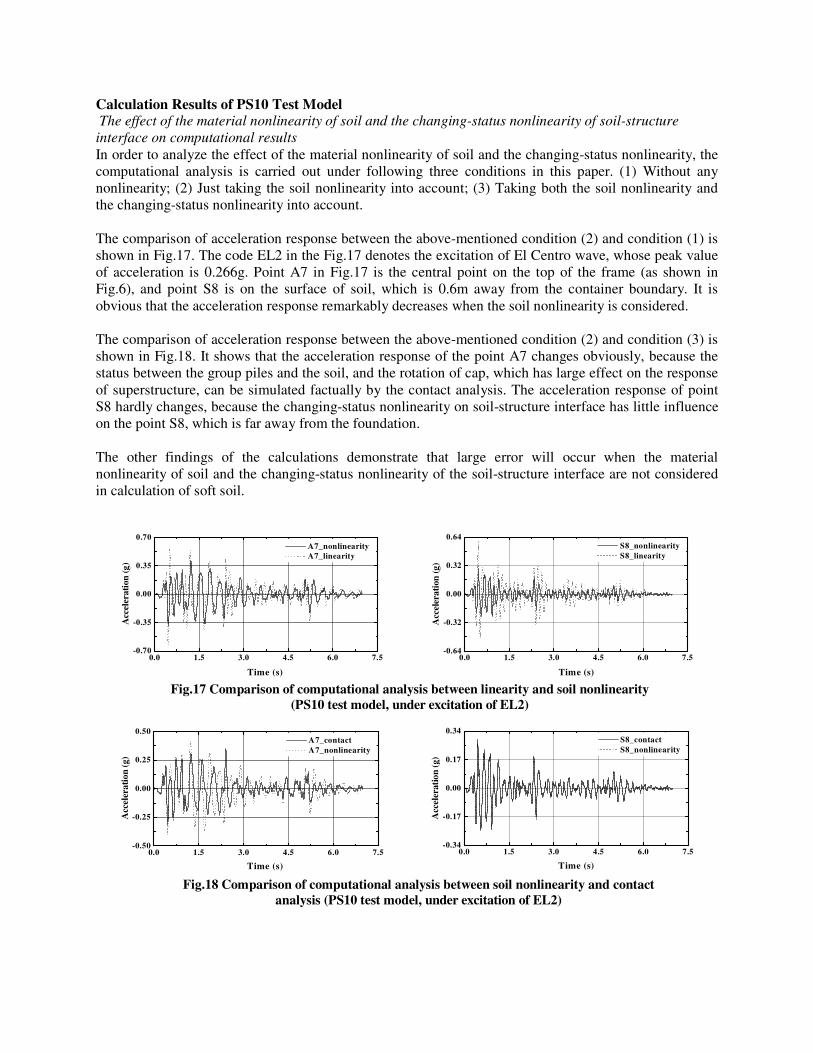
Calculation Results of PS10 Test Model The effect of the material nonlinearity of soil and the changing-status nonlinearity of soil-structure interface on computational results In order to analyze the effect of the material nonlinearity of soil and the changing-status nonlinearity, the computational analysis is carried out under following three conditions in this paper. (1) Without any nonlinearity; (2) Just taking the soil nonlinearity into account; (3) Taking both the soil nonlinearity and the changing-status nonlinearity into account. The comparison of acceleration response between the above-mentioned condition (2) and condition (1) is shown in Fig.17. The code EL2 in the Fig.17 denotes the excitation of El Centro wave, whose peak value of acceleration is 0.266g. Point A7 in Fig.17 is the central point on the top of the frame (as shown in Fig.6), and point S8 is on the surface of soil, which is 0.6m away from the container boundary. It is obvious that the acceleration response remarkably decreases when the soil nonlinearity is considered. The comparison of acceleration response between the above-mentioned condition (2) and condition (3) is shown in Fig.18. It shows that the acceleration response of the point A7 changes obviously, because the status between the group piles and the soil, and the rotation of cap, which has large effect on the response of superstructure, can be simulated factually by the contact analysis. The acceleration response of point S8 hardly changes, because the changing-status nonlinearity on soil-structure interface has little influence on the point S8, which is far away from the foundation. The other findings of the calculations demonstrate that large error will occur when the material nonlinearity of soil and the changing-status nonlinearity of the soil-structure interface are not considered in calculation of soft soil.
Fig.17 Comparison of computational analysis between linearity and soil nonlinearity (PS10 test model, under excitation of EL2)
0.0 1.5 3.0 4.5 6.0 7.5-0.64
-0.32
0.00
0.32
0.64
Acc
eler
atio
n (g
)
Time (s)
S8_nonlinearity S8_linearity
0.0 1.5 3.0 4.5 6.0 7.5-0.70
-0.35
0.00
0.35
0.70 A7_nonlinearity A7_linearity
Time (s)
Acc
eler
atio
n (g
)
0.0 1.5 3.0 4.5 6.0 7.5-0.34
-0.17
0.00
0.17
0.34
Acc
eler
atio
n (g
)
Time (s)
S8_contact S8_nonlinearity
0.0 1.5 3.0 4.5 6.0 7.5-0.50
-0.25
0.00
0.25
0.50 A7_contact A7_nonlinearity
Time (s)
Acc
eler
atio
n (g
)
Fig.18 Comparison of computational analysis between soil nonlinearity and contact analysis (PS10 test model, under excitation of EL2)

Contact analysis on soil-pile interface In order to learn the response characteristics of each pile of the group piles foundation, the normal strain along the pile, contact pressure and sliding between the soil and the piles are outputted in calculation process. The plan of group piles is shown in Fig.19, in which No.2 pile is a middle pile at side row, No.3 pile is at the corner, and No.5 pile is the center pile.
Distribution of the strain amplitude on pile Fig.20 is the distribution of the strain amplitude along the No.2, No.3 and No.5 piles under excitation of EL2. The distribution of the strain amplitude along the pile is the shape where the large strain is at the top of the pile and the small strain is at the tip of the pile, which consist with the crack distribution observed in the test. The strain amplitudes of different piles have large difference at the top of piles, while little difference at the tip of piles. The strain amplitude of the pile at the corners is larger than the middle pile of side row and the center pile.
Distribution of the contact pressure on the pile-soil interface Fig.21 is the contact pressure time-history at the position 80mm below top of No.3 pile. It can clearly be seen that the condition of zero contact pressure exists, which demonstrates that the phenomena of separation and reclosing occur between soil and pile foundation. Fig.22 is the distribution of the contact pressure amplitude between soil and the No.2, No.3 and No.5 piles under excitation of SH2. The code SH2 denotes Shanghai artificial wave, whose peak value of acceleration is 0.266g. The distribution of the contact pressure on the soil-pile interface is the shape where the smaller pressure is at the middle of pile and the larger pressure is at both the top and the bottom.
Sliding on the soil-structure interface Fig.23 is the distribution of the sliding amplitude between soil and the No.2, No.3 and No.5 piles under excitation of EL2. The sliding amplitude on the soil-pile interface of the No.5 pile is smaller than that of the No.2 and No.3 pile. The pile’s sliding of the side row is larger than that of the middle row along the vibration direction.
CONCLUSIONS In this paper, shaking table model tests on dynamic SSI system are described, and some important findings from the present tests are concluded. Combining general-purpose finite element program ANSYS and based on shaking table model tests, three-dimensional finite element analysis on SSI system has been
17 4
8 5
9 6 3
2
+X-X+Y
-Y
X
Y
Fig.19 Plan of group piles
1200
1000
800
600
400
200
00 60 120 180 240 300 360
Strain amplitude on pile (¡Á10 -6)
left side of No.2 pile right side of No.2 pile left side of No.3 pile right side of No.3 pile right side of No.5 pile
Dep
th (m
m)
Fig.20 Distribution of the strain amplitude on pile (PS10 test model, under excitation of EL2)
0.0 1.5 3.0 4.5 6.0 7.5
0.0
0.6
1.2
1.8
2.4
3.0
Con
tact
pre
ssur
e am
plit
ude
(kP
a)
Time (s)
Fig.21 Contact pressure time-history (80mm below top of No.3 pile, under
excitation of EL2)

carried out. By comparison analysis between the calculation and the tests, it is verified that the modeling methods are rational and suitable for the numerical analysis of dynamic SSI system.
ACKNOWLEDGEMENT
This project is carried out under the sponsorship of the key project (No.50025821) and the youth project (No.50308018) of National Natural Science Foundation of China.
REFERENCES 1. Aso T, Uno K, Kitagawn S, Morikawa T. “A Dynamic Model Test and Analysis of A Steel Pipe Piled
Well Foundation.” Proc.11WCEE, Acapulco, Mexico. Paper no.1085, 1996. 2. Don H, Byrne PM. “Dynamic Response of Single Piles and Soil-Pile Interaction.” Canada Geotech.
1996; 33: 80-96. 3. Futaki M, et al. “Experiments about Seismic Performance of Reinforced Earth Retaining Wall.”
Proc.11WCEE, Acapulco, Mexico. Paper no.1083, 1996. 4. Hadjian AH, et al. “The Learning from the Large Scale Lotung Soil-Structure Interaction
Experiments.” Proc. 2nd Int. Conf. on Recent Advances in Geotech. Eng. and Soil Dyn., St. Louis, 1991, Vo1.1
5. Hideto S, Makoto K, Toshio Y. “Study on Nonlinear Dynamic Analysis Method of Pile Subjected to Ground Motion. Part 2: Comparison between Theory and Experiment.” Proc.11WCEE, Acapulco, Mexico. Paper no.1289, 1996.
6. Meymand P. “Shake Table Tests: Seismic Soil-Pile-Superstructure Interaction.” PEER Center News 1998; 1(2): 1-4
7. Riemer M, et al. “1-g Modeling of Seismic Soil-Pile-Superstructure Interaction in Soft Clay.” Proc.4th Caltrans Seismic Research Workshop, Sacramento 1996.
8. Shohara R, Mita A. “Laboratory Model Tests with Silicone Rubber Ground Model(Embedment Effect Test on Soil-Structure Interaction).” SMIRT11 Transactions 1991; K06(2): 117-122
9. Lou M L, Chen Q J, et al. “Research on Influence of Lateral Boundary on Seismic Response of Pile Foundation.” Research Report of RISEDR. Tongji University 1999.
10. Wang S T, Cao Z. “Design Methods of Modern Aseismic Structures.” China Architecture & Building Press, Beijing, China, 1997.
1200
1000
800
600
400
200
00 4 8 12 16 20
Contact pressure amplitude (kPa)
No.3 pile No.5 pile No.2 pile
Dep
th (m
m)
Fig.22 Distribution of the contact pressure amplitude on pile
(PS10 test model, under excitation of SH2)
1200
1000
800
600
400
200
00.0 0.5 1.0 1.5 2.0 2.5
Sliding amplitude (mm)
No.3 pile No.5 pile No.2 pile
Dep
th (m
m)
Fig.23 Distribution of sliding amplitude on soil-pile interface
(PS10 test model, under excitation of EL2)


![Dynamic Soil-Structure Interaction, Wolf[1]](https://img.dokumen.tips/doc/110x75/55cf8cff5503462b139128df/dynamic-soil-structure-interaction-wolf1.jpg)