Embed Size (px)
Citation preview
Result Update Presentation
Q3 / 9M FY16
February 2016
Shaily Engineering Plastics Limited
1
This presentation and the accompanying slides (the “Presentation”), which have been prepared by Shaily EngineeringPlastics Limited (the “Company”), have been prepared solely for information purposes and do not constitute any offer,recommendation or invitation to purchase or subscribe for any securities, and shall not form the basis or be relied on inconnection with any contract or binding commitment whatsoever. No offering of securities of the Company will bemade except by means of a statutory offering document containing detailed information about the Company.
This Presentation has been prepared by the Company based on information and data which the Company considersreliable, but the Company makes no representation or warranty, express or implied, whatsoever, and no reliance shallbe placed on, the truth, accuracy, completeness, fairness and reasonableness of the contents of this Presentation. ThisPresentation may not be all inclusive and may not contain all of the information that you may consider material. Anyliability in respect of the contents of, or any omission from, this Presentation is expressly excluded.
Certain matters discussed in this Presentation may contain statements regarding the Company’s market opportunityand business prospects that are individually and collectively forward-looking statements. Such forward-lookingstatements are not guarantees of future performance and are subject to known and unknown risks, uncertainties andassumptions that are difficult to predict. These risks and uncertainties include, but are not limited to, the performanceof the Indian economy and of the economies of various international markets, the performance of the industry in Indiaand world-wide, competition, the company’s ability to successfully implement its strategy, the Company’s future levelsof growth and expansion, technological implementation, changes and advancements, changes in revenue, income orcash flows, the Company’s market preferences and its exposure to market risks, as well as other risks. The Company’sactual results, levels of activity, performance or achievements could differ materially and adversely from resultsexpressed in or implied by this Presentation. The Company assumes no obligation to update any forward-lookinginformation contained in this Presentation. Any forward-looking statements and projections made by third partiesincluded in this Presentation are not adopted by the Company and the Company is not responsible for such third partystatements and projections.
2
Safe Harbor
Q3/9M FY16 - Financial Performance
3

4
Q3 FY16
Revenue
EBITDA
PBT
PAT
9M FY16
Rs. 29.8 cr. up 59.0%Margin at 17.4%
Rs. 5.7 cr. up 82.7%Margin at 10.4%
Rs. 17.1 cr. up 65.9%Margin at10.0%
Rs. 3.9 cr. up 49.4%Margin at 7.0%
Rs. 11.4 cr. up 37.1%Margin at 6.6%
Key Financial Highlights
Rs. 10.1 cr. up 74.1%Margin at18.2%
Rs. 55.2 cr up 20.3% Rs. 171.3 cr up 30.8%

Key Development - Q3 FY16
Started business with Gillette (Subsidiary of P & G) and supplying components for disposable razor
Successfully commercialized storage box in recycled raw material for a large home & furnishings major
Added 5 new injection molding machines across various facilities
CRC Business - Product under different stages of validation/customer approval with various pharmaceutical customers
5
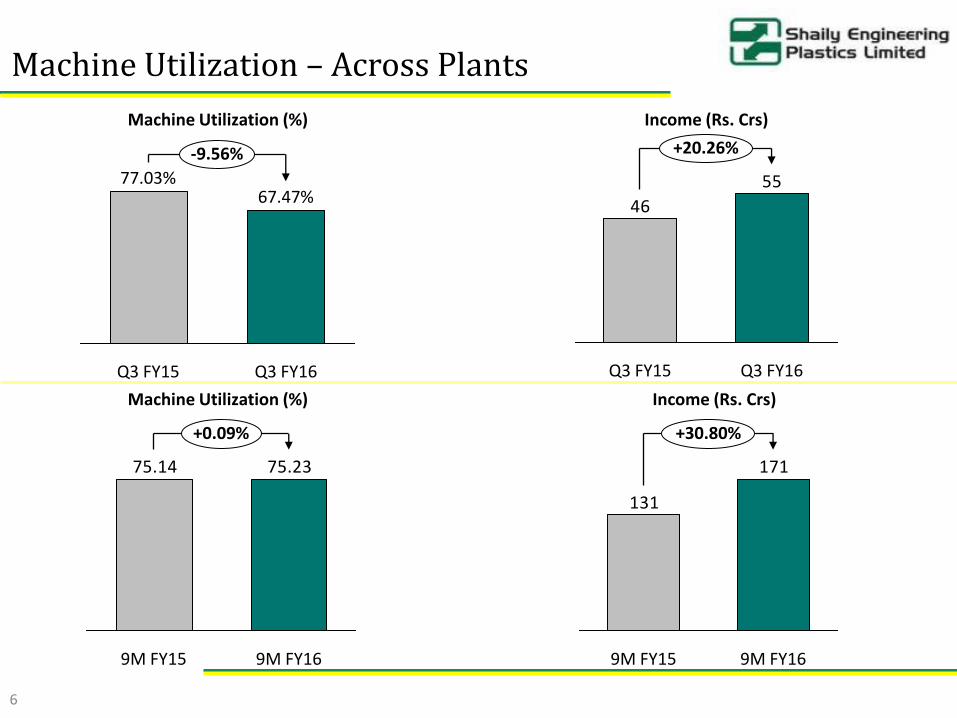
Machine Utilization – Across Plants
Machine Utilization (%)
67.47%77.03%
-9.56%
Q3 FY16Q3 FY15
55
46
+20.26%
Q3 FY15 Q3 FY16
75.2375.14
9M FY15
+0.09%
9M FY16
171
131
9M FY15
+30.80%
9M FY16
Machine Utilization (%)
Income (Rs. Crs)
Income (Rs. Crs)
6

Key Highlights – Q3 FY16
7
Revenue EBITDA EBITDA Margin %
55.2
45.9
+20%
Q3 FY16Q3 FY15
10.1
5.8
+74%
Q3 FY16Q3 FY15
18.2%
12.6%
560 bps
Q3 FY16Q3 FY15
PBT
5.8
3.1
Q3 FY15 Q3 FY16
+83%
(Rs. Cr.)
(Rs. Cr.) PBT Margin % PAT
10.4%
6.9%
360 bps
Q3 FY16Q3 FY15
3.9
2.6
Q3 FY16
+49%
Q3 FY15
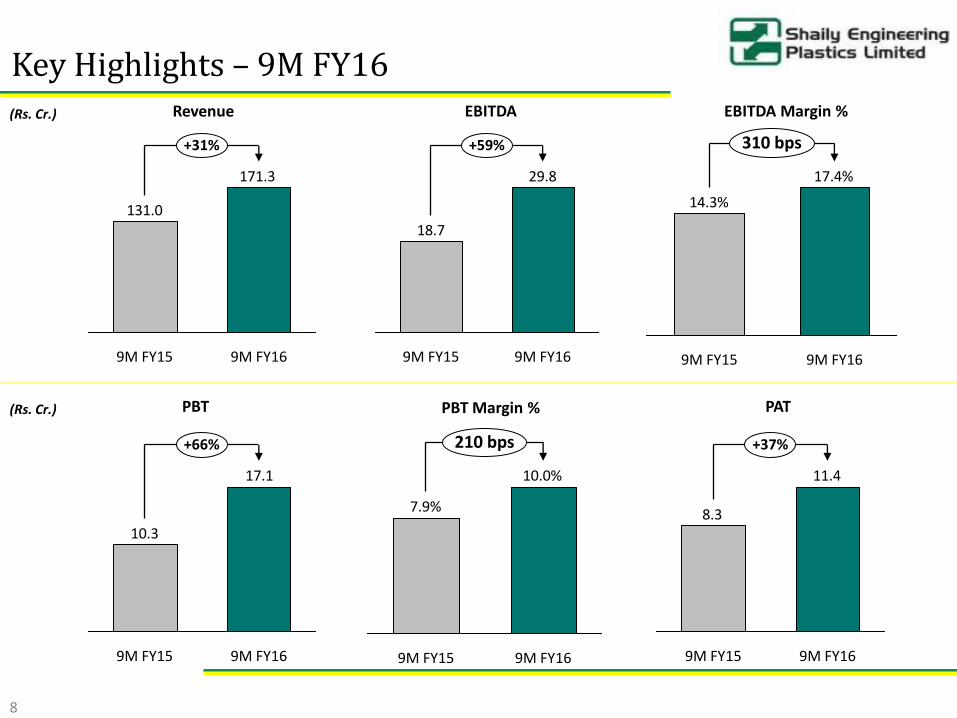
Key Highlights – 9M FY16
8
Revenue EBITDA EBITDA Margin %
171.3
131.0
9M FY16
+31%
9M FY15
29.8
18.7
9M FY15
+59%
9M FY16
17.4%
14.3%
9M FY16
310 bps
9M FY15
PBT
17.1
10.3
9M FY15
+66%
9M FY16
(Rs. Cr.)
(Rs. Cr.) PBT Margin % PAT
10.0%
7.9%
9M FY15
210 bps
9M FY16
11.4
8.3
+37%
9M FY15 9M FY16
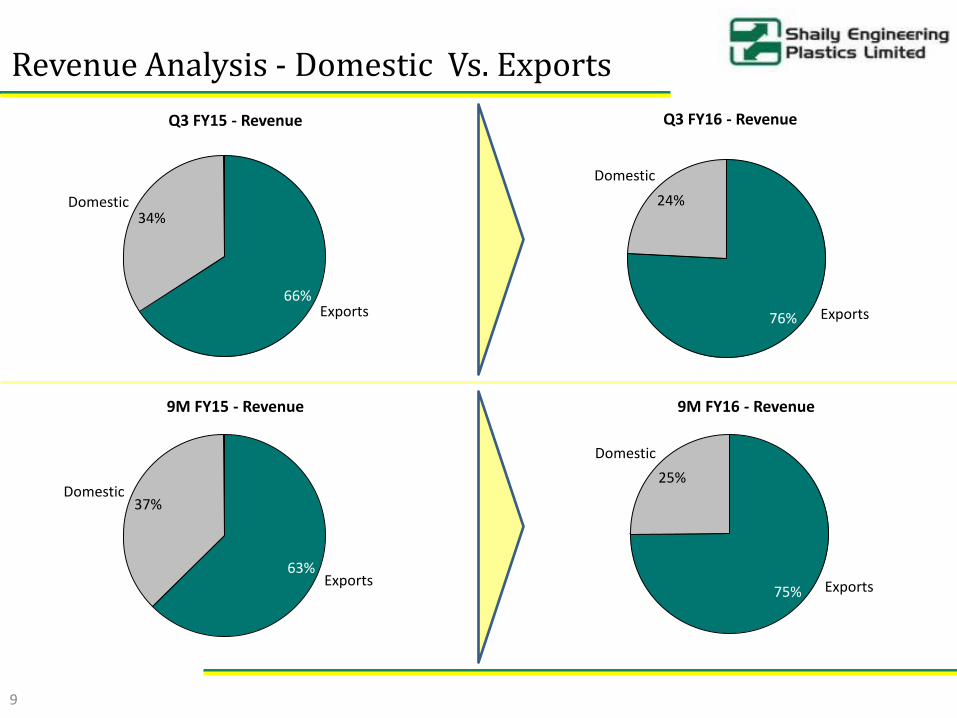
Revenue Analysis - Domestic Vs. Exports
Exports
34%Domestic
66%
Q3 FY15 - Revenue
9M FY15 - Revenue
24%
Exports76%
Domestic
9M FY16 - Revenue
Exports
37%Domestic
63%
25%
Exports75%
Domestic
Q3 FY16 - Revenue
9
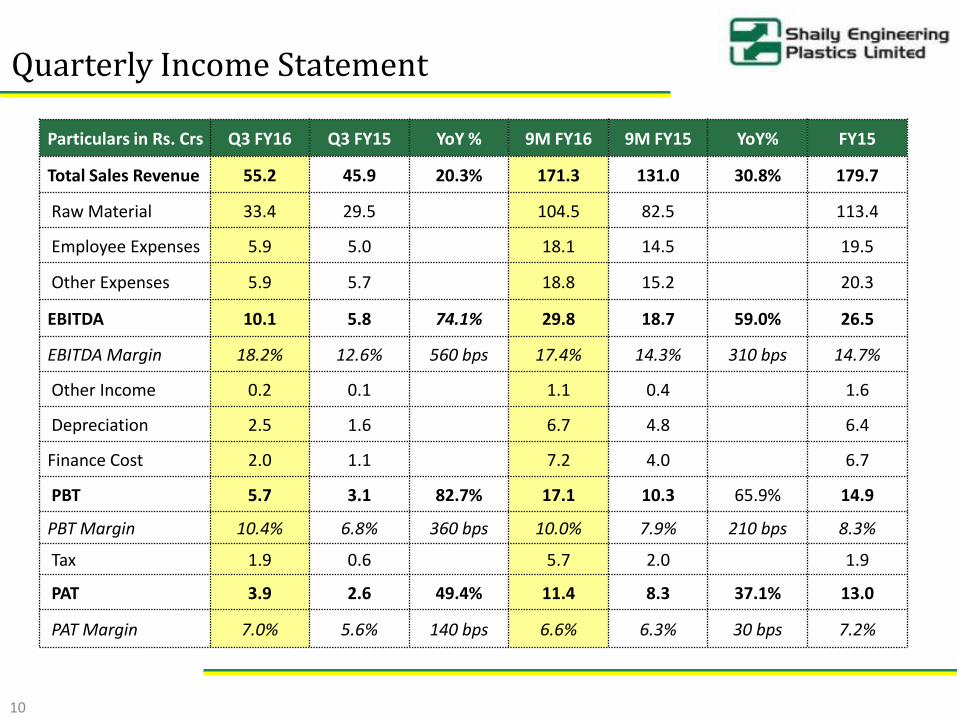
Quarterly Income Statement
Particulars in Rs. Crs Q3 FY16 Q3 FY15 YoY % 9M FY16 9M FY15 YoY% FY15
Total Sales Revenue 55.2 45.9 20.3% 171.3 131.0 30.8% 179.7
Raw Material 33.4 29.5 104.5 82.5 113.4
Employee Expenses 5.9 5.0 18.1 14.5 19.5
Other Expenses 5.9 5.7 18.8 15.2 20.3
EBITDA 10.1 5.8 74.1% 29.8 18.7 59.0% 26.5
EBITDA Margin 18.2% 12.6% 560 bps 17.4% 14.3% 310 bps 14.7%
Other Income 0.2 0.1 1.1 0.4 1.6
Depreciation 2.5 1.6 6.7 4.8 6.4
Finance Cost 2.0 1.1 7.2 4.0 6.7
PBT 5.7 3.1 82.7% 17.1 10.3 65.9% 14.9
PBT Margin 10.4% 6.8% 360 bps 10.0% 7.9% 210 bps 8.3%
Tax 1.9 0.6 5.7 2.0 1.9
PAT 3.9 2.6 49.4% 11.4 8.3 37.1% 13.0
PAT Margin 7.0% 5.6% 140 bps 6.6% 6.3% 30 bps 7.2%
10
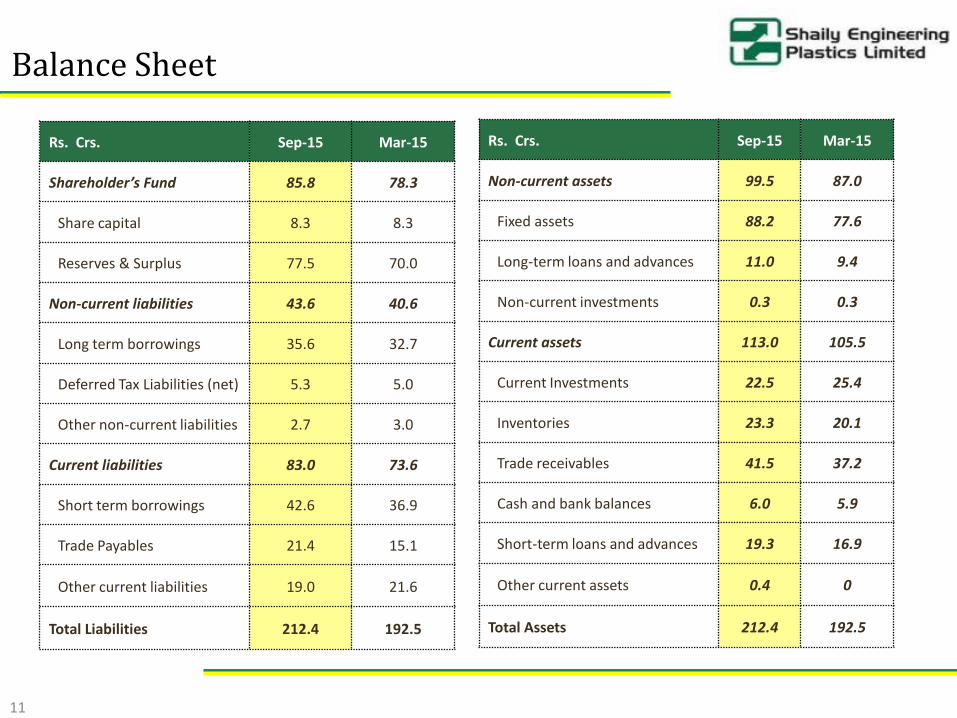
Rs. Crs. Sep-15 Mar-15
Shareholder’s Fund 85.8 78.3
Share capital 8.3 8.3
Reserves & Surplus 77.5 70.0
Non-current liabilities 43.6 40.6
Long term borrowings 35.6 32.7
Deferred Tax Liabilities (net) 5.3 5.0
Other non-current liabilities 2.7 3.0
Current liabilities 83.0 73.6
Short term borrowings 42.6 36.9
Trade Payables 21.4 15.1
Other current liabilities 19.0 21.6
Total Liabilities 212.4 192.5
Rs. Crs. Sep-15 Mar-15
Non-current assets 99.5 87.0
Fixed assets 88.2 77.6
Long-term loans and advances 11.0 9.4
Non-current investments 0.3 0.3
Current assets 113.0 105.5
Current Investments 22.5 25.4
Inventories 23.3 20.1
Trade receivables 41.5 37.2
Cash and bank balances 6.0 5.9
Short-term loans and advances 19.3 16.9
Other current assets 0.4 0
Total Assets 212.4 192.5
Balance Sheet
11
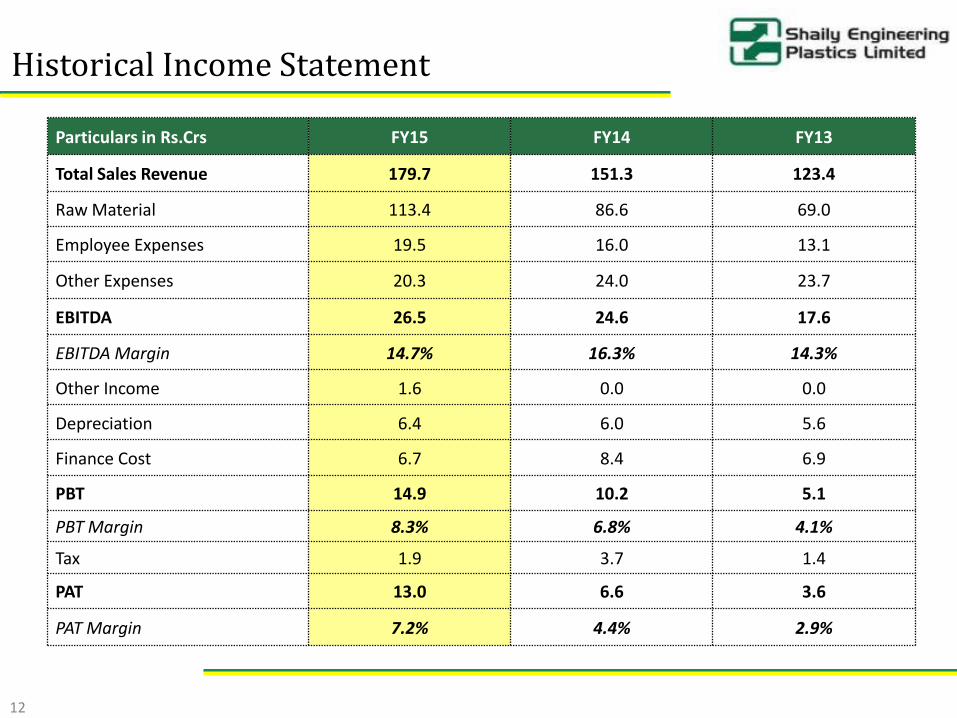
Particulars in Rs.Crs FY15 FY14 FY13
Total Sales Revenue 179.7 151.3 123.4
Raw Material 113.4 86.6 69.0
Employee Expenses 19.5 16.0 13.1
Other Expenses 20.3 24.0 23.7
EBITDA 26.5 24.6 17.6
EBITDA Margin 14.7% 16.3% 14.3%
Other Income 1.6 0.0 0.0
Depreciation 6.4 6.0 5.6
Finance Cost 6.7 8.4 6.9
PBT 14.9 10.2 5.1
PBT Margin 8.3% 6.8% 4.1%
Tax 1.9 3.7 1.4
PAT 13.0 6.6 3.6
PAT Margin 7.2% 4.4% 2.9%
Historical Income Statement
12
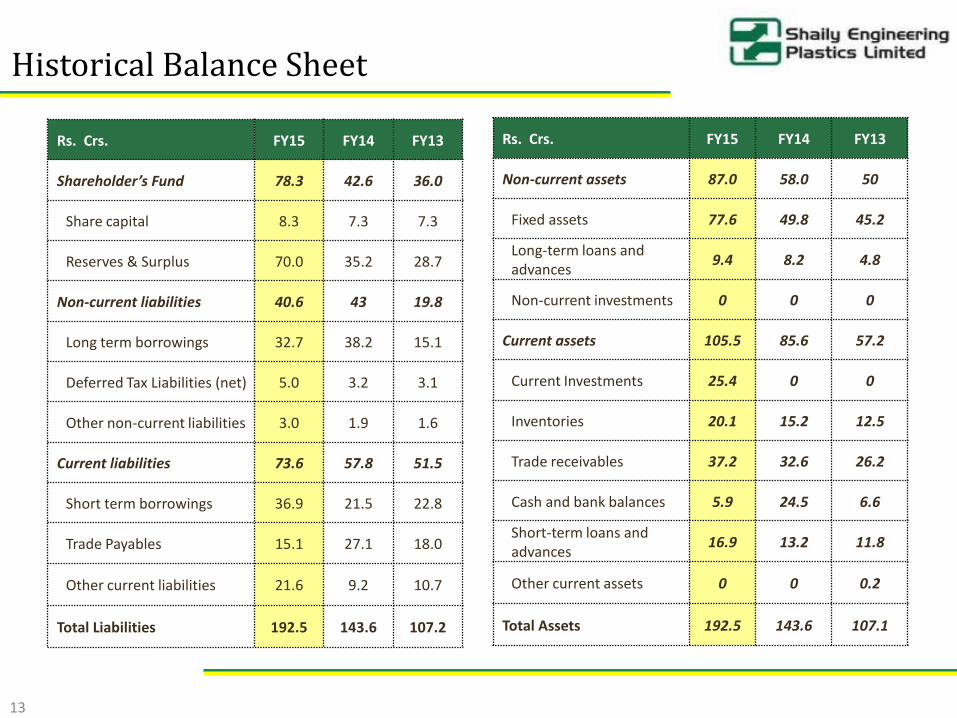
Rs. Crs. FY15 FY14 FY13
Shareholder’s Fund 78.3 42.6 36.0
Share capital 8.3 7.3 7.3
Reserves & Surplus 70.0 35.2 28.7
Non-current liabilities 40.6 43 19.8
Long term borrowings 32.7 38.2 15.1
Deferred Tax Liabilities (net) 5.0 3.2 3.1
Other non-current liabilities 3.0 1.9 1.6
Current liabilities 73.6 57.8 51.5
Short term borrowings 36.9 21.5 22.8
Trade Payables 15.1 27.1 18.0
Other current liabilities 21.6 9.2 10.7
Total Liabilities 192.5 143.6 107.2
Rs. Crs. FY15 FY14 FY13
Non-current assets 87.0 58.0 50
Fixed assets 77.6 49.8 45.2
Long-term loans and advances
9.4 8.2 4.8
Non-current investments 0 0 0
Current assets 105.5 85.6 57.2
Current Investments 25.4 0 0
Inventories 20.1 15.2 12.5
Trade receivables 37.2 32.6 26.2
Cash and bank balances 5.9 24.5 6.6
Short-term loans and advances
16.9 13.2 11.8
Other current assets 0 0 0.2
Total Assets 192.5 143.6 107.1
Historical Balance Sheet
13
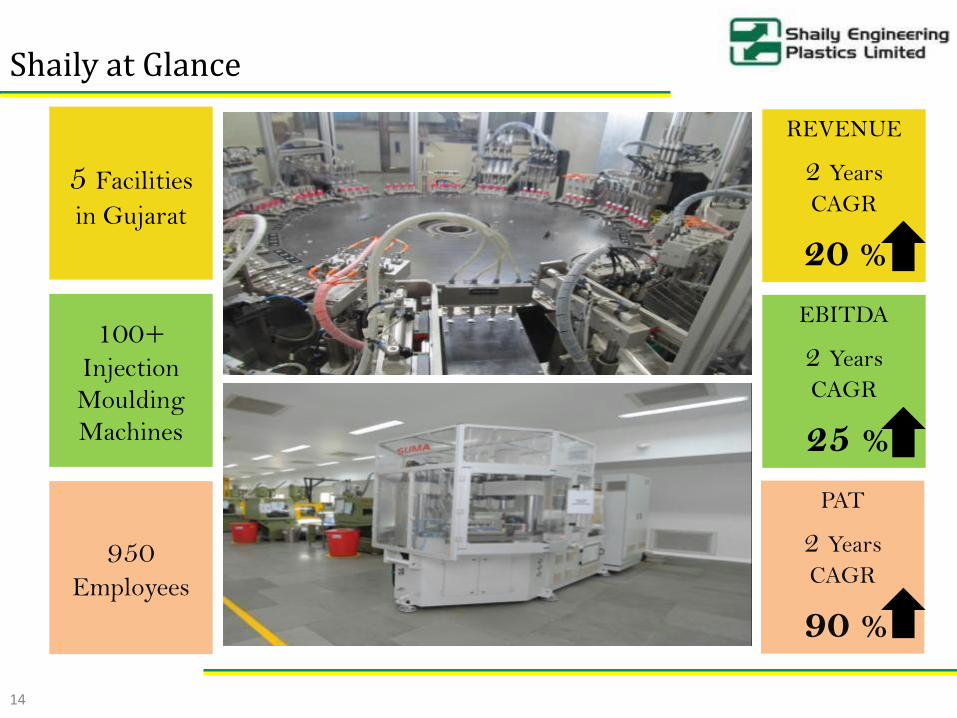
Shaily at Glance
5 Facilities
in Gujarat
REVENUE
2 Years
CAGR
20 %
EBITDA
2 Years
CAGR
25 %
PAT
2 Years
CAGR
90 %
100+Injection
Moulding
Machines
950Employees
14
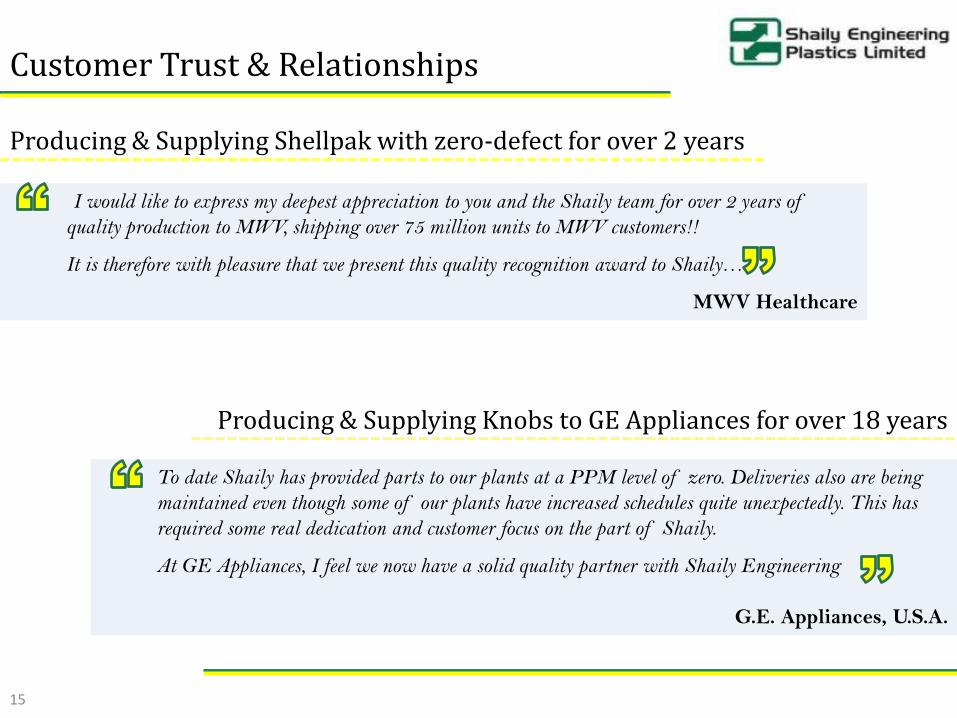
Customer Trust & Relationships
I would like to express my deepest appreciation to you and the Shaily team for over 2 years of
quality production to MWV, shipping over 75 million units to MWV customers!!
It is therefore with pleasure that we present this quality recognition award to Shaily…
MWV Healthcare
Producing & Supplying Shellpak with zero-defect for over 2 years
Producing & Supplying Knobs to GE Appliances for over 18 years
To date Shaily has provided parts to our plants at a PPM level of zero. Deliveries also are being
maintained even though some of our plants have increased schedules quite unexpectedly. This has
required some real dedication and customer focus on the part of Shaily.
At GE Appliances, I feel we now have a solid quality partner with Shaily Engineering
G.E. Appliances, U.S.A.
15
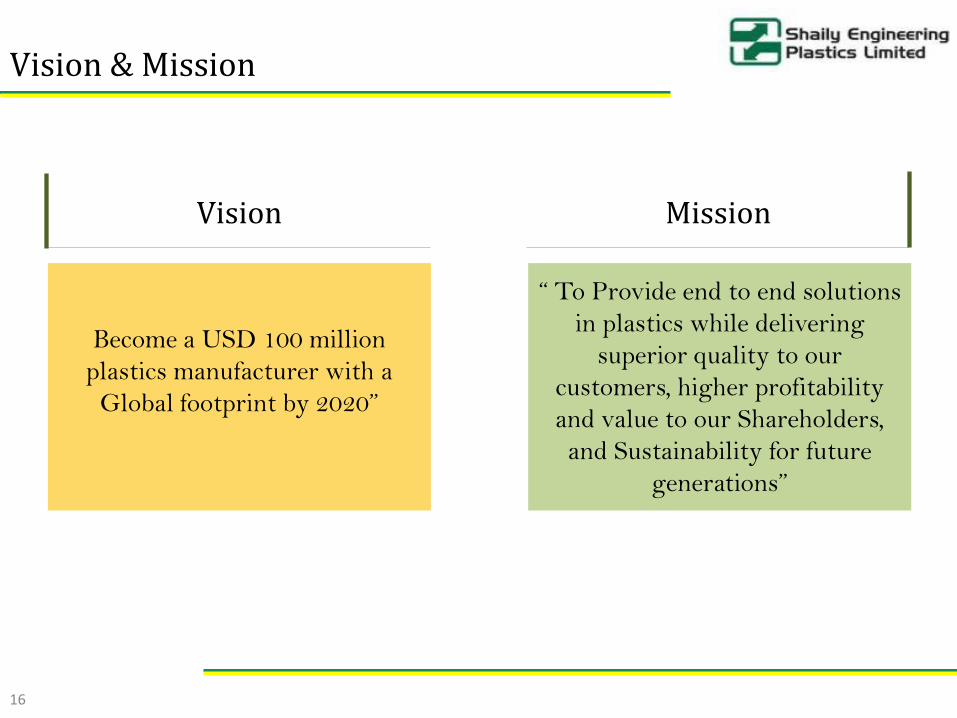
Vision & Mission
Become a USD 100 million
plastics manufacturer with a
Global footprint by 2020”
“ To Provide end to end solutions
in plastics while delivering
superior quality to our
customers, higher profitability
and value to our Shareholders,
and Sustainability for future
generations”
Vision Mission
16
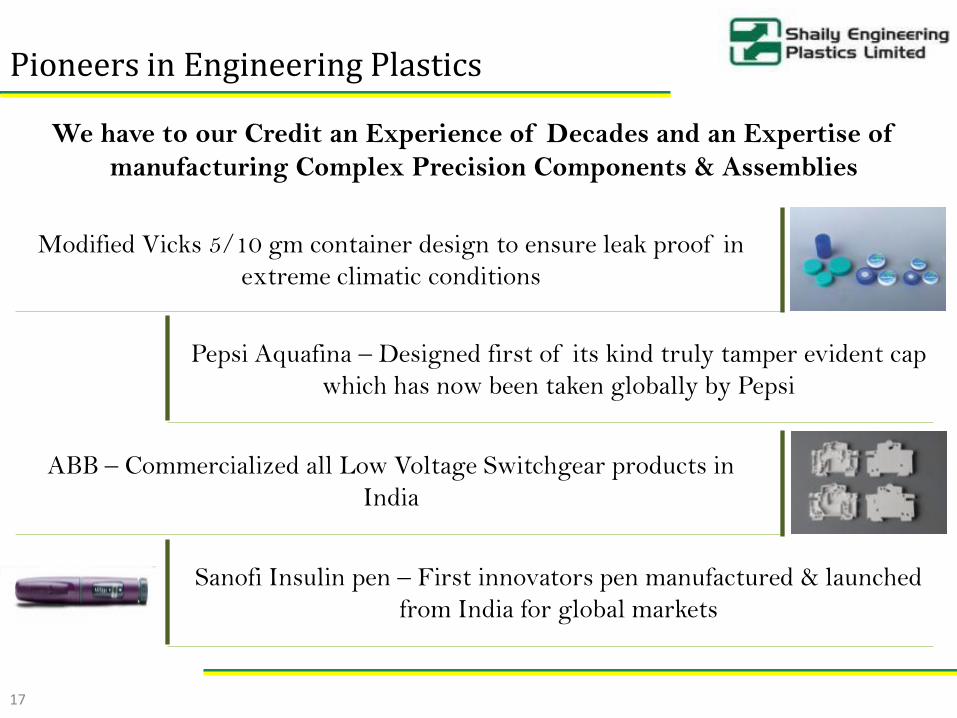
Pioneers in Engineering Plastics
We have to our Credit an Experience of Decades and an Expertise of
manufacturing Complex Precision Components & Assemblies
17
Modified Vicks 5/10 gm container design to ensure leak proof in
extreme climatic conditions
Pepsi Aquafina – Designed first of its kind truly tamper evident cap
which has now been taken globally by Pepsi
ABB – Commercialized all Low Voltage Switchgear products in
India
Sanofi Insulin pen – First innovators pen manufactured & launched
from India for global markets
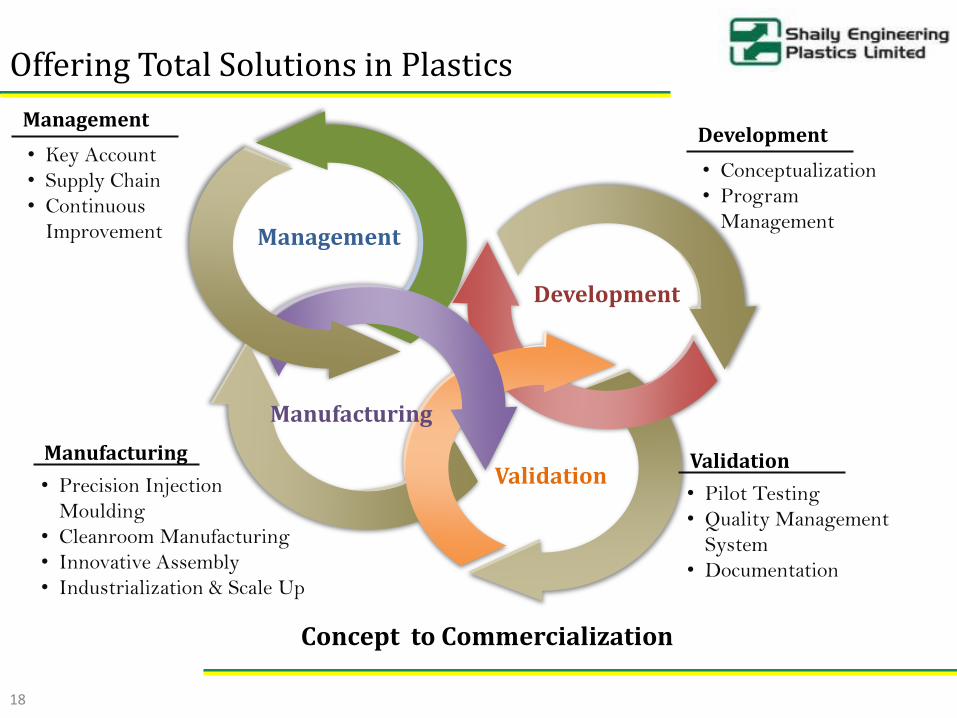
Offering Total Solutions in Plastics
Management
Development
Validation
Manufacturing
• Conceptualization
• Program
Management
Development
• Pilot Testing
• Quality Management
System
• Documentation
Validation• Precision Injection
Moulding
• Cleanroom Manufacturing
• Innovative Assembly
• Industrialization & Scale Up
Manufacturing
• Key Account
• Supply Chain
• Continuous
Improvement
Management
Concept to Commercialization
18

19
Catering to Fortune 100 Companies
Consumer & FMCG
Pharmaceutical
Automotive
Others
Company : Investor Relations Advisors :
Shaily Engineering Plastics Ltd.CIN – L51900GJ1980PLC065554Mr. Sanjay Shah, CFO & VP- [email protected]
www.shaily.com
Strategic Growth Advisors Pvt. Ltd.CIN - U74140MH2010PTC204285Mr. Shogun Jain / Ms. Sanjita [email protected] / [email protected]+91 77383 77756 / +91 7738359389
www.sgapl.net
For further information, please contact:
20