Embed Size (px)
Citation preview

Shadow Price & Sensitivity Analysis
Interpreting Solver outputs
Susana Barreiro
3 March 2021

Shadow prices
Max Z = 3x1 + 5x2
Subject to:
x1 ≤ 4
2x2 ≤ 12
3x1 + 2x2 ≤ 18
And x1 ≥ 0; x2 ≥ 0
X1 number of window batch; X2 number of glass doors batchProfit of windows batch = 3 profit of doors batch = 5 (K€)
Plant 1- produces the aluminum frames (prod. time available = 4 h/week)Plant 2- produces the wood frames (prod. time available = 12)Plant 3- produces the glass and assembles the product (prod. time available = 18)
Resources - the production capacity of each Plant made available (R1, R2, R3), where bi (RHS) represents the hours of production time per week
Max
x1 x2 Z
3 5 0
Total RHS
S1 1 0 <= 4
S2 2 0 <= 12
S3 3 2 0 <= 18
x1 x2
0 0 >= 0
Objective function:
Constraint coeff.
The Excel Formulation
Shadow prices
The initial tableau
Z x1 x2 S1 S2 S3
R0 Z 1 -3 -5 0 0 0 0
R1 S1 0 1 0 1 0 0 4
R2 S2 0 0 2 0 1 0 12
R3 S3 0 3 2 0 0 1 18
Rowbasic
var.
coefficients of:
right side
An example of how to solve this LP problem in Excel
Max
x1 x2 Z
3 5 0
Total RHS
S1 1 0 <= 4
S2 2 0 <= 12
S3 3 2 0 <= 18
x1 x2
0 0 >= 0
Objective function:
Constraint coeff.
The Excel Formulation
Max Z = 3x1 + 5x2
Subject to:
x1 ≤ 4
2x2 ≤ 12
3x1 + 2x2 ≤ 18
And x1 ≥ 0; x2 ≥ 0
Because all the constraint signs are the same, constraint coeff. and their respective RHS can be selected in one step
When each of the constraints has different signs, these must be added one by one.

Shadow prices
Max Z = 3x1 + 5x2
Subject to:
x1 ≤ 4
2x2 ≤ 12
3x1 + 2x2 ≤ 18
And x1 ≥ 0; x2 ≥ 0
There is information we can obtain from the optimal tableau that we don’t get directly in the Excel spreadsheet, but further details can be obtained by clicking on the option Answer under Reports.
Max
x1 x2 Z
3 5 0
Total RHS
S1 1 0 <= 4
S2 2 0 <= 12
S3 3 2 0 <= 18
x1 x2
0 0 >= 0
Objective function:
Constraint coeff.
Shadow pricesMax Time Unlimited, Iterations Unlimited, Precision 0.000001
Max Subproblems Unlimited, Max Integer Sols Unlimited, Integer Tolerance 1%
Objective Cell (Max)
Cell Name Original Value Final Value
$Y$11 Total 0 36
Variable Cells
Cell Name Original Value Final Value Integer
$W$4 S3 x1 0 2 Contin
$X$4 S3 x2 0 6 Contin
Constraints
Cell Name Cell Value Formula Status Slack
$Y$7 S1 Total 2 $Y$7<=$AA$7 Not Binding 2
$Y$8 S2 Total 12 $Y$8<=$AA$8 Binding 0
$Y$9 S3 Total 18 $Y$9<=$AA$9 Binding 0
$W$4 S3 x1 2 $W$4>=0 Not Binding 2
$X$4 S3 x2 6 $X$4>=0 Not Binding 6
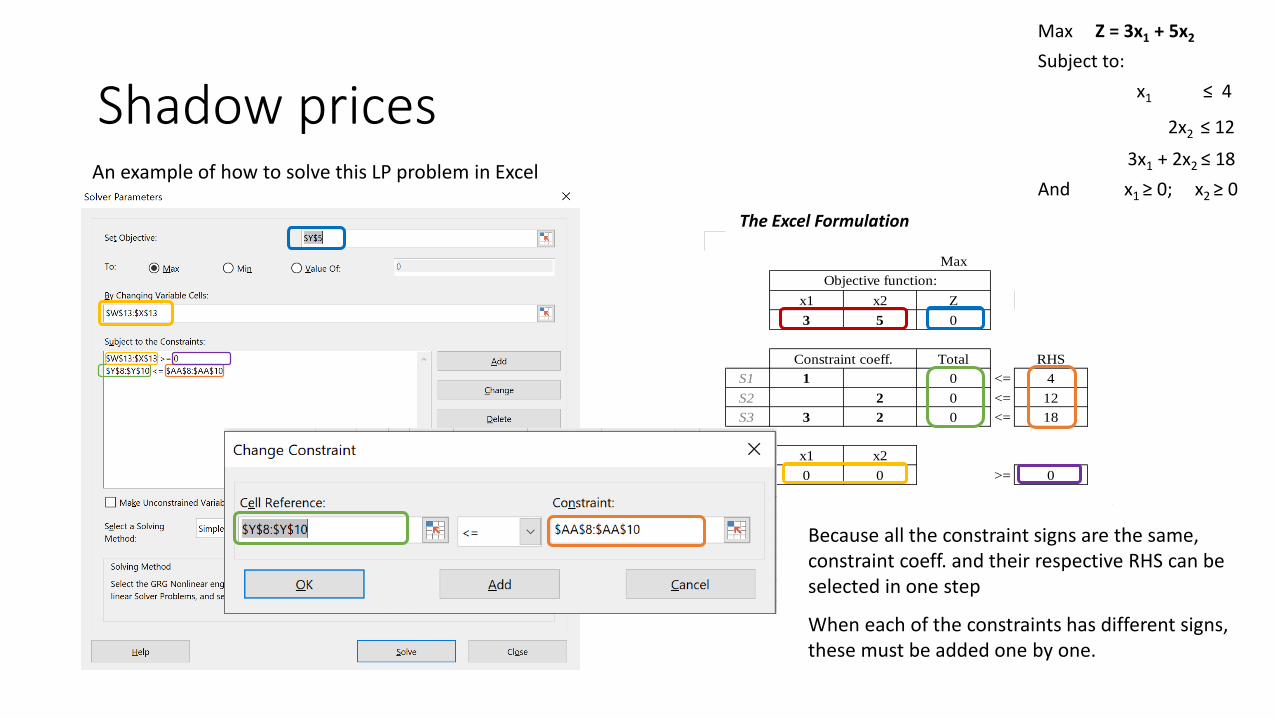
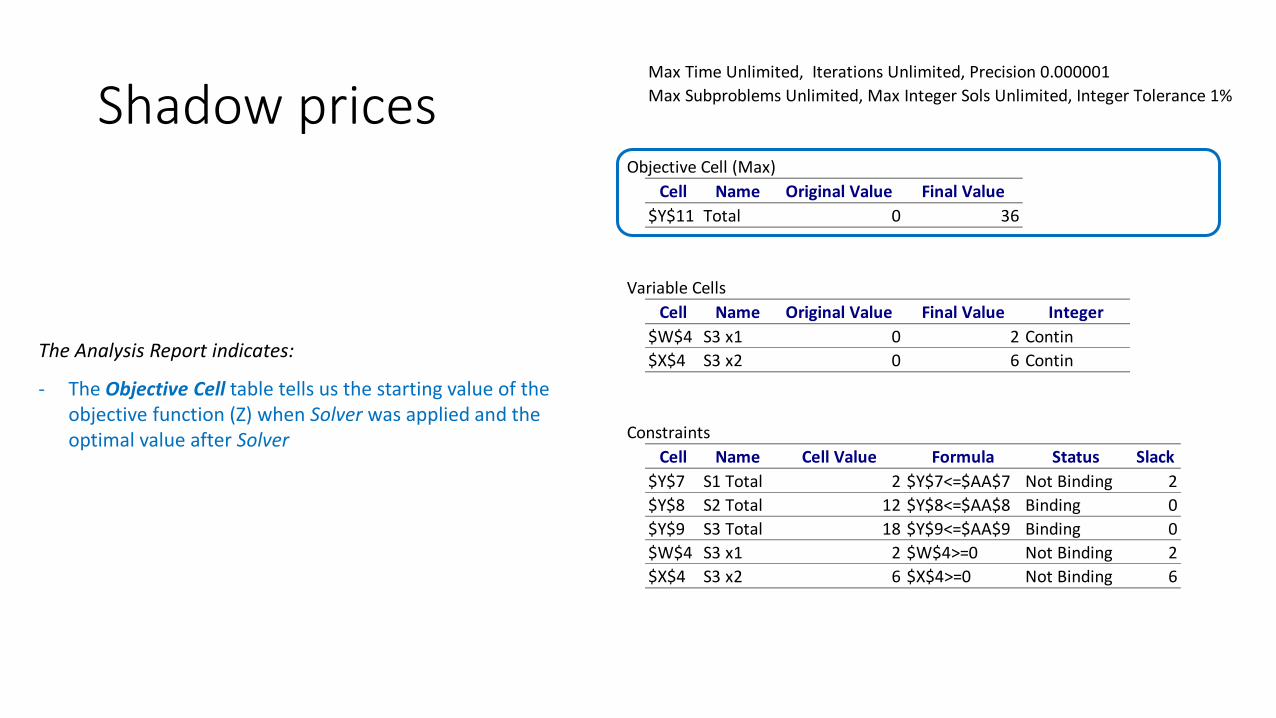
The Analysis Report indicates:
- The Objective Cell table tells us the starting value of the objective function (Z) when Solver was applied and the optimal value after Solver
- The Variables Cells shows the values of the decision variables (x1, x2) for the initial solution and the optimal solution
- The Constraints table provides information regarding the restrictions applied to each of the decision variables and resources (Formula), providing indication on which are the limiting resources (the binding constraints that will have a positive shadow price, but not the shadow price value)
- The initial and optimal solutions (x1, x2, S1, S2) can be read across tables

Shadow pricesMax Time Unlimited, Iterations Unlimited, Precision 0.000001
Max Subproblems Unlimited, Max Integer Sols Unlimited, Integer Tolerance 1%
Objective Cell (Max)
Cell Name Original Value Final Value
$Y$11 Total 0 36
Variable Cells
Cell Name Original Value Final Value Integer
$W$4 S3 x1 0 2 Contin
$X$4 S3 x2 0 6 Contin
Constraints
Cell Name Cell Value Formula Status Slack
$Y$7 S1 Total 2 $Y$7<=$AA$7 Not Binding 2
$Y$8 S2 Total 12 $Y$8<=$AA$8 Binding 0
$Y$9 S3 Total 18 $Y$9<=$AA$9 Binding 0
$W$4 S3 x1 2 $W$4>=0 Not Binding 2
$X$4 S3 x2 6 $X$4>=0 Not Binding 6
The Analysis Report indicates:
- The Objective Cell table tells us the starting value of the objective function (Z) when Solver was applied and the optimal value after Solver
- The Variables Cells shows the values of the decision variables (x1, x2) for the initial solution and the optimal solution
- The Constraints table provides information regarding the restrictions applied to each of the decision variables and resources (Formula), providing indication on which are the limiting resources (the binding constraints that will have a positive shadow price, but not the shadow price value)
- The initial and optimal solutions (x1, x2, S1, S2) can be read across tables
For more detailed information e.g (the shadow prices) a different
option of the Reports should be selected: Sensitivity Analysis
Sensitivity Analysis
The basic idea of Sensitivity Analysis is to be able to give answers to questions such as:
1. If the objective function changes, how does the solution change?
2. If resources available change, how does the solution change?
3. If a constraint is added to the problem, how does the solution change?
(We will just focus on the first 2)

Sensitivity Analysis Microsoft Excel 16.0 Sensitivity Report
Worksheet: [SimplexMethod.xlsx]z-3x1-5x2
Report Created: 28/02/2020 13:56:49
Variable Cells
Final Reduced Objective Allowable Allowable
Cell Name Value Cost Coefficient Increase Decrease
$W$4 S3 x1 2 0 3 4.5 3
$X$4 S3 x2 6 0 5 1E+30 3
Constraints
Final Shadow Constraint Allowable Allowable
Cell Name Value Price R.H. Side Increase Decrease
$Y$7 S1 Total 2 0 4 1E+30 2
$Y$8 S2 Total 12 1.5 12 6 6
$Y$9 S3 Total 18 1 18 6 6
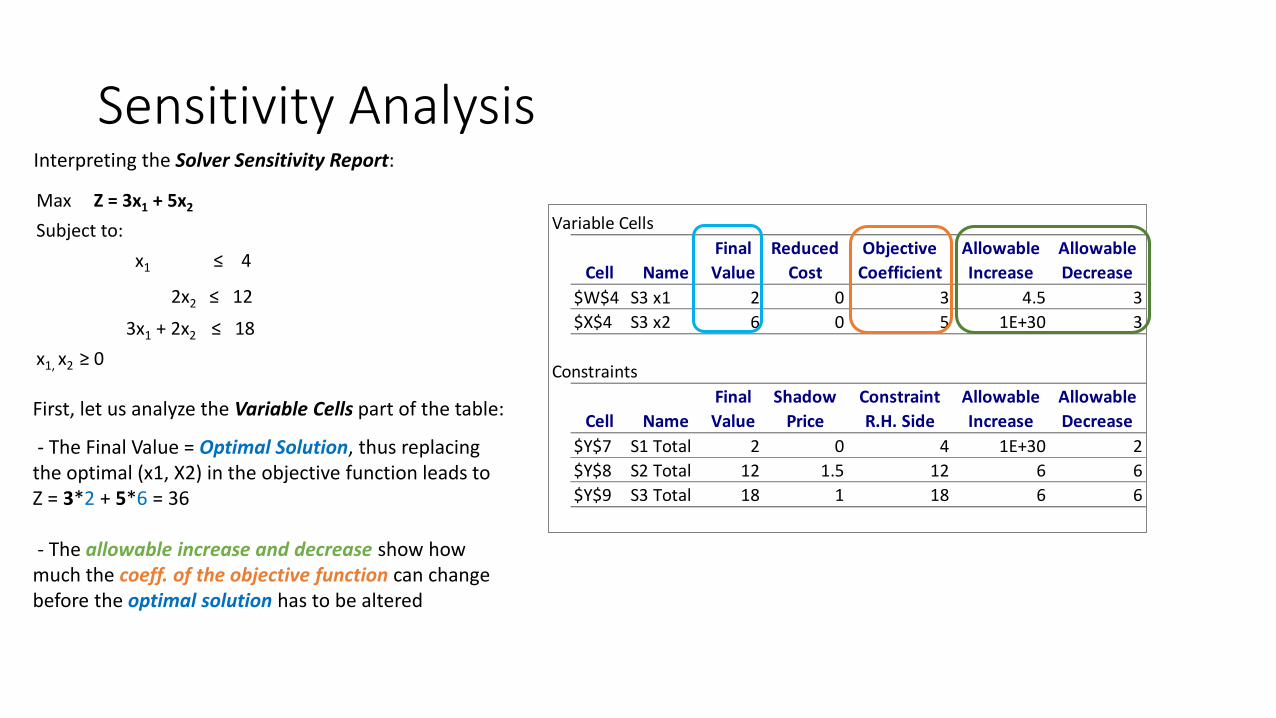
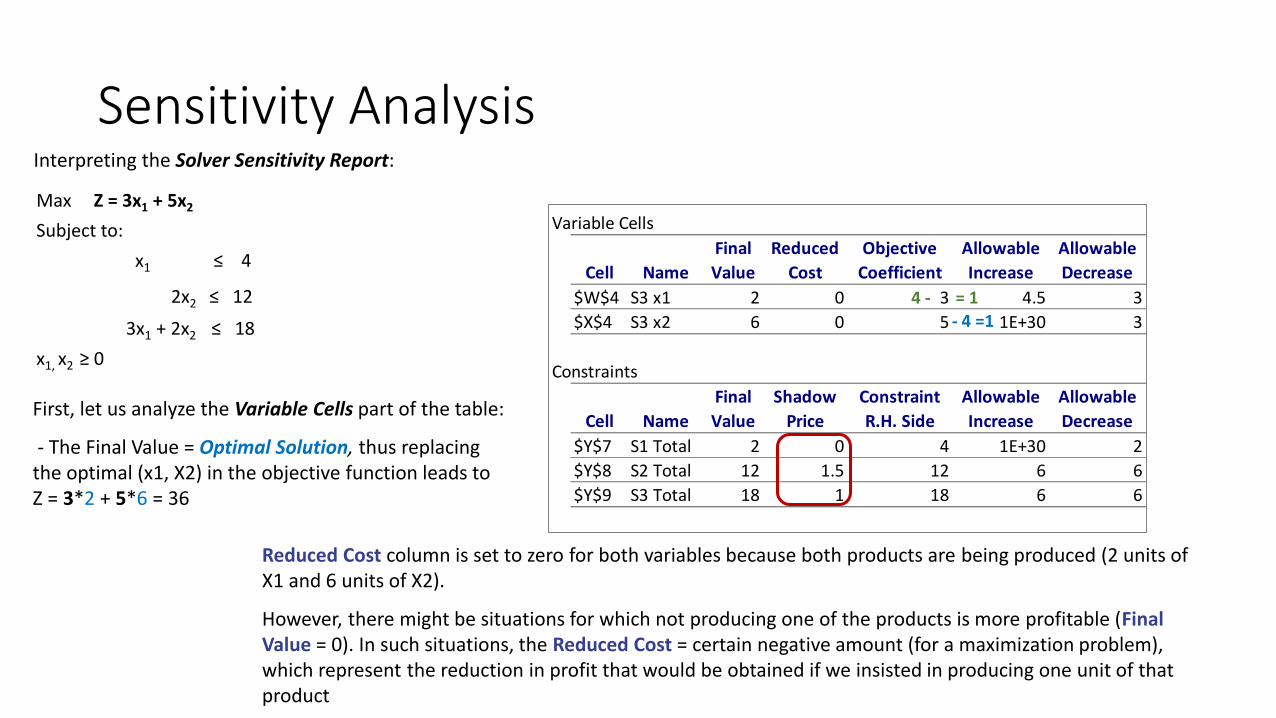
Interpreting the Solver Sensitivity Report:
Max Z = 3x1 + 5x2
Subject to:
x1 ≤ 4
2x2 ≤ 12
3x1 + 2x2 ≤ 18
x1, x2 ≥ 0

Sensitivity Analysis
First, let us analyze the Variable Cells part of the table:
- The Final Value = Optimal Solution, thus replacing the optimal (x1, X2) in the objective function leads to Z = 3*2 + 5*6 = 36
Interpreting the Solver Sensitivity Report:
Max Z = 3x1 + 5x2
Subject to:
x1 ≤ 4
2x2 ≤ 12
3x1 + 2x2 ≤ 18
x1, x2 ≥ 0
Microsoft Excel 16.0 Sensitivity Report
Worksheet: [SimplexMethod.xlsx]z-3x1-5x2
Report Created: 28/02/2020 13:56:49
Variable Cells
Final Reduced Objective Allowable Allowable
Cell Name Value Cost Coefficient Increase Decrease
$W$4 S3 x1 2 0 3 4.5 3
$X$4 S3 x2 6 0 5 1E+30 3
Constraints
Final Shadow Constraint Allowable Allowable
Cell Name Value Price R.H. Side Increase Decrease
$Y$7 S1 Total 2 0 4 1E+30 2
$Y$8 S2 Total 12 1.5 12 6 6
$Y$9 S3 Total 18 1 18 6 6
Sensitivity AnalysisInterpreting the Solver Sensitivity Report:
First, let us analyze the Variable Cells part of the table:
- The Final Value = Optimal Solution, thus replacing the optimal (x1, X2) in the objective function leads to Z = 3*2 + 5*6 = 36
- The allowable increase and decrease show how much the coeff. of the objective function can change before the optimal solution has to be altered
Max Z = 3x1 + 5x2
Subject to:
x1 ≤ 4
2x2 ≤ 12
3x1 + 2x2 ≤ 18
x1, x2 ≥ 0

Microsoft Excel 16.0 Sensitivity Report
Worksheet: [SimplexMethod.xlsx]z-3x1-5x2
Report Created: 28/02/2020 13:56:49
Variable Cells
Final Reduced Objective Allowable Allowable
Cell Name Value Cost Coefficient Increase Decrease
$W$4 S3 x1 2 0 3 4.5 3
$X$4 S3 x2 6 0 5 1E+30 3
Constraints
Final Shadow Constraint Allowable Allowable
Cell Name Value Price R.H. Side Increase Decrease
$Y$7 S1 Total 2 0 4 1E+30 2
$Y$8 S2 Total 12 1.5 12 6 6
$Y$9 S3 Total 18 1 18 6 6
Sensitivity AnalysisInterpreting the Solver Sensitivity Report:
First, let us analyze the Variable Cells part of the table:
- The Final Value = Optimal Solution, thus replacing the optimal (x1, X2) in the objective function leads to Z = 3*2 + 5*6 = 36
Max Z = 3x1 + 5x2
Subject to:
x1 ≤ 4
2x2 ≤ 12
3x1 + 2x2 ≤ 18
x1, x2 ≥ 0
+ 7.5 0
Upper Limit
Lower Limit
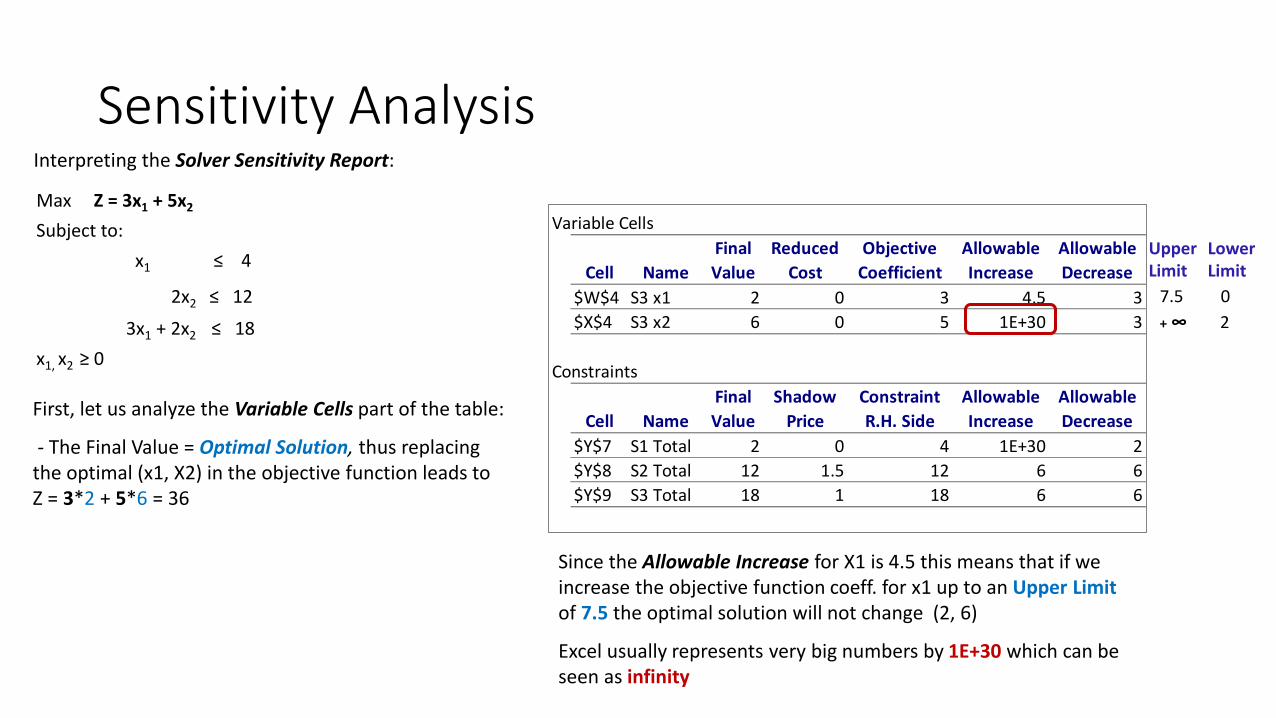
Since the Allowable Increase for X1 is 4.5 this means that if we increase the objective function coeff. for x1 up to an Upper Limit of 7.5 the optimal solution will not change (2, 6)
Microsoft Excel 16.0 Sensitivity Report
Worksheet: [SimplexMethod.xlsx]z-3x1-5x2
Report Created: 28/02/2020 13:56:49
Variable Cells
Final Reduced Objective Allowable Allowable
Cell Name Value Cost Coefficient Increase Decrease
$W$4 S3 x1 2 0 3 4.5 3
$X$4 S3 x2 6 0 5 1E+30 3
Constraints
Final Shadow Constraint Allowable Allowable
Cell Name Value Price R.H. Side Increase Decrease
$Y$7 S1 Total 2 0 4 1E+30 2
$Y$8 S2 Total 12 1.5 12 6 6
$Y$9 S3 Total 18 1 18 6 6
Sensitivity AnalysisInterpreting the Solver Sensitivity Report:
First, let us analyze the Variable Cells part of the table:
- The Final Value = Optimal Solution, thus replacing the optimal (x1, X2) in the objective function leads to Z = 3*2 + 5*6 = 36
Max Z = 3x1 + 5x2
Subject to:
x1 ≤ 4
2x2 ≤ 12
3x1 + 2x2 ≤ 18
x1, x2 ≥ 0
Since the Allowable Increase for X1 is 4.5 this means that if we increase the objective function coeff. for x1 up to an Upper Limit of 7.5 the optimal solution will not change (2, 6)
Excel usually represents very big numbers by 1E+30 which can be seen as infinity
Upper Limit
Lower Limit
7.5 0
+ ∞ 2
3Microsoft Excel 16.0 Sensitivity Report
Worksheet: [SimplexMethod.xlsx]z-3x1-5x2
Report Created: 28/02/2020 13:56:49
Variable Cells
Final Reduced Objective Allowable Allowable
Cell Name Value Cost Coefficient Increase Decrease
$W$4 S3 x1 2 0 3 4.5 3
$X$4 S3 x2 6 0 5 1E+30 3
Constraints
Final Shadow Constraint Allowable Allowable
Cell Name Value Price R.H. Side Increase Decrease
$Y$7 S1 Total 2 0 4 1E+30 2
$Y$8 S2 Total 12 1.5 12 6 6
$Y$9 S3 Total 18 1 18 6 6
Sensitivity AnalysisInterpreting the Solver Sensitivity Report:
First, let us analyze the Variable Cells part of the table:
- The Final Value = Optimal Solution, thus replacing the optimal (x1, X2) in the objective function leads to Z = 3*2 + 5*6 = 36
Max Z = 3x1 + 5x2
Subject to:
x1 ≤ 4
2x2 ≤ 12
3x1 + 2x2 ≤ 18
x1, x2 ≥ 0
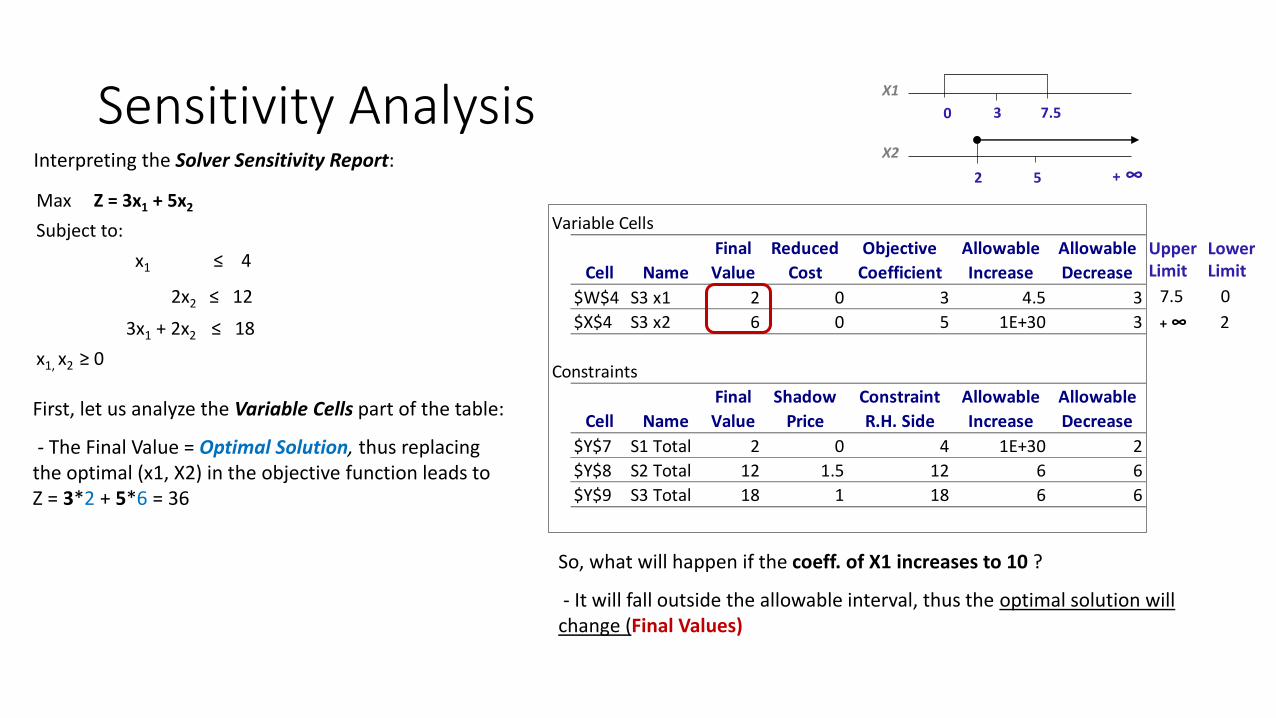
So, what will happen if the coeff. of X1 increases to 10 ?
- It will fall outside the allowable interval, thus the optimal solution will change (Final Values)
Upper Limit
Lower Limit
52 + ∞X2
X1
0 7.5
7.5 0
+ ∞ 2

3Microsoft Excel 16.0 Sensitivity Report
Worksheet: [SimplexMethod.xlsx]z-3x1-5x2
Report Created: 28/02/2020 13:56:49
Variable Cells
Final Reduced Objective Allowable Allowable
Cell Name Value Cost Coefficient Increase Decrease
$W$4 S3 x1 2 0 3 4.5 3
$X$4 S3 x2 6 0 5 1E+30 3
Constraints
Final Shadow Constraint Allowable Allowable
Cell Name Value Price R.H. Side Increase Decrease
$Y$7 S1 Total 2 0 4 1E+30 2
$Y$8 S2 Total 12 1.5 12 6 6
$Y$9 S3 Total 18 1 18 6 6
Sensitivity AnalysisInterpreting the Solver Sensitivity Report:
First, let us analyze the Variable Cells part of the table:
- The Final Value = Optimal Solution, thus replacing the optimal (x1, X2) in the objective function leads to Z = 3*2 + 5*6 = 36
Max Z = 3x1 + 5x2
Subject to:
x1 ≤ 4
2x2 ≤ 12
3x1 + 2x2 ≤ 18
x1, x2 ≥ 0
So, what will happen if the coeff. of X1 increases to 10 ?
- It will fall outside the allowable interval, thus the optimal solution will change (Final Values)
And what will happen if the coeff. of X1 increases to 6 ?
- The optimal solution will remain optimal but Z = 6*2 + 5*6 = 42
Upper Limit
Lower Limit
52 + ∞X2
X1
0 7.5
7.5 0
+ ∞ 2

3Microsoft Excel 16.0 Sensitivity Report
Worksheet: [SimplexMethod.xlsx]z-3x1-5x2
Report Created: 28/02/2020 13:56:49
Variable Cells
Final Reduced Objective Allowable Allowable
Cell Name Value Cost Coefficient Increase Decrease
$W$4 S3 x1 2 0 3 4.5 3
$X$4 S3 x2 6 0 5 1E+30 3
Constraints
Final Shadow Constraint Allowable Allowable
Cell Name Value Price R.H. Side Increase Decrease
$Y$7 S1 Total 2 0 4 1E+30 2
$Y$8 S2 Total 12 1.5 12 6 6
$Y$9 S3 Total 18 1 18 6 6
Sensitivity AnalysisInterpreting the Solver Sensitivity Report:
First, let us analyze the Variable Cells part of the table:
- The Final Value = Optimal Solution, thus replacing the optimal (x1, X2) in the objective function leads to Z = 3*2 + 5*6 = 36
Max Z = 3x1 + 5x2
Subject to:
x1 ≤ 4
2x2 ≤ 12
3x1 + 2x2 ≤ 18
x1, x2 ≥ 0
And what will happen if both coeff. X1 and X2 change to 4 (simultaneous changes)?
- This optimality report only applies to individual changes and to answer the question we will have to calculate 100% Rule:
X1 increases in 1 unit, so: 1 / 4.5 (allowable increase) = 0.22X2 decreases in 1 unit, so: 1 / 3 (allowable decrease) = 0.33
Upper Limit
Lower Limit
52 + ∞X2
X1
0 7.5
7.5 0
+ ∞ 2
4 - = 1- 4 =1
0.22 + 0.33 = 0.55 % <100%
Solution remains optimalZ = 4*2 + 4*6 = 32
Microsoft Excel 16.0 Sensitivity Report
Worksheet: [SimplexMethod.xlsx]z-3x1-5x2
Report Created: 28/02/2020 13:56:49
Variable Cells
Final Reduced Objective Allowable Allowable
Cell Name Value Cost Coefficient Increase Decrease
$W$4 S3 x1 2 0 3 4.5 3
$X$4 S3 x2 6 0 5 1E+30 3
Constraints
Final Shadow Constraint Allowable Allowable
Cell Name Value Price R.H. Side Increase Decrease
$Y$7 S1 Total 2 0 4 1E+30 2
$Y$8 S2 Total 12 1.5 12 6 6
$Y$9 S3 Total 18 1 18 6 6
Sensitivity AnalysisInterpreting the Solver Sensitivity Report:
First, let us analyze the Variable Cells part of the table:
- The Final Value = Optimal Solution, thus replacing the optimal (x1, X2) in the objective function leads to Z = 3*2 + 5*6 = 36
Max Z = 3x1 + 5x2
Subject to:
x1 ≤ 4
2x2 ≤ 12
3x1 + 2x2 ≤ 18
x1, x2 ≥ 0
Reduced Cost column is set to zero for both variables because both products are being produced (2 units of X1 and 6 units of X2).
However, there might be situations for which not producing one of the products is more profitable (Final Value = 0). In such situations, the Reduced Cost = certain negative amount (for a maximization problem), which represent the reduction in profit that would be obtained if we insisted in producing one unit of that product
4 - = 1- 4 =1
Microsoft Excel 16.0 Sensitivity Report
Worksheet: [SimplexMethod.xlsx]z-3x1-5x2
Report Created: 28/02/2020 13:56:49
Variable Cells
Final Reduced Objective Allowable Allowable
Cell Name Value Cost Coefficient Increase Decrease
$W$4 S3 x1 2 0 3 4.5 3
$X$4 S3 x2 6 0 5 1E+30 3
Constraints
Final Shadow Constraint Allowable Allowable
Cell Name Value Price R.H. Side Increase Decrease
$Y$7 S1 Total 2 0 4 1E+30 2
$Y$8 S2 Total 12 1.5 12 6 6
$Y$9 S3 Total 18 1 18 6 6
Sensitivity AnalysisInterpreting the Solver Sensitivity Report:
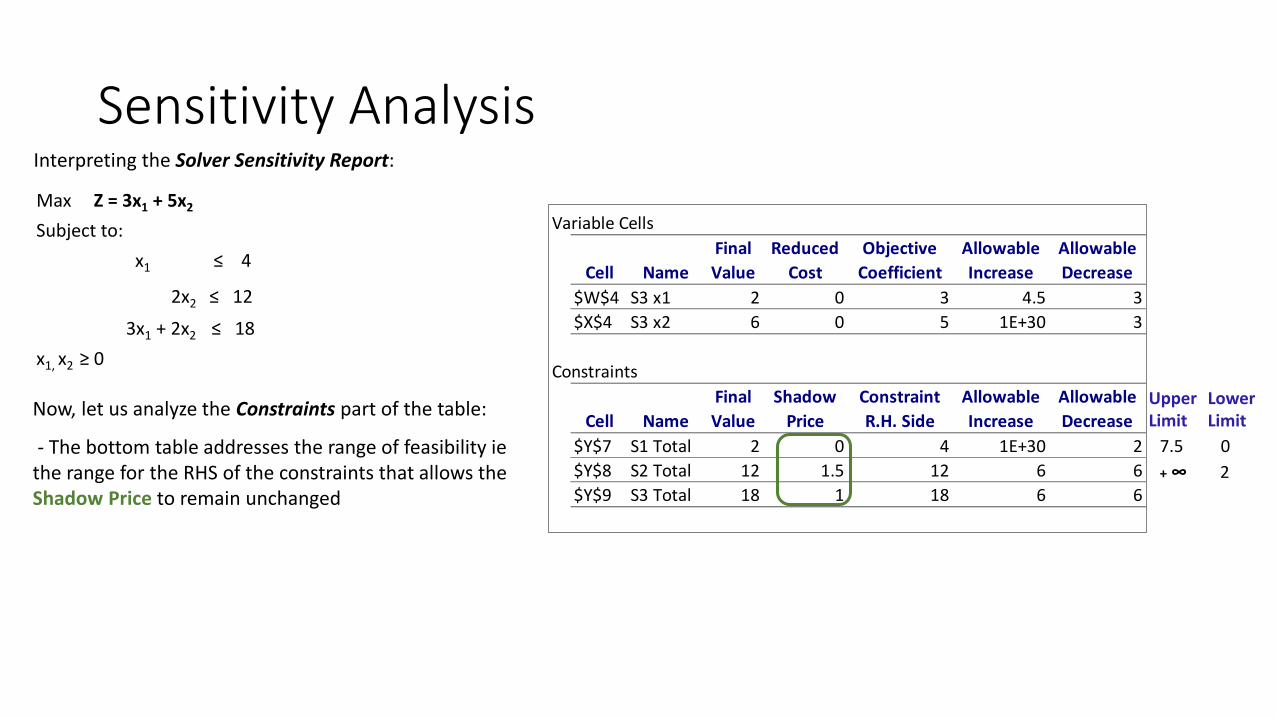
Now, let us analyze the Constraints part of the table:
- The bottom table addresses the range of feasibility iethe range for the RHS of the constraints that allows the Shadow Price to remain unchanged
Max Z = 3x1 + 5x2
Subject to:
x1 ≤ 4
2x2 ≤ 12
3x1 + 2x2 ≤ 18
x1, x2 ≥ 0
Upper Limit
Lower Limit
7.5 0
+ ∞ 2

Microsoft Excel 16.0 Sensitivity Report
Worksheet: [SimplexMethod.xlsx]z-3x1-5x2
Report Created: 28/02/2020 13:56:49
Variable Cells
Final Reduced Objective Allowable Allowable
Cell Name Value Cost Coefficient Increase Decrease
$W$4 S3 x1 2 0 3 4.5 3
$X$4 S3 x2 6 0 5 1E+30 3
Constraints
Final Shadow Constraint Allowable Allowable
Cell Name Value Price R.H. Side Increase Decrease
$Y$7 S1 Total 2 0 4 1E+30 2
$Y$8 S2 Total 12 1.5 12 6 6
$Y$9 S3 Total 18 1 18 6 6
Sensitivity AnalysisInterpreting the Solver Sensitivity Report:
Now, let us analyze the Constraints part of the table:
- The bottom table addresses the range of feasibility iethe range for the RHS of the constraints that allows the Shadow Price to remain unchanged
Max Z = 3x1 + 5x2
Subject to:
x1 ≤ 4
2x2 ≤ 12
3x1 + 2x2 ≤ 18
x1, x2 ≥ 0
Upper Limit
Lower Limit
+ ∞ 2
18 618 12
Increase in Z resulting of an Unit increase in
the RHS of a constraint

Microsoft Excel 16.0 Sensitivity Report
Worksheet: [SimplexMethod.xlsx]z-3x1-5x2
Report Created: 28/02/2020 13:56:49
Variable Cells
Final Reduced Objective Allowable Allowable
Cell Name Value Cost Coefficient Increase Decrease
$W$4 S3 x1 2 0 3 4.5 3
$X$4 S3 x2 6 0 5 1E+30 3
Constraints
Final Shadow Constraint Allowable Allowable
Cell Name Value Price R.H. Side Increase Decrease
$Y$7 S1 Total 2 0 4 1E+30 2
$Y$8 S2 Total 12 1.5 12 6 6
$Y$9 S3 Total 18 1 18 6 6
Sensitivity AnalysisInterpreting the Solver Sensitivity Report:
Now, let us analyze the Constraints part of the table:
- The bottom table addresses the range of feasibility iethe range for the RHS of the constraints that allows the Shadow Price to remain unchanged
Max Z = 3x1 + 5x2
Subject to:
x1 ≤ 4
2x2 ≤ 12
3x1 + 2x2 ≤ 18
x1, x2 ≥ 0
Upper Limit
Lower Limit
+ ∞ 2
18 6
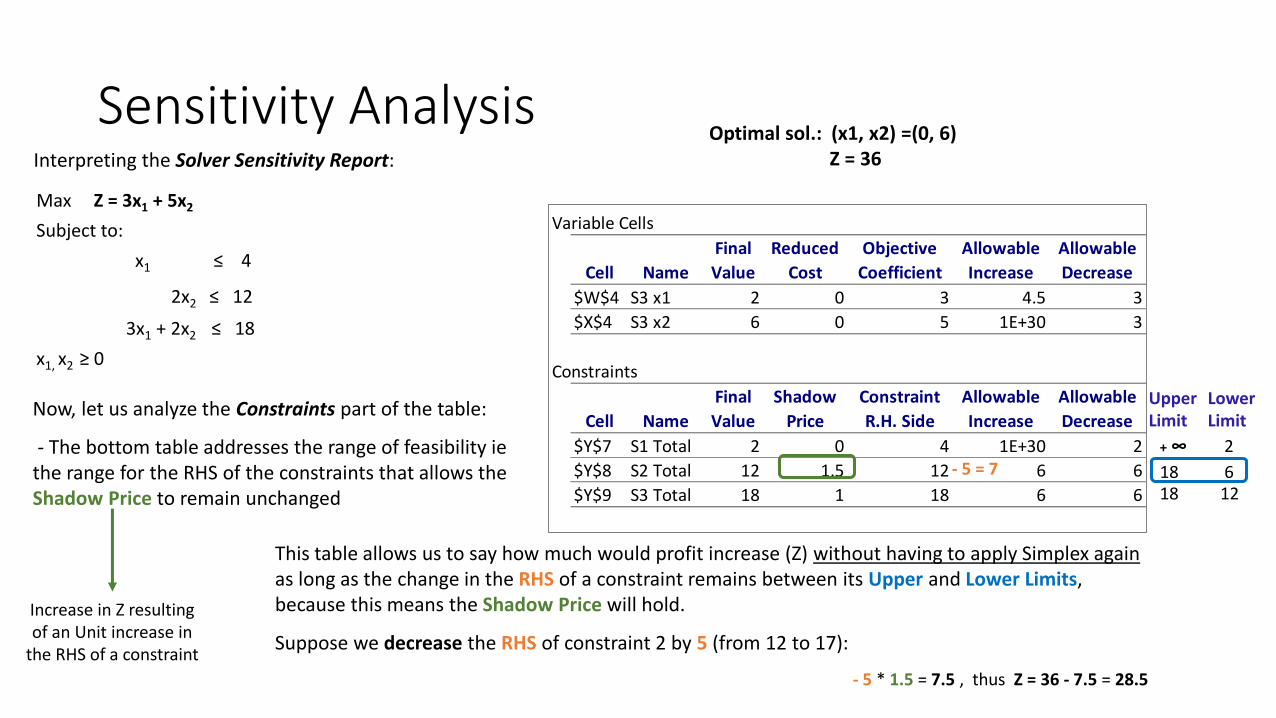
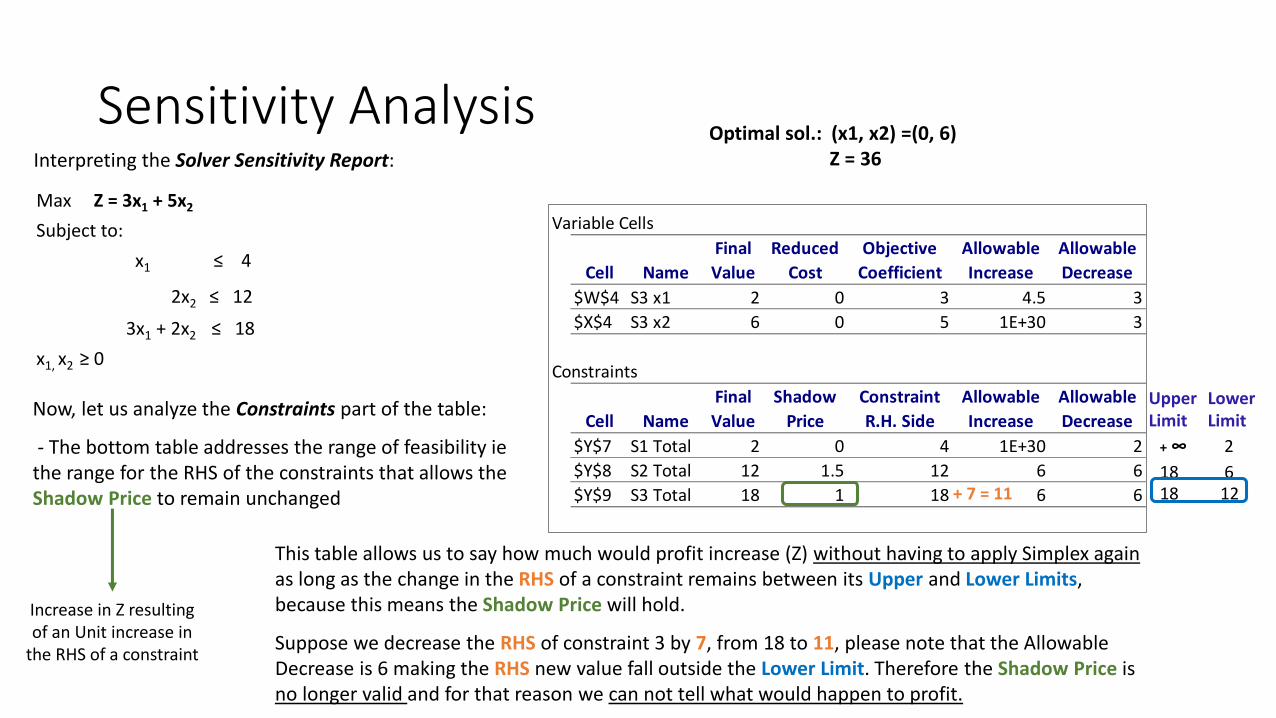
This table allows us to say how much would profit increase (Z) without having to apply Simplex again as long as the change in the RHS of a constraint remains between its Upper and Lower Limits, because this means the Shadow Price will hold.
18 12
Optimal sol.: (x1, x2) =(0, 6)Z = 36
Increase in Z resulting of an Unit increase in
the RHS of a constraint

Microsoft Excel 16.0 Sensitivity Report
Worksheet: [SimplexMethod.xlsx]z-3x1-5x2
Report Created: 28/02/2020 13:56:49
Variable Cells
Final Reduced Objective Allowable Allowable
Cell Name Value Cost Coefficient Increase Decrease
$W$4 S3 x1 2 0 3 4.5 3
$X$4 S3 x2 6 0 5 1E+30 3
Constraints
Final Shadow Constraint Allowable Allowable
Cell Name Value Price R.H. Side Increase Decrease
$Y$7 S1 Total 2 0 4 1E+30 2
$Y$8 S2 Total 12 1.5 12 6 6
$Y$9 S3 Total 18 1 18 6 6
Sensitivity AnalysisInterpreting the Solver Sensitivity Report:
Now, let us analyze the Constraints part of the table:
- The bottom table addresses the range of feasibility iethe range for the RHS of the constraints that allows the Shadow Price to remain unchanged
Max Z = 3x1 + 5x2
Subject to:
x1 ≤ 4
2x2 ≤ 12
3x1 + 2x2 ≤ 18
x1, x2 ≥ 0
Upper Limit
Lower Limit
+ ∞ 2
18 6
This table allows us to say how much would profit increase (Z) without having to apply Simplex again as long as the change in the RHS of a constraint remains between its Upper and Lower Limits, because this means the Shadow Price will hold.
Suppose we increase the RHS of constraint 2 by 5 (from 12 to 17):
5 * 1.5 = 7.5 , thus Z = 36 + 7.5 = 43.5
18 12
Optimal sol.: (x1, x2) =(0, 6)Z = 36
+ 5 = 17
Increase in Z resulting of an Unit increase in
the RHS of a constraint
Microsoft Excel 16.0 Sensitivity Report
Worksheet: [SimplexMethod.xlsx]z-3x1-5x2
Report Created: 28/02/2020 13:56:49
Variable Cells
Final Reduced Objective Allowable Allowable
Cell Name Value Cost Coefficient Increase Decrease
$W$4 S3 x1 2 0 3 4.5 3
$X$4 S3 x2 6 0 5 1E+30 3
Constraints
Final Shadow Constraint Allowable Allowable
Cell Name Value Price R.H. Side Increase Decrease
$Y$7 S1 Total 2 0 4 1E+30 2
$Y$8 S2 Total 12 1.5 12 6 6
$Y$9 S3 Total 18 1 18 6 6
Sensitivity AnalysisInterpreting the Solver Sensitivity Report:
Now, let us analyze the Constraints part of the table:
- The bottom table addresses the range of feasibility iethe range for the RHS of the constraints that allows the Shadow Price to remain unchanged
Max Z = 3x1 + 5x2
Subject to:
x1 ≤ 4
2x2 ≤ 12
3x1 + 2x2 ≤ 18
x1, x2 ≥ 0
Upper Limit
Lower Limit
+ ∞ 2
18 6
This table allows us to say how much would profit increase (Z) without having to apply Simplex again as long as the change in the RHS of a constraint remains between its Upper and Lower Limits, because this means the Shadow Price will hold.
Suppose we decrease the RHS of constraint 2 by 5 (from 12 to 17):
- 5 * 1.5 = 7.5 , thus Z = 36 - 7.5 = 28.5
18 12
Optimal sol.: (x1, x2) =(0, 6)Z = 36
- 5 = 7
Increase in Z resulting of an Unit increase in
the RHS of a constraint
Microsoft Excel 16.0 Sensitivity Report
Worksheet: [SimplexMethod.xlsx]z-3x1-5x2
Report Created: 28/02/2020 13:56:49
Variable Cells
Final Reduced Objective Allowable Allowable
Cell Name Value Cost Coefficient Increase Decrease
$W$4 S3 x1 2 0 3 4.5 3
$X$4 S3 x2 6 0 5 1E+30 3
Constraints
Final Shadow Constraint Allowable Allowable
Cell Name Value Price R.H. Side Increase Decrease
$Y$7 S1 Total 2 0 4 1E+30 2
$Y$8 S2 Total 12 1.5 12 6 6
$Y$9 S3 Total 18 1 18 6 6
Sensitivity AnalysisInterpreting the Solver Sensitivity Report:
Now, let us analyze the Constraints part of the table:
- The bottom table addresses the range of feasibility iethe range for the RHS of the constraints that allows the Shadow Price to remain unchanged
Max Z = 3x1 + 5x2
Subject to:
x1 ≤ 4
2x2 ≤ 12
3x1 + 2x2 ≤ 18
x1, x2 ≥ 0
Upper Limit
Lower Limit
+ ∞ 2
18 6
This table allows us to say how much would profit increase (Z) without having to apply Simplex again as long as the change in the RHS of a constraint remains between its Upper and Lower Limits, because this means the Shadow Price will hold.
Suppose we decrease the RHS of constraint 3 by 7, from 18 to 11, please note that the Allowable Decrease is 6 making the RHS new value fall outside the Lower Limit. Therefore the Shadow Price is no longer valid and for that reason we can not tell what would happen to profit.
18 12
Optimal sol.: (x1, x2) =(0, 6)Z = 36
+ 7 = 11
Increase in Z resulting of an Unit increase in
the RHS of a constraint