Embed Size (px)
Citation preview

Shadow EconomiesEconomic Survival Strategies Of Toronto Immigrant Communities October 2013

Funded by Wellesley InstituteLocal Immigration Partnership program, Toronto East Neighbourhood funded by Citizenship Immigration Canada
REsEaRCh PaRTNERsaction for Neighbourhood Change – Taylor MasseyBangladeshi Canadian Community servicesChinese Canadian National Council – Toronto ChapterEast african Riverdale associationNeighbourhood LinkWoodGreen Community services
ReseaRch TeamLead Researcher & Data Analyst: Nasima akter, Ph.D. (Bangladeshi-canadian community services)Project Supervisor and Research Support: sevgul Topkara-sarsu, Ph.D. (WoodGreen community services)Researcher Coordinator: Leqin Lu (chinese canadian National council – Toronto)Research Assistant: suad abukar (east african Riverdale association)Financial Coordinator: Bob mcLellan (Neighbourhood Link)Technical Assistance: Luis Lozano, m.D., sandra Guerra, mohammad hayat, Kay Dyson Tam (WoodGreen community services)Key Informant Interviews: sevgul Topkara-sarsu, Ph.D. (WoodGreen community services)Advisor: Tom ZizysWriter: Diane Dyson (WoodGreen community services)
CommunITy ReSeARCheRSmirza m. Rahmansk. monira hoqueNilufer Begum Lei Zhao Jianping Dong Xian Xing (Jenny) Jiang muna Rage suad abukar
DATA enTRyabu hanifJingyao ZhangJustin carrollTanya shahriarXiaoli Liang

10 alcorn ave, suite 300Toronto, ON, canada m4V [email protected]
ChIneSe-LAnguAge TRAnSLATIon AnD InTeRPReTATIonLeqin LuXian Xing (Jenny) JiangXiaoli Liang
Acknowledgementsmuch thanks to Brenda Roche, sheila Block, Jo snyder and staff at the Wellesley Institute for their patient and stalwart support and guidance during this project.Thanks to the anonymous reviewers for their thoughtful comments on the paper. The views, analysis and interpretation of this review remain those of the research team.
copies of this report can be downloaded from www.wellesleyinstitute.com.
shadow economies | Research Report© Wellesley Institute 2013
The Wellesley Institute engages in research, policy and community mobilization to advance population health.
all references to this paper should be cited as:
akter, Nasima; Topkara-sarsu, sevgul; and Dyson, Diane. “shadow
Economies: Economic survival strategies of Toronto Immigrant
Communities.” Toronto East Local Immigration Partnership workgroup
(action for Neighbourhood Change – Taylor Massey, Bangladeshi-
Canadian Community services, Chinese Canadian National Council –
Toronto Chapter, Neighbourhood Link, Riverdale East african association,
WoodGreen Community services), Toronto: Wellesley Institute. 2013.
Toronto East Local Immigration Partnership
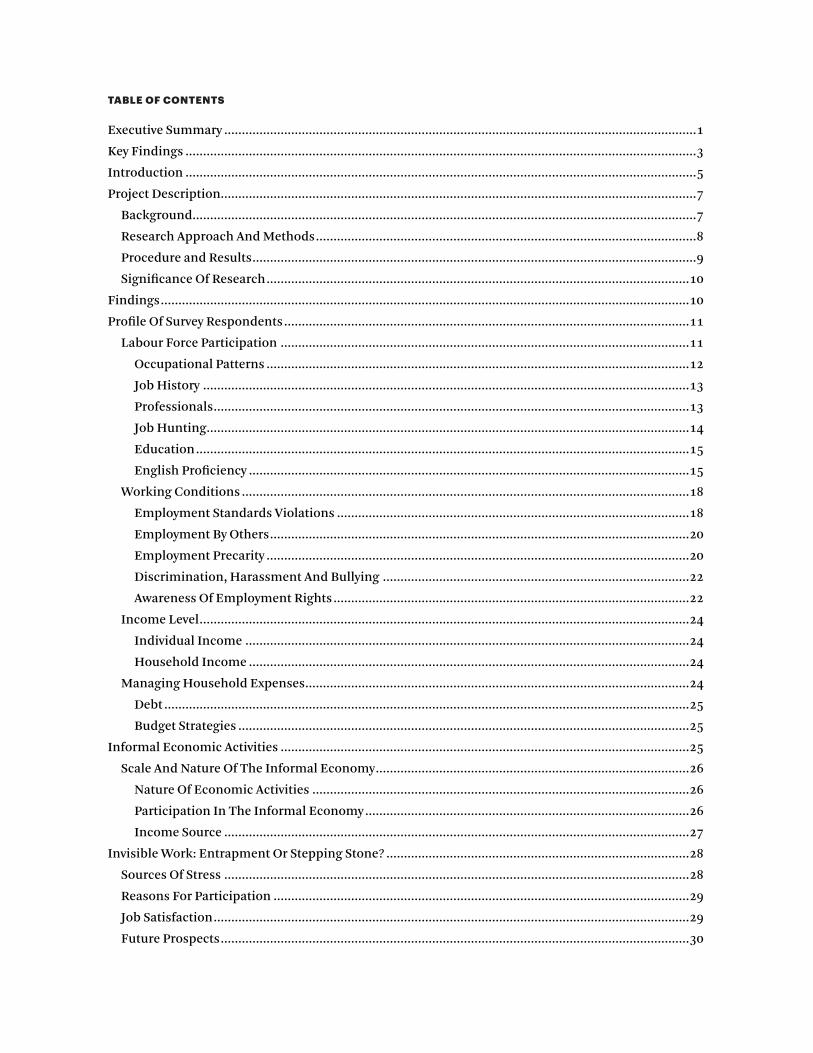
Table of ConTenTs
Executive summary ......................................................................................................................................1
Key Findings .................................................................................................................................................3
Introduction .................................................................................................................................................5
Project Description.......................................................................................................................................7
Background...............................................................................................................................................7
Research approach and Methods ............................................................................................................8
Procedure and Results ..............................................................................................................................9
significance Of Research ........................................................................................................................10
Findings ......................................................................................................................................................10
Profile Of survey Respondents ...................................................................................................................11
Labour Force Participation ....................................................................................................................11
Occupational Patterns ........................................................................................................................12
Job history ..........................................................................................................................................13
Professionals .......................................................................................................................................13
Job hunting .........................................................................................................................................14
Education ............................................................................................................................................15
English Proficiency .............................................................................................................................15
Working Conditions ...............................................................................................................................18
Employment standards Violations ....................................................................................................18
Employment By Others .......................................................................................................................20
Employment Precarity ........................................................................................................................20
Discrimination, harassment and Bullying .......................................................................................22
awareness Of Employment Rights .....................................................................................................22
Income Level ...........................................................................................................................................24
Individual Income ..............................................................................................................................24
household Income .............................................................................................................................24
Managing household Expenses .............................................................................................................24
Debt .....................................................................................................................................................25
Budget strategies ................................................................................................................................25
Informal Economic activities ....................................................................................................................25
scale and Nature Of The Informal Economy .........................................................................................26
Nature Of Economic activities ...........................................................................................................26
Participation In The Informal Economy ............................................................................................26
Income source ....................................................................................................................................27
Invisible Work: Entrapment Or stepping stone? ......................................................................................28
sources Of stress ....................................................................................................................................28
Reasons For Participation ......................................................................................................................29
Job satisfaction .......................................................................................................................................29
Future Prospects .....................................................................................................................................30
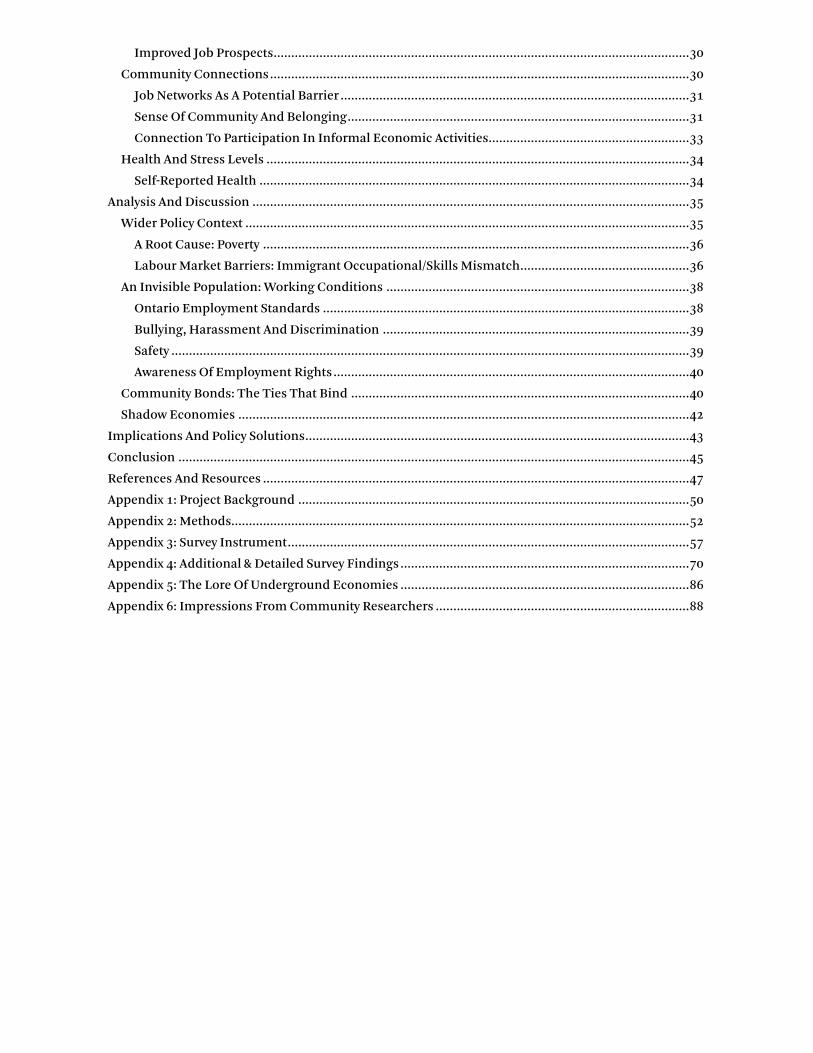
Improved Job Prospects ......................................................................................................................30
Community Connections .......................................................................................................................30
Job Networks as a Potential Barrier ...................................................................................................31
sense Of Community and Belonging .................................................................................................31
Connection To Participation In Informal Economic activities .........................................................33
health and stress Levels ........................................................................................................................34
self-Reported health ..........................................................................................................................34
analysis and Discussion ............................................................................................................................35
Wider Policy Context ..............................................................................................................................35
a Root Cause: Poverty .........................................................................................................................36
Labour Market Barriers: Immigrant Occupational/skills Mismatch ................................................36
an Invisible Population: Working Conditions ......................................................................................38
Ontario Employment standards ........................................................................................................38
Bullying, harassment and Discrimination .......................................................................................39
safety ...................................................................................................................................................39
awareness Of Employment Rights .....................................................................................................40
Community Bonds: The Ties That Bind ................................................................................................40
shadow Economies ................................................................................................................................42
Implications and Policy solutions .............................................................................................................43
Conclusion .................................................................................................................................................45
References and Resources .........................................................................................................................47
appendix 1: Project Background ...............................................................................................................50
appendix 2: Methods..................................................................................................................................52
appendix 3: survey Instrument ..................................................................................................................57
appendix 4: additional & Detailed survey Findings ..................................................................................70
appendix 5: The Lore Of Underground Economies ..................................................................................86
appendix 6: Impressions From Community Researchers ........................................................................88
the wellesley institute 1
EXECUTIVE SUMMARY
Shadow Economies
Economic Survival Strategies Of Toronto Immigrant CommunitiesNumerous research reports have described the poor labour market outcomes and resultant low-incomes
and poverty faced by Canadian immigrants. a substantial number of immigrants are not only blocked
from entering the professions for which they trained and were then recruited to Canada, but a substantial
portion of them are not in any type or form of secure employment. Instead, Canadian newcomers often
face substandard, precarious and sometimes dangerous working conditions. Immigrants are the invisible
hands in our marketplaces, sewing our clothes, packaging our food, driving our taxies, or washing our
dishes after a restaurant meal. They perform many of the key support activities which allow the rest of us
to work, like minding our children, and cleaning our homes and our places of work. This study attempts
to document the realities of these shadow economies that grassroots organizations, advocacy groups,
and community agencies in east end Toronto hear from clients.
Immigrants who are stymied at the edges of the economic mainstream, despite the skills for which they
were recruited to come to Canada, must then figure out a way to eke out a living. Many newcomers survive
by participating in parallel economic activities, working under-the-table or “on the side.” Often, they face
exploitation in substandard work conditions even in established businesses. Other times, newcomers
may channel their talents towards developing economic opportunities, usually within their own ethnic
communities.
This study looks at how newcomers survive poor labour market access, adverse working conditions,
and the broader conditions that make them vulnerable to exploitation. It also looks at the resiliency of
newcomers and how they may build new economic opportunities for themselves when conventional ones
are denied. This is a story of economic survival and how people cope in hard times inside the shadow
economy.
This research project is a collaborative effort by east-end Toronto community service groups to move
past anecdotal stories towards understanding the dimensions of newcomers’ household economics.
We report here on surveys conducted with 453 newcomer households in the east end of the former City
of Toronto using an interval random sampling method, multilingual format, and extended in-person
structured interviews. Respondents were asked about their employment history and that of those in their
household. Respondents were also surveyed about their education level, language capacities, income
sources, methods of accessing labour market information, knowledge of their workplace rights and comfort
in exercising them, general health and participation in wider social networks. Five in-depth open-ended
key informant interviews were also conducted to collect experiential data.
Our study is a new angle on an old issue. The “underground” or “informal” economy1 has often received
public attention as an untapped pool of tax revenue but lately it has also received attention around its
1 We will use the terms interchangeably with shadow economy in this paper. Cf. ftnt. 3, for a more in-depth exploration of these terms.

the wellesley institute 2
dangerous working conditions. While criminal activities are sometimes lumped into the same description,
these untracked, cash-exchange economic activities are part of what many of us have done, hiring babysitters,
tipping servers, and even sometimes paying cash to avoid additional taxes.
This report views informal economic activities from a different analytical stance. If the “economic man,”
is a rational one, we looked to see how informal economic activities are a logical outcome when people
face labour market barriers and straitened poverty. Our findings tell a story of marginalization from the
mainstream and show alternate economic coping activities are a regular mechanism within Toronto
newcomer communities. a majority of newcomers surveyed here report low-income and participate in
some form of informal economic activities.
The first part of our study looks at the employment and educational profile of the newcomers surveyed.
We explore their barriers to employment, current occupations and working conditions.
The second part of our study examines the working conditions of newcomers across a range of formal
and informal employment arrangements. Our findings confirm that the workplace is frequently a site for
exploitation, its consequences leading to further marginalization and economic deprivation. We found a
high number of newcomers working in very poor, sub-standard jobs, sometimes unknowingly, and often
without a viable alternative, especially where they worked for others. Newcomers regularly experience
high levels of violations of employment standards. Bullying and harassment were also reported by a high
number of employees. Yet, employees demonstrated a lack of knowledge about their employment rights
and/or a reluctance to complain because of potential repercussions from such actions.
In counter-balance, the third part of our study underscores the resiliency of some newcomers who turn
to informal economic activities within the enclaves in which they may live or use other survival strategies
as a creative response to their circumstances. Informal economic activities can provide the opportunity
to channel the innovative force of newcomers when pathways to integration are blocked. These findings
have interesting implications which can be incorporated into wider newcomer settlement strategies.
This lens on informal economic activities, essentially as the pursuit of a survival strategy, insists we
understand the work and motivations of these shadow economies. any systemic response developed must
ensure individuals participating in the shadow economy, often not by choice, are protected and are given
opportunities to join the wider formal economy.

the wellesley institute 3
Key Findings
This stratified, random sample survey of three newcomer communities found shadow economy activities
are widespread both in terms of sub-standard employment and in the presence of a cash economy.
Working Conditions
Reported working conditions were quite alarming.• More than one-third (41%) reported holding a job where provincial employment standards were not
followed. More than half (55%) reported discrimination as a barrier in the labour force. seventy percent (70%) reported poor working conditions, including labour law violations, irregular hours and/or pay, or poor physical work environment.
• More than one-third of respondents (38%) had experienced bullying or harassment by supervisors, co-workers or customers while at work within the previous six months. This was described as aggressive behaviour, physical assault, yelling, threats or sexual harassment.
• English language skills strongly correlated with formal labour market attachment. Those with the highest level of English language were most likely to be employed (71%) and most likely to be employed full time (45%) compared to those with lower levels of English. Those with only beginner English were least likely to be employed (28%) and least likely to work full time (12%).
• Only six out of ten respondents reported they use English at work all the time.• Knowledge of employment standards was poor. almost one-half (48%) could not say what length of
annual vacation they were entitled to. One out of three (34%) did not know they are entitled to benefits if they are injured on the job. One in six (16%) could not confirm “the minimum wage is $10.25 per hour ($8.90 per hour for liquor servers) even if [they] work for cash.” Recent Immigrants were the least likely to have this knowledge.
• More than half of respondents (55%) felt that raising a concern about health & safety or an employment standard was likely to have a negative impact on their future employment.
Economic Survival Strategies
The economic poverty of newcomers is clear.• Only one-third of households reported being able to fully cover their household expenses on income
earned through formal employment. a majority relied on a layering of income sources.• Only 3% of immigrants formerly in professional occupations were still working in their field. Five
times that percentage work instead in customer service (15%).• almost seven out of ten (68%) respondents report some form of involvement with informal economy
activities, whether through purchases or earnings.• Forty-six percent (46%) report earning income from their participation in the informal economy.• Factory work, restaurants and stores were some of the main areas outside the regulatory framework
of basic employment standards and cash exchange activities.• Income from informal employment activities most often supplemented other forms of household
income.• Forty-two percent (42%) of those engaged in informal economic activities earned less than $10,000
annually from them. Eighteen percent (18%) earned more than $30,000 a year from these activities.
the wellesley institute 4
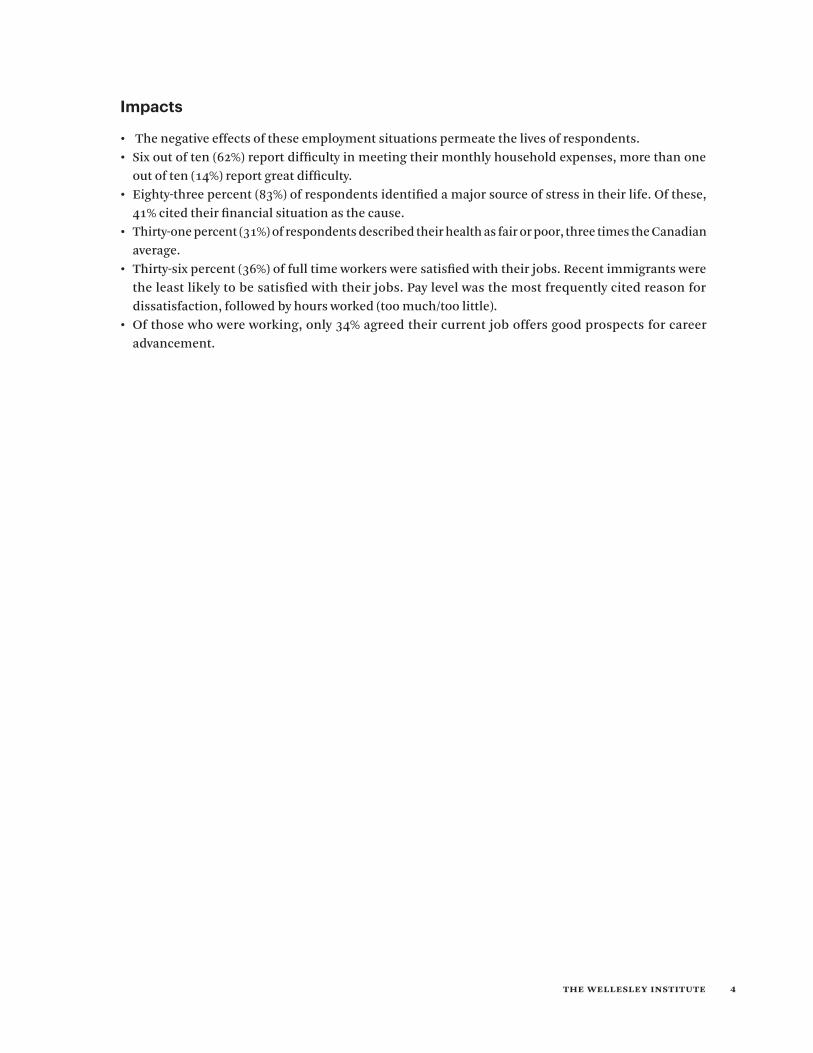
Impacts
• The negative effects of these employment situations permeate the lives of respondents.• six out of ten (62%) report difficulty in meeting their monthly household expenses, more than one
out of ten (14%) report great difficulty.• Eighty-three percent (83%) of respondents identified a major source of stress in their life. Of these,
41% cited their financial situation as the cause. • Thirty-one percent (31%) of respondents described their health as fair or poor, three times the Canadian
average.• Thirty-six percent (36%) of full time workers were satisfied with their jobs. Recent immigrants were
the least likely to be satisfied with their jobs. Pay level was the most frequently cited reason for dissatisfaction, followed by hours worked (too much/too little).
• Of those who were working, only 34% agreed their current job offers good prospects for career advancement.

the wellesley institute 5
Introduction
Canadian newcomers2 arrive ready to settle in their new communities, find jobs, send their children
to good schools, buy a home, establish new lives, and to thrive. Recruited because of their skills and
education, they are hopeful. settlement programs support them by providing orientation, language classes,
mentoring opportunities, and career advice. Yet still, as we know, many newcomers have been unable to
establish themselves and enjoy their new lives in Canada. Instead newcomers find their dreams stymied,
job avenues cut off, employment opportunities limited, and barriers erected.
This report sits at the intersection of a number of complex issues: growing inequality, the spread of poverty
and its concentration among immigrant and racialized populations, the changing shape of the labour force
and the growth of employment precarity, the debates over immigration classes (economic, family, refugee,
temporary and undocumented), cultural diversity and immigrant settlement, the underground economy
and tax avoidance. all of these issues are complex and fraught with challenges. Our quest was simpler.
With a mandate to improve settlement outcomes for newcomers in the east end of the old City of Toronto,
a local network of community service agencies and small ethno-cultural associations convened around
the Toronto East Local Immigration Partnership (LIP) to look at access to the formal labour market and
the key challenges that needed addressing.
Our initial broad question was “how are newcomers surviving?”
We expected to discuss credentialing processes, career ladders, and employment opportunities. Instead,
we heard stories of deadening isolation and of mutual support, of unrestricted exploitation and of free
enterprise, of exasperation and of inspiration, of dead ends and new beginnings. We found stories of a
shadow economy where people worked hard to survive, but who still weren’t able to thrive. What we learned
gave insight to the stories of immigrant poverty that were told even in earlier generations.
What emerged was a portrait of how newcomers earn income, manage their household expenses,
train for new positions, access goods and services not available elsewhere, and connect with each other.
a clearer picture formed of how newcomer households survive in the absence of formal labour market
opportunities, the networks and resources people may draw on or turn to when more conventional methods
are unavailable, and what happens when people worked outside the regulated labour market. It is a picture
2 In this study, the term newcomer(s) includes all local residents who were born outside Canada. The term is used interchangeably with Im-migrants in this paper. Both terms should be understood to include refugees, refugee claimants and undocumented residents as well as landed immigrants, recent immigrants, and naturalized citizens. Respondents were not asked about their legal status, but were asked their immigration class upon entry.

the wellesley institute 6
of an informal economy, a shadow or an underground3 economy of the activities people engage in to cope
with low incomes. From this research came stories of need, fuelled by poverty and exclusion, stories of
resourcefulness and innovation, despite these conditions, and, more alarmingly, stories of hazards and
exploitation in the workplace.
With a focus on potential solutions and an eye for a creative system response, the Toronto East LIP
workgroup began to explore the issues further, asking: • Do Canadian newcomers use the informal economy as an income transition point and a springboard
into employment within the wider, formal economy? • Or, does the informal economy trap newcomers in bad jobs, lowering their quality of life and overall
prospects?
Within conversations with participants of the research study, the “informal economy” was defined as
a form of economic cash exchange without a receipt, as “strategy you have used to survive financially.”
Often seen specifically as a coping mechanism, rather than as an illegal activity, respondents were
forthcoming about their participation in these activities. additional dimensions explored these cash
economies as a source for goods and/or services from others. Conditions of employment were measured
against provincial labour standards, including minimum wage, health and safety regulations, vacation
pay and statutory holidays. With trust established, the project researchers were also able to explore work
histories, community connections, health, and aspirations, giving further insights into the financial
survival strategies of immigrant and low-income households.
What emerged was a picture of the dimensions of labour exploitation and the survival strategies newcomers
use to adapt to the market. The story of the challenges in these shadow economies is detailed in this report.
3 Allofthesetermsrelatetoundocumentedeconomicactivities,akeyfocusofthispaper.Anencompassingdefinitionofanyofthesemar-ginal economies would encompass activities outside the legal and regulated, formal measurable cash-exchange economy. The term “informal economy” will be used mainly here as it captures a wider range of activities, from bartering through cash work to the other end of the spectrum, criminal activities. However, each may be used interchangeably to capture the idea of a marginal economy which describes any cash-generating activities, normally as a means of survival used to cover expenses. We generally avoid the term “underground economy” as it is so charged with the idea of illicit activities; this study explicitly avoided an exploration of criminal (as opposed to unlawful) activities. Instead, our focus is on household coping strategies and economic activities, such as factory work, childcare and food preparation. Many of these still fall outside current regulatory frameworks, but they are activities that might be easily regularized through such tools as enhanced enforcement of labour standards, unionization, and/or business incubators versus remedies for illegal activities which turn to the criminal justice system. Some of our reviewers described these activities at the fringe as “parallel,” “marginal,” “desperate” or “vulnerable” economy. “Parallel” captures the separa-tion from the mainstream, documented economy, driven by its own internal dynamics. “Marginal,” “desperate” and “vulnerable” describes the positional difference of these economic activities at the fringe. “Shadow Economies” caputures the undocumented aspects of these activities. Each of these single descriptors capture an important element of the dynamics at work, but we will leave further conceptual dissection to others inthefield,toonlysaythesedescribeaspectsofthesameproblemsfacedbyourrespondents.

the wellesley institute 7
Project Description
Background
In this report, we explore how people have responded to labour market forces, denial of opportunity,
settlement supports to integrate, and the real threat of poverty. This is a new angle on an old issue.
Where these shadow activities have received public attention, it has been viewed as an untapped pool of
tax revenue and, more recently, as a site for dangerous working conditions. sometimes criminal activities
are lumped into the same description. however, these untracked, cash-exchange economic activities are
part of what many of us have done: hiring babysitters, tipping servers, and, yes, sometimes paying cash
to avoid additional taxes.
however, our study took a different tack recognizing that shadow economies can be an economic coping
strategy when incomes are low and opportunities are blocked or non-existent. The world we explored is
substantially different from the common portrayal of tax evasion and profit-maximization. Instead we
looked at it from the point of view of the earner, who often enters the underground economy as a means of
survival in the face of limited prospects. Many facing narrowed opportunities and wider systemic barriers
turn to informal economic activities as a way to cope with an income/expense gap, sometimes moving
into the cash economy or, in the ideal, establishing fledging start-up companies. Lack of adequate job
supports exacerbates this exclusion, creating a system out of which it is difficult to escape.
These economic coping strategies are at best interim stepping stones to the formal labour market but,
at worst they are a source of prolonged exploitation and abuse where people remain trapped (allamby,
2011; Dwyer, 2011; Gellatly, 2011). Participation in the informal economy also carries with it health-related
risks from increased mental health problems including anxiety and depression, to dangerous situations
marked by coercion, discrimination and exploitation from employers who know their employees have
few other opportunities (Workers’ action Centre, 2007).
social mobility, access to opportunity and fairness are foundational principles in Canadian society. Yet
for newcomers, these ideals are betrayed by the realities of constrained prospects in the labour force and
wilful mistreatment by some employers.
Our research project emerged in response to concerns raised by a work group of settlement organizations
and grassroots groups looking at the labour market integration of immigrants in the east end of Toronto.
The Toronto East LIP identified the varied strategies newcomers used when employment prospects eluded
them. some chose to start “survival jobs,” often settling for low wage service jobs far from their former
fields of employment (and far from the ones for which they had been recruited to Canada under such
programs as the Federal skilled Worker Program4). Members of the workgroup expressed concerns about
anecdotal data surfacing in their communities which described another, lower level of employment:
those employed in informal economic activities without the protection of provincial labour standards.
Important local research laid the foundation for this report.
4 In March 2013, Citizenship Immigration Canada updated the eligible occupations list to twenty-four priority areas, including professions such as Occupational Therapist, Land Surveyors, Financial & Investment analysts, and various engineering positions: http://www.cic.gc.ca/english/department/media/backgrounders/2013/2013-04-18.asp.

the wellesley institute 8
In 2010, the Chinese Canadian National Council – Toronto Chapter surveyed 119 workers and visitors in
the spadina Chinatown neighbourhood, finding very low awareness of employment rights and standards
under provincial legislation. almost half were unaware that the Employment standards act applies to
all employees in the province. More than six out of ten respondents did not know about holiday and
overtime pay and more than eight out of ten did not know the maximum hours permitted to work per
week. Respondents recounted stories of working for $4/hour and work weeks of 70 hours/week.
In a 2011 study, Bangladeshi Canadian Community services partnered with action for Neighbourhood
Change – Taylor Massey and WoodGreen Community services to conduct a needs assessment for those
operating a home-based business or hoping to engage in an entrepreneurial activity within the Crescent
Town Priority Neighbourhood area. This report found that few households were able to generate more
than half their household income from small businesses. Most entrepreneurs were only earning a small
portion, between 10% – 25% of their family income this way.
Informal economic activities were typically seen as survival strategies.
Research produced by other organizations such as the Workers’ action Centre (WaC) is also foundational
to this research project. several reports from the WaC over the past few years focus on employment that
does not meet provincial labour standards. Not surprisingly, a substantial proportion of the people WaC
serves are Canadian newcomers. Their research and policy campaigns have been instrumental in recent
(small) increases to the Ministry of Labour’s enforcement wing and to broader discussions on protecting
vulnerable workers. The Law Commission of Ontario has also recently released its report on Vulnerable
Workers and Precarious Work (2012), which touched on some of the same labour market dynamics.
Our research project was also developed to complement the work of others looking at overlapping areas
of interest. For instance, this report also investigates the various impacts each strategy has on newcomers’
health and connection to community, in coordination with Community-University Research alliance
(CURa) project being done through United Way Toronto and McMaster University’s Poverty and Precarious
Employment in southern Ontario (PEPsO). as a result, measures of participation, precariousness of
employment, and impacts on health and sense of belonging were all included in the survey.
By their nature, shadow economies are difficult to document. This study focuses on two prominent
survival activities engaged in by newcomers and the impacts on those who participate in them:• sub-standard employment (where legislated minimum standards and rights such as minimum wage,
employer contributions, health and safety and other requirements are not met).• Unregulated self-employment (typically operated out of the home, operating under the radar of most
regulatory and tax rules).
Research Approach And Methods
Three ethno-cultural newcomer communities in Toronto’s east end, with very different settlement
histories, were targeted for this study: Bangladeshi, Chinese and somali. Each of them, to varying degrees,
because of the cost of housing or the comfort of compatriots, lives within or near enclaves of people from
their birth countries. Through social networks, such enclaves foster cultural and interpretive supports,
and economic opportunities, such as mentoring, job referrals, job offers, and business deals. While

the wellesley institute 9
these communities differ from each other in time of arrival, immigration class, and pre-settlement
histories, individual members tell the same stories of labour market barriers, poor employment and
poverty. Research partners were committed to a hard analytical research approach that would measure
the scope and pervasiveness of these issues. The chosen unit of analysis for this exercise is the household
economics of local newcomers.
The project underwent ethics review through the Community Research Ethics Board in Waterloo,
Ontario, and was conducted in accordance with the principles of the Tri-Council Policy statement on
Ethical Conduct for Research Involving humans.
Procedure And Results5
a mixed-methods research approach, with an emphasis on quantitative methods, was used to address
the issue with sufficient rigour and to address questions of prevalence and scope of marginalized economic
activities. In-depth quantitative surveys were collected by a team of trained, bilingual community researchers
and supplemented by key informant interviews.
The sampling method was based on probability sampling theory. The sampling unit was private households
and interval sampling was used, with the interval based on size of each local immigrant community. The
target sample size was set at 453 respondents to allow for some data stratification and disaggregation. Using
the confidence limit of 95%, with a 7% margin of error, and considering the maximum possible response
ratio of 50%, the final sample size was as follows: Chinese 188, Bangladeshis 173, and 55 somalis , totalling
416 surveys. This was later adjusted with the addition of 34 more surveys and a lower response rate among
somali participants. The estimated sample size was then distributed among selected neighbourhoods
of Toronto East based on the concentration of selected communities, which function as ethnic enclaves.
Within these neighbourhoods interval-sampling method was used. The interval size was estimated by
dividing the total number of potential respondents within households in each community by the desired
sample size. The first respondent was selected randomly from the first interval to avoid systematic bias,
and the consecutive respondents were selected using the estimated interval size. Estimated interval size
was 22 for the sample size of 214 Chinese participants, 8 for 199 Bangladeshi participants and 2 for 40
somali participants. In the case of the Chinese community, this survey interval sampling method was
also used in the large commercial district area.
The survey was pre-tested in the community with an additional 30 surveys, and quality control was
maintained through a follow-up with 5% of the survey sample.
Trained community researchers used in-depth, mulit-lingual, structured surveys to interview respondents.
Written informed consent was obtained from all respondents. Confidentiality was guaranteed to respondents,
and a small honorarium was offered in compensation for their time.
Because households often operate as an economic unit, a household audit was also completed by survey
respondents. Family members and other household members of the respondents were counted to allow
for a wider lens to be used in some aspects of the analysis. In total, the audit tracked 1,367 respondents
and family/household members, their occupations and sources of income. Responses were analysed
with sPss. The survey questionnaire was augmented with five in-depth, semi-structured interviews. This
5 The questionnaire and a detailed methodology are available in the appendices.

the wellesley institute 10
sample was to represent a range of experiences within the shadow economy and across the three immigrant
groups. These interviews included a small business owner, two people who earned money through home-
based businesses, a cash worker working under the table and a factory worker. Names have been changed
to protect their identity.
This sample target was achieved resulting in the following final sample sizes from the communities:
Chinese (n=214), Bangladeshis (n=199), and somalis (n=40).
Significance Of Research
This research study is significant because it steps beyond qualitative research on informal economic
activity. The research team was committed to strengthening the rigour of earlier reports and attempting to
provide answers to questions on the extent and pervasiveness of the informal economy. The large sample
size, randomized selection, and team of trained community researchers with second language capabilities
were important elements in accomplishing these goals. Our emphasis on gathering quantitative data on
undocumented economic activities is a core contribution of this project, providing important insights
into the scope of economic activities and the pervasiveness of poor working conditions in the places on
the edges of our economy, where people are trying to survive.
as a result, we believe this report will make a significant contribution to the field.
however there are always limitations. This survey focused on newcomers who tend to live in enclaves,
with a proportionately higher number of neighbours from their own ethnic or linguistic background
although nowhere near a majority of local residents. These newcomers, like many immigrants, were
also more likely to be living in low-income pockets because of housing form and availability. They were
also, because of where they live within the former city of Toronto, more likely to be able to access social
networks, local program and services, transportation. Therefore, while the results may not be reflective
of the wider immigrant population in the city, the results do provide a glimpse of those broader realities.
Findings
(additional findings appear in appendices)
Our research findings confirm the experiences of immigrants and low-income groups, as found in many
other reports: newcomers face difficulty finding work in their field, poor working conditions, harassment
and exclusion, and high levels of poverty.
These findings highlight several key themes around poor jobs, labour market barriers, settlement
pathways and the wider regulatory environment. For newcomers, exclusion from the formal labour market
is all too common of an occurrence. The struggle to deal with poverty in the face of such exclusion may
drive individuals to participate in the informal economy as workers.
In this report we explore the interplay of these dynamics among Toronto newcomer communities.
Respondents frequently identified difficulty transitioning into the Toronto labour market after arrival,
leading to lower income levels and poorer health.
Our research focused on the coping strategies of the respondent, but also surveyed the key characteristics
of other household members. This two-pronged approach allowed us to gather in-depth information
from 453 survey respondents and higher-level information on the 1367 family members living in their

the wellesley institute 11
households. Where comparisons were available, these were noted. Noteworthy differences include higher
levels of education, especially among the Bangladeshi respondents, and a younger population, especially
among the somali survey respondents. a complete profile is recorded in appendix 4.
The survey focused on three separate newcomer communities with very different settlement pathways.
The Bangladeshi respondents were often the newest arrivals, but also the most highly educated. The
Chinese language respondents (Cantonese and Mandarin) tended to have longer histories of residence
in Canada and tended not to have emigrated with the resources of immigrants who have settled in the
areas surrounding the inner core of the city. Like the Bangladeshi respondents, somali respondents
were newly arrived, but many of them had arrived as refugees so lacked the economic entrée of the other
groups. Like other newcomers, most lived in close connection with other community members. Each of
the communities also struggled with their own challenges of language, education levels and credential
recognition.
The commonalities each of these newcomer communities shared were poverty, barriers to labour market
entry, and some common coping strategies. across these communities, a typical range of employment
structures emerged, from those working in precarious jobs, those working in jobs that, at best, met only
minimal employment standards, and those who supplemented income outside traditional employment
structures.
Finally, because each of these ethnic communities had a residential concentration, small commercial
districts and some social institutions to serve their needs locally, its members and households do not
act independently. These ethnic enclaves are important because they provide social, and sometimes
economic, supports to community members. They are also critical to understanding settlement pathways,
sometimes determining how successful a newcomer will be, dependent on the type of information and
critical help they receive that may help them in their new lives.
Profile Of Survey Respondents
To understand the communities being surveyed, preliminary descriptive data was collected, including
labour force participation, working conditions, education levels, income, household expenses and self-
reported health.
a portrait emerged of a low-income, marginal population that survives on the edges of the labour market.
Few of the respondents were working full time in the field for which they were trained. a substantial
proportion of respondents worked in jobs that fail to meet basic legislated rights in the provincial
Employment standards act. In describing their economic situation, a majority of respondents reported
difficulty meeting their household expenses and had little expectation of this changing in the short-term.
simultaneously, respondents also reported high levels of stress and negative impacts on their health.
Labour Force Participation
To gain insight into the hard economics of newcomer households, their income gaps, and their coping
mechanisms, we wanted to understand the nature of the formal labour participation for each of the three
newcomer communities. The overall labour force participation rate among these community members
was 74%, above the City of Toronto rate of 65% in 2010, and in line with participation rates of recent

the wellesley institute 12
immigrants. Yet, the nature and quality of jobs warrants a closer look. Only one in three respondents had
found full time employment. another one in four worked in part time6 or casual7 work.
a high number of respondents were unemployed and actively looking for work. With 15% reporting
this as their employment status, this is one and a half times the city-wide rate of 10% (2010) and nearly
twice the national unemployment rate of 8%. This rate is similar to the high unemployment rates seen
among the other large population of new labour market entrants, Canadian youth. While youth do not
have the same levels of experience and training as immigrants, the similar pattern of difficulty entering
the labour market signals a wider systemic issue with the labour market’s ability to absorb new entrants.
The similarly high underemployment rates for each group (youth and immigrants) among the respondents
would also corroborate this trend.
are you currently working?(% of respondents)
survey Total N= 4521
Canada2
2011
Full time (30 hours +) 34% 50%
Part time (Less than 30 hours, steady hours)
14% 12%
Casual 9% 7%
Unemployed, Looking for Work 15% 7%
None of above/Not looking for work 26% 24%
1 Please note that as responses through this report have been rounded to nearest digit, they may not always add up to 100%.
2 http://www4.hrsdc.gc.ca/[email protected]?iid=13 and Statistics Canada, Labour Force Survey, September 2012
Occupational Patterns
No unexpected patterns were seen in terms of the relationships between the education of respondents
and the occupations they held. Generally those with lower levels of formal education held lower skilled
jobs, such as factory work, while those with more education were more likely to work in a professional
capacity such as in the social services field or the financial services sector. Where there were anomalies,
the sample size was too small to make further inferences.
among the survey respondents, those who had obtained jobs as professionals (banks and social service
agencies were mentioned most frequently) were the most likely to report higher levels of personal income
($30,000 – $49,000).
Those respondents earning in the $10,000 - $29,999 range were most likely to have occupations such as
factory workers, customer service, taxi-drivers or be self-employed. Their earnings were consistent with
average earnings for these occupations within the Toronto region. People in these positions were also
more likely to report their positions were part time.
Respondents with the very lowest incomes (below $10,000) were unemployed, day labourers or students.
These very low-income respondents either worked less than full time or earned less than minimum wage
(a full time, full-year minimum wage job earns an annual salary of $18,655).
6 Definedassteadyworkbutlessthan30hoursaweek.7 Definedaswork“wheneveryoucangetthework,butitisnotverypredictable.”
the wellesley institute 13
Job History
“If I knew the situation here... I wouldn’t have applied to emigrate to Canada. I had a good job.
When they interviewed me at the Visa office, I showed them my credentials, diplomas and my
experience. They were so nice. They never told me that they weren’t going to be recognized in
Canada.”
In an open-ended question, respondents were asked to report their occupation before they immigrated
to Canada. These occupations were then compared with their current employment. Unemployment levels
were very high with an average of 23% across the sample of respondents.
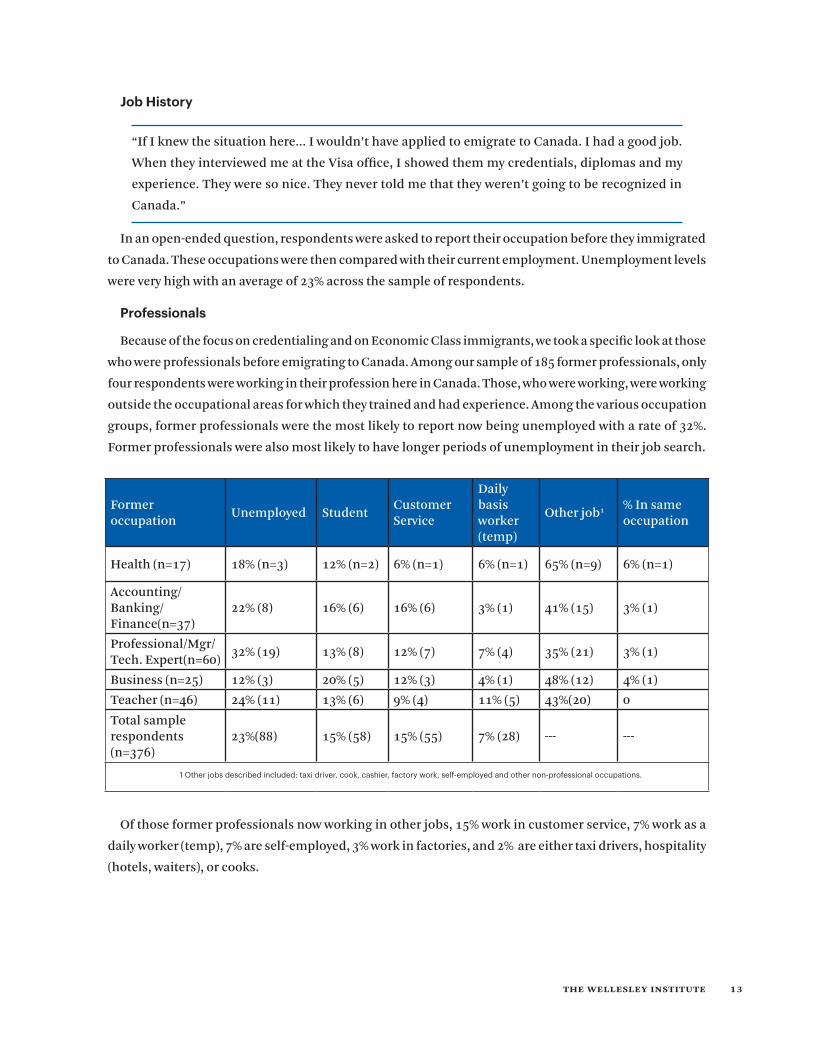
Professionals
Because of the focus on credentialing and on Economic Class immigrants, we took a specific look at those
who were professionals before emigrating to Canada. among our sample of 185 former professionals, only
four respondents were working in their profession here in Canada. Those, who were working, were working
outside the occupational areas for which they trained and had experience. among the various occupation
groups, former professionals were the most likely to report now being unemployed with a rate of 32%.
Former professionals were also most likely to have longer periods of unemployment in their job search.
Former occupation
Unemployed studentCustomer service
Daily basis worker (temp)
Other job1 % In same occupation
health (n=17) 18% (n=3) 12% (n=2) 6% (n=1) 6% (n=1) 65% (n=9) 6% (n=1)
accounting/Banking/ Finance(n=37)
22% (8) 16% (6) 16% (6) 3% (1) 41% (15) 3% (1)
Professional/Mgr/ Tech. Expert(n=60)
32% (19) 13% (8) 12% (7) 7% (4) 35% (21) 3% (1)
Business (n=25) 12% (3) 20% (5) 12% (3) 4% (1) 48% (12) 4% (1)
Teacher (n=46) 24% (11) 13% (6) 9% (4) 11% (5) 43%(20) 0
Total sample respondents (n=376)
23%(88) 15% (58) 15% (55) 7% (28) --- ---
1 Other jobs described included: taxi driver, cook, cashier, factory work, self-employed and other non-professional occupations.
Of those former professionals now working in other jobs, 15% work in customer service, 7% work as a
daily worker (temp), 7% are self-employed, 3% work in factories, and 2% are either taxi drivers, hospitality
(hotels, waiters), or cooks.

the wellesley institute 14
Job Hunting
Respondents were asked how they found their current employment. This question was asked whether
the work was within the formal or informal economy. Respondents used a variety of methods to find the
information that led to the job they now held.
The majority of survey respondents (74%) found their first job in Canada and their current jobs fairly
quickly, within the first three months. Family and friends were an important source of referral for almost
half of respondents.
how did you find your current job?RespondentsN= 269
Through friend(s)/relatives 45%
Contacted potential employer directly 13%
searched the internet 13%
Placed or answered newspaper ad 9%
Employment support (incl. community organizations, temp agencies)
9%
Other 6%
Those seeking employment in a professional or in the financial sector used wider search methods,
which included friends and family, but also extended to private employment agencies, internet searches
and direct broaches to employers. Other research has confirmed that the diversity of a social network
improves earning power (Geron, 1999).
hong, a former electrition, found his current job through another friend. his friend was leaving
his job at a restaurant and he asked hong to replace him, then he trained hong for one full day
(without payment). For cash jobs, he says, you have to be referred by someone, business owners
do not hire people they don’t know for cash jobs. hong told us that he actually preferred to work
on the record because the money is better and workers receive more security through such things
as such as EI, WsIB and CPP and sometimes benefits. Most of the time, he explained, business
owners hire people for cash only and their attitude is “take it or leave it.”
5
10
15
20
25
30
35
40
45
Length of time to find current employment
Time in months
Perc
enta
ge o
f res
pond
ents
33.7
< 1
40.4
1 - 3
16.5
3.5 - 6
19.6
7 - 12
7.2
13 - 24
7.9
25 - 72

the wellesley institute 15
Most respondents also took between one to three months to find their current job, although they did
find their first job in Canada sooner. however, there were significant differences between each ethno-
cultural group perhaps because of the wide variation in education levels and language facility. Those with
higher levels of education took a little longer than other respondents to find work; key informants tell us
the extra time is presumably to find a better job match rather than taking a survival job.
To explore employment options and opportunities, respondents were also asked what they felt they needed
in order to find a better job. Multiple responses were allowed (n=453). Better language and communications
skills was cited as the biggest barrier to employment opportunities (68.9%), followed by professional
training/skills upgrading (55.9%), networking/knowing more people (47%), and job references from Canada
(44.6%). These research findings align with other topical reports. statistics Canada reported that 70% of
newcomers report experiencing difficulty finding a job because of “lack of Canadian experience,” foreign
credential recognition, and language barriers. however, each of these reasons places the focus on the
newcomer rather than looking for wider, systemic barriers.
Education
“sixteen years of education and experience didn’t mean anything, but the two certificates I received
here help me earn my living. It was a total waste of my education.”
To explore the relationship with their job prospects, respondents were asked about their educational
attainment. Each community presented a very different profile in terms of levels of schooling, language
of instruction, and where they received their education (Canada or Internationally).
almost all Bangladeshi respondents had at least some higher education, and the vast majority had
graduate education. Eighty-eight percent (88%) obtained their highest level of education outside Canada.
a substantial number (45.7%) did their studies in the English language. The Chinese population showed
a more varied background. Reflecting their younger demographic, the somali population was the most
likely to have been educated in Canada.
To understand some of the difficulties our respondents faced in finding high-skilled jobs, other aspects
need to be explored. Respondents were asked about their comfort and experience with using English in
the Toronto environment, and about both their health and stress levels since living in Canada.• The Bangladeshi population reported the highest education levels. Ninety-five percent (95%) has done
some or completed college or university, 88% had completed postgraduate studies. • Eighty percent (80%) of the Chinese respondents obtained their highest degree outside the country
(23% in English). • Forty-one percent (41%) of somali respondents had completed post-secondary studies, 73% in Canada.
English Proficiency
The issue of proficiency in one of the official languages was considered cautiously because of the current
political debate around admission criteria for immigration to Canada. Despite the sensitivities around
this topic, both the steering committee and newcomers themselves raised the issue, as the topic has
important implications for the delivery of language training programs.

the wellesley institute 16
Most Canadian immigrants have been admitted as Family Class or in other categories where English
Language proficiency has not been required. Their value as part of family support to the principle applicant
was valued by immigration policy, and because of Canada’s commitment to offer settlement and language
classes, families have been happy to emigrate to Canada.
however, there are serious limitations to the availability of language supports for newcomers. Eligibility
for language classes restrict many of the federal-funded programs to those from specific immigration
categories, those who have been settled in Canada for less than three years and those who have not yet
obtained citizenship. The impact of this has meant that many women, arriving with young children, miss
the window for training and must seek out the more scarce provincially-funded or community-driven
settlement programs without these strict criteria.
Language Skills Related To Work
hong wants to be part of the formal economy, but language is the biggest barrier for him. (hong
feels like he had no choice but work for cash.) hong continues to work on improving his English
language skills, and he wants to get his electrician licence. he is currently attending an EsL school
but he had to take a break from EsL studies for some time. he was attending an EsL classes near
his home, but the class was cancelled because of a government funding cut. There was another
class available further away, where he had to travel to go there. however the school provided only
one token per day, a hardship in a family where every dollar counts. For this reason, many of his
EsL classmates also stopped attending the EsL school. hong explains, “Language is the biggest
barrier, and this is one thing that government shouldn’t cut the funding of.”
The second barrier for hong is the licensing requirements in his field. Recruited as an electrician
when he first came to Canada, hong wanted to get his licence here as an electrician. he paid
$300 to take a training course for the licensing exam. The course was offered in Chinese, and
although he knew the subject matter, he couldn’t understand the licensing questions because
they are administered in English. hong is frustrated because of this. he knows everything about
electrical connections, he explains, but his problem is English. hong wonders if he couldn’t be
licensed to work with the large Chinese population.
English language skills could be seen as a necessary but not sufficient condition to better employment
opportunities. Results from the survey confirm the importance of English-language proficiency in the
Toronto job market. additional analysis examined that those with advanced English language skills
(defined as those who can participate fully in social and familiar work situations and technical discussions
within their own field) confirmed access to full time employment.
English language skills are strongly related to whether a respondent was able to work in an English
language environment. Those who reported the strongest English language skills were most likely to use
English all the time at work (93%). Eighty-four percent (84%) of those with beginner level English reported

the wellesley institute 17
working in a work environment where they rarely use English. Overall, 62% of respondents reported
working in English all the time, 25% used English some of the time, and 13% use English rarely at work.
This is also reproduced in terms of respondents social and community connections; 29% report rarely
using English in the wider the community and less than one-fifth (18%) using it all the time.
Those with the highest level of English language were most likely to be employed (71%) and most likely
to be employed full time (45%) compared to those with lower levels of English. Those with only beginner
English were least likely to be employed (28%) and least likely to work full time (12%). (see graph below.)
100%
Labour Force Participation by English Language Ability
90%
80%
70%
60%
50%
40%
30%
20%
10%
0%
Beginner
11.6
7
9.3
25.6
46.5
High beginner
27.9
7
14
18.6
32.6
Intermediate
27.2
12.3
14.8
18.5
25.9
High Intermediate
34.1
12.2
11.4
18.7
23.6
Advanced
45.4
4.9
7.4
22.1
20.2
Not working, not looking
Unemployed
Casual
Part-time
Full-time
In terms of those respondents involved in informal work, 33% reported advanced proficiency in English,
defined as the ability “to participate fully in social and familiar work situations; can understand and
participate in conversations and in technical discussions in own [occupational] field.”
From the graph above less than 50% of those with advanced English language skills were working full
time, so clearly while language skills are a barrier, they are not the only ones to economic integration for
newcomers. This is reinforced by the finding that half of those employed informally used English all the
time at work.

the wellesley institute 18
10
20
30
40
50
60
70
80
90
100
Use of English at Work by Ethnic GroupPe
rcen
tage
of r
espo
nden
ts
33.7
83
All the time
Bangladeshi
Chinese
Somali
46
79
Sometimes
33
14
Rarely
21
714
3
Those who had poor English language skills were three times as likely to be involved in small scale
production jobs, such as sewing, handicrafts or jewellery, as any other job category in the informal economy.
Those with advanced English skills were more likely to be involved in small businesses (i.e. painter, money
exchange) and jobs helping people (child care, health services, tutoring) where better language skills are
expected.
Working Conditions
Employment Standards Violations
Our results showed widespread violations of provincial employment standards including minimum
wage, vacation or vacation pay, statutory deductions for employment insurance and other mandatory
rights. To test each condition, multiple responses were allowed.
Two hundred and sixty-three (263) out of the 453 survey respondents reported earnings, representing
58% of the total population. Of these, 41% reported work that does not meet the minimum provincial
employment standards.
Compliance with provincial employment standards of currently employed individuals Freq Percent
Compliance with employment standards 154 59%
1 employment standards not met 59 22%
2 employment standards not met 18 7%
3 or more employment standards not met 32 12%
Number of individuals currently employed 263 100%

the wellesley institute 19
Respondents were given a list and asked whether they had experienced any of the following employment
standards violations. Multiple answers were allowed. as seen below, in order of frequency, failure to pay
minimum wage was the most commonly cited violation (48% of those reporting a violation).
Frequency of employment standard violation Freq Percent
Paid less than minimum wage 70 48%
statutory holidays not paid 52 36%
No vacation pay/vacation 50 34%
Cash payment without mandatory deductions (i.e. EI, CPP) 44 30%
Working longer than 13 hours a day 18 12%
Irregular pay schedule 16 11%
Total number of employed individuals reporting violation 145
Those who reported these types of work violations were more likely to be low income despite working.
Of those who reported a violation of employment standards in their workplace, 45% reported annual
personal incomes below $30,000 and 27% below $10,000 (n=128). In a city where the average income is
$40,376, the median individual income is $24,544 and the low income cut-off is $20,778 for one person
before tax (City of Toronto, 2011), these are very low income workers.
Those with intermediate English language skills were the most likely to be employed for cash (24%, n=316).
Key informant interviews included people who worked for cash in retail positions. They most often
described this as a choice of last resort where they felt vulnerable with few other options. Oftentimes,
language barriers acted as a barrier to any new position. Yan, a newly-hired factory worker, was delighted
to move out of the waitressing job where she had worked for cash.
hong says that the scale of informal economy is wide. For every trade or job, he says, there are
so-called “volunteer” jobs, people “even” working in offices as volunteers, but who are paid under
the table. and this is not valid just for the Chinese community, he says, but other newcomer
communities. he tells the story of an Iranian colleague who “volunteers.” hong explains that
sometimes friends ask each other to volunteer with something and the automatic understanding
is that you will be paid in cash. he tells another story of some people he knows who are helping
seniors at their homes as volunteers but who are being paid cash.
In contrast, one of the small business owners included in the case studies defended his hiring practice,
explaining that if he did not hire these candidates, they would have few, if any, other options. he defended
the low wages with the explanation that his margins were very tight.
hiran, a store owner, hires some workers for cash with no employment record. The number of
these workers changes all the time but the average 6-7 people work for cash. (60% of staff works for
cheque and 40% works for cash). some of the cash workers are on Ontario Works/social assistance.
Other than hiring people informally, the store is also linked to other informal economic activities.
at the store, they sell some homemade food items for which hiran pays cash.

the wellesley institute 20
Employment By Others
When the respondent reported they earned income by working for someone else or for a business, the
frequency of reportable poor working conditions was worse. Poor working conditions included Employment
standard act violations, lousy physical conditions and elements of job precarity, such as variable hours.
These respondents represented two-thirds (64 %) of the population reporting precarious employment
standards (n=105 out of 163). seventy percent (70%) reported one condition of poor employment, and
30% reported at least two poor job conditions.
Precarious employment and reported working for cash Freq Percent
Less than $ 10.25 per hour 57 54%
On-call, irregular hours 35 33%
Cash payment without deductions 35 33%
Irregular pay schedule 12 11%
Working longer than 13 hours a day 15 14%
No vacation pay 38 36%
No paid holidays 37 35%
Poor physical conditions (bad ventilation, too noisy etc.)
12 11%
Other conditions 7 7%
Number of respondents (individuals) 105 100%
While startling, they are in line with other research and are further explored in the analysis and Discussion
and Findings of this paper.
Employment Precarity
Our findings point to a high degree of precarious employment along with markers of other poor working
conditions. Poor working conditions, such as working longer than 13-hours-a-day or high levels of noise
and poor ventilation were also explored. Eleven percent (11%) of respondents worked overly long hours
and 12% of respondents worked in an environment with poor physical conditions.
Employment precarity also emerged in respondents’ descriptions of their work conditions. We asked
respondents whether they received extended benefits from their paid employment (including pension
contributions, health benefits like prescription drugs, dental and short-term disability). Of those formally
employed, 35% reported receiving benefits, such as extended health care or pension contributions, while
an additional 30% received only partial benefits, and 35% received no benefits at all. however this survey
question may be less reliable as legally required “benefits” such as employment insurance may have been
confused with extended benefits.
hong has been working at a restaurant for cash ($8 an hour) for over a year now. The work is not
regular, his hours change according to the restaurant’s need. (When there are events, such as New
Year celebrations, restaurants hire more people, he explains). hong also has worked at a public
festival for his friend and was paid $8 an hour. he explains his friend only hires people he knows

the wellesley institute 21
well to avoid any legal problems. If anyone checked, his friend would say they are not employees
but are his friends and that they are just helping him out.
Full-Time Work
• 47% of those respondents in the labour force8 had full time work; of those working, this was 59%.• 19% of those in the labour force worked part time; of those working, 24% held part-time jobs.• 13% of those in the labour force worked on a casual (on-call) basis; that was 17% of all those holding
a job.
While individuals with higher education were more likely to report full time employment, a substantial
portion (68%) of casual workers had at least some post-secondary education, indicating that higher education
did not protect workers from this kind of work.
Cash Work
Respondents who worked for cash for someone else were asked in which sector they worked. The response
for factory work was surprising to the researchers based on their knowledge of the communities; however
given that day labourers were identified as one of the most common occupations among household
members, there may be a strong overlap between these two areas. analysis also showed that forms of
work such as taxi-driving or factory work were not widespread, but were concentrated among specific
ethno-cultural communities.
sector, working for someone else or for a business for cash (Multiple responses allowed)
Percentage(n=200 responses from 149 individuals)
Factory work 31%
Work in a store (e.g. cashier, stock) 20%
Restaurant 17.5%
Other (incl. general labour, piece work, construction, tutoring, childcare, garden, cleaning)
30%
Departing from the common idea of which sectors immigrants find work, respondents reported work
such as construction or cleaning only in the single digits. Manufacturing and retail service were more
common.
Yan says that she never liked the cash work. “Cash work is much harder, I worked 13 hours a day,
and the bosses weren’t nice either.” she was very stressed and unhappy when she worked there.
Yan explains “Cash work is not a good thing for people. It can be beneficial for some people, if
they don’t want to pay taxes, but not for me.” she feels much happier now that she has found
some factory work outside her community and within the formal sector.
8 Labourforceisdefinedasallthosecurrentlyworkingorseekingwork.

the wellesley institute 22
Discrimination, Harassment And Bullying
Discrimination
More than half (56%) of respondents reported that discrimination based on one of the prohibited grounds
was a barrier to them in the workplace. Fourteen percent (14%), or one in seven, reported discrimination
as a barrier more than half the time, and another four out of ten (42%) some of the time.
These rates are significantly higher than those regularly reported as the Canadian norm. according to
statistic Canada’s Ethnic Diversity survey (2003), one of the more recent population-based studies on the
topic, one in five Canadians report experiencing discrimination often or sometimes.
Respondents were not asked specifically about wider issues of systemic racism but 9% did cite ‘elimination
of discrimination’ when asked what was needed to find a desirable job. seventeen percent (17%) of
respondents reported the need for more “Canadian experience.”
Harassment And Bullying
similarly disturbing numbers were reported when respondents were asked how frequently they had
experienced bullying or harassment by supervisors, co-workers or customers while at work. (This was
defined as aggressive behaviour, physical assault, yelling, threats or sexual harassment.)
More than a third of workers (38%, n=315) had experienced bullying or harassment at work within the
previous six months.
While he is happy with his general working conditions, arpan is not very satisfied with his formal
work. he feels his skills and experience are wasted as his current job only requires a high school
education. he also faces discrimination and harassment. One co-worker knowing arpan is Muslim
said “are you gonna bomb the CN Tower?” another co-worker called arpan “bloody Indian.” Racial
discrimination, he said, is the most common mistreatment he faces.
When arpan sponsored his mother, people at work also made various comments, such as “You
are bringing your mother to exploit the health system here.” arpan finds these comments very
demoralizing and upsetting. he says his mother doesn’t need money, she took care of him,
supported him and it should be his right to bring his mother here, as many of his co-workers
also enjoy.
Key informant interviews confirmed these descriptions. The comments and harassment from both
employers and co-workers created a highly stressful work environment for newcomers.
Awareness Of Employment Rights
Following the work done by the Chinese Canadian National Council Toronto Chapter (Chinese Interagency
Network, 2010), respondents were asked about of their awareness of specific Ontario employment standards.
similarly to this early study and their more recent one (Zheng, 2013), a sizeable portion of respondents
were not aware of many of the specific protections they enjoy under provincial labour legislation.• One in three (34%) were not aware that they are entitled to workers’ compensation if they are injured
on the job (n=429).

the wellesley institute 23
• One in six (16%) could not confirm “the minimum wage is $10.25 per hour ($8.90 per hour for liquor servers) even if you work for cash.” (n=453)
• almost one-half (49%) could not say what minimum length of annual vacation time they are entitled to after having worked for a year. (n=430) [answer: Two weeks].
as seen from the graph below, recent immigrants were the most likely to be unaware of their basic
employment rights.
10
20
30
40
50
60
70
Percentage of Respondents who immigrated between 2007-2011 who were Unaware of Employment Rights
Perc
enta
ge o
f res
pond
ents
Vacation Pay
67.1
Injury benefits
43.9
Minimum Wage
17.3
While this lack of knowledge of basic rights was troubling, respondents were also probed about the
likelihood that they might exercise these rights. To determine this, respondents were asked whether
lodging a complaint would harm their future employment with their employer. More than half (55%)
thought doing so would have a negative impact on their employment prospects. The following chart gives
a further breakdown. More than one in ten respondents thought it was very likely that there would be a
negative impact on their future employment with their workplace if they raised a concern.
Likelihood of a negative impact from raising employment standards or health & safety concern
% of respondents
Very likely 13.7%
Likely 17.8%
somewhat likely 22.6%
Not likely 24.5%
Not likely at all 13.7%
Don’t Know 6%

the wellesley institute 24
Over half of the respondents (54.1%) said there was at least some likelihood of raising a concern over
their treatment according to basic provincial employment and health and safety legislation. Just over one
third (38.2%) felt there would be no repercussions.
Income Level
To get a clearer picture of their labour market experience and to explore what might be driving any
health impacts, respondents were asked to report their individual and household incomes, in a series of
ranges. In general, respondents to this survey were low income.
Individual Income
seventy-one percent (71%) of people surveyed reported an individual annual income less than $30,000.
Recent immigrants were the most likely to have very low incomes; 57% of them earned less $10,000,
compared to 32% of all other immigrants.
(For more details, see Detailed Findings in appendix 4.)
Household Income
as would be expected, reported household incomes were higher than individual incomes but still
generally low. Close to two thirds (63%) still report a household income below $30,000 (versus 25% in the
city of Toronto); 15% reported less than $10,000 (versus 7% in the city of Toronto); 35% of respondents
reported a household income over $30,000.
The average household size of respondents is three persons. The 2011 statistics Canada Low Income
Cut-Off (LICO) for a Toronto household with three people is an income of $35,657.
Full time formal employment was strongly associated with higher household incomes with 59% of those
who reported full time employment earning over $30,000, and 12% of them reporting more than $70,000.
In contrast, 81% of those who worked part time had annual household incomes of less than $30,000 and
65% of those who earned less than $10,000 worked part time.
Managing Household Expenses
In an effort to gain more insight into what drives people into jobs which might not meet minimum
employment standards, we asked respondents to report on household expenses, and their ability to
adequately cover expenses during a given month. Well over half (62%, n= 428) reported difficulty in meeting
their monthly household expenses, with a significant portion of the total (14%) reporting “great difficulty.”
hong feels like he had no choice but work for cash. he receives $1260 from OW for his family of
three (wife and a daughter). his daughter goes to college and receives OsaP. Money is very tight
but hong says they are frugal. They live in a basement, rent is not very high and they go to a food
bank at least once every three weeks (sometimes once a week). They don’t smoke or drink, they
have no extra expenses. he buys kitchenware, clothing and furniture second-hand and pays cash.
survey respondents were also asked their perception of how their households’ economic conditions
have changed over the course of the previous year. Just over half of households saw no change (57%).

the wellesley institute 25
One in four (25%) saw an improvement, while just over one in six (17%) reported a deterioration in their
household finances (n=420).
Debt
another strategy for covering household expenses is taking on debt. approximately half (54%) of
households reported household expenditures balanced over the course of a year so that they were neither
saving money nor in debt. One in six (17%) respondents reported being able to contribute to savings.
Twenty-nine percent (29%) of households reported some level of debt during the year, 19% intermittently
and 10% all year round (n=426). This is similar in proportion to the number of Canadians who have consumer
debt, which has fluctuated between 26% and 33% over the past three decades (statistics Canada, 2007,
p.31).
The research did not explore categories of household expenditures, but given the cost of housing and
living within a large urban environment, these are the likeliest sources of financial strain.
Budget Strategies
Respondents were asked, in an open-ended question, how they were able to manage household budgets.
Their responses were as follows (n=198): • Cutting household expenditures was the most frequent strategy cited (36% ). • Nineteen percent (19%) relied on borrowing most often from family, friends and some cited accumulating
credit card debt. • a similar portion rely on their savings (13%).
• another portion were working more (12%).
Other less frequent strategies included: • Cost management rather than cost cutting. • Improving themself to be more employable. • Relying on gifts from family and friends. • hunting for better employment. • Participation in informal employment.• Reliance on government income supports, loans and subsidies.
One respondent also described relying on gambling at a casino as a way to cover income gaps. This area
of inquiry, looking at the gap between household income and expenses, provided an entry point into an
exploration of informal economic activities and encompasses the main part of the next section.
Informal Economic Activities
after developing an understanding of the labour force participation and income patterns of local
immigrant households, survey respondents were asked about the means they used to cope with some of
the limitations they described.
Our research shows that informal economic activities fall across a wide spectrum from casual exchanges
among neighbours through small businesses to undocumented employment in poor working conditions.
These activities are pervasive, woven through the community into an exchange economy among individuals
on the margin who share a common identity.

the wellesley institute 26
Scale And Nature Of Shadow Economies
Nature Of Economic Activities
a high percentage of respondents earned some form of income through informal economic activities.
This included their own entrepreneurial endeavors as well as working for others, whether this was defined
as “self-employment” or they worked for cash without a record, both classifications fall under the broad
swath of undocumented economic, cash-generating activities.
Participation In The Informal Economy
store owner hiran states that the scale of informal economy is wide. This practice of hiring people
for cash is very common. Many stores, restaurants participate in the informal economy. There is
a price range for different informal jobs: meat cutter are paid $9-$10 an hour, general labour at
grocery stores pays $7-$8 an hour. hiran says that when he first arrived in Canada, he worked at a
restaurant for cash and was paid $4 an hour. at the time minimum wage was around $5. so over
the years, he says, informal wage increased as much as official minimum wage.
Informal economic activities among survey respondents were found to be fairly pervasive.
Over two-thirds (68%) of respondents reported at least some involvement with the informal economy,
whether that was through purchases or earnings. Just under half (46%) of respondents reported earning
income this way.
services purchased within this informal economy included room and board rental, beauty services,
food services and catering, handicrafts and tutoring.
Time of arrival in Canada does not appear to have a relationship to earning income through informal
economic activities. Other factors, such as education or language facility, may be involved but were not
analyzed. (For further details, see appendix 4.)
Women were more likely to be active in the informal economy. Fifty-seven percent (57%) of those involved
in informal economic activities were women. Both anecdotal data from members of the wider Toronto East
LIP and survey respondents support this gendered difference; women were more likely to be involved in
babysitting/childcare or food services as home-based business, they apparently offered needed flexibility
where labour market entry was blocked.
Miriam started a child-care business because she needed the money for school after her application
for OsaP was denied (as she made a mistake in the forms). all of Miriam’s income comes from
this work (the informal economy). Miriam explains that this is her current situation, she needed
an income and this was the only way, she could think of, to get it.
Miriam always knew she liked working with children, so, before starting this, she completed
one-year Early Childhood assistant training at a local public college. she likes the children and
the money is good. It is convenient; she doesn’t have to leave home. she is very happy with this
kind of arrangement. “Even if you make more money with the formal jobs, formal work is more

the wellesley institute 27
stressful. I am the boss; I don’t have to answer to people.” she doesn’t like formal jobs as they are
more structured and tend to offer less flexibility.
she has been doing this work for approximately four years within her own community. Miriam
explains it is very difficult for a student to get a part-time job that would be flexible enough to
accommodate class and study time. still, she says, this work is good until she finishes school.
she doesn’t plan do it for a long time.
Income Source
Newcomers’ participation in the informal economy was not a substitute for participation in formal
economic activities. When asked to describe what share of their income came from a variety of sources,
respondents reported their largest source of income is from formal employment. however, only one-
third of households were able to fully provide for their household on the income earned through formal
employment. Instead, most relied on a mixture of sources to cover their household costs.
Of households with formal income, just over one-third (37%) relied solely on it to cover household costs;
Of those with income from self-employment activities, just over one in six (16%) were able to solely rely
on it; one in four (25%) of those with student loans relied solely on them; and, another one in six (18%)
relied solely on other government transfer payments (including Old age, Child Tax Benefit and social
assistance). Finally, of those relying on family/friends outside the home, one in twelve (9%) relied solely
on them to cover their household costs.
Most households rely on a combination of these income sources: • sixty-seven percent (67%) report at least some household income from formal employment; 16%
report household income from self-employment.• Eighteen percent (18%) report household income from other sources of employment 34% report
household income from government transfer payments 22% report household income from student loans.
• Thirteen percent (13%) report household income from family and/or friends, proficiency.
Government transfer payments tended to include Ontario Child Benefit, GsT/hsT, and a substantial
portion who borrowed through the Ontario student Loan assistance Program (OsaP). Ontario Works
(social assistance) is also included here.
arpan found his current job as a gardener in 2006. he also started his own informal business as
an urban farmer. he has been growing vegetables for the Bangladeshi community since then. his
annual salary from his employer is $45,000; he earns another $10,000 per year through his own
farming. arpan has been working like this, both formally and informally, for the last five years.
still, arpan is not very satisfied with his formal work. “I am not in the same job as when I was
back home. My current work requires a grade 12 education. I could do much better.” he feels his
skills and experience are wasted. he says if he could find a better paying job, he would quit his
informal work. Despite its flexibility and chance to involve his family, it is backbreaking work.
however he continues as he has a young family to raise.
among those who relied on family and friends outside the household for support, a good proportion
of them were in the prime earning years of 30 – 49 and almost three-quarters of them were women. It is

the wellesley institute 28
likely that many of them have childcare responsibilities and may be relying on fathers working overseas.
This aligns with other research showing the underemployment of immigrant women.
Invisible Work: Entrapment Or Stepping Stone?
“Most of the workers are newcomers; they can’t get a job elsewhere. By hiring them we give them
an opportunity to make money, we provide them a shelter.” store owner hiran
having a fuller picture of how many immigrant households are coping within low-income and their
household economies, wider questions arose. What are the impacts of these activities? What pathways
lead to these outcomes?
Sources Of Stress
In an open-ended question, respondents were asked to report the major sources of stress in their daily
lives. Eight-three percent (83%) of those surveyed identified at least one factor. On average, close to three
sources of stress were cited by each respondent:• Financial situation was most commonly (40.8% of respondents) cited for stress. • Language barriers (26%). • Time pressure (26%).• Employment status (unemployment) (25%).• Caring for own family (25%).
Recent immigrants were much more likely to report their financial situation as a main source of
stress (27% vs. 15% of other respondents). Employment status was a similar source of stress for recent
immigrants (19% vs. 7%). additional sources of stress cited, in order, included stress at work, health
problems (including mental health), lack of adequate or affordable housing, loneliness, adjusting to life
in Canada, and discrimination. Immigrants who had arrived most recently were the most likely to report
depression, with almost half (49%) feeling depressed within the previous month at least once. More worrying,
a small subgroup of those who arrived in the past five years reported feeling depressed on a daily basis
(7%), and 17% reported feeling depressed two to three times a week within the past month. Elevated rates
of depression, even for a small sub-population, are cause for concern and warrant further examination.
Only 5% indicated they had sought help in the past year for any non-medical problem (n = 421).
These findings should be of interest to settlement service providers. Given that half of respondents
reported feeling depressed in the last month, this underscores the growing recognition that mental health
issues may pose health issues for newcomers and immigrants. This finding reinforces the importance of
increasing focus by service providers on mental health issues for newcomers.
These results were also tested against those who reported their involvement in undocumented cash-
exchange activities. No strong relationships were found. however, those who were involved in the informal
economy in business or small scale production were the least likely to report feeling stress, perhaps, as the
case studies implied, because they were more likely to feel a stronger sense of control over their daily lives.

the wellesley institute 29
Where other relationships were identified, the sample size was not large enough to draw any conclusions.
More focused research will be required to draw any reliable further conclusions. Our findings only hint
at the complex interplay of work, health and social well-being.
Reasons For Participation
Respondents who cited informal participation in a small business or self-employment activity to earn
additional income were asked why they undertook these activities, whether in their own home or elsewhere.
Their reasons fell into a few categories; Unemployment (22%) and Convenience (20%) were the most
common reasons cited. Less cited, but seen as barriers to more formal work, were start-up costs and
limited access to capital (6%), English language skills (6%), access to market (4%), high cost of commercial
rent (4%), and access to child care (3%).
Job Satisfaction
store owner hiran believes that most of his employees who work for cash without any record
are satisfied with their jobs. hiran “always pays them regularly and on time.” some workers still
complain, hiran says, but he believes they complain, not because of the work, but because of
their personality that they would complain about any job.
Respondents were also asked about their satisfaction with their current job; more were satisfied (38%),
than not (25%). Of those who were not, the most common reason was remuneration/pay level (24%).
hours of work (too much/too little) was cited as the second most common (20%) area of dissatisfaction.
Job security (17%) and opportunities for advancement (16%) followed.
Recent immigrants clearly reported high levels of job dissatisfaction, as the chart below and appendices
show. Those who emigrated a longer time ago were more likely to be satisfied, or at least to not be dissatisfied,
with their current employment. Whether this was because they had found better employment, or had
resigned themselves to their new occupation, was not explored. however other dimensions were examined.
5
10
15
20
25
30
35
40
45
50
Job Satisfaction among Immigrants and Recent Immigrants (%)
Very satisfiedor Satisfied
All other
Recent Immigrants
41
36
Neither
42
26
Dissatisfiedor very dissatisfied
17
39

the wellesley institute 30
Respondents with full time jobs were the least likely to be satisfied with their current work (36%), whereas
the 44% of those with part-time jobs and half (50%) of those who were working casually were satisfied.
This seems counter-intuitive and may warrant further exploration, however we can speculate on a few
reasons. It may be that those who were in poor quality jobs on a full time basis were more despondent
than those who only worked at it on a part-time basis, with the former feeling more permanence in a poor
position. also, a large number of the small entrepreneurs were not working full time, so this result may
simply emerge out of the autonomy they were able to exercise over their work.
Future Prospects
Employed respondents were also asked whether their current job offered them good prospects for career
advancement. a slightly larger number disagreed with this statement than agreed.
My job(s)/contract(s) offer me good prospects for career advancement
% of respondents, currently workingn=189
agree strongly 6.9%
agree 27%
Neither agree nor disagree 27.5%
Disagree 23.3%
Disagree strongly 15.3%
Don’t know 1%
Refuse to answer 1%
Respondents who were involved in entrepreneurial activity were more optimistic than those who were
not. The case study interviews also showed that entrepreneurs felt a greater sense of autonomy.
Improved Job Prospects
To explore employment options and opportunities, respondents were also asked what they felt they
needed in order to find a better job. Multiple responses were allowed (n=453). Better language and
communications skills was cited as the biggest barrier to employment opportunities (69% of respondents),
followed by Professional training/skills upgrading (55.9%), Networking/knowing more people (47%), and
Job References from Canada (45%).
Community Connections
In order to explore community connections, respondents were asked whether they participated in a
variety of activities within their cultural and wider community. Community was found to be both a site of
support and, less frequently, of exploitation.
The survey explored various forms of connections, concentrating on connections with the wider
community, levels of reciprocity and support, and participation in group activities. Community connections
include both social and economic connections; these may be helpful and hurtful. For instance, a social

the wellesley institute 31
network which only has access to poor quality jobs will not help a new arrival settle well, whereas a strong,
well-connected social group may help accelerate the settlement process.
Job Networks As A Potential Barrier
Demonstrating the importance of social networks, the most prevalent form of job referral was through
friends or family members. as shown earlier, just under half (45%) of respondents found employment
through friends and family. Word-of-mouth has always been considered a key aspect of successful job-
hunting in immigrant communities. Yet, where family and friends have access only to low-paying jobs
and precarious or dangerous work, this can trap newcomers in poverty. For those who were referred to a
job by a friend or relative, many worked in service jobs such as cashiers or customer service (29% of job
occupations). Pointing to the poor quality of jobs, 11% of the respondents reported their main occupation
as a daily basis worker.
somali respondents were six times as likely as Chinese Language or Bangladeshi respondents to
report working as a taxi driver.
a broader network was available to these newcomers. Eighty-five percent (85%) of respondents indicated
they use the internet for browsing and communication. a high proportion also used methods such as
an employment counsellor or agency. Professionals or those who had emigrated a number of years ago
were most likely to bridge outside the community. Those seeking employment in a profession or in the
financial sector used wider search methods. While it included friends and family, it also extended to
private employment agencies, internet searches and direct broaches to employers. Other research has
confirmed the diversity of a social network improves earning power (Geron, 1999). however it should be
noted that even the best job networks will not succeed with other structural barriers in place.
Sense Of Community And Belonging
Using measures from statistics Canada’s General social survey on social Engagement, the survey also
examined people’s sense of community and belonging. Research has established the importance of a
sense of belonging for health. This set of questions explored whether employment has a relationship to
one’s sense of belonging. The range of questions included perception of their community as a friendly
and inclusive place, participation in social and political activities, trust and measures of reciprocity.
While respondents were more likely to report that their community is a friendly place to live (61%), and
friendly to newcomers (57%), they were less likely to agree that they felt a part of the community (45%).
To compare, 65% Canadians strongly agree or very strongly agree that they feel a part of their community
(statistics Canada, 2010), although those in urban areas (55%) or who are low income (45% and 53%) are
more likely to report a lower sense of community belonging (Ross, 2002).
This sentiment of feeling disconnected did not seem to affect respondents’ willingness to provide
assistance to neighbours, friends, relatives or work colleagues. a strong proportion (69%) indicated they
had done so in the previous month. Those people who were involved in service jobs or in business were
most likely to have extended help (78% and 86% respectively), while those involved in small scale production
activities were least likely to have assistance (36%). This may correlate with the stories we heard about
small business owners who described their employment of compatriots as helping them, both financial

the wellesley institute 32
and to get “Canadian experience,” despite conditions that violate employment standards. The disconnect
that exists between perceptions of helping and violations of employment standards are explored further
in the next section.
Bangladeshi Respondents
In terms of community connections, Bangladeshi respondents showed high levels of interaction:
87% reported providing assistance to someone and 84% reported having received help in the
previous month. almost half (48%) reported having done volunteer work during the previous
year. Bangladeshi respondents also showed high participation in clubs and societies, with more
than half (56%) reporting membership in such groups. Just over one quarter (29%) also reported
taking part in Canadian political activities within the past year.
similarly, 68% of respondents indicated that they had received personal or emotional assistance from
someone in their community during the past month. When analysed against work type, again those
involved with small scale social production were least likely to have received help, indicating perhaps a
smaller social network, while those involved with service jobs, labour or small business, were more likely
to have received help.
Four out of five of those looking for work (80%) reported having provided assistance to someone, followed
closely by those who work part time (78%). Those who worked full time also showed high levels (72%) of
offering support. These forms of labour market participation (versus those working casually or those not
looking for work) were also linked to having received personal assistance from others.
To explore active connections to community, respondents were also asked about other more formal
dimensions of their connections to community. Thirty-four percent (34%) of respondents have been
involved in a volunteer activity over the course of the previous year. This is similar to 2003 survey rates of
Canadians, which found 30% of immigrants and 35% of Canadian-born residents had volunteered in the
previous year. Those respondents involved with jobs that involve physical labour were the least likely to
have volunteered (20%).
Just over one-third, or 35% of respondents, also reported memberships in a club or society. This is less
than other surveys of Canadian immigrants that have shown participation rates of 50%.Those involved with
small scale production were least likely to belong to a club or society. additionally, 21% of respondents had
taken part in a partisan Canadian political event or activity over the previous twelve months. In contrast,
55% of all Canadians were likely to have participated in a similar activity (hRsDC, undated).
The relationship between a sense of community and belonging and a number of other responses were
also examined. The first was respondents’ form of participation in the informal economy. Those who were
involved in service jobs (e.g. beauty and food services) or business (e.g. printing) were most likely to have
participated in other social behaviours, more likely to have given or received help, to have volunteered,
to have joined a club or society, or to have been politically active (almost half the business respondents).
Those involved in small scale production activities, such as producing handcrafts/jewellery, were least
likely to have had these positive social interactions. The reasons for this are not apparent but may be
related to location of work since much small-scale production occurs at home. some variation was also
seen by ethnicity. These are reported in later sections.

the wellesley institute 33
Responses to questions about social connections were also compared to respondents’ self-reported
health. Those who reported no depression in the previous month were also least likely to have provided
assistance or needed personal/emotional assistance. Conversely, those who reported feeling depressed
more frequently were more likely to have given or received assistance. They were also more likely to have
participated in a volunteer activity or to be a member of a club (again only those who reported depressive
feelings on a daily basis were the exception). however, those respondents who reported feeling depressed
on a daily basis, did not have this positive relationship to social connections.
In essence, and surprisingly, people who reported feeling depressed were more likely to be connected
to their community. What we were not able to determine was whether this is because those involved in
their communities bear the burden of others as well as their own, or whether this is because those who are
depressed seek community connections. In contrast, those who were politically involved did not follow
this same pattern, emphasizing perhaps a different set of causes.
In terms of sex of the respondents, men were slightly more likely to belong to a club (39% vs. 33%) while
women were slightly more likely to have volunteered (37% vs. 32%). Both sexes were as likely to have offered
assistance in the previous month (seven out of ten), although women were slightly more likely to have
received personal or emotional assistance (73% vs. 62%).
age had little relation with whether respondents has offered help to others, although the working age
(30 – 49) were most likely to have received some personal emotional assistance and to be a member of a
club or society. Political activity increased with age. seniors (65+) were most likely to have volunteered.
Overall, there was a strong relationship with those who had given and received assistance. Reciprocal
relations were apparent. The least common forms of relationships were those where the assistance had
been unidirectional. Generally those who had not offered or received assistance had not done either.
The majority of Chinese respondents showed active connections to their community: 63% reported
providing assistance to someone in the previous month, 65% reported having received help during
that time period, and about a quarter (26%) reported having done volunteer work in the previous
year. about one in five (18%) reported being a member of a club or society. a slightly lower number
(14%) of Chinese respondents reported having taken part in a Canadian-focused political activity
within the previous year. This was only half the participation level of the other two respondent
communities who both reported more comfort with English language communication.
Connection To Participation In Informal Economic Activities
In seeking to understand some of these patterns, we looked at whether there was a correlation between
a strong sense of belonging and participation in a shadow economy or precarious employment. a weak
correlation existed between the forms of work (Full time/Part time/Casual), however the response rate for
this was also low. subsequently, any of these results should be interpreted cautiously. Nonetheless there
are some interesting patterns in this data. Those in casual (unpredictable) work relations were three time
less likely to report feeling part of the community. Those in full time employment were twice as likely to
report a sense of community belonging (n=422).
some positive relationships were found between job satisfaction and a sense of belonging. Further analysis
also considered how a sense of belonging was associated with other measures. No strong correlation was

the wellesley institute 34
found with those who reported discrimination in their workplace, perhaps because the sample size was
too small for this level of disaggregation.
While other research (Masurel et. al. 2002; Wayland, 2012; North York Community house, 2013) has
found social networks are useful for successful entrepreneurialism, our research did not explore this
relationship.
Health And Stress Levels
Respondents were asked to report on their health and stress levels. This was considered important
because of the role of work, health and immigration status as social determinants of health.
Self-Reported Health
In general, hong feels stressed. In China, he had a higher position, better income, higher self-
respect and his dignity. When he first started working for cash shortly after arriving in Canada,
hong struggled with low self-confidence and thought he had lost his sense of self-worth. But later,
hong says, he accepted the new reality and felt more peaceful. “It is about adjusting your state of
mind. My English is not good, so I can’t hope much. I lowered my expectations, and I feel better
now.” But he does still feels mixed. he says that to be really happy, he needs to be working as an
electrician as he trained.
The report found very high levels of self-reported stress and depression among newcomers in comparison
to Canadian norms. somewhat surprising, despite the oft-reported healthy immigrant effect, respondents
were much more likely to report poorer health than the Canadian average. however, research on immigrant
health has found that income and employment status are strongly linked to self-reported health (Zhao,
2007, 2010). Finances and sense of belonging play important roles in self-reported health. This is not
new. as far back as 1988, the Canadian Task Force on Mental health Issues affecting Immigrants and
Refugees found that unemployment and underemployment affect newcomers’ mental health (health
Canada, 1999). although dated, additional evidence from the 1990 Ontario health survey indicates that
immigrants may rate their health generally lower that Canadians do, despite the evidence that they have
fewer chronic health conditions (health Canada, 1999, p.23).
In general, my health is% of respondents, surveyN=453
statistics Canada, health Indicator Profile, 2010
Excellent or very good 25.2% 61.9%
Good 43.5% 27.7%
Fair or poor 30.9% 10.3%
Refuse to answer 0.4%
Questions on sleep patterns, stress, pain levels and depression were also asked. at least one out of
four respondents was likely to report some problems in one of these areas. One-quarter of respondents
reported insomnia at least weekly. In comparison, one in seven of all Canadians report weekly insomnia
(statistics Canada, 2005). stress levels among respondents were somewhat lower than among the general

the wellesley institute 35
Canadian population. While 15.6% of respondents reported daily stress, 22.3% of all Canadians do. This
may be areas for further inquiry.
Comparisons on the other two dimensions, of pain and of depression, are difficult to interpret because
of the use of different definitions in this area. In addition, some of the health issues reported, such as
difficulty sleeping, pain and depression are also associated with stress conditions. It is not possible in this
study to disentangle what symptoms may be related to stress and/or trauma and what are expressions of
insomnia and pain that are not related to mental health issues. Despite this, respondents were also asked
about the occurrence of pain or depression in the previous month. Forty-nine percent (49%) cited depressive
symptoms, such as feelings of hopelessness, sadness and low energy levels within the previous month
(n=436); and 60% reported pain (often a proxy for mental wellness) during the same time period (n=440).
Analysis And Discussion
This research has yielded rich insight into the employment and economic lives of newcomers. however,
these findings were not what we expected. The research team set out with the premise that resourceful
people, recruited to our country because of their talents and commitment to forge a new life, were
finding ways to cope with the multiple challenges of settlement and integration. however, the degree
of underemployment, poor labour market integration and level of harassment and exploitation paint a
much grimmer, even grimier, picture than we expected. We had hoped to find that participation in the
cash economy was simply a transition point in the employment trajectory of many immigrants. Instead,
we found that it was much more likely to be a trap.
Neither government and community services, nor social networks emerged as clear pathways out of poor
jobs. Language class eligibility ends too quickly for meaningful labour market integration. Employment
standards are widely ignored. Local social networks offered poor quality jobs to more recent immigrants,
leaving them at the mercy of business owners and managers from within their own language groups. Well
educated immigrants continue to work precariously or in jobs for which they are over-qualified.
The focus of this study was from the perspective of newcomers. While we did speak with a few business
operators, through the key informant interviews, other related actors were not included. Other key
stakeholders include all three levels of government: for regulatory roles and their roles in supporting
labour market outcomes and social supports. Not to be discounted as well, is the role of the consumer in
this dynamic. Business owners report consumer demand for lower prices a normal expectation of doing
business. Given the scope of this study, we did not further examine these dynamics; however they are vital
to any broader discussion and policy resolution.
This next section will highlight some specific findings from this report and their connection to other
research and policy discussions in the area.
Wider Policy Context
The scope and the trends on those who participate on the edge of the mainstream are mainly unknown
within a Canadian urban context. Before undertaking this study, we suspected from anecdotal evidence
that the marginal economy played a significant role in the livelihood of newcomers. We heard that the
informal economy provides employment opportunities for immigrants (both legal and illegal) who

the wellesley institute 36
often face difficulties in getting access to regular jobs. These informal economic activities acted as an
alternative way of entry into the urban labour market. Thus, the question of informal economy cannot be
separated from the issue of access to the labour market for immigrants. The informal economy exists at
an intersection of various economic, social, political and cultural issues such as social exclusion, ethnic
enclaves, immigrant integration and poverty, which are also social determinants of health. We wanted to
understand how immigrants are managing the disparities they face in their income, labour market and
health, to lay the groundwork for a better policy and program response.
This report fits within the context of other research in the city of Toronto, looking at growing levels of
poverty and inequality, employment precarity, labour market shifts and how immigrants find their way
in all this.
A Root Cause: Poverty
Poverty, in all its complexity, is a central theme in the findings of this report. however, while perhaps
more specific to these communities, the findings are not new. There is a growing body of research which
looks at how these dynamics interact with the growing segregation of neighbourhoods by income bracket
and social networks which connect or isolate residents from the wider community. however, the value
of ethnic enclaves in the settlement process should be also recognized. This report found immigrants in
east Toronto were very low income and had few ways to bridge out of it.
Numerous research reports have described the poor labour market outcomes and resultant low-incomes
and poverty faced by Canadian immigrants. Reports from United Way Toronto (2003, 2004, 2007, 2011)
signalled the declining incomes that are creating the spatially divided city described by David hulchanski’s
and Cities Centre’s Three Cities (2010) work on neighbourhood change in Toronto. The persistence and
spread of poverty, especially among those most marginalized by race, immigration or family status, is
only worsening as the labour force bifurcates into high-end, high-skilled jobs and low-paying, service-
level jobs. The Toronto Workforce Innovation Group has tracked the division of jobs into those well-
paying ones requiring high-education levels with those, more often, service-based that are low-skilled
and poorly-paid (2011). Workers’ action Centre (2007; Gellatly, 2011) has detailed in report after report
the vulnerability of those employed in low-end jobs and sectors, facing wage theft and other working
conditions which fail to meet minimum employment standards. The Metcalf Foundation’s 2012 report,
The Working Poor, demonstrates the fast-moving treadmill many find themselves on, working full time
yet still falling below the poverty line (73% of working poor are immigrants). Groups like the Colour of
Poverty – Colour of Change have highlighted the growing racialization of poverty, where many immigrants
are caught, in their advocacy efforts.
Poverty is clearly a key driver however in newcomers’ participation in these marginal marketplaces. This
report tracked a wide range of activities which emerged out of newcomers’ strategies to cope with very
low household incomes and poor job prospects. Their work in substandard jobs or their participation in
informal economic activities emerged out of desperation and, sometimes, inspiration.
Labour Market Barriers: Immigrant Occupational/Skills Mismatch
Precarious employment and the loss of “good jobs,” has been documented by numerous groups including
unions, labour councils and grassroots advocacy groups. The Toronto Workforce Innovation Group’s

the wellesley institute 37
Changing the hourglass Economy (2010) tracks the barriers faced by new labour market entrants; young
people and new migrants face challenges entering the labour market and progressing through its ranks.
United Way Toronto and McMaster University, with several community partners including WoodGreen
Community services, have documented the growing precarity of employment in southern Ontario, and
how even middle class workers face more job insecurity. This spring, the Law Commission of Ontario
released a wide set of recommendations on protecting vulnerable workers.
Despite the limitations of a quantitative survey, some attempts were made to explore how and why
newcomers became involved in informal economic activities. Our premise was that immigrants arrive ready
to enter the Canadian labour market and contribute their skills and experience. The research supports
this. statistics Canada data shows that 85% of newcomers plan to work upon arrival in Canada – 94% of
those who are between the ages of 25 and 44 years (Longitudinal survey of Immigrants to Canada, 2003).
The responses from our survey demonstrate a substantial gap between those expectations and newcomers’
ability to access the labour market.
Given the generally low household incomes of most respondents in this study and the small incomes eked
out, the primary purpose for their participation in the informal economy is survival, . These are individuals
and families struggling to make ends meet, and a labour market which channels their desperation to its
own profit.
What was apparent from these findings is that occupations are only weakly related to educational
qualifications. Low wage, low-skill jobs were the norm for many respondents, even though many had
immigrated under a point system which awards higher education. This reflected a wider, well-documented
pattern. a 2006 statistics Canada study, The Dynamics of Overqualification, found that:
On a personal level, it has a psychological dimension. Underemployed university grads often
experience the frustration of lower earnings and job dissatisfaction. It could be a personal choice
for some to work in a lower skilled job because of…higher family responsibilities, or to improve
the quality of life such as being less stressed. For the nation as a whole, however, it represents an
underutilization of human capital. (Li, Gervais, & Duval, 2006)
This same study also found that recent immigrants, defined as those who had arrived in Canada within
the past ten years, were twice as likely to be working in a position for which they were overqualified and
were more likely to stay in that position, whereas others, such as younger workers, experienced it as a
transitory phase.
The occupational mismatch can become a catalyst for immigrants to seek their own opportunities
through entrepreneurial activities. North York Community house’s recent study (2013) found that the
most common reason (32%) entrepreneurs cited for starting their own business was that they “could not
find suitable employment (p.16).” Followed closely behind were 29% of entrepreneurs who were seeking
“ways to supplement income” (North York Community house, 2013, p. 16).
English language skills, within the wider Toronto context, have also been identified by others and in
our report as a key barrier for newcomers. advanced language skills provide the ability “to garner new

the wellesley institute 38
information, navigate unfamiliar systems and reach” (North York Community house, 2013) outside their
own community to access wider resources.
as noted above, many newcomers to Canada arrive here with education and skills. We also know from
many studies that their ability to land a job in their field or indeed a job paying an adequate wage is much
diminished, due to poorer English language proficiency, their lack of social networks and connections,
and difficulty adapting to a different labour market and a different business culture. Many resort to taking
any employment, what we call survival jobs, because they are prepared to do anything, simply to ensure
they can provide the essentials for their families, putting food on the table and a roof over their heads.
But in doing so, they often find themselves in jeopardy. They resort to taking jobs on the margins, where
they do not benefit from the kinds of employment protections we all take for granted. These protections
include rules governing minimum wages, overtime, vacation time or pay in lieu, coverage for injuries
sustained in the workplace, protection against harassment, and being enrolled in and contributing to
income support programs, such as employment insurance and the Canada Pension Plan. They move into
the invisible marketplace.
Labour market integration for newcomers has had strong research and policy attention, with interventions
such as Toronto Regional Immigrant Employment Council and Toronto Immigrant Employment Data
Initiative. These bodies have identified barriers to employment, such as “Canadian experience” 9 or
professional credentialing, which have arisen out of transnational migrations. This report found respondents
facing similar barriers. Internationally educated professionals were the most likely to report lack of access
to wider social networks and credential recognition by employers. Language also emerged as particularly
important.
An Invisible Population: Working Conditions
The immigrants we surveyed are vulnerable to abuse in many ways.
Ontario Employment Standards
First, we found immigrants are in a labour market that tolerates minimum labour standards violations,
opening them to abuse by employers. as our results show, bullying, poor pay, and unsafe work are all part
their work experience. second, because of very low household incomes and limited job opportunities,
newcomers are in an untenable position, seeking any possible additional sources of income. This often
means, with little recourse to better jobs or to strong protections, accepting substandard employment.
From the outset, newcomers face significant barriers including language supports, access to the formal
labour market, and unfamiliarity with Ontario employment standards. Precarity of jobs is a risk factor for
workers as well. Workers’ action Centre (2011) has also found that more precarious forms of employment
“had higher rates of workplace violations than did low-wage permanent workers.”
Enforcement of basic labour standards relies mainly on complaints from individuals, thereby making
newcomers more vulnerable, because of the fear or repercussions. Outside of the context of a unionized
environment the only current recourse open to a complainant is through the Ministry of Labour. however,
9 The Ontario Human Rights Commission has announced a new policy on removing the “Canadian Experience” barrier. (February 2013). http://www.ohrc.on.ca/en/policy-removing-%E2%80%9Ccanadian-experience%E2%80%9D-barrier

the wellesley institute 39
as reported by Workers’ action Centre 2011 report, the Ministry of Labour “inspects less than one percent
of Ontario’s 370,000 workplaces” (p.13).
alongside its activist work highlighting adverse working condition, including “bad bosses” and the
abuses among temp agencies, Workers’ action Centre has also championed strong policy proposals calling
for enhanced enforcement of employment standards and a system that is more proactive, rather than
responding to individual complaints. This includes targeting sectors and employers that are known to be
more likely in violation of provincial standards. Workers action Centre (2007) identified these sectors as
“banking, call centres, clerical, cleaning, computer/IT, construction, factory, general labourer, homecare
services, retail, sales, temp agency, and transport.” In 2004/2005, hRsDC named three high risk sectors
for employment standards violations. These were restaurants & taverns, retail and business management
services, and the garment industry. Comparable findings emerged from our survey. Factory work, working
in a store or in a restaurant, were cited as the three top sites where newcomers worked for cash for others.
Bullying, Harassment And Discrimination
Researchers such as Phil Oreopoulis (2009) have ably demonstrated the difficulty of making it past
the applicant stage of a job interview in Canada. Oreopoulis tested the receptivity of hiring managers to
people with non-anglo-saxon names. The results showed the barriers that many newcomers face getting
through the front door. his findings may reflect why such a disproportionate number of our immigrant
respondents have not found formal jobs which align with their experiences.
Other reports have also confirmed the higher levels of discrimination which newcomers may face.
The recent report from CCNC-TO (Zheng, 2013) demonstrates similarly high levels of abuse on the job.
CCNC-TO found 34% of their sample reported verbal insults and harassment and 3% reported they had
experienced physical harassment and assault on the job. This is similar to our findings in which 38% of
respondents reported experiencing bullying or harassment within the previous six months.
Safety
The Ontario Ministry of Labour also identified the underground economy as a source of vulnerability
for many workers, undermining minimum employment standards. In a follow-up to the 2010 Christmas
Eve tragedy where four construction workers lost their lives, the Ministry of Labour established an Expert
advisory Panel on Occupational health and safety which called for enhanced enforcement tactics. The
Minister of Labour accepted the report’s 46 recommendations.
Vulnerable employees were identified to include recent immigrants, temporary foreign workers, very low-
wage workers holding multiple part-time jobs, and workers in the temporary staffing industry, recognizing
that these workers “tend to be disproportionately employed in physically demanding or hazardous jobs.”
all of the report’s recommendations were adopted by the provincial government, and the Ministry is now
consulting on action priorities. Both small businesses and vulnerable workers are emerging as priorities.
In conjunction with the Law Commission of Ontario’s recent report, Vulnerable Workers and Precarious
Employment (2012), these issues are receiving more public attention, intra-governmental coordination,
and some dedicated resources.

the wellesley institute 40
Awareness Of Employment Rights
Immigrants who emigrated recently (within the previous five years) have lower levels of knowledge
about employment rights other than minimum wage. Recent immigrants were half as likely to know about
vacation pay, and two thirds as likely to know about workers’ injury benefits.
In 2010, the Chinese Interagency Network conducted a similar survey of pedestrians in the spadina
Chinatown on the same topic. Of the 119 people interviewed, they found, on average, respondents only
were able to answer half the questions correctly. The report cites:
about 40% of people did not know the current minimum wage or whether one is protected by
the Esa without signing a contract. also, more than 66% and 64% of the participants were not
aware of the overtime pay and holiday pay, respectively. 55% workers did not know the details of
severance pay or one week notice after the initial three-month probation period. alarmingly, only
18% respondents knew the maximum [number of] hour[s] one is permitted to work per week.
(Chinese interagency Network, 2010)
Language was identified as a complicating factor. In their follow-up study, CCNC-TO found that only
30% of respondents knew where to find help to resolve any concerns they had about fair treatment (Zheng,
2013). a 2011 unpublished report for Dr. Johanna Faulk, at the Canadian Manufacturers and Exporters, of
Canadian newcomers, confirmed these findings, that “newcomers felt that they did not have the context,
power or motivation to making [sic] their workplaces safer” (p.12). however, they also found that immigrants
“appreciated the health and safety focus in Canada, and were keen to see health and safety prioritized
consistently” (p. 11). When immigrants are unaware of their employment rights, they may face more than
the immediate threat of exploitation by a bad employer. They also, as stapleton & Nascimento (2006) remind
us, lose out on broader income supports and transfers, such as eligibility for Employment Insurance,
Workers’ Compensation, various tax credits and the Canada Pension Plan.
The report recommends improved community education tailored to non-official language groups.
The Ontario Ministry of Labour is now more focused on protections for vulnerable workers such as
information in multiple languages, conducting inspections in workplaces and sectors where vulnerable
workers are concentrated and conducting inspections after regular business hours so that shift workers
are protected. as of June 2012, after our fieldwork, employers are required to post a health & safety poster
in English and the language of the majority of employees in their workplace.
The survey clearly found that basic knowledge of their employment rights is the first challenge for
newcomers. The findings also revealed their reluctance to exercise their rights under provincial legislation.
This means employers will have to ensure they create a workplace that values safety and employment
standards.
Community Bonds: The Ties That Bind
Newcomers often rely upon the social capital of other newcomers who have arrived before them. It provides
the connections and access immigrants need to start their new lives and build better ones. Ideally, the
community leverages itself into prosperity and economic integration with the wider community. however,
this is not always so. Occasionally communities become entrapments rather than stepping stones.
the wellesley institute 41
Consistent with other research (stapleton, 2006; Egeh, 2011), we found that newcomers could not always
rely on those from their same ethnic group for help in finding a good job. Those immigrants with fewer
English-language skills could find needed supports, or, as easily, be taken advantage of within their own
communities. sadly, we found that those newcomers who dealt directly with a purchaser of service (i.e. a
proprietorial relationship) seemed to do better, reporting fewer employment standard violations; those
who were hired to do work by an intermediary were more likely to report illegal working conditions. The
2010 Christmas Eve construction accident is an example of this dynamic, where a crew supervisor with
more language capacity worked with employees who lacked better English skills.
an early discussion with the Toronto East LIP identified one local ethnic grocery store where newly-
arrived women often found their first employment, the assumption being that it would provide “Canadian
experience10” within a familiar context. Because the store was a central part of the community, it was
trusted. We were not able to interview employees at that store about their working conditions. stories
emerged through the course of our research in interviews with key informants of employers within their
own communities whose behaviour was very problematic. The very high rates of abuse (1/3) reported by
respondents also gave the research team pause for thought. The informal economy can as easily trap as
support its participants. Those with less English were more likely to be working in their home language
and more likely to report employment standard violations.
stapleton and Nasciemento (2006) described the limitations faced by less established immigrant
communities, including “reduced access to work; inadequate support for settlement and resettlement;
reduced infrastructure; inadequate information, and little political support for community issues (p. 19).
They also found that individual immigrants could face divisions within their own immigrant communities,
“based on ethnicity, age, gender and other factors” where fellow immigrants might exploit those who are
less able (p. 20). Egeh (2011) and others have also pointed out the problems of how intra-ethnic social
bonds may not enrich new entrants if the community only has access to poor quality jobs.
In contrast, the wider social capital available within an ethnic community can provide the supports bridge
to better employment opportunities. North York Community house’s 2013 study found that the supports
offered by others in the same immigrant community can have a buoying effect for entrepreneurial activities,
including support from family/friends, “co-ethnic staff, markets and suppliers …. Large, geographically
concentrated enclaves provide substantial markets and extensive employment pools (p. 24).”
all of these dynamics of social capital were apparent in the three ethnic communities we studied. The
Chinese community had the longest history and the strongest social and commercial infrastructures, with
some language and class divisions apparent. The somali community had the smallest population and
their community infrastructure is widely dispersed. While the Bangladeshi community had the benefit
of being the most geographically concentrated, their community infrastructure is still very emergent.
These stories, these findings tie into wider policy discussions on the complex intersection of immigration,
poverty and the labour market. They help us to understand how the financial, yet precarious, supports
offered through informal economic activities are integral to so many immigrant households.
10 In his report A Public Service for Ontarians: A Path to Sustainability and Excellence, economist Don Drummond called for the regularization of employment and additional enforcement as a revenue source of up to $500 million a year for government.

the wellesley institute 42
Shadow Economies
a core finding from our study is the wide range of experience of those within the informal economy. an
important finding is the degree to which immigrants work in jobs that do not meet minimum employment
standards. another theme in the results is economic activity outside formal employment relationships,
in a more cash-based and sometimes more entrepreneurial economy.
all of these activities have variously been called an underground economy, informal economy, or, for
the purpose of this exploration, a shadow economy. Because these activities exist within an arena where
cash exchanges leave much economic activity untraceable, this is typically seen as a problem for tax
collection and sometimes for workers’ safety. It also has longer term impacts on an employee’s access to
social programs, such as employment insurance and the Canada Pension Plan (stapleton, 2013).
There is an extensive body of international research on economies that operate parallel to formal labour
markets. They also use a more political and economic perspectives in their approach. Our approach
examined the issue from the perspective of those who participate in undocumented economic activities.
It is more sociological in its approach; mapping its drivers and impacts at the micro-level.
Voicu (2012) summarizes the approach we used, seeing the shadow economy is described also as “a
source of development, subsistence and even escape from the periphery.” It is an asset-based approach
that sees newcomers as agents with their own destinies, sometimes trapped where they are, but always
looking for a creative and resilient response to the limits they face. Only a small number of Canadian
research reports explore the shadow economy, and even fewer policy and program responses have been
developed in response to the seemingly daily reality for newcomers.
st. Christopher house has produced (and is continuing to produce) interesting analyses on the topic of the
informal economy. In a 2006 paper, they described the various coping mechanisms that immigrant families
use when faced with labour market barriers (stapleton & Nascimento). These included income mixing
(formal and undocumented income sources), working multiple jobs, starting over in their occupational
field, returning to their home countries, and depression and immobilization (p. 3). In their current work,
they identify multiple reasons exploring why people enter the informal economy, although the conventional
description of tax evasion is not one of them.
The view of the shadow economy as a haven for tax evaders is part of a wider policy discussion at the
provincial level within the past three years. Both the recent Drummond Report (2012)11 and the Ontario
Ministry of Labour’s Expert Panel, Occupational health and safety (2010), recommended the creation of
a provincial body responsible coordinating a provincial underground economy strategy. Both provincial
reports identified the informal economy as an untapped source of tax revenue for government and a threat
to the competitive advantage of other businesses. however, from the perspective of immigrants and their
household economics, the idea of the informal economy is not as simple.
Excluded from the main labour force, working underground becomes a much-needed cash-generating
activity, one that clearly makes newcomers vulnerable to employers looking to avoid provincial Employment
11 In his report Public Services for Ontarians: A Path to Sustainability and Excellence (2012), economist Don Drummond called for the regular-ization of employment and additional enforcement as a revenue source of up to $500 million a year for government.

the wellesley institute 43
standards or unleashes a determined entrepreneurial spirit to succeed. Business owners and consumers
both benefit from this arrangement.
These activities are not without risks for small entrepreneurs either who only hope to supplement their
household incomes. They run the risk of putting themselves in jeopardy by running afoul of regulatory rules
that stipulate where and how businesses are to be conducted and what fees, licenses and taxes may apply,
and/or because of restrictions that accompany government social assistance and other income support.
This next section will take a high-level look at potential policy and program responses which might help
newcomers lever out of the invisible marketplace.
Implications And Policy Solutions
What should be the appropriate policy response?
Our study provides insight into the impact of poor labour market integration and growing inequality.
as Canadians, we must be aware of the effects of these wider forces, especially on the most vulnerable
and who have fewer choices. Even the wider protective effects of higher education do not sheild against
the structural discrimination that confines many immigrants to poor jobs. supports for those in low-
income jobs have been, and should be, further explored. some ways to reduce household costs include
the expansion of affordable housing, working tax benefits, and portable health care benefits.
We also need to better understand the shadow economy. The United Nations agency, the International
Labour Organization (ILO) provides eight key pillars for action: 1. Measuring the informal sector.2. Enhancing the micro-entrepreneur’s potential.3. The creation and capacity building among informal sector organizations.4. Infrastructure, job creation and living conditions.5. Reforming training policies and systems.6. Enhancing workers’ social protection.7. Reforming legal frameworks.8. assessing macroeconomic policies.
While focused on countries of the south, these basic building blocks provide an important guide for
policy discussions in Ontario, where as evidenced in this report, many of these minimal targets are not
met for those on the edge of the labour market.
Turning to the level of individuals workers on the ground, heightened enforcement of basic employment
standards is the most obvious first step. The easiest way to eliminate exploitative employment practices
is to deal with the problem at its source, through stronger regulation and detection of poor employers.
Our commitment must be to ensure that all jobs are good jobs.
however, the second stream of activities we tracked are ones that newcomers themselves initiated,
to increase their household revenues. From the perspective of newcomers themselves, they need to
be supported through public education, health and safety training, and supports for job-hunting. If
the minimal goal of our policies is to support the capacity of individuals and households to maintain
themselves independently, then there is merit in exploring how the energy and drive of newcomers might
be channeled. so the question then becomes how and whether any of these informal business activities
can be regularized and integrated into the mainstream economy.
the wellesley institute 44
Indeed, other studies have supported the view that informal businesses are often a stepping stone
towards more formalized businesses. a recent survey in Great Britain (Dellot, 2012 p. 22) of formal business
owners reported the following:• One in five respondents said they had engaged in informal activities on at least one occasion when
starting their businesses.• Of the respondents who had traded informally, the two most popular reasons given for doing so was
that they first wanted to see if their business would be viable (64%) and that it gave them the breathing space before they had the capacity to register their business (40%).
• Only 9% of those who had engaged in informal business practices said they did so because they wanted to earn extra income that would have otherwise been taxed.
The decision to engage in informal business activity may well be driven by a number of factors, of which
avoiding taxes might not be the primary one. In such an instance, a policy approach that aims to support
informal businesses, with the goal of graduating them into the formal economy (the British use the term
“formalising the businesses”), may have the added benefit of both encouraging entrepreneurial spirit
where it emerges naturally and growing the local economy.
To date, much of the policy response to shadow economies has been to respond with further strictures.
however, where these activities do not violate minimum employment and health and safety standards,
there may be more room for consideration of other approaches. The British report (Dellot, 2012) builds
on this view:
“[D]eterrence measures are symptomatic of a system that fails to recognise the many and varied
factors driving entrepreneurs below the radar. Informality is not always the result of a simple
cost-benefit calculation on the part of rational actors but rather a combination of factors – for
instance, poverty or the prohibitive costs of business registration – that put formalisation out of
reach. Nor is informal activity a wholly clandestine activity, which deterrence implies. It exists
within a ‘political economy’ of mutual support that emerges when a community is attempting to
help one another in times of need” (p. 22).
“Formalisation should therefore not always be seen as a simple decision to be made but rather a journey
with numerous individual, structural and cultural hurdles that need to be cleared along the way.” (p. 33)
Thus, might there not be a case to be made for assisting individuals engaged in self-employed income
generation, even when on social assistance, in a way that goes beyond the earned income provisions
currently in place?12 Given the challenges of starting a business, and the time and costs associated with
such an endeavour, perhaps there is reason to encourage initiatives of this sort, both as a way to enhance
household income, but also as a way to support the economic life of lower-income neighbourhoods?
These are large policy questions, but any approach would need to be fair to newcomers and accord with
the rules, regulations and fair treatment we expect for all Canadians.
12 Currently,underOntarioWorks,earningsfromregularemploymentaredeductedfrombenefitsatarateof50%,thusdeductingonlyonedollarfromsocialassistancebenefitsforeverytwodollarsearnedthroughemployment.However,earningsfromself-employmentdonotattractthisincentive to work. The recent review of social assistance, Brighter Prospects: Transforming Social Assistance in Ontario, recommends treating income self-employment in the same way as earned income from employment (p.39 of the report).

the wellesley institute 45
Conclusion
We found the results from our research to be more complex than we predicted. Newcomers’ abilities to
deal with poor labour market access and resultant coping methods exist across a dichotomous spectrum,
ranging from illegal employment arrangements to budding entrepreneurialism. We heard both stories
of victimization and of resourcefulness. We heard stories of dashed dreams and of pragmatic, rational
responses to a system that does not support labour market integration. Most of the stories were of people
determined to succeed, whether within the system or from where they were shut out.
One end of this spectrum is plainly harmful to those participating in it. Those who worked at the edges
of the mainstream economy, unprotected by and without information about basic employment standards
fared very poorly. The underside of a shadow economy is clear. These were stories of poverty, anxiety and
depression, stories of harassment and exploitation from employers who know their employees have
few other opportunities, and stories of discontent and frustration. There were those recruited for their
professional experience who never were able to use their talents within our city. There were even very real
stories of danger. Our report found that those who worked for others were the most likely to face poor
working conditions and be unhappy about it. a lack of awareness of employment rights, or the benefits of
claiming them, was also confirmed among some respondents. The harsh reality is that many newcomers are
working without the legislated protections which are intended to be universal minimum standards for all.
Part of the solution will be to make explicit how regular employment is more profitable on both a personal
and societal level and how one can claim one’s employment rights. however, a stronger underpinning
has to be systemic enforcement, so that employers don’t resort to an easy source of trouble-free, cheap
labour and so that the most vulnerable among us are not left working without protection.
We did find some bright spots, on the other end of the spectrum, where newcomers demonstrated
their resiliency or were able to be creative and flexible. a few of these new Canadian residents engaged in
informal economic activities for a range of positive reasons: as a way to meet an unmet local demand, as
part of strong social networks which are embedded in trust and reciprocity, as part of settlement supports
(Elson, 1992; Reimer, 2001). This is not to deny the reality that they turn to these informal activities often
because of a failure to connect to the formal economy; we found that newcomers can become successful
entrepreneurs and do look for opportunities to grow.
There is no doubt that some people, whether they are Canadian-born or recent newcomers may sometimes
engage in the underground economy or in the informal sector as a way to skirt rules or to take advantage
of the system. however, we found the more common story was one driven by need. The goal here was to
understand the actual experiences of newcomers and how their dire circumstances lead them to engage
in activities that put them in jeopardy at the hands of those willing to take advantage of their desperation.
Pointedly, to understand the dynamics of working underground, neither the research advisory group
nor the Toronto East LIP took a position on the legality or ethics of any particular coping strategies used
by respondents; our intention was to map these activities so that we could better understand newcomers’
response to exclusion. It is notable that we did not discover a large number of “undocumented” workers
or ones engaged in activities at the criminal fringe. Instead, our examination found these strategies
employed by a broad breadth of immigrants (and, while we did not study them, almost certainly also the
wider population).

the wellesley institute 46
Through hearing these stories of survival we can explore the values we share as a wider community, those
which touch on the social contract we have with each other, of the misery of when it is violated and of the
human capacity for ingenuity and resiliency in the face of challenge. This is a story of the creative energy
and determination through which people find a way survive even when the main channels are closed to
them. In present day, where immigrants face barriers to social and economic integration, their skills and
energy are lost to the wider economy with ripple effects through the generations. It is a loss for them and
for us. how this energy is unleashed is up to us. Former Canadian Minister of Citizenship, Immigration
and Multiculturalism, Jason Kenney has spoken of his government’s desire to avoid “the kind of ethnic
enclaves or parallel communities that exist in some European countries” (National Post, 2012). This is
mirrored in the book arrival City (2011), where journalist Doug saunders describes the urban settlement
areas, often ringing our cities, as places “where the next great economic and cultural book will be born, or
where the next explosion of violence will occur.” how this unfolds is under our control. The answer is not
simply to ban enclaves, places which can provide important settlement supports, or to focus a crackdown
on those making their subsistence this way. The answer to these straightened economies is to make the
invisible visible, to unlock opportunities, to build on hope, and to include us all.

the wellesley institute 47
References And Resourcesallamby, Les, John Bell, Jennifer hamilton, Ulf hansson, Neil Jarman, Michael Potter and sorina Toma (2011), Forced
Labour in Northern Ireland: Exploiting Vulnerability, York: Joseph Rowntree Foundation, pp.34-5; Northern Ireland Council for Ethnic Minorities. 2012
Bangladeshi-Community services, WoodGreen Community services and action for Neighbourhood Change. Research report on entrepreneurial activity in the Crescent Town area. Toronto: 2011.
Canadian Manufacturers & Exporters. Improving health and safety training for newcomers in manufacturing workplaces. september 19, 2011. Unpublished.
Chinese Interagency Network. Chinese workers are not protected by Esa. Chinese Canadian National Council – Toronto Chapter. Toronto: 2010 (http://www.ccnctoronto.ca/?q=zh-hans/node/343)..
City of Toronto. Memo. Release of the 2006 Census Data on Income and shelter Costs. Undated. http://www.toronto.ca/demographics/pdf/2006_income_and_shelter_costs_briefingnote.pdf
City of Toronto, social Development, Finance & administration, social Policy analysis and Research. Profile of Low Income in the City of Toronto. 2011. http://www.toronto.ca/demographics/pdf/poverty_profile_2010.pdf
Dechief Diane and Philip Oreopoulos. Why do some employers prefer to interview Matthew, but not samir? New evidence from Toronto, Montreal, and Vancouver. Metropolis British Columbia. Working Paper series. Linda sheldo, Krishna Pendakur and Daniel hiebert. Editors. september 2011.
Dellot, Benedict., Untapped Enterprise: Learning to Live with the Informal Economy, Rsa (Royal society for the encouragement of arts, Manufactures and Commerce), 2012, p. 22. http://www.thersa.org/__data/assets/pdf_file/0011/729443/Enterprise-Untapped_Enterprise-Rsa.pdf
Dwyer Peter, hannah Lewis, Lisa scullion and Louise Waite. Forced labour and UK immigration policy: status matters? Joseph Rowntree Foundation. United Kingdom: October 2011.
Egeh, haweiya. social Capital, Labour Market Outcomes and the Influence of Ethnic Concentration: a Case study of the somali Community in Toronto. Unpublished thesis. Ryerson University. 2011.
Elson, Diane. “From survival strategies to Transformation strategies” Women’s Needs and structural adjustment.” Unequal Burdens: Economic Crises, Persistent Poverty, and Women’s Work (Lourdes Beneria and shelley Feldman, eds.) 1992.
Gellatly, Mary. Unpaid wages, Unprotected Workers: a survey of Employment standards Violations. Workers action Centre: Toronto. May 2011.
Grenon, Lee. Obtaining a job. Perspectives. statistics Canada. spring 1999.
human Resources Development Canada (hRsDC). Indicators of Well-being in Canada: social Participation. Multiple pages. http://www4.hrsdc.gc.ca/[email protected]?did=16#D_16. Undated. Retrieved December 9, 2012.
human Resources Development Canada (hRsDC). Indicators of Well-being in Canada: Work – Employment Rate. Multiple pages. Undated. Retrieved December 21, 2012. http://www4.hrsdc.gc.ca/[email protected]?iid=13
Interagency Panel on Research Ethics. Tri-Council Policy statement: Ethical Conduct for Research Involving humans. 2012. http://ethics.gc.ca/eng/policy-politique/initiatives/tcps2-eptc2/Default/
Jie, sim Wan, huam hon Tat, amran Rasli and Lee Thean Chye. Underground Economy: Definition and Causes. Business and Management Review. Vol. 1 (2), pp. 14-24, april 2011. (http://www.businessjournalz.org/articlepdf/BMR_1205.pdf)
Kinnon, Dianne. health Canada, Canadian Research on health and Immigration. 1999. http://publications.gc.ca/collections/Collection/h21-149-1999E.pdf
Law Commission of Ontario. Vulnerable Workers and Precarious Work. Interim Report. august 2012. (Final report, December 2012)
Lewchuk, Wayne et. al. ”From Job strain to Employment strain: health Effects of Precarious Employment.” Forum on Precarious employment. Just Labour. Vol. 3. Fall 2003. http://www.justlabour.yorku.ca/volume3/pdfs/lewchuketal.pdf

the wellesley institute 48
Li, Chris, and Ginette Gervais and aurélie Duval. The Dynamics of Overqualification: Canada’s Underemployed University Graduates. statistics Canada. Ministry of Industry: Ottawa. april 2006.
Losby, Jan. L., et. al. Informal Economy Literature Review. Institute for social and Economic Development and the The aspen Institute. December 2002. http://www.kingslow-assoc.com/images/Informal_Economy_Lit_Review.pdf
Masurel, Enno, Peter Nijkamp, Murat Tastan and Gabriella Vindigni. “Motivations and Performance Conditions for Ethnic Entrepreneurship.” Growth and Change. Vol. 33, Issue 2, pp. 238-260. spring 2002. http://onlinelibrary.wiley.com/doi/10.1111/0017-4815.00189/abstract
National Post, Opinion. “Kenney’s crossroads.” Undated. Retrieved, Dec. 21, 2012. http://www.nationalpost.com/opinion/columnists/story.html?id=33049fe7-8a94-43fa-9b44-65490ae111c6
Neuwirth, Robert. stealth of Nations: The Global Rise of the Informal Economy, Random house Digital. 2011.
North York Community house. DIY: Immigrant Entrepreneurs are doing it for themselves. Research: Public Interest. July 2013. http://www.nych.ca/wp-content/uploads/2013/07/DIY-Immigrant-Entrepreneurs-report-July-2013.pdf
Ornstein, Michael. Ethno-Racial Inequality in Toronto: analysis of the 1996 Census. City of Toronto. 2000.
Oreopoulos, Philip. “Why do skilled immigrants struggle in the labour market? a field experiment with six thousand resumes”, 2009. http://mbc.metropolis.net/assets/uploads/files/wp/2009/WP09-03.pdf
Picot, Garnett, Feng hou & simon Coulombe. Chronic Low Income and Low-Income Dynamics among Recent Immigrants. statistics Canada, analytical studies Branch Research Paper series. 2005.
Poverty and Employment Precarity in southern Ontario (PEPsO) research group. It’s More Than Poverty: Employment precarity and household well-being. Wayne Lewchuk, Michelynn Lafleche, Diane Dyson et. all. McMaster University and United Way Toronto. 2013
Public services for Ontarians: a Path to sustainability and Excellence. Report from the Commission on the Reform of Ontario’s Public services. (Don Drummond, Chair). Queen’s Park Printer, 2012. http://www.fin.gov.on.ca/en/reformcommission/chapters/report.pdf
Reimer, Bill. “The Informal Economy in Rural Canada” Draft. 6 May 2001. accessed January 15, 2013. http://nre.concordia.ca/ftprootFull/ReimerInformalEconomyCERF.pdf
Report and Recommendations to the Minister of Labour. Expert advisory Panel on Occupational health and safety. Province of Ontario. December 2010. http://www.labour.gov.on.ca/english/hs/pdf/eap_report.pdf
Ross, Nancy. Community Belonging and health. health Reports, Vol. 13, No. 3. statistics Canada, March 2002.
saunders, Doug. arrival City. Knopf Canada, 2011.
sherman, Joshua. “Government lays off employment standards officers.” humber Et Cetera. News, October 5, 2012. Retrieved December 14, 2012. http://humberetc.com/2012/10/05/government-lays-off-employment-standards-officers/
stapleton, John. Framing the Informal Economy. Presentation to Informal Economy Technical advisory Committee. st. Christopher house. July 23, 2103.
stapleton, John. The Working Poor. Toronto: Metcalf Foundation, 2011. http://metcalffoundation.com/wp-content/uploads/2012/02/Working-Poor-in-Toronto-Region-summary-Report.pdf
stapleton, John and Odete Nascimento. Poor Immigrants in Canada: are they working? a Community Perspective. st. Christopher house, Toronto, November 2006. http://openpolicyontario.com/wordpress/wp-content/uploads/2012/02/Lisbon.pdf
statistics Canada, Canadian Community health survey (CChs), 2010.
statistics Canada, health reports. The Daily, November 16, 2005.
statistics Canada. housing, Family and social statistics. Ethnic Diversity survey: Portrait of a multicultural society. Catalogue No. 89-593-XIE. Ottawa (ON): statistics Canada: september 2003. http://www.statcan.gc.ca/bsolc/olc-cel/olc-cel?catno=89-593-X&lang=eng

the wellesley institute 49
statistics Canada, Labour Force survey, september 2012. http://www.statcan.gc.ca/daily-quotidien/121005/dq121005a-eng.htm
statistics Canada, Longitudinal survey of Immigrants: Process, progress and prospects. “Labour Market Entry”. Catalogue No. 89-611-XIE. Ottawa (ON). september 4th, 2003. http://www.statcan.gc.ca/pub/89-611-x/4152884-eng.htm
statistics Canada, Personal Debt, Perspectives on Labour and Income. Catalogue no. 75-001-XIE, pp. 28 – 34, January 2007. http://www.statcan.gc.ca/pub/75-001-x/commun/4235072-eng.pdf
statistics Canada. Personal networks and the economic adjustment of immigrants. Derrick Thomas (author). Canadian social Trends. November 20, 2011. http://www.statcan.gc.ca/pub/11-008-x/2011002/article/11592-eng.htm#a4
swift, Jamie, Brice Balmer and Mira Dineen. Persistent Poverty: Voices from the Margins. Toronto: Between the Lines, 2010.
Thomas, Derrick. Personal networks and the economic adjustment of immigrants. Canadian social Trends. statistics Canada. November 30. 2011.
Toronto Immigrant Employment Data Initiative (TIEDI). “Fact sheet 09-01: how Many Immigrants with a masters or a PhD degree have immigrated to Canada, by year of arrival?” York University. February 2009. http://www.yorku.ca/tiedi/doc/TIEDIFactsheet0901.pdf
Toronto Workforce Innovation Group. an Economy Out of shape: Changing the hourglass. Tom Zizys. Toronto: 2010.
United Way Toronto. Decade of Decline: Poverty and income inequality in the City of Toronto in the 1990s. susan MacDonnell. Toronto, 2003.
United Way Toronto. Losing Ground: The Persistent Growth of Family Poverty in Canada’s Largest City. susan MacDonnell, april Lim and Diane Dyson. Toronto. 2007.
United Way Toronto. Poverty by Postal Code. 2004. susan MacDonnell, Don Embuldeniya, and Fawzia Ratansho. Toronto, 2004.
United Way Toronto. Poverty by Postal Code 2: Vertical Poverty. susan MacDonnell, Jamie Robinson, Vladmir Mikadze, Laura McDonough, alan Meisner. Toronto, 2011
Venkatesh, sudhir alladi. Off the Books: The Underground Economy of the Urban Poor. harvard University Press. 2006
Voicu, Christina. “Economics and ‘underground economy theory.” Theoretical and applied Economics. Vol. XIX (2012), No. 7 (572), pp. 77-84. Retrieved December 14, 2012: http://store.ectap.ro/articole/752.pdf
Wayland, sarah. Immigrant self-Employment and Entrepreneurship in the GTa: Literature, Data and Program Review. Maytree and Metcalf Foundations. 2012.
Wilson, Ruth Marie, Patricia Landolt,Y.B. shakya, G. Galabuzi, Z. Zahoorunissa, D. Pham, F. Cabrera, s. Dahy, and M.-P. Johy., Employment and Income securities faced by racialized groups on the Black Creek area and their impacts on health, access alliance Multicultural health & Community services, Toronto, 2011.
Workers’ action Centre. Unpaid Wages, Unprotected Workers: a survey of Employment standards Violations. Toronto: May 2011.
Workers’ action Centre. Working on the Edge. Toronto: 2007. http://www.workersactioncentre.org/wp-content/uploads/2011/12/pb_WorkingOnTheEdge_eng.pdf
Zhao, Jun. “socio-Economic Determinants of health and health Care Utilization of Recent Immigrants in Canada.” Citizenship and Immigration Canada. 2007.
Zhao, Jun and Li Xue and Tara Gilkson. health status and social Capital of Recent Immigrants in Canada: Evidence form the Longitudinal survey of Immigrants to Canada. Citizenship and Immigration Canada. March 2010.
Zheng, Tommy F. B. One step Forward, Two steps Back: Community Research about Chinese Newcomers’ Working Conditions and Experiences. Chinese Canadian National Council, Toronto Chapter. June 2013.
the wellesley institute 50
Appendix 1: Project Background
Toronto East Local Immigration Partnership
The Toronto East Local Immigration Partnership (LIP) is one of 14 LIPs in Toronto and (many more
across Ontario) established by Citizenship and Immigration Canada to:• Improve access to, and coordination of, effective services that facilitate immigrant settlement and
integration• Improve access to the labour market for immigrants• strengthen local and regional awareness and capacity to integrate immigrants• Establish or enhance partnerships and participation of multiple stakeholders in planning, and
coordinating the delivery of immigration services
The Toronto East LIP catchment area covers the east end of the former City of Toronto, an area roughly
bounded by Lake Ontario to the south, the Don Valley to the west, O’Connor Drive to the north and Victoria
Park avenue to the east. Its membership is made up of more than 20 participating organizations.
Project Description
In pursuing its goals, the Toronto East LIP came to appreciate the importance of informal settlement
processes and reliance on the informal economy on the part of newcomers as a result it has made these
areas of special attention and created workgroups on each topic. The Informal Economy Workgroup has
met monthly since september 2010. Composed of local community agencies and ethno-specific community
groups, the workgroup built initial linkages across ethnic and language groupings and engaged in the
following activities:• Discussed the nature and mechanisms of the informal economy• Reviewed the results of a preliminary survey on the informal economy by Bangladeshi Community
services in partnership with action for Neighbourhood Change and WoodGreen Community services, undertaken largely by volunteer workers
• Received presentations on under-the-table employment• Undertaken a literature review on the informal economy• Explored benefits, drawbacks, opportunities and experiences of immigrant women who have become
involved in home-based employment, such as sewing and cooking
This study is the natural extension of this workgroup’s activities. The grant from the Wellesley Institute
allowed the workgroup to partner on this research project.
Project aim: • To investigate local newcomer participation in the informal economy
Project objectives: • To understand the nature and scale of the informal economy among local newcomers• To understand the impact of their participation in the informal economy, in terms of income security,
health and social inclusion• To identify potential points of intervention, either to support or mitigate reliance on the informal
economy, depending on its impact

the wellesley institute 51
Research questions: • Test the relation of social determinants of health with engagement in informal economy activities • Describe the scale of the informal economy• Explore the settlement transitions and initial labour market pathways of those engaged in each
economy (formal/informal)• Describe the financial impact of informal economy activity on households
Project Partners
Action for neighbourhood Change – Taylor massey (AnC-Tm): action for Neighbbourhood Change
is a United Way of Toronto funded initiative that works with residents in Priority Neighbourhood areas
to build local engagement and strengthen Toronto neighbourhoods. aNC-TM partnered on an earlier
research project looking at informal economic and entrepreurial activities within the communities it serves.
This project was done in partnership with Bangladeshi-Canadian Community services and WoodGreen
Community services. aNC-TM participated on the advisory Committee for this project.
Bangladeshi-Canadian Community Services (BCS): Bangladeshi-Canadian Community services offers
information and referrals, settlement services and community programs to residents living in Crescent
Town, Teesdale, and surrounding areas. BCs partnered with aNC-TM and WoodGreen to do earlier research
in this field. BCs staff played key roles on the advisory Committee and on the research team as Lead
Researcher.
Chinese Canadian national Council – Toronto Chapter (CCnC-To): CCNC-TO is a city-wide organization
that promotes equity, social justice and civic participation. CCNC-TO research laid some of the groundwork
for this study in an earlier report that examined workers’ knowledge of their employment rights under
provincial legislation. CCNC-TO participated on the advisory Committee for this project and supported
the research team.
neighbourhood Link: Neighbourhood Link is a multi-service community agency which has served
residents of the east end of Toronto since 1975. staff were active on this project’s advisory Committee
and the agency acted as Financial Trustee on this project.
Riverdale east African Association: The association is a community-based organization which works
to build partnerships and support for people from the horn of africa. The association was a member of
the advisory Committee and staff were members of the research team.
Woodgreen Community Services: WoodGreen is a large multi-service agency which seeks to create a city
where everyone has the opportunity to thrive. WoodGreen acted as the lead agency in the Local Immigration
Partnership (LIP), was active on the advisory Committee for this project, and supported the research team.
Tom Zizys (consultant): Tom Zizys is a labour market and community economic development specialist.
Tom supported the Local Immigration Partnership (LIP) and the advisory Committee for this report. his
vision and input were invaluable in moving this report to reality, for, as he said, “the common good.”

the wellesley institute 52
Appendix 2: Methods
Methodology
Using a mixed methods approach we sought to uncover some of the patterns and trends around labour
market participation, and involvement in the informal economy for newcomers in three ethnocultural
communities in Toronto.
Research Design And Methods
The research design was composed of two related data collection methods. Both quantitative and
qualitative methods were used in the study. Quantitative data was collected by survey of sampled households/
individuals. Qualitative data was collected from in-depth interviews of six key informants.
The research population was immigrants, 18 years old and above, living in Toronto East. Respondents
provided information on the household’s day-to-day activities related income and expenditure as well as
other aspects of the home. as well, they belonged to one of the following communities:• Bangladeshi• Chinese (Mandarin or Cantonese speaking)• somali
The primary sampling unit was the household/economic family unit. Information on immigration
status, demographic profile, economic engagements, social determinants of health, and socioeconomic
variables for each sampling unit was collected using structured questionnaires. a second survey section
further explored individual respondents’ experience within the informal economy.
Surveys
The purpose of the survey was to explore the scope, nature and impact of the informal economy.
specifically, the survey gathered data on identifying newcomers’ economic activities (informal self-
employment, under-the-table work, formal and perhaps precarious employment {various types: temp
agency, part time, full time, etc.} unemployed, and looking for work), measuring indicators relating to
income security, physical and mental health, process of settlement, social inclusion, among others, as
well as identifying interventions from which individuals felt they would benefit. Paper-based surveys were
administered through community researchers via face-to-face interviews from October to December 2011.
The survey design was based on probability sampling theory. The sampling unit was private households
and the sampling size target was set at 453 surveys to allow for some data stratification and disaggregation
along a number of dimensions including:• Engagement in some form of informal self-employment, under-the-table employment, formal
employment, and unemployed but looking for work. • socio-demographic variations, such as education levels or period of immigration.
a household audit was filled in by survey respondents. Family members and other household members
of the respondents were counted, to allow for a wider lens in some aspects of the analysis. In total, the audit
tracked 1,368 respondents and family/household members, their occupations and sources of income.
The estimated sample size was distributed among selected neighbourhoods of Toronto East considering
the concentration of selected communities which function as ethnic enclaves:

the wellesley institute 53
• Crescent Town (south asian communities) (48%)• Broadview Chinatown/Central Riverdale (Chinese communities) (23%)• Central Riverdale (East african communities) (13%)• Other neighbourhoods in the east end (16%)
Sampling Procedure
The sample size estimation for the survey followed an interval sampling procedure where each community
was considered as a cluster. The primary sampling unit was the household . Quantitative data were collected
by survey of sampled household (hh) respondent.
study sampling was done considering 95% confidence limit, 7% error margin and considering the
maximum possible response ratio of 50%. hence the sample size for the respective community stands at
188 for Chinese, 173 for Bangladeshis and 55 for somalis totalling 416. The additional 34 responses were
taken proportionate to the above estimated population sizes by ethnicity. so, the sample size targets stood
as follows: Chinese 203, Bangladeshis 187 and somalis 60, totalling 450. however, due to no response
or unavailability of somali respondents 20 somali sample number and additional 3 totalling 23 samples
were distributed as 12 samples for Bangladeshi and 11 samples for Chinese. Therefore, the final sample
sizes stand as follows: Chinese 214, Bangladeshis 199, and somalis 40, totalling 453.
The estimated sample size was distributed among selected neighbourhoods of Toronto East considering
the concentration of the selected community. In the selected neighbourhoods, an interval-sampling
method was used. In the first stage, all the hh number within a neighbourhood was listed (based on
statistics Canada data). In the second stage, the interval size was estimated by dividing the total number
of hh within a community by sample number. The first hh was selected randomly from the first interval
to avoid systematic bias and the consecutive hh/individual was selected using the estimated interval size.
That way, the estimated interval size for the Chinese was 22, Bangladeshi 8, and somali 2.
Questionnaire Development
a multidisciplinary research team was involved in preparing the questionnaire. The questionnaire
primarily focused on collecting information on immigration status, demography, economic engagements,
social determinants of health, and socioeconomic variables.
study themes were generated through the advisory team of partners. The research team then drafted a
questionnaire, using standardized, validated questions, where available, to improve comparability. The
draft questionnaire was presented to the advisory team for detailed comments and feedback.
The re-drafted questionnaire was pre-tested extensively in the field (non sampled area). The pre-test
was essential for finalizing the structure of the questionnaire and writing it in language appropriate for
the survey community. The pre-test findings also helped in setting appropriate codes for some of the
questions. Timing of filling out each questionnaire was recorded to determine average time to conduct
a full-length survey.
The final draft questionnaire once again went through some internal and external reviews before it
was finalized.

the wellesley institute 54
Community Researchers Selection
selection criteria for the community researchers were done based on previous experience, educational
qualifications, and network and community engagement. Qualified community researchers were recruited
from the respective community. The selected researchers went through a two-day rigorous training course
followed by field tests to acclimatize them with the survey procedures and questionnaire. Ten surveys of
each researcher were checked by the lead researcher to see if they were on the right track and provided
one-to-one feedback to the researchers for improvement.
Data Collection And Quality Control
Community researches were instructed to complete all the questionnaires on the spot and cross-check
each other’s questionnaires before finalizing.
The lead researcher reviewed all the completed questionnaires to identify any inconsistencies and
re-interviewed those identified as inconsistent. In addition to this, 5% of the questionnaires were selected
randomly and re-checked by the lead researcher, for monitoring and quality control purposes.
Handling Non-Response
It was instructed to the community researchers that if the selected household respondent declined to
participate in the interview, then the immediate next household would be selected to minimize the non-
response. There was no pattern in non-response. In some cases, the eligible respondents seemed afraid of
discussing income issues, some were unwilling to talk in absence of their partner and some were simply
non-cooperative.
Data Coding And Entry
Questionnaires from the field were collected and coded by the lead researcher. The coded questionnaires
were then sent for entry. after entry, 20% of the data was rechecked to identify any inconsistencies. Once
verified, the data was ready for analyses.
Qualitative In-Depth Interviews
Using a mixed-method approach strengthens any research by laying down multiple lines of evidence.
To complement the surveys, we conducted a small series of qualitative interviews. The set of five in-depth
interviews, allowed us to collect data specifically on the needs, barriers, and coping strategies of newcomers
who have had extensive involvement with the informal economy. after developing an interview guide, the
interviews were conducted by the research team in February 2012.The stories we heard are included in
this report as illustrative counterpoints to buttress the analysis and final recommendations.
The Informal Economy Workgroup and project partners provided guidance, insight and elaboration
for the research and its final policy recommendations. The project hired a research team to recruit and
train the researchers who carried out the survey work and to oversee the report’s dissemination. a team of
community researchers was hired and trained to administer the quantitative survey. To be able to access
immigrants who might not be comfortable responding in English, alternate survey formats and languages
were also developed and administered by the community peer researchers. The research team and a set
of volunteers input the data for data cleaning and analysis.

the wellesley institute 55
The project work also relied on a lead researcher with the methodological expertise to draft the survey
instruments, sampling method, and do the data analysis. The Research and Evaluation Coordinator
supervised day-today research activities, completed the ethics review, and led the interviews with newcomers
for the qualitative part of the project. The entire team was supported by the Toronto East Local Immigration
Partnership (LIP) staff and overseen by the Partnership Council of the LIP.
Ethics
Due to the very nature of our research subject, we knew that some respondents might feel uncomfortable
or vulnerable completing the survey. hence, the question of ethics was central to our project from the
very beginning. We built into the design of the project various protection mechanisms into each stage of
our research to protect the confidentiality and privacy of the research participants from data-gathering
to data analysis and reporting. We felt that use of researchers from the community would help lessen
any stigma respondents might feel as there would be a shared understanding of immigrant settlement
pathways. all community researchers were given training in their responsibilities as researchers within
their own communities as well as the principles for ethical conduct as outlined in the Tri-Council Policy
statement: Ethical Conduct for Research Involving humans.
Because of the vulnerability of those answering the questions, special attention was given to the ethical
duty of confidentiality. In addition, no identifying information was asked for within the surveys and
in-depth interviews. sign-in sheets for honoraria as well as consent forms were stored separately from
the completed surveys, so were not linked to participants’ answers. Those who gathered data through
surveys and interviews were different from the people who did data inputting or analysis, so linking a
specific response to a specific participant was protected. all volunteers and staff were also given extensive
training on confidentiality.
Community researchers reported that some respondents did not wish for their answers to be recorded,
although they admitted to activities defined as informal economy activity in less formal ways. If any
respondent changed their mind partway through the data collection process, these responses were not
recorded, as set out in the project’s ethical review commitments. however, as the survey questions progressed
and respondents further probed on various dimensions of their income activity, more positive responses
emerged.
Finally, the right to refuse to answer questions was an important part of the methodology and ethical
considerations of the study. We found, in the end, that of those who chose to proceed with the survey,
most respondents were willing to answer almost all the survey questions. since the right to refuse was
offered as an option, trust was built between the community researchers and survey respondents. Where
informal economy activities were investigated, the survey was structured so that while a respondent might
not directly report participation in the informal economy, they could report other activities whereby their
participation could then be inferred rather than directly reported.
Formal ethical review for this proposal was granted through the Community Research Ethics Office
CREO in september 2011.

the wellesley institute 56
Interpreting The Results
The community research team worked closely with the project supervisor and lead researcher to minimize
error and bias in all data collection methods. Recruitment strategies were developed, practiced and revised
so that the methodological rigour was maintained while, at the same time, a large enough sample of
willing respondents was recruited. The research team considered how to overcome normal reticence to
speak with a stranger on this topic, relying often on recognition of local community agencies which acted
as partners on the project and the persuasiveness and shared language of the community researchers.
survey respondents who agreed to participate were also sometimes reluctant to admit outright or during
the initial parts of the interview whether they were involved in the informal economy. Therefore, we expect
these survey results, while significant, are also under-reported and are therefore a limitation on this study.
Results were rounded so may not always add up to 100%.

the wellesley institute 57
Appendix 3: Survey Instrument
PERSONAL INFORMATION
1. how did you come to Canada?
1= Main applicant/Economic Class
2= Family Class/sponsorship
3= Refugee Claimants
4= Convention Refugee/Protected Person,
5= Visitor/Work Permit/study Permit holder
6= other ……………………..
77= Don’t know 88= Refused to answer 99= Not applicable
2. In what year did you come to Canada to settle?
.................77= Don’t know 88= Refused to answer 99= Not applicable
EDUCATION
3. What is your highest level of education?
Obtained inCanada
Obtained outside Canada
Language of education1= English 2= Not English
No high school diploma
high school diploma
have a trade certificate
attended some college
Obtained college certificate/diploma
attended some university
Obtained Bachelor’s degree
Post graduate studies
None of the above (pls specify) …
77= Don’t know 88= Refused to answer 99= Not applicable
4. how often do you use english? Please check one for each box.
home Work Community
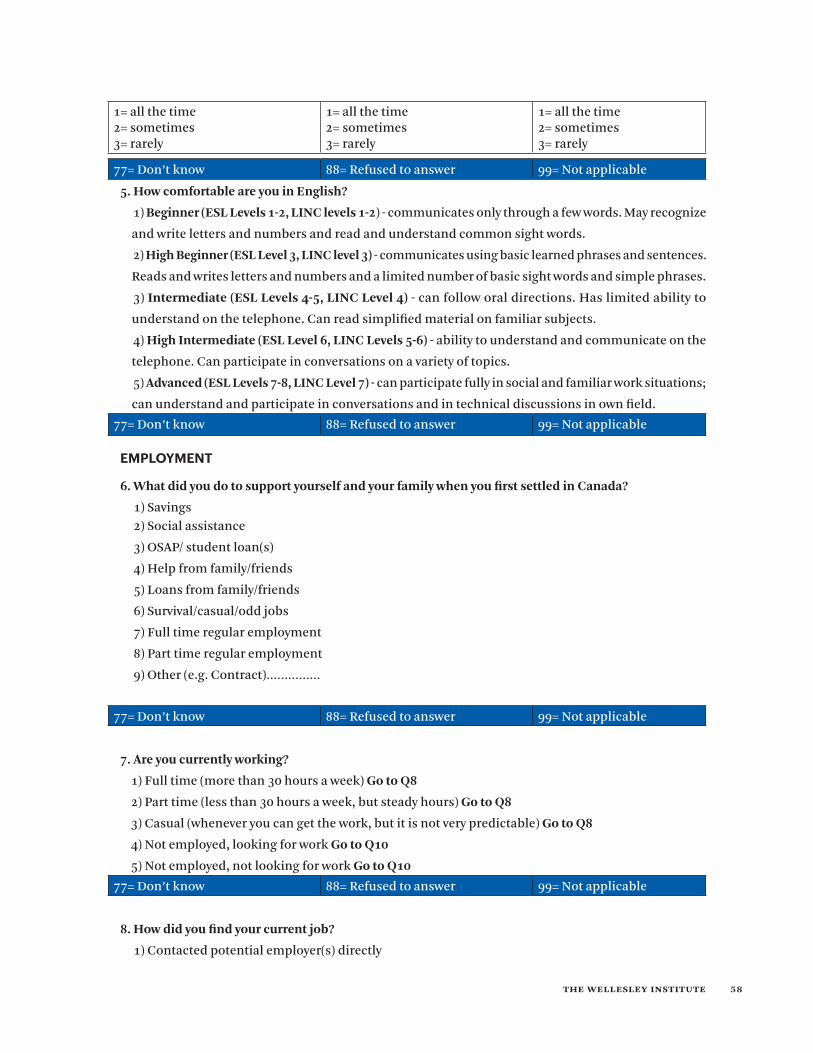
the wellesley institute 58
1= all the time2= sometimes3= rarely
1= all the time2= sometimes3= rarely
1= all the time2= sometimes3= rarely
77= Don’t know 88= Refused to answer 99= Not applicable
5. how comfortable are you in english?
1) Beginner (eSL Levels 1-2, LInC levels 1-2) - communicates only through a few words. May recognize
and write letters and numbers and read and understand common sight words.
2) high Beginner (eSL Level 3, LInC level 3) - communicates using basic learned phrases and sentences.
Reads and writes letters and numbers and a limited number of basic sight words and simple phrases.
3) Intermediate (eSL Levels 4-5, LInC Level 4) - can follow oral directions. has limited ability to
understand on the telephone. Can read simplified material on familiar subjects.
4) high Intermediate (eSL Level 6, LInC Levels 5-6) - ability to understand and communicate on the
telephone. Can participate in conversations on a variety of topics.
5) Advanced (eSL Levels 7-8, LInC Level 7) - can participate fully in social and familiar work situations;
can understand and participate in conversations and in technical discussions in own field.
77= Don’t know 88= Refused to answer 99= Not applicable
EMPLOYMENT
6. What did you do to support yourself and your family when you first settled in Canada?
1) savings 2) social assistance
3) OsaP/ student loan(s)
4) help from family/friends
5) Loans from family/friends
6) survival/casual/odd jobs
7) Full time regular employment
8) Part time regular employment
9) Other (e.g. Contract)……………
77= Don’t know 88= Refused to answer 99= Not applicable
7. Are you currently working?
1) Full time (more than 30 hours a week) go to Q8
2) Part time (less than 30 hours a week, but steady hours) go to Q8
3) Casual (whenever you can get the work, but it is not very predictable) go to Q8
4) Not employed, looking for work go to Q10
5) Not employed, not looking for work go to Q10
77= Don’t know 88= Refused to answer 99= Not applicable
8. how did you find your current job?
1) Contacted potential employer(s) directly

the wellesley institute 59
2) Through friend(s)/relative(s)
3) Through co-worker(s)
4) Placed or answered newspaper ad(s)
5) Consulted with employment services offered by community organizations
6) Consulted with temporary or private employment agency
7) Was referred by another employer
8) searched the internet
9) Was referred by a union
10) Other.......................
77= Don’t know 88= Refused to answer 99= Not applicable
9. how long did it take for you to find your current job? And first job?
Current job:………………… Go to Q11
First job: ………………….. Go to Q11
77= Don’t know 88= Refused to answer 99= Not applicable
10. how long have you been looking for work?
………………………..
77= Don’t know 88= Refused to answer 99= Not applicable
11. What was your main occupation before immigrating to Canada?
1= …………………………………. 2= ……………………………77= Don’t know 88= Refused to answer 99= Not applicable
INCOME
12. What is the total income and cash payments from the work you did over the past 12 months, before
taxes and deductions?
1) below $10, 000
2) $10,000-$29,999
3) $30,000-$49,999
4) More than $50,000
77= Don’t know 88= Refused to answer 99= Not applicable
13. What is the total household income of all household members including yourself for the past 12
months before taxes and other deductions?
Include any pensions, investment incomes, rental income, and any other governmental transfers in
your calculations.
1) below $10, 000
2) $10,000-$29,999

the wellesley institute 60
3) $30,000-$49,999
4) $50,000- $69,999
5) More than $70,000
77= Don’t know 88= Refused to answer 99= Not applicable
SOURCES OF INCOME
14. What percentage of your household income comes from the following categories?
1) Formal employment = ………………..
2) self employment = ………….
3) Other work (other than self employment) =…………………
4) Government transfer payments = ……………………….
5) OsaP/study loan ……….
6) Financial support from family/friend (i.e. back home) =
7) Other = ………………….
77= Don’t know 88= Refused to answer 99= Not applicable
15. People do different things to get by. We are interested in learning the different strategies you have
used to survive financially. all answers are confidential. have you or anyone in your household engaged
with the following self-employment activities to generate income for yourself in the last 6 months? (Do
not include anything you have done purely for recreation, as a hobby, or as a charitable act”).
1) None
2) Building/renovation/repair
3) Gardening/yard work/landscaping
4) Care giving (for elderly, disabled and others)
5) Babysitting/childcare
6) Tutoring
7) sewing
8) housekeeping/cleaning
9) health services
10) Beauty services
11) Food services/catering
12) Providing room and board/rent
13) selling handcrafts/jewellery
14) IT/technical services
15) Collecting scrap metal and recyclables
16) advice giving
17) Taxi/transportation-people or goods
18) Driving instruction
19) accessing community services with compensation (provisioning)

the wellesley institute 61
20) Other………………………………………………..
77= Don’t know 88= Refused to answer 99= Not applicable
16. Where were these activities conducted?
1= own home
2= other’s home
3= somewhere else
77= Don’t know 88= Refused to answer 99= Not applicable
17. What are the reasons for starting your own business or reasons for self employment mentioned
above? (Interviewer: do not prompt)
1) start-up cost/limited access to capital
2) high cost of commercial rent
3) Tax burden
4) Unemployment
5) Convenience
6) health & disability reasons
7) Regulations(e.g. the length of time it takes to receive necessary permits)
8) access to childcare
9) Training need for formal business
10) English language skills
11) Lack of Information
12) Lack of community networks
13) access to loans
14) access to market
15) Broad skill set
16) Other ……………
77= Don’t know 88= Refused to answer 99= Not applicable
18. have you or anyone in your household purchased any of the following services from an informal
source (paid in cash without a receipt) in the last 6 months?
1) None
2) Building/renovation/repair
3) Gardening/yard work/landscaping
4) Care giving (for elderly, disabled and others)
5) Babysitting/ childcare
6) Tutoring
7) sewing

the wellesley institute 62
8) housekeeping/cleaning
9) health services
10) Beauty services
11) Food services/catering
12) Providing room and board/rent
13) handcrafts/jewellery
14) IT/technical services
15) advice giving
16) Taxi/transportation-people or goods
17) Driving instruction
18) Other………………………………
77= Don’t know 88= Refused to answer 99= Not applicable
19. have you or anyone in your household worked for someone else or a business for cash in any of the
following activities?
1) None
2) Working in a store (e.g. cashier, sales, stocker)
3) Factory work
4) Farm work
5) Piecework at home
6) Restaurant
7) Construction
8) Tutoring center
9) hair/nail salon/spa
10) housekeeping/cleaning agency
11) Day care/ babysitting center
12) Money exchange/engineering and design shop/other small shop or business
13) Other............................................
77= Don’t know 88= Refused to answer 99= Not applicable
20. Which conditions apply to your work above?
1) Less than $10.25 per hour (less than $8.90 per hour for liquor servers)
2) On-call, irregular hours
3) Cash payment without deductions
4) Irregular pay schedule
5) Working longer than 13 hours a day
6) No vacation pay
7) No paid holidays (New Year’s Day, Family Day, Good Friday, Victoria Day, Canada Day, Civic holiday,
Labour Day, Thanksgiving Day, Christmas Day, Boxing Day)

the wellesley institute 63
8) Poor physical conditions (e.g., bad ventilation, too noisy, etc.)
9) Other...........................................
77= Don’t know 88= Refused to answer 99= Not applicable
INCOME AND MEETING HOUSEHOLD NEED/EXPENSE
21. Thinking of your household’s total monthly income, is your household able to make ends meet:
1) very easily go to Q23 2) easily go to Q23
3) with some difficulty go to next question 4) with great difficulty go to next question
77= Don’t know 88= Refused to answer 99= Not applicable
22. What do you do to make ends meet?
1= ………………… 2= ……………..3= ………………. 4= ……………….
77= Don’t know 88= Refused to answer 99= Not applicable
23. how frequently in the past month have you borrowed, traded (exchanged) or given/been given
something?
1) 0
2) 1-3 times
3) 4-6 times
4) 7-12 times
5) 13 or more
77= Don’t know 88= Refused to answer 99= Not applicable
24. Perceived household economic Status:
(1) Describe your economic status considering your last year’s expenditure?
all year debt...………………..1
Intermittently debt …………2
Neither saving nor debt ...……3
savings…………………….….4
(2) Is there any change in economic condition in last one year?
Improved……………………1
No Change…………………..2
Deteriorated…………………3
77= Don’t know 88= Refused to answer 99= Not applicable

the wellesley institute 64
WORKING ENVIRONMENT
25. how often is discrimination a barrier for you in the workplace? (That is, discrimination based on
your race, gender, disability, religion, age, sexual orientation, language, etc.)
1) all of the time
2) most of the time
3) half the time
4) some of the time
5) never
77= Don’t know 88= Refused to answer 99= Not applicable
26. If you were to raise employment rights or health and safety issues concern with your current employer(s),
would this negatively affect your future employment with them? (e.g. concerns about minimum wage,
overtime pay, length of breaks, parental leave, harassment, holiday pay, notice of layoff, etc.)
1) very likely
2) likely
3) somewhat likely
4) not likely
5) not likely at all
77= Don’t know 88= Refused to answer 99= Not applicable
27. In the last six months, how often did you feel you have experienced bullying or harassment by
supervisors, co-workers, and/or customers while at work? (e.g. aggressive behaviour, physical assault,
yelling, sexual harassment, threats, or bullying)
1) all of the time
2) most of the time
3) half of the time
4) some of the time
5)never
77= Don’t know 88= Refused to answer 99= Not applicable
28. Do you have any benefits from your paid employment (e.g. extended health, pension, eI etc.?)
1= Yes 2= Partially 3= No
77= Don’t know 88= Refused to answer 99= Not applicable
29. my job(s)/contract(s) offer me good prospects for career advancement (check one only):
1) agree strongly
2) agree
3) neither agree nor disagree
4) disagree
5) disagree strongly

the wellesley institute 65
77= Don’t know 88= Refused to answer 99= Not applicable
HEALTH
30. In general, would you say your health is:
1) excellent
2) very good
3) good
4) fair
5) poor
77= Don’t know 88= Refused to answer 99= Not applicable
31. In the last month, how often did you experience:
Difficulty Sleeping
1) Never2) Once only3) 2 to 3 times a month4) Once a week5) 2 to 3 times a week6) Daily/almost every day
Stress (pressured/tense/nervous)1) Never2) Once only3) 2 to 3 times a month4) Once a week5) 2 to 3 times a week6) Daily/almost every day
Pain (Any)
1) Never2) Once only3) 2 to 3 times a month4) Once a week5) 2 to 3 times a week6) Daily/almost every day
Depression(low energy/sad/hopeless)1) Never2) Once only3) 2 to 3 times a month4) Once a week5) 2 to 3 times a week6) Daily/almost every day
77= Don’t know 88= Refused to answer 99= Not applicable
32. Thinking about the main source of stress in your daily life what would you say is the most important
factors contributing to feelings of stress you may have?
(interviewer: Open ended, do not prompt)
1) Time pressure
2) Own physical health problem or condition
3) Own emotional or mental health problem or condition
4) Financial situation (e.g., not enough money, debt)
5) Own stressful work situation (hours of work, working conditions, discrimination at work)
6) Employment status (unemployment)
7) Caring for own family
8) Personal relationships
9) Discrimination
10) Language barrier(s)
11) Lack of adequate/affordable housing
12) adjusting to life in Canada
13) Loneliness/lack of family support
14) Other personal or family responsibilities
15) No source in particular

the wellesley institute 66
77= Don’t know 88= Refused to answer 99= Not applicable
33. During the last year, did you seek help or counseling for a non-medical, personal or emotional
problem of any kind?
1) Yes
2) No, but I thought about it
3) No
77= Don’t know 88= Refused to answer 99= Not applicable
EMPLOYMENT STANDARDS
34. Please indicate yeS or no for each of the following statements:
1= YEs 2= NO
Do you know the minimum wage is $10.25 per hour ($8.90 per hour for liquor servers) even if you work for cash?
Do you know how long your vacation would be after working 12 months?
Do you know you are entitled to benefits if you are injured while at work?
77= Don’t know 88= Refused to answer 99= Not applicable
JOB SATISFACTION
35. how satisfied are you with your current job?
1= Very satisfied
2= satisfied
3= Neither satisfied not dissatisfied
4= Dissatisfied
5=Very dissatisfied
77= Don’t know 88= Refused to answer 99= Not applicable
36. Please explain why or why not? (Interviewer: do not prompt, open ended)
1= Remuneration/payment
2= hours of work (not enough or too long)
3= Physical conditions
4= Work load/responsibilities
5= Job security
6= Relationship with co-workers/employer
7=Opportunities for advancement/promotion/development
8=Match (or not match) with specialization/training/skills
9=Location
10= Professional job

the wellesley institute 67
11=Other ………………….
77= Don’t know 88= Refused to answer 99= Not applicable
37. In your opinion what is needed to find a desired position/job?
1= Better language/communication skills
2= Professional training/skills upgrading
3= Job references from Canada
4= Networking/knowing more people in the job market
5= Elimination of discrimination
6= More professional job search support
7=Other.........................................
77= Don’t know 88= Refused to answer 99= Not applicable
SOCIAL INCLUSION
38. Community inclusiveness (Rank in scale 1 to 5, 1 as not agree to 5 strongly agree)
1) My local community is a friendly place to live.............
2) My local community is friendly to newcomers.............
3) I feel that I am part of this community..............
77= Don’t know 88= Refused to answer 99= Not applicable
39. have you provided any assistance to neighbours, friends, relatives or work colleagues in the past
month?
1) Yes
2) No
77= Don’t know 88= Refused to answer 99= Not applicable
40. have you received any personal-emotional assistance from your neighbours, friends, relatives or
work colleagues in the past month?
1) Yes
2) No
77= Don’t know 88= Refused to answer 99= Not applicable
41. have you participated in any volunteer activity in previous twelve months?
1) Yes
2) No
77= Don’t know 88= Refused to answer 99= Not applicable42. Are you a member of any clubs and societies?
1) Yes
2) No
the wellesley institute 68
77= Don’t know 88= Refused to answer 99= Not applicable
43. have you taken part in any Canadian political activity in previous twelve months?
(e.g. Signed a petition, Contacted a State mP, letter/ email to the council, Attended a council meeting,
public meeting, protest march or rally etc.)
1) Yes
2) No
77= Don’t know 88= Refused to answer 99= Not applicable
44. Are you able to use internet for browsing and communication?
1) Yes
2) No
77= Don’t know 88= Refused to answer 99= Not applicable
End the interview with thanks to the respondent

the wellesley institute 69
BaCKGROUND INFORMaTION
II: hOUsEhOLD COMPOsITION/ Economic family unit
Information of household Members Line No.
Relation-ship with the respondent
sex
1 = m
2 = F
3 = Other
age marital status
15 years age and over
education
15 years age and over
main Occupa-tion / employ-ment activity
Form of payment
childcare
If yes,
1= formal
2= informal
1 2 3 4 5 6 7 8 9
01 1= Respon-dent
02
03
04
05
06
07
Coding: Write the relevant code number in each box
Is there anyone else in the household that is not related to you? YEs NO2.Relationship with household
4. age 5. Marital status 6. Education 7. Occupation/ employment activity
8. Form of pay-ment
9. Childcare
2 = husband/wife
1= 18 and under
1 = Unmarried 1 = No high school
00=child 1=unemployed2 = self em-ployed3 = business4 = daily basis worker5= taxi driver6= vendor7= supplier8= customer service9= cashier …..10= hotel front/ waiter11= cook12= student13= other (re-spondent)14= other
In what form do you receive payment?1= Written pay records with deductions2= Written pay records without deductions 3= Cash with receipt4= Cash with-out receipt5= Other (e.g. barter/ex-change)…..
1 =Formal
3 = son/Daugh-ter
2= 19- 29 2 = Married/ Common-law
2 = high school diploma
2 = Informal
4 = Father/Mother
3= 30- 49 3 = Widow/Widower 3 = College/ University
Note: if there is any chil-dren in
selected hh then fill column 9
5 = Brother/ sister
4= 50- 64 4 = Divorced 4 = Post graduate studies
6 = Grand parents
5= 65 and over
5= separated
7 = Others...

the wellesley institute 70
Appendix 4 – Additional & Detailed Survey Findings
Demographics of Survey Respondents
The survey allowed the capture of the in-depth experience of respondents, as well as a higher-level survey
of their household members. These were used to develop a profile for comparative purposes.
Survey Respondents
Ethno-Cultural Background
In close proportion to their representation within immigrants in the local community, • 47% of respondents identified as Chinese-Canadian • 44% as Bangladeshi-Canadian
• 9% as somali-Canadian
Time Of Arrival
• 38% of respondents arrived within the last five years • 29% settled in Canada between 2002 and 2006 • 12% arrived between 1997 and 2001 • 19% arrived in 1996 or earlier (n=453 for all questions)
Immigration Status
• 33% were the Main applicant or an Economic Class immigrant. (half have post-graduate education) • 47% arrived as a Family Class immigrant, sponsored 4/5 or 81% of those sponsored are women • 12% of respondents were refugees, half of them somali
The remainder were here under other categories including Work Permit or student Visas. • 3% refused to answer • Two respondents were born in Canada but lived in families who emigrated to the country • 60% were prime working age (30-49 years old), upon arrival
Connection To East-End Toronto
Of these groups, those who identified as Chinese were most likely to live in the neighbourhood (versus
work or visit). They were also most likely to work in the community.
Those who identified as somali were most likely to be among the respondents who were visiting the
area, to see others, shop, worship, or attend programs.
Demographics Of Survey Respondents’ Households
In alignment with the survey of 453 individual respondents, a brief survey of household members and
occupations was overlaid with the more detailed survey. This allowed the research team to capture and
illuminate the findings within the main survey.

the wellesley institute 71
Information on household members included relation to respondent, sex, age, marital status, education
level, main occupation/employment activity, form of payment received, and availability of child care.• 1367 household members were captured in the survey.
Profile In Comparison With Other Residents Of East End Toronto Similar In Many Respects
The profile which emerged from survey respondents parallels their neighbours in east end of the former
City of Toronto in some aspects, but also shows some key differences, which probably emerge out of
their position as immigrants. The household audit revealed a higher number of young people than the
population in Toronto East.
sex household survey
(n=1367)
Census data To-ronto East
Male 50% 49%
Female 50% 51%
These additional household members, were split evenly by gender, a third were children (32%), with an additional 165 young adults (aged 18 - 29). The remaining household members included spouses, adult children of respondents and extended family members. Two percent of household members were senior citizens.
age survey
(n=1367)
Toronto East
18 and under 33% 21%
19-29 16% 13%
30-49 39% 36%
50-64 11% 17%
65 and over 2% 12%
Note: StatsCan age categories are different for the first two categories: 0-19, 20-29
The sample respondents were more likely to be married than the gener-al population, not unexpected given the number of family class arrivals.
Marital status survey
(n=453)
Toronto East
Unmarried 19% 40%
Married 70% 43%
Widowed 2% 6%
Divorced 6% 8%
separated 2% 4%
Over two-thirds (70%) of household members have some college or university, up to the level of postgraduate
education, with10% reporting no household member with a high school education (this does not include
children in the household).

the wellesley institute 72
Education survey
(n=453)
Toronto East
No high school Diploma 10% 15%
high school Diploma 17% 21%
Trade Certificate 2% 5%
attended some College 2% No equivalent value
College Certificate Or Diploma 9% 17%
some University 5% 9%
Bachelor’s Degree 24% 23%
Post Graduate studies 30% 11%
Additional Findings from Survey Questions
Occupation
When asked about the occupations of household members, 30% of household members are students,
7% work in customer service, 5% are self-employed, 4% work as day labourer (n=1367 for all questions.
similar levels of income and employment precarity are found in the household audit sample. Of the
1367 people captured through this snapshot, • 19% of adult household members are unemployed• 17% of adult household members report working for cash without a receipt • 30% of household members are students (although only 16% are aged 18-29) thus revealing a sizeable
portion of mature students in the population • 16% of family members relied on other forms of income, which includes student loans and bursaries• The two most common occupations reported are • Customer service representative and
• Daily basis worker
Income
In general, respondents to this survey were low income. seventy-one percent (71%) of them reported
an individual annual income less than $30,000. Recent immigrants were the most likely to have very low
incomes. Fifty-seven percent (57%) of them earned less $10,000, compared to 32% of all other immigrants.
The highest incomes were found among immigrants who had emigrated between 1997 and 2001, where
18% reported income over $50,000/year.
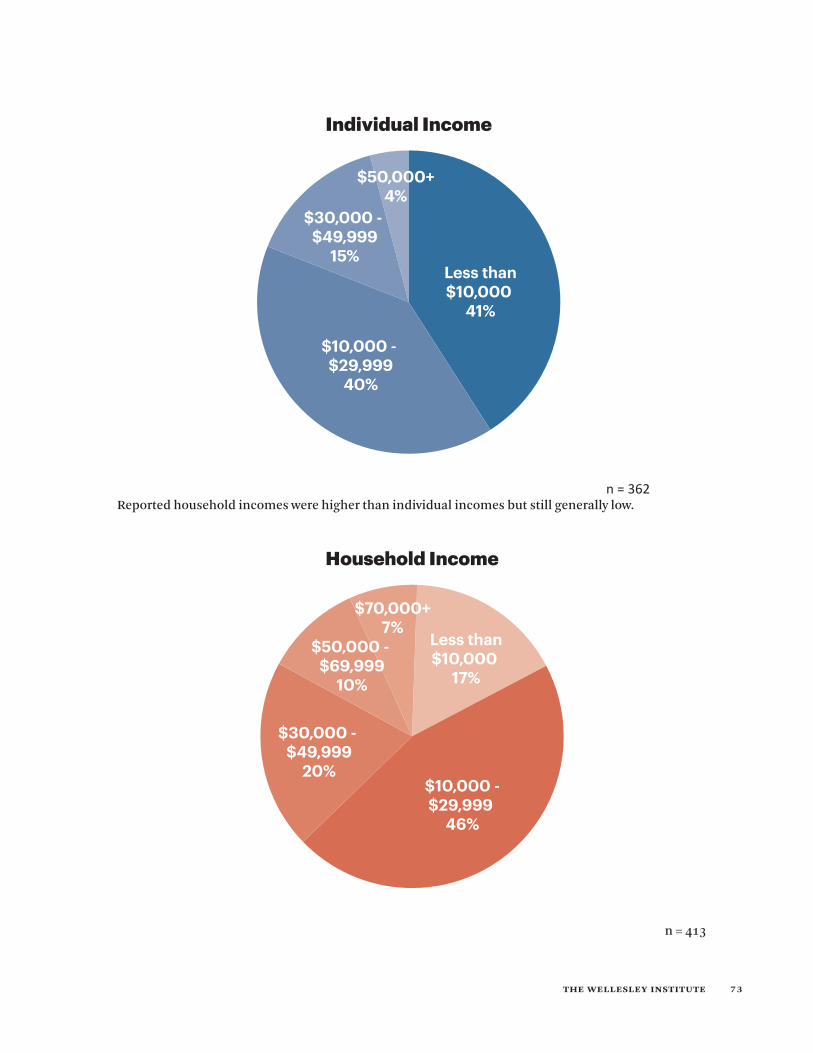
the wellesley institute 73
Individual Income
$50,000+4%
$30,000 - $49,999
15%
$10,000 - $29,999
40%
Less than$10,000
41%
Reported household incomes were higher than individual incomes but still generally low.
Household Income
$70,000+7%
$50,000 - $69,999
10%
$30,000 - $49,999
20%$10,000 -$29,999
46%
Less than$10,000
17%
n = 413
n = 362

the wellesley institute 74
More than half (63%) still report a household income below $30,000 (versus 25% in the city of Toronto).
seventeen percent (17%) earn less than $10,000 (versus 7% in the city of Toronto13). again, immigrants who
had arrived in the 1997 – 2001 period were most likely to report higher incomes. Thirty-five percent (35%)
reported over a household income over $70,000, an income pattern similar to the general population in
east-end Toronto.
Full time formal employment was strongly associated with higher household incomes. Fifty-nine (59%)
of those who reported full time employment earned over $30,000. Twelve percent (12%) reported more
than $70,000. In contrast, 81% of those who worked part time earned less than $30,000 annually as a
household. sixty-five (65%) of those who earned less than $10,000 worked part time.
The chart below also shows the difference between those who worked stable jobs (regular hours, written
pay statements with deductions) compared to those who worked irregular hours and/or in a job which
does not meet provincial employment standards.
Individual Total Income and Cash Pay-ments Over The Past 12 Months
stable Employ-ment Meeting
Provincial standards
Poor Or Precari-ous Employment
Freq Percent Freq PercentBelow $10,000 32 23% 49 40%$10,000 - $29,999 57 40% 46 38%$30,000 - $49,999 41 29% 13 11%More than $50,000 6 4% 8 7%Don’t know 1 1% 0 0%Refused to answer 5 4% 5 4%Total 142 100% 121 100%
Total household Income for the past 12 months
stable Employ-ment meeting
Provincial standards
Poor or Precari-ous Employment
Freq Percent Freq PercentBelow $10,000 9 6% 24 20%$10,000 -$29,999 47 33% 53 44%$30,000 - $49,999 36 25% 18 15%$50,000 - $69,999 22 15% 11 9%More than $ 70,000 16 11% 9 7%Don’t know 2 1% 3 2%Refused to answer 10 7% 3 2%Total 142 100% 121 100%
English Language Skills
When asked to assess their comfort in English, 36% of respondents reported their English level skills as
advanced, described as being able to participate fully in social and familiar work situations, and able to
13 City of Toronto, Release of the 2006 Census Data on Income and Shelter costs, 2008
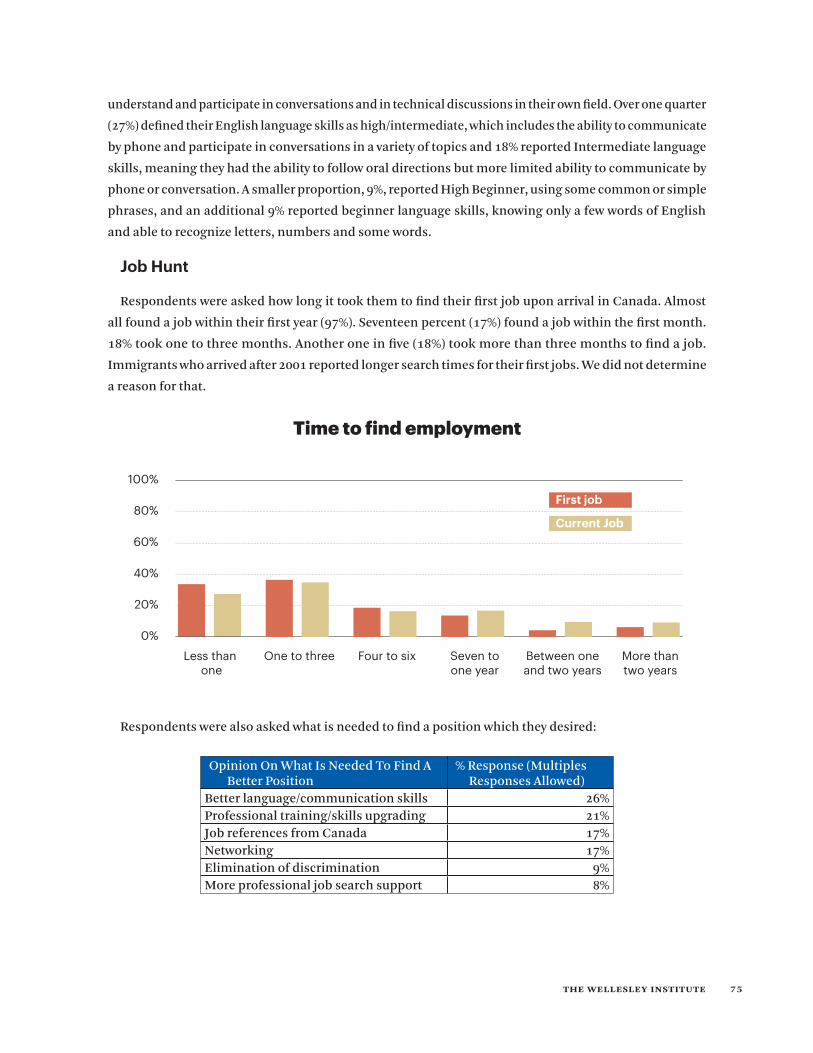
the wellesley institute 75
understand and participate in conversations and in technical discussions in their own field. Over one quarter
(27%) defined their English language skills as high/intermediate, which includes the ability to communicate
by phone and participate in conversations in a variety of topics and 18% reported Intermediate language
skills, meaning they had the ability to follow oral directions but more limited ability to communicate by
phone or conversation. a smaller proportion, 9%, reported high Beginner, using some common or simple
phrases, and an additional 9% reported beginner language skills, knowing only a few words of English
and able to recognize letters, numbers and some words.
Job Hunt
Respondents were asked how long it took them to find their first job upon arrival in Canada. almost
all found a job within their first year (97%). seventeen percent (17%) found a job within the first month.
18% took one to three months. another one in five (18%) took more than three months to find a job.
Immigrants who arrived after 2001 reported longer search times for their first jobs. We did not determine
a reason for that.
Time to find employment
100%
80%
60%
40%
20%
0%
Less than one
One to three Four to six Seven toone year
Between oneand two years
More thantwo years
First job
Current Job
Respondents were also asked what is needed to find a position which they desired:
Opinion On What Is Needed To Find a Better Position
% Response (Multiples Responses allowed)
Better language/communication skills 26%Professional training/skills upgrading 21%Job references from Canada 17%Networking 17%Elimination of discrimination 9%More professional job search support 8%

the wellesley institute 76
Job Satisfaction
5
10
15
20
25
30
35
40
45
50
Job Satisfaction (%)
Very satisfied
Recent Immigrants
All other
68
Satisfied
3033
Neither
26
42
Dissatisfied
26
16
Very dissatisfied
13
1
IMPACT OF COMPLAINT ON EMPLOYMENT PROSPECTS
Likelihood of a negative impact from rais-ing employment standards or health & safety concern
% of respondents
n=310Very likely 13.9%Likely 18.1%somewhat likely 22.9%Not likely 24.8%Not likely at all 13.9%Don’t Know 6.5%

the wellesley institute 77
SERVICES PURCHASED WITHIN THE INFORMAL ECONOMY
Rankactivity
(N=224)
Frequency of activity as part of informal economy, rounded
(%)
1 Providing room & board/rent 31%
2 Beauty services 21%
3 Food services/catering 18%
4Purchasing handicrafts/jewel-lery
15%
5 health services 14%
6 Tutoring 12%
7Taxi/transportation of people or goods
11%
8 Building/renovation/Repair 9%
9 Babysitting/childcare 8%
10 IT/technical services 7%
11 Driving instruction 6%
11 sewing 6%
12 Other miscellaneous 3%
13 housekeeping/cleaning 3%
14Gardening/yard work/land-scaping
1%
15 Care-giving (elderly, disabled) 1%
The most frequent job categories for the informal economy are in the “helping,” service, and labour jobs.
Over a third (36%) were working in jobs like childcare, tutoring, advice-giving, driving instruction and health
services, with just over a quarter (28% ) of participants involved in service jobs such as catering, beauty
services, providing room and board, or IT/Technical services. an additional quarter (24%) of participants in
the underground economy did labour jobs such as building, renovation, gardening, landscaping, factory
work, taxi/transportation or cleaning.
ENGLISH LANGUAGE PROFICIENCY
English proficiency was strongly related to whether a household earned income formally. Those with low
levels of English reported very low income; 60% of those with Beginner English earned less than $10,000
annually. None of them earned $30,000 or over. Those with high Beginner English were more likely to

the wellesley institute 78
earn more, but were also not earning more than $30,000. Of the respondents who had high level English,
only those who held formal employment earned an income above $50,000
HEALTH AND STRESS
survey respondents were also asked about specific aspects of their health which could give some insight
into the effect of their current living situations.
In the last month, experienced(n = 436)
Difficulty sleeping (%)
stress (%) Pain (any) (%) Depression(%)
Daily/almost every day 7.7 15.6 8.9 7.1
2 to 3 times a week 11 12 8.9 4.5
Once a week 6.4 8.2 6.7 4.2
2 to 3 times in month 23.6 28.3 21.8 16.5
Once only 9.3 13.6 12 14.9
Never 39.7 21.2 39.6 49.9
Don’t know 0.4 0.4 0.7 1.3
Refuse to answer 1.1 0.4 0.9 1.3
SELF EMPLOYMENT
Respondents were asked to describe what methods they used to cope financially, 22% reported some
part of their household income was from self-employment. Respondents reported a range of activities
undertaken by household members to earn some income in the previous six months. (Two percent refused
to answer this question.)
Room and board, beauty and food services were some of the most frequent areas of self-employment.
Unemployment and convenience were cited as the most popular reasons for self-employment. In order of
frequency, these self-employment activities included:
Offered Services
Rank activity Percentage n=154
1 Babysitting/childcare 23
2 Food services/catering 22
3 Taxi/transportation of people or goods 14
4 housekeeping/cleaning 11
5 Providing room & board/rent 11
6 sewing 10
7 Tutoring 10
Respondents were also asked the location of these income-earning activities. They were divided fairly
evenly among residents’ own homes (34.6%), somewhere else (33%), or another person’s home (28.5%).

the wellesley institute 79
Total Income earned from Informal Economy
2%
16%
40%
42%
Below $10,000
$10,000 - $29,999
$30,000 - $49,999
$50,000 +
Most of the personal incomes earned from activities in the informal economy are low, 42% of respondents
who earn some income this way report less than $10,000 annually, 40% report wages of at least $10,000
up to $29,999, 18% earned between $30,000 - $49,000. Only 2% earn reported annual earnings more than
$50,000 (those who earned at this level reported the income from renting a room out, tutoring, driving
a taxi, or work in a retail business). Those who were engaged in small business activities, such as money
exchange or boutique business, were the most likely to earn under $10,000/annually.
Miriam explains price range changes according to the activity. For example, the compensation for tutoring is $20 an hour, babysitting is $12 to $15 an hour. Restaurants, in general, hire newcomers and pay the least amount of money, around $6 an hour.
In looking beyond individuals to household incomes, half of households reporting informal economic
activities reported a household income in the $10,000- 29,999 range. an additional 15% report a household
income of less than $10,000/year. The incomes of these households are marginal, well below average
household incomes of $80,34314 and the median household income was $52,833 (City of Toronto, 2008).
These findings support the earlier findings by Bangladeshi-Canadian Community services which found
that entrepreneurial activities only supplemented family incomes.
Respondents were also asked about their participation in the informal economy through the purchase of
services. 68% reported some participation. The activities that people engaged in as customers or consumers
14 Within the east end neighbourhoods surveyed, the average household income is $65,508. (Toronto East Local Immigration Partnership calcula-tion using census data from the Community Data program of the Canadian Council on Social Development. 2009).
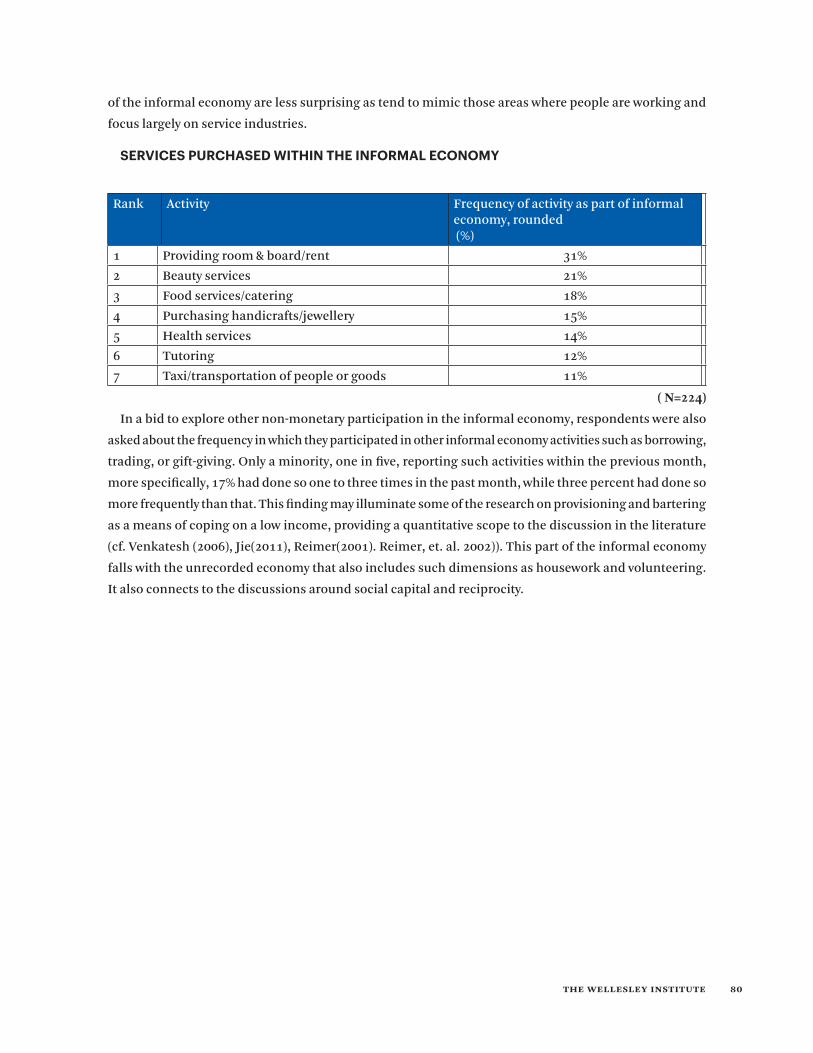
the wellesley institute 80
of the informal economy are less surprising as tend to mimic those areas where people are working and
focus largely on service industries.
SERVICES PURCHASED WITHIN THE INFORMAL ECONOMY
Rank activity Frequency of activity as part of informal economy, rounded (%)
1 Providing room & board/rent 31%
2 Beauty services 21%
3 Food services/catering 18%
4 Purchasing handicrafts/jewellery 15%
5 health services 14%
6 Tutoring 12%
7 Taxi/transportation of people or goods 11%
( n=224)
In a bid to explore other non-monetary participation in the informal economy, respondents were also
asked about the frequency in which they participated in other informal economy activities such as borrowing,
trading, or gift-giving. Only a minority, one in five, reporting such activities within the previous month,
more specifically, 17% had done so one to three times in the past month, while three percent had done so
more frequently than that. This finding may illuminate some of the research on provisioning and bartering
as a means of coping on a low income, providing a quantitative scope to the discussion in the literature
(cf. Venkatesh (2006), Jie(2011), Reimer(2001). Reimer, et. al. 2002)). This part of the informal economy
falls with the unrecorded economy that also includes such dimensions as housework and volunteering.
It also connects to the discussions around social capital and reciprocity.

the wellesley institute 81
Community Profiles
Portrait of a Community: Bangladeshi Respondents
Over half of the Bangladeshi respondents (56%) had arrived in Canada within the last five years, 41%
arrived as an economic class main applicant, 49% arrived as a family class member, sponsored by another
(N=199).
The Bangladeshi community reported the highest level education levels. This mirrors the patterns shown
by Toronto Immigrant Employment Data Initiative researchers who have tracked the source countries
of PhDs. In the 1990s, Bangladesh ranked tenth. By 2005, they were fourth, ahead of the U.s.a., France,
Russia and Korea.
While Bangladeshi respondents had very high levels of education, 88% obtained their highest level of
education outside Canada. a substantial number (45.7%) did their studies in the English language.
The Bangladeshi population reported the highest education levels, 95% has done or completed some
college or university, 88% had completed postgraduate studies.
Eighty-eight percent (88%) of Bangladeshi respondents obtained their highest degree outside the country
(46% in the English language).
In terms of labour force participation, 28% of Bangladeshi respondents work full time, 17% work part
time, 7% work casual, 18% are looking for work. Family and Friends was a major job referral source for
Bangladeshi respondents (22%), however they were more likely than other respondents also to contact
potential employers directly (13%).
The Bangladeshi respondents reported the longest wait times to find their current employment, with 7%
waiting over three years for their first or current job. This is not unexpected as other research has shown
that obtaining professional level positions take substantially longer.
sixteen percent (16%) of Bangladeshi respondents worked in customer service. In the household survey,
the most common occupations reported by Bangladeshi respondents were full time student (aged 15+),
customer service and self-employed . The household survey also revealed the highest unemployment rate
and the highest number of children.
Fifty-two percent (52%) of Bangladeshi respondents were paid with a written pay record and statutory
deductions, 15% of respondents who were working were paid simply in cash, 27% indicated other forms
of payment which might include student loans, self-employment or bartering.
Eighty-three percent (83%) of Bangladeshi respondents reported working in English all the time, 14%
used English some of the time, and 3% rarely use English at work. Perhaps because of their facility in the
language, Bangladeshi respondents were the most likely to have a student loan as one of their sources of
household income, 73% of those with student loans were Bangladeshi.
Bangladeshi respondents were as likely as other survey respondents to know minimum wage laws (85%
knew), but were far less likely to know about vacation standards (31% knew) and somewhat less likely to
know about workers’ compensation benefits (63% knew).
When asked to identify the main source of the stress they felt, Bangladeshi respondents were most
likely to identify Financial situation, Employment status and Time Pressure. Further behind but still a

the wellesley institute 82
substantial portion of stress were Loneliness/Lack of Family support, Caring for own Family, and Lack of
adequate/affordable housing. In comparison to other respondents, Bangladeshi respondents were also
more likely to identify adjusting to Life in Canada.
In terms of community connections, Bangladeshi showed high levels of interaction: 87% reported
providing assistance to someone and 84% reported having received help in the previous month. almost
half (48%) reported having done volunteer work during the previous year. Bangladeshi respondents also
showed high participation in clubs and societies, with more than half (56%) reporting membership in
such groups. Just over one quarter (29%) also reported taking part in Canadian political activities within
the past year.
Portrait of a Community: Chinese-language Respondents
although drawn mainly from the central Riverdale area, Chinese respondents were least likely to live
within a narrow geographic community. Given their longer settlement histories, this was not surprising.
84% of survey respondents live within the area.
The Chinese-language survey respondents (N=214) had the widest dispersion in response to the question
of the year of their arrival in Canada. Their wider and more stable social networks were apparent, as a
result. a high number (30%) reported obtaining their current job through friends and relatives. They
were also more likely to have used a formal job search strategy (newspaper ads, internet searches) to have
obtained their current job and to have spent the least amount of time searching for a job (7.9% less than
one month, 18.2% between one to three months).
Twenty-nine of survey respondents came as economic class main applicants, and 50% came as family
class members,12% came as refugees, 6% were other (including international student, work permit, etc.).
Fifty-two percent (52%) of Chinese respondents reported some postsecondary education; 80% of the
Chinese respondents obtained their highest degree outside the country (23% in English).
In terms of labour force participation, 40% of Chinese respondents work full time, 11% work part time,
13% work casual, 14% are looking for work. The Chinese community respondents reported the highest levels
of casual work among all respondents. Common occupations reported by Chinese language respondents
were full time student (aged 15+), daily basis worker, customer service, and self-employed, 46% of Chinese
reported working in English all the time, 33% used English some of the time, and 21% rarely use English at
work. Chinese language respondents were also the most likely to report Beginner/high Beginner language
skills (32% of respondents).
Chinese households were least likely to use the English language in their home, with only 3.7% reporting
using it all the time, 21% reporting using it sometimes, and 75.2% using it rarely. This reflected their
use of English at work and in the community. While those who reported a high comfort level in English
(47%), Chinese respondents also showed a similar number (31.7%) who reported their English skills at
the Beginner/high Beginner level.
The Chinese survey respondents reported the widest range of education. They were also the least likely
to have done their studies in the English language, and rated their comfort with English.
The Chinese population showed the highest levels of employment, perhaps because more of them
had been settled in Canada for longer time or because their larger numbers created work opportunities

the wellesley institute 83
within an ethnic enclave where English is only sometimes (32%) or rarely (21%) used. Chinese respondents
reported the highest levels of full time employment (40.2% versus Bangladeshi 28.1%, somali, 32.5%) and
were most likely to report all of their household income came from formal employment (78% versus 41%
Bangladeshi and 65% somali). Chinese respondents were the most likely to report working for another
in the informal economy (29% of those working informally) Chinese respondents were twice as likely as
other respondents to be working on a casual basis (11.2% versus 7% Bangladeshi or 5% somali), 9 % of
the Chinese respondents reported working as a daily basis labourer (higher than the other respondents).
Chinese respondents were also very likely to report being paid in form with a written record (64%).
sixty-four percent (64%) of Chinese-language respondents were paid with a written pay record and
statutory deductions, 17% of respondents who were working were paid simply in cash, 11% indicated
other forms of payment which might include bartering.
10
20
30
40
50
60
70
80
90
100
Use of English in the Community
Perc
enta
ge o
f res
pond
ents
10.1
All the time
Bangali
Chinese
Somali
15.4
70
Sometimes
50.9
27.5
Rarely
33.630.2
2.5
59.8
Chinese respondents showed a similar level of knowledge about provincial labour standards, compared
to other survey respondents. Eighty-four percent (84%) knew about minimum wage, 64% knew about
vacation pay, and 66% knew about compensation for injuries on the job.
When asked to identify the main sources of their stress in their lives, Chinese respondents were most
likely to select Financial Situation and Language barriers. In comparison to other respondents, Chinese
respondents were more likely to select Own Emotional or Mental Health Problems, Personal Relationships, and Own Stressful Work Situation.
The majority of Chinese respondents showed active connections to their community: 63% reported
providing assistance to someone in the previous month, 65% reported having received help during that
time period, and about a quarter (26%) reported having done volunteer work in the previous year. about
one in five (18%) reported being a member of a club or society. a slightly lower number (14%) of Chinese

the wellesley institute 84
respondents reported having taken part in a Canadian-focused political activity within the previous year.
This was only half the participation level of the other two respondent communities who both reported
more comfort with English language communication.
10
20
30
40
50
60
70
Highest Level of Education Completed
Perc
enta
ge o
f res
pond
ents
1
No High School
Bangali
Chinese
Somali
16.820
High School
34.6 35
College
41.1
32.2
Post Graduate
7.5
61.3
5
32.5
5
Portrait of a Community: Somali respondents
according to the ground-breaking Ornstein report in 2000, the somali population is one of the most
economically disadvantaged ethnic populations in the city of Toronto. Egeh (2011) reports average
employment income is $17, 969.
although small, the East african community brings a different settlement history to east Toronto.
(Within Toronto, the 2006 census reported a population of 12, 770.) Within the city limits, large numbers
of somalis have settled in the west end, however in the east end, they have taken up residents in central
Riverdale and established businesses along the Danforth. The Ethiopian association of Greater Toronto
is also located further east, at Danforth and Woodbine. The community also keeps connections with other
somalis in Regent Park and the Teasdale neighbourhoods.
Faith traditions are supported at nearby mosques in the community.
The community’s settlement history follows a different pathway than their east-end neighbours from
China or from Bangladesh. Reflecting the instability and civil war in their home countries, more than
half (52.5%) of the new arrivals are refugee claimants. Others, often more highly educated, have come
as Economic Class applicants (12.5%) or sponsored through the Family Class provisions (17.5%). (an
additional 17.5% refused to answer.) (N=40)
The somali population, and respondents as represented in the survey, tends to be younger. (statistics
Canada does not report somali as an ethnic category in its public files, so more in-depth comparisons
were not available.)
Because of this different settlement pathway, as refugees from a war-torn area and arrival in the country
at younger ages, the local somali community also showed dramatically different educational backgrounds.
Fifty-five percent (55%) has a high school diploma or less, while 7.5% had completed university at the
undergraduate or graduate level. Forty-one percent (41%) of somali respondents have post-secondary
the wellesley institute 85
education. (In contrast, showing the important impacts of different arrival histories, the Bangladeshi
respondents mainly arrived as Economic Class. Of them, 5% of survey respondents had a high school
diploma or less, and 59% reported graduate education.) The somali immigrants were also more likely to
have obtained their highest level of education in Canada (72.5%) whereas the other immigrants groups were
more likely to have obtained their highest level of education abroad (Bangladeshi 87.9%, Chinese 80.4%).
In terms of labour force participation, 33% of somali respondents work full time, 15% work part time, 5%
work casual, 13% are looking for work. somali respondents were the most likely to look for work through
their social networks. 33% found their current job through friends or family.
seventy-nine percent (79%) of somali reported working in English all the time, 14% used English some
of the time, and 7% use English rarely at work.
sixty-eight percent (68%) of somali respondents were paid with a written pay record and statutory
deductions, while 27% of respondents who were working were paid simply in cash.
Out of the 40 somali respondents, three (7.5%) reported their occupation as taxi driver. This was slightly
higher a percentage than in the larger household survey where 5.5% of respondents were taxi-drivers,
making up more than half of those reporting taxi driving as their occupation, six times as likely as the
other two ethnic groups to be taxi drivers. Egeh (personal communication, 2012) speculates that this is
because power of social networks and the attraction of being self-employed. a similar proportion was
reported in the household survey (5.2%). Four (10%) worked in customer service, and four (10%) were
in business. The largest number (25%), probably reflecting the youth of the respondents, were students
[children excluded]. (household showed 35.6%.)
The majority of somali respondents knew about their rights under Ontario labour legislation: 80% knew
the minimum wage levels, 72% knew their entitlement to two weeks’ annual vacation/vacation pay, and
80% knew about their right to compensation should a workplace injury occur.
somali respondents showed the low levels of community connection. One-third (32%) reported having
provided assistance to a friend or neighbour in the previous month. Only one-in-eight (12%) reported
having received personal or emotional assistance over that time period. One in five (21%) said they had
participated in a volunteer activity over the previous twelve months. a larger number, one in five (18%)
reported membership in a club or society.
sixty-three (63%) of respondents live in the area, while 37% were visiting the area.

the wellesley institute 86
Appendix 5: The Lore Of Underground Economies
The idea of informal economic activities is ill-defined and subject to speculation and moral chest-
thumping. even the naming of it as underground carries a moral tone. We address some of these common
conceptions, true and untrue.
Underground Economies As An Area Of Mounting Attention
The topic of the underground economy explodes onto news headlines when critical incidents such as
the Christmas Eve construction accident exposed the use of untrained and unlicensed workers, vulnerable
and working outside legislative protections. Occasionally, the topic emerges from a government report,
such as the Ministry of Labour’s investigation into this incident. More recently, the Ontario 2012 Budget
highlighted enforcement measures the provincial government is actively pursuing. similarly, although
outside of the main thrust of a report focused on cost containment and efficiencies, the Drummond
Report identified an area of revenue generation which could raise $500 annual for the Ontario provincial
government. Its pervasiveness and concentration, especially within specific sectors and among some
vulnerable workers, has been the focus of other government ministries (Finance, Labour). The recent
report from the auditor for the City of Toronto also focused on some of these issues, highlighting that
those in receipt of social assistance may be earning an income through their business license with the
City, and yet the City did not track these activities. (as auditors will in flagging a problem, although he
found less than a handful, he flagged this as an issue for potential abuse.)
Because of its shadowy nature, much of what is known about the underground economy is speculative
and uncertain. here is some of the common lore, both true and not:.
The Underground Economy Is Pervasive
The informal economy encompasses a wide spectrum of activities outside the formal economic activities
of the nation. They range from paying the local teenager for baby-sitting or sidewalk snow-shovelling, to
building back deck through barter, to paying cash for a plumber’s off hour visit, to the most egregious
criminal activities. Because of the breadth of activities, which involve the exchange of items or services for
those of approximately equal value, outside the tax and regulatory structure, the underground economy
is pervasive. The Organization for Economic Cooperation and Development (OECD) estimates that half
of the world’s workers were in jobs that were not regulated or registered, are outside the tax system and
involve cash payment. Researchers have identified this alternately as a shadow economy or as “system
D.” Foreign Policy magazine contributor and author Neuwirth says that, were these activities captured
within one country, it would the second largest economy in the world15. While shadow Econonmies found
these activities were pervasive, we were not able to determine how they compare to the informal economic
activities of Canadian-born citizens or to other immigrant communities. What we have shown, though,
is some of the main drivers for it, such as poverty and barriers to labour market entry.
15 http://www.foreignpolicy.com/articles/2011/10/28/black_market_global_economy

the wellesley institute 87
The Underground Economy Denies Legitimate Tax Revenue To The Government
Tax savings are easily one of the biggest drivers for the underground economy. When the harmonized
sales Tax is not charged, the payee saves automatically and the payor saves the paper work. This same tax
avoidance dynamic has been identified as some of the cause of the current European debt crisis.
Our research found that tax avoidance is a minor reason for people’s participation in the underground
economy. supplementing meagre household incomes was a much larger reason for new immigrants
participation.
The Underground Economy Occurs Because Of Scammers
The underground economy has been blamed on those of poor character, abusing the system. We found
such widespread participation that it may more accurately be viewed as part of a spectrum of economic
activities. Where there was outright flouting of tax laws, more often we found abuses reported around
employer/employee relations. Our case studies found the same, with abuse being more concentrated
among small business owners rather than the individuals.
The Underground Economy Is Risky
Because these activities involve the exchange of value outside the normal protections of the law, those
involved are assuming more risk. Those engaged in informal economic activities lose the protections of
consumer law, employment standards, workers’ compensation, environmental regulations, building
codes and/or other legislative buffers. Our research found, many people are willing to take that chance.
Occasionally, they also do so unwillingly or unknowingly. Only a few would choose this as a regular or
on-going activity should there be another recourse.
The Underground Economy Is A Result Of Ingenuity, Self-Reliance, Or Sometimes, Desperation
The informal economy, sometimes referred to as “system D,” is seen as a creative response to hard
circumstances, one in which people have had to rely upon their own resourcefulness when denied access
to the formal labour market. In his book arrival City, Globe & Mail reported Doug saunders describes
the insular economies which emerge within urban communities where new arrivals struggle to make an
income. Where local authorities have hemmed in the options open to these new migrants, an underground
economy often emerges.
This also touches on whether people choose to undertake these informal activities. Our research found
that most, especially those working for others, would choose to participate in the formal economy if they
could.

the wellesley institute 88
Appendix 6: Impressions From Community Researchers
some selected quotes:
Because of the sensitive nature of the questions in the questionnaire, many people are very cautious
to participate, even though I told them that I would neither ask for their names nor their phone
numbers.
I still remember one lady who told me her husband was paid in “cash without receipt”. she regretted
immediately and demanded that I change the answer. I promised her that we had nothing to do
with Revenue Canada or the government in general, she still asked for my phone number and
said she’d hold me accountable, should anything bad happen to her.
Before I started the work in this project, I once thought that I had the clear picture in mind regarding
newcomer’s employment, well-being and other matters in the Chinese community. In fact, it is a
kind of different compares with the groups I know. I have developed better understanding about
informal employment that newcomers might become involved in. No matter where did they come
from, they are facing common issues in the new country. They are struggling at learning a new
language, learning how to integrate within local cultures and how to adapt family or personal
ways into a new environment.
During my conducting surveys, I found the participants are roughly divided into two groups. One
group of participants is well educated either in Canada or the previous country. They found relative
stable jobs after 3-5 years’ struggle. They would like to take a part in our survey and shared their
true stories with us. another group of participants is reluctant or scared to communicate with
us. some of them quickly refused to participate in the survey while I was introducing to them.
some of them agreed to do the survey. But when we came across the sensitive questions, I could
feel that they didn’t tell their true stories. They never gave their phone numbers. That is those
participants whom were involving in the informal economy activities deeply. Most of them were
living and working in Broadview Chinatown and Central Riverdale. They found jobs in a short
period of time with help of their friends. Most of them were hour or piece-basis employees. They
were paid in cash without receipt. They often experienced bullying or harassment by supervisors
or workers, not to say the benefit from their employment.

the wellesley institute 89