Embed Size (px)
Citation preview
lapopsurveys.orgSíganos en
AmericasBarometer Brief: Venezuela 2016/17Extreme Conditions Open Troubling Fault Lines in Democratic Public Opinion in an Unstable System
Dr. Mariana Rodríguez, LAPOP Program Coordinator and Venezuela Study Coordinator
Dr. Elizabeth J. Zechmeister, LAPOP Director and Cornelius Vanderbilt Professor of Political Science
May 2017

AmericasBarometer Brief: Venezuela 2016/17Extreme Conditions Open Troubling Fault Lines in Democratic Public Opinion in an Unstable System
Presentation Structure:
Background on LAPOP’s AmericasBarometer and the Venezuela survey
Part I: Wide-ranging economic, security, and political grievances
Part II. Instability, flagging system support, and (un)democratic opinion

• Each point estimate (mean or percentage) is based on a 95% confidence interval, expressed in terms of a range surrounding that point. These estimations take into account the stratified and clustered sample design.
• When two estimated points have confidence intervals that overlap to a large degree, the difference between the two values is typically not statistically significant.
• It should be noted that the results presented and analyzed in this report are based on a preliminary version of the data set for the 2016/17 Venezuela survey.
Understanding the Figures
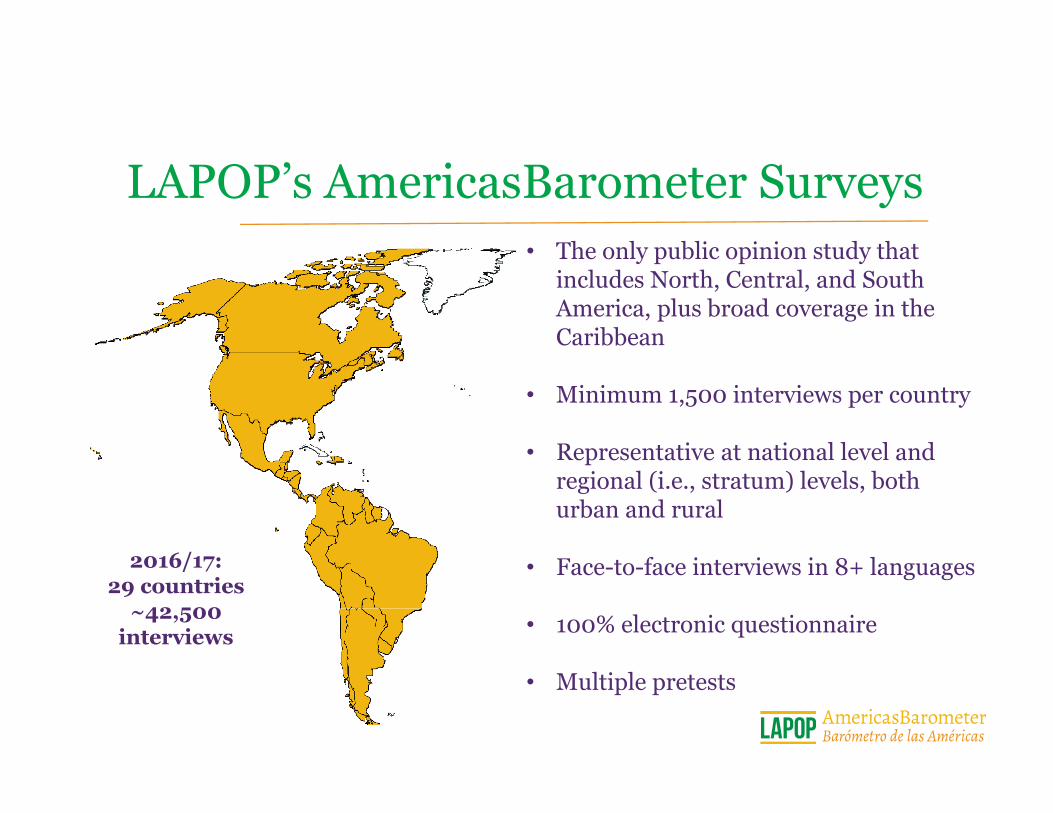
• The only public opinion study that includes North, Central, and South America, plus broad coverage in the Caribbean
• Minimum 1,500 interviews per country
• Representative at national level and regional (i.e., stratum) levels, both urban and rural
• Face-to-face interviews in 8+ languages
• 100% electronic questionnaire
• Multiple pretests
LAPOP’s AmericasBarometer Surveys
2016/17:29 countries
~42,500 interviews
Our Partners
• State failings led to delays and substitutions – e.g., cash crisis in Dec/Jan meant the team could not cover transportation costs; diphtheria outbreak in a region that was then sealed off meant a work area was substituted
• Despite significant security precautions, robberies and one assault occurred during the course of fieldwork
• Some originally drawn areas had to be substituted due to security concerns
• Extremely high levels of insecurity brought about unprecedented challengeswith respect to data quality…, however, fortunately:
• LAPOP’s FALCON © system effectively identified enumerators who rushed surveys and enumerators who falsified interviews, and these problems were corrected in real time
Challenges to Fieldwork in Venezuela
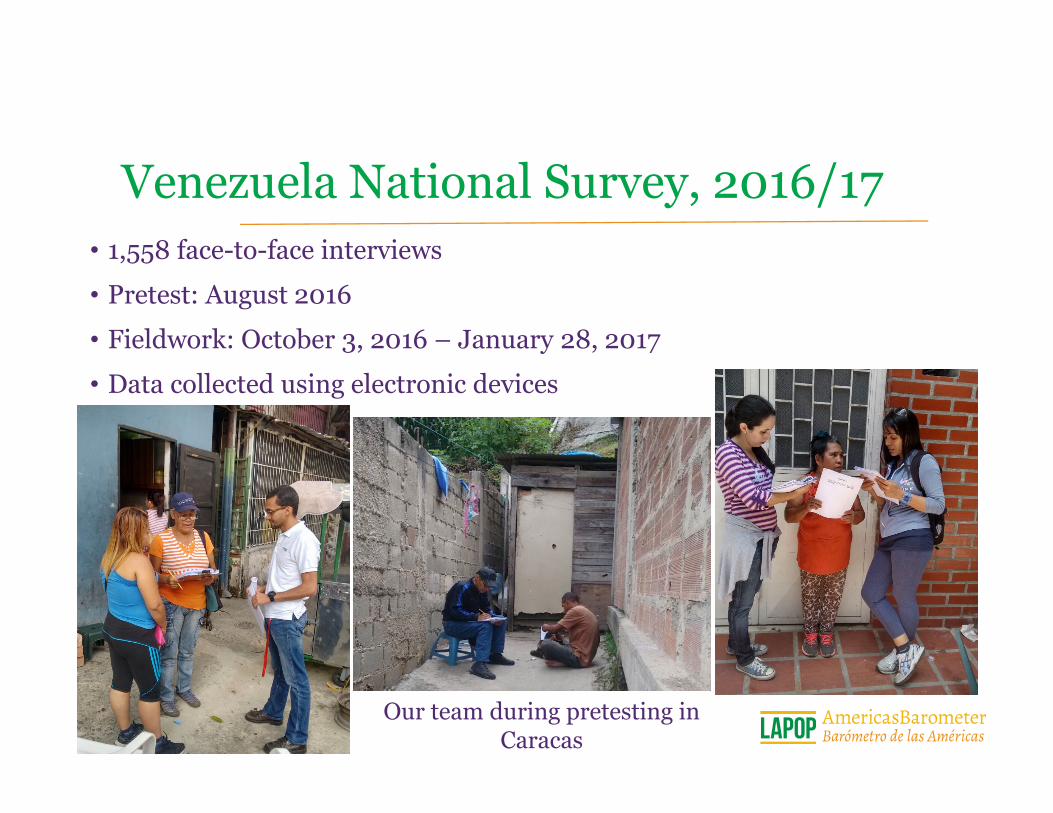
• 1,558 face-to-face interviews
• Pretest: August 2016
• Fieldwork: October 3, 2016 – January 28, 2017
• Data collected using electronic devices
Venezuela National Survey, 2016/17
Our team during pretesting in Caracas
Part I. Wide-Ranging Economic, Security, and Political Grievances in 2016/17
IA. Economy: Acute Concerns Reflect the Worrisome Realities Venezuelans Face in 2016/17
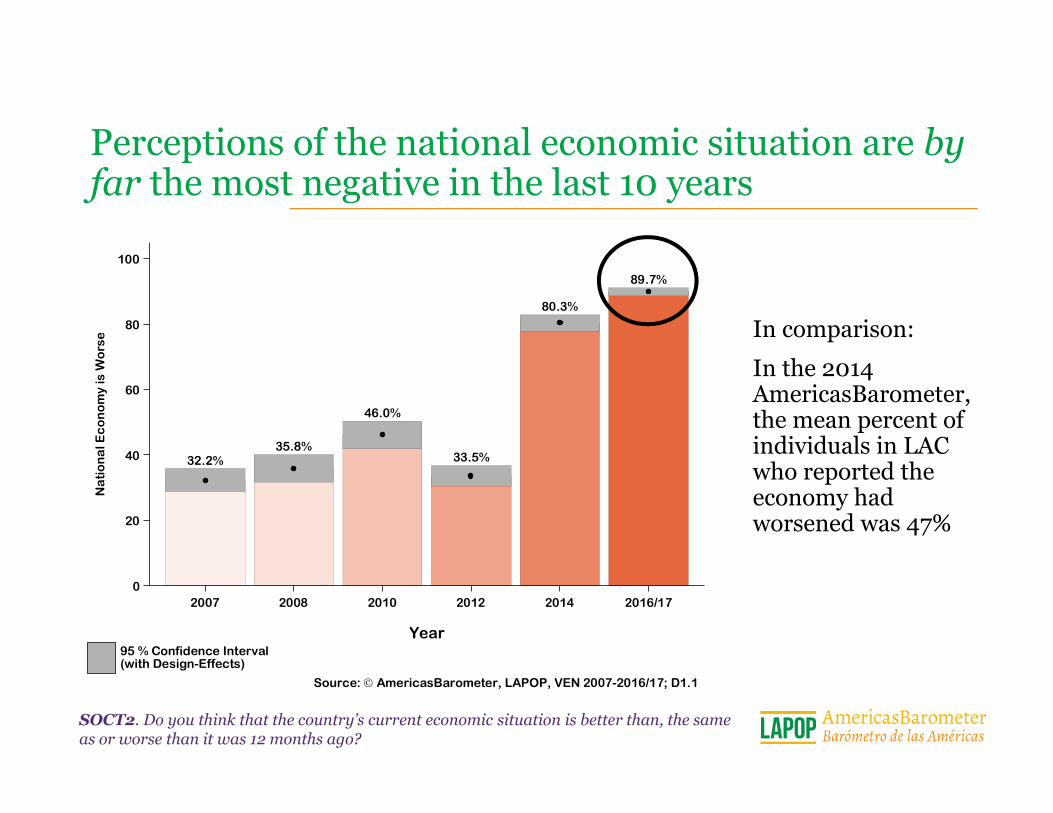
Perceptions of the national economic situation are by far the most negative in the last 10 years
SOCT2. Do you think that the country’s current economic situation is better than, the same as or worse than it was 12 months ago?
32.2%35.8%
46.0%
33.5%
80.3%
89.7%
0
20
40
60
80
100
Na
tio
na
l Ec
on
om
y is
Wo
rse
2007 2008 2010 2012 2014 2016/17
Year 95 % Confidence Interval (with Design-Effects)
Source: AmericasBarometer, LAPOP, VEN 2007-2016/17; D1.1
In comparison:
In the 2014 AmericasBarometer, the mean percent of individuals in LAC who reported the economy had worsened was 47%

Perceptions of personal economic situations are by far the most negative in the last 10 years
IDIO2. Do you think that your economic situation is better than, the same as, or worse than it was 12 months ago?
26.5% 24.1%
30.2%
21.9%
63.2%
77.9%
0
20
40
60
80
Pe
rso
na
l Ec
on
om
y is
Wo
rse
2007 2008 2010 2012 2014 2016/17
Year 95 % Confidence Interval (with Design-Effects)
Source: AmericasBarometer, LAPOP, VEN 2007-2016/17; D1.1
In comparison:
In the 2014 AmericasBarometer, the mean percent of individuals in LAC who reported their economy had worsened was 35%
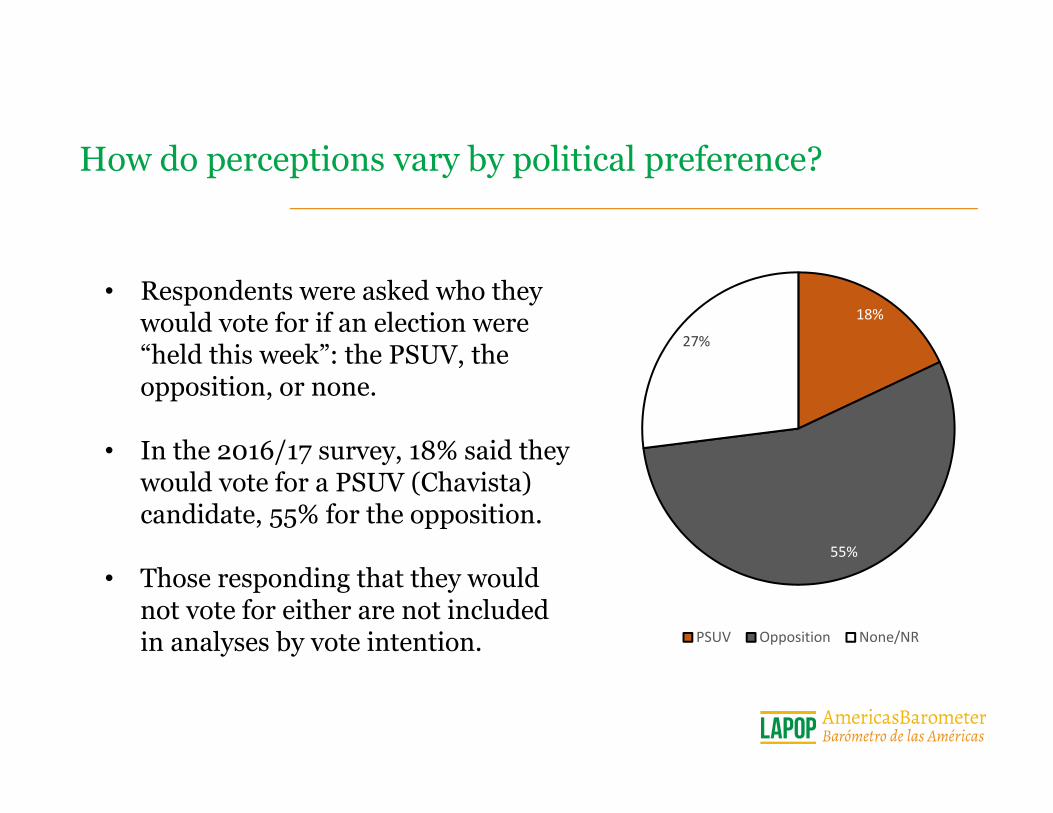
How do perceptions vary by political preference?
• Respondents were asked who they would vote for if an election were “held this week”: the PSUV, the opposition, or none.
• In the 2016/17 survey, 18% said they would vote for a PSUV (Chavista) candidate, 55% for the opposition.
• Those responding that they would not vote for either are not included in analyses by vote intention.
18%
55%
27%
PSUV Opposition None/NR
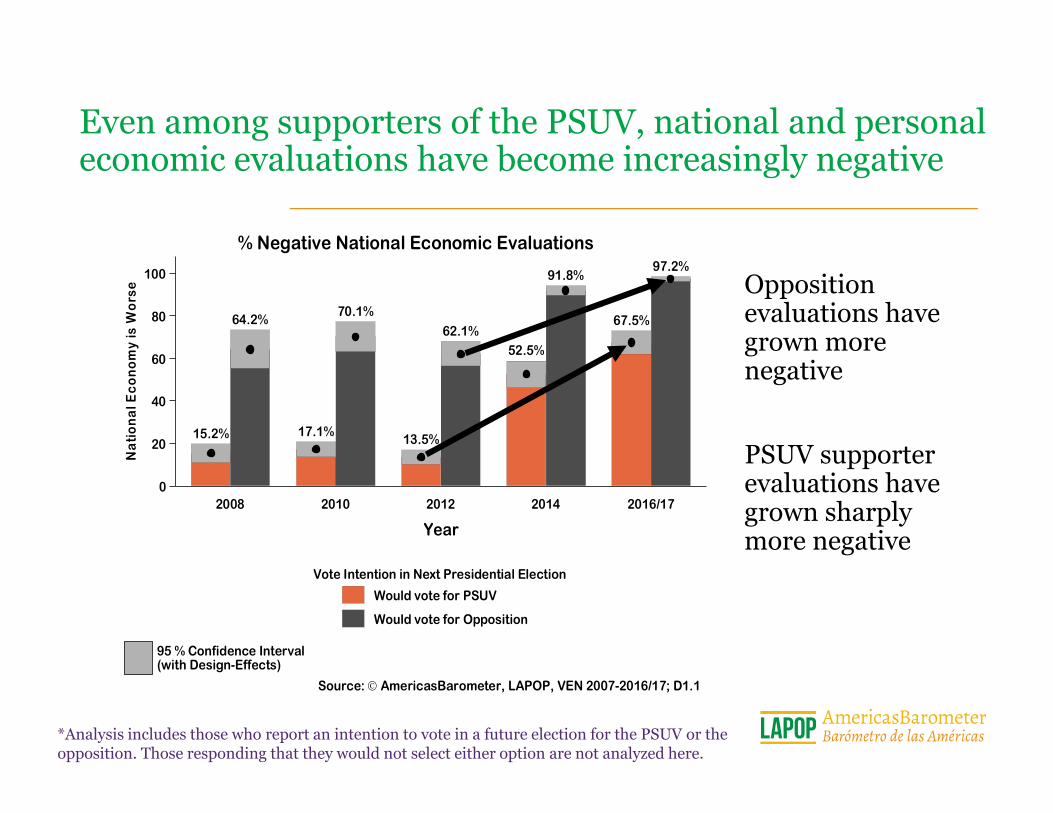
15.2% 17.1% 13.5%
52.5%
67.5%64.2%70.1%
62.1%
91.8%97.2%
0
20
40
60
80
100
Na
tio
na
l Ec
on
om
y is
Wo
rse
2008 2010 2012 2014 2016/17
Year
Would vote for PSUV
Would vote for Opposition
Vote Intention in Next Presidential Election
95 % Confidence Interval (with Design-Effects)
Source: AmericasBarometer, LAPOP, VEN 2007-2016/17; D1.1
% Negative National Economic Evaluations
Even among supporters of the PSUV, national and personal economic evaluations have become increasingly negative
*Analysis includes those who report an intention to vote in a future election for the PSUV or the opposition. Those responding that they would not select either option are not analyzed here.
Opposition evaluations have grown more negative
PSUV supporter evaluations have grown sharply more negative

1.8% 2.9%
9.1%18.3%
67.9%
0
20
40
60
80
Pe
rce
nta
ge
Veryeasy
Somewhateasy
Neither Somewhatdifficult
Verydifficult
Ease of Obtaining Food during the Last Month
Source: AmericasBarometer, LAPOP, VEN 2016/17; D1.1
~2 out of 3 Venezuelans report finding food and basic products in the last month “very difficult”
VENESC2B. ¿Qué tan fácil o difícil ha sido para usted en el último mes conseguir los alimentos y productos básicos que usted más consume en su hogar? (1) Muy fácil (2) Algo fácil (3) Ni fácil, ni difícil (4) Algo difícil (5) Muy difícil

4.0%
9.7%
22.8%
25.0%
38.5%
1.5%1.1%4.4%
16.2%
76.9%
0%
20%
40%
60%
80%
100%
Would vote for PSUV Would vote for OppositionSource: AmericasBarometer, LAPOP, VEN 2016/17; D1.1
Very Difficult
Somewhat Difficult
Neither Easy, Nor Difficult
Somewhat Easy
Very Easy
Ease of Obtaining Foodduring the Last Month
Although a majority of PSUV supporters indicate difficulties in finding food, they report more positive experiences than do opposition supporters
*Analysis includes those who report an intention to vote in a future election for the PSUV or the opposition. Those responding that they would not select either option are not analyzed here.
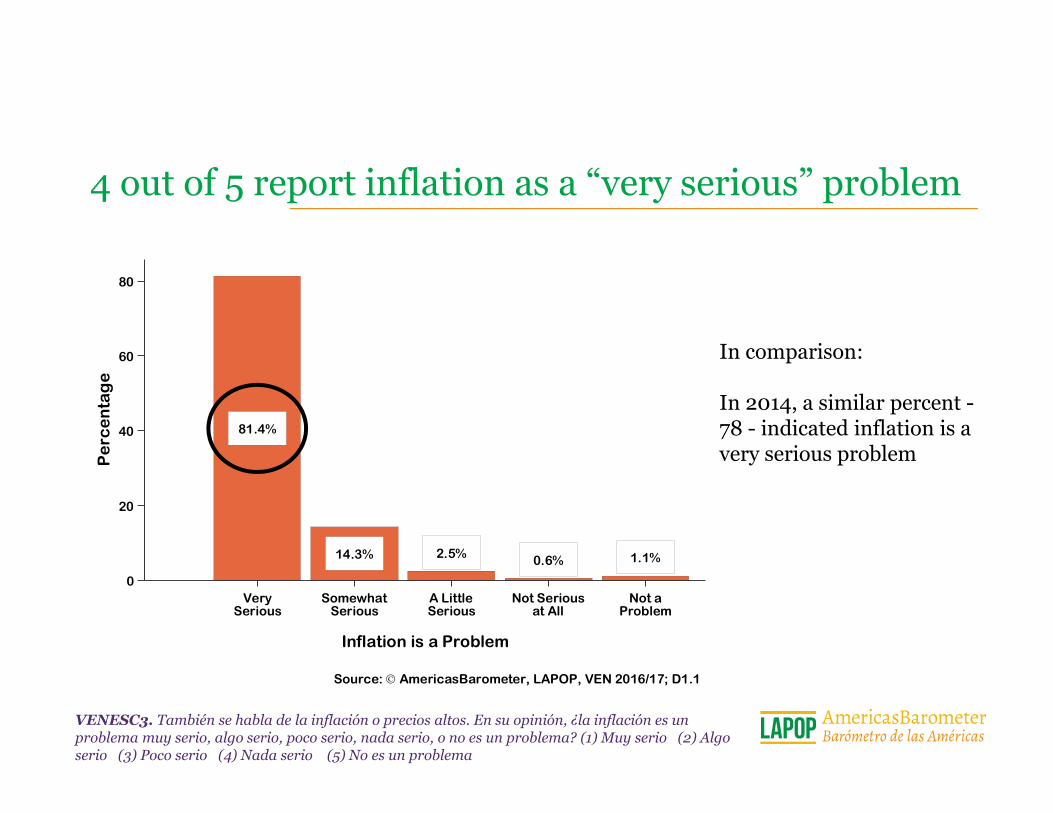
81.4%
14.3% 2.5% 0.6% 1.1%
0
20
40
60
80
Pe
rce
nta
ge
VerySerious
SomewhatSerious
A LittleSerious
Not Seriousat All
Not aProblem
Inflation is a Problem
Source: AmericasBarometer, LAPOP, VEN 2016/17; D1.1
4 out of 5 report inflation as a “very serious” problem
In comparison:
In 2014, a similar percent -78 - indicated inflation is a very serious problem
VENESC3. También se habla de la inflación o precios altos. En su opinión, ¿la inflación es un problema muy serio, algo serio, poco serio, nada serio, o no es un problema? (1) Muy serio (2) Algo serio (3) Poco serio (4) Nada serio (5) No es un problema

Although opposition supporters report more negative views about inflation, perceptions of inflation as a “very serious” problem are widespread even among PSUV supporters
72.0%
87.1%
0
20
40
60
80
100
Infl
ati
on
is a
Ve
ry S
eri
ou
s P
rob
lem
Would vote for PSUV Would vote for Opposition
Vote Intention in Next Presidential Election 95 % Confidence Interval (with Design-Effects)
Source: AmericasBarometer, LAPOP, VEN 2016/17; D1.1
*Analysis includes those who report an intention to vote in a future election for the PSUV or the opposition. Those responding that they would not select either option are not analyzed here.

Part I. Wide-Ranging Economic, Security, and Political Grievances in 2016/17
IB. Security: Persistent Insecurity and Rising Crime Victimization in 2016/17
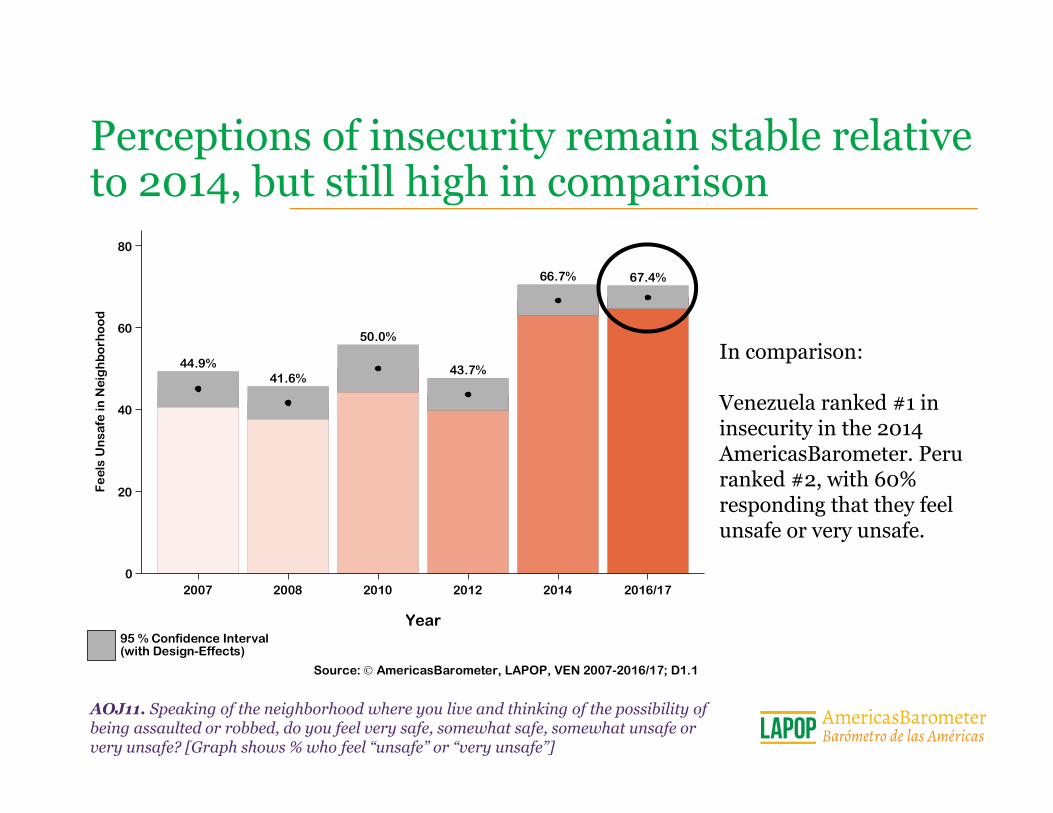
Perceptions of insecurity remain stable relative to 2014, but still high in comparison
AOJ11. Speaking of the neighborhood where you live and thinking of the possibility of being assaulted or robbed, do you feel very safe, somewhat safe, somewhat unsafe or very unsafe? [Graph shows % who feel “unsafe” or “very unsafe”]
44.9%41.6%
50.0%
43.7%
66.7% 67.4%
0
20
40
60
80
Fe
els
Un
safe
in N
eig
hb
orh
oo
d
2007 2008 2010 2012 2014 2016/17
Year 95 % Confidence Interval (with Design-Effects)
Source: AmericasBarometer, LAPOP, VEN 2007-2016/17; D1.1
In comparison:
Venezuela ranked #1 in insecurity in the 2014 AmericasBarometer. Peru ranked #2, with 60% responding that they feel unsafe or very unsafe.

3 out of 4 opposition supporters feel unsafe, in contrast to fewer than 1 of 2 PSUV supporters
30.0%
40.2%37.7%
49.4%43.6%
50.3%
57.6% 57.7%
77.6%74.6%
0
20
40
60
80
Fe
els
Un
safe
in N
eig
hb
orh
oo
d
2008 2010 2012 2014 2016/17
Year
Would vote for PSUV
Would vote for Opposition
Vote Intention in Next Presidential Election
95 % Confidence Interval (with Design-Effects)
Source: AmericasBarometer, LAPOP, VEN 2007-2016/17; D1.1
*Analysis includes those who report an intention to vote in a future election for the PSUV or the opposition. Those responding that they would not select either option are not analyzed here.

Crime victimization nearly doubled in 2016/17
VIC1EXT. Now, changing the subject, have you been a victim of any type of crime in the past 12 months? That is, have you been a victim of robbery, burglary, assault, fraud, blackmail, extortion, violent threats or any other type of crime in the past 12 months?
26.2%
19.4%
24.4%
40.5%
0
10
20
30
40
50
Vic
tim
of
Cri
me
2010 2012 2014 2016/17
Year 95 % Confidence Interval (with Design-Effects)
Source: AmericasBarometer, LAPOP, VEN 2007-2016/17; D1.1
In comparison:
This is 10 percentage points higher than the #1 ranked country in terms of crime victimization in the 2014 AmericasBarometer

Part I. Wide-Ranging Economic, Security, and Political Grievances in 2016/17
IC. Corruption: Bribe Solicitation and Perceptions of Corruption Remain High

LAPOP’s Corruption Victimization Measure
EXC2. Has a police officer asked you for a bribe in the last twelve months?
EXC6. In the last twelve months, did any government employee ask you for a bribe?
EXC11. In the last twelve months, to process any kind of document in your municipal government, like a permit for example, did you have to pay any money above that required by law?
EXC13. In your work, have you been asked to pay a bribe in the last twelve months?
EXC14. Did you have to pay a bribe to the courts in the last twelve months?
EXC15. In order to be seen in a hospital or a clinic in the last twelve months, did you have to pay a bribe?
EXC16. Have you had to pay a bribe at school in the last twelve months?
*The LAPOP corruption victimization measure codes anyone who answers “yes” to one or more of these questions to 1, else 0.

Rates of corruption victimization remain stable relative to 2014, but still high in comparison
19.4%
10.7%
18.5%
15.3%
26.6% 28.6%
0
5
10
15
20
25
30
Co
rru
pti
on
Vic
tim
izat
ion
2007 2008 2010 2012 2014 2016/17
Year 95 % Confidence Interval (with Design-Effects)
Source: AmericasBarometer, LAPOP, VEN 2007-2016/17; D1.1
In comparison:
In the 2014 AmericasBarometer, only 4 LAC countries had corruption victimization rates ≥ 28% (Mexico, Paraguay, Bolivia, and Haiti)
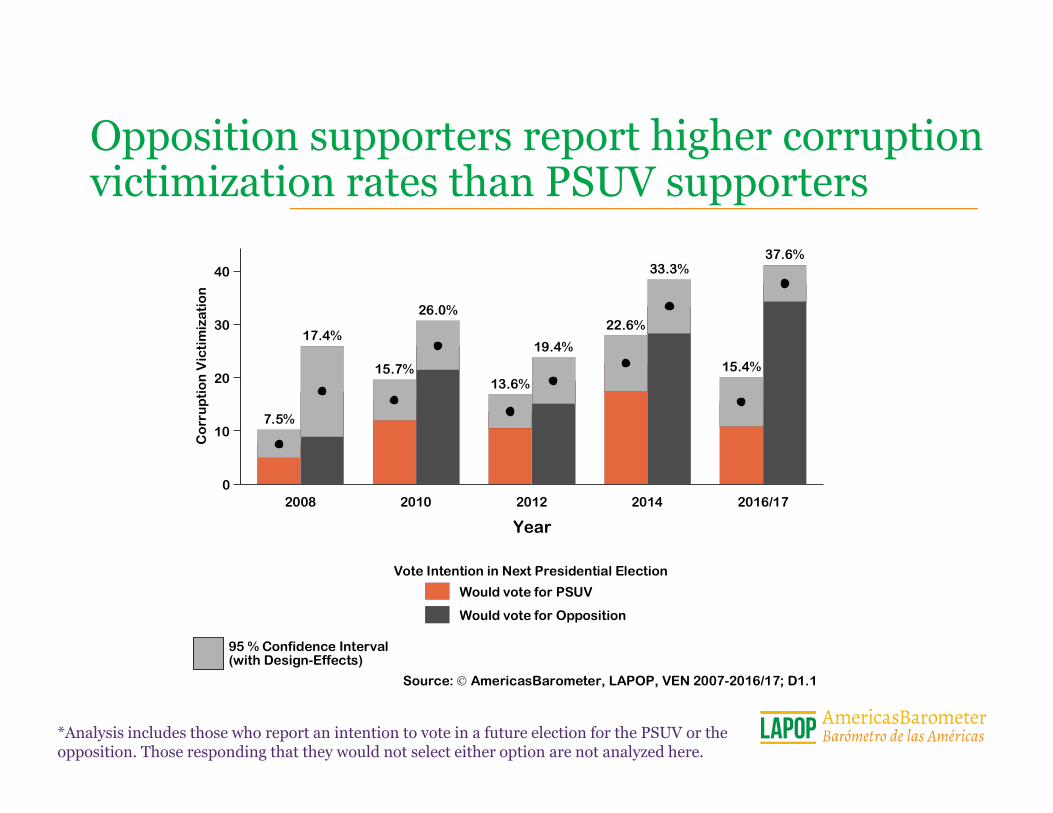
Opposition supporters report higher corruption victimization rates than PSUV supporters
7.5%
15.7%13.6%
22.6%
15.4%
17.4%
26.0%
19.4%
33.3%37.6%
0
10
20
30
40
Co
rru
pti
on
Vic
tim
izat
ion
2008 2010 2012 2014 2016/17
Year
Would vote for PSUV
Would vote for Opposition
Vote Intention in Next Presidential Election
95 % Confidence Interval (with Design-Effects)
Source: AmericasBarometer, LAPOP, VEN 2007-2016/17; D1.1
*Analysis includes those who report an intention to vote in a future election for the PSUV or the opposition. Those responding that they would not select either option are not analyzed here.
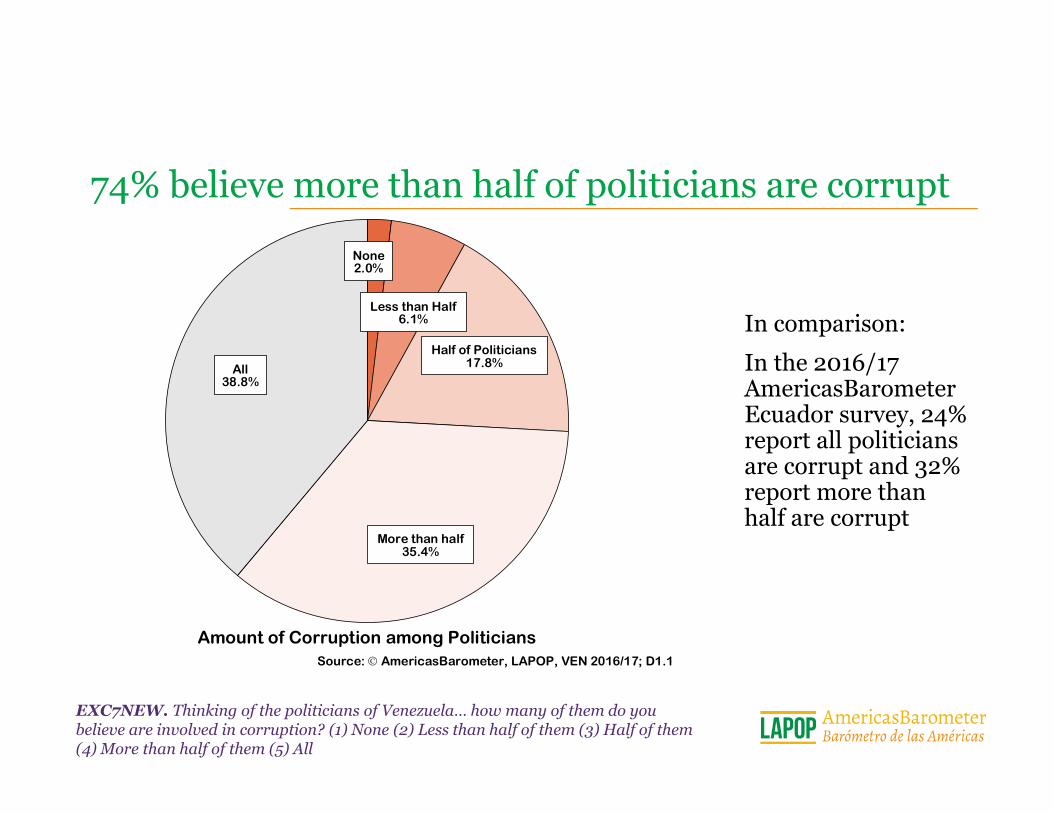
74% believe more than half of politicians are corrupt
None2.0%
Less than Half6.1%
Half of Politicians17.8%
More than half35.4%
All38.8%
Amount of Corruption among PoliticiansSource: AmericasBarometer, LAPOP, VEN 2016/17; D1.1
EXC7NEW. Thinking of the politicians of Venezuela… how many of them do you believe are involved in corruption? (1) None (2) Less than half of them (3) Half of them (4) More than half of them (5) All
In comparison:
In the 2016/17 AmericasBarometer Ecuador survey, 24% report all politicians are corrupt and 32% report more than half are corrupt

Part II. Instability, Flagging System Support, and (Un)Democratic Public Opinion
IIA. Uncertain Times: Heightened Concerns about Freedom of Expression and Socio-Political Conflict Persist in 2016/17, and Protest Participation Rises
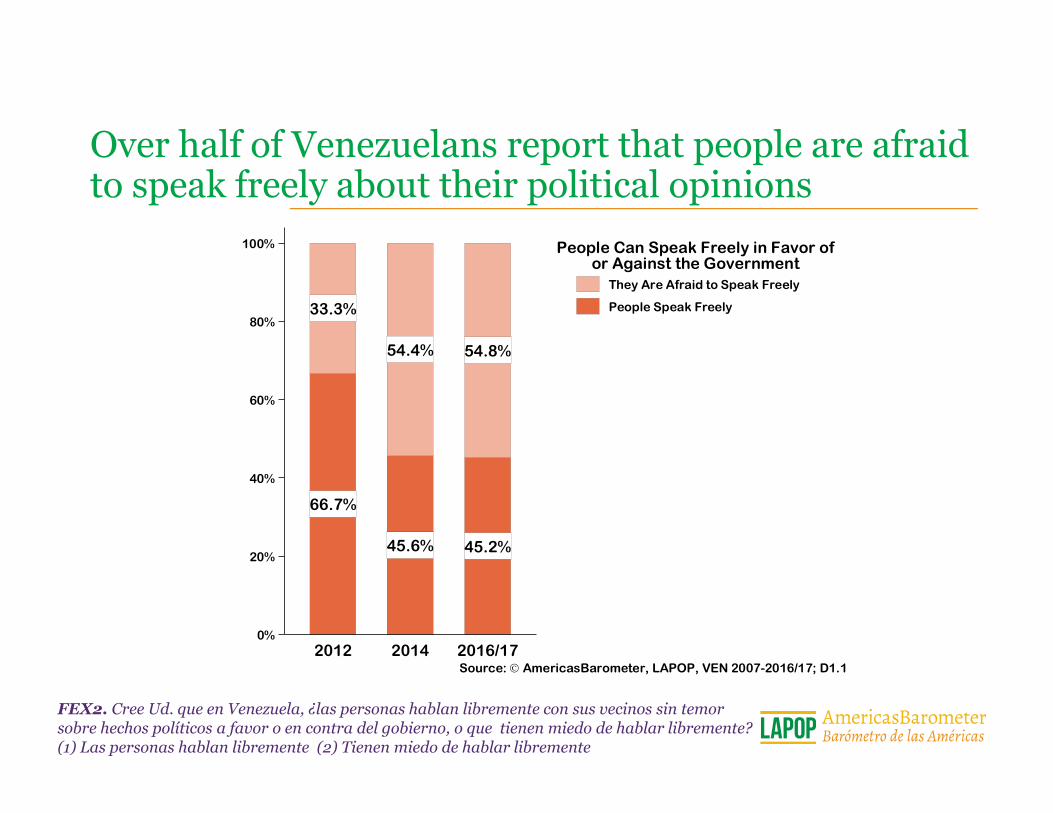
Over half of Venezuelans report that people are afraid to speak freely about their political opinions
FEX2. Cree Ud. que en Venezuela, ¿las personas hablan libremente con sus vecinos sin temor sobre hechos políticos a favor o en contra del gobierno, o que tienen miedo de hablar libremente? (1) Las personas hablan libremente (2) Tienen miedo de hablar libremente
66.7%
33.3%
45.6%
54.4%
45.2%
54.8%
0%
20%
40%
60%
80%
100%
2012 2014 2016/17Source: AmericasBarometer, LAPOP, VEN 2007-2016/17; D1.1
They Are Afraid to Speak Freely
People Speak Freely
People Can Speak Freely in Favor ofor Against the Government

Large differences exist in perceptions about freedom of speech between PSUV and opposition supporters
*Analysis includes those who report an intention to vote in a future election for the PSUV or the opposition. Those responding that they would not select either option are not analyzed here.
73.4%
26.6%
35.2%
64.8%
0%
20%
40%
60%
80%
100%
Would vote forPSUV
Would vote forOpposition
Source: AmericasBarometer, LAPOP, VEN 2016/17; D1.1
They Are Afraid to Speak Freely
People Speak Freely
People Can Speak Freely in Favor ofor Against the Government

The public outlook on socio-political conflict is pessimistic: over half of Venezuelans believe conflict will continue to increase
VENPROT11. ¿A usted le parece que en los próximos meses el conflicto social y político en Venezuela aumentará, se mantendrá igual, o disminuirá?
50.8%
40.0%
9.1%
51.0%
30.9%
18.1%
56.8%
25.5%
17.7%
0%
20%
40%
60%
80%
100%
2012 2014 2016/17Source: AmericasBarometer, LAPOP, VEN 2007-2016/17; D1.1
Will Decrease
Will Stay the Same
Will Increase
Level of Social and PoliticalConflict in the Next Months

The percentage of Venezuelans who perceive “a lot” of political polarization among citizens has increased
POLZ1. Hoy en día se habla mucho de que los venezolanos están divididos. En su opinión, ¿cuánta división política hay hoy entre los venezolanos? 1 “nada”- 7 “mucho”
52.6%
47.4%
38.2%
61.8%
0%
20%
40%
60%
80%
100%
2014 2016/17Source: AmericasBarometer, LAPOP, VEN 2007-2016/17; D1.1
7 "A lot"
1 "Not at all" - 6
Level of Political Polarizationamong Venezuelans

8.2%
3.7%
11.7%
15.8%
0
5
10
15
20
Pa
rtic
ipat
ed in
a P
rote
st
2010 2012 2014 2016/17
Year 95 % Confidence Interval (with Design-Effects)
Source: AmericasBarometer, LAPOP, VEN 2007-2016/17; D1.1
Protest participation continues to rise
PROT3. In the last 12 months, have you participated in a demonstration or protest march? (1) Yes (2) No
In comparison:
In the 2014 AmericasBarometer wave, the top-ranked country in protest, Bolivia, also had a rate of 16% (Venezuela was ranked #3 in that wave)

As expected, protest is greater among opposition supporters than PSUV supporters
*Analysis includes those who report an intention to vote in a future election for the PSUV or the opposition. Those responding that they would not select either option are not analyzed here.
13.3%
3.8%5.0%
7.2%7.5%
4.3%
20.5%
26.1%
0
5
10
15
20
25
30
Pa
rtic
ipat
ed in
a P
rote
st
2010 2012 2014 2016/17
Year
Would vote for PSUV
Would vote for Opposition
Vote Intention in Next Presidential Election
95 % Confidence Interval (with Design-Effects)
Source: AmericasBarometer, LAPOP, VEN 2007-2016/17; D1.1

Part II. Instability, Flagging System Support, and (Un)Democratic Public Opinion
IIB. Flagging System Support: Widespread discontent with the political system and attitudes conducive to instability
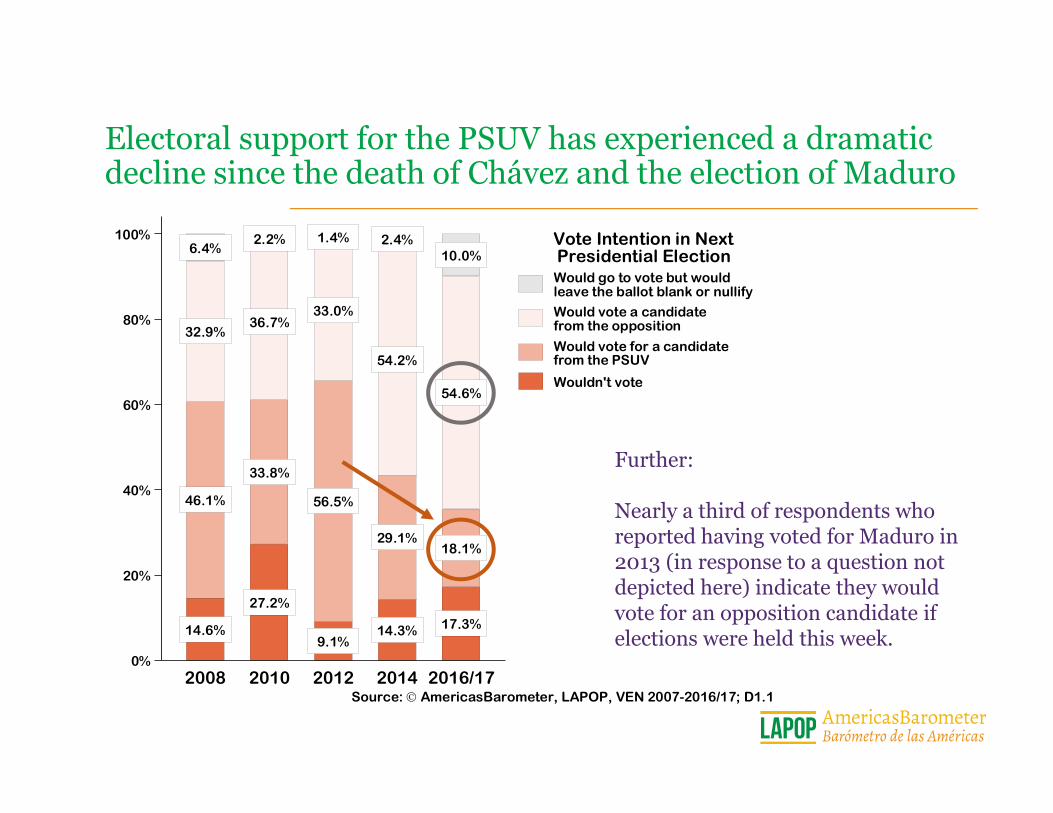
14.6%
46.1%
32.9%
6.4%
27.2%
33.8%
36.7%
2.2%
9.1%
56.5%
33.0%
1.4%
14.3%
29.1%
54.2%
2.4%
17.3%
18.1%
54.6%
10.0%
0%
20%
40%
60%
80%
100%
2008 2010 2012 2014 2016/17Source: AmericasBarometer, LAPOP, VEN 2007-2016/17; D1.1
Would go to vote but wouldleave the ballot blank or nullify
Would vote a candidatefrom the opposition
Would vote for a candidatefrom the PSUV
Wouldn't vote
Vote Intention in NextPresidential Election
Electoral support for the PSUV has experienced a dramatic decline since the death of Chávez and the election of Maduro
Further:
Nearly a third of respondents who reported having voted for Maduro in 2013 (in response to a question not depicted here) indicate they would vote for an opposition candidate if elections were held this week.

Two thirds of Venezuelans believe President Maduro should have left office by recall referendum in 2016 or by resignation
Leave by recallreferendum in 2016
29.3%
Leave by recallreferendum in 2017
6.2%
Finish his termin 201922.4%
Be re-electedin 2019
6.3%
Renounce his office35.7%
President should be recalled, finish his term, be reelected or resignSource: AmericasBarometer, LAPOP, VEN 2016/17; D1.1

57.0
49.749.0
56.2
42.339.9
0
10
20
30
40
50
60
Sys
tem
Su
pp
ort
2007 2008 2010 2012 2014 2016/17
Year 95 % Confidence Interval (with Design-Effects)
Source: AmericasBarometer, LAPOP, VEN 2007-2016/17; D1.1
Political system support remains at its lowest in 10 years: 40 degrees of support
B1. To what extent do you think the courts in (country) guarantee a fair trial?
B2. To what extent do you respect the political institutions of (country)?
B3. To what extent do you think that citizens’ basic rights are well protected by the political system of (country)?
B4. To what extent do you feel proud of living under the political system of (country)?
B6. To what extent do you think that one should support the political system of (country)?
In comparison:
In the 2016/17 AmericasBarometer Ecuador survey, the public expresses an average of 55 degrees of system support
0-1
00
In
dex
ba
sed
on
:
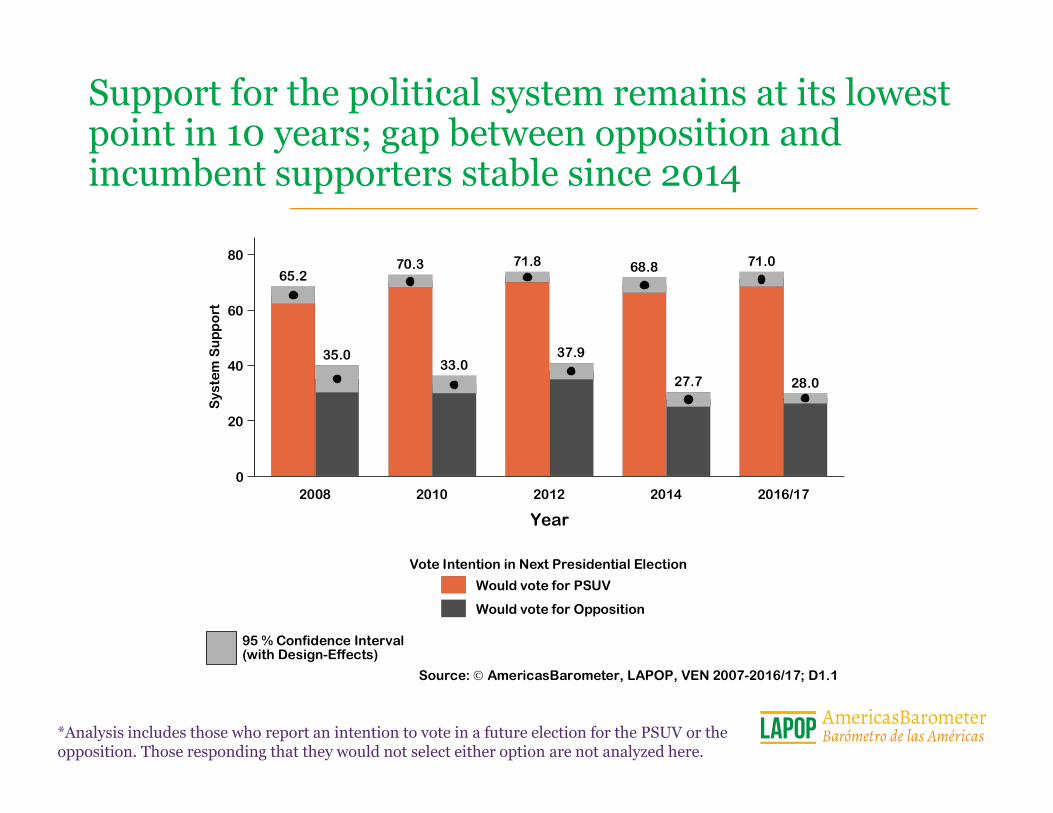
Support for the political system remains at its lowest point in 10 years; gap between opposition and incumbent supporters stable since 2014
*Analysis includes those who report an intention to vote in a future election for the PSUV or the opposition. Those responding that they would not select either option are not analyzed here.
65.270.3 71.8 68.8 71.0
35.033.0
37.9
27.7 28.0
0
20
40
60
80
Sys
tem
Su
pp
ort
2008 2010 2012 2014 2016/17
Year
Would vote for PSUV
Would vote for Opposition
Vote Intention in Next Presidential Election
95 % Confidence Interval (with Design-Effects)
Source: AmericasBarometer, LAPOP, VEN 2007-2016/17; D1.1

Tolerance of the rights of anti-system critics fluctuates at mid-range levels
0-100 Index based on:
D1. There are people who only say bad things about the (country) form of government, not just the incumbent government but the system of government. How strongly do you approve or disapprove of such people’s right to vote?
D2. How strongly do you approve or disapprove that such people be allowed to conduct peaceful demonstrations in order to express their views?
D3. Still thinking of those who only say bad things about the (country) form of government, how strongly do you approve or disapprove of such people being permitted to run for public office?
D4. How strongly do you approve or disapprove of such people appearing on television to make speeches?
66.5
54.6
63.4
54.2
61.8
55.2
0
20
40
60
80
To
lera
nc
e
2007 2008 2010 2012 2014 2016/17
Year 95 % Confidence Interval (with Design-Effects)
Source: AmericasBarometer, LAPOP, VEN 2007-2016/17; D1.1

Tolerance of the rights of system opponents decreased among the opposition in 2016/17
*Analysis includes those who report an intention to vote in a future election for the PSUV or the opposition. Those responding that they would not select either option are not analyzed here.
47.4
59.8
48.4 48.245.4
63.169.5 67.3 69.3
61.1
0
20
40
60
80
To
lera
nc
e
2008 2010 2012 2014 2016/17
Year
Would vote for PSUV
Would vote for Opposition
Vote Intention in Next Presidential Election
95 % Confidence Interval (with Design-Effects)
Source: AmericasBarometer, LAPOP, VEN 2007-2016/17; D1.1

Assessing Prospects for Stable Democracy in Venezuela
D1. There are people who only say bad things about the (country) form of government, not just the incumbent government but the system of government. How strongly do you approve or disapprove of such people’s right to vote? D2. How strongly do you approve or disapprove that such people be allowed to conduct peaceful demonstrations in order to express their views? D3. Still thinking of those who only say bad things about the (country) form of government, how strongly do you approve or disapprove of such people being permitted to run for public office? D4. How strongly do you approve or disapprove of such people appearing on television to make speeches?
Variables used to create a political tolerance index [all are on a 0 (Strongly disapprove) to 100 (Strongly approve) scale]:
Variables used to create a legitimacy (system support) index [all are on a 0 (None) to 100 (A lot) scale]:
B1. To what extent do you think the courts in (country) guarantee a fair trial?B2. To what extent do you respect the political institutions of (country)? B3. To what extent do you think that citizens’ basic rights are well protected by the political system of (country)?B4. To what extent do you feel proud of living under the political system of (country)?B6. To what extent do you think that one should support the political system of (country)?
Political Tolerance
Legitimacy(System Support)
High Low
High Stable Democracy
Authoritarian Stability
Low Unstable Democracy
Democracy at Risk

40
45
50
55
60
65
Ave
rag
e
2007 2008 2010 2012 2014 2016Year
Political Tolerance System Support
Source: AmericasBarometer LAPOP, VEN 2016/17; D1.1
Venezuela’s public opinion profile in 2016/17: waning tolerance + lower system support
Tolerance jut above the mid‐point (50) + low (and declining) system support =
Unstable Democracy (and approaching Democracy at Risk)
High system support + low tolerance = Authoritarian Stability (2012)
Low system support + high tolerance = Unstable Democracy (2014)

42.5%
18.8%
26.6%
12.1%
26.8%
22.6%
27.9%
22.6%
29.2%
16.8%
37.0%
17.0%
24.5%
36.7%
23.6%
15.2%
18.2%
18.9%
43.8%
19.1%
14.9%
18.7%
38.8%
27.7%
0%
20%
40%
60%
80%
100%
2007 2008 2010 2012 2014 2016/17Source: AmericasBarometer, LAPOP, VEN 2007-2016/17; D1.1
Democracy at Risk
Unstable Democracy
Authoritarian Stability
Stable Democracy
Political Culture Profiles
Venezuela’s 2016/17 public opinion profile: high tolerance + low system support, portends democratic instability while moving toward a system at risk
The percentage of Venezuelans with attitudes conducive to stable democracy
has reached an all‐time low
The percentage of Venezuelans with attitudes conducive to stable democracy
has reached an all‐time low
Shift toward a political system at riskShift toward a political system at risk
Part II. Instability, Flagging System Support, and (Un)Democratic Public Opinion
IIC. Waning Support for Democracy: New Fault Lines in Some, but not all, Democratic Values

Satisfaction with democracy declined to its lowest point, even lower than 2014
PN4. In general, would you say that you are very satisfied, satisfied, dissatisfied or very dissatisfied with the way democracy works in Venezuela? (100) Very satisfied/Satisfied (0) Dissatisfied/Very dissatisfied
58.5%
66.4%
40.6%
62.1%
31.5%
26.5%
0
20
40
60
80
Pe
rce
nt
Sa
tisf
ied
wit
h D
em
ocr
acy
2007 2008 2010 2012 2014 2016/17
Year 95 % Confidence Interval (with Design-Effects)
Source: AmericasBarometer, LAPOP, VEN 2007-2016/17; D1.1
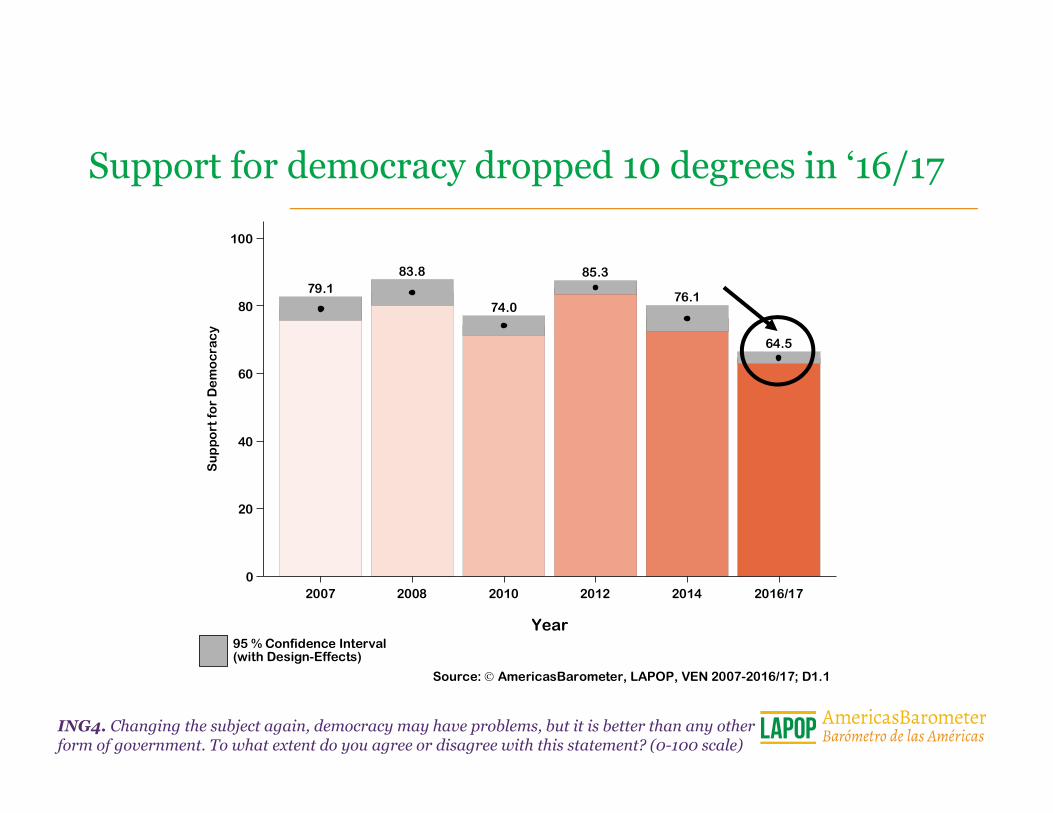
Support for democracy dropped 10 degrees in ‘16/17
ING4. Changing the subject again, democracy may have problems, but it is better than any other form of government. To what extent do you agree or disagree with this statement? (0-100 scale)
79.183.8
74.0
85.3
76.1
64.5
0
20
40
60
80
100
Su
pp
ort
fo
r D
em
ocr
acy
2007 2008 2010 2012 2014 2016/17
Year 95 % Confidence Interval (with Design-Effects)
Source: AmericasBarometer, LAPOP, VEN 2007-2016/17; D1.1
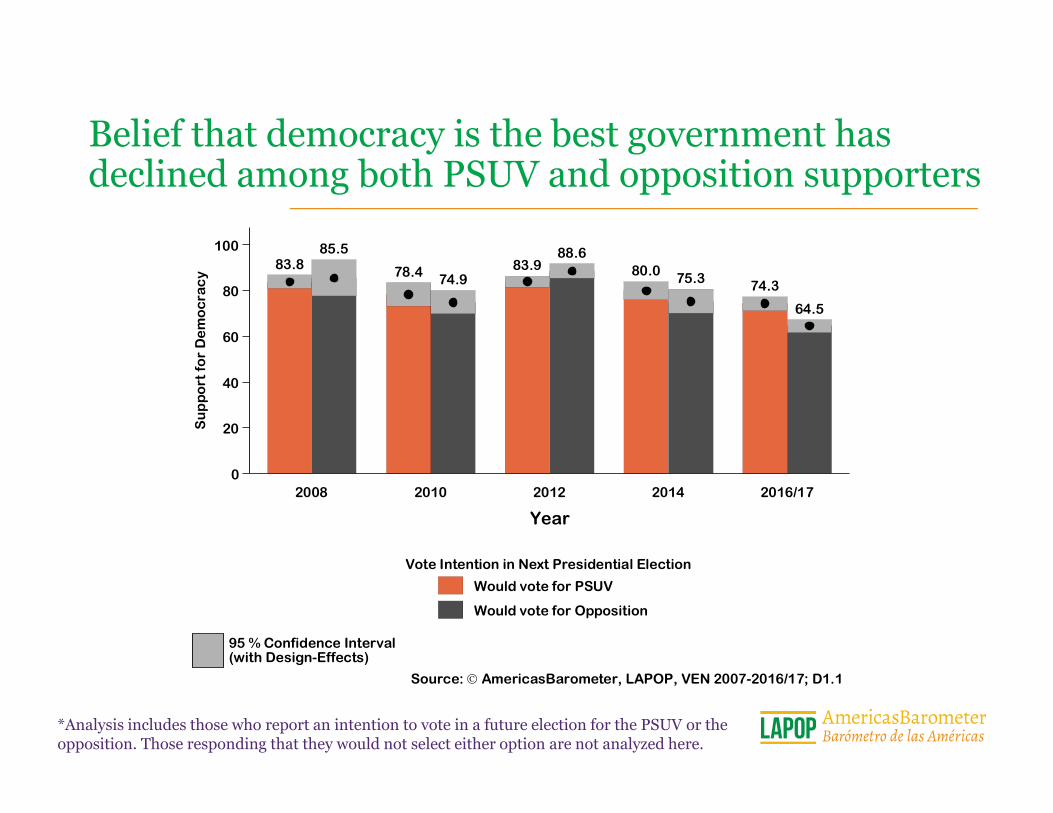
83.8 78.4 83.9 80.074.3
85.5
74.9
88.6
75.3
64.5
0
20
40
60
80
100
Su
pp
ort
fo
r D
em
oc
rac
y
2008 2010 2012 2014 2016/17
Year
Would vote for PSUV
Would vote for Opposition
Vote Intention in Next Presidential Election
95 % Confidence Interval (with Design-Effects)
Source: AmericasBarometer, LAPOP, VEN 2007-2016/17; D1.1
Belief that democracy is the best government has declined among both PSUV and opposition supporters
*Analysis includes those who report an intention to vote in a future election for the PSUV or the opposition. Those responding that they would not select either option are not analyzed here.
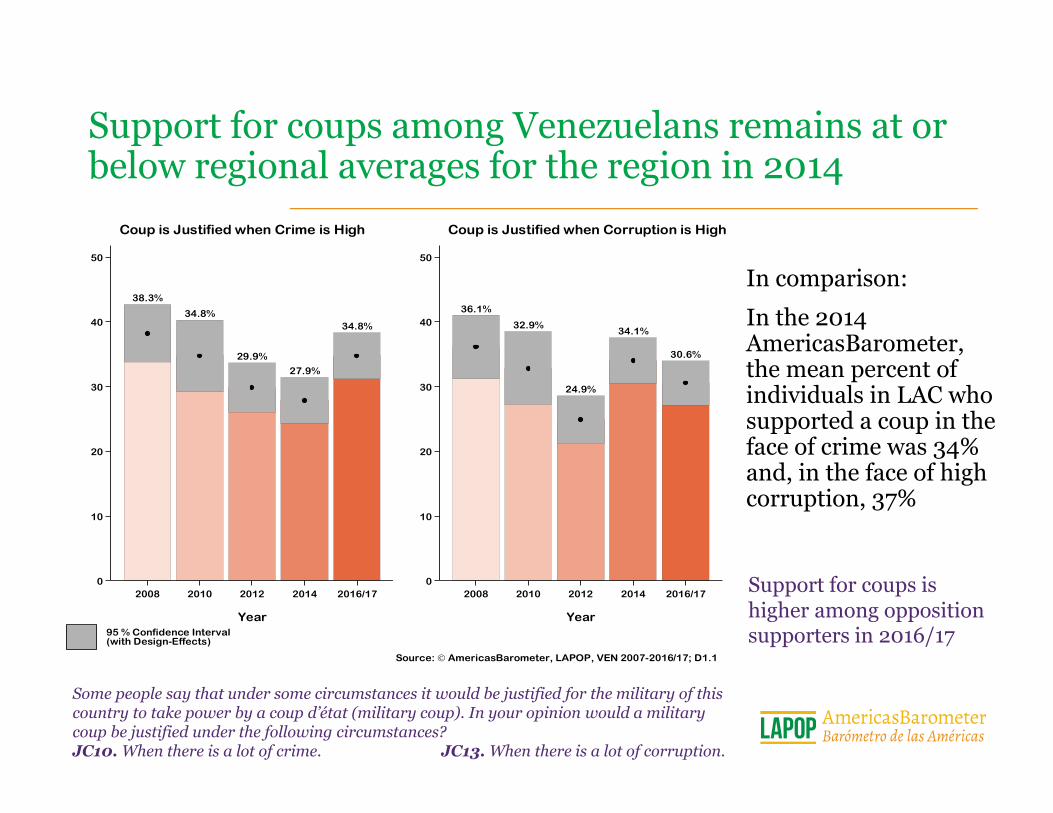
38.3%
34.8%
29.9%
27.9%
34.8%
0
10
20
30
40
50
2008 2010 2012 2014 2016/17
Year
Coup is Justified when Crime is High
36.1%
32.9%
24.9%
34.1%
30.6%
0
10
20
30
40
50
2008 2010 2012 2014 2016/17
Year
Coup is Justified when Corruption is High
95 % Confidence Interval (with Design-Effects)
Source: AmericasBarometer, LAPOP, VEN 2007-2016/17; D1.1
Support for coups among Venezuelans remains at or below regional averages for the region in 2014
Some people say that under some circumstances it would be justified for the military of this country to take power by a coup d’état (military coup). In your opinion would a military coup be justified under the following circumstances?JC10. When there is a lot of crime. JC13. When there is a lot of corruption.
Support for coups is higher among opposition supporters in 2016/17
In comparison:
In the 2014 AmericasBarometer, the mean percent of individuals in LAC who supported a coup in the face of crime was 34% and, in the face of high corruption, 37%
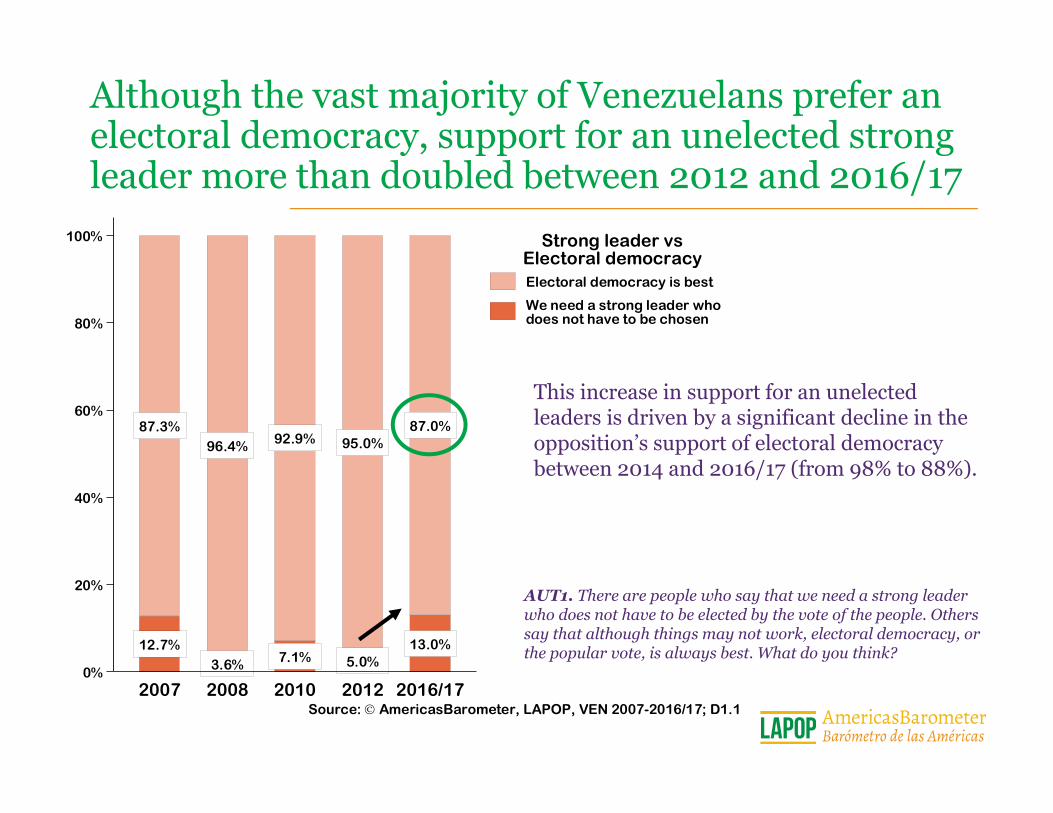
12.7%
87.3%
3.6%
96.4%
7.1%
92.9%
5.0%
95.0%
13.0%
87.0%
0%
20%
40%
60%
80%
100%
2007 2008 2010 2012 2016/17Source: AmericasBarometer, LAPOP, VEN 2007-2016/17; D1.1
Electoral democracy is best
We need a strong leader whodoes not have to be chosen
Strong leader vsElectoral democracy
Although the vast majority of Venezuelans prefer an electoral democracy, support for an unelected strong leader more than doubled between 2012 and 2016/17
AUT1. There are people who say that we need a strong leader who does not have to be elected by the vote of the people. Others say that although things may not work, electoral democracy, or the popular vote, is always best. What do you think?
This increase in support for an unelected leaders is driven by a significant decline in the opposition’s support of electoral democracy between 2014 and 2016/17 (from 98% to 88%).

Although the vast majority of Venezuelans do not think it is justified to close the National Assembly in times of crisis, the percent that do justify this action has increased in 2016/17
JC15A. Do you believe that when the country is facing very difficult times it is justifiable for the President of the country to close the National Assembly and govern without the National Assembly?
9.7%
90.3%
5.6%
94.4%
7.2%
92.8%
13.0%
87.0%
0%
20%
40%
60%
80%
100%
2010 2012 2014 2016/17Source: AmericasBarometer, LAPOP, VEN 2007-2016/17; D1.1
No, it is not justified
Yes, it is justified
Executive Justified in Governingwithout Legislature during Crisis
This increase is driven by a significant increase among PSUV supporters who agree with this type of action between 2014 and 2016/17 (from 12% to 41%).
In brief: new fault lines in democratic public opinion are emerging on both sides of an increasingly unstable political system

Report Credits
Author: Mariana Rodríguez, Ph.D. Country Coordinator: Mariana Rodríguez, Ph.D.
Series Editor: Elizabeth J. Zechmeister, Ph.D.
All LAPOP reports and data are available at www.lapopsurveys.org
.

lapopsurveys.orgSíganos en
![Jamaica 2010 presentation v8 with LAPOP intro [Read-Only] · Title: Microsoft PowerPoint - Jamaica 2010 presentation v8 with LAPOP intro [Read-Only] Author: bembrytj Created Date:](https://img.dokumen.tips/doc/110x75/5ff83e258bdd572f744c8766/jamaica-2010-presentation-v8-with-lapop-intro-read-only-title-microsoft-powerpoint.jpg)