Embed Size (px)
Citation preview

. . . . . .. . . .
. . . . . . . . . .
PageBloomer
Weather Forecasting
Project Report for SFF L05-006: Weather forecasting for enhanced profits and environment
protection
Report prepared for the Foundation for Arable Research - July 2007

. . . . . . .. . .
Page Bloomer Associates 2
www.pagebloomer.co.nz
Weather Forecasting
Project Report for SFF L05-006: Weather forecasting for enhanced profits and environment protection
Project Summary
This project is part of a review of new technologies for the arable sector. The Foundation for Arable Research is investigating opportunities for increased use of information technologies. These include decision support tools such as crop and disease calculators and irrigation and nutrient scheduling guides.
Access to appropriate on-demand weather data is a core component of such tools but is not widely used outside the research community. Currently Canterbury has few accessible sites with sufficient weather parameters monitored. As farmers and other key decision makers adopt decision support tools, more pertinent information at a more local level is required.
This project investigated the opportunity to co-ordinate a regional weather station network, use computer modelling to predict disease risk, irrigation need, and crop yields.
With support from technology providers, three groups of arable farmers and consultants were provided with free access to detailed localized weather forecasts and associated information. Access to this forecasting was expected to enhance cropping farmers’ ability to optimise use of irrigation, agrochemicals and fertilisers and plan other farm operations.
Most weather information users are seeking predictions and use multiple sources of information. They apply their own interpretations to whichever forecasts they receive. Some people are unable to adequately access web-based information due to poor infrastructure.
There is some use of, but little emphasis on, access to historic weather data. The main identified use was for crop models such as Wheat Calculator, and limited use for disease prediction.
All but one person found the HortPlus MetWatch forecasts very useful. Local weather differences from the forecast sites were evident. The accuracy was

Page Bloomer Associates 3
www.pagebloomer.co.nz
generally considered much better around the Chertsey weather station than Methven or St Andrews.
User surveys show that the information provided can assist on-farm decision making with regard to field operations such as spraying, harvest, cultivation and planting. However, much better disease forecasting is seen to have the biggest potential benefit.
The financial gain from using cheaper protectants is suggested sufficient to pay for the cost of obtaining the information. As such high priority should be placed on integrating suitable disease (and pest) models into the weather forecast service.
A map of potential weather stations is presented. Approximately ninety potential weather stations were identified in Canterbury, Otago and Southland. Identified stations include those operated by crown institutes, cropping organisations and private individuals.
After removing probable duplicates some seventy remain, although of these some are probably outside the main areas of interest, and access to data and the quality and reliability has not been verified.
In addition, a range of information sheets addressing weather measuring and interpretation were prepared. These cover topics from selecting sensors, to weather and disease, to interpreting weather maps.
The assistance of project partners is gratefully acknowledged.
• HortPlus provided focus group participants with one year MetWatch subscriptions at no charge and made helpful presentations to growers
• MetService generated point forecasts for the three FAR weather station sites and made these available at no charge
• Scott Technical provide weather station advice and assistance and helped identify potential weather stations
• Focus group members gave valuable feedback on the service from arable industry perspectives. ‘The Glebe’ and ‘Copperfields’ host the stations at Methven and St Andrews.

. . . . . . .. . .
Page Bloomer Associates 4
www.pagebloomer.co.nz
Table of Contents
1. Background..................................................................................5
2. Project activities...........................................................................6
3. Weather station locations ...........................................................7
3.1. Weather information requirements.............................................7
3.2. Weather stations used ................................................................7
3.3. Other weather stations identified................................................7
4. Weather forecasts .......................................................................9
4.1. MetWatch forecasts ....................................................................9
4.2. Accessing forecasts and data ....................................................9
4.3. Project weather forecasts ...........................................................9
5. Initial user survey.......................................................................10
5.1. Results of Initial Survey.............................................................10
6. Final user survey .......................................................................11
6.1. Email survey ..............................................................................11
6.2. Telephone Interviews................................................................12
6.3. Application for decision support ...............................................15
6.4. Application for environmental protection .................................15
7. Appendices ................................................................................16
7.1. Project milestones..............................................................16
7.2. Arable Relevant Weather Station Locations......................17
7.3. Map of Arable Relevant Weather Stations.........................18
7.4. National Rural Fire Association Standards........................19
7.5. HortPlus MetWatch daily forecast......................................21
7.6. Initial User survey ..............................................................22
7.6.1. Initial Survey Template ......................................................22
7.6.2. Responses to Initial Survey ...............................................25
7.7. Final User Surveys.............................................................27
7.7.1. Email Survey Template......................................................27
7.7.2. Responses to email survey................................................27
7.7.3. Telephone Survey Template..............................................29
7.7.4. Summary of responses ......................................................30
7.8. Project Team......................................................................38
7.9. Additional Resources .........................................................39
7.9.1. List of Titles........................................................................39

Page Bloomer Associates 5
www.pagebloomer.co.nz
1. Background
National weather forecasting is well resourced and the subject of much discussion. However it is only able to give indicative forecasts at broad scales and with a relative lack of detail.
To improve decision making farmers need to know what the weather will be doing on their properties in 2, 12, 22 or 32 hours time. Access to detailed ‘customised’ weather forecasting was expected to enhance cropping farmers’ ability to optimise use of irrigation, agrochemicals and fertilisers and plan other farm operations.
Small weather stations have become increasingly affordable and the ability to transmit, process and share data is improving greatly. A network of stations and access to appropriate crop and disease models was anticipated to help farmers make the best practical and timely decisions on spraying, irrigating, and harvesting crops. Farmers would not all need their own weather stations, as they would be able to obtain property relevant predictions of the time of arrival of weather events or occurrence of infection periods via email, fax or phone messages or internet options.
The project investigated the opportunity to co-ordinate a regional weather station network, use computer modelling to predict disease risk, irrigation need, and crop yields. This would reduce unnecessary expenditure on hardware, reduce weather related risks, increase profitability and save farmers and the environment from wasteful application of chemicals and/or water.
We anticipated the outcomes from this project would be able to flow on to other cropping sectors, and to be extended geographically as well.

. . . . . . .. . .
Page Bloomer Associates 6
www.pagebloomer.co.nz
2. Project activities
This project involved co-ordination of three small groups of cropping farmers in Canterbury. Those involved had a commitment to developing much better site specific weather forecasts and taking advantage of related technologies to improve production efficiency and safeguard the environment.
An initial small workshop outlined the available technology options and explained how these are being applied in other sectors and regions in NZ.
Information and technology providers HortPlus (Trevor Atkins) outlined the existing uses of new weather and related prediction technologies for fruit industries, and potential for arable cropping in Canterbury. A number of growers and industry people described the roles they saw for such information.
Three existing weather stations operated by the Foundation for Arable Research were used to demonstrate the potential of already available forecast opportunities. The three FAR stations have potential to be included in a regional network providing data for on-farm decisions. Detailed site specific forecasts were generated by the Met Service and made available to focus group members by HortPlus MetWatch.
An attempt was made to record the locations of other weather stations that were potentially able to be incorporated in a regional network. Crop & Food Research and McCain Foods are known to have additional stations. A number of sites are operated by NIWA and through the National Rural Fire network, however these may not be in suitable locations or collecting sufficient data.
Surveys of participants were conducted at the beginning and end of the project to determine the uses to which weather and climate information is currently being used, and to document the benefits that accrue to those acting on the information provided. This also helped identify gaps and prioritise future development goals.
Information about weather stations and interpretation was prepared in fact sheet format. The material is predominantly derived from an earlier MAF SFF project, Research to Practice, use and interpretation of weather information (Manktelow and Porteous). This material is intended to increase the extent of awareness of the potential for these and related technologies.
We anticipate again interacting with the wider community through a series of workshops that present the results of the project, and generate ongoing adoption of suitable opportunities. This has not been completed as FAR are reviewing their portfolio of weather and crop model research and services for levy payers.

Page Bloomer Associates 7
www.pagebloomer.co.nz
3. Weather station locations
3.1. Weather information requirements
The detailed forecasts used in this project are quite site specific. Therefore valued weather recording sites are located in or very near cropping districts.
In addition, specific information is required to generate MetWatch forecasts.
1. Minimum sensoring required for MetWatch
Air temperature Rainfall
Leaf wetness
2. Station Outputs
Output needs to include year, plus an output array for daily totals (usually 9am but midnight otherwise) for:
Rainfall total Average, min, max air temperature (plus Windrun if wind speed is recorded, and total radiation if recorded)
3.2. Weather stations used
Three weather stations were ultimately used as trial sites for this project – rather than one originally planned. This was assisted by Met Service making free forecasts available for this project. The contribution is gratefully acknowledged.
The sites were: 1. Methven at “The Glebe”
2. Chertesy at the “FAR Arable Site”
3. St Andrews at “Copperfields”
All three stations are operated by the Foundation for Arable Research.
3.3. Other weather stations identified
Approximately ninety potential weather stations were identified in Canterbury, Otago and Southland. After removing probable duplicates some seventy remain, although of these some are probably outside the main areas of interest.
The station names and known locations are presented in Appendix 7.2. A map is presented as Appendix 7.3.

. . . . . . .. . .
Page Bloomer Associates 8
www.pagebloomer.co.nz
Stations have been grouped according to ownership and probable utility. The weather factors measured by each is reported but has not been verified. Iin addition, there has been no checking of the quality or maintenance standards of these stations.
For reference, the requirements for inclusion in the National Rural Fire Association weather station network are presented in Appendix 7.4.
The collated list includes stations in the NFRA network, NIWA climate station network and stations operated for agronomy purposes by FAR, Crop& Food and McCain Foods.
Another group includes stations operated by councils, although some are located on buildings.
The remaining group includes private stations that are available for polling via internet links. Many of these are in Southland and more peripheral locations so may be of limited use.
Among the various groups are stations reportedly used by the NZ Meteorological Service.
The quality of data from the NFRA and NIWA networks and from Met Service stations and the agronomy stations can be assumed adequate for crop management purposes. Data quality from private on-line stations is unknown.

Page Bloomer Associates 9
www.pagebloomer.co.nz
4. Weather forecasts
4.1. MetWatch forecasts
MetWatch weather station forecasts are detailed point forecasts generated by the New Zealand Meteorological Service. Key parameters are forecast on an hour by hour basis for up to 60 hours ahead.
Forecasting is refined through a feedback loop. Generated forecasts are compared to actual weather experienced at the site in question and the algorithms adjusted accordingly.
4.2. Accessing forecasts and data
MetWatch forecasts are made available to HortPlus subscribers by daily fax or email, and through website access. The members of focus groups in this project were provided with one year subscriptions by HortPlus at no charge.
An example of a daily forecast emailed to subscribers is given in Appendix 7.5. The HortPlus weather site can be viewed at http://www.hortplus2.com/mwol/
The Met Service generated and made available three weather forecasts, one for each FAR station. This increased coverage of the project from one to three sites. Three discussion groups were formed, one based around each weather station.
While many in the discussion groups were local to one or other of the sites, some were further a-field to help identify issues arising for farmers sited some distance from a local station.
4.3. Project weather forecasts
A number of problems were encountered during the establishment phase of this project. Early forecasts were notably incorrect – to the extent farmers rang to query the forecasts they received.
This problem was resolved quickly, but stayed in the minds of focus group farmers. The cause was an error in co-ordinate conversion. This error mis-located stations (Methven was apparently on Mt Hutt). All stations were some 10km out, and in areas with variable topographical (Methven and St Andrews) this was particularly significant.
On several occasions problems remotely accessing the three weather stations appeared to have been resolved but then resurfaced.
General station maintenance was completed and stations were reprogrammed to allow 24/7 remote login. Aerials were checked and changed but did not seem to cause the faults. It is possible a download software version conflict may have been the root cause.

. . . . . . .. . .
Page Bloomer Associates 10
www.pagebloomer.co.nz
5. Initial user survey
A postal survey of the focus group members receiving daily weather forecasts was undertaken near the start of the project. The survey form is presented in Appendix 7.6.1.
Unfortunately only a small number of users responded to the survey, even after repeated approaches.
5.1. Results of Initial Survey
Details are presented in Appendix 7.6.2.
Weather forecasting was generally regarded ‘very important’ for farm management. Half of the group checked forecasts daily, one quarter twice daily, and the others several times. Information was obtained from TV, radio and internet, and newspapers.
Forecast information was used for work planning and for protection from adverse weather such as frost. Spring and summer were predominantly named as the critical periods. Half of the respondents check weather forecasts several times a day at critical times. Responses to ‘how often access was wanted’ were generally the same as ‘actual use’.
Wind speed and direction, rain information, maximum and minimum air temperatures and humidity were important to most of the group, while solar radiation was of interest to only 3 respondents.
Most farmers measured their rainfall, max and min temperatures and humidity. Less than half measured wind speed or direction and solar radiation. Rainfall was recorded by all but one respondent.
Soil temperature and disease pressure were the most highly sought related data (6/7), followed closely by soil moisture, leaf wetness and pest pressure. Ground air temperature was only wanted by three of the farmers.
Few were measuring all that they are seeking and even less were recording it.

Page Bloomer Associates 11
www.pagebloomer.co.nz
6. Final user survey
At the end of the project, all focus group members were emailed seeking feedback on the service. A number of focus group members were also interviewed by telephone, interviews lasting for approximately half an hour.
6.1. Email survey
The email survey was ‘informal’ – an email with no leading questions sought quick responses. See Appendix 7.7.1.
A small number of growers replied (as with the first written mail survey at the start of the project). Further emails were exchanged with respondents, clarifying points raised. Of those who did not reply, later communications with some indicated they were “sorry but just too busy”.
Details from email responses are presented in Appendix 7.7.2.
Responses varied from “not much use” to “excellent tool”. In part this seems to be locality related, and in part it reflects early experiences and possibly attitude to new technologies. One grower felt the service was no better than other options and believed it to be highly inaccurate.
This response related to the initial incorrect grid reference given for the Methven station which resulted incorrect forecasts. It seems correcting this was not acknowledged, and perhaps the service was written off at this early stage.
Other growers were enthusiastic with one stating the forecasts were useful despite ‘inaccuracy’. The information was still better than otherwise available.
The lack of ‘add-on tools’ for arable diseases was noted by several respondents.

. . . . . . .. . .
Page Bloomer Associates 12
www.pagebloomer.co.nz
6.2. Telephone Interviews
Interviewees included both farmers and consultant/contractors. Each person was referenced to one of the three FAR weather stations; four were based at Chertsey (two growers, one consultant, one process factory), two at Methven and two at St Andrews.
The interview template is attached as Appendix 7.7.3.
A range of responses was obtained, with overall opinions ranging from ‘not much use’ to ‘extremely useful’. Details are presented in Appendix 7.7.4.
6.2.1. Summary
Most weather information users are seeking predictions and use multiple sources of information. They apply their own interpretations to whichever forecasts they receive.
TV news and weather is widely used to obtain an overview and a variety of other sources including websites and local newspapers used to obtain more localised detail.
There is some use of, but little emphasis on, access to historic weather data. The main identified use was for crop models such as Wheat Calculator, and Crop & Food provides updated information already. There is minor use of recent historic data by farmers for irrigation scheduling and some disease modelling by the process factory.
Some people are unable to adequately access web-based information due to poor infrastructure. However few of those involved in the project made extensive use of the information available on-line at HortPlus MetWatch anyway. There were notable exceptions.
Local accuracy differences from, and therefore usefulness of, the detailed forecasts were evident and seen to have significant effect further from the base station site. This was most noticeable away from the Methven and St Andrews stations.
The accuracy was generally considered much better around the Chertsey weather station. Suggested reasons are the more even topography and reduced influences from either sea or mountains. In the Chertsey area, the forecast was believed to be very accurate in an ellipse extending further north-south (15-20km) than east-west (8-12km).
All but one person found the HortPlus MetWatch forecasts very useful. The one who did not, discussed needing to learn to trust it, and thought that forecast was the best for wind prediction, a lot closer than TV or radio.

Page Bloomer Associates 13
www.pagebloomer.co.nz
The prediction one to two days out was considered good by most. But beyond that it was less useful and often changed significantly as events neared.
The nature of inaccuracy was more in the wind and rain detail than an event occurring. Temperature predictions were perceived to be fairly good. The rainfall forecast was good on predicting timing of events, but not so accurate on depths. The wind forecast was good at predicting direction but not so accurate on strengths.
The ten day regional text forecast was seen to provide a useful overall picture but was not better than other sources. The TV news and midday radio forecasts were helpful for the ‘big picture’ because they covered adjoining regions and growers could track larger scale movements.
The detailed forecasts were valued for specific decision making. Crop spraying decisions were most commonly noted as needing detailed information and the hour by hour HortPlus forecast was regarded as best for that.
Some users were happy with a daily forecast, others rechecked at intervals during the day for particular reasons. Access to the on-line information was seen by some as very useful.
Two distinct approaches are evident – users do or don’t go on-line. Those who do are usually seeking the most up to date information, maybe several times a day, or they want to find out about conditions away from their home station.
On-Line Use of MetWatch by Project Members
931
268
41
2215
85
3 32 2 2
1 0 0 0 01
10
100
1000
1 2 3 4 5 6 7 8 9 10 11 12 13 14 15 16 17
Individual
Accesses d
uri
ng
Pro
ject
(lo
g s
cale
)
Figure 1: Graph of On-Line MetWatch use by individual members of the Project Focus groups
showing extreme variation in number of accesses during the project, with a top usage of
931 accesses and a bottom of zero accesses.
. . . . . . .. . .
Page Bloomer Associates 14
www.pagebloomer.co.nz
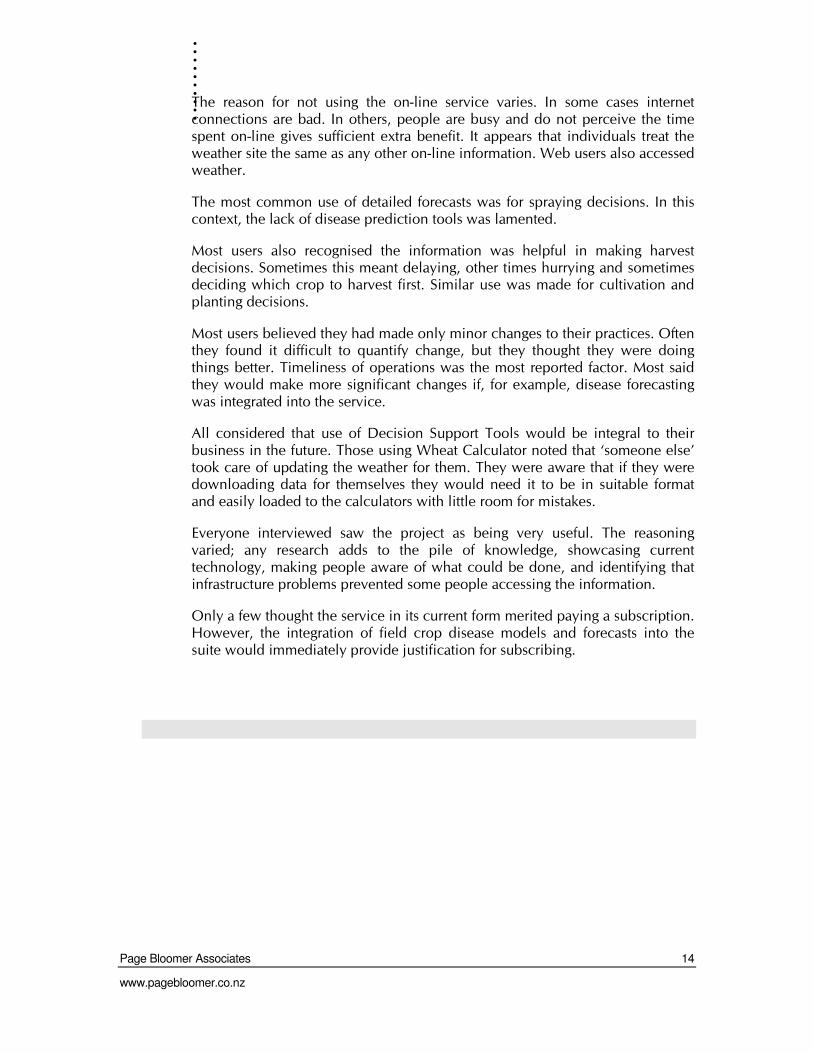
The reason for not using the on-line service varies. In some cases internet connections are bad. In others, people are busy and do not perceive the time spent on-line gives sufficient extra benefit. It appears that individuals treat the weather site the same as any other on-line information. Web users also accessed weather.
The most common use of detailed forecasts was for spraying decisions. In this context, the lack of disease prediction tools was lamented.
Most users also recognised the information was helpful in making harvest decisions. Sometimes this meant delaying, other times hurrying and sometimes deciding which crop to harvest first. Similar use was made for cultivation and planting decisions.
Most users believed they had made only minor changes to their practices. Often they found it difficult to quantify change, but they thought they were doing things better. Timeliness of operations was the most reported factor. Most said they would make more significant changes if, for example, disease forecasting was integrated into the service.
All considered that use of Decision Support Tools would be integral to their business in the future. Those using Wheat Calculator noted that ‘someone else’ took care of updating the weather for them. They were aware that if they were downloading data for themselves they would need it to be in suitable format and easily loaded to the calculators with little room for mistakes.
Everyone interviewed saw the project as being very useful. The reasoning varied; any research adds to the pile of knowledge, showcasing current technology, making people aware of what could be done, and identifying that infrastructure problems prevented some people accessing the information.
Only a few thought the service in its current form merited paying a subscription. However, the integration of field crop disease models and forecasts into the suite would immediately provide justification for subscribing.

Page Bloomer Associates 15
www.pagebloomer.co.nz
6.3. Application for decision support
The members of the focus groups were strongly supportive of development of predictive tools to enhance crop protection and for other management decision making purposes.
Several have been actively involved in the development of Wheat Calculator and similar tools. Some are making limited use of weather data to aid irrigation decisions.
Almost all were strongly supportive of the detailed hourly forecasts in assisting with spray application. Better knowledge of impending weather events – rain, dry, wind etc – allowed them to make better decisions regarding chemical type (mode of action) and to identify most appropriate spray windows.
The financial gain from using cheaper protectants was suggested sufficient to pay for the cost of obtaining the information. As such high priority should be placed on integrating suitable disease (and pest) models into the weather forecast service.
6.4. Application for environmental protection
The knowledge of wind speed and direction was seen as immensely valuable in directing work programmes. Managers were better able to plan spraying staff programmes, sending them to areas where weather conditions were likely to be suitable, or waiting until a weather gap saw suitable conditions on site. This was seen to reduce the risk of off-target impacts from spraying ‘to get the job done’.
. . . . . . .. . .
Page Bloomer Associates 16
www.pagebloomer.co.nz
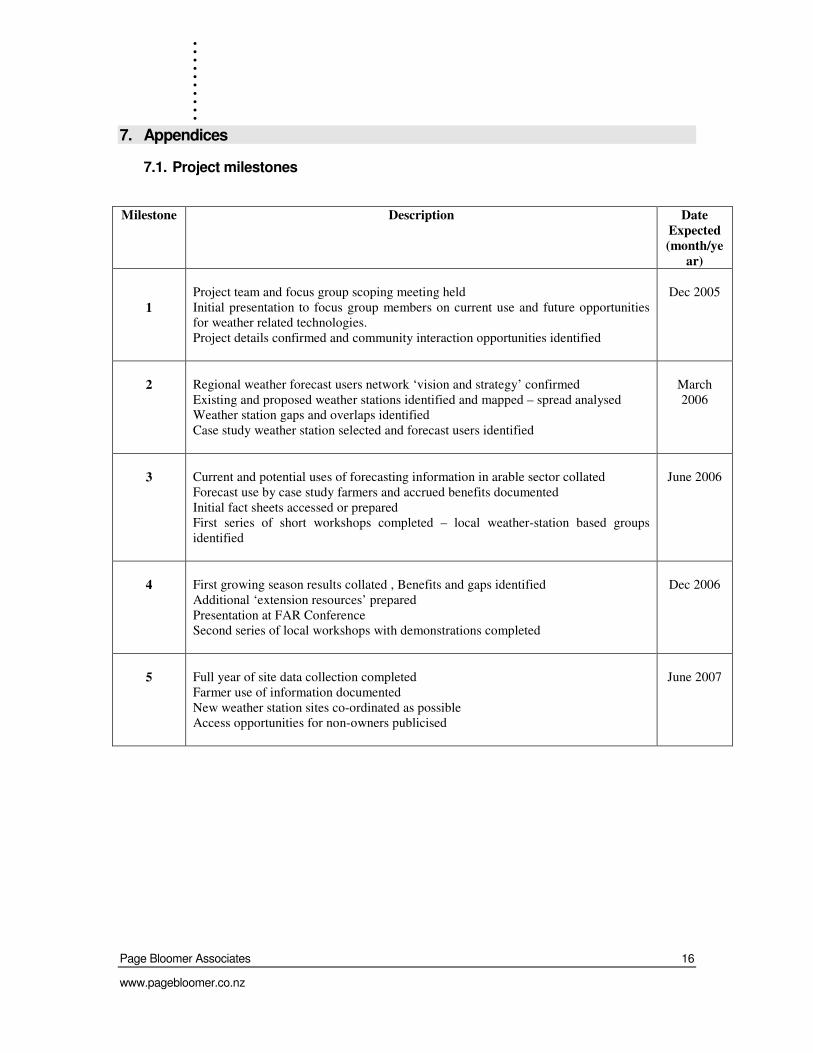
7. Appendices
7.1. Project milestones
Milestone Description Date
Expected
(month/ye
ar)
1
Project team and focus group scoping meeting held
Initial presentation to focus group members on current use and future opportunities
for weather related technologies.
Project details confirmed and community interaction opportunities identified
Dec 2005
2
Regional weather forecast users network ‘vision and strategy’ confirmed
Existing and proposed weather stations identified and mapped – spread analysed
Weather station gaps and overlaps identified
Case study weather station selected and forecast users identified
March
2006
3
Current and potential uses of forecasting information in arable sector collated
Forecast use by case study farmers and accrued benefits documented
Initial fact sheets accessed or prepared
First series of short workshops completed – local weather-station based groups
identified
June 2006
4
First growing season results collated , Benefits and gaps identified
Additional ‘extension resources’ prepared
Presentation at FAR Conference
Second series of local workshops with demonstrations completed
Dec 2006
5
Full year of site data collection completed
Farmer use of information documented
New weather station sites co-ordinated as possible
Access opportunities for non-owners publicised
June 2007

Page Bloomer Associates 17
www.pagebloomer.co.nz
7.2. Arable Relevant Weather Station Locations
Code Name/ Area E N M asl 1 CFR1 Pendarves 2428208 5702035 2 FAR 1 Methven 2398310 5729600 340 3 FAR 2 Chertsey 2426370 5712280 120 4 FAR 3 St Andrews 2365530 5629170 10 5 McC1 Wakanui 2413735 5691548 approx coord 6 McC2 Winchester 2375767 5664113 approx coord 7 McC3 Kerrytown 2365501 5658342 approx coord 8 NIWA1 Broadfield 2467278 5731298 18 9 NIWA2 Rakaia 2431378 5713112 124 10 NIWA3 Winchmore 2406771 5708044 11 NRFA01 Oamaru Aero 2358761 5580756 12 NRFA06 Burnham 2454100 5732464 13 NRFA07 Darfield 2441300 5745650 175 14 NRFA08 Christchurch Aero 2472269 5747203 15 NRFA18 Timaru Aero 2369031 5655083 16 NRFA21 Ashburton Plains 2409400 5700450 109 17 NRFA22 Leeston 2453744 5715786 18 Private1 Dorie 2438311 5698379 approx coord 19 Private2 Makikihi 2363734 5623757 approx coord 20 Private3 Studholme 2361697 5607131 approx coord 21 Web21 Burwood 2484587 5746490 10 22 Web23 Oamaru 2347700 5564374 65 23 xx05 Balmoral / Culverden 2490703 5821917 215
24 xx07 Tapanui / Nth Southland 2218020 5470521 200 25 xx08 Glenledi / Milton -Otago 2282628 5444483 140 26 xx09 Wreys Bush/ Sthland 2131646 5453226 110

. . . . . . .. . .
Page Bloomer Associates 18
www.pagebloomer.co.nz
7.3. Map of Arable Relevant Weather Stations

Page Bloomer Associates 19
www.pagebloomer.co.nz
7.4. National Rural Fire Association Standards
NRFA STANDARD 5-01
Weather Observations and Recording
Purpose: To monitor and record weather data for the Fire Weather Index (FWI) System and during fire incidents.
Contents:
Part A – User Requirement
Part B – Manufacturing and Installation Requirements
Part C – Inspection Record
Part D – Performance / Annual Calibration Record
Part A - User Requirement
A Remote Automated Weather Station (RAWS) monitors, records and transmits a range of weather observation data automatically and on demand.
Temperature, relative humidity, wind speed and direction and rainfall data are the observations which are collected to support the Fire Weather Index component of the New Zealand Fire Danger Rating System, a tool that allows Rural Fire Authorities to make accurate assessments of the fire danger.
A nation-wide network of RAWS exists to allow a Rural Fire Authority and the National Rural Fire Authority to monitor weather conditions in accordance with legislated responsibilities.
The RAWS sample and record data every hour, which can be used during an incident to get near-real time observations. At 12:00 NZST (1:00 NZDT) data is collected to provide daily Fire Weather Index figures.
The RAWS is located in an area where the microclimate covers an area a rural fire authority considers is at risk. The location of RAWS is to be approved by the regional Rural Fire Committee to ensure that there is both adequate coverage within a region and that multiple RAWS are not placed in the same microclimates.
The National Rural Fire Authority adds RAWS to the national network by (a) accepting voluntary offers of goodwill (b) through commercial contracts with organisations (such as the Metservice), and (c) offering subsidies to Rural Fire Authorities for RAWS purchase and upgrade). The only stipulations on RAWS owners are that the National Rural Fire Authority is able to access the data at any time and that the station is sited and maintained sufficiently to deliver quality data. A RAWS that fails to deliver regular, accurate data will be removed from the network until it is deemed to be fully operational.
Part B – Manufacturing and Installation Requirements
The sensors for temperature, relative humidity, wind speed and direction and rainfall shall be durable to ensure continuity of service and accurate to World Meteorological Organisation (WMO) Guidelines No.8
Major components should have an expected life span of at least 5 years depending on the environment. Some sensors can be replaced annually. All sensors shall be calibrated annually.

. . . . . . .. . .
Page Bloomer Associates 20
www.pagebloomer.co.nz
The RAWS shall have solar power, or another on site independent means of maintaining the battery condition to ensure continuity of power supply.
The RAWS shall be erected in a manner that allows for easy access to the sensors for maintenance and installed at a site that will allow service agents regular access.
The data logger installed must have good error detection, correction and a minimum of a 30 day data storage facility and be compatible with Campbell Scientific CR10 and Forest Technology Systems FWS11 protocols.
The RAWS must have access to a strong, stable data communications link to the owner, Rural Fire Authority and the National Rural Fire Authority
Part C – Inspection Record
Shall be inspected at least 3 monthly and in accordance with the manufacturers guidelines.
If required shall be serviced by competent, authorised personnel.
Reference NRFA publication: Remote Automatic Weather Stations - Guidelines for the Installation, Use and Maintenance for the NRFA Network
The fire authority must hold a record of the inspections carried out.
Part D – Performance / Annual Calibration Record
The RAWS owner and/or service agent should monitor the number of outages and the duration of outages to determine the reliability of a station and the performance of the service agent in responding to those outages. Such outages may include the failure of one or more sensors, the data logger, or the transmission equipment (modem and/or phone line).
Data should be monitored to detect failures. Total failures mean either an absence of entire records or an absence of one sensor’s value and are easy to detect. Partial failures are harder to detect but may show values obviously out of acceptable ranges. The gradual decay of a sensor is the hardest to detect and may only be obvious when compared with data from nearby stations or stations in a similar climatic region.
The RAWS shall be performance tested and calibrated as necessary in accordance with the manufacturers guidelines:
(a) On acceptance of delivery (new product)
(b) After any repairs
(c) A minimum of annually, preferably during August and September to have the station operating as accurately as possible over the summer.
Reference NRFA publications:
Service Level Agreement for The Maintenance of Remote Automatic Weather Station/s and the NRFA Remote Automatic Weather Station Network Calibration and Upgrade Policy
The fire authority must hold a record of the RAWS performance / annual calibration.

Page Bloomer Associates 21
www.pagebloomer.co.nz
7.5. HortPlus MetWatch daily forecast

. . . . . . .. . .
Page Bloomer Associates 22
www.pagebloomer.co.nz
7.6. Initial User survey
7.6.1. Initial Survey Template

Page Bloomer Associates 23
www.pagebloomer.co.nz

. . . . . . .. . .
Page Bloomer Associates 24
www.pagebloomer.co.nz

Page Bloomer Associates 25
www.pagebloomer.co.nz
7.6.2. Responses to Initial Survey
1. Importance of Forecasts
Of the seven respondents, one considered weather forecasting ‘critically important’ and the rest ‘very important’ for farm management. Half of the group check forecasts daily, one quarter twice daily, and the others several times.
Spring and summer were predominantly named as the critical periods, with other periods noted being particular to the produce of the farm such as lambing, planting or harvesting.
Forecast information is used for work planning including planting, irrigation, fertilisation and harvest and also for protection from adverse weather such as frost.
2. Frequency of Forecasts
Half of the respondents check weather forecasts several times a day at critical times. One checks twice daily and the others daily. All respondents gave the same answer for how often they do check as how often they would like to access forecasts.
At non-critical times there is an even split between daily checkers and twice dailies, and only one who checks every few days. Responses to how often access was wanted was generally the same as actual use.
3. Data Sought
All but one respondent sought rain information, half were interested in maximum and minimum air temperatures, all wanted wind speed and direction. Humidity is important to most of the group, while solar radiation is of interest to only 3 respondents.
Most farmers measure their rainfall, max and min temperatures and humidity. Less than half measure wind speed or direction and solar radiation. Rainfall is recorded by all but one respondent. Record keeping for the other factors is only done by 3 respondents.
Soil moisture and temperature, leaf wetness and disease pressure are consistently required by this group. Ground temperature and pest pressure rated for about half of them.

. . . . . . .. . .
Page Bloomer Associates 26
www.pagebloomer.co.nz
Soil temperature and disease pressure are the most highly sought related data (6/7), followed closely by soil moisture, leaf wetness and pest pressure. Ground temperature is only wanted by three of the farmers.
Few are measuring all that they are seeking and even less are recording it.
4. Usefulness of Forecasts
Order of preference for sources of weather forecast is: TV, radio and internet second equal, newspaper, Metphone (only one user). None use teletext or a subscriber service.
TV1 was selected by 3 respondents and TV3 by 1. 6 o'clock is the preferred time. National Radio is the most favoured station with morning shown as more useful than lunchtime.
All but two respondents access the internet for weather, three using MetService, and one each for ATS, TVNZ, Crop & Food and HortPlus. Users rated these highly - as essential or very useful.

Page Bloomer Associates 27
www.pagebloomer.co.nz
7.7. Final User Surveys
7.7.1. Email Survey Template This was ‘informal’ – an email with no leading questions sought quick responses.
As we near the end of the trial period for the Detailed Weather Forecast project, it is time to seek your views about the service provided and its potential as a tool for farmers.
We would like to send you a formal survey, and to speak with a few of you later, but first, I’m very keen that you just respond off the top of your head.
So, please, reply to this with whatever comments you have about your experiences with HortPlus Metwatch Daily Reports and the Online System.
A small number of growers replied (as with the first written mail survey at the start of the project). Further emails were exchanged with respondents, clarifying points raised.
Of those who did not reply, later communications with some indicated they were “sorry but just too busy”.
7.7.2. Responses to email survey Responses varied from “not much use” to “excellent tool”. In part this seems to be locality related, and in part it reflects early experiences and possibly attitude to new technologies.
One grower felt the service was no better than other options and believed it to be highly inaccurate.
Although quite fun to receive a daily forecast for Methven I do not think it is any more useful than the general forecast we can obtain free. I did find earlier in the summer the accuracy of the forecasts was bad. One particular day we were forecast 80mm of rain where everyone else was saying 4mm. When I rang to question it I was told they were confident 80mm was correct. It turned out that you had the wrong grid reference for Methven and it was stuck up in the hills.
This response related to the initial incorrect grid reference given for the Methven station which resulted incorrect forecasts. It seems correcting this was not acknowledged, and perhaps the service was written off at this early stage.
Other growers were enthusiastic:
Love getting daily weather forecast for our area. Great job thanks!

. . . . . . .. . .
Page Bloomer Associates 28
www.pagebloomer.co.nz
And
Very useful - Surprisingly accurate for predicting the area the weather station is in. eg the Chertsey Mid Canterbury area.
Found it very useful when planning ground vehicle boom spraying program, eg wind speed forecast. Good for planning harvest.
I would guess a diameter of 12 - 15 kilometres from the weather station is accurate for rainfall, but north and south probably more accurate for a greater distance, where as east and west probably 10 kilometres would be max on accuracy for rainfall data.
Another grower indicated usefulness despite ‘inaccuracy’.
The service is proving very useful tool for making decisions on spraying and harvesting. Although St Andrews is not accurate as to winds, temperature and amount of rain, more often than not it does forecast the event is going to happen which is a great help.
The lack of ‘add-on tools’ for arable diseases was noted by a grower who was positive about the service.
The online system is better than the Daily reports. More info mainly.
Good layout and helpful.
Been superseded by Met service rural to some extent ie no Chertsey/Ashburton site with met service
No Disease prediction for arable crops or vegetable crop grown for seed. This would potentially be the big advantage with Hortplus.
Timing of updates incorrect 7am Noon 7pm and Midnight would be better timing.

Page Bloomer Associates 29
www.pagebloomer.co.nz
7.7.3. Telephone Survey Template
Which is your base FAR weather station?
How far are you from the FAR weather stations?
Are there other weather stations in your area?
What information are they collecting?
Is this information available?
What are your most common/used sources of weather information?
Now specific to MetWatch.
Have you found the forecasts to be useful?
How often do you refer to the daily forecasts?
Can you tell me about the usefulness of detailed localised forecast (the hour by hour information) v’s the less detailed regional text forecasts?
How accurate do you think the weather forecasts are?
Have you found the on-line information to be useful?
Which parts of the on-line information have you used?
How often do you refer to the on-line information?
Which parts of the on-line information do you find most helpful?
Management Decision Making
For which decisions do you think about looking up the forecast?
For which decisions do you think about looking up recent weather station information?
Have you changed any of your practices based on routine access to forecasts?
Have you changed any of your practices based on access to recent weather station information?
Do you use any decision support tools?
How do you see Decision Support tools in the future of your business?
What type of weather information do you think is needed to feed the decision support tools?
Would you pay for the subscription service?
Are there any other comments you would like to make?
Was the project useful?

. . . . . . .. . .
Page Bloomer Associates 30
www.pagebloomer.co.nz
7.7.4. Summary of responses
Weather information
Most common/used sources of weather information
Most weather information users are seeking predictions and use multiple sources plus personal interpretation. There is some use of, but little emphasis on, access to historic weather data.
“I already know what happened!”
Forecasts
The key points are that people are using multiple sources and applying their own interpretations to whichever forecasts they receive. Experience has taught them how to refine the general and more detailed information available to calibrate to their own site(s).
Most people use TV (6pm) to get a general picture of weather at broad scale.
“The visual presentation is very helpful. It does give a good overall picture”.
Many use local newspapers for more detailed local information. Some papers are providing additional information such as PET and soil temperatures.
A proportion of growers use a number of other on-line sources. Two users in particular draw data regularly from a number of sites and constantly seek more sources.
METVUE is suggested as best for longer term indications. The MetService Rural site is suggested as a newer free alternative to HortPlus MetWatch, though 3 hour chunking is limited for some applications. The HortPlus service is identified as being the best for detailed decisions such as identifying spray window opportunities.
Some growers have very poor internet access, and this generally excludes them from accessing this type of information. Cellular text messaging with key information is suggested as a prime potential method of presenting weather information; the corollary being that subscribers could then access more detailed information on-line is warranted.
Weather Records
Several growers use wheat calculator and receive updated historic weather from Crop & Food as part of that. One noted that recent historic data can be helpful for irrigation scheduling decisions. Most farmers suggest that the utility of historic information for their farming operations is limited at present.
The process factory noted the use of recent historic data for disease modelling blight. Data for this is accessed from their own stations. A grower accessible

Page Bloomer Associates 31
www.pagebloomer.co.nz
disease predictor is seen as extremely valuable, but would need to have capability for paddock specific calculations.
HortPlus MetWatch Forecasts
Usefulness
All but one person found the forecasts very useful. The one who did not, discussed needing to learn to trust it.
He did think the forecast was the best for wind prediction, a lot closer than TV or radio. A self-described pilot, he uses a barometer as a key indicator especially for wind. He also noted that this year the MetWatch wind forecast had been right when the barometer indicated otherwise.
Like others, he found the rainfall forecast was good on predicting timing of events, but not so accurate on depths.
“Last week it predicted occasional scattered showers, but we got 30mm”.
Those finding the forecasts useful noted application for assisting with planning work operations.
“It lets me ‘semi-plan’ ahead for the week. I have to refine it each day”
“The wind prediction is useful, it tells me whether to send the guys north or south to spray first”
“When we were busy at harvest, with several crops almost ready, I could see I might as well continue with the onions and leave the cereals to dry for a few more days.”
Accuracy
Users were generally satisfied with the apparent accuracy of forecasts. Some suggested it was the most accurate they had experienced. Others thought it still somewhat unreliable.
“I was really surprised at the accuracy of the Chertsey forecast. It was very good, and I didn’t think it would be. The accuracy extends further north-south (15-20km) than it does east-west (8-12km).”
“It’s not as accurate as I’d hoped. Especially the wind, but we’re quite a way from the weather station and it’s probably right for there.”
Most noted forecasts were not particularly reliable more than a couple of days ahead. They also commented on the fact that predictions changed as events got closer.

. . . . . . .. . .
Page Bloomer Associates 32
www.pagebloomer.co.nz
“I’d say 48 hours or more out the accuracy is questionable but it gives a guide.”
Overall the prediction one to two days out was considered good by most.
The nature of inaccuracy was more in the wind and rain detail than an event occurring. Events occurred, but to a greater or lesser extend than indicated. Temperature predictions were perceived to be fairly good.
“There isn’t one thing that’s always wrong. It might be the wind direction today, the amount of rain tomorrow.”
“Sometimes everything is spot on. Sometimes the wind will be wrong or the rain will be wrong. There is no one thing that is bad.”
Users felt that most times a rain event was predicted it would occur sometime within an hour or two of the predicted time. However, the depth of rain received could be quite different.
“Last week it predicted occasional scattered showers, but we got 30mm”.
“It said there would be 6mm of rain so I put on a rain activated herbicide and there wasn’t even enough to make the concrete wet.”
Growers nearer the hills thought rainfall difficult to predict in their districts because of geographic influences, especially for certain wind directions.
“In our area there is a kind of weather division – the rain may go out to sea or go inland along the hills.”
Similarly, for many users, the wind direction tended to be correct, but the strength may vary.
“If it says we’re going to get a nor’wester we will, but the strength can be wrong.”
Local differences were evident and seen to have significant effect further from the base station site.
“We’re about 15 km from the station at Methven and the Rakaia Gorge has a big effect. The wind funnels down the gorge – some mornings we can have early wind too strong for spraying, but it drops away later, but the Methven site doesn’t pick that up.”
The inaccuracy of wind strength forecasting was not always seen as problematic.
Page Bloomer Associates 33
www.pagebloomer.co.nz
“I found that if it’s predicting wind over 10km/h, there is not going to be much of a chance for spraying, and that was pretty reliable.”
Detailed local v’s general regional
The ten day regional text forecast was seen to provide a useful overall picture. However, it was not seen as better than any other forecast, and perhaps less useful than some. The TV news and midday radio forecasts were helpful for the ‘big picture’ because they covered adjoining regions and growers could track larger scale movements.
“The TV presentation is very good. At St Andrews we need to see both Otago and Canterbury to make sense of things and TV is good for that.”
The detailed forecasts were valued for specific decision making. Some users were happy with a daily forecast, others rechecked at intervals during the day for particular reasons. Crop spraying decisions were most commonly noted as needing detailed information and the hour by hour HortPlus forecast was regarded as best for that. Access to the on-line information was seen by some as very useful.
“If there is a weather feature predicted – maybe a front moving over the island – I can keep an eye on its progress by going on-line”
Others suggested once a day planning was sufficient. They typically made little or no use of the on-line access.
“If I tried to adjust plans every couple of hours, nothing would ever get done!”
The time of updating of the forecasts was raised. Several people did not realise they could specify what time they received forecasts. One person noted that the timing of forecast updates needs to be publicised so people know what to expect.
“I get my forecast at 6.30am, and my neighbour gets his at 7.30am. The difference in the two can be very significant. I didn’t realise it changed at 7 o’clock.”
On-line information
Two distinct approaches are evident – users do or don’t go on-line. Those who do are usually seeking the most up to date information, maybe several times a day, or they want to find out about conditions away from their home station.

. . . . . . .. . .
Page Bloomer Associates 34
www.pagebloomer.co.nz
“The on-line part is the best bit! Especially the access to maps, give you the general trends eg at harvest time I could see there was a period of changing systems – I could tell it wasn’t going to settle into good or bad. There was going to be a series of events passing through.”
“I don’t much look at the email, as by the time I get it I’ve already been on-line to check everything out. I’d like the updating to be a little earlier than 7am.”
“We operate in several districts, so I want to know what is happening at the other places too. My forecast only tells me about one place.”
“It can be quite good for when I’m going hunting . . . “
The reason for not using the on-line service varies. In some cases internet connections are bad. In others, people are busy and do not perceive the time spent on-line gives sufficient extra benefit.
“I tried using the on-line site early in the project, but it was hopeless. The connection kept cutting out, and I’d wait for hours to get anything.”
“I’ve used it a bit, especially now I’ve got satellite broadband. It’s a good back up to the morning email, especially when a front is coming through.”
“I’ve never really looked at the on-line stuff. My wife prints off the email forecast and I grab that for the day.”
Management Decision Making
Decisions that use weather information
The most common use of detailed forecasts was for spraying decisions. In this context, the lack of disease prediction tools was lamented.
“We contract spray, and the forecasts let me tell the drivers whether to head north or south first thing each day”
“The forecast format is good – very easy to understand. For spraying decisions, if it says the wind will drop off at three, it usually will within an hour or two either side of that.”
“We do some disease modelling and the forecast helps decide whether to use a cheap protectant or an expensive eradicant. Ideally the disease models and the forecasts would be integrated – that would be a real help for farmers.”
“It helps us plan our spraying a couple of days out, which helps when we’re busy.”

Page Bloomer Associates 35
www.pagebloomer.co.nz
Most users also recognised the information was helpful in making harvest decisions. Sometimes this meant delaying, other times hurrying and sometimes deciding which crop to harvest first.
“We were busy harvesting onions and worrying about the grains. The forecast showed there was little chance of rain but little chance of further drying either, so we carried on and got the onions in.”
For factory supply management the forecasts helped decide whether to stockpile some extra if an event is predicted.
Several users also noted that cultivation and planting decisions were better especially when conditions were marginal.
“I could see that it wasn’t going to rain so I could wait another day or so”
“It helps me decide urgency of planting and cultivation. Do I need to jump in now or shall I put it off for a few days?”
Changes to practice
Most users believed they had made only minor changes to their practices. Often they found it difficult to quantify change, but they thought they were doing things better. Timeliness of operations was the most reported factor.
“Mainly I think it’s just made it easier, taking some of the guess work out of when to do things. We get a better lead time, so we can make better decisions.”
Most said they would make more significant changes if, for example, disease forecasting was integrated into the service.
“I’m sure I make changes if we had blight models - it would be very useful. We could target cover much better in spring.”
Use with Decision Support Tools
Several farmers have been involved with Wheat Calculator and similar Decision Support Tools. Many have not used such tools themselves yet. All considered that use of Decision Support Tools would be integral to their business in the future.
Those using Wheat Calculator noted that ‘someone else’ took care of updating the weather for them. They were aware that if they were downloading data for themselves they would need it to be in suitable format and easily loaded to the calculators with little room for mistakes.
“I can see we’re going to have to use these things. We’ll have to use them once nitrogen use gets more regulated, won’t we?”

. . . . . . .. . .
Page Bloomer Associates 36
www.pagebloomer.co.nz
“We really need disease predictors. The amount of money we could save there would easily cover the cost of the weather forecasts.”
Would you pay for the service?
“No.”
“Yes.”
“It’s hard to put a dollar value on it. AS it is, I think I can get most of the information elsewhere. With diseases built in I think it would easily pay for the subscription.”
“As it is , no. There are better returns on $800. Maybe it’s worth $100 - $200 as it is. With diseases it would be worth it.”
“Through the main activity period, spring through autumn I probably would, but I’m not too sure how much.”
“If it had the ability to have paddock specific disease prediction it would be very easy to justify the cost.”
“I’d really like to have good blight prediction on it; then I’d pay. The preventative programme we use for cereals is working ok for now.”
Project Usefulness Everyone interviewed saw the project as being very useful. The reasoning varied, in some cases acknowledging that any research adds to the pile of knowledge. More specific benefits include showcasing current technology, making people aware of what could be done, and even identifying that infrastructure problems prevented some people accessing the information.
“It’s made a real difference to us. We have much less lost work time with our spraying. That is a direct financial benefit to us.”
“This sort of information is really important and we’re going to need it more to feed the tools. You’d never have got people on board if you hadn’t done it.”
“It’s been a very interesting project from my point of view. And a direct benefit to us was getting a more localised forecast we can use – it’s taken some of the guess work out.”
“If nothing else, it shows not all of us can access information. And maybe we need a more relevant site than is currently available.”
“It has definitely been a very useful project. It really showed just what is now possible. And what still needs to be done.”
“It’s given us an idea of what’s out there. If they can do that stuff for apples, we should be able to do it for vegetables and other crops too.”

Page Bloomer Associates 37
www.pagebloomer.co.nz
Where to for FAR? “I think using levy money to have this on the FAR site would be good. People often ask what they get for their levy, and this would be a very visible example.”
“It would be best if the forecast came as a text message with key information presented on four lines. If needed, people go on-line to get more.”
“We need to get the disease models up and running.”
“Disease models would add more value than anything – ‘TomCast’ was developed for tomatoes but apparently works well for Alternaria in carrots”
“Need to link the package with the crop models and the disease prediction programmes.”
“We need more stations in the network - there’s a hole in the info around Timaru.”
“It would be good to get a weather station at Wakanui, maybe one half way between Methven and Rakaia, one in from Fairton.”

. . . . . . .. . .
Page Bloomer Associates 38
www.pagebloomer.co.nz
7.8. Project Team
Project Managers Foundation for Arable Research
Jacqui Johnstone, Tabitha Armour, David Geary, Nick Pyke, Nick Poole
Focus Groups Chertsey
Bede McCloy Anton Nicholls Dean Pye John Jackson John Evans
Methven Dave Grant Mark Robinson Craige Mackenzie Ian Maw David Wright John Wright James Halford
St Andrews Rob McIlraith Colin Hurst Ross Rathgen Gary Johnston Nick Porter
Technical Providers HortPlus
Trevor Atkins, Andrew Hodson
MetService
Scott Technical Blair Millar, Lawrie Hoare
Project Consultants Page Bloomer Associates
Dan Bloomer, Phillipa Page

Page Bloomer Associates 39
www.pagebloomer.co.nz
7.9. Additional Resources
A series of handouts on weather recording and interpretation are presented. These are strongly based on material prepared under an earlier MAF SFF Project; Research to Practice: Weather recording and interpretation for fruit industries. This project was lead by David Manktelow of HortResearch and Alan Porteous of NIWA. Some of the handouts have been updated, others completed and some adapted to have more relevance to the field cropping sectors.
7.9.1. List of Titles
Weather Monitoring
1 Hardware 2 Temperature 3 Surface wetness 4 Humidity 5 Light 6 Wind
Weather and Climate Scales
1 MacroClimate 2 MicroClimate
Weather Forecasting
1 Weather forecasts and microclimate 2 Weather v’s Climate Forecasts 3 Reading a Weather Map
Other Information
1 Measuring Chilling units 2 Measuring Heat Units 3 Weather and Disease