Embed Size (px)
DESCRIPTION
adas
Citation preview

IT – 3301
Lecture 4
This session…
• Project teams, lets talk about the projects
• Attendance
• Chapters 6 in Wysocki
• Introduction to Gantter http://gantter.com/

Project ideas
1 Build a computer
2 Build a web site
3 Start a small company/restaurant

Project Deliverables
Project Objective Statement
WBS
Schedule
Cost estimates
Performance measurement baselines
Major milestones and target dates
Key staff (and expected costs)
Risk management plan

Project Objective Statement
The POS captures key objectives of the project, such as the Conditions of Satisfaction (COS)
It should be a short document (1-2 pp)
The COS should convey what the project is expected to deliver and accomplish
It should be reviewed and updated throughout the project – it isn’t static
It is negotiated with the customer

WBS Review (1st approach)

WBS Review (2nd approach)

Network View
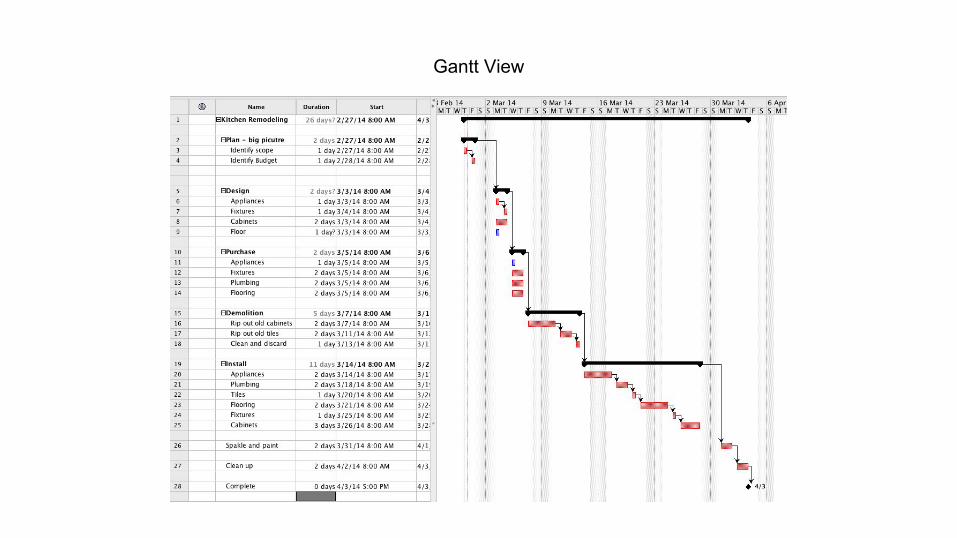
Gantt View
Chapter 6 - Constructing and Analyzing the Project Network Diagram
Chapter 6 objectives (* note - good source for study guide ;-)
1. Construct a network representation of the project activities.
2. Understand the four types of activity dependencies and when they are used.
3. Recognize the types of constraints to create activity sequences.
4. Compute the earliest start, earliest finish, latest start, latest finish times for every activity in the network.
5. Understand lag variables and their uses. Identify critical path and the project.
6. Define free slack and total slack and know their significance.
7. Analyze the network for possible schedule compression.
8. Use advanced network dependency relationships for improving improving project schedule.
9. Understand and apply management reserve.
10. Use the critical path for planning implementation in control of the project activities.

Chapter 6 - Constructing and Analyzing the Project Network Diagram
The project network diagram.
• Envisioning a complex project network diagram.
Chapter 6 - Constructing and Analyzing the Project Network Diagram
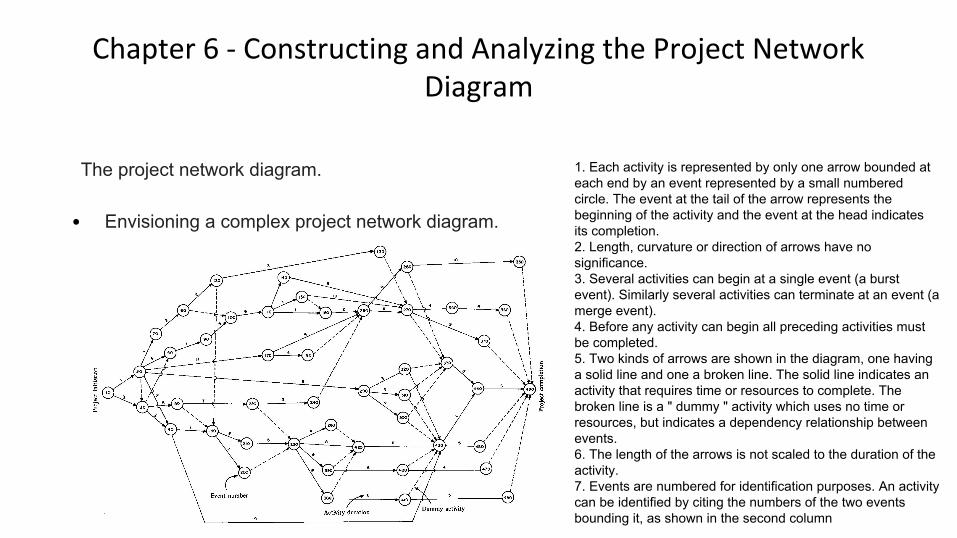
The project network diagram.
• Envisioning a complex project network diagram.
1. Each activity is represented by only one arrow bounded at each end by an event represented by a small numbered circle. The event at the tail of the arrow represents the beginning of the activity and the event at the head indicates its completion.2. Length, curvature or direction of arrows have no significance.3. Several activities can begin at a single event (a burst event). Similarly several activities can terminate at an event (a merge event).4. Before any activity can begin all preceding activities must be completed.5. Two kinds of arrows are shown in the diagram, one having a solid line and one a broken line. The solid line indicates an activity that requires time or resources to complete. The broken line is a " dummy " activity which uses no time or resources, but indicates a dependency relationship between events.6. The length of the arrows is not scaled to the duration of the activity.7. Events are numbered for identification purposes. An activity can be identified by citing the numbers of the two events bounding it, as shown in the second column

Chapter 6 - Constructing and Analyzing the Project Network Diagram
The project network diagram.
• Benefits to network-based scheduling.

Chapter 6 - Constructing and Analyzing the Project Network Diagram
Building the network diagram using the precedence diagramming method .
• Dependencies.
• Constraints.
• Using the lag variable.
• Creating an initial project Network schedule.
• Analyzing the initial project network diagram.
• Compressing the schedule.
• Managing reserve.

Chapter 6 - Constructing and Analyzing the Project Network Diagram

Chapter 6 - Constructing and Analyzing the Project Network Diagram

Chapter 6 - Constructing and Analyzing the Project Network Diagram

Chapter 6 - Constructing and Analyzing the Project Network Diagram

Chapter 6 - Constructing and Analyzing the Project Network Diagram
Exercise:
Using the JPP session to construct and analyze a network diagram for your project.