Embed Size (px)
Citation preview

Sexually Transmitted Disease
Morbidity Report
2012
600 South Commonwealth Avenue, 10th Floor
Los Angeles, CA 90005
Tel: (213) 351-8001 Fax: (213) 387-0912
http://publichealth.lacounty.gov/dhsp

JONATHAN E. FIELDING, MD, MPH Director and Health Officer CYNTHIA A. HARDING, MPH Chief Deputy Director Division of HIV and STD Programs Mario J. Pérez, Director 600 South Commonwealth Avenue, 10th Floor Los Angeles, California 90005 TEL (213) 351-8001 FAX (213) 387-0912 www.publichealth.lacounty.gov/dhsp
June 2014 Dear Colleague: We are pleased to release the Los Angeles County (LAC) 2012 Sexually Transmitted Disease Morbidity Report. This report offers a summary of sexually transmitted disease (STD) morbidity, trends and patterns, and provides comprehensive updates on reportable STDs in Los Angeles County. The report includes two sections. The first section represents an overall Los Angeles County Summary and is designed to provide a broader picture of STD trends countywide. The second section (addendum) focuses on morbidity and trends within each of the eight LAC Service Planning Areas. Both sections are organized in a similar manner with summary sections followed by sections on chlamydia (CT), gonorrhea (GC), syphilis, and pelvic inflammatory disease (PID). The following are data highlights associated with this report: A total of 63,232 STDs were reported in LAC in 2012, 77% of which were CT, 18% were GC, and 5%
were syphilis, representing an increase of 16% since 2008. There were also 6 cases of congenital syphilis and 226 cases of PID reported during 2012 (Figure 1.1).
In the five years leading up to 2012, rates of reported CT infection rose 18%, from 441 to 521 cases per
100,000 persons. During the same period, GC rates increased 45%, from 84 to 122 cases per 100,000 persons (Table 1.2).
Rates of primary and secondary (P&S) syphilis fell steadily from 2008 to 2010 (7.3 to 6.5 per 100,000),
before increasing again in 2011 (8.1 per 100,000) and 2012 (9.4 per 100,000). Meanwhile, early latent syphilis rates increased steadily from 2008 to 2012, from 7.9 to 13.7 per 100,000 persons, representing an increase of 73% (Table 1.2).
Among males in LAC, the highest rates of CT and GC were found among African Americans age 20-29
years, and the highest rates of P&S syphilis were found among African Americans, age 25-29 years (Table 1.3).
Among females in LAC, the highest number of CT cases was found among Latinas, age 20-24 years,
while the highest number of GC cases was seen among African Americans age 15-24 years. Rates of both CT and GC were highest among African Americans age 15-24 years (Table 1.4).
In 2012, LAC annual rates of CT were 16% higher, GC rates were 38% higher, P&S syphilis rates were
21% higher, and early latent syphilis rates were 108% higher than California statewide rates (Figures 2.1, 3.1, 4.1, and 5.1).
BOARD OF SUPERVISORS
Gloria Molina First District Mark Ridley-Thomas Second District Zev Yaroslavsky Third District Don Knabe Fourth District Michael D. Antonovich Fifth District


The Sexually Transmitted Disease Morbidity Report is published on an annual basis by the Los Angeles County Department of Public Health’s Division of HIV and STD Programs. This report is also available in PDF format at http://publichealth.lacounty.gov/dhsp.
SUGGESTED CITATION
Division of HIV and STD Programs Los Angeles County Department of Public Health.
2012 Sexually Transmitted Disease Morbidity Report.
Department of Public Health
Jonathan E. Fielding, M.D., M.P.H. Director and Health Officer
Cynthia A. Harding, M.P.H.
Chief Deputy Director
~
Division of HIV and STD Programs
Mario J. Pérez, Director
Clinical Services
Monica Muñoz
Epidemiology and Surveillance Michael Chien
Field Operations
Frank Ramirez
Information Systems and Data Management Kai-Jen Cheng, M.S. Zhiwei (Waley) Zeng
Adolescent and School Health
Christine J. De Rosa, Ph.D.
REPORT PREPARED BY: Zhiwei (Waley) Zeng

Sexually Transmitted Disease Morbidity Report – 2012
i
CONTENTS ____________________________________________________________________________
I. Summary
Table 1.1
Surveillance Summary of Sexually Transmitted Diseases Reported to the Los Angeles County Division of HIV and STD Programs, 2012
1
Table 1.2 Trend of Chlamydia, Gonorrhea, Syphilis and PID Reported for Los Angeles County Residents, 2008-2012
2
Figure 1.1 Distribution of Reported Sexually Transmitted Diseases in Los Angeles County, 2012.
3
● Among Males
Table 1.3
Surveillance Summary of Chlamydia, Gonorrhea and Early Syphilis Reported to the Los Angeles County Division of HIV and STD Programs, By Race/Ethnicity and Age Group among Males, 2012
4
Figure 1.2 Reported Chlamydia Rates per 100,000 Population Among Males in Los Angeles County, by Age Group and Race/Ethnicity, 2012
5
Figure 1.3 Reported Chlamydia Cases Among Males in Los Angeles County, by Age Group and Race/Ethnicity, 2012
6
Figure 1.4 Reported Gonorrhea Rates per 100,000 Population Among Males in Los Angeles County, by Age Group and Race/Ethnicity, 2012
7
Figure 1.5 Reported Gonorrhea Cases Among Males in Los Angeles County, by Age Group and Race/Ethnicity, 2012
8
Figure 1.6 Reported Early Syphilis Rates per 100,000 Population Among Males in Los Angeles County, by Age Group and Race/Ethnicity, 2012
9
Figure 1.7 Reported Early Syphilis Cases Among Males in Los Angeles County, by Age Group and Race/Ethnicity, 2012
10
● Among Females
Table 1.4
Surveillance Summary of Chlamydia, Gonorrhea and Early Syphilis Reported to the Los Angeles County HIV and STD Programs, By Race/Ethnicity and Age Group among Females, 2012
11
Figure 1.8 Reported Chlamydia Rates per 100,000 Population Among Females in Los Angeles County, by Age Group and Race/Ethnicity, 2012
12
Figure 1.9 Reported Chlamydia Cases Among Females in Los Angeles County, by Age Group and Race/Ethnicity, 2012
13
Figure 1.10 Reported Gonorrhea Rates per 100,000 Population Among Females in Los Angeles County, by Age Group and Race/Ethnicity, 2012
14
Figure 1.11 Reported Gonorrhea Cases Among Females in Los Angeles County, by Age Group and Race/Ethnicity, 2012
15

Sexually Transmitted Disease Morbidity Report – 2012
ii
Figure 1.12 Reported Early Syphilis Rates per 100,000 Population Among Females in Los Angeles County, by Age Group and Race/Ethnicity, 2012
16
Figure 1.13 Reported Early Syphilis Cases Among Females in Los Angeles County, by Age Group and Race/Ethnicity, 2012
17
II. Chlamydia
● National, State and County Comparisons
Figure 2.1 Reported Chlamydia Rates per 100,000 Population by Year, United States, California, and Los Angeles County (LAC), 2008-2012
18
● By Age
Table 2.1 Reported Chlamydia Cases and Rates per 100,000 Population by Age Group, Los Angeles County, 2008-2012
19
Figure 2.2 Reported Chlamydia Rates per 100,000 in Los Angeles County, by Age Group, 2012
20
● By Gender
Table 2.2 Reported Chlamydia Cases and Rates per 100,000 Population by Gender and Age Group, Los Angeles County, 2008-2012
21
Figure 2.3 Reported Chlamydia Rates per 100,000 Population in Los Angeles County, by Gender and Year
22
Figure 2.4 Reported Chlamydia Rates per 100,000 Population in Los Angeles County, by Gender and Age Group, 2012
23
● By Race/Ethnicity Table 2.3 Reported Chlamydia Cases and Rates per 100,000 Population by
Gender and Race/Ethnicity, Los Angeles County, 2008-2012 24
Figure 2.5 Reported Chlamydia Rates per 100,000 Population in Los Angeles County, by Gender and Race/Ethnicity, 2012
25
III. Gonorrhea
● National, State and County Comparisons
Figure 3.1 Reported Gonorrhea Rates per 100,000 Population by Year, United States, California, and Los Angeles County (LAC), 2008-2012
26
● By Age
Table 3.1 Reported Gonorrhea Cases and Rates per 100,000 Population by Age Group, Los Angeles County, 2008-2012
27
Figure 3.2 Reported Gonorrhea Rates per 100,000 in Los Angeles County, by Age Group, 2012
28

Sexually Transmitted Disease Morbidity Report – 2012
iii
● By Gender
Table 3.2 Reported Gonorrhea Cases and Rates per 100,000 Population by Gender and Age Group, Los Angeles County, 2008-2012
29
Figure 3.3 Reported Gonorrhea Rates per 100,000 Population in Los Angeles County, by Gender and Year
30
Figure 3.4 Reported Gonorrhea Rates per 100,000 Population in Los Angeles County, by Gender and Age Group, 2012
31
● By Race/Ethnicity
Table 3.3 Reported Gonorrhea Cases and Rates per 100,000 Population by Gender and Race/Ethnicity, Los Angeles County, 2008-2012
32
Figure 3.5 Reported Gonorrhea Rates per 100,000 Population in Los Angeles County, by Gender and Race/Ethnicity, 2012
33
IV. Primary and Secondary Syphilis
● National, State and County Comparisons
Figure 4.1 Reported Primary and Secondary Syphilis Rates per 100,000 Population by Year, United States, California, and Los Angeles County (LAC), 2008-2012
34
● By Age
Table 4.1 Reported Primary and Secondary Syphilis Cases and Rates per 100,000 Population by Age Group, Los Angeles County, 2008-2012
35
Figure 4.2 Reported Primary and Secondary Syphilis Rates per 100,000 in Los Angeles County, by Age Group, 2012
36
● By Gender
Table 4.2 Reported Primary and Secondary Syphilis Cases and Rates per 100,000 Population by Gender and Age Group, Los Angeles County, 2008-2012
37
Figure 4.3 Reported Primary and Secondary Syphilis Rates per 100,000 Population in Los Angeles County, by Gender and Year
38
Figure 4.4 Reported Primary and Secondary Syphilis Rates per 100,000 Population in Los Angeles County, by Gender and Age Group, 2012
39
● By Race/Ethnicity
Table 4.3 Reported Primary and Secondary Syphilis Cases and Rates per 100,000 Population by Gender and Race/Ethnicity, Los Angeles County, 2008-2012
40
Figure 4.5 Reported Primary and Secondary Syphilis Rates per 100,000 Population in Los Angeles County, by Gender and Race/Ethnicity, 2012
41

Sexually Transmitted Disease Morbidity Report – 2012
iv
V. Early Latent Syphilis
● National, State and County Comparisons
Figure 5.1 Reported Early Latent Syphilis Rates per 100,000 Population by Year, United States, California, and Los Angeles County (LAC), 2008-2012
42
● By Age
Table 5.1 Reported Early Latent Syphilis Cases and Rates per 100,000 Population by Age Group, Los Angeles County, 2008-2012
43
Figure 5.2 Reported Early Latent Syphilis Rates per 100,000 in Los Angeles County, by Age Group, 2012
44
● By Gender
Table 5.2 Reported Early Latent Syphilis Cases and Rates per 100,000 Population by Gender and Age Group, Los Angeles County, 2008-2012
45
Figure 5.3 Reported Early Latent Syphilis Rates per 100,000 Population in Los Angeles County, by Gender and Year
46
Figure 5.4 Reported Early Latent Syphilis Rates per 100,000 Population in Los Angeles County, by Gender and Age Group, 2012
47
● By Race/Ethnicity
Table 5.3 Reported Early Latent Syphilis Cases and Rates per 100,000 Population by Gender and Race/Ethnicity, Los Angeles County, 2008-2012
48
Figure 5.5 Reported Early Latent Syphilis Rates per 100,000 Population in Los Angeles County, by Gender and Race/Ethnicity, 2012
49
VI. Late and Late Latent Syphilis
● National, State and County Comparisons
Figure 6.1 Reported Late and Late Latent Syphilis Rates by Year, United States, California, and Los Angeles County (LAC), 2008-2012
50
● By Age
Table 6.1 Reported Late and Late Latent Syphilis Cases and Rates per 100,000 Population by Age Group, Los Angeles County, 2008-2012
51
● By Gender
Table 6.2 Reported Late and Late Latent Syphilis Cases and Rates per 100,000 Population by Gender and Age Group, Los Angeles County, 2008-2012
52

Sexually Transmitted Disease Morbidity Report – 2012
v
● By Race/Ethnicity
Table 6.3 Reported Late and Late Latent Syphilis Cases and Rates per 100,000 Population by Gender and Race/Ethnicity, Los Angeles County, 2008-2012
53
VII. Congenital Syphilis
● National, State and County Comparisons
Figure 7.1 Reported Presumptive Congenital Syphilis Rates by Year, United States, California, and Los Angeles County (LAC), 2008-2012
54
● By Race/Ethnicity
Table 7.1 Reported Presumptive Congenital Syphilis Cases and Rates per 100,000 Live Births by Race/Ethnicity, Los Angeles County, 2008-2012
55
VIII. All Pelvic Inflammatory Disease (PID)
● By Age
Table 8.1 Reported All Pelvic Inflammatory Disease (PID) Cases and Rates per 100,000 Female Population by Age Group, Los Angeles County, 2008-2012
56
● By Race/Ethnicity
Table 8.2 Reported All Pelvic Inflammatory Disease (PID) Cases and Rates per 100,000 Female Population by Race/Ethnicity, Los Angeles County, 2008-2012
57
SERVICE PLANNING AREAS ADDENDUM
Addendum I. Chlamydia
Figure a1.1 Reported Chlamydia Rates per 100,000 Population by Service Planning Area (SPA), Los Angeles County, 2012
I-1
Figure a1.2 Reported Chlamydia Rates per 100,000 Population by Health District (HD), Los Angeles County, 2012
I-2
Table a1.1 Reported Chlamydia Cases and Rates per 100,000 Population by Service Planning Area (SPA) and Health District (HD), Los Angeles
I-3

Sexually Transmitted Disease Morbidity Report – 2012
vi
County, 2008-2012 ● By Gender and Age
Table a1.2 Reported Chlamydia Cases and Rates per 100,000 Population by Gender and Age, Antelope Valley Service Planning Area 1 (SPA 1), Los Angeles County, 2008-2012
I-4
Table a1.3 Reported Chlamydia Cases and Rates per 100,000 Population by Gender and Age, San Fernando Service Planning Area 2 (SPA 2), Los Angeles County, 2008-2012
I-5
Table a1.4 Reported Chlamydia Cases and Rates per 100,000 Population by Gender and Age, San Gabriel Service Planning Area 3 (SPA 3), Los Angeles County, 2008-2012
I-6
Table a1.5 Reported Chlamydia Cases and Rates per 100,000 Population by Gender and Age, Metro Service Planning Area 4 (SPA 4), Los Angeles County, 2008-2012.
I-7
Table a1.6 Reported Chlamydia Cases and Rates per 100,000 Population by Gender and Age, West Service Planning Area 5 (SPA 5), Los Angeles County, 2008-2012
I-8
Table a1.7 Reported Chlamydia Cases and Rates per 100,000 Population by Gender and Age, South Service Planning Area 6 (SPA 6), Los Angeles County, 2008-2012
I-9
Table a1.8 Reported Chlamydia Cases and Rates per 100,000 Population by Gender and Age, East Service Planning Area 7 (SPA 7), Los Angeles County, 2008-2012
I-10
Table a1.9 Reported Chlamydia Cases and Rates per 100,000 Population by Gender and Age, South Bay Service Planning Area 8 (SPA 8), Los Angeles County, 2008-2012
I-11
● By Gender and Race/Ethnicity
Table a1.10 Reported Chlamydia Cases and Rates per 100,000 Population by Gender and Race/Ethnicity, Antelope Valley Service Planning Area 1 (SPA 1), Los Angeles County, 2008-2012
I-12
Table a1.11 Reported Chlamydia Cases and Rates per 100,000 Population by Gender and Race/Ethnicity, San Fernando Service Planning Area 2 (SPA 2), Los Angeles County, 2008-2012
I-13
Table a1.12 Reported Chlamydia Cases and Rates per 100,000 Population by Gender and Race/Ethnicity, San Gabriel Service Planning Area 3 (SPA 3), Los Angeles County, 2008-2012
I-14
Table a1.13 Reported Chlamydia Cases and Rates per 100,000 Population by Gender and Race/Ethnicity, Metro Service Planning Area 4 (SPA 4), Los Angeles County, 2008-2012
I-15
Table a1.14 Reported Chlamydia Cases and Rates per 100,000 Population by Gender and Race/Ethnicity, West Service Planning Area 5 (SPA 5), Los Angeles County, 2008-2012
I-16
Table a1.15 Reported Chlamydia Cases and Rates per 100,000 Population by I-17

Sexually Transmitted Disease Morbidity Report – 2012
vii
Gender and Race/Ethnicity, South Service Planning Area 6 (SPA 6), Los Angeles County, 2008-2012
Table a1.16 Reported Chlamydia Cases and Rates per 100,000 Population by Gender and Race/Ethnicity, East Service Planning Area 7 (SPA 7), Los Angeles County, 2008-2012
I-18
Table a1.17 Reported Chlamydia Cases and Rates per 100,000 Population by Gender and Race/Ethnicity, South Bay Service Planning Area 8 (SPA 8), Los Angeles County, 2008-2012
I-19
Addendum II. Gonorrhea
Figure a2.1 Reported Gonorrhea Rates per 100,000 Population by Service
Planning Area (SPA), Los Angeles County, 2012 II-1
Figure a2.2 Reported Gonorrhea Rates per 100,000 Population by Health District (HD), Los Angeles County, 2012
II-2
Table a2.1 Reported Gonorrhea Cases and Rates per 100,000 Population by Service Planning Area (SPA) and Health District (HD), Los Angeles County, 2008-2012
II-3
● By Gender and Age
Table a2.2 Reported Gonorrhea Cases and Rates per 100,000 Population by Gender and Age, Antelope Valley Service Planning Area 1 (SPA 1), Los Angeles County, 2008-2012
II-4
Table a2.3 Reported Gonorrhea Cases and Rates per 100,000 Population by Gender and Age, San Fernando Service Planning Area 2 (SPA 2), Los Angeles County, 2008-2012
II-5
Table a2.4 Reported Gonorrhea Cases and Rates per 100,000 Population by Gender and Age, San Gabriel Service Planning Area 3 (SPA 3), Los Angeles County, 2008-2012
II-6
Table a2.5 Reported Gonorrhea Cases and Rates per 100,000 Population by Gender and Age, Metro Service Planning Area 4 (SPA 4), Los Angeles County, 2008-2012
II-7
Table a2.6 Reported Gonorrhea Cases and Rates per 100,000 Population by Gender and Age, West Service Planning Area 5 (SPA 5), Los Angeles County, 2008-2012
II-8
Table a2.7 Reported Gonorrhea Cases and Rates per 100,000 Population by Gender and Age, South Service Planning Area 6 (SPA 6), Los Angeles County, 2008- 2012
II-9
Table a2.8 Reported Gonorrhea Cases and Rates per 100,000 Population by Gender and Age, East Service Planning Area 7 (SPA 7), Los Angeles County, 2008-2012
II-10
Table a2.9 Reported Gonorrhea Cases and Rates per 100,000 Population by Gender and Age, South Bay Service Planning Area 8 (SPA 8), Los
II-11

Sexually Transmitted Disease Morbidity Report – 2012
viii
Angeles County, 2008-2012
● By Gender and Race/Ethnicity
Table a2.10 Reported Gonorrhea Cases and Rates per 100,000 Population by Gender and Race/Ethnicity, Antelope Valley Service Planning Area 1 (SPA 1), Los Angeles County, 2008-2012
II-12
Table a2.11 Reported Gonorrhea Cases and Rates per 100,000 Population by Gender and Race/Ethnicity, San Fernando Service Planning Area 2 (SPA 2), Los Angeles County, 2008-2012.
II-13
Table a2.12 Reported Gonorrhea Cases and Rates per 100,000 Population by Gender and Race/Ethnicity, San Gabriel Service Planning Area 3 (SPA 3), Los Angeles County, 2008-2012
II-14
Table a2.13 Reported Gonorrhea Cases and Rates per 100,000 Population by Gender and Race/Ethnicity, Metro Service Planning Area 4 (SPA 4), Los Angeles County, 2008-2012
II-15
Table a2.14 Reported Gonorrhea Cases and Rates per 100,000 Population by Gender and Race/Ethnicity, West Service Planning Area 5 (SPA 5), Los Angeles County, 2008-2012
II-16
Table a2.15 Reported Gonorrhea Cases and Rates per 100,000 Population by Gender and Race/Ethnicity, South Service Planning Area 6 (SPA 6), Los Angeles County, 2008-2012
II-17
Table a2.16 Reported Gonorrhea Cases and Rates per 100,000 Population by Gender and Race/Ethnicity, East Service Planning Area 7 (SPA 7), Los Angeles County, 2008-2012
II-18
Table a2.17 Reported Gonorrhea Cases and Rates per 100,000 Population by Gender and Race/Ethnicity, South Bay Service Planning Area 8 (SPA 8), Los Angeles County, 2008-2012
II-19
Addendum III. Primary and Secondary Syphilis
Figure a3.1 Reported Primary and Secondary Syphilis Rates per 100,000
Population by Service Planning Area (SPA), Los Angeles County, 2012
III-1
Figure a3.2 Reported Primary and Secondary Syphilis Rates per 100,000 Population by Health District (HD), Los Angeles County, 2012
III-2
Table a3.1 Reported Primary and Secondary Syphilis Cases and Rates per 100,000 Population by Service Planning Area (SPA) and Health District (HD), Los Angeles County, 2008-2012
III-3
● By Gender and Age
Table a3.2 Reported Primary and Secondary Syphilis Cases and Rates per 100,000 Population by Gender and Age, Antelope Valley Service Planning Area 1 (SPA 1), Los Angeles County, 2008-2012
III-4
Table a3.3 Reported Primary and Secondary Syphilis Cases and Rates per III-5

Sexually Transmitted Disease Morbidity Report – 2012
ix
100,000 Population by Gender and Age, San Fernando Service Planning Area 2 (SPA 2), Los Angeles County, 2008-2012
Table a3.4 Reported Primary and Secondary Syphilis Cases and Rates per 100,000 Population by Gender and Age, San Gabriel Service Planning Area 3 (SPA 3), Los Angeles County, 2008-2012
III-6
Table a3.5 Reported Primary and Secondary Syphilis Cases and Rates per 100,000 Population by Gender and Age, Metro Service Planning Area 4 (SPA 4), Los Angeles County, 2008-2012
III-7
Table a3.6 Reported Primary and Secondary Syphilis Cases and Rates per 100,000 Population by Gender and Age, West Service Planning Area 5 (SPA 5), Los Angeles County, 2008-2012
III-8
Table a3.7 Reported Primary and Secondary Syphilis Cases and Rates per 100,000 Population by Gender and Age, South Service Planning Area 6 (SPA 6), Los Angeles County, 2008-2012
III-9
Table a3.8 Reported Primary and Secondary Syphilis Cases and Rates per 100,000 Population by Gender and Age, East Service Planning Area 7 (SPA 7), Los Angeles County, 2008-2012
III-10
Table a3.9 Reported Primary and Secondary Syphilis Cases and Rates per 100,000 Population by Gender and Age, South Bay Service Planning Area 8 (SPA 8), Los Angeles County, 2008-2012
III-11
● By Gender and Race/Ethnicity
Table a3.10 Reported Primary and Secondary Syphilis Cases and Rates per 100,000 Population by Gender and Race/Ethnicity, Antelope Valley Service Planning Area 1 (SPA 1), Los Angeles County, 2008-2012
III-12
Table a3.11 Reported Primary and Secondary Syphilis Cases and Rates per 100,000 Population by Gender and Race/Ethnicity, San Fernando Service Planning Area 2 (SPA 2), Los Angeles County, 2008-2012
III-13
Table a3.12 Reported Primary and Secondary Syphilis Cases and Rates per 100,000 Population by Gender and Race/Ethnicity, San Gabriel Service Planning Area 3 (SPA 3), Los Angeles County, 2008-2012
III-14
Table a3.13 Reported Primary and Secondary Syphilis Cases and Rates per 100,000 Population by Gender and Race/Ethnicity, Metro Service Planning Area 4 (SPA 4), Los Angeles County, 2008-2012
III-15
Table a3.14 Reported Primary and Secondary Syphilis Cases and Rates per 100,000 Population by Gender and Race/Ethnicity, West Service Planning Area 5 (SPA 5), Los Angeles County, 2008-2012
III-16
Table a3.15 Reported Primary and Secondary Syphilis Cases and Rates per 100,000 Population by Gender and Race/Ethnicity, South Service Planning Area 6 (SPA 6), Los Angeles County, 2008-2012
III-17
Table a3.16 Reported Primary and Secondary Syphilis Cases and Rates per 100,000 Population by Gender and Race/Ethnicity, East Service Planning Area 7 (SPA 7), Los Angeles County, 2008-2012
III-18
Table a3.17 Reported Primary and Secondary Syphilis Cases and Rates per III-19

Sexually Transmitted Disease Morbidity Report – 2012
x
100,000 Population by Gender and Race/Ethnicity, South Bay Service Planning Area 8 (SPA 8), Los Angeles County, 2008-2012
Addendum IV. Early Latent Syphilis
Figure a4.1 Reported Early Latent Syphilis Rates per 100,000 by Service
Planning Area (SPA), Los Angeles County, 2012 IV-1
Figure a4.2 Reported Early Latent Syphilis Rates per 100,000 by Health District (HD), Los Angeles County, 2012
IV-2
Table a4.1 Reported Early Latent Syphilis Cases and Rates per 100,000 Population by Service Planning Area (SPA) and Health District (HD), Los Angeles County, 2008-2012
IV-3
● By Gender and Age
Table a4.2 Reported Early Latent Syphilis Cases and Rates per 100,000 Population by Gender and Age, Antelope Valley Service Planning Area 1 (SPA 1), Los Angeles County, 2008-2012
IV-4
Table a4.3 Reported Early Latent Syphilis Cases and Rates per 100,000 Population by Gender and Age, San Fernando Service Planning Area 2 (SPA 2), Los Angeles County, 2008-2012
IV-5
Table a4.4 Reported Early Latent Syphilis Cases and Rates per 100,000 Population by Gender and Age, San Gabriel Service Planning Area 3 (SPA 3), Los Angeles County, 2008-2012
IV-6
Table a4.5 Reported Early Latent Syphilis Cases and Rates per 100,000 Population by Gender and Age, Metro Service Planning Area 4 (SPA 4), Los Angeles County, 2008-2012
IV-7
Table a4.6 Reported Early Latent Syphilis Cases and Rates per 100,000 Population by Gender and Age, West Service Planning Area 5 (SPA 5), Los Angeles County, 2008-2012
IV-8
Table a4.7 Reported Early Latent Syphilis Cases and Rates per 100,000 Population by Gender and Age, South Service Planning Area 6 (SPA 6), Los Angeles County, 2008-2012
IV-9
Table a4.8 Reported Early Latent Syphilis Cases and Rates per 100,000 Population by Gender and Age, East Service Planning Area 7 (SPA 7), Los Angeles County, 2008-2012
IV-10
Table a4.9 Reported Early Latent Syphilis Cases and Rates per 100,000 Population by Gender and Age, South Bay Service Planning Area 8 (SPA 8), Los Angeles County, 2008-2012
IV-11
● By Gender and Race/Ethnicity
Table a4.10 Reported Early Latent Syphilis Cases and Rates per 100,000 Population by Gender and Race/Ethnicity, Antelope Valley Service Planning Area 1 (SPA 1), Los Angeles County, 2008-2012
IV-12
Table a4.11 Reported Early Latent Syphilis Cases and Rates per 100,000 IV-13

Sexually Transmitted Disease Morbidity Report – 2012
xi
Population by Gender and Race/Ethnicity, San Fernando Service Planning Area 2 (SPA 2), Los Angeles County, 2008-2012
Table a4.12 Reported Early Latent Syphilis Cases and Rates per 100,000 Population by Gender and Race/Ethnicity, San Gabriel Service Planning Area 3 (SPA 3), Los Angeles County, 2008-2012
IV-14
Table a4.13 Reported Early Latent Syphilis Cases and Rates per 100,000 Population by Gender and Race/Ethnicity, Metro Service Planning Area 4 (SPA 4), Los Angeles County, 2008-2012
IV-15
Table a4.14 Reported Early Latent Syphilis Cases and Rates per 100,000 Population by Gender and Race/Ethnicity, West Service Planning Area 5 (SPA 5), Los Angeles County, 2008-2012
IV-16
Table a4.15 Reported Early Latent Syphilis Cases and Rates per 100,000 Population by Gender and Race/Ethnicity, South Service Planning Area 6 (SPA 6), Los Angeles County, 2008-2012
IV-17
Table a4.16 Reported Early Latent Syphilis Cases and Rates per 100,000 Population by Gender and Race/Ethnicity, East Service Planning Area 7 (SPA 7), Los Angeles County, 2008-2012
IV-18
Table a4.17 Reported Early Latent Syphilis Cases and Rates per 100,000 Population by Gender and Race/Ethnicity, South Bay Service Planning Area 8 (SPA 8), Los Angeles County, 2008-2012
IV-19
Addendum V. Late and Late Latent Syphilis
Figure a5.1 Reported Late and Late Latent Syphilis Rates per 100,000 by Service
Planning Area (SPA), Los Angeles County 2012 V-1
Figure a5.2 Reported Late and Late Latent Syphilis Rates per 100,000 by Health District (HD), Los Angeles County 2012
V-2
Table a5.1 Reported Late and Late Latent Syphilis Cases and Rates per 100,000 Population by Service Planning Area (SPA) and Health District (HD), Los Angeles County, 2008-2012
V-3
● By Gender and Age
Table a5.2 Reported Late and Late Latent Syphilis Cases and Rates per 100,000 Population by Gender and Age, Antelope Valley Service Planning Area 1 (SPA 1), Los Angeles County, 2008-2012
V-4
Table a5.3 Reported Late and Late Latent Syphilis Cases and Rates per 100,000 Population by Gender and Age, San Fernando Service Planning Area 2 (SPA 2), Los Angeles County, 2008-2012
V-5
Table a5.4 Reported Late and Late Latent Syphilis Cases and Rates per 100,000 Population by Gender and Age, San Gabriel Service Planning Area 3 (SPA 3), Los Angeles County, 2008-2012
V-6

Sexually Transmitted Disease Morbidity Report – 2012
xii
Table a5.5 Reported Late and Late Latent Syphilis Cases and Rates per 100,000 Population by Gender and Age, Metro Service Planning Area 4 (SPA 4), Los Angeles County, 2008-2012
V-7
Table a5.6 Reported Late and Late Latent Syphilis Cases and Rates per 100,000 Population by Gender and Age, West Service Planning Area 5 (SPA 5), Los Angeles County, 2008-2012
V-8
Table a5.7 Reported Late and Late Latent Syphilis Cases and Rates per 100,000 Population by Gender and Age, South Service Planning Area 6 (SPA 6), Los Angeles County, 2008-2012
V-9
Table a5.8 Reported Late and Late Latent Syphilis Cases and Rates per 100,000 Population by Gender and Age, East Service Planning Area 7 (SPA 7), Los Angeles County, 2008-2012
V-10
Table a5.9 Reported Late and Late Latent Syphilis Cases and Rates per 100,000 Population by Gender and Age, South Bay Service Planning Area 8 (SPA 8), Los Angeles County, 2008-2012
V-11
● By Gender and Race/Ethnicity
Table a5.10 Reported Late and Late Latent Syphilis Cases and Rates per 100,000 Population by Gender and Race/Ethnicity, Antelope Valley Service Planning Area 1 (SPA 1), Los Angeles County, 2008-2012
V-12
Table a5.11 Reported Late and Late Latent Syphilis Cases and Rates per 100,000 Population by Gender and Race/Ethnicity, San Fernando Service Planning Area 2 (SPA 2), Los Angeles County, 2008-2012
V-13
Table a5.12 Reported Late and Late Latent Syphilis Cases and Rates per 100,000 Population by Gender and Race/Ethnicity, San Gabriel Service Planning Area 3 (SPA 3), Los Angeles County, 2008-2012
V-14
Table a5.13 Reported Late and Late Latent Syphilis Cases and Rates per 100,000 Population by Gender and Race/Ethnicity, Metro Service Planning Area 4 (SPA 4), Los Angeles County, 2008-2012
V-15
Table a5.14 Reported Late and Late Latent Syphilis Cases and Rates per 100,000 Population by Gender and Race/Ethnicity, West Service Planning Area 5 (SPA 5), Los Angeles County, 2008-2012
V-16
Table a5.15 Reported Late and Late Latent Syphilis Cases and Rates per 100,000 Population by Gender and Race/Ethnicity, South Service Planning Area 6 (SPA 6), Los Angeles County, 2008-2012
V-17
Table a5.16 Reported Late and Late Latent Syphilis Cases and Rates per 100,000 Population by Gender and Race/Ethnicity, East Service Planning Area 7 (SPA 7), Los Angeles County, 2008-2012
V-18
Table a5.17 Reported Late and Late Latent Syphilis Cases and Rates per 100,000 Population by Gender and Race/Ethnicity, South Bay Service Planning Area 8 (SPA 8), Los Angeles County, 2008-2012
V-19
Sexually Transmitted Disease Morbidity Report – 2012
xiii
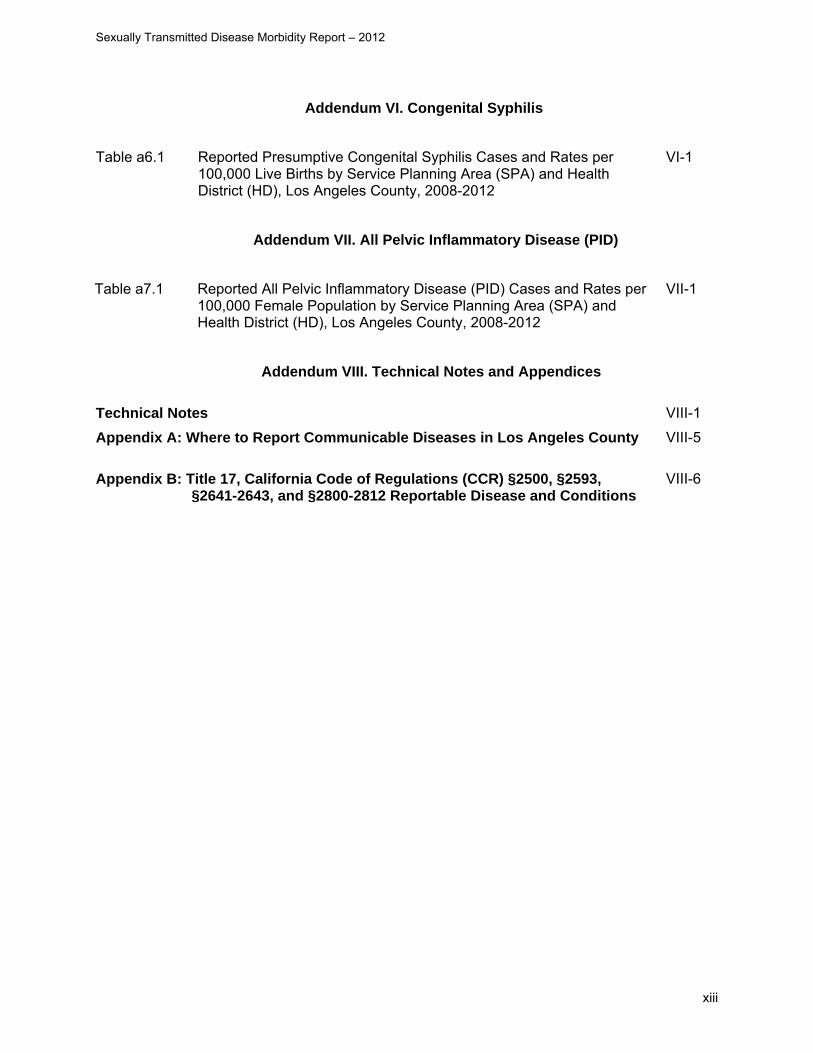
Addendum VI. Congenital Syphilis
Table a6.1 Reported Presumptive Congenital Syphilis Cases and Rates per
100,000 Live Births by Service Planning Area (SPA) and Health District (HD), Los Angeles County, 2008-2012
VI-1
Addendum VII. All Pelvic Inflammatory Disease (PID)
Table a7.1 Reported All Pelvic Inflammatory Disease (PID) Cases and Rates per 100,000 Female Population by Service Planning Area (SPA) and Health District (HD), Los Angeles County, 2008-2012
VII-1
Addendum VIII. Technical Notes and Appendices
Technical Notes
VIII-1
Appendix A: Where to Report Communicable Diseases in Los Angeles County
VIII-5
Appendix B: Title 17, California Code of Regulations (CCR) §2500, §2593, §2641-2643, and §2800-2812 Reportable Disease and Conditions
VIII-6

Section I:
Summary

Sexually Transmitted Disease Morbidity Report - 2012 1
n % Rate1 n % Rate1 n % Rate1 n % Rate1 n % Rate1 n % Rate N2 %County Total 48,461 100 521.3 11,425 100 122.9 878 100 9.4 1276 100 13.7 2154 100 23.2 226 100 4.8 9,296,158 100.0Gender Male 17,015 35 371.0 7,629 67 166.3 850 97 18.5 1185 93 25.8 2035 94 44.4 N/A N/A N/A 4,586,835 49.3 Female 31,335 65 665.4 3,773 33 80.1 28 3 0.6 89 7 1.9 117 5 2.5 226 100 4.8 4,709,323 50.7 Unknown 111 0 . 23 0 . 0 0 . 2 0 . 2 0 . . . . . .Age Group 0-14 249 1 13.9 49 0 2.7 0 0 0.0 1 0 0.1 1 0 0.1 4 2 0.5 1,789,802 19.3 15-19 10,816 22 1545.5 1,590 14 227.2 22 3 3.1 26 2 3.7 48 2 6.9 57 25 16.6 699,828 7.5 20-24 17,981 37 2606.4 3,226 28 467.6 156 18 22.6 137 11 19.9 293 14 42.5 59 26 17.5 689,872 7.4 25-29 9,257 19 1328.4 2,468 22 354.2 166 19 23.8 210 16 30.1 376 17 54.0 40 18 11.7 696,845 7.5 30-34 4,403 9 647.2 1,419 12 208.6 114 13 16.8 166 13 24.4 280 13 41.2 22 10 6.6 680,348 7.3 35-44 3,812 8 287.8 1,572 14 118.7 222 25 16.8 371 29 28.0 593 28 44.8 29 13 4.4 1,324,461 14.2 45-54 1,470 3 114.3 873 8 67.9 151 17 11.7 304 24 23.6 455 21 35.4 8 4 1.2 1,286,529 13.8 55-64 334 1 32.8 191 2 18.7 29 3 2.8 54 4 5.3 83 4 8.1 3 1 0.6 1,019,219 11.0 65+ 72 0 6.5 21 0 1.9 16 2 1.4 5 0 0.5 21 1 1.9 1 0 0.2 1,109,254 11.9 Unknown 67 0 . 16 0 . 2 0 . 2 0 . 4 0 . 3 1 . . .Race/Ethnicity3
White 5,308 11 199.9 2,548 22 96.0 258 29 9.7 342 26.8 12.9 502 28 18.9 36 16 3.0 2,654,839 28.6 Black 9,418 19 1216.6 3,570 31 461.2 193 22 24.9 277 21.7 35.8 331 18 42.8 63 28 16.9 774,147 8.3 Latino 20,213 42 446.4 3,837 34 84.7 345 39 7.6 582 45.6 12.9 844 47 18.8 97 43 4.8 4,528,203 48.7 Asian-Pacific Islander 1,777 4 134.5 389 3 29.4 50 6 3.8 43 3.4 3.3 57 3 4.3 3 1 0.5 1,321,113 14.2 Other/Mixed Race 595 1 3332.2 142 1 795.3 5 1 28.0 14 1.1 78.4 24 1 135.8 2 1 . 17,856 0.2 Unknown 11,150 23 . 939 8 . 27 3 . 18 1 . 35 2 . 25 11 . . .Service Planning Area (SPA) Antelope Valley (1) 2,242 5 578.6 442 4 114.1 12 1 3.1 13 1 3.4 25 1 6.5 21 9 10.8 387,512 4.2 East (7) 6,474 13 498.7 991 9 76.3 56 6 4.3 93 7 7.2 149 7 11.5 20 9 3.0 1,298,211 14.0 Metro (4) 7,063 15 628.8 3,053 27 271.8 337 38 30.0 590 46 52.5 927 43 82.5 23 10 4.2 1,123,335 12.1 San Fernando (2) 7,148 15 332.9 1,579 14 73.5 160 18 7.5 168 13 7.8 328 15 15.3 43 19 4.0 2,147,332 23.1 San Gabriel (3) 5,998 12 370.9 878 8 54.3 67 8 4.1 75 6 4.6 142 7 8.8 34 15 4.1 1,617,105 17.4 South (6) 9,849 20 968.0 2,371 21 233.0 122 14 12.0 175 14 17.2 297 14 29.2 37 16 7.1 1,017,508 10.9 South Bay (8) 5,225 11 490.0 1,244 11 116.7 61 7 5.7 77 6 7.2 138 6 12.9 28 12 5.1 1,066,277 11.5 West (5) 2,022 4 316.5 579 5 90.6 49 6 7.7 71 6 11.1 120 6 18.8 14 6 4.2 638,878 6.9 Unknown 2,440 5 . 288 3 . 14 2 . 14 1 . 28 1 . 6 3 . . .
*Report as of September 2013. The impact of report delay and/or update must be considered when comparing to the results reported over time. **Pelvic Inflammatory Disease. Includes Chlamydial, Non-Chlamydial, Gonococcal and Non-Gonococcal. Rates per 100,000 female population.1Per 100,000 population. 2Excludes population in Long Beach and Pasadena. Data Source: LA County, ISD, Social Services Systems Division and released by DPH, Office of Health Assesment and Epidemiology.3Rates adjusted for unknown, other, and mixed race/ethnicity. See Technical Notes for more details.Note: Percentages may not total to 100%, due to rounding; excludes cases in Long Beach and Pasadena.
Table 1.1. Surveillance Summary of Sexually Transmitted Diseases Reported* to the Los Angeles County Division of HIV and STD Programs, 2012
GonorrheaChlamydia County Population P & S Syphilis Early Latent Syphilis PID** TotalEarly Syphilis

Sexually Transmitted Disease Morbidity Report - 2012 2
No. (%) Rate No. (%) Rate No. (%) Rate No. (%) Rate No. (%) Rate
Chlamydia1 42,987 79.2 441.9 43,809 79.3 448.5 44,619 78.4 454.8 47,487 79.1 512.9 48,461 76.6 521.3
Gonorrhea1 8,184 15.1 84.1 8,486 15.4 86.9 9,498 16.7 96.8 9,572 15.9 103.4 11,425 18.1 122.9
Syphilis
Primary and Secondary1 706 1.3 7.3 703 1.3 7.2 637 1.1 6.5 750 1.2 8.1 878 1.4 9.4
Early Latent1 770 1.4 7.9 958 1.7 9.8 916 1.6 9.3 1,041 1.7 11.2 1,276 2.0 13.7
Late & Late Latent1 1,456 2.7 15.0 1,133 2.1 11.6 1,049 1.8 10.7 961 1.6 10.4 960 1.5 10.3
Congenital2 20 0.0 4.0 15 0.0 11.5 8 0.0 6.1 14 0.0 11.5 6 0.0 4.9
PID* 199 0.4 4.0 174 0.3 3.5 205 0.4 4.1 212 0.4 4.5 226 0.4 4.8
Total Incidents** 54,322 55,278 56,932 60,037 63,232
1. Rates per 100,000 population.2. Rates per 100,000 live births.*Pelvic Inflammatory Disease. Includes Chlamydial, Non-Chlamydial, Gonococcal and Non-Gonococcal. Rates per 100,000 female population.**A case of Chlamydial or Gonococcal PID was counted as two infection incidents, one for Chlamydia or Gonorrhea and the other for PID.
Note: Cumulative percentages may not equal 100% because of rounding. Excludes cases from Pasadena and Long Beach.
Table 1.2. Trend of Chlamydia, Gonorrhea, Syphilis and PID* Reported for Los Angeles County Residents, 2008-2012
201220112008 2009 2010

Sexually Transmitted Disease Morbidity Report - 2012 3
Chlamydia4846176.6%
Gonorrhea1142518.1%
P & S Syphilis878
1.4%
Early Latent Syphilis12762.0%
Late Latent Syphilis960
1.5% Congenital Syphilis6
0.0%PID*226
0.4%
Figure 1.1. Distribution of Reported Sexually Transmitted Diseases in Los Angeles County, 2012
*Pelvic Inflammatory Disease. Includes Chlamydia, Non-Chlamydial, Gonococcal and Non-Gonococcal.Note: Excludes cases in Long Beach and Pasadena

Sexually Transmitted Disease Morbidity Report - 2012 4
n % Rate1 n % Rate1 n % Rate1 n % Rate1 n % Rate1
Male Total2 17,015 100 371.0 7,629 100 166.3 850 100 18.5 1,185 100 25.8 2,035 100 44.4 White3
Total 2,681 100 245.5 2,067 100 168.1 255 100 19.7 336 100 25.6 591 100 45.3 Ages 0-14 0 0 0.0 0 0 0.0 0 0 0.0 0 0 0.0 0 0 0.0 15-19 129 5 179.0 52 3 72.1 3 1 4.2 3 1 4.2 6 1 8.3 20-24 589 22 767.9 338 16 440.7 17 7 22.2 14 4 18.3 31 5 40.4 25-29 632 24 674.9 451 22 481.6 29 11 31.0 42 13 44.9 71 12 75.8 30-34 432 16 459.0 338 16 359.1 32 13 34.0 28 8 29.7 60 10 63.7 35-44 473 18 260.9 464 22 255.9 91 36 50.2 97 29 53.5 188 32 103.7 45-54 339 13 156.6 327 16 151.0 63 25 29.1 127 38 58.7 190 32 87.8 55-64 73 3 37.0 88 4 44.6 13 5 6.6 25 7 12.7 38 6 19.3 65+ 14 1 6.2 7 0 3.1 7 3 3.1 0 0 . 7 1 3.1 Unknown 0 0 . 2 0 . 0 0 . 0 0 . 0 0 . Black3
Total 3,400 100 1141.0 2,010 100 599.0 183 100 51.9 239 100 66.7 422 100 118.7 Ages 0-14 19 1 27.0 8 0 11.4 0 0 0.0 0 0 0.0 0 0 0.0 15-19 727 21 2391.2 287 14 944.0 7 4 23.0 11 5 36.2 18 4 59.2 20-24 1,156 34 3870.8 597 30 1999.0 48 26 160.7 44 18 147.3 92 22 308.1 25-29 677 20 2735.5 445 22 1798.1 49 27 198.0 58 24 234.4 107 25 432.3 30-34 308 9 1343.6 213 11 929.2 19 10 82.9 24 10 104.7 43 10 187.6 35-44 303 9 663.3 241 12 527.6 35 19 76.6 45 19 98.5 80 19 175.1 45-54 181 5 325.3 178 9 319.9 17 9 30.6 46 19 82.7 63 15 113.2 55-64 25 1 58.6 37 2 86.7 6 3 14.1 8 3 18.8 14 3 32.8 65+ 4 0 9.8 3 0 7.3 2 1 4.9 2 1 4.9 4 1 9.8 Unknown 0 0 . 1 0 . 0 0 . 1 0 . 1 0 . Latino3
Total 6,392 100 344.2 2,562 100 122.5 331 100 15.1 540 100 24.2 871 100 39.3 Ages 0-14 23 0 4.0 4 0 0.7 0 0 0.0 0 0 0.0 0 0 0.0 15-19 962 15 455.0 216 8 102.2 7 2 3.3 7 1 3.3 14 2 6.6 20-24 2,173 34 1069.9 672 26 330.9 68 21 33.5 52 10 25.6 120 14 59.1 25-29 1,470 23 777.8 665 26 351.8 65 20 34.4 86 16 45.5 151 17 79.9 30-34 762 12 423.2 402 16 223.3 49 15 27.2 92 17 51.1 141 16 78.3 35-44 704 11 206.0 416 16 121.7 74 22 21.7 177 33 51.8 251 29 73.4 45-54 237 4 87.4 161 6 59.4 58 18 21.4 104 19 38.4 162 19 59.8 55-64 39 1 23.8 17 1 10.4 5 2 3.1 18 3 11.0 23 3 14.1 65+ 7 0 5.5 6 0 4.7 3 1 2.3 3 1 2.3 6 1 4.7 Unknown 15 0 . 3 0 . 2 1 . 1 0 . 3 0 .Other Total 816 100 33.6 361 100 16.7 55 100 2.7 53 100 2.7 108 100 5.4 Ages 0-14 0 0 0.0 0 0 0.0 0 0 0.0 0 0 0.0 0 0 0.0 15-19 71 9 166.3 20 6 46.8 2 4 4.7 0 0 0.0 2 2 4.7 20-24 223 27 507.9 85 24 193.6 9 16 20.5 4 8 9.1 13 12 29.6 25-29 200 25 409.6 84 23 172.0 15 27 30.7 7 13 14.3 22 20 45.1 30-34 146 18 308.2 72 20 152.0 8 15 16.9 6 11 12.7 14 13 29.6 35-44 113 14 122.4 63 17 68.2 16 29 17.3 27 51 29.2 43 40 46.6 45-54 50 6 54.3 30 8 32.6 3 5 3.3 9 17 9.8 12 11 13.0 55-64 8 1 9.7 6 2 7.3 1 2 1.2 0 0 0.0 1 1 1.2 65+ 4 0 4.7 1 0 1.2 1 2 1.2 0 0 0.0 1 1 1.2 Unknown 1 0 . 0 0 . 0 0 . 0 0 . 0 0 .
reported over time.1Per 100,000 population. 2Includes cases of unknown race/ethnicity. Excludes cases reported as "Unknown/Other/Ambiguous Genitalia" gender.3Rates adjusted for unknown, other, and mixed race/ethnicity. Note: Percentages may not total to 100%, due to rounding; excludes cases in Long Beach and Pasadena.
*Report as of September 2013. The impact of report delay and/or update must be considered when comparing to results
Table 1.3. Surveillance Summary of Chlamydia, Gonorrhea and Early Syphilis Reported* to
By Race/Ethnicity and Age Group among Males, 2012
Chlamydia Gonorrhea P & S Syphilis TotalEarly Latent SyphilisEarly Syphilis
the Los Angeles County Sexually Transmitted Disease Program,

Sexually Transmitted Disease Morbidity Report - 2012 5
OtherWhite
BlackLatino0
500
1000
1500
2000
2500
3000
3500
4000
0-14 15-19 20-24 25-29 30-34 35-44 45-54 55-64 65+
Rat
e pe
r 100
,000
pop
ulat
ion
Age Group
Figure 1.2. Reported Chlamydia Rates per 100,000 Population Among Males in Los Angeles County, by Age Group and Race/Ethnicity, 2012
Note: Excludes cases in Long Beach and Pasadena

Sexually Transmitted Disease Morbidity Report - 2012 6
OtherWhite
BlackLatino0
500
1000
1500
2000
2500
0-14 15-19 20-24 25-29 30-34 35-44 45-54 55-64 65+
Num
ber o
f Cas
es
Age Group
Figure 1.3. Reported Chlamydia Cases Among Males in Los Angeles County, by Age Group and Race/Ethnicity, 2012
Note: Excludes cases in Long Beach and Pasadena

Sexually Transmitted Disease Morbidity Report - 2012 7
OtherWhite
BlackLatino0
200
400
600
800
1000
1200
1400
1600
1800
2000
0-14 15-19 20-24 25-29 30-34 35-44 45-54 55-64 65+
Rat
e pe
r 100
,000
pop
ulat
ion
Age Group
Figure 1.4. Reported Gonorrhea Rates per 100,000 Population Among Males in Los Angeles County, by Age Group and Race/Ethnicity, 2012
Note: Excludes cases in Long Beach and Pasadena

Sexually Transmitted Disease Morbidity Report - 2012 8
OtherWhite
BlackLatino0
100
200
300
400
500
600
700
0-14 15-19 20-24 25-29 30-34 35-44 45-54 55-64 65+
Num
ber o
f Cas
es
Age Group
Figure 1.5. Reported Gonorrhea Cases Among Males in Los Angeles County, by Age Group and Race/Ethnicity, 2012
Note: Excludes cases in Long Beach and Pasadena

Sexually Transmitted Disease Morbidity Report - 2012 9
OtherWhite
BlackLatino0
50
100
150
200
250
300
350
400
450
0-14 15-19 20-24 25-29 30-34 35-44 45-54 55-64 65+
Rat
e pe
r 100
,000
pop
ulat
ion
Age Group
Figure 1.6. Reported Early Syphilis Rates per 100,000 Population Among Males in Los Angeles County, by Age Group and Race/Ethnicity, 2012
Note: Excludes cases in Long Beach and Pasadena. Early Syphilis includes Primary and Secondary Syphilis, and Early Latent Syphilis

Sexually Transmitted Disease Morbidity Report - 2012 10
OtherWhite
BlackLatino0
50
100
150
200
250
300
0-14 15-19 20-24 25-29 30-34 35-44 45-54 55-64 65+
Num
ber o
f Cas
es
Age Group
Figure 1.7. Reported Early Syphilis Cases Among Males in Los Angeles County, by Age Group and Race/Ethnicity, 2012
Note: Excludes cases in Long Beach and Pasadena. Early Syphilis includes Primary and Secondary Syphilis, and Early Latent Syphilis.

Sexually Transmitted Disease Morbidity Report - 2012 11
n % Rate1 n % Rate1 n % Rate1 n % Rate1 n % Rate1
Female Total2 31,335 100 665.4 3,773 100 80.1 28 100 0.6 89 100 1.9 117 100 2.5 White3
Total 2,613 100 243.9 477 100 39.0 3 100 0.2 6 100 0.5 9 100 0.7 Ages 0-14 7 0 4.3 1 0 0.6 0 0 0.0 0 0 0.0 0 0 0.0 15-19 540 21 777.4 60 13 86.4 0 0 0.0 0 0 0.0 0 0 0.0 20-24 1,132 43 1506.9 165 35 219.6 2 67 2.7 1 17 1.3 3 33 4.0 25-29 497 19 549.6 119 25 131.6 0 0 0.0 0 0 0.0 0 0 0.0 30-34 197 8 230.8 48 10 56.2 1 33 1.2 2 33 2.3 3 33 3.5 35-44 169 6 101.8 59 12 35.5 0 0 0.0 2 33 1.2 2 22 1.2 45-54 45 2 22.4 19 4 9.5 0 0 0.0 0 0 0.0 0 0 0.0 55-64 22 1 11.4 4 1 2.1 0 0 0.0 1 17 0.5 1 11 0.5 65+ 1 0 0.4 1 0 0.4 0 0 0.0 0 0 0.0 0 0 0.0 Unknown 3 0 . 1 0 . 0 0 . 0 0 . 0 0 . Black3
Total 6,006 100 1805.7 1,555 100 409.2 10 100 2.5 37 100 9.1 47 100 11.6 Ages 0-14 66 1 97.2 22 1 32.4 0 0 0.0 0 0 0.0 0 0 0.0 15-19 2,152 36 7130.8 524 34 1736.3 2 20 6.6 4 11 13.3 6 13 19.9 20-24 2,376 40 7896.8 589 38 1957.6 4 40 13.3 10 27 33.2 14 30 46.5 25-29 861 14 3156.2 244 16 894.4 1 10 3.7 6 16 22.0 7 15 25.7 30-34 310 5 1184.2 86 6 328.5 1 10 3.8 5 14 19.1 6 13 22.9 35-44 180 3 339.3 54 3 101.8 1 10 1.9 8 22 15.1 9 19 17.0 45-54 36 1 56.3 26 2 40.6 0 0 0.0 4 11 6.3 4 9 6.3 55-64 19 0 36.8 9 1 17.4 1 10 1.9 0 0 0.0 1 2 1.9 65+ 1 0 1.6 0 0 0.0 0 0 0.0 0 0 0.0 0 0 0.0 Unknown 5 0 . 1 0 . 0 0 . 0 0 . 0 0 . Latino3
Total 13,792 100 752.5 1,268 100 60.6 14 100 0.6 41 100 1.8 55 100 2.5 Ages 0-14 107 1 19.4 10 1 1.8 0 0 0.0 1 2 0.2 1 2 0.2 15-19 3,657 27 1803.0 262 21 129.2 1 7 0.5 1 2 0.5 2 4 1.0 20-24 5,656 41 2989.1 463 37 244.7 5 36 2.6 9 22 4.8 14 25 7.4 25-29 2,393 17 1385.9 231 18 133.8 2 14 1.2 7 17 4.1 9 16 5.2 30-34 983 7 574.4 129 10 75.4 2 14 1.2 5 12 2.9 7 13 4.1 35-44 764 6 228.0 124 10 37.0 1 7 0.3 6 15 1.8 7 13 2.1 45-54 182 1 66.1 39 3 14.2 3 21 1.1 11 27 4.0 14 25 5.1 55-64 27 0 14.5 7 1 3.8 0 0 0.0 1 2 0.5 1 2 0.5 65+ 4 0 2.2 1 0 0.6 0 0 0.0 0 0 0.0 0 0 0.0 Unknown 19 0 . 2 0 . 0 0 . 0 0 . 0 0 .Other Total 1,547 100 60.8 166 100 7.4 0 100 0.0 4 100 0.2 4 100 0.2 Ages 0-14 3 0 3.3 0 0 0.0 0 0 0.0 0 0 0.0 0 0 0.0 15-19 228 15 559.2 21 13 51.5 0 0 0.0 0 0 0.0 0 0 0.0 20-24 645 42 1540.8 55 33 131.4 0 0 0.0 0 0 0.0 0 0 0.0 25-29 317 20 630.9 46 28 91.6 0 0 0.0 2 50 4.0 2 50 4.0 30-34 158 10 296.8 13 8 24.4 0 0 0.0 0 0 0.0 0 0 0.0 35-44 147 10 134.6 21 13 19.2 0 0 0.0 2 50 1.8 2 50 1.8 45-54 29 2 26.0 9 5 8.1 0 0 0.0 0 0 0.0 0 0 0.0 55-64 14 1 13.8 0 0 0.0 0 0 0.0 0 0 0.0 0 0 0.0 65+ 5 0 4.5 1 1 0.9 0 0 0.0 0 0 0.0 0 0 0.0 Unknown 1 0 . 0 0 . 0 0 . 0 0 . 0 0 .
*Report as of September 2013. The impact of report delay and/or update must be considered when comparing to results reported over time.1Per 100,000 population. 2Includes cases of unknown race/ethnicity. Excludes cases reported as "Unknown/Other/Ambiguous Genitalia" gender.3Rates adjusted for unknown, other, and mixed race/ethnicity.Note: Percentages may not total to 100%, due to rounding; excludes cases in Long Beach and Pasadena.
Table 1.4. Surveillance Summary of Chlamydia, Gonorrhea and Early Syphilis Reported* to
By Race/Ethnicity and Age Group among Females, 2012
Chlamydia Gonorrhea P & S Syphilis TotalEarly Latent SyphilisEarly Syphilis
the Los Angeles County Sexually Transmitted Disease Program,

Sexually Transmitted Disease Morbidity Report - 2012 12
OtherWhite
BlackLatino0
1000
2000
3000
4000
5000
6000
7000
8000
0-14 15-19 20-24 25-29 30-34 35-44 45-54 55-64 65+
Rat
e pe
r 100
,000
pop
ulat
ion
Age Group
Figure 1.8. Reported Chlamydia Rates per 100,000 Population Among Females in Los Angeles County, by Age Group and Race/Ethnicity, 2012
Note: Excludes cases in Long Beach and Pasadena

Sexually Transmitted Disease Morbidity Report - 2012 13
OtherWhite
BlackLatino0
1000
2000
3000
4000
5000
6000
0-14 15-19 20-24 25-29 30-34 35-44 45-54 55-64 65+
Num
ber o
f Cas
es
Age Group
Figure 1.9. Reported Chlamydia Cases Among Females in Los Angeles County, by Age Group and Race/Ethnicity, 2012
Note: Excludes cases in Long Beach and Pasadena

Sexually Transmitted Disease Morbidity Report - 2012 14
OtherWhite
BlackLatino0
200
400
600
800
1000
1200
1400
1600
1800
2000
0-14 15-19 20-24 25-29 30-34 35-44 45-54 55-64 65+
Rat
e pe
r 100
,000
pop
ulat
ion
Age Group
Figure 1.10. Reported Gonorrhea Rates per 100,000 Population Among Females in Los Angeles County, by Age Group and Race/Ethnicity, 2012
Note: Excludes cases in Long Beach and Pasadena

Sexually Transmitted Disease Morbidity Report - 2012 15
OtherWhite
BlackLatino0
100
200
300
400
500
600
0-14 15-19 20-24 25-29 30-34 35-44 45-54 55-64 65+
Num
ber o
f Cas
es
Age Group
Figure 1.11. Reported Gonorrhea Cases Among Females in Los Angeles County, by Age Group and Race/Ethnicity, 2012
Note: Excludes cases in Long Beach and Pasadena

Sexually Transmitted Disease Morbidity Report - 2012 16
OtherWhite
BlackLatino0
5
10
15
20
25
30
35
40
45
50
0-14 15-19 20-24 25-29 30-34 35-44 45-54 55-64 65+
Rat
e pe
r 100
,000
pop
ulat
ion
Age Group
Figure 1.12. Reported Early Syphilis Rates per 100,000 Population Among Females in Los Angeles County, by Age Group and Race/Ethnicity, 2012
Note: Excludes cases in Long Beach and Pasadena. Early Syphilis includes Primary and Secondary Syphilis, and Early Latent Syphilis.

Sexually Transmitted Disease Morbidity Report - 2012 17
OtherWhite
BlackLatino0
2
4
6
8
10
12
14
0-14 15-19 20-24 25-29 30-34 35-44 45-54 55-64 65+
Num
ber o
f Cas
es
Age Group
Figure 1.13. Reported Early Syphilis Cases Among Females in Los Angeles County, by Age Group and Race/Ethnicity, 2012
Note: Excludes cases in Long Beach and Pasadena. Early Syphilis includes Primary and Secondary Syphilis, and Early Latent Syphilis.

Section II:
Chlamydia

Sexually Transmitted Disease Morbidity Report - 2012 18
398.1405.3
423.6
457.6405.0 398.1 416.3
438.1448.9441.9 448.5 454.8
512.9 521.3
150
200
250
300
350
400
450
500
550
2008 2009 2010 2011 2012
Rat
es p
er 1
00,0
00 p
opul
atio
n
Year
Figure 2.1. Reported Chlamydia Rates per 100,000 Population by Year, United States, California, and Los Angeles County (LAC), 2008-2012
United States¹
California²
LA County³
1CDC. Sexually Transmitted Disease Surveillance. 2012 data was not available as of September 11, 2013.2California Department of Health Services, STD Control Branch, Sexually Transmitted Diseases Data Tables, 2012 at website: http://www.cdph.ca.gov/data/statistics/Pages/STDDataTables.aspx (accessed on September 11, 2013). 3Los Angeles County Disvion of HIV and STD Programs, 2012. Excludes cases from Pasadena and Long Beach.

Sexually Transmitted Disease Morbidity Report - 2012 19
2008 2009 2010No. (%) Rate No. (%) Rate No. (%) Rate No. (%) Rate No. (%) Rate
0-14 382 0.9 18.1 315 0.7 15.3 314 0.7 15.3 311 0.7 17.2 249 0.5 13.9
15-19 12,040 28.0 1,606.8 12,136 27.7 1,585.1 11,785 26.4 1,643.8 11,727 24.7 1,651.7 10,816 22.3 1,545.5
20-24 15,056 35.0 2,127.6 15,464 35.3 2,167.0 16,216 36.3 2,333.2 17,632 37.1 2,556.7 17,981 37.1 2,606.4
25-29 7,620 17.7 1,134.8 7,756 17.7 1,151.6 7,770 17.4 987.3 8,565 18.0 1,217.0 9,257 19.1 1,328.4
30-34 3,533 8.2 508.7 3,602 8.2 529.2 3,718 8.3 495.5 4,028 8.5 597.1 4,403 9.1 647.2
35-44 3,070 7.1 205.8 3,052 7.0 205.2 3,321 7.4 230.7 3,531 7.4 264.9 3,812 7.9 287.8
45-54 964 2.2 71.7 1,097 2.5 80.1 1,127 2.5 83.4 1,225 2.6 95.1 1,470 3.0 114.3
55-64 176 0.4 19.1 218 0.5 22.9 241 0.5 25.1 312 0.7 31.5 334 0.7 32.8
65+ 37 0.1 3.6 65 0.1 6.1 51 0.1 4.8 79 0.2 7.5 72 0.1 6.5
Unknown 109 0.3 . 104 0.2 . 76 0.2 . 77 0.2 . 67 0.1 .
Total 42,987 441.9 43,809 448.5 44,619 454.8 47,487 512.9 48,461 521.3
Note: Cumulative percentages may not equal 100% because of rounding. Excludes cases from Pasadena and Long Beach.
2011
Table 2.1. Reported Chlamydia Cases and Rates per 100,000 Population by Age Group,Los Angeles County, 2008-2012
2012

Sexually Transmitted Disease Morbidity Report - 2012 20
13.9
1545.5
2606.4
1328.4
647.2
287.8
114.332.8 6.5
0
500
1000
1500
2000
2500
3000
0-14 15-19 20-24 25-29 30-34 35-44 45-54 55-64 65+
Rat
e pe
r 100
,000
pop
ulat
ion
Age Group
Figure 2.2. Reported Chlamydia Rates per 100,000 Population in Los Angeles County, by Age Group, 2012
Note: Excludes cases in Long Beach and Pasadena

Sexually Transmitted Disease Morbidity Report - 2012 21
No. (%) Rate No. (%) Rate No. (%) Rate No. (%) Rate No. (%) Rate
MALE
0-14 75 0.6 7.0 56 0.4 5.3 59 0.4 5.6 50 0.3 5.4 52 0.3 5.715-19 2,777 20.5 728.8 2,860 19.7 735.0 2,837 18.8 773.6 2,757 17.0 759.5 2,474 14.5 693.820-24 4,295 31.6 1,184.6 4,567 31.4 1,253.8 4,747 31.5 1,333.6 5,212 32.2 1,471.7 5,309 31.2 1,501.525-29 2,736 20.2 782.8 2,950 20.3 838.2 3,088 20.5 754.6 3,355 20.7 933.0 3,766 22.1 1,057.230-34 1,412 10.4 398.5 1,581 10.9 454.2 1,648 10.9 428.7 1,860 11.5 545.8 2,110 12.4 612.535-44 1,555 11.5 205.6 1,614 11.1 214.2 1,765 11.7 242.0 1,849 11.4 277.9 2,019 11.9 305.445-54 551 4.1 82.9 693 4.8 102.1 727 4.8 108.3 836 5.2 131.6 1,008 5.9 158.755-64 103 0.8 23.6 132 0.9 29.2 146 1.0 31.9 202 1.2 42.8 203 1.2 41.865+ 17 0.1 3.9 31 0.2 6.9 30 0.2 6.7 49 0.3 10.9 47 0.3 9.8Unknown 51 0.4 . 40 0.3 . 24 0.2 . 33 0.2 . 27 0.2 .
Subtotal 13,572 31.8 281.5 14,524 33.3 299.9 15,071 33.9 309.4 16,203 34.2 354.7 17,015 35.2 371.0
FEMALE
0-14 307 1.1 29.8 258 0.9 25.6 255 0.9 25.5 261 0.8 29.5 197 0.6 22.515-19 9,206 31.6 2,499.7 9,229 31.7 2,451.2 8,905 30.3 2,542.8 8,939 28.7 2,576.1 8,326 26.6 2,425.720-24 10,694 36.7 3,098.9 10,857 37.3 3,107.6 11,422 38.8 3,368.8 12,374 39.7 3,688.2 12,636 40.3 3,757.425-29 4,832 16.6 1,500.8 4,773 16.4 1,484.4 4,663 15.9 1,234.5 5,182 16.6 1,505.6 5,459 17.4 1,602.730-34 2,084 7.1 612.6 2,005 6.9 602.9 2,059 7.0 562.7 2,155 6.9 645.4 2,280 7.3 678.835-44 1,488 5.1 202.3 1,425 4.9 194.1 1,541 5.2 217.1 1,671 5.4 250.3 1,784 5.7 268.945-54 400 1.4 58.8 395 1.4 57.2 394 1.3 57.9 387 1.2 59.2 460 1.5 70.655-64 73 0.3 15.1 86 0.3 17.3 95 0.3 18.8 110 0.4 21.2 131 0.4 24.665+ 20 0.1 3.3 34 0.1 5.5 21 0.1 3.4 30 0.1 5.0 24 0.1 3.8Unknown 48 0.2 . 61 0.2 . 47 0.2 . 44 0.1 . 38 0.1 .
Subtotal 29,152 68.2 594.1 29,123 66.7 591.4 29,402 66.1 595.1 31,153 65.8 664.0 31,335 64.8 665.4
Total1,2 42,987 441.9 43,809 448.5 44,619 454.8 47,487 512.9 48,461 521.3
1. Includes cases reported as "Unknown" gender and age.2. Includes cases reported as "Unknown/Other/Ambiguous Genitalia" gender and known age.Note: Cumulative percentages may not equal 100% because of rounding. Excludes cases from Pasadena and Long Beach. Includes Transgender cases.
Table 2.2. Reported Chlamydia Cases and Rates per 100,000 Population by Gender and Age Group,Los Angeles County, 2008-2012
2011 2012201020092008

Sexually Transmitted Disease Morbidity Report - 2012 22
281.5 299.9 309.4354.7 371.0
594.1 591.4 595.1
664.0 665.4
0
200
400
600
800
1000
2008 2009 2010 2011 2012
Rat
e pe
r 100
,000
pop
ulat
ion
Year
Male Female
Figure 2.3. Reported Chlamydia Rates per 100,000 Population in Los Angeles County, by Gender and Year
Note: Excludes cases in Long Beach and Pasadena

Sexually Transmitted Disease Morbidity Report - 2012 23
5.7
693.8
1501.5
1057.2
612.5
305.4
158.7
41.8
9.8
05001000150020002500300035004000
0-14
15-19
20-24
25-29
30-34
35-44
45-54
55-64
65+
22.5
2425.7
3757.4
1602.7
678.8
268.9
70.6
24.6
3.8
0 500 1000 1500 2000 2500 3000 3500 4000
0-14
15-19
20-24
25-29
30-34
35-44
45-54
55-64
65+
Figure 2.4. Reported Chlamydia Rates per 100,000 Population in Los Angeles County, by Gender and Age Group, 2012
Note: Excludes cases in Long Beach and Pasadena
Male Rate per 100,000 population Female
Age

Sexually Transmitted Disease Morbidity Report - 2012 24
Adj. Adj. Adj. Adj. Adj. Adj.No. (%) Rate No. (%) Rate No. (%) Rate No. (%) Rate No. (%) Rate No. (%) Rate
MALE
2008 1,611 11.9 134.9 3,658 27.0 1115.5 4,939 36.4 254.6 433 3.2 85.2 63 0.5 13,572 31.8 281.52009 1,915 13.2 155.1 3,882 26.7 1149.4 5,585 38.5 278.4 442 3.0 84.1 131 0.9 14,524 33.3 299.92010 1,985 13.2 165.7 3,923 26.0 1173.7 5,669 37.6 282.0 477 3.2 89.8 113 0.8 15,071 33.9 309.42011 2,273 14.0 206.3 3,714 22.9 1239.1 6,088 37.6 328.0 549 3.4 107.6 178 1.1 16,203 34.2 354.72012 2,681 15.8 245.5 3,400 20.0 1141.0 6,392 37.6 344.2 591 3.5 116.2 225 1.3 17,015 35.2 371.0
FEMALE
2008 2,656 9.1 213.1 7,307 25.1 1881.6 12,964 44.5 659.0 1,106 3.8 191.2 151 0.5 29,152 68.2 594.12009 2,796 9.6 219.9 7,284 25.0 1846.0 13,275 45.6 660.0 1,135 3.9 191.7 254 0.9 29,123 66.7 591.42010 2,591 8.8 212.0 7,392 25.1 1915.3 12,889 43.8 649.7 1,088 3.7 183.0 241 0.8 29,402 66.1 595.12011 2,722 8.7 245.7 6,925 22.2 2018.2 13,792 44.3 734.7 1,169 3.8 200.1 410 1.3 31,153 65.8 664.02012 2,613 8.3 243.9 6,006 19.2 1805.7 13,792 44.0 752.5 1,178 3.8 207.6 369 1.2 31,335 64.8 665.4
1. Includes data for ethnicity reported as "Other," "Native American," and "Mixed."
Note: If race/ethnicity was not specified, cases were prorated according to the distribution of cases for which race/ethnicity was specified. Rates were adjusted including the prorated cases. Therefore, these tables should be used only for race/ethnicity comparisons, not for overall totals or gender totals. Cumulative percentages may not equal 100% because of
Other1
Table 2.3. Reported Chlamydia Cases and Rates per 100,000 Population by Gender and Race/Ethnicity, Los Angeles County, 2008-2012
White Black Latino Asian-Pacific Total2,3
2. Excludes cases reported with "Unknown/Other/Ambiguous Genitalia" gender. 3. Includes cases reported as "Unknown" race/ethnicity.
rounding. Cases from Pasadena and Long Beach were not included. Transgender cases were included.

Sexually Transmitted Disease Morbidity Report - 2012 25
245.5
1141.0
344.2
116.2
243.9
1805.7
752.5
207.6
0
200
400
600
800
1000
1200
1400
1600
1800
2000
White Black Latino Asian-Pacific
Rat
e pe
r 100
,000
pop
ulat
ion
Male Female
Figure 2.5. Reported Chlamydia Rates per 100,000 Population in Los Angeles County, by Gender and Race/Ethnicity, 2012
Note: Adjusted for unknown race. Excludes cases in Long Beach and Pasadena

Section III:
Gonorrhea

Sexually Transmitted Disease Morbidity Report - 2012 26
110.7
98.1 100.2104.2
69.264.8
71.9 73.1
89.384.1 86.9
96.8103.4
122.9
0
20
40
60
80
100
120
140
2008 2009 2010 2011 2012
Rat
es p
er 1
00,0
00 p
opul
atio
n
Year
Figure 3.1. Reported Gonorrhea Rates per 100,000 Population by Year, United States, California, and Los Angeles County (LAC), 2008-2012
United States¹
California²
LA County³
1CDC. Sexually Transmitted Disease Surveillance. 2012 data was not available as of September 11, 2013.2California Department of Health Services, STD Control Branch, Sexually Transmitted Diseases Data Tables, 2012 at website: http://www.cdph.ca.gov/data/statistics/Pages/STDDataTables.aspx (accessed on September 11, 2013). 3Los Angeles County Division of HIV and STD Programs, 2012. Excludes cases from Pasadena and Long Beach.

Sexually Transmitted Disease Morbidity Report - 2012 27
2008 2009 2010No. (%) Rate No. (%) Rate No. (%) Rate No. (%) Rate No. (%) Rate
0-14 86 1.1 4.1 47 0.6 2.3 61 0.6 3.0 49 0.5 2.7 49 0.4 2.7
15-19 1,819 22.2 242.8 1,682 19.8 219.7 1,634 17.2 227.9 1,617 16.9 227.7 1,590 13.9 227.2
20-24 2,399 29.3 339.0 2,408 28.4 337.4 2,625 27.6 377.7 2,700 28.2 391.5 3,226 28.2 467.6
25-29 1,460 17.8 217.4 1,713 20.2 254.4 1,912 20.1 243.0 1,937 20.2 275.2 2,468 21.6 354.2
30-34 803 9.8 115.6 908 10.7 133.4 1,102 11.6 146.9 1,153 12.0 170.9 1,419 12.4 208.6
35-44 1,067 13.0 71.5 1,109 13.1 74.6 1,361 14.3 94.6 1,242 13.0 93.2 1,572 13.8 118.7
45-54 433 5.3 32.2 493 5.8 36.0 631 6.6 46.7 695 7.3 53.9 873 7.6 67.9
55-64 89 1.1 9.7 85 1.0 8.9 132 1.4 13.7 146 1.5 14.7 191 1.7 18.7
65+ 10 0.1 1.0 25 0.3 2.4 18 0.2 1.7 23 0.2 2.2 21 0.2 1.9
Unknown 18 0.2 . 16 0.2 . 22 0.2 . 10 0.1 . 16 0.1 .
Total 8,184 84.1 8,486 86.9 9,498 96.8 9,572 103.4 11,425 122.9
Note: Cumulative percentages may not equal 100% because of rounding. Excludes cases from Pasadena and Long Beach.
2011
Table 3.1. Reported Gonorrhea Cases and Rates per 100,000 Population by Age Group, Los Angeles County, 2008-2012
2012

Sexually Transmitted Disease Morbidity Report - 2012 28
2.7
227.2
467.6
354.2
208.6
118.7
67.9
18.71.9
0
50
100
150
200
250
300
350
400
450
500
0-14 15-19 20-24 25-29 30-34 35-44 45-54 55-64 65+
Rat
e pe
r 100
,000
pop
ulat
ion
Age Group
Figure 3.2. Reported Gonorrhea Rates per 100,000 Population in Los Angeles County, by Age Group, 2012
Note: Excludes cases in Long Beach and Pasadena

Sexually Transmitted Disease Morbidity Report - 2012 29
No. (%) Rate No. (%) Rate No. (%) Rate No. (%) Rate No. (%) Rate
MALE
0-14 17 0.4 1.6 10 0.2 0.9 7 0.1 0.7 9 0.1 1.0 12 0.2 1.315-19 651 14.2 170.9 674 12.8 173.2 680 11.3 185.4 609 10.0 167.8 635 8.3 178.120-24 1,249 27.2 344.5 1,316 25.1 361.3 1,430 23.7 401.7 1,511 24.8 426.7 1,848 24.2 522.725-29 881 19.2 252.1 1,167 22.2 331.6 1,310 21.7 320.1 1,352 22.1 376.0 1,773 23.2 497.730-34 527 11.5 148.7 674 12.8 193.6 797 13.2 207.3 875 14.3 256.8 1,108 14.5 321.635-44 812 17.7 107.4 900 17.1 119.4 1,118 18.5 153.3 996 16.3 149.7 1,289 16.9 195.045-54 363 7.9 54.6 416 7.9 61.3 555 9.2 82.7 601 9.8 94.6 766 10.0 120.655-64 73 1.6 16.7 65 1.2 14.4 110 1.8 24.1 125 2.0 26.5 168 2.2 34.665+ 6 0.1 1.4 22 0.4 4.9 15 0.2 3.4 23 0.4 5.1 18 0.2 3.8Unknown 11 0.2 . 7 0.1 . 16 0.3 . 4 0.1 . 12 0.2 .
Subtotal 4,590 56.6 95.2 5,251 62.2 108.4 6,038 63.9 124.0 6,105 64.0 133.7 7,629 66.9 166.3
FEMALE
0-14 69 2.0 6.7 37 1.2 3.7 54 1.6 5.4 40 1.2 4.5 37 1.0 4.215-19 1,163 33.0 315.8 1,004 31.5 266.7 952 27.9 271.8 1,007 29.3 290.2 955 25.3 278.220-24 1,131 32.1 327.7 1,085 34.0 310.6 1,185 34.7 349.5 1,182 34.4 352.3 1,374 36.4 408.625-29 566 16.1 175.8 529 16.6 164.5 586 17.2 155.1 577 16.8 167.6 687 18.2 201.730-34 263 7.5 77.3 226 7.1 68.0 295 8.6 80.6 275 8.0 82.4 304 8.1 90.535-44 243 6.9 33.0 204 6.4 27.8 237 6.9 33.4 240 7.0 35.9 281 7.4 42.445-54 65 1.8 9.6 76 2.4 11.0 73 2.1 10.7 90 2.6 13.8 105 2.8 16.155-64 14 0.4 2.9 20 0.6 4.0 22 0.6 4.4 21 0.6 4.0 23 0.6 4.365+ 4 0.1 0.7 3 0.1 0.5 3 0.1 0.5 0 0.0 0.0 3 0.1 0.5Unknown 6 0.2 . 4 0.1 . 5 0.1 . 6 0.2 . 4 0.1 .
Subtotal 3,524 43.4 71.8 3,188 37.8 64.7 3,412 36.1 69.1 3,438 36.0 73.3 3,773 33.1 80.1
Total1,2 8,184 84.1 8,486 86.9 9,498 96.8 9,572 103.4 11,425 122.9
1. Includes cases reported as "Unknown" gender and age.2. Includes cases reported as "Unknown/Other/Ambiguous Genitalia" gender and known age.Note: Cumulative percentages may not equal 100% because of rounding. Excludes cases from Pasadena and Long Beach. Includes Transgender cases.
Table 3.2. Reported Gonorrhea Cases and Rates per 100,000 Population by Gender and Age Group,Los Angeles County, 2008-2012
2011 20122008 2009 2010

Sexually Transmitted Disease Morbidity Report - 2012 30
95.2
108.4
124.0133.7
166.3
71.864.7
69.173.3
80.1
0
50
100
150
200
2008 2009 2010 2011 2012
Rat
e pe
r 100
,000
pop
ulat
ion
Year
Male Female
Figure 3.3. Reported Gonorrhea Rates per 100,000 Population in Los Angeles County, by Gender and Year
Note: Excludes cases in Long Beach and Pasadena

Sexually Transmitted Disease Morbidity Report - 2012 31
1.3
178.1
497.7
321.6
195.0
120.6
34.6
3.8
0100200300400500
0-14
15-19
20-24
25-29
30-34
35-44
45-54
55-64
65+
4.2
278.2
408.6
201.7
90.5
42.4
16.1
4.3
0.5
0 100 200 300 400 500
0-14
15-19
20-24
25-29
30-34
35-44
45-54
55-64
65+
Figure 3.4. Reported Gonorrhea Rates per 100,000 Population in Los Angeles County, by Gender and Age Group, 2012
Note: Excludes cases in Long Beach and Pasadena
Male Rate per 100,000 population Female
Age

Sexually Transmitted Disease Morbidity Report - 2012 32
Adj. Adj. Adj. Adj. Adj. Adj.No. (%) Rate No. (%) Rate No. (%) Rate No. (%) Rate No. (%) Rate No. (%) Rate
MALE
2008 879 19.2 69.6 1,827 39.8 526.9 1,060 23.1 51.7 118 2.6 22.0 38 0.8 4,590 56.6 95.22009 1,141 21.7 87.4 1,956 37.3 547.5 1,354 25.8 63.8 150 2.9 27.0 59 1.1 5,251 62.2 108.42010 1,508 25.0 114.7 1,978 32.8 539.2 1,777 29.4 80.5 196 3.3 33.6 56 0.9 6,038 63.9 124.02011 1,454 23.8 118.4 1,893 31.0 566.5 1,956 32.0 94.5 222 3.6 39.0 60 1.0 6,105 64.0 133.72012 2,067 27.1 168.1 2,010 26.4 599.0 2,562 33.6 122.5 268 3.5 46.8 93 1.2 7,629 66.9 166.3
FEMALE
2008 370 10.5 28.5 1,806 51.3 445.9 788 22.4 38.4 110 3.1 18.2 19 0.5 3,524 43.4 71.82009 384 12.1 29.1 1,645 51.6 402.2 671 21.1 32.2 99 3.1 16.1 39 1.2 3,188 37.8 64.72010 487 14.3 36.8 1,676 49.1 400.7 834 24.4 38.8 97 2.8 15.1 25 0.7 3,412 36.1 69.12011 402 11.7 32.8 1,645 47.9 433.7 978 28.5 47.1 93 2.7 14.4 35 1.0 3,438 36.0 73.32012 477 12.6 39.0 1,555 41.2 409.2 1,268 33.6 60.6 117 3.1 18.1 49 1.3 3,773 33.1 80.1
1. Includes data for ethnicity reported as "Other," "Native American," and "Mixed."
Note: If race/ethnicity was not specified, cases were prorated according to the distribution of cases for which race/ethnicity was specified. Rates were adjusted including the prorated cases. Therefore, these tables should be used only for race/ethnicity comparisons, not for overall totals or gender totals. Cumulative percentages may not equal 100% because of
Table 3.3. Reported Gonorrhea Cases and Rates per 100,000 Populationby Gender and Race/Ethnicity, Los Angeles County, 2008-2012
White Black Latino Asian-Pacific Other1 Total2,3
2. Excludes cases reported with "Unknown/Other/Ambiguous Genitalia" gender. 3. Includes cases reported as "Unknown" race/ethnicity.
rounding. Cases from Pasadena and Long Beach were not included. Transgender cases were included.

Sexually Transmitted Disease Morbidity Report - 2012 33
168.1
599.0
122.5
46.839.0
409.2
60.6
18.1
0
100
200
300
400
500
600
700
White Black Latino Asian-Pacific
Rat
e pe
r 100
,000
pop
ulat
ion
Male Female
Figure 3.5. Reported Gonnorhea Rates per 100,000 Population in Los Angeles County, by Gender and Race/Ethnicity, 2012
Note: Adjusted for unknown race. Excludes cases in Long Beach and Pasadena

Section IV:
Primary and Secondary Syphilis

Sexually Transmitted Disease Morbidity Report - 2012 34
4.4
4.6 4.54.5
5.95.5
5.6
6.5
7.87.3
7.2 6.5
8.1
9.4
0
1
2
3
4
5
6
7
8
9
10
2008 2009 2010 2011 2012
Rat
es p
er 1
00,0
00 p
opul
atio
n
Year
Figure 4.1. Reported Primary and Secondary Syphilis Rates per 100,000 Population by Year, United States, California, and Los Angeles County (LAC),
2008-2012
United States¹
California²
LA County³
1CDC. Sexually Transmitted Disease Surveillance. 2012 data was not available as of September 11, 2013.2California Department of Health Services, STD Control Branch, Sexually Transmitted Diseases Data Tables, 2012 at website: http://www.cdph.ca.gov/data/statistics/Pages/STDDataTables.aspx (accessed on September 11, 2013). 3Los Angeles County Division of HIV and STD Programs, 2012. Excludes cases from Pasadena and Long Beach.

Sexually Transmitted Disease Morbidity Report - 2012 35
2008 2009 2010No. (%) Rate No. (%) Rate No. (%) Rate No. (%) Rate No. (%) Rate
0-14 0 0.0 0.0 1 0.1 0.0 0 0.0 0.0 0 0.0 0.0 0 0.0 0.0
15-19 29 4.1 3.9 18 2.6 2.4 27 4.2 3.8 25 3.3 3.5 22 2.5 3.1
20-24 113 16.0 16.0 109 15.5 15.3 87 13.7 12.5 113 15.1 16.4 156 17.8 22.6
25-29 122 17.3 18.2 138 19.6 20.5 109 17.1 13.9 159 21.2 22.6 166 18.9 23.8
30-34 107 15.2 15.4 94 13.4 13.8 102 16.0 13.6 108 14.4 16.0 114 13.0 16.8
35-44 219 31.0 14.7 188 26.7 12.6 189 29.7 13.1 180 24.0 13.5 222 25.3 16.8
45-54 101 14.3 7.5 116 16.5 8.5 101 15.9 7.5 132 17.6 10.2 151 17.2 11.7
55-64 13 1.8 1.4 31 4.4 3.3 17 2.7 1.8 29 3.9 2.9 29 3.3 2.8
65+ 2 0.3 0.2 7 1.0 0.7 3 0.5 0.3 3 0.4 0.3 16 1.8 1.4
Unknown 1 0.1 . 2 0.3 . 1 0.1 . 2 0.2 .
Total 706 7.3 703 7.2 637 6.5 750 8.1 878 9.4
Note: Cumulative percentages may not equal 100% because of rounding. Excludes cases from Pasadena and Long Beach.
2011
Table 4.1. Reported Primary and Secondary Syphilis Cases and Rates per 100,000 Population by Age Group, Los Angeles County, 2008-2012
2012

Sexually Transmitted Disease Morbidity Report - 2012 36
0.0
3.1
22.623.8
16.8 16.8
11.7
2.81.4
0
5
10
15
20
25
30
0-14 15-19 20-24 25-29 30-34 35-44 45-54 55-64 65+
Rat
e pe
r 100
,000
pop
ulat
ion
Age Group
Figure 4.2. Reported Primary and Secondary Syphilis Rates per 100,000 Population in Los Angeles County, by Age Group, 2012
Note: Excludes cases in Long Beach and Pasadena

Sexually Transmitted Disease Morbidity Report - 2012 37
No. (%) Rate No. (%) Rate No. (%) Rate No. (%) Rate No. (%) Rate
MALE
0-14 0 0.0 0.0 1 0.1 0.1 0 0.0 0.0 0 0.0 0.0 0 0.0 0.015-19 27 4.0 7.1 16 2.4 4.1 27 4.3 7.4 24 3.3 6.6 19 2.2 5.320-24 104 15.3 28.7 104 15.4 28.6 86 13.8 24.2 109 14.8 30.8 144 16.9 40.725-29 118 17.4 33.8 133 19.7 37.8 106 17.0 25.9 153 20.8 42.5 163 19.2 45.830-34 105 15.4 29.6 92 13.6 26.4 100 16.1 26.0 107 14.6 31.4 110 12.9 31.935-44 213 31.3 28.2 179 26.5 23.8 185 29.7 25.4 178 24.2 26.8 220 25.9 33.345-54 98 14.4 14.7 112 16.6 16.5 97 15.6 14.4 131 17.8 20.6 148 17.4 23.355-64 13 1.9 3.0 30 4.4 6.6 17 2.7 3.7 29 3.9 6.1 28 3.3 5.865+ 2 0.3 0.5 7 1.0 1.6 3 0.5 0.7 3 0.4 0.7 16 1.9 3.3Unknown 1 0.1 . 2 0.3 . 1 0.1 . 2 0.2 .
Subtotal 680 96.3 14.1 675 96.0 13.9 623 97.8 12.8 735 98.0 16.1 850 96.8 18.5
FEMALE
0-14 0 0.0 0.0 0 0.0 0.0 0 0.0 0.0 0 0.0 0.0 0 0.0 0.015-19 2 7.7 0.5 2 7.1 0.5 0 0.0 0.0 1 6.7 0.3 3 10.7 0.920-24 9 34.6 2.6 5 17.9 1.4 1 7.1 0.3 4 26.7 1.2 12 42.9 3.625-29 4 15.4 1.2 5 17.9 1.6 3 21.4 0.8 6 40.0 1.7 3 10.7 0.930-34 2 7.7 0.6 2 7.1 0.6 2 14.3 0.5 1 6.7 0.3 4 14.3 1.235-44 6 23.1 0.8 9 32.1 1.2 4 28.6 0.6 2 13.3 0.3 2 7.1 0.345-54 3 11.5 0.4 4 14.3 0.6 4 28.6 0.6 1 6.7 0.2 3 10.7 0.555-64 0 0.0 0.0 1 3.6 0.2 0 0.0 0.0 0 0.0 0.0 1 3.6 0.265+ 0 0.0 0.0 0 0.0 0.0 0 0.0 0.0 0 0.0 0.0 0 0.0 0.0Unknown
Subtotal 26 3.7 0.5 28 4.0 0.6 14 2.2 0.3 15 2.0 0.3 28 3.2 0.6
Total 706 7.3 703 7.2 637 6.5 750 8.1 878 9.4
Note: Cumulative percentages may not equal 100% because of rounding. Excludes cases from Pasadena and Long Beach. Includes Transgender cases.
Table 4.2. Reported Primary and Secondary Syphilis Cases and Rates per 100,000 Population by Gender and Age Group, Los Angeles County, 2008-2012
2011 2012201020092008

Sexually Transmitted Disease Morbidity Report - 2011 (Volume 1) 38
14.1 13.912.8
16.1
18.5
0.5 0.6 0.3 0.3 0.6
0
10
20
30
2008 2009 2010 2011 2012
Rat
e pe
r 100
,000
pop
ulat
ion
Year
Male Female
Figure 4.3. Reported Primary and Secondary Syphilis Rates per 100,000 Population in Los Angeles County, by Gender and Year
Note: Excludes cases in Long Beach and Pasadena

Sexually Transmitted Disease Morbidity Report - 2012 39
0.0
5.3
40.7
45.8
31.9
33.3
23.3
5.8
3.3
01020304050
0-14
15-19
20-24
25-29
30-34
35-44
45-54
55-64
65+
0.0
0.9
3.6
0.9
1.2
0.3
0.5
0.2
0.0
0 10 20 30 40 50
0-14
15-19
20-24
25-29
30-34
35-44
45-54
55-64
65+
Figure 4.4. Reported Primary and Secondary Syphilis Rates per 100,000 Population in Los Angeles County, by Gender and Age Group, 2012
Note: Excludes cases in Long Beach and Pasadena
Male Rate per 100,000 population Female
Age

Sexually Transmitted Disease Morbidity Report - 2012 40
Adj. Adj. Adj. Adj. Adj. Adj.No. (%) Rate No. (%) Rate No. (%) Rate No. (%) Rate No. (%) Rate No. (%) Rate
MALE
2008 222 32.7 15.8 104 15.3 26.9 298 43.8 13.0 29 4.3 4.8 8 1.2 680 96.3 14.12009 270 40.0 18.9 99 14.7 25.4 255 37.8 11.0 34 5.0 5.6 4 0.6 675 96.0 13.92010 208 33.4 14.8 102 16.4 26.0 271 43.5 11.5 29 4.7 4.6 4 0.6 623 97.8 12.82011 222 30.2 17.1 141 19.2 39.8 313 42.6 14.3 30 4.1 5.0 11 1.5 735 98.0 16.12012 255 30.0 19.7 183 21.5 51.9 331 38.9 15.1 50 5.9 8.3 5 0.6 850 96.8 18.5
FEMALE
2008 3 11.5 0.2 8 30.8 1.8 13 50.0 0.6 1 3.9 0.2 0 0.0 26 3.7 0.52009 6 21.4 0.4 12 42.9 2.6 10 35.7 0.4 0 0.0 0.0 0 0.0 28 4.0 0.62010 1 7.1 0.1 4 28.6 0.9 8 57.1 0.3 0 0.0 0.0 1 7.1 14 2.2 0.32011 4 26.7 0.3 4 26.7 1.0 6 40.0 0.3 1 6.7 0.1 0 0.0 15 2.0 0.32012 3 10.7 0.2 10 35.7 2.5 14 50.0 0.6 0 0.0 0.0 0 0.0 28 3.2 0.6
1. Includes data for ethnicity reported as "Other," "Native American," and "Mixed."
Note: If race/ethnicity was not specified, cases were prorated according to the distribution of cases for which race/ethnicity was specified. Rates were adjusted including the prorated cases. Therefore, these tables should be used only for race/ethnicity comparisons, not for overall totals or gender totals. Cumulative percentages may not equal 100% because of rounding. Cases from Pasadena and Long Beach were not included. Transgender cases were included.
Total2
2. Includes cases reported as "Unknown" race/ethnicity.
Table 4.3. Reported Primary and Secondary Syphilis Cases and Rates per 100,000 Population by Gender and Race/Ethnicity, Los Angeles County, 2008-2012
White Black Latino Asian-Pacific Other1

Sexually Transmitted Disease Morbidity Report - 2012 41
19.7
51.9
15.1
8.3
0.22.5
0.6 0.00
10
20
30
40
50
60
White Black Latino Asian-Pacific
Rat
e pe
r 100
,000
pop
ulat
ion
Male Female
Figure 4.5. Reported Primary and Secondary Syphilis Rates per 100,000 Population in Los Angeles County, by Gender and Race/Ethnicity, 2012
Note: Adjusted for unknown race. Excludes cases in Long Beach and Pasadena

Section V:
Early Latent Syphilis

Sexually Transmitted Disease Morbidity Report - 2012 42
4.1 4.3
4.4 4.34.5 4.6
4.95.5
6.67.9
9.8 9.3
11.3
13.7
0
1
2
3
4
5
6
7
8
9
10
11
12
13
14
15
2008 2009 2010 2011 2012
Rat
es p
er 1
00,0
00 p
opul
atio
n
Year
Figure 5.1. Reported Early Latent Syphilis Rates per 100,000 Population by Year, United States, California, and Los Angeles County (LAC), 2008-2012
United States¹
California²
LA County³
1CDC. Sexually Transmitted Disease Surveillance, 2012 was not available as of September 11, 2013.2California Department of Health Services, STD Control Branch, Sexually Transmitted Diseases Data Tables, 2012 at website: http://www.cdph.ca.gov/data/statistics/Pages/STDDataTables.aspx (accessed on September 11, 2013). 3Los Angeles County Division of HIV and STD Programs, 2012. Excludes cases from Pasadena and Long Beach.

Sexually Transmitted Disease Morbidity Report - 2012 43
2008 2009 2010No. (%) Rate No. (%) Rate No. (%) Rate No. (%) Rate No. (%) Rate
0-14 1 0.1 0.0 1 0.1 0.0 0 0.0 0.0 1 0.1 0.1 1 0.1 0.1
15-19 21 2.7 2.8 22 2.3 2.9 26 2.8 3.6 28 2.7 3.9 26 2.0 3.7
20-24 88 11.4 12.4 105 11.0 14.7 96 10.5 13.8 121 11.6 17.5 137 10.7 19.9
25-29 131 17.0 19.5 140 14.6 20.8 133 14.5 16.9 162 15.6 23.0 210 16.5 30.1
30-34 87 11.3 12.5 141 14.7 20.7 126 13.8 16.8 149 14.3 22.1 166 13.0 24.4
35-44 273 35.5 18.3 311 32.5 20.9 306 33.4 21.3 302 29.0 22.7 371 29.1 28.0
45-54 130 16.9 9.7 182 19.0 13.3 174 19.0 12.9 211 20.3 16.4 304 23.8 23.6
55-64 27 3.5 2.9 42 4.4 4.4 42 4.6 4.4 59 5.7 5.9 54 4.2 5.3
65+ 9 1.2 0.9 12 1.3 1.1 12 1.3 1.1 7 0.7 0.7 5 0.4 0.5
Unknown 3 0.4 . 2 0.2 . 1 0.1 . 1 0.1 . 2 0.2 .
Total 770 7.9 958 9.8 916 9.3 1,041 11.2 1,276 13.7
Note: Cumulative percentages may not equal 100% because of rounding. Excludes cases from Pasadena and Long Beach.
2011
Table 5.1. Reported Early Latent Syphilis Cases and Rates per 100,000 Population by Age Group, Los Angeles County, 2008-2012
2012

Sexually Transmitted Disease Morbidity Report - 2012 44
0.1
3.7
19.9
30.1
24.4
28.0
23.6
5.3
0.50
5
10
15
20
25
30
35
0-14 15-19 20-24 25-29 30-34 35-44 45-54 55-64 65+
Rat
e pe
r 100
,000
pop
ulat
ion
Age Group
Figure 5.2. Reported Early Latent Syphilis Rates per 100,000 Population in Los Angeles County,by Age Group, 2012
Note: Excludes cases in Long Beach and Pasadena

Sexually Transmitted Disease Morbidity Report - 2012 45
No. (%) Rate No. (%) Rate No. (%) Rate No. (%) Rate No. (%) Rate
MALE
0-14 1 0.1 0.1 1 0.1 0.1 0 0.0 0.0 1 0.1 0.1 0 0.0 0.015-19 12 1.7 3.1 16 1.8 4.1 14 1.7 3.8 20 2.0 5.5 21 1.8 5.920-24 70 10.1 19.3 93 10.7 25.5 85 10.0 23.9 112 11.5 31.6 115 9.7 32.525-29 114 16.5 32.6 126 14.5 35.8 125 14.8 30.5 146 14.9 40.6 195 16.5 54.730-34 78 11.3 22.0 129 14.9 37.1 119 14.0 31.0 142 14.5 41.7 154 13.0 44.735-44 262 37.9 34.6 291 33.6 38.6 289 34.1 39.6 289 29.6 43.4 352 29.7 53.245-54 118 17.1 17.8 162 18.7 23.9 165 19.5 24.6 204 20.9 32.1 289 24.4 45.555-64 25 3.6 5.7 37 4.3 8.2 37 4.4 8.1 55 5.6 11.7 52 4.4 10.765+ 8 1.2 1.8 10 1.2 2.2 12 1.4 2.7 7 0.7 1.6 5 0.4 1.0Unknown 3 0.4 . 2 0.2 . 1 0.1 . 1 0.1 . 2 0.2 .
Subtotal 691 89.7 14.3 867 90.5 17.9 847 92.5 17.4 977 93.9 21.4 1,185 93.0 25.8
FEMALE
0-14 0 0.0 0.0 0 0.0 0.0 0 0.0 0.0 0 0.0 0.0 1 1.1 0.115-19 9 11.4 2.4 6 6.6 1.6 12 17.4 3.4 8 12.5 2.3 5 5.6 1.520-24 18 22.8 5.2 12 13.2 3.4 11 15.9 3.2 9 14.1 2.7 21 23.6 6.225-29 17 21.5 5.3 14 15.4 4.4 8 11.6 2.1 16 25.0 4.6 15 16.9 4.430-34 9 11.4 2.6 12 13.2 3.6 7 10.1 1.9 7 10.9 2.1 12 13.5 3.635-44 11 13.9 1.5 20 22.0 2.7 17 24.6 2.4 13 20.3 1.9 18 20.2 2.745-54 12 15.2 1.8 20 22.0 2.9 9 13.0 1.3 7 10.9 1.1 15 16.9 2.355-64 2 2.5 0.4 5 5.5 1.0 5 7.2 1.0 4 6.3 0.8 2 2.2 0.465+ 1 1.3 0.2 2 2.2 0.3 0 0.0 0.0 0 0.0 0.0 0 0.0 0.0Unknown
Subtotal 79 10.3 1.6 91 9.5 1.8 69 7.5 1.4 64 6.1 1.4 89 7.0 1.9
Total 770 7.9 958 9.8 916 9.3 1,041 11.2 1,276 13.7
Note: Cumulative percentages may not equal 100% because of rounding. Excludes cases from Pasadena and Long Beach. Includes Transgender cases.
Table 5.2. Reported Early Latent Syphilis Cases and Rates per 100,000 Population by Gender and Age Group, Los Angeles County, 2008-2012
2011 2012201020092008

Sexually Transmitted Disease Morbidity Report - 2012 46
14.3
17.9 17.4
21.4
25.8
1.6 1.8 1.4 1.4 1.9
0
10
20
30
2008 2009 2010 2011 2012
Rat
e pe
r 100
,000
pop
ulat
ion
Year
Male Female
Figure 5.3. Reported Early Latent Syphilis Rates per 100,000 Population in Los Angeles County,by Gender and Year
Note: Excludes cases in Long Beach and Pasadena

Sexually Transmitted Disease Morbidity Report - 2012 47
0.0
5.9
32.5
54.7
44.7
53.2
45.5
10.7
1.0
0.010.020.030.040.050.060.0
0-14
15-19
20-24
25-29
30-34
35-44
45-54
55-64
65+
0.1
1.5
6.2
4.4
3.6
2.7
2.3
0.4
0.0
0.0 10.0 20.0 30.0 40.0 50.0 60.0
0-14
15-19
20-24
25-29
30-34
35-44
45-54
55-64
65+
Figure 5.4. Reported Early Latent Syphilis Rates per 100,000 Population in Los Angeles County, by Gender and Age Group, 2012
Note: Excludes cases in Long Beach and Pasadena
Male Rate per 100,000 population Female
Age

Sexually Transmitted Disease Morbidity Report - 2012 48
Adj. Adj. Adj. Adj. Adj. Adj.No. (%) Rate No. (%) Rate No. (%) Rate No. (%) Rate No. (%) Rate No. (%) Rate
MALE
2008 226 32.7 16.0 103 14.9 26.6 320 46.3 14.0 17 2.5 2.8 7 1.0 691 89.7 14.32009 254 29.3 17.7 140 16.2 35.8 411 47.5 17.7 34 3.9 5.6 14 1.6 866 90.5 17.92010 242 28.6 17.1 123 14.5 31.1 436 51.5 18.3 31 3.7 4.9 9 1.1 847 92.5 17.42011 265 27.1 20.2 168 17.2 47.0 492 50.4 22.2 23 2.4 3.8 14 1.4 977 93.9 21.42012 336 28.4 25.6 239 20.2 66.7 540 45.6 24.2 39 3.3 6.4 14 1.2 1,185 93.0 25.8
FEMALE
2008 3 3.8 0.2 21 26.6 4.6 52 65.8 2.3 3 3.8 0.4 0 0.0 79 10.3 1.62009 11 12.1 0.8 27 29.7 6.0 51 56.0 2.2 2 2.2 0.3 0 0.0 91 9.5 1.82010 3 4.4 0.2 24 34.8 5.4 38 55.1 1.7 3 4.4 0.4 0 0.0 69 7.5 1.42011 6 9.4 0.5 19 29.7 4.6 34 53.1 1.5 4 6.3 0.6 1 1.6 64 6.1 1.42012 6 6.7 0.5 37 41.6 9.1 41 46.1 1.8 4 4.5 0.6 0 0.0 89 7.0 1.9
1. Includes data for ethnicity reported as "Other," "Native American," and "Mixed."2. Includes cases reported as "Unknown" race/ethnicity.Note: If race/ethnicity was not specified, cases were prorated according to the distribution of cases for which race/ethnicity was specified. Rates were adjusted including the prorated cases. Therefore, these tables should be used only for race/ethnicity comparisons, not for overall totals or gender totals. Cumulative percentages may not equal 100% because of
Other1 Total2
rounding. Cases from Pasadena and Long Beach were not included. Transgender cases were included.
Table 5.3. Reported Early Latent Syphilis Cases and Rates per 100,000 Population by Gender and Race/Ethnicity, Los Angeles County, 2008-2012
White Black Latino Asian-Pacific

Sexually Transmitted Disease Morbidity Report - 2012 49
25.6
66.7
24.2
6.4
0.5
9.1
1.8 0.60
10
20
30
40
50
60
70
80
White Black Latino Asian-Pacific
Rat
e pe
r 100
,000
pop
ulat
ion
Male Female
Figure 5.5. Reported Early Latent Syphilis Rates per 100,000 Population in Los Angeles County,by Gender and Race/Ethnicity, 2012
Note: Adjusted for unknown race. Excludes cases in Long Beach and Pasadena

Section VI:
Late and Late Latent Syphilis

Sexually Transmitted Disease Morbidity Report - 2012 50
6.6
5.6 5.9 6.0
8.3 6.76.3 6.6 6.4
14.9
11.610.7
10.4 10.3
0
5
10
15
20
2008 2009 2010 2011 2012
Rat
es p
er 1
00,0
00 p
opul
atio
n
Year
Figure 6.1. Reported Late and Late Latent Syphilis Rates per 100,000 Population by Year, United States, California, and Los Angeles County (LAC), 2008-2012
United States¹
California²
LA County³
1CDC. Sexually Transmitted Disease Surveillance. 2012 data was not available as of September 11, 2013.2California Department of Health Services, STD Control Branch, Sexually Transmitted Diseases Data Tables, 2012 at website: http://www.cdph.ca.gov/data/statistics/Pages/STDDataTables.aspx (accessed on September 11, 2013). 3Los Angeles County Division of HIV and STD Programs, 2012. Excludes cases from Pasadena and Long Beach.Note: Late and late latent syphilis is classified as late latent, latent unknown duration, and late syphilis with clinical manifestations (including neurosyphilis).

Sexually Transmitted Disease Morbidity Report - 2012 51
2008 2009 2010No. (%) Rate No. (%) Rate No. (%) Rate No. (%) Rate No. (%) Rate
0-14 2 0.1 0.1 0 0.0 0.0 1 0.1 0.0 1 0.1 0.1 0 0.0 0.0
15-19 40 2.7 5.3 40 3.5 5.2 37 3.5 5.2 28 2.9 3.9 32 3.3 4.6
20-24 113 7.8 16.0 84 7.4 11.8 106 10.1 15.3 106 11.0 15.4 132 13.8 19.1
25-29 175 12.0 26.1 123 10.9 18.3 137 13.1 17.4 125 13.0 17.8 157 16.4 22.5
30-34 166 11.4 23.9 163 14.4 23.9 145 13.8 19.3 125 13.0 18.5 134 14.0 19.7
35-44 372 25.5 24.9 304 26.8 20.4 270 25.7 18.8 257 26.7 19.3 216 22.5 16.3
45-54 288 19.8 21.4 225 19.9 16.4 193 18.4 14.3 174 18.1 13.5 166 17.3 12.9
55-64 153 10.5 16.6 123 10.9 12.9 111 10.6 11.5 89 9.3 9.0 77 8.0 7.6
65+ 135 9.3 13.0 68 6.0 6.4 49 4.7 4.6 53 5.5 5.0 45 4.7 4.1
Unknown 12 0.8 . 3 0.3 . 0 0.0 . 3 0.3 . 1 0.1 .
Total 1,456 15.0 1,133 11.6 1,049 10.7 961 10.4 960 10.3
Note: Cumulative percentages may not equal 100% because of rounding. Excludes cases from Pasadena and Long Beach.1. Late and late latent syphilis is classified as late latent, latent unknown duration, and late syphilis with clinical manifestations (including neurosyphilis)
2011
Table 6.1. Reported Late and Late Latent Syphilis1 Cases and Rates per 100,000 Population by Age Group, Los Angeles County, 2008-2012
2012

Sexually Transmitted Disease Morbidity Report - 2012 52
No. (%) Rate No. (%) Rate No. (%) Rate No. (%) Rate No. (%) Rate
MALE
0-14 1 0.1 0.1 0 0.0 0.0 1 0.1 0.1 1 0.1 0.1 0 0.0 0.015-19 17 1.7 4.5 28 3.5 7.2 19 2.6 5.2 15 2.2 4.1 24 3.1 6.720-24 73 7.5 20.1 56 7.1 15.4 67 9.3 18.8 81 11.7 22.9 105 13.6 29.725-29 124 12.7 35.5 95 12.0 27.0 104 14.4 25.4 94 13.6 26.1 133 17.3 37.330-34 129 13.2 36.4 125 15.8 35.9 100 13.9 26.0 98 14.2 28.8 114 14.8 33.135-44 266 27.2 35.2 209 26.4 27.7 185 25.7 25.4 187 27.1 28.1 178 23.1 26.945-54 195 19.9 29.3 169 21.4 24.9 144 20.0 21.5 125 18.1 19.7 135 17.5 21.255-64 92 9.4 21.1 80 10.1 17.7 79 11.0 17.3 54 7.8 11.4 55 7.1 11.365+ 74 7.6 16.9 27 3.4 6.0 22 3.1 4.9 32 4.6 7.1 25 3.2 5.2Unknown 8 0.8 . 2 0.3 . 3 0.4 . 1 0.1 .
Subtotal 979 67.3 20.3 791 69.9 16.3 721 68.7 14.8 690 71.9 15.1 770 80.2 16.8
FEMALE
0-14 1 0.2 0.1 0 0.0 0.0 0 0.0 0.0 0 0.0 0.0 0 0.0 0.015-19 23 4.8 6.2 12 3.5 3.2 18 5.5 5.1 13 4.8 3.7 8 4.2 2.320-24 40 8.4 11.6 28 8.2 8.0 39 11.9 11.5 25 9.3 7.5 27 14.2 8.025-29 51 10.7 15.8 28 8.2 8.7 33 10.1 8.7 30 11.2 8.7 24 12.6 7.030-34 36 7.6 10.6 38 11.1 11.4 45 13.7 12.3 27 10.0 8.1 20 10.5 6.035-44 106 22.3 14.4 95 27.9 12.9 85 25.9 12.0 70 26.0 10.5 38 20.0 5.745-54 93 19.6 13.7 56 16.4 8.1 49 14.9 7.2 49 18.2 7.5 31 16.3 4.855-64 61 12.8 12.6 42 12.3 8.4 32 9.8 6.3 35 13.0 6.7 22 11.6 4.165+ 61 12.8 10.1 41 12.0 6.7 27 8.2 4.4 20 7.4 3.3 20 10.5 3.2Unknown 3 0.6 . 1 0.3 .
Subtotal 475 32.7 9.7 341 30.1 6.9 328 31.3 6.6 269 28.1 5.7 190 19.8 4.0
Total2 1,456 15.0 1,133 11.6 1,049 10.7 961 10.4 960 10.3
(Source: CDC. Sexually Transmitted Disease Surveillance)
Note: Cumulative percentages may not equal 100% because of rounding. Excludes cases from Pasadena and Long Beach. Includes Transgender cases.2. Includes cases reported as "Unknown/Other" gender and known age.
Table 6.2. Reported Late and Late Latent Syphilis1 Cases and Rates per 100,000 Population by Gender and Age Group, Los Angeles County, 2008-2012
2011 2012
1. Late and late latent syphilis is classified as late latent, latent unknown duration and late syphilis with clinical manifestations (including neurosyphilis).
2009 20102008

Sexually Transmitted Disease Morbidity Report - 2012 53
Adj. Adj. Adj. Adj. Adj. Adj.No. (%) Rate No. (%) Rate No. (%) Rate No. (%) Rate No. (%) Rate No. (%) Rate
MALE
2008 172 17.6 13.2 175 17.9 48.9 487 49.7 23.0 30 3.1 5.4 7 0.7 979 67.3 20.32009 136 17.2 10.3 131 16.6 36.3 408 51.6 19.0 28 3.5 5.0 9 1.1 791 69.9 16.32010 114 15.8 8.4 102 14.2 26.8 429 59.5 18.8 36 5.0 6.0 5 0.7 721 68.7 14.82011 141 20.4 11.1 122 17.7 35.4 355 51.5 16.6 30 4.4 5.1 7 1.0 690 71.9 15.12012 159 20.7 12.6 164 21.3 47.6 359 46.6 16.7 39 5.1 6.6 7 0.9 770 80.2 16.8
FEMALE
2008 36 7.6 2.8 83 17.5 20.8 257 54.1 12.7 28 5.9 4.7 4 0.8 475 32.7 9.72009 24 7.0 1.8 59 17.3 14.2 201 58.9 9.5 21 6.2 3.4 5 1.5 341 30.1 6.92010 19 5.8 1.4 65 19.8 15.1 201 61.3 9.1 22 6.7 3.3 2 0.6 328 31.3 6.62011 24 8.9 1.9 47 17.5 12.3 154 57.3 7.3 24 8.9 3.7 1 0.4 269 28.1 5.72012 13 6.8 1.1 41 21.6 10.7 99 52.1 4.7 23 12.1 3.5 0 0.0 190 19.8 4.0
1. Late and late latent syphilis is classified as late latent, latent unknown duration, and late syphilis with clinical manifestations (including neurosyphilis).2. Includes data for ethnicity reported as "Other," "Native American," and "Mixed."
Note: If race/ethnicity was not specified, cases were prorated according to the distribution of cases for which race/ethnicity was specified. Rates were adjusted including the prorated cases. Therefore, these tables should be used only for race/ethnicity comparisons, not for overall totals or gender totals. Cumulative percentages may not equal 100% because of rounding. Cases from Pasadena and Long Beach were not included. Transgender cases were included.
3. Excludes cases reported with "Unknown/Other" gender. 4. Includes cases reported as "Unknown" race/ethnicity.
Table 6.3. Reported Late and Late Latent Syphilis1 Cases and Rates per 100,000 Population by Gender and Race/Ethnicity, Los Angeles County, 2008-2012
White Black Latino Asian-Pacific Other2 Total3,4

Section VII:
Congenital Syphilis

Sexually Transmitted Disease Morbidity Report - 2012 54
10.5 10.19.1
8.5
12.7
10.4 10 9.6
5.9
14.0
11.5
6.1
11.5
4.9
0
10
20
30
2008 2009 2010 2011 2012
Rat
es p
er 1
00,0
00 L
ive
Birt
hs
Year
Figure 7.1. Reported Presumptive Congenital Syphilis Rates by Year, United States, California, and Los Angeles County (LAC), 2008-2012
United States¹
Californa²
LA County³
1CDC. Sexually Transmitted Disease Surveillance. 2012 data was not available as of September 11, 20132California Department of Health Services, STD Control Branch, Sexually Transmitted Diseases Data Tables, 2012 at website: http://www.cdph.ca.gov/data/statistics/Pages/STDDataTables.aspx (accessed on September 11, 2013). 3Los Angeles County Division of HIV and STD Programs, 2012. Note: Excludes cases from Pasadena and Long Beach.

Sexually Transmitted Disease Morbidity Report - 2012 55
Adj. Adj. Adj. Adj.No. (%) Rate No. (%) Rate No. (%) Rate No. (%) Rate No. (%) Rate
2008 0 0.0 0.0 4 20.0 39.0 11 55.0 12.6 1 5.0 6.4 20 100.0 14.0
2009 2 13.3 9.1 2 13.3 20.2 7 46.7 8.6 0 0.0 0.0 15 100.0 11.5
2010 0 0.0 0.0 3 37.5 31.4 3 37.5 3.9 0 0.0 0.0 8 100.0 6.5
2011 2 14.3 9.2 6 42.9 65.6 4 28.6 5.4 1 7.1 6.6 14 100.0 11.5
2012 0 0.0 0.0 2 33.3 21.9 2 33.3 2.7 1 16.7 6.6 6 100.0 4.9
1. Includes cases reported as "Unknown" race/ethnicity.2. Cases from Pasadena and Long Beach were not included.Live birth data courtesy of Los Angeles Office of Health Assessment and Epidemiology. Note: if race/ethnicity was not specified, cases were prorated according to the distribution of cases for which race/ethnicity was specified. Rates wereadjusted including the prorated cases. Therefore, these tables should be used only for race/ethnicity comparisons, not for overall totals or gender totals.Cumulative percentages may not equal 100% because of rounding.
Table 7.1. Reported Presumptive Congenital Syphilis Cases and Rates per 100,000 Live Births by Race/Ethnicity, Los Angeles County, 2008-2012
White Black Hispanic Asian-Pacific Total1,2

Section VIII:
All Pelvic Inflammatory Disease

Sexually Transmitted Disease Morbidity Report - 2012 56
No. (%) Rate No. (%) Rate No. (%) Rate No. (%) Rate No. (%) Rate
FEMALE
0-14 7 3.5 0.7 1 0.6 0.1 2 1.0 0.2 1 0.5 0.1 4 1.8 0.5
15-19 62 31.2 16.6 45 25.9 12.0 43 21.0 12.3 57 26.9 16.4 57 25.2 16.6
20-24 44 22.1 12.6 51 29.3 14.6 70 34.1 20.6 75 35.4 22.4 59 26.1 17.5
25-29 36 18.1 11.0 28 16.1 8.7 31 15.1 8.2 29 13.7 8.4 40 17.7 11.7
30-34 18 9.0 5.2 21 12.1 6.3 23 11.2 6.3 21 9.9 6.3 22 9.7 6.6
35-44 23 11.6 3.1 23 13.2 3.1 17 8.3 2.4 18 8.5 2.7 29 12.8 4.4
45-54 7 3.5 1.0 4 2.3 0.6 10 4.9 1.5 8 3.8 1.2 8 3.5 1.2
55-64 1 0.5 0.2 1 0.6 0.2 8 3.9 1.6 1 0.5 0.2 3 1.3 0.6
65+ 1 0.5 0.2 0 0.0 0.0 0 0.0 0.0 1 0.5 0.2 1 0.4 0.2
Unknown 0 0.0 . 0 0.0 . 1 0.5 . 1 0.5 . 3 1.3
Total 199 4.0 174 3.5 205 4.1 212 4.5 226 4.8
1. Includes chlamydial PID, gonococcal PID, and non-chlamydial/non-gonococcal PID.Note: Cumulative percentages may not equal 100% because of rounding. Excludes cases from Pasadena and Long Beach.
Table 8.1. Reported All Pelvic Inflammatory Disease (PID)1Cases and Rates per 100,000 Female Population by Age Group, Los Angeles County, 2008-2012
20122011201020092008

Sexually Transmitted Disease Morbidity Report - 2012 57
Adj. Adj. Adj. Adj. Adj.No. (%) Rate No. (%) Rate No. (%) Rate No. (%) Rate No. (%) Rate No. (%) Rate
FEMALE
2008 18 9.0 1.4 77 38.7 19.1 70 35.2 3.5 8 4.0 1.3 1 0.5 . 199 100.0 4.02009 23 13.2 1.8 47 27.0 11.8 79 45.4 4.0 5 2.9 0.9 0 0.0 . 174 100.0 3.52010 22 10.7 1.7 56 27.3 13.5 96 46.8 4.5 8 3.9 1.3 4 2.0 . 205 100.0 4.12011 21 9.9 1.8 58 27.4 15.7 95 44.8 4.7 14 6.6 2.2 2 0.9 . 212 100.0 4.52012 36 15.9 3.0 63 27.9 16.9 97 42.9 4.8 3 1.3 0.5 2 0.9 . 226 100.0 4.8
1. Includes chlamydial PID, gonococcal PID, and non-chlamydial/non-gonococcal PID.2. Includes data for ethnicity reported as "Other", "Native American", and "Mixed Race."3. Includes cases reported as "Unknown" race/ethnicity.Note: if race/ethnicity was not specified, cases were prorated according to the distribution of cases for which race/ethnicity was specified. Rates were adjusted including the proratedcases. Therefore, these tables should be used only for race/ethnicity comparisons, not for overall totals or gender totals. Cumulative percentages may not equal 100% because of rounding. Cases from Pasadena and Long Beach were not included.
Table 8.2. Reported All Pelvic Inflammatory Disease (PID)1
Cases and Rates per 100,000 Female Population by Race/Ethnicity, Los Angeles County, 2008-2012
White Black Latino Asian-Pacific Total3Other2

Los Angeles County Sexually Transmitted Disease
Morbidity Report
2012
SERVICE PLANNING AREAS ADDENDUM

Addendum I:
Chlamydia

Sexually Transmitted Disease Surveillance Report - 2012 I-1
0 8 164 Miles±
Figure a1.1 Reported Chlamydia Rates per 100,000 Population by Service Planning Area (SPA), Los Angeles County, 2012.
Excludes cases from Pasadena (SPA 3) and Long Beach (SPA 8).
Antelope Valley (SPA 1)578.6
East (SPA 7)498.7
Metro (SPA 4)628.5
San Fernando (SPA 2)332.9
San Gabriel (SPA 3)370.9
South (SPA 6)968.0
South Bay (SPA 8)490.0
West (SPA 5)316.5

Foothill302.2
West316.5
Antelope Valley578.6
San Fernando289.4
East Valley407.1
West Valley355.4
Pomona429.0
Whittier440.5
Torrance313.9
El Monte449.2
Glendale241.7
Harbor401.2
Central653.2
Alhambra241.7
Bellflower449.7
Inglewood728.7 Compton
870.8
Southwest985.8
Long Beach *0
San Antonio571.1
Northeast485.5
Pasadena *0
Hollywood-Wilshir702.2
South1181.8
East Los Angeles525.5Southeast
850.8
* Data of Pasadena (SPA 3) and Long Beach (SPA 8) are not available.
0 7 143.5 Miles±
Rates per 100,000 population0.00.1 - 300.0300.1 - 600.0600.1 - 900.0900.1 - 1200.0
Figure a1.2 Reported Chlamydia Rates per 100,000 Population by Health District (HD), Los Angeles County, 2012.
Sexually Transmitted Disease Morbidity Report - 2012 I-2

Sexually Transmitted Disease Morbidity Report - 2012 I-3
No. (%) Rate No. (%) Rate No. (%) Rate No. (%) Rate No. (%) Rate
SPA2/HD3
Antelope Valley (1) 1,804 4.2 496.6 1,971 4.5 535.5 1,851 4.1 496.1 2,082 4.4 538.6 2,242 4.6 578.6 Antelope Valley 1,804 4.2 496.6 1,971 4.5 535.5 1,851 4.1 496.1 2,082 4.4 538.6 2,242 4.6 578.6
East (7) 5,431 12.6 393.2 5,605 12.8 405.4 5,614 12.6 407.6 6,320 13.3 487.7 6,474 13.4 498.7 Bellflower 1,462 3.4 395.0 1,427 3.3 385.4 1,443 3.2 389.0 1,623 3.4 458.4 1,595 3.3 449.7 East Los Angeles 897 2.1 403.7 946 2.2 426.4 958 2.1 442.7 1,058 2.2 519.3 1,073 2.2 525.5 San Antonio 1,951 4.5 431.3 2,075 4.7 457.7 2,109 4.7 466.3 2,271 4.8 540.5 2,402 5.0 571.1 Whittier 1,121 2.6 333.2 1,157 2.6 343.4 1,104 2.5 326.8 1,368 2.9 430.4 1,404 2.9 440.5
Metro (4) 5,599 13.0 446.9 5,851 13.4 469.9 6,180 13.9 491.2 6,586 13.9 588.0 7,063 14.6 628.8 Central 1,802 4.2 490.6 1,814 4.1 496.0 1,924 4.3 521.1 1,991 4.2 591.9 2,201 4.5 653.2 Hollywood-Wilshire 2,537 5.9 473.4 2,719 6.2 511.7 2,814 6.3 523.6 3,135 6.6 652.9 3,384 7.0 702.2 Northeast 1,260 2.9 360.5 1,318 3.0 378.7 1,442 3.2 410.1 1,460 3.1 480.9 1,478 3.0 485.5
San Fernando (2) 6,419 14.9 293.4 6,511 14.9 294.0 6,568 14.7 296.5 6,847 14.4 320.5 7,148 14.8 332.9 East Valley 1,666 3.9 359.2 1,724 3.9 366.6 1,719 3.9 366.8 1,731 3.6 392.0 1,810 3.7 407.1 Glendale 709 1.6 199.8 708 1.6 199.2 754 1.7 211.5 853 1.8 253.4 815 1.7 241.7 San Fernando 1,208 2.8 255.4 1,256 2.9 262.0 1,286 2.9 266.6 1,370 2.9 275.2 1,447 3.0 289.4 West Valley 2,836 6.6 316.5 2,823 6.4 310.3 2,809 6.3 309.5 2,893 6.1 336.1 3,076 6.3 355.4
San Gabriel (3) 4,960 11.5 286.9 5,036 11.5 290.9 5,387 12.1 310.5 5,695 12.0 353.4 5,998 12.4 370.9 Alhambra 631 1.5 174.5 727 1.7 200.1 758 1.7 207.8 747 1.6 218.3 831 1.7 241.7 El Monte 1,653 3.8 344.4 1,766 4.0 368.3 1,891 4.2 394.1 1,876 4.0 433.0 1,952 4.0 449.2 Foothill 828 1.9 263.4 807 1.8 257.1 857 1.9 271.3 936 2.0 310.1 914 1.9 302.2 Pomona 1,848 4.3 322.5 1,736 4.0 302.1 1,881 4.2 327.4 2,136 4.5 399.9 2,301 4.7 429.0
South (6) 10,129 23.6 966.7 10,357 23.6 985.2 10,407 23.3 973.3 10,094 21.3 999.9 9,849 20.3 968.0 Compton 2,673 6.2 918.0 2,679 6.1 925.6 2,545 5.7 874.1 2,511 5.3 897.7 2,445 5.0 870.8 South 2,513 5.8 1321.8 2,335 5.3 1206.9 2,359 5.3 1208.3 2,361 5.0 1259.2 2,243 4.6 1181.8 Southeast 1,264 2.9 694.1 1,394 3.2 751.3 1,423 3.2 774.0 1,388 2.9 823.3 1,455 3.0 850.8 Southwest 3,679 8.6 957.2 3,949 9.0 1031.6 4,080 9.1 1022.5 3,834 8.1 1025.8 3,706 7.6 985.8
South Bay (8) 4,852 11.3 432.9 5,002 11.4 445.2 5,137 11.5 457.5 5,360 11.3 504.7 5,225 10.8 490.0 Harbor 587 1.4 273.7 589 1.3 271.7 716 1.6 333.2 772 1.6 384.7 810 1.7 401.2 Inglewood 3,010 7.0 690.5 2,986 6.8 686.4 3,030 6.8 695.1 3,138 6.6 768.0 2,990 6.2 728.7 Torrance 1,255 2.9 266.8 1,427 3.3 302.5 1,391 3.1 294.7 1,450 3.1 320.2 1,425 2.9 313.9 West (5) 1,530 3.6 236.8 1,592 3.6 244.4 1,627 3.6 246.5 1,767 3.7 277.3 2,022 4.2 316.5 West 1,530 3.6 236.8 1,592 3.6 244.4 1,627 3.6 246.5 1,767 3.7 277.3 2,022 4.2 316.5
Unknown 2,263 5.3 . 1,884 4.3 . 1,848 4.1 . 2,736 5.8 . 2,440 5.0 .
Total 42,987 441.9 43,809 448.5 44,619 454.8 47,487 512.9 48,461 521.3
1. Excludes cases from Pasadena (SPA 3) and Long Beach (SPA 8).2. Main categories.3. Subcategories.Note: Cumulative percentages may not equal 100% because of rounding.
Table a1.1. Reported Chlamydia Cases and Rates per 100,000 Population by Service Planning Area (SPA)1and Health District (HD), Los Angeles County, 2008-2012
2011 20122008 2009 2010

Sexually Transmitted Disease Morbidity Report - 2012 I-4
No. (%) Rate No. (%) Rate No. (%) Rate No. (%) Rate No. (%) Rate
MALE
0-14 6 1.2 13.7 4 0.8 9.1 6 1.1 13.7 1 0.2 2.1 5 0.8 11.015-19 195 39.9 1,071.8 180 35.4 980.2 145 27.7 868.8 142 25.0 734.8 184 27.8 968.020-24 151 30.9 837.7 169 33.3 913.9 208 39.7 1,162.1 245 43.1 1,583.1 234 35.3 1,431.625-29 82 16.8 562.8 82 16.1 508.9 79 15.1 383.2 100 17.6 780.7 120 18.1 919.230-34 22 4.5 218.0 24 4.7 227.3 35 6.7 271.9 30 5.3 258.8 51 7.7 434.035-44 22 4.5 100.6 24 4.7 114.6 37 7.1 187.1 33 5.8 136.6 38 5.7 162.745-54 10 2.0 37.4 15 3.0 56.1 10 1.9 38.7 12 2.1 42.7 28 4.2 101.055-64 1 0.2 6.3 1 0.2 6.1 2 0.4 11.9 2 0.4 10.4 2 0.3 10.065+ 0 0.0 0.0 0 0.0 0.0 0 0.0 0.0 0 0.0 0.0 0 0.0 0.0Unknown 9 1.8 . 2 0.4 . 3 0.5 .
Subtotal 489 27.2 268.1 508 25.9 274.8 524 28.4 278.8 568 27.4 295.6 662 29.6 343.6
FEMALE
0-14 24 1.8 57.0 21 1.4 49.7 26 2.0 61.7 9 0.6 20.0 8 0.5 18.315-19 539 41.1 3,143.2 568 39.1 3,266.6 498 37.7 3,191.3 555 36.8 3,006.8 543 34.5 2,998.220-24 467 35.6 2,807.0 536 36.9 3,121.4 524 39.7 3,150.0 624 41.4 4,250.7 635 40.3 4,105.025-29 153 11.7 1,199.2 191 13.1 1,367.2 150 11.4 834.8 184 12.2 1,526.3 219 13.9 1,802.330-34 68 5.2 754.9 66 4.5 717.8 61 4.6 554.6 68 4.5 584.0 86 5.5 746.035-44 33 2.5 147.5 32 2.2 150.3 47 3.6 238.2 54 3.6 212.5 60 3.8 241.045-54 18 1.4 65.4 14 1.0 50.2 9 0.7 32.9 11 0.7 38.1 20 1.3 70.355-64 5 0.4 30.7 1 0.1 6.0 3 0.2 17.4 3 0.2 15.3 1 0.1 4.965+ 2 0.2 11.7 2 0.1 11.6 0 0.0 0.0 0 0.0 0.0 1 0.1 5.0Unknown 1 0.1 . 22 1.5 . 3 0.2 . 2 0.1 .
Subtotal 1310 72.8 724.1 1,453 74.1 793.3 1,321 71.6 713.4 1,508 72.6 775.9 1,575 70.4 808.3
Total1 1,799 495.2 1,961 532.8 1,845 494.5 2,076 537.1 2,237 577.3
1. Excludes cases reported as "Unknown" gender. May not equal to SPA total.Note: Cumulative percentages may not equal 100% because of rounding.
Table a1.2. Reported Chlamydia Cases and Rates per 100,000 Population by Gender and Age, Antelope Valley Service Planning Area 1 (SPA 1), Los Angeles County, 2008-2012
20122008 20112009 2010

Sexually Transmitted Disease Morbidity Report - 2012 I-5
No. (%) Rate No. (%) Rate No. (%) Rate No. (%) Rate No. (%) Rate
MALE
0-14 9 0.5 3.9 5 0.2 2.2 5 0.2 2.2 4 0.2 2.0 6 0.2 3.015-19 308 15.6 375.7 313 14.8 370.9 291 13.0 369.2 319 13.4 396.6 312 12.2 393.020-24 586 29.7 738.1 651 30.8 806.6 698 31.3 899.2 767 32.1 1,001.6 786 30.8 1,027.925-29 442 22.4 585.0 472 22.3 606.2 503 22.5 539.9 521 21.8 641.3 558 21.8 692.130-34 249 12.6 329.0 253 12.0 338.4 268 12.0 321.7 300 12.6 390.5 347 13.6 445.435-44 257 13.0 150.2 272 12.9 160.1 289 12.9 177.9 301 12.6 193.4 334 13.1 216.745-54 90 4.6 55.1 109 5.2 65.1 139 6.2 84.7 125 5.2 79.9 167 6.5 106.855-64 25 1.3 23.2 22 1.0 19.5 28 1.3 24.6 39 1.6 33.3 34 1.3 28.265+ 1 0.1 1.0 7 0.3 6.6 9 0.4 8.5 8 0.3 7.4 7 0.3 6.1Unknown 3 0.2 . 8 0.4 . 3 0.1 . 3 0.1 . 5 0.2 .
Subtotal 1970 30.9 180.9 2112 32.5 191.5 2233 34.1 202.2 2387 34.9 225.7 2556 35.8 240.3
FEMALE
0-14 42 1.0 19.2 24 0.5 11.1 32 0.7 15.0 35 0.8 18.0 25 0.5 13.015-19 1,213 27.5 1,551.1 1,187 27.1 1,475.1 1,168 27.1 1,575.7 1,098 24.7 1,473.5 1,098 24.0 1,481.420-24 1,658 37.6 2,225.1 1,658 37.8 2,178.1 1,692 39.2 2,320.7 1,798 40.4 2,559.1 1,853 40.5 2,627.325-29 828 18.8 1,210.5 827 18.9 1,182.6 737 17.1 862.9 810 18.2 1,062.7 872 19.1 1,154.930-34 347 7.9 484.4 356 8.1 506.5 343 8.0 440.1 349 7.8 468.5 335 7.3 447.335-44 244 5.5 146.8 246 5.6 148.8 257 6.0 163.3 271 6.1 172.2 286 6.2 183.745-54 62 1.4 37.5 61 1.4 36.2 63 1.5 38.2 52 1.2 32.3 76 1.7 47.355-64 13 0.3 11.2 13 0.3 10.7 13 0.3 10.6 22 0.5 17.4 26 0.6 20.065+ 2 0.0 1.4 2 0.0 1.4 2 0.0 1.4 6 0.1 4.2 2 0.0 1.3Unknown 6 0.1 . 9 0.2 . 7 0.2 . 7 0.2 . 4 0.1 .
Subtotal 4415 69.1 401.7 4,383 67.5 394.2 4,314 65.9 388.2 4,448 65.1 412.2 4,577 64.2 422.3
Total1 6,385 291.9 6,495 293.3 6,547 295.5 6,835 319.9 7,133 332.2
Note: Cumulative percentages may not equal 100% because of rounding.1. Excludes cases reported as "Unknown" gender. May not equal to SPA total.
Table a1.3. Reported Chlamydia Cases and Rates per 100,000 Population by Gender and Age, San Fernando Service Planning Area 2 (SPA 2), Los Angeles County, 2008-2012
2008 2009 2011 20122010

Sexually Transmitted Disease Morbidity Report - 2012 I-6
No. (%) Rate No. (%) Rate No. (%) Rate No. (%) Rate No. (%) Rate
MALE
0-14 2 0.1 1.1 2 0.1 1.1 1 0.1 0.6 1 0.1 0.6 3 0.2 2.015-19 215 15.8 310.9 251 17.4 359.7 261 16.8 400.1 251 15.4 380.9 224 12.9 346.920-24 535 39.2 758.7 541 37.6 770.6 552 35.6 827.6 604 37.1 976.5 657 37.8 1,043.925-29 289 21.2 453.2 304 21.1 464.9 338 21.8 437.7 346 21.3 622.8 407 23.4 723.230-34 119 8.7 204.6 145 10.1 250.2 175 11.3 267.7 171 10.5 341.9 195 11.2 386.835-44 154 11.3 129.2 123 8.5 104.1 155 10.0 135.8 164 10.1 155.5 163 9.4 156.945-54 39 2.9 33.5 60 4.2 51.0 49 3.2 42.8 69 4.2 61.3 60 3.5 53.855-64 8 0.6 9.6 10 0.7 11.7 12 0.8 13.9 12 0.7 13.3 22 1.3 23.865+ 3 0.2 3.5 3 0.2 3.5 4 0.3 4.6 8 0.5 9.1 3 0.2 3.2Unknown 1 0.1 . 1 0.1 . 2 0.1 . 2 0.1 . 4 0.2 .
Subtotal 1365 27.7 161.2 1440 28.6 169.8 1549 28.8 182.0 1628 28.6 207.0 1738 29.0 220.2
FEMALE
0-14 17 0.5 9.9 17 0.5 10.1 23 0.6 13.9 17 0.4 11.4 14 0.3 9.615-19 1,051 29.5 1,571.6 1,026 28.6 1,521.0 1,020 26.7 1,633.5 1,078 26.6 1,708.9 983 23.1 1,570.520-24 1,370 38.5 2,028.5 1,381 38.5 2,036.1 1,583 41.4 2,456.1 1,662 41.0 2,911.4 1,845 43.4 3,139.525-29 575 16.1 960.0 612 17.1 1,001.7 615 16.1 845.0 675 16.6 1,285.4 750 17.6 1,424.230-34 279 7.8 491.4 247 6.9 441.3 285 7.4 454.9 287 7.1 567.0 328 7.7 646.635-44 195 5.5 159.4 221 6.2 181.8 229 6.0 195.9 261 6.4 232.8 240 5.6 218.145-54 55 1.5 43.7 62 1.7 48.9 56 1.5 45.4 52 1.3 42.8 70 1.6 58.455-64 10 0.3 10.7 10 0.3 10.4 8 0.2 8.2 10 0.2 9.8 7 0.2 6.765+ 6 0.2 5.1 4 0.1 3.4 4 0.1 3.4 8 0.2 6.8 4 0.1 3.3Unknown 5 0.1 . 7 0.2 . 4 0.1 . 7 0.2 . 9 0.2 .
Subtotal 3563 72.3 404.0 3,587 71.4 406.2 3,827 71.2 432.8 4,057 71.4 491.7 4,250 71.0 513.5
Total2 4,928 285.0 5,027 290.4 5,376 309.8 5,685 352.8 5,988 370.3
Note: Cumulative percentages may not equal 100% because of rounding.2. Excludes cases reported as "Unknown" gender. May not equal to SPA total.
Table a1.4. Reported Chlamydia Cases and Rates per 100,000 Population by Gender and Age, San Gabriel Service Planning Area 3 (SPA 3), Los Angeles County, 2008-2012
2008 2009 2011 2012
1. Excludes cases from Pasadena.
2010

Sexually Transmitted Disease Morbidity Report - 2012 I-7
No. (%) Rate No. (%) Rate No. (%) Rate No. (%) Rate No. (%) Rate
MALE
0-14 3 0.1 2.3 5 0.2 4.0 4 0.1 3.2 6 0.2 6.4 0 0.0 0.015-19 224 10.0 538.7 255 9.6 598.2 265 9.2 638.3 239 7.8 686.6 252 7.1 742.920-24 531 23.7 1,380.1 623 23.5 1,662.6 611 21.2 1,619.1 688 22.4 1,579.8 733 20.6 1,810.725-29 517 23.1 1,153.0 587 22.2 1,397.3 686 23.8 1,489.2 677 22.0 1,161.0 841 23.6 1,505.930-34 323 14.4 555.4 408 15.4 747.9 434 15.0 755.8 524 17.0 906.5 607 17.1 1,038.835-44 428 19.1 332.0 487 18.4 375.7 581 20.1 457.1 549 17.8 539.1 647 18.2 628.645-54 178 7.9 195.3 236 8.9 250.2 256 8.9 266.1 326 10.6 409.3 396 11.1 489.855-64 27 1.2 49.6 38 1.4 66.8 42 1.5 72.2 55 1.8 100.3 64 1.8 113.265+ 2 0.1 3.6 4 0.2 7.1 8 0.3 14.0 8 0.3 15.5 16 0.4 29.1Unknown 9 0.4 . 6 0.2 . 4 0.1 . 2 0.1 .
Subtotal 2242 40.6 348.4 2649 45.5 413.8 2887 47.0 445.8 3076 46.9 534.2 3558 50.5 616.4
FEMALE
0-14 42 1.3 33.7 25 0.8 20.8 16 0.5 13.3 26 0.7 29.2 27 0.8 30.315-19 845 25.8 2,119.1 820 25.9 2,003.4 794 24.4 2,021.7 831 23.9 2,549.5 817 23.4 2,582.120-24 1,179 36.0 3,331.4 1,168 36.9 3,329.2 1,249 38.3 3,568.4 1,286 37.0 3,249.9 1,306 37.4 3,520.525-29 645 19.7 1,676.3 627 19.8 1,745.4 621 19.1 1,549.3 716 20.6 1,353.1 706 20.2 1,377.230-34 275 8.4 533.6 284 9.0 585.6 279 8.6 545.1 295 8.5 586.6 317 9.1 617.035-44 225 6.9 210.7 177 5.6 163.5 226 6.9 211.0 237 6.8 281.7 238 6.8 278.645-54 48 1.5 59.7 48 1.5 58.9 59 1.8 72.2 62 1.8 90.7 50 1.4 72.855-64 10 0.3 17.7 14 0.4 24.1 11 0.3 18.5 16 0.5 28.1 17 0.5 29.365+ 1 0.0 1.3 5 0.2 6.5 2 0.1 2.6 4 0.1 5.7 4 0.1 5.5Unknown 6 0.2 . 1 0.0 . 1 0.0 . 3 0.1 . 8 0.2 .
Subtotal 3276 59.4 537.7 3,169 54.5 523.8 3,258 53.0 533.5 3,476 53.1 638.7 3,490 49.5 639.1
Total1 5,518 440.4 5,818 467.3 6,145 488.4 6,552 585.0 7,048 627.4
Note: Cumulative percentages may not equal 100% because of rounding.1. Excludes cases reported as "Unknown" gender. May not equal to SPA total.
Table a1.5. Reported Chlamydia Cases and Rates per 100,000 Population by Gender and Age, Metro Service Planning Area 4 (SPA 4), Los Angeles County, 2008-2012
2008 2009 2011 20122010

Sexually Transmitted Disease Morbidity Report - 2012 I-8
No. (%) Rate No. (%) Rate No. (%) Rate No. (%) Rate No. (%) Rate
MALE
0-14 1 0.2 2.0 0 0.0 0.0 0 0.0 0.0 1 0.1 2.3 0 0.0 0.015-19 53 9.1 293.2 63 9.9 343.2 40 6.4 233.1 45 6.2 251.2 65 7.4 364.720-24 159 27.3 935.4 182 28.6 1,050.7 173 27.5 1,049.4 188 25.9 805.7 216 24.5 1,007.125-29 140 24.0 784.1 141 22.1 867.4 154 24.5 804.9 180 24.8 634.0 243 27.6 903.130-34 86 14.8 325.2 85 13.3 337.4 102 16.2 358.4 110 15.2 389.4 136 15.4 468.935-44 102 17.5 166.3 93 14.6 150.7 96 15.3 158.4 124 17.1 254.8 142 16.1 287.245-54 31 5.3 62.8 50 7.8 98.3 49 7.8 95.8 54 7.4 128.2 50 5.7 118.655-64 9 1.5 25.0 20 3.1 53.1 13 2.1 34.5 19 2.6 52.6 20 2.3 54.865+ 2 0.3 5.3 2 0.3 5.1 2 0.3 5.1 5 0.7 12.2 9 1.0 21.0Unknown 1 0.2 .
Subtotal 583 38.4 185.9 637 40.2 201.2 629 38.8 196.1 726 41.2 235.3 881 43.7 284.7
FEMALE
0-14 1 0.1 2.1 6 0.6 12.6 4 0.4 8.2 5 0.5 12.1 0 0.0 0.015-19 236 25.2 1,265.1 215 22.7 1,137.3 228 22.9 1,305.9 218 21.0 1,197.0 249 21.9 1,349.620-24 341 36.5 2,023.5 364 38.4 2,104.9 403 40.5 2,410.7 393 37.9 1,534.6 441 38.8 1,905.125-29 191 20.4 1,064.8 194 20.5 1,239.1 188 18.9 1,040.3 233 22.4 793.2 205 18.0 718.530-34 90 9.6 330.9 82 8.6 312.1 85 8.6 281.3 105 10.1 367.8 116 10.2 397.235-44 57 6.1 92.5 68 7.2 109.4 64 6.4 104.3 55 5.3 112.4 88 7.7 177.245-54 14 1.5 27.5 15 1.6 28.8 15 1.5 28.7 19 1.8 43.0 24 2.1 54.355-64 3 0.3 7.4 3 0.3 7.2 3 0.3 7.2 3 0.3 7.5 8 0.7 19.965+ 2 0.2 3.9 0 0.0 0.0 0 0.0 0.0 3 0.3 5.7 5 0.4 9.2Unknown 1 0.1 . 4 0.4 . 4 0.4 .
Subtotal 935 61.6 281.3 948 59.8 283.1 994 61.2 293.1 1,038 58.8 315.9 1,136 56.3 344.8
Total1 1,518 234.9 1,585 243.3 1,623 245.9 1,764 276.9 2,017 315.7
Note: Cumulative percentages may not equal 100% because of rounding.1. Excludes cases reported as "Unknown" gender. May not equal to SPA total.
Table a1.6. Reported Chlamydia Cases and Rates per 100,000 Population by Gender and Age, West Service Planning Area 5 (SPA 5), Los Angeles County, 2008-2012
2008 2009 2011 20122010

Sexually Transmitted Disease Morbidity Report - 2012 I-9
No. (%) Rate No. (%) Rate No. (%) Rate No. (%) Rate No. (%) Rate
MALE
0-14 25 0.9 16.6 19 0.6 12.9 14 0.4 9.4 14 0.5 10.9 21 0.7 16.515-19 841 28.6 1,710.6 880 28.6 1,746.7 811 25.7 1,681.6 724 24.2 1,520.7 660 22.0 1,411.620-24 1,032 35.1 2,335.8 1,077 35.0 2,416.0 1,149 36.3 2,534.7 1,085 36.3 2,314.1 1,051 35.0 2,235.125-29 501 17.1 1,163.8 521 16.9 1,221.3 571 18.1 1,205.1 552 18.4 1,368.9 604 20.1 1,462.430-34 240 8.2 610.0 254 8.3 631.6 242 7.7 537.8 260 8.7 724.8 280 9.3 767.635-44 199 6.8 286.5 215 7.0 307.3 256 8.1 369.3 228 7.6 347.5 238 7.9 361.945-54 78 2.7 144.9 86 2.8 156.6 98 3.1 176.7 88 2.9 153.4 125 4.2 215.855-64 13 0.4 41.2 13 0.4 39.9 15 0.5 44.7 25 0.8 66.1 20 0.7 50.565+ 3 0.1 9.5 6 0.2 18.9 1 0.0 3.1 7 0.2 22.3 2 0.1 6.0Unknown 6 0.2 . 6 0.2 . 4 0.1 . 9 0.3 . 5 0.2 .
Subtotal 2938 29.1 573.0 3077 29.8 597.8 3161 30.5 602.4 2992 29.7 609.1 3006 30.6 606.8
FEMALE
0-14 101 1.4 69.3 86 1.2 60.1 94 1.3 65.3 112 1.6 89.9 69 1.0 55.815-19 2,755 38.5 5,680.4 2,792 38.5 5,628.8 2,627 36.4 5,626.7 2,468 34.8 5,242.6 2,257 33.1 4,869.220-24 2,459 34.3 5,691.7 2,600 35.8 5,943.4 2,698 37.4 6,188.9 2,675 37.8 5,840.7 2,680 39.2 5,762.025-29 1,027 14.3 2,504.6 984 13.6 2,423.6 970 13.4 2,152.9 1,031 14.5 2,621.7 1,024 15.0 2,586.430-34 425 5.9 1,098.6 400 5.5 1,021.3 443 6.1 1,018.2 407 5.7 1,112.3 402 5.9 1,086.835-44 287 4.0 403.9 273 3.8 383.3 274 3.8 389.0 280 4.0 403.2 285 4.2 410.945-54 80 1.1 133.9 85 1.2 140.5 81 1.1 133.0 80 1.1 125.6 85 1.2 132.755-64 12 0.2 31.2 18 0.2 45.7 16 0.2 39.3 24 0.3 54.1 20 0.3 43.265+ 2 0.0 4.1 11 0.2 22.4 3 0.0 6.0 4 0.1 8.4 1 0.0 2.0Unknown 14 0.2 . 8 0.1 . 11 0.2 . 5 0.1 . 6 0.1 .
Subtotal 7162 70.9 1,338.6 7,257 70.2 1,352.6 7,217 69.5 1,325.5 7,086 70.3 1,367.1 6,829 69.4 1,307.9
Total1 10,100 964.0 10,334 983.0 10,378 970.6 10,078 998.3 9,835 966.6
Note: Cumulative percentages may not equal 100% because of rounding.1. Excludes cases reported as "Unknown" gender. May not equal to SPA total.
Table a1.7. Reported Chlamydia Cases and Rates per 100,000 Population by Gender and Age, South Service Planning Area 6 (SPA 6), Los Angeles County, 2008-2012
2008 2009 2011 20122010

Sexually Transmitted Disease Morbidity Report - 2012 I-10
No. (%) Rate No. (%) Rate No. (%) Rate No. (%) Rate No. (%) Rate
MALE
0-14 8 0.6 4.8 5 0.3 3.0 2 0.1 1.2 4 0.2 2.7 4 0.2 2.815-19 317 22.1 532.0 277 18.0 455.7 274 17.6 477.9 324 17.4 566.5 323 16.0 579.020-24 517 36.0 928.6 574 37.2 1,035.6 588 37.8 1,069.2 719 38.7 1,383.0 785 38.9 1,471.225-29 287 20.0 527.7 331 21.5 600.7 317 20.4 510.6 399 21.5 850.1 442 21.9 943.330-34 136 9.5 267.8 144 9.3 285.1 159 10.2 291.1 183 9.9 409.2 194 9.6 435.635-44 125 8.7 125.6 146 9.5 146.6 152 9.8 157.6 153 8.2 169.2 195 9.7 218.245-54 34 2.4 40.9 45 2.9 53.0 46 3.0 55.2 52 2.8 64.1 52 2.6 63.755-64 5 0.3 9.1 13 0.8 23.0 11 0.7 19.5 16 0.9 26.8 15 0.7 24.465+ 3 0.2 5.2 3 0.2 5.2 3 0.2 5.3 4 0.2 6.9 4 0.2 6.5Unknown 5 0.3 . 5 0.3 . 3 0.2 . 3 0.2 . 4 0.2 .
Subtotal 1437 26.5 210.2 1543 27.7 225.5 1555 27.8 227.5 1857 29.4 291.7 2018 31.3 316.4
FEMALE
0-14 36 0.9 22.4 26 0.6 16.6 15 0.4 9.8 18 0.4 12.8 22 0.5 16.015-19 1,196 30.1 2,093.3 1,209 30.0 2,062.0 1,136 28.1 2,086.1 1,232 27.7 2,245.4 1,086 24.5 2,021.120-24 1,529 38.4 2,872.7 1,575 39.0 2,937.9 1,646 40.7 3,144.5 1,868 42.0 3,764.7 1,907 43.0 3,733.025-29 681 17.1 1,363.9 676 16.8 1,348.0 676 16.7 1,178.0 702 15.8 1,528.7 769 17.3 1,677.830-34 271 6.8 550.8 290 7.2 597.2 272 6.7 523.8 312 7.0 687.5 304 6.8 674.735-44 214 5.4 219.6 186 4.6 190.1 228 5.6 240.6 245 5.5 265.0 263 5.9 287.045-54 40 1.0 45.9 54 1.3 61.1 44 1.1 51.2 48 1.1 56.7 62 1.4 73.555-64 2 0.1 3.2 8 0.2 12.5 21 0.5 32.8 16 0.4 23.8 17 0.4 24.765+ 1 0.0 1.2 6 0.1 7.5 1 0.0 1.3 3 0.1 3.8 5 0.1 6.1Unknown 7 0.2 . 4 0.1 . 6 0.1 . 7 0.2 . 3 0.1 .
Subtotal 3977 73.5 570.2 4,034 72.3 577.9 4,045 72.2 582.8 4,451 70.6 675.1 4,438 68.7 672.0
Total1 5,414 392.0 5,577 403.4 5,600 406.6 6,308 486.8 6,456 497.3
Note: Cumulative percentages may not equal 100% because of rounding.1. Excludes cases reported as "Unknown" gender. May not equal to SPA total.
Table a1.8. Reported Chlamydia Cases and Rates per 100,000 Population by Gender and Age, East Service Planning Area 7 (SPA 7), Los Angeles County, 2008-2012
2008 2009 2011 20122010

Sexually Transmitted Disease Morbidity Report - 2012 I-11
No. (%) Rate No. (%) Rate No. (%) Rate No. (%) Rate No. (%) Rate
MALE
0-14 8 0.6 6.5 5 0.3 4.2 5 0.3 4.2 5 0.3 4.7 6 0.3 5.615-19 334 23.3 772.0 309 20.2 695.3 292 18.3 699.6 325 18.8 815.7 293 16.8 745.220-24 477 33.2 1,213.7 525 34.3 1,311.4 587 36.8 1,498.1 601 34.7 1,743.0 636 36.4 1,790.325-29 266 18.5 750.1 336 21.9 919.8 320 20.1 734.2 368 21.2 1,021.1 364 20.8 1,029.430-34 137 9.5 384.2 149 9.7 434.2 164 10.3 438.5 171 9.9 479.0 186 10.7 517.435-44 153 10.7 179.9 133 8.7 159.1 150 9.4 188.5 181 10.4 246.6 157 9.0 217.545-54 51 3.6 63.5 57 3.7 69.7 59 3.7 73.1 63 3.6 81.2 82 4.7 106.555-64 8 0.6 15.0 11 0.7 20.2 15 0.9 27.4 13 0.8 22.8 17 1.0 28.965+ 2 0.1 3.6 4 0.3 7.1 3 0.2 5.3 4 0.2 6.9 4 0.2 6.6Unknown 2 0.1 . 2 0.1 . 1 0.1 .
Subtotal 1436 29.7 261.1 1531 30.7 277.6 1595 31.1 289.3 1733 32.4 333.8 1746 33.4 334.9
FEMALE
0-14 33 1.0 28.2 34 1.0 29.8 29 0.8 25.8 23 0.6 22.5 26 0.7 25.715-19 1,098 32.3 2,621.3 1,177 34.1 2,729.2 1,168 33.0 2,908.3 1,044 28.9 2,733.1 971 28.0 2,539.020-24 1,270 37.4 3,366.2 1,282 37.1 3,329.0 1,336 37.8 3,572.1 1,532 42.4 4,658.8 1,365 39.3 4,052.425-29 527 15.5 1,569.9 517 15.0 1,511.2 534 15.1 1,303.6 583 16.1 1,625.9 604 17.4 1,721.730-34 241 7.1 666.7 220 6.4 635.4 229 6.5 611.0 207 5.7 570.1 250 7.2 692.635-44 164 4.8 187.3 168 4.9 194.6 164 4.6 199.2 170 4.7 218.5 198 5.7 258.445-54 56 1.6 67.2 38 1.1 44.8 51 1.4 60.8 42 1.2 51.6 38 1.1 46.855-64 9 0.3 15.1 15 0.4 24.7 15 0.4 24.5 10 0.3 15.8 19 0.5 29.465+ 1 0.0 1.4 3 0.1 4.0 8 0.2 10.6 1 0.0 1.3 1 0.0 1.3Unknown 1 0.0 . 2 0.1 . 4 0.1 . 5 0.1 . 2 0.1 .
Subtotal 3400 70.3 595.8 3,456 69.3 604.1 3,538 68.9 619.1 3,617 67.6 666.3 3,474 66.6 637.5
Total2 4,836 431.5 4,987 443.9 5,133 457.1 5,350 503.7 5,220 489.6
1. Excludes cases from Long Beach.
Note: Cumulative percentages may not equal 100% because of rounding.2. Excludes cases reported as "Unknown" gender. May not equal to SPA total.
Table a1.9. Reported Chlamydia Cases and Rates per 100,000 Population by Gender and Age, South Bay Service Planning Area 8 (SPA 8), Los Angeles County, 2008-2012
2008 2009 2011 20122010

Sexually Transmitted Disease Morbidity Report - 2012 I-12
Adj. Adj. Adj. Adj.No. (%) Rate No. (%) Rate No. (%) Rate No. (%) Rate No. (%) Rate
MALE
2008 42 8.6 60.2 258 52.8 1218.6 96 19.6 169.7 2 0.4 35.6 489 27.2 268.12009 53 10.4 80.9 206 40.6 965.5 136 26.8 228.2 6 1.2 105.7 508 25.9 274.82010 66 12.6 104.5 194 37.0 915.2 134 25.6 218.2 1 0.2 16.6 524 28.4 278.82011 62 10.9 109.8 235 41.4 978.4 132 23.2 186.3 8 1.4 139.0 568 27.4 295.62012 82 12.4 150.1 248 37.5 1052.7 142 21.5 205.0 8 1.2 142.3 662 29.6 343.6
FEMALE
2008 183 14.0 256.7 539 41.2 2,484.8 350 26.7 631.4 17 1.3 277.3 1,310 72.8 724.12009 237 16.3 347.5 577 39.7 2,581.8 364 25.1 610.1 21 1.5 333.5 1,453 74.1 793.32010 186 14.1 281.7 564 42.7 2,564.2 306 23.2 499.6 18 1.4 275.7 1,321 71.6 713.42011 187 12.4 326.6 577 38.3 2,193.3 404 26.8 565.8 17 1.1 252.9 1,508 72.6 775.92012 221 14.0 405.9 512 32.5 2,025.0 406 25.8 592.1 15 1.0 233.8 1,575 70.4 808.3
Note: If race/ethnicity was not specified, cases were prorated according to the distribution of cases for which race/ethnicity was specified. Rates were adjusted including the prorated cases. Therefore, these tables should be used only for race/ethnicity comparisons, not for overall totals or gender totals. Cumulative percentages may not
Total1Asian-Pacific
Table a1.10. Reported Chlamydia Cases and Rates per 100,000 Population by Gender and Race/Ethnicity, Antelope Valley Service Planning Area 1 (SPA 1), Los Angeles County, 2008-2012
White Black Latino
equal 100% because of rounding.
1. Includes Native Americans and cases reported as "Mixed/Other/Unknown" race/ethnicity. Excludes cases reported with "Other/Unknown" gender. May not add up to SPA total.

Sexually Transmitted Disease Morbidity Report - 2012 I-13
Adj. Adj. Adj. Adj.No. (%) Rate No. (%) Rate No. (%) Rate No. (%) Rate No. (%) Rate
MALE
2008 420 21.3 100.3 227 11.5 716.6 795 40.4 226.8 81 4.1 90.8 1,970 30.9 180.92009 448 21.2 103.2 258 12.2 785.4 900 42.6 247.1 72 3.4 78.2 2,112 32.5 191.52010 462 20.7 110.0 293 13.1 891.2 900 40.3 247.4 88 3.9 93.3 2,233 34.1 202.22011 473 19.8 118.6 266 11.1 835.7 974 40.8 282.1 108 4.5 117.8 2,387 34.9 225.72012 602 23.6 154.3 234 9.2 746.0 964 37.7 281.5 87 3.4 96.4 2,556 35.8 240.3
FEMALE
2008 838 19.0 192.1 362 8.2 1,142.7 2,151 48.7 615.0 184 4.2 179.9 4,415 69.1 401.72009 788 18.0 175.1 355 8.1 1,086.6 2,255 51.5 623.0 179 4.1 169.9 4,383 67.5 394.22010 753 17.5 175.1 398 9.2 1,237.7 2,059 47.7 580.6 177 4.1 166.1 4,314 65.9 388.22011 697 15.7 171.7 337 7.6 1,115.3 2,157 48.5 624.8 207 4.7 195.7 4,448 65.1 412.22012 662 14.5 171.3 314 6.9 1,081.0 2,078 45.4 623.4 208 4.5 205.5 4,577 64.2 422.3
Note: If race/ethnicity was not specified, cases were prorated according to the distribution of cases for which race/ethnicity was specified. Rates were adjusted including the prorated cases. Therefore, these tables should be used only for race/ethnicity comparisons, not for overall totals or gender totals. Cumulative percentages may not
Total1Asian-Pacific
Table a1.11. Reported Chlamydia Cases and Rates per 100,000 Population by Gender and Race/Ethnicity, San Fernando Service Planning Area 2 (SPA 2), Los Angeles County, 2008-2012
White Black Latino
1. Includes Native Americans and cases reported as "Mixed/Other/Unknown" race/ethnicity. Excludes cases reported with "Other/Unknown" gender. May not add up to SPA total.
equal 100% because of rounding.

Sexually Transmitted Disease Morbidity Report - 2012 I-14
Adj. Adj. Adj. Adj.No. (%) Rate No. (%) Rate No. (%) Rate No. (%) Rate No. (%) Rate
MALE
2008 144 10.6 85.4 152 11.1 602.3 706 51.7 208.9 114 8.4 62.1 1,365 27.7 161.22009 149 10.4 90.6 161 11.2 666.1 720 50.0 216.1 107 7.4 58.3 1,440 28.6 169.82010 149 9.6 94.2 147 9.5 611.2 780 50.4 234.6 132 8.5 71.6 1,549 28.8 182.02011 181 11.1 138.9 161 9.9 806.8 771 47.4 252.2 122 7.5 66.7 1,628 28.6 207.02012 156 9.0 124.4 139 8.0 720.7 812 46.7 273.3 136 7.8 76.7 1,738 29.0 220.2
FEMALE
2008 330 9.3 182.6 277 7.8 981.0 2,102 59.0 607.2 255 7.2 127.0 3,563 72.3 404.02009 385 10.7 214.7 276 7.7 1,003.6 2,021 56.3 581.3 298 8.3 145.6 3,587 71.4 406.22010 366 9.6 216.0 283 7.4 1,058.7 2,116 55.3 624.7 281 7.3 138.4 3,827 71.2 432.82011 380 9.4 277.0 282 7.0 1,304.4 2,173 53.6 682.6 319 7.9 157.3 4,057 71.4 491.72012 333 7.8 252.0 230 5.4 1,097.8 2,242 52.8 723.4 322 7.6 163.7 4,250 71.0 513.5
1. Excludes cases from Pasadena.
Note: If race/ethnicity was not specified, cases were prorated according to the distribution of cases for which race/ethnicity was specified. Rates were adjusted including the prorated cases. Therefore, these tables should be used only for race/ethnicity comparisons, not for overall totals or gender totals. Cumulative percentages may not
Total1,2Asian-Pacific
2. Includes Native Americans and cases reported as "Mixed/Other/Unknown" race/ethnicity. Excludes cases reported with "Other/Unknown" gender. May not add up to SPA total.
equal 100% because of rounding.
Table a1.12. Reported Chlamydia Cases and Rates per 100,000 Population by Gender and Race/Ethnicity,San Gabriel Service Planning Area 3 (SPA 3), Los Angeles County, 2008-2012
White Black Latino

Sexually Transmitted Disease Morbidity Report - 2012 I-15
Adj. Adj. Adj. Adj.No. (%) Rate No. (%) Rate No. (%) Rate No. (%) Rate No. (%) Rate
MALE
2008 527 23.5 421.4 275 12.3 843.9 953 42.5 307.9 104 4.6 122.9 2,242 40.6 348.42009 636 24.0 491.0 346 13.1 1041.7 1,135 42.9 371.1 97 3.7 115.1 2,649 45.5 413.82010 778 27.0 590.5 360 12.5 1074.2 1,208 41.8 383.1 114 4.0 130.9 2,887 47.0 445.82011 836 27.2 637.7 375 12.2 1272.4 1,228 39.9 475.1 135 4.4 170.1 3,076 46.9 534.22012 1,080 30.4 814.3 398 11.2 1342.4 1,371 38.5 522.3 164 4.6 203.7 3,558 50.5 616.4
FEMALE
2008 346 10.6 311.4 335 10.2 1,128.9 1,885 57.5 633.3 241 7.4 252.8 3,276 59.4 537.72009 336 10.6 295.7 344 10.9 1,157.0 1,798 56.7 619.0 206 6.5 219.7 3,169 54.5 523.82010 303 9.3 267.9 368 11.3 1,250.9 1,831 56.2 631.3 228 7.0 240.5 3,258 53.0 533.52011 370 10.6 333.5 378 10.9 1,638.1 1,839 52.9 766.5 250 7.2 274.3 3,476 53.1 638.72012 339 9.7 309.5 363 10.4 1,604.2 1,868 53.5 786.3 232 6.7 258.3 3,490 49.5 639.1
Note: If race/ethnicity was not specified, cases were prorated according to the distribution of cases for which race/ethnicity was specified. Rates were adjusted including the prorated cases. Therefore, these tables should be used only for race/ethnicity comparisons, not for overall totals or gender totals. Cumulative percentages may not
1. Includes Native Americans and cases reported as "Mixed/Other/Unknown" race/ethnicity. Excludes cases reported with "Other/Unknown" gender. May not add up to SPA total.
equal 100% because of rounding.
Table a1.13. Reported Chlamydia Cases and Rates per 100,000 Population by Gender and Race/Ethnicity, Metro Service Planning Area 4 (SPA 4), Los Angeles County, 2008-2012
White Black Latino Total¹Asian-Pacific

Sexually Transmitted Disease Morbidity Report - 2012 I-16
Adj. Adj. Adj. Adj.No. (%) Rate No. (%) Rate No. (%) Rate No. (%) Rate No. (%) Rate
MALE
2008 206 35.3 119.4 117 20.1 691.0 120 20.6 259.4 32 5.5 104.2 583 38.4 185.92009 253 39.7 142.6 122 19.2 704.2 112 17.6 245.6 34 5.3 111.5 637 40.2 201.22010 234 37.2 138.2 112 17.8 648.0 103 16.4 222.5 34 5.4 107.4 629 38.8 196.12011 279 38.4 167.1 101 13.9 695.9 118 16.3 302.6 52 7.2 170.4 726 41.2 235.32012 361 41.0 212.5 147 16.7 995.1 124 14.1 310.6 46 5.2 147.1 881 43.7 284.7
FEMALE
2008 263 28.1 148.3 207 22.1 1,078.9 198 21.2 417.8 85 9.1 228.4 935 61.6 281.32009 249 26.3 136.6 188 19.8 954.3 260 27.4 555.5 75 7.9 202.2 948 59.8 283.12010 261 26.3 151.1 196 19.7 1,002.4 211 21.2 451.3 83 8.4 217.3 994 61.2 293.12011 302 29.1 176.2 171 16.5 1,072.5 226 21.8 522.1 95 9.2 242.3 1,038 58.8 315.92012 287 25.3 176.6 150 13.2 993.0 252 22.2 610.3 99 8.7 265.2 1,136 56.3 344.8
Note: If race/ethnicity was not specified, cases were prorated according to the distribution of cases for which race/ethnicity was specified. Rates were adjusted including the prorated cases. Therefore, these tables should be used only for race/ethnicity comparisons, not for overall totals or gender totals. Cumulative percentages may not
Table a1.14. Reported Chlamydia Cases and Rates per 100,000 Population by Gender and Race/Ethnicity,West Service Planning Area 5 (SPA 5), Los Angeles County, 2008-2012
White Black Latino
equal 100% because of rounding.
Total¹Asian-Pacific
1. Includes Native Americans and cases reported as "Mixed/Other/Unknown" race/ethnicity. Excludes cases reported with "Other/Unknown" gender. May not add up to SPA total.

Sexually Transmitted Disease Morbidity Report - 2012 I-17
Adj. Adj. Adj. Adj.No. (%) Rate No. (%) Rate No. (%) Rate No. (%) Rate No. (%) Rate
MALE
2008 50 1.7 431.8 1,652 56.2 1239.2 866 29.5 283.4 21 0.7 271.3 2,938 29.1 573.02009 43 1.4 358.9 1,632 53.0 1229.8 1,026 33.3 332.8 12 0.4 151.1 3,077 29.8 597.82010 51 1.6 408.4 1,739 55.0 1317.2 981 31.0 310.7 9 0.3 109.8 3,161 30.5 602.42011 69 2.3 622.5 1,513 50.6 1344.0 1,008 33.7 330.7 16 0.5 204.3 2,992 29.7 609.12012 59 2.0 545.8 1,383 46.0 1250.2 1,082 36.0 357.0 29 1.0 377.6 3,006 30.6 606.8
FEMALE
2008 140 2.0 1254.7 3,684 51.4 2,195.7 2,489 34.8 849.2 36 0.5 414.4 7,162 70.9 1338.62009 129 1.8 1123.9 3,639 50.1 2,182.5 2,637 36.3 891.2 43 0.6 483.9 7,257 70.2 1352.62010 144 2.0 1192.3 3,674 50.9 2,207.7 2,552 35.4 842.3 42 0.6 459.7 7,217 69.5 1325.52011 120 1.7 1103.2 3,371 47.6 2,355.3 2,669 37.7 890.4 34 0.5 398.4 7,086 70.3 1367.12012 126 1.9 1189.5 2,913 42.7 2,081.1 2,713 39.7 913.1 41 0.6 491.0 6,829 69.4 1307.9
Note: If race/ethnicity was not specified, cases were prorated according to the distribution of cases for which race/ethnicity was specified. Rates were adjusted including the prorated cases. Therefore, these tables should be used only for race/ethnicity comparisons, not for overall totals or gender totals. Cumulative percentages may not
Table a1.15. Reported Chlamydia Cases and Rates per 100,000 Population by Gender and Race/Ethnicity, South Service Planning Area 6 (SPA 6), Los Angeles County, 2008-2012
White Black Latino
equal 100% because of rounding.
Total¹Asian-Pacific
1. Includes Native Americans and cases reported as "Mixed/Other/Unknown" race/ethnicity. Excludes cases reported with "Other/Unknown" gender. May not add up to SPA total.

Sexually Transmitted Disease Morbidity Report - 2012 I-18
Adj. Adj. Adj. Adj.No. (%) Rate No. (%) Rate No. (%) Rate No. (%) Rate No. (%) Rate
MALE
2008 83 5.8 84.2 137 9.5 917.7 907 63.1 221.9 23 1.6 47.1 1,437 26.5 210.22009 101 6.6 101.7 174 11.3 1124.2 970 62.9 228.8 47 3.1 93.1 1,543 27.7 225.52010 77 5.0 81.8 155 10.0 1033.0 1,000 64.3 240.1 28 1.8 56.0 1,555 27.8 227.52011 137 7.4 173.9 148 8.0 947.6 1,177 63.4 297.1 35 1.9 74.8 1,857 29.4 291.72012 112 5.6 146.4 122 6.1 797.1 1,284 63.6 331.6 47 2.3 102.8 2,018 31.3 316.4
FEMALE
2008 251 6.3 239.7 325 8.2 1,981.9 2,589 65.1 621.4 94 2.4 175.0 3,977 73.5 570.22009 293 7.3 281.2 285 7.1 1,700.0 2,691 66.7 630.1 122 3.0 221.9 4,034 72.3 577.92010 264 6.5 266.0 313 7.7 1,929.9 2,660 65.8 635.2 85 2.1 155.3 4,045 72.2 582.82011 288 6.5 352.1 280 6.3 1,635.5 2,986 67.1 724.6 99 2.2 187.5 4,451 70.6 675.12012 254 5.7 322.4 233 5.3 1,396.3 2,903 65.4 725.4 103 2.3 201.3 4,438 68.7 672.0
Note: If race/ethnicity was not specified, cases were prorated according to the distribution of cases for which race/ethnicity was specified. Rates were adjusted including the prorated cases. Therefore, these tables should be used only for race/ethnicity comparisons, not for overall totals or gender totals. Cumulative percentages may not
Table a1.16. Reported Chlamydia Cases and Rates per 100,000 Population by Gender and Race/Ethnicity,East Service Planning Area 7 (SPA 7), Los Angeles County, 2008-2012
White Black Latino
equal 100% because of rounding.
Total¹Asian-Pacific
1. Includes Native Americans and cases reported as "Mixed/Other/Unknown" race/ethnicity. Excludes cases reported with "Other/Unknown" gender. May not add up to SPA total.

Sexually Transmitted Disease Morbidity Report - 2012 I-19
Adj. Adj. Adj. Adj.No. (%) Rate No. (%) Rate No. (%) Rate No. (%) Rate No. (%) Rate
MALE
2008 98 6.8 65.1 684 47.6 1004.0 367 25.6 200.6 48 3.3 68.2 1,436 29.7 261.12009 133 8.7 87.7 732 47.8 1064.5 364 23.8 195.1 50 3.3 70.3 1,531 30.7 277.62010 141 8.8 96.8 716 44.9 1059.2 394 24.7 212.1 64 4.0 90.5 1,595 31.1 289.32011 165 9.5 122.5 731 42.2 1162.9 472 27.2 266.2 60 3.5 86.4 1,733 32.4 333.82012 170 9.7 129.7 653 37.4 1064.2 501 28.7 286.5 56 3.2 82.2 1,746 33.4 334.9
FEMALE
2008 251 7.4 164.4 1,425 41.9 1,687.4 1,040 30.6 570.5 175 5.2 223.9 3,400 70.3 595.82009 286 8.3 185.8 1,450 42.0 1,696.5 1,066 30.8 571.7 167 4.8 211.1 3,456 69.3 604.12010 280 7.9 189.6 1,467 41.5 1,752.3 1,047 29.6 567.4 163 4.6 206.6 3,538 68.9 619.12011 291 8.1 222.5 1,372 37.9 1,784.5 1,164 32.2 655.4 126 3.5 160.5 3,617 67.6 666.32012 305 8.8 237.9 1,176 33.9 1,560.1 1,137 32.7 645.8 137 3.9 177.0 3,474 66.6 637.5
Note: If race/ethnicity was not specified, cases were prorated according to the distribution of cases for which race/ethnicity was specified. Rates were adjusted including the prorated cases. Therefore, these tables should be used only for race/ethnicity comparisons, not for overall totals or gender totals. Cumulative percentages may not
Table a1.17. Reported Chlamydia Cases and Rates per 100,000 Population by Gender and Race/Ethnicity, South Bay Service Planning Area 8 (SPA 8), Los Angeles County, 2008-2012
White Black Latino
equal 100% because of rounding.
1. Excludes cases from Long Beach.
Total1,2Asian-Pacific
2. Includes Native Americans and cases reported as "Mixed/Other/Unknown" race/ethnicity. Excludes cases reported with "Other/Unknown" gender. May not add up to SPA total.

Addendum II:
Gonorrhea

Sexually Transmitted Disease Surveillance Report - 2012 II-1
0 8 164 Miles±
Figure a2.1 Reported Gonorrhea Rates per 100,000 Population by Service Planning Area (SPA), Los Angeles County, 2012.
Excludes cases from Pasadena (SPA 3) and Long Beach (SPA 8).
Antelope Valley (SPA 1)114.1
East (SPA 7)76.3
Metro (SPA 4)271.8
San Fernando (SPA 2)73.5
San Gabriel (SPA 3)54.3
South (SPA 6)233.0
South Bay (SPA 8)116.7
West (SPA 5)90.6

Foothill49.3
West90.6
Antelope Valley114.1
San Fernando48.2
East Valley98.3
West Valley76.0
Pomona65.8
Whittier68.4
Torrance70.0
El Monte56.6
Glendale72.1
Harbor92.6
Central239.2
Alhambra37.8
Bellflower76.1
Inglewood180.1 Compton
165.3
Southwest283.6
Long Beach *0
San Antonio78.0
Northeast106.1
Pasadena *0
Hollywood-Wilshir399.2
South309.3
East Los Angeles85.7Southeast
148.5
* Data of Pasadena (SPA 3) and Long Beach (SPA 8) are not available.
0 7 143.5 Miles±
Rates per 100,000 population0.00.1 - 100.0100.1 - 200.0200.1 - 300.0300.1 - 400.0
Figure a2.2 Reported Gonorrhea Rates per 100,000 Population by Health District (HD), Los Angeles County, 2012.
Sexually Transmitted Disease Morbidity Report - 2012 II-2

Sexually Transmitted Disease Morbidity Report - 2012 II-3
No. (%) Rate No. (%) Rate No. (%) Rate No. (%) Rate No. (%) Rate
SPA2/HD3
Antelope Valley (1) 283 3.5 77.9 324 3.8 88.0 323 3.4 86.6 282 2.9 73.0 442 3.9 114.1 Antelope Valley 283 3.5 77.9 324 3.8 88.0 323 3.4 86.6 282 2.9 73.0 442 3.9 114.1
East (7) 588 7.2 42.6 546 6.4 39.5 727 7.7 52.8 756 7.9 58.3 991 8.7 76.3 Bellflower 194 2.4 52.4 150 1.8 40.5 204 2.1 55.0 223 2.3 63.0 270 2.4 76.1 East Los Angeles 77 0.9 34.7 70 0.8 31.6 125 1.3 57.8 146 1.5 71.7 175 1.5 85.7 San Antonio 215 2.6 47.5 233 2.7 51.4 262 2.8 57.9 228 2.4 54.3 328 2.9 78.0 Whittier 102 1.2 30.3 93 1.1 27.6 136 1.4 40.3 159 1.7 50.0 218 1.9 68.4
Metro (4) 1,438 17.6 114.8 1,940 22.9 155.8 2,322 24.4 184.5 2,293 24.0 204.7 3,053 26.7 271.8 Central 343 4.2 93.4 471 5.6 128.8 583 6.1 157.9 643 6.7 191.2 806 7.1 239.2 Hollywood-Wilshire 928 11.3 173.2 1,290 15.2 242.8 1,527 16.1 284.1 1,406 14.7 292.8 1,924 16.8 399.2 Northeast 167 2.0 47.8 179 2.1 51.4 212 2.2 60.3 244 2.5 80.4 323 2.8 106.1
San Fernando (2) 933 11.4 42.6 1,011 11.9 45.6 1,160 12.2 52.4 1,237 12.9 57.9 1,579 13.8 73.5 East Valley 246 3.0 53.0 304 3.6 64.7 346 3.6 73.8 355 3.7 80.4 437 3.8 98.3 Glendale 111 1.4 31.3 158 1.9 44.5 147 1.5 41.2 186 1.9 55.3 243 2.1 72.1 San Fernando 164 2.0 34.7 160 1.9 33.4 150 1.6 31.1 174 1.8 35.0 241 2.1 48.2 West Valley 412 5.0 46.0 389 4.6 42.8 517 5.4 57.0 522 5.5 60.6 658 5.8 76.0
San Gabriel (3) 574 7.0 33.2 525 6.2 30.3 584 6.1 33.7 646 6.7 40.1 878 7.7 54.3 Alhambra 97 1.2 26.8 86 1.0 23.7 93 1.0 25.5 85 0.9 24.8 130 1.1 37.8 El Monte 151 1.8 31.5 135 1.6 28.2 148 1.6 30.8 199 2.1 45.9 246 2.2 56.6 Foothill 97 1.2 30.9 107 1.3 34.1 129 1.4 40.8 138 1.4 45.7 149 1.3 49.3 Pomona 229 2.8 40.0 197 2.3 34.3 214 2.3 37.2 224 2.3 41.9 353 3.1 65.8
South (6) 2,601 31.8 248.2 2,289 27.0 217.7 2,432 25.6 227.5 2,344 24.5 232.2 2,371 20.8 233.0 Compton 584 7.1 200.6 477 5.6 164.8 483 5.1 165.9 477 5.0 170.5 464 4.1 165.3 South 648 7.9 340.8 538 6.3 278.1 602 6.3 308.3 601 6.3 320.5 587 5.1 309.3 Southeast 263 3.2 144.4 249 2.9 134.2 251 2.6 136.5 274 2.9 162.5 254 2.2 148.5 Southwest 1,106 13.5 287.8 1,025 12.1 267.7 1,096 11.5 274.7 992 10.4 265.4 1,066 9.3 283.6
South Bay (8) 946 11.6 84.4 974 11.5 86.7 1,065 11.2 94.8 1,159 12.1 109.1 1,244 10.9 116.7 Harbor 73 0.9 34.0 84 1.0 38.7 110 1.2 51.2 114 1.2 56.8 187 1.6 92.6 Inglewood 695 8.5 159.4 662 7.8 152.2 723 7.6 165.9 746 7.8 182.6 739 6.5 180.1 Torrance 178 2.2 37.8 228 2.7 48.3 232 2.4 49.1 299 3.1 66.0 318 2.8 70.0 West (5) 368 4.5 57.0 381 4.5 58.5 527 5.5 79.9 461 4.8 72.4 579 5.1 90.6 West 368 4.5 57.0 381 4.5 58.5 527 5.5 79.9 461 4.8 72.4 579 5.1 90.6
Unknown 453 5.5 . 496 5.8 . 358 3.8 . 394 4.1 . 288 2.5 .
Total 8,184 84.1 8,486 86.9 9,498 96.8 9,572 103.4 11,425 122.9
1. Excludes cases from Pasadena (SPA 3) and Long Beach (SPA 8).2. Main categories.3. Subcategories.Note: Cumulative percentages may not equal 100% because of rounding.
Table a2.1. Reported Gonorrhea Cases and Rates per 100,000 Population by Service Planning Area (SPA)1and Health District (HD), Los Angeles County, 2008-2012
2011 20122008 2009 2010

Sexually Transmitted Disease Morbidity Report - 2012 II-4
No. (%) Rate No. (%) Rate No. (%) Rate No. (%) Rate No. (%) Rate
MALE
0-14 2 1.6 4.6 0 0.0 0.0 0 0.0 0.0 0 0.0 0.0 2 1.1 4.415-19 34 26.4 186.9 48 31.6 261.4 41 25.6 245.7 48 35.3 248.4 43 23.2 226.220-24 44 34.1 244.1 57 37.5 308.2 52 32.5 290.5 40 29.4 258.5 64 34.6 391.625-29 22 17.1 151.0 21 13.8 130.3 34 21.3 164.9 20 14.7 156.1 32 17.3 245.130-34 7 5.4 69.4 8 5.3 75.8 9 5.6 69.9 8 5.9 69.0 16 8.6 136.235-44 10 7.8 45.7 12 7.9 57.3 14 8.8 70.8 12 8.8 49.7 19 10.3 81.445-54 8 6.2 29.9 5 3.3 18.7 8 5.0 30.9 6 4.4 21.3 9 4.9 32.555-64 2 1.6 12.6 0 0.0 0.0 1 0.6 5.9 1 0.7 5.2 0 0.0 0.065+ 0 0.0 0.0 0 0.0 0.0 1 0.6 7.4 1 0.7 6.8 0 0.0 0.0Unknown 1 0.7 .
Subtotal 129 45.6 70.7 152 47.1 82.2 160 49.5 85.1 136 48.6 70.8 185 41.9 96.0
FEMALE
0-14 4 2.6 9.5 2 1.2 4.7 5 3.1 11.9 1 0.7 2.2 0 0.0 0.015-19 59 38.3 344.1 75 43.9 431.3 56 34.4 358.9 57 39.6 308.8 86 33.5 474.820-24 59 38.3 354.6 58 33.9 337.8 69 42.3 414.8 51 35.4 347.4 96 37.4 620.625-29 17 11.0 133.2 19 11.1 136.0 19 11.7 105.7 16 11.1 132.7 36 14.0 296.330-34 6 3.9 66.6 12 7.0 130.5 9 5.5 81.8 9 6.3 77.3 19 7.4 164.835-44 3 1.9 13.4 2 1.2 9.4 4 2.5 20.3 9 6.3 35.4 16 6.2 64.345-54 4 2.6 14.5 2 1.2 7.2 0 0.0 0.0 1 0.7 3.5 2 0.8 7.055-64 1 0.6 6.1 1 0.6 6.0 0 0.0 0.0 0 0.0 0.0 2 0.8 9.765+ 1 0.6 5.9 0 0.0 0.0 0 0.0 0.0 0 0.0 0.0 0 0.0 0.0Unknown 1 0.6 .
Subtotal 154 54.4 85.1 171 52.9 93.4 163 50.5 88.0 144 51.4 74.1 257 58.1 131.9
Total1 283 77.9 323 87.8 323 86.6 280 72.4 442 114.1
Note: Cumulative percentages may not equal 100% because of rounding.1. Excludes cases reported as "Unknown" gender. May not equal to SPA total.
Table a2.2. Reported Gonorrhea Cases and Rates per 100,000 Population by Gender and Age, Antelope Valley Service Planning Area 1 (SPA 1), Los Angeles County, 2008-2012
2008 2009 2011 20122010

Sexually Transmitted Disease Morbidity Report - 2012 II-5
No. (%) Rate No. (%) Rate No. (%) Rate No. (%) Rate No. (%) Rate
MALE
0-14 0 0.0 0.0 0 0.0 0.0 0 0.0 0.0 0 0.0 0.0 1 0.1 0.515-19 38 6.9 46.3 45 7.0 53.3 59 7.8 74.9 57 6.8 70.9 69 6.3 86.920-24 124 22.4 156.2 153 23.7 189.6 178 23.4 229.3 183 21.9 239.0 277 25.3 362.325-29 137 24.8 181.3 160 24.8 205.5 180 23.7 193.2 219 26.2 269.6 252 23.0 312.630-34 77 13.9 101.7 77 11.9 103.0 99 13.0 118.8 120 14.4 156.2 150 13.7 192.535-44 117 21.2 68.4 129 20.0 75.9 161 21.2 99.1 151 18.1 97.0 186 17.0 120.745-54 44 8.0 26.9 68 10.5 40.6 72 9.5 43.9 82 9.8 52.4 117 10.7 74.855-64 14 2.5 13.0 10 1.5 8.9 11 1.4 9.7 20 2.4 17.1 35 3.2 29.065+ 0 0.0 0.0 3 0.5 2.8 1 0.1 0.9 3 0.4 2.8 4 0.4 3.5Unknown 2 0.4 . 1 0.2 . 3 0.3 .
Subtotal 553 60.0 50.8 646 64.1 58.6 761 65.7 68.9 835 67.7 79.0 1094 69.3 102.9
FEMALE
0-14 4 1.1 1.8 2 0.6 0.9 5 1.3 2.3 1 0.3 0.5 3 0.6 1.615-19 86 23.3 110.0 72 19.9 89.5 85 21.4 114.7 97 24.3 130.2 84 17.4 113.320-24 138 37.4 185.2 128 35.4 168.1 131 32.9 179.7 126 31.6 179.3 184 38.0 260.925-29 77 20.9 112.6 80 22.1 114.4 86 21.6 100.7 91 22.8 119.4 105 21.7 139.130-34 27 7.3 37.7 35 9.7 49.8 37 9.3 47.5 38 9.5 51.0 38 7.9 50.735-44 29 7.9 17.4 37 10.2 22.4 39 9.8 24.8 28 7.0 17.8 50 10.3 32.145-54 6 1.6 3.6 5 1.4 3.0 10 2.5 6.1 13 3.3 8.1 14 2.9 8.755-64 2 0.5 1.7 3 0.8 2.5 4 1.0 3.3 3 0.8 2.4 4 0.8 3.165+ 0 0.0 0.0 0 0.0 0.0 0 0.0 0.0 0 0.0 0.0 1 0.2 0.7Unknown 1 0.3 . 2 0.5 . 1 0.2 .
Subtotal 369 40.0 33.6 362 35.9 32.6 398 34.3 35.8 399 32.3 37.0 484 30.7 44.7
Total1 922 42.1 #### 45.5 1,159 52.3 1,234 57.8 1,578 73.5
Note: Cumulative percentages may not equal 100% because of rounding.1. Excludes cases reported as "Unknown" gender. May not equal to SPA total.
Table a2.3. Reported Gonorrhea Cases and Rates per 100,000 Population by Gender and Age, San Fernando Service Planning Area 2 (SPA 2), Los Angeles County, 2008-2012
2008 2009 2011 20122010

Sexually Transmitted Disease Morbidity Report - 2012 II-6
No. (%) Rate No. (%) Rate No. (%) Rate No. (%) Rate No. (%) Rate
MALE
0-14 0 0.0 0.0 2 0.6 1.1 1 0.3 0.6 1 0.3 0.6 0 0.0 0.015-19 44 14.3 63.6 38 12.1 54.5 41 10.9 62.8 42 10.7 63.7 53 10.0 82.120-24 99 32.2 140.4 81 25.7 115.4 106 28.1 158.9 132 33.8 213.4 154 29.1 244.725-29 61 19.9 95.7 97 30.8 148.3 95 25.2 123.0 79 20.2 142.2 121 22.9 215.030-34 27 8.8 46.4 26 8.3 44.9 50 13.3 76.5 45 11.5 90.0 80 15.1 158.735-44 57 18.6 47.8 44 14.0 37.2 52 13.8 45.6 58 14.8 55.0 80 15.1 77.045-54 13 4.2 11.2 24 7.6 20.4 21 5.6 18.3 28 7.2 24.9 31 5.9 27.855-64 6 2.0 7.2 1 0.3 1.2 7 1.9 8.1 1 0.3 1.1 10 1.9 10.865+ 0 0.0 0.0 2 0.6 2.3 2 0.5 2.3 5 1.3 5.7 0 0.0 0.0Unknown 2 0.5 .
Subtotal 307 53.9 36.2 315 60.6 37.1 377 64.7 44.3 391 60.7 49.7 529 60.3 67.0
FEMALE
0-14 3 1.1 1.7 2 1.0 1.2 4 1.9 2.4 0 0.0 0.0 0 0.0 0.015-19 70 26.6 104.7 50 24.4 74.1 47 22.8 75.3 49 19.4 77.7 70 20.1 111.820-24 86 32.7 127.3 71 34.6 104.7 74 35.9 114.8 86 34.0 150.6 117 33.5 199.125-29 46 17.5 76.8 37 18.0 60.6 38 18.4 52.2 48 19.0 91.4 76 21.8 144.330-34 24 9.1 42.3 20 9.8 35.7 19 9.2 30.3 27 10.7 53.3 34 9.7 67.035-44 23 8.7 18.8 16 7.8 13.2 18 8.7 15.4 30 11.9 26.8 35 10.0 31.845-54 7 2.7 5.6 6 2.9 4.7 6 2.9 4.9 8 3.2 6.6 13 3.7 10.955-64 3 1.1 3.2 2 1.0 2.1 0 0.0 0.0 4 1.6 3.9 4 1.1 3.865+ 0 0.0 0.0 1 0.5 0.8 0 0.0 0.0 0 0.0 0.0 0 0.0 0.0Unknown 1 0.4 . 1 0.4 .
Subtotal 263 46.1 29.8 205 39.4 23.2 206 35.3 23.3 253 39.3 30.7 349 39.7 42.2
Total1 570 33.0 520 30.0 583 33.6 644 40.0 878 54.3
Note: Cumulative percentages may not equal 100% because of rounding.2. Excludes cases reported as "Unknown" gender. May not equal to SPA total.
Table a2.4. Reported Gonorrhea Cases and Rates per 100,000 Population by Gender and Age, San Gabriel Service Planning Area 3 (SPA 3), Los Angeles County, 2008-2012
2008 2009 2011 2012
1. Excludes cases from Pasadena.
2010

Sexually Transmitted Disease Morbidity Report - 2012 II-7
No. (%) Rate No. (%) Rate No. (%) Rate No. (%) Rate No. (%) Rate
MALE
0-14 2 0.2 1.5 1 0.1 0.8 0 0.0 0.0 1 0.1 1.1 0 0.0 0.015-19 54 4.9 129.9 66 4.1 154.8 63 3.3 151.8 54 2.8 155.1 85 3.2 250.620-24 204 18.4 530.2 294 18.3 784.6 300 15.5 795.0 297 15.5 682.0 423 16.1 1,044.925-29 243 21.9 541.9 356 22.2 847.4 424 21.9 920.4 449 23.5 770.0 631 24.0 1,129.930-34 160 14.4 275.1 290 18.1 531.6 329 17.0 573.0 336 17.6 581.3 470 17.9 804.335-44 302 27.2 234.3 390 24.3 300.9 515 26.6 405.2 446 23.3 438.0 584 22.2 567.445-54 124 11.2 136.0 180 11.2 190.8 263 13.6 273.4 278 14.5 349.0 356 13.5 440.355-64 19 1.7 34.9 22 1.4 38.7 32 1.7 55.0 47 2.5 85.7 72 2.7 127.465+ 1 0.1 1.8 6 0.4 10.6 5 0.3 8.7 4 0.2 7.7 4 0.2 7.3Unknown 1 0.1 . 1 0.1 . 2 0.1 . 1 0.1 . 3 0.1 .
Subtotal 1110 78.7 172.5 1606 83.5 250.9 1933 84.3 298.5 1913 83.9 332.2 2628 86.4 455.3
FEMALE
0-14 8 2.7 6.4 4 1.3 3.3 1 0.3 0.8 3 0.8 3.4 3 0.7 3.415-19 67 22.3 168.0 68 21.5 166.1 44 12.3 112.0 72 19.7 220.9 76 18.3 240.220-24 81 26.9 228.9 98 30.9 279.3 119 33.1 340.0 125 34.2 315.9 148 35.7 399.025-29 71 23.6 184.5 52 16.4 144.8 74 20.6 184.6 78 21.3 147.4 90 21.7 175.630-34 32 10.6 62.1 43 13.6 88.7 57 15.9 111.4 35 9.6 69.6 37 8.9 72.035-44 30 10.0 28.1 33 10.4 30.5 48 13.4 44.8 35 9.6 41.6 43 10.4 50.345-54 9 3.0 11.2 15 4.7 18.4 11 3.1 13.5 15 4.1 22.0 16 3.9 23.355-64 2 0.7 3.5 3 0.9 5.2 4 1.1 6.7 2 0.5 3.5 1 0.2 1.765+ 0 0.0 0.0 1 0.3 1.3 1 0.3 1.3 0 0.0 0.0 0 0.0 0.0Unknown 1 0.3 . 1 0.3 . 1 0.2 .
Subtotal 301 21.3 49.4 317 16.5 52.4 359 15.7 58.8 366 16.1 67.2 415 13.6 76.0
Total1 1,411 112.6 1,923 154.4 2,292 182.2 2,279 203.5 3,043 270.9
Note: Cumulative percentages may not equal 100% because of rounding.1. Excludes cases reported as "Unknown" gender. May not equal to SPA total.
Table a2.5. Reported Gonorrhea Cases and Rates per 100,000 Population by Gender and Age, Metro Service Planning Area 4 (SPA 4), Los Angeles County, 2008-2012
2008 2009 2011 20122010

Sexually Transmitted Disease Morbidity Report - 2012 II-8
No. (%) Rate No. (%) Rate No. (%) Rate No. (%) Rate No. (%) Rate
MALE
0-14 0 0.0 0.0 0 0.0 0.0 0 0.0 0.0 0 0.0 0.0 0 0.0 0.015-19 14 6.8 77.5 17 7.4 92.6 18 5.2 104.9 16 4.8 89.3 18 4.0 101.020-24 50 24.2 294.2 47 20.4 271.3 65 18.8 394.3 66 19.8 282.9 82 18.2 382.325-29 44 21.3 246.4 57 24.8 350.7 82 23.8 428.6 75 22.5 264.2 108 24.0 401.430-34 26 12.6 98.3 29 12.6 115.1 55 15.9 193.3 53 15.9 187.6 89 19.8 306.935-44 49 23.7 79.9 43 18.7 69.7 74 21.4 122.1 70 21.0 143.8 93 20.7 188.145-54 20 9.7 40.5 20 8.7 39.3 34 9.9 66.4 37 11.1 87.9 48 10.7 113.955-64 3 1.4 8.3 13 5.7 34.5 12 3.5 31.9 17 5.1 47.1 11 2.4 30.265+ 0 0.0 0.0 2 0.9 5.1 2 0.6 5.1 0 0.0 0.0 1 0.2 2.3Unknown 1 0.5 . 2 0.9 . 3 0.9 .
Subtotal 207 56.9 66.0 230 60.5 72.7 345 65.6 107.6 334 72.8 108.3 450 78.0 145.4
FEMALE
0-14 0 0.0 0.0 0 0.0 0.0 0 0.0 0.0 0 0.0 0.0 1 0.8 2.415-19 30 19.1 160.8 23 15.3 121.7 23 12.7 131.7 12 9.6 65.9 28 22.0 151.820-24 42 26.8 249.2 48 32.0 277.6 66 36.5 394.8 39 31.2 152.3 41 32.3 177.125-29 30 19.1 167.2 30 20.0 191.6 38 21.0 210.3 32 25.6 108.9 27 21.3 94.630-34 20 12.7 73.5 22 14.7 83.7 18 9.9 59.6 17 13.6 59.5 11 8.7 37.735-44 23 14.6 37.3 19 12.7 30.6 24 13.3 39.1 20 16.0 40.9 13 10.2 26.245-54 10 6.4 19.6 6 4.0 11.5 9 5.0 17.2 3 2.4 6.8 3 2.4 6.855-64 1 0.6 2.5 2 1.3 4.8 2 1.1 4.8 2 1.6 5.0 2 1.6 5.065+ 1 0.6 2.0 0 0.0 0.0 0 0.0 0.0 0 0.0 0.0 1 0.8 1.8Unknown 1 0.6 .
Subtotal 157 43.1 47.2 150 39.5 44.8 181 34.4 53.4 125 27.2 38.0 127 22.0 38.6
Total1 364 56.3 380 58.3 526 79.7 459 72.0 577 90.3
Note: Cumulative percentages may not equal 100% because of rounding.1. Excludes cases reported as "Unknown" gender. May not equal to SPA total.
Table a2.6. Reported Gonorrhea Cases and Rates per 100,000 Population by Gender and Age, West Service Planning Area 5 (SPA 5), Los Angeles County, 2008-2012
2008 2009 2011 20122010

Sexually Transmitted Disease Morbidity Report - 2012 II-9
No. (%) Rate No. (%) Rate No. (%) Rate No. (%) Rate No. (%) Rate
MALE
0-14 11 0.9 7.3 5 0.4 3.4 3 0.3 2.0 3 0.3 2.3 6 0.5 4.715-19 295 23.6 600.0 269 23.7 533.9 242 20.7 501.8 217 19.0 455.8 184 15.0 393.520-24 397 31.7 898.6 352 31.0 789.6 393 33.6 867.0 368 32.2 784.9 388 31.5 825.125-29 194 15.5 450.7 207 18.2 485.3 220 18.8 464.3 216 18.9 535.7 291 23.7 704.630-34 123 9.8 312.6 113 10.0 281.0 103 8.8 228.9 141 12.3 393.1 126 10.2 345.435-44 126 10.1 181.4 117 10.3 167.2 119 10.2 171.7 105 9.2 160.0 128 10.4 194.645-54 83 6.6 154.2 57 5.0 103.8 61 5.2 110.0 67 5.9 116.8 88 7.2 151.955-64 17 1.4 53.9 10 0.9 30.7 23 2.0 68.6 18 1.6 47.6 14 1.1 35.465+ 2 0.2 6.4 5 0.4 15.7 2 0.2 6.2 6 0.5 19.1 3 0.2 9.0Unknown 3 0.2 . 2 0.2 . 2 0.2 . 2 0.2 .
Subtotal 1251 48.2 244.0 1135 49.7 220.5 1168 48.1 222.6 1143 48.8 232.7 1230 51.9 248.3
FEMALE
0-14 30 2.2 20.6 18 1.6 12.6 22 1.7 15.3 24 2.0 19.3 14 1.2 11.315-19 558 41.5 1,150.5 450 39.2 907.2 437 34.7 936.0 446 37.2 947.4 366 32.2 789.620-24 407 30.3 942.1 407 35.5 930.4 462 36.6 1,059.8 426 35.5 930.2 429 37.7 922.325-29 181 13.5 441.4 147 12.8 362.1 181 14.4 401.7 160 13.3 406.9 175 15.4 442.030-34 80 6.0 206.8 49 4.3 125.1 80 6.3 183.9 61 5.1 166.7 68 6.0 183.835-44 64 4.8 90.1 47 4.1 66.0 52 4.1 73.8 56 4.7 80.6 53 4.7 76.445-54 18 1.3 30.1 23 2.0 38.0 24 1.9 39.4 20 1.7 31.4 27 2.4 42.255-64 2 0.1 5.2 2 0.2 5.1 2 0.2 4.9 7 0.6 15.8 5 0.4 10.865+ 1 0.1 2.1 1 0.1 2.0 0 0.0 0.0 0 0.0 0.0 0 0.0 0.0Unknown 2 0.1 . 3 0.3 . 1 0.1 . 1 0.1 .
Subtotal 1343 51.8 251.0 1,147 50.3 213.8 1,261 51.9 231.6 1,200 51.2 231.5 1,138 48.1 218.0
Total1 2,594 247.6 2,282 217.1 2,429 227.2 2,343 232.1 2,368 232.7
Note: Cumulative percentages may not equal 100% because of rounding.1. Excludes cases reported as "Unknown" gender. May not equal to SPA total.
Table a2.7. Reported Gonorrhea Cases and Rates per 100,000 Population by Gender and Age, South Service Planning Area 6 (SPA 6), Los Angeles County, 2008-2012
2008 2009 2011 20122010

Sexually Transmitted Disease Morbidity Report - 2012 II-10
No. (%) Rate No. (%) Rate No. (%) Rate No. (%) Rate No. (%) Rate
MALE
0-14 2 0.7 1.2 1 0.3 0.6 0 0.0 0.0 2 0.4 1.4 1 0.2 0.715-19 34 11.4 57.1 45 14.0 74.0 47 10.6 82.0 49 10.6 85.7 63 10.4 112.920-24 104 35.0 186.8 98 30.4 176.8 119 26.9 216.4 156 33.6 300.1 205 33.7 384.225-29 54 18.2 99.3 72 22.4 130.7 108 24.4 174.0 112 24.1 238.6 133 21.9 283.930-34 35 11.8 68.9 35 10.9 69.3 60 13.5 109.9 55 11.9 123.0 82 13.5 184.135-44 44 14.8 44.2 56 17.4 56.2 81 18.3 84.0 50 10.8 55.3 72 11.8 80.545-54 18 6.1 21.6 11 3.4 13.0 19 4.3 22.8 32 6.9 39.4 44 7.2 53.955-64 4 1.3 7.3 3 0.9 5.3 6 1.4 10.6 6 1.3 10.0 6 1.0 9.865+ 1 0.3 1.7 0 0.0 0.0 2 0.5 3.5 1 0.2 1.7 1 0.2 1.6Unknown 1 0.3 . 1 0.3 . 1 0.2 . 1 0.2 . 1 0.2 .
Subtotal 297 50.8 43.4 322 59.1 47.1 443 61.3 64.8 464 61.5 72.9 608 61.5 95.3
FEMALE
0-14 4 1.4 2.5 1 0.4 0.6 3 1.1 2.0 5 1.7 3.6 2 0.5 1.515-19 82 28.5 143.5 65 29.1 110.9 56 20.0 102.8 59 20.3 107.5 74 19.5 137.720-24 102 35.4 191.6 72 32.3 134.3 99 35.4 189.1 111 38.3 223.7 139 36.6 272.125-29 48 16.7 96.1 51 22.9 101.7 64 22.9 111.5 46 15.9 100.2 77 20.3 168.030-34 27 9.4 54.9 13 5.8 26.8 28 10.0 53.9 38 13.1 83.7 48 12.6 106.535-44 23 8.0 23.6 15 6.7 15.3 19 6.8 20.0 21 7.2 22.7 27 7.1 29.545-54 1 0.3 1.1 5 2.2 5.7 6 2.1 7.0 8 2.8 9.5 10 2.6 11.955-64 1 0.3 1.6 1 0.4 1.6 3 1.1 4.7 1 0.3 1.5 2 0.5 2.965+ 0 0.0 0.0 0 0.0 0.0 2 0.7 2.5 0 0.0 0.0 1 0.3 1.2Unknown 1 0.3 .
Subtotal 288 49.2 41.3 223 40.9 31.9 280 38.7 40.3 290 38.5 44.0 380 38.5 57.5
Total1 585 42.4 545 39.4 723 52.5 754 58.2 988 76.1
Note: Cumulative percentages may not equal 100% because of rounding.1. Excludes cases reported as "Unknown" gender. May not equal to SPA total.
Table a2.8. Reported Gonorrhea Cases and Rates per 100,000 Population by Gender and Age, East Service Planning Area 7 (SPA 7), Los Angeles County, 2008-2012
2008 2009 2011 20122010

Sexually Transmitted Disease Morbidity Report - 2012 II-11
No. (%) Rate No. (%) Rate No. (%) Rate No. (%) Rate No. (%) Rate
MALE
0-14 0 0.0 0.0 0 0.0 0.0 2 0.3 1.7 0 0.0 0.0 2 0.3 1.915-19 83 18.1 191.8 91 17.8 204.8 110 17.9 263.6 93 14.5 233.4 96 13.3 244.220-24 168 36.6 427.5 169 33.1 422.1 169 27.6 431.3 212 33.0 614.8 218 30.3 613.725-29 78 17.0 219.9 111 21.8 303.9 130 21.2 298.3 129 20.1 358.0 161 22.4 455.330-34 35 7.6 98.2 44 8.6 128.2 62 10.1 165.8 82 12.8 229.7 79 11.0 219.735-44 52 11.3 61.1 57 11.2 68.2 71 11.6 89.2 68 10.6 92.7 92 12.8 127.545-54 35 7.6 43.6 34 6.7 41.6 55 9.0 68.1 45 7.0 58.0 52 7.2 67.555-64 6 1.3 11.3 2 0.4 3.7 12 2.0 21.9 12 1.9 21.0 14 1.9 23.865+ 2 0.4 3.6 2 0.4 3.5 0 0.0 0.0 2 0.3 3.5 5 0.7 8.2Unknown 2 0.3 . 1 0.1 .
Subtotal 459 48.8 83.4 510 52.4 92.5 613 57.7 111.2 643 55.6 123.8 720 58.0 138.1
FEMALE
0-14 12 2.5 10.3 5 1.1 4.4 7 1.6 6.2 2 0.4 2.0 12 2.3 11.915-19 167 34.7 398.7 165 35.6 382.6 164 36.5 408.4 172 33.5 450.3 139 26.6 363.520-24 159 33.1 421.4 163 35.1 423.3 140 31.2 374.3 175 34.0 532.2 189 36.2 561.125-29 69 14.3 205.6 75 16.2 219.2 67 14.9 163.6 74 14.4 206.4 89 17.0 253.730-34 32 6.7 88.5 22 4.7 63.5 39 8.7 104.1 40 7.8 110.2 40 7.7 110.835-44 33 6.9 37.7 20 4.3 23.2 22 4.9 26.7 31 6.0 39.8 39 7.5 50.945-54 7 1.5 8.4 9 1.9 10.6 5 1.1 6.0 18 3.5 22.1 11 2.1 13.655-64 2 0.4 3.4 5 1.1 8.2 5 1.1 8.2 2 0.4 3.2 3 0.6 4.665+ 0 0.0 0.0 0 0.0 0.0 0 0.0 0.0 0 0.0 0.0 0 0.0 0.0Unknown
Subtotal 481 51.2 84.3 464 47.6 81.1 449 42.3 78.6 514 44.4 94.7 522 42.0 95.8
Total² 940 83.9 974 86.7 1,062 94.6 1,157 108.9 1,242 116.5
1. Excludes cases from Long Beach.
Note: Cumulative percentages may not equal 100% because of rounding.2. Excludes cases reported as "Unknown" gender. May not equal to SPA total.
Table a2.9. Reported Gonorrhea Cases and Rates per 100,000 Population by Gender and Age, South Bay Service Planning Area 8 (SPA 8), Los Angeles County, 2008-2012
2008 2009 2011 20122010

Sexually Transmitted Disease Morbidity Report - 2012 II-12
Adj. Adj. Adj. Adj.No. (%) Rate No. (%) Rate No. (%) Rate No. (%) Rate No. (%) Rate
MALE
2008 12 9.3 16.8 74 57.4 341.0 22 17.1 37.9 0 0.0 0.0 129 45.6 70.72009 14 9.2 20.4 95 62.5 424.1 20 13.2 32.0 0 0.0 0.0 152 47.1 82.22010 12 7.5 17.2 82 51.3 349.6 45 28.1 66.2 0 0.0 0.0 160 49.5 85.12011 15 11.0 24.4 80 58.8 305.6 24 17.7 31.1 0 0.0 0.0 136 48.6 70.82012 21 11.4 36.8 96 51.9 390.0 29 15.7 40.1 1 0.5 17.0 185 41.9 96.0
FEMALE
2008 24 15.6 31.6 97 63.0 419.3 16 10.4 27.1 2 1.3 30.6 154 54.4 85.12009 12 7.0 16.7 112 65.5 476.0 22 12.9 35.0 5 2.9 75.4 171 52.9 93.42010 22 13.5 29.4 113 69.3 453.4 18 11.0 25.9 3 1.8 40.6 163 50.5 88.02011 11 7.6 17.7 105 72.9 368.2 12 8.3 15.5 0 0.0 0.0 144 51.4 74.12012 24 9.3 40.5 142 55.3 515.8 45 17.5 60.3 3 1.2 43.0 257 58.1 131.9
Note: If race/ethnicity was not specified, cases were prorated according to the distribution of cases for which race/ethnicity was specified. Rates were adjusted including the prorated cases. Therefore, these tables should be used only for race/ethnicity comparisons, not for overall totals or gender totals. Cumulative percentages may not
Table a2.10. Reported Gonorrhea Cases and Rates per 100,000 Population by Gender and Race/Ethnicity, Antelope Valley Service Planning Area 1 (SPA 1), Los Angeles County, 2008-2012
White Black Latino Asian-Pacific Total1
equal 100% because of rounding.
1. Includes Native Americans and cases reported as "Mixed/Other/Unknown" race/ethnicity. Excludes cases reported with "Other/Unknown" gender. May not add up to SPA total.

Sexually Transmitted Disease Morbidity Report - 2012 II-13
Adj. Adj. Adj. Adj.No. (%) Rate No. (%) Rate No. (%) Rate No. (%) Rate No. (%) Rate
MALE
2008 198 35.8 44.2 90 16.3 265.8 155 28.0 41.4 24 4.3 25.2 553 60.0 50.82009 224 34.7 49.3 101 15.6 293.6 195 30.2 51.1 22 3.4 22.8 646 64.1 58.62010 252 33.1 55.4 134 17.6 376.5 249 32.7 63.2 29 3.8 28.4 761 65.7 68.92011 294 35.2 67.1 119 14.3 340.3 286 34.3 75.4 31 3.7 30.8 835 67.7 79.02012 391 35.7 90.7 121 11.1 348.9 381 34.8 100.7 48 4.4 48.1 1,094 69.3 102.9
FEMALE
2008 129 35.0 29.0 62 16.8 191.9 97 26.3 27.2 15 4.1 14.4 369 40.0 33.62009 136 37.6 30.2 51 14.1 155.9 96 26.5 26.5 15 4.1 14.2 362 35.9 32.62010 136 34.2 29.7 57 14.3 166.3 136 34.2 36.0 16 4.0 14.1 398 34.3 35.82011 124 31.1 28.0 39 9.8 118.3 167 41.9 44.3 18 4.5 15.6 399 32.3 37.02012 154 31.8 35.5 48 9.9 147.0 191 39.5 51.0 23 4.8 20.2 484 30.7 44.7
Note: If race/ethnicity was not specified, cases were prorated according to the distribution of cases for which race/ethnicity was specified. Rates were adjusted including the prorated cases. Therefore, these tables should be used only for race/ethnicity comparisons, not for overall totals or gender totals. Cumulative percentages may not
Table a2.11. Reported Gonorrhea Cases and Rates per 100,000 Population by Gender and Race/Ethnicity, San Fernando Service Planning Area 2 (SPA 2), Los Angeles County, 2008-2012
White Black Latino Asian-Pacific Total1
equal 100% because of rounding.
1. Includes Native Americans and cases reported as "Mixed/Other/Unknown" race/ethnicity. Excludes cases reported with "Other/Unknown" gender. May not add up to SPA total.

Sexually Transmitted Disease Morbidity Report - 2012 II-14
Adj. Adj. Adj. Adj.No. (%) Rate No. (%) Rate No. (%) Rate No. (%) Rate No. (%) Rate
MALE
2008 41 13.4 24.0 56 18.2 219.1 127 41.4 37.1 29 9.5 15.6 307 53.9 36.22009 55 17.5 29.9 59 18.7 218.4 140 44.4 37.6 32 10.2 15.6 315 60.6 37.12010 63 16.7 35.1 51 13.5 186.7 190 50.4 50.3 44 11.7 21.0 377 64.7 44.32011 52 13.3 33.7 57 14.6 241.4 220 56.3 60.8 39 10.0 18.0 391 60.7 49.72012 91 17.2 60.0 64 12.1 274.5 280 52.9 78.0 51 9.6 23.8 529 60.3 67.0
FEMALE
2008 32 12.2 16.8 47 17.9 158.2 128 48.7 35.2 27 10.3 12.8 263 46.1 29.82009 19 9.3 10.1 46 22.4 159.6 93 45.4 25.5 22 10.7 10.3 205 39.4 23.22010 29 14.1 15.2 51 24.8 168.9 92 44.7 24.0 18 8.7 7.9 206 35.3 23.32011 33 13.0 21.4 38 15.0 156.0 146 57.7 40.7 14 5.5 6.1 253 39.3 30.72012 38 10.9 24.4 53 15.2 214.8 200 57.3 54.8 30 8.6 12.9 349 39.7 42.2
1. Excludes cases from Pasadena.
Note: If race/ethnicity was not specified, cases were prorated according to the distribution of cases for which race/ethnicity was specified. Rates were adjusted including the prorated cases. Therefore, these tables should be used only for race/ethnicity comparisons, not for overall totals or gender totals. Cumulative percentages may not equal 100% because of rounding.
Table a2.12. Reported Gonorrhea Cases and Rates per 100,000 Population by Gender and Race/Ethnicity,San Gabriel Service Planning Area 3 (SPA 3), Los Angeles County, 2008-2012
White Black Latino Asian-Pacific Total1,2
2. Includes Native Americans and cases reported as "Mixed/Other/Unknown" race/ethnicity. Excludes cases reported with "Other/Unknown" gender. May not add up to SPA total.
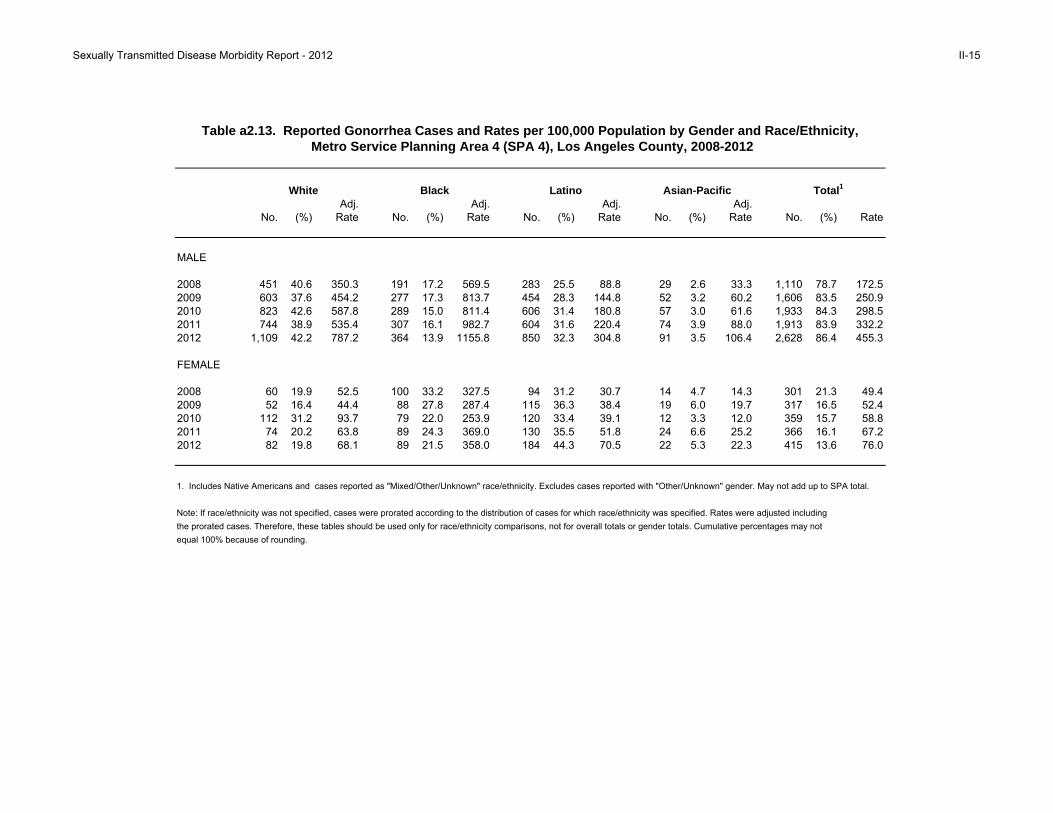
Sexually Transmitted Disease Morbidity Report - 2012 II-15
Adj. Adj. Adj. Adj.No. (%) Rate No. (%) Rate No. (%) Rate No. (%) Rate No. (%) Rate
MALE
2008 451 40.6 350.3 191 17.2 569.5 283 25.5 88.8 29 2.6 33.3 1,110 78.7 172.52009 603 37.6 454.2 277 17.3 813.7 454 28.3 144.8 52 3.2 60.2 1,606 83.5 250.92010 823 42.6 587.8 289 15.0 811.4 606 31.4 180.8 57 3.0 61.6 1,933 84.3 298.52011 744 38.9 535.4 307 16.1 982.7 604 31.6 220.4 74 3.9 88.0 1,913 83.9 332.22012 1,109 42.2 787.2 364 13.9 1155.8 850 32.3 304.8 91 3.5 106.4 2,628 86.4 455.3
FEMALE
2008 60 19.9 52.5 100 33.2 327.5 94 31.2 30.7 14 4.7 14.3 301 21.3 49.42009 52 16.4 44.4 88 27.8 287.4 115 36.3 38.4 19 6.0 19.7 317 16.5 52.42010 112 31.2 93.7 79 22.0 253.9 120 33.4 39.1 12 3.3 12.0 359 15.7 58.82011 74 20.2 63.8 89 24.3 369.0 130 35.5 51.8 24 6.6 25.2 366 16.1 67.22012 82 19.8 68.1 89 21.5 358.0 184 44.3 70.5 22 5.3 22.3 415 13.6 76.0
Note: If race/ethnicity was not specified, cases were prorated according to the distribution of cases for which race/ethnicity was specified. Rates were adjusted including the prorated cases. Therefore, these tables should be used only for race/ethnicity comparisons, not for overall totals or gender totals. Cumulative percentages may not
Table a2.13. Reported Gonorrhea Cases and Rates per 100,000 Population by Gender and Race/Ethnicity, Metro Service Planning Area 4 (SPA 4), Los Angeles County, 2008-2012
White Black Latino Asian-Pacific Total1
equal 100% because of rounding.
1. Includes Native Americans and cases reported as "Mixed/Other/Unknown" race/ethnicity. Excludes cases reported with "Other/Unknown" gender. May not add up to SPA total.

Sexually Transmitted Disease Morbidity Report - 2012 II-16
Adj. Adj. Adj. Adj.No. (%) Rate No. (%) Rate No. (%) Rate No. (%) Rate No. (%) Rate
MALE
2008 82 39.6 45.9 40 19.3 228.3 40 19.3 83.5 13 6.3 40.9 207 56.9 66.02009 107 46.5 57.1 42 18.3 229.5 39 17.0 81.0 15 6.5 46.6 230 60.5 72.72010 176 51.0 92.9 60 17.4 310.2 57 16.5 110.0 20 5.8 56.4 345 65.6 107.62011 159 47.6 82.5 54 16.2 322.3 70 21.0 155.5 24 7.2 68.1 334 72.8 108.32012 234 52.0 118.6 81 18.0 472.2 78 17.3 168.3 25 5.6 68.8 450 78.0 145.4
FEMALE
2008 46 29.3 25.4 52 33.1 264.9 17 10.8 35.1 17 10.8 44.7 157 43.1 47.22009 59 39.3 32.1 32 21.3 161.2 17 11.3 36.1 10 6.7 26.8 150 39.5 44.82010 81 44.8 42.5 38 21.0 176.0 17 9.4 32.9 24 13.3 56.9 181 34.4 53.42011 52 41.6 28.3 22 17.6 128.9 19 15.2 41.0 15 12.0 35.8 125 27.2 38.02012 55 43.3 27.4 32 25.2 171.6 17 13.4 33.3 14 11.0 30.4 127 22.0 38.6
Note: If race/ethnicity was not specified, cases were prorated according to the distribution of cases for which race/ethnicity was specified. Rates were adjusted including the prorated cases. Therefore, these tables should be used only for race/ethnicity comparisons, not for overall totals or gender totals. Cumulative percentages may not
Table a2.14. Reported Gonorrhea Cases and Rates per 100,000 Population by Gender and Race/Ethnicity,West Service Planning Area 5 (SPA 5), Los Angeles County, 2008-2012
White Black Latino Asian-Pacific Total1
equal 100% because of rounding.
1. Includes Native Americans and cases reported as "Mixed/Other/Unknown" race/ethnicity. Excludes cases reported with "Other/Unknown" gender. May not add up to SPA total.

Sexually Transmitted Disease Morbidity Report - 2012 II-17
Adj. Adj. Adj. Adj.No. (%) Rate No. (%) Rate No. (%) Rate No. (%) Rate No. (%) Rate
MALE
2008 23 1.8 194.3 934 74.7 685.3 171 13.7 54.7 4 0.3 50.6 1,251 48.2 244.02009 19 1.7 151.1 870 76.7 624.8 163 14.4 50.4 4 0.4 48.0 1,135 49.7 220.52010 30 2.6 224.4 866 74.1 612.7 209 17.9 61.8 8 0.7 91.2 1,168 48.1 222.62011 40 3.5 333.0 794 69.5 650.9 256 22.4 77.5 9 0.8 106.1 1,143 48.8 232.72012 40 3.3 334.3 820 66.7 669.7 312 25.4 93.0 13 1.1 152.9 1,230 51.9 248.3
FEMALE
2008 12 0.9 105.4 991 73.8 578.8 202 15.0 67.5 13 1.0 146.6 1,343 51.8 251.02009 17 1.5 144.3 894 77.9 522.3 137 11.9 45.1 4 0.4 43.9 1,147 50.3 213.82010 29 2.3 227.6 967 76.7 550.7 195 15.5 61.0 3 0.2 31.1 1,261 51.9 231.62011 22 1.8 186.6 945 78.8 609.0 185 15.4 56.9 3 0.3 32.4 1,200 51.2 231.52012 18 1.6 153.0 846 74.3 544.1 226 19.9 68.5 6 0.5 64.7 1,138 48.1 218.0
Note: If race/ethnicity was not specified, cases were prorated according to the distribution of cases for which race/ethnicity was specified. Rates were adjusted including the prorated cases. Therefore, these tables should be used only for race/ethnicity comparisons, not for overall totals or gender totals. Cumulative percentages may not
Table a2.15. Reported Gonorrhea Cases and Rates per 100,000 Population by Gender and Race/Ethnicity, South Service Planning Area 6 (SPA 6), Los Angeles County, 2008-2012
White Black Latino Asian-Pacific Total1
equal 100% because of rounding.
1. Includes Native Americans and cases reported as "Mixed/Other/Unknown" race/ethnicity. Excludes cases reported with "Other/Unknown" gender. May not add up to SPA total.

Sexually Transmitted Disease Morbidity Report - 2012 II-18
Adj. Adj. Adj. Adj.No. (%) Rate No. (%) Rate No. (%) Rate No. (%) Rate No. (%) Rate
MALE
2008 33 11.1 32.6 50 16.8 326.0 160 53.9 38.1 5 1.7 10.0 297 50.8 43.42009 32 9.9 30.3 58 18.0 352.7 192 59.6 42.6 8 2.5 14.9 322 59.1 47.12010 59 13.3 56.4 62 14.0 371.9 275 62.1 59.4 12 2.7 21.6 443 61.3 64.82011 56 12.1 64.4 61 13.2 353.9 297 64.0 67.9 15 3.2 29.0 464 61.5 72.92012 70 11.5 80.7 52 8.6 299.4 426 70.1 97.0 15 2.5 28.9 608 61.5 95.3
FEMALE
2008 22 7.6 19.9 65 22.6 375.8 161 55.9 36.6 7 2.4 12.4 288 49.2 41.32009 17 7.6 15.7 52 23.3 297.7 120 53.8 27.0 8 3.6 14.0 223 40.9 31.92010 29 10.4 27.2 42 15.0 241.0 174 62.1 38.7 7 2.5 11.9 280 38.7 40.32011 28 9.7 31.4 44 15.2 235.4 190 65.5 42.2 6 2.1 10.4 290 38.5 44.02012 40 10.5 44.9 38 10.0 201.4 266 70.0 58.8 7 1.8 12.1 380 38.5 57.5
Note: If race/ethnicity was not specified, cases were prorated according to the distribution of cases for which race/ethnicity was specified. Rates were adjusted including the prorated cases. Therefore, these tables should be used only for race/ethnicity comparisons, not for overall totals or gender totals. Cumulative percentages may not
Table a2.16. Reported Gonorrhea Cases and Rates per 100,000 Population by Gender and Race/Ethnicity,East Service Planning Area 7 (SPA 7), Los Angeles County, 2008-2012
White Black Latino Asian-Pacific Total1
equal 100% because of rounding.
1. Includes Native Americans and cases reported as "Mixed/Other/Unknown" race/ethnicity. Excludes cases reported with "Other/Unknown" gender. May not add up to SPA total.

Sexually Transmitted Disease Morbidity Report - 2012 II-19
Adj. Adj. Adj. Adj.No. (%) Rate No. (%) Rate No. (%) Rate No. (%) Rate No. (%) Rate
MALE
2008 17 3.7 10.6 320 69.7 442.9 64 13.9 33.0 11 2.4 14.7 459 48.8 83.42009 32 6.3 20.0 344 67.5 473.0 75 14.7 38.0 10 2.0 13.3 510 52.4 92.52010 69 11.3 43.1 368 60.0 495.2 108 17.6 52.9 23 3.8 29.6 613 57.7 111.22011 66 10.3 45.1 353 54.9 516.8 146 22.7 75.8 22 3.4 29.2 643 55.6 123.82012 87 12.1 59.3 368 51.1 535.4 179 24.9 91.4 22 3.1 28.8 720 58.0 138.1
FEMALE
2008 21 4.4 13.1 342 71.1 384.2 63 13.1 32.8 10 2.1 12.1 481 51.2 84.32009 34 7.3 21.4 314 67.7 355.2 51 11.0 26.4 13 2.8 15.9 464 47.6 81.12010 34 7.6 21.1 297 66.2 325.1 73 16.3 36.3 14 3.1 16.3 449 42.3 78.62011 40 7.8 27.6 324 63.0 379.7 107 20.8 54.3 6 1.2 6.9 514 44.4 94.72012 58 11.1 40.9 288 55.2 345.1 116 22.2 59.5 10 1.9 11.7 522 42.0 95.8
Note: If race/ethnicity was not specified, cases were prorated according to the distribution of cases for which race/ethnicity was specified. Rates were adjusted including the prorated cases. Therefore, these tables should be used only for race/ethnicity comparisons, not for overall totals or gender totals. Cumulative percentages may not
Table a2.17. Reported Gonorrhea Cases and Rates per 100,000 Population by Gender and Race/Ethnicity, South Bay Service Planning Area 8 (SPA 8), Los Angeles County, 2008-2012
White Black Latino Asian-Pacific Total1,2
1. Excludes cases from Long Beach.2. Includes Native Americans and cases reported as "Mixed/Other/Unknown" race/ethnicity. Excludes cases reported with "Other/Unknown" gender. May not add up to SPA total.
equal 100% because of rounding.

Addendum III:
Primary and Secondary Syphilis

Sexually Transmitted Disease Surveillance Report - 2012 III-1
0 8 164 Miles±
Figure a3.1 Reported Primary and Secondary Syphilis Rates per 100,000 Population by Service Planning Area (SPA), Los Angeles County, 2012.
Excludes cases from Pasadena (SPA 3) and Long Beach (SPA 8).
Antelope Valley (SPA 1)3.1
East (SPA 7)4.3
Metro (SPA 4)30.0
San Fernando (SPA 2)7.5
San Gabriel (SPA 3)4.1
South (SPA 6)12.0
South Bay (SPA 8)5.7
West (SPA 5)7.7

Foothill4.3
West7.7
Antelope Valley3.1
San Fernando4.8
East Valley12.4
West Valley6.5
Pomona3.7
Whittier0.9
Torrance3.1
El Monte3.5
Glendale7.4
Harbor2.5
Central24.3
Alhambra5.5
Bellflower3.4
Inglewood10.2 Compton
6.8
Southwest16.0
Long Beach *0
San Antonio5.7
Northeast11.5
Pasadena *0
Hollywood-Wilshir45.7
South15.3
East Los Angeles8.3Southeast
8.2
* Data of Pasadena (SPA 3) and Long Beach (SPA 8) are not available.
0 7 143.5 Miles±
Rates per 100,000 population0.00.1 - 15.015.1 - 30.030.1 - 45.045.1 - 60.0
Figure a3.2 Reported Primary and Seconary Syphilis Rates per 100,000 Population by Health District (HD), Los Angeles County, 2012.
Sexually Transmitted Disease Morbidity Report - 2012 III-2

Sexually Transmitted Disease Morbidity Report - 2012 III-3
No. (%) Rate No. (%) Rate No. (%) Rate No. (%) Rate No. (%) Rate
SPA2/HD3
Antelope Valley (1) 0 0.0 0.0 7 1.0 1.9 5 0.8 1.3 8 1.1 2.1 12 1.4 3.1 Antelope Valley 7 1.0 1.9 5 0.8 1.3 8 1.1 2.1 12 1.4 3.1
0 0.00 0.0East (7) 58 8.2 4.2 66 9.4 4.8 58 9.1 4.2 62 8.3 4.8 56 6.4 4.3 Bellflower 19 2.7 5.1 20 2.8 5.4 9 1.4 2.4 12 1.6 3.4 12 1.4 3.4 East Los Angeles 6 0.8 2.7 14 2.0 6.3 13 2.0 6.0 10 1.3 4.9 17 1.9 8.3 San Antonio 14 2.0 3.1 17 2.4 3.7 22 3.5 4.9 25 3.3 6.0 24 2.7 5.7 Whittier 19 2.7 5.6 15 2.1 4.5 14 2.2 4.1 15 2.0 4.7 3 0.3 0.9
Metro (4) 288 40.8 23.0 289 41.1 23.2 256 40.2 20.3 306 40.8 27.3 337 38.4 30.0 Central 64 9.1 17.4 63 9.0 17.2 66 10.4 17.9 66 8.8 19.6 82 9.3 24.3 Hollywood-Wilshire 199 28.2 37.1 202 28.7 38.0 163 25.6 30.3 216 28.8 45.0 220 25.1 45.7 Northeast 25 3.5 7.2 24 3.4 6.9 27 4.2 7.7 24 3.2 7.9 35 4.0 11.5
San Fernando (2) 122 17.3 5.6 111 15.8 5.0 110 17.3 5.0 129 17.2 6.0 160 18.2 7.5 East Valley 38 5.4 8.2 34 4.8 7.2 43 6.8 9.2 49 6.5 11.1 55 6.3 12.4 Glendale 19 2.7 5.4 19 2.7 5.3 17 2.7 4.8 12 1.6 3.6 25 2.8 7.4 San Fernando 22 3.1 4.7 10 1.4 2.1 17 2.7 3.5 15 2.0 3.0 24 2.7 4.8 West Valley 43 6.1 4.8 48 6.8 5.3 33 5.2 3.6 53 7.1 6.2 56 6.4 6.5
San Gabriel (3) 63 8.9 3.6 49 7.0 2.8 36 5.7 2.1 35 4.7 2.2 67 7.6 4.1 Alhambra 8 1.1 2.2 12 1.7 3.3 11 1.7 3.0 8 1.1 2.3 19 2.2 5.5 El Monte 20 2.8 4.2 16 2.3 3.3 7 1.1 1.5 7 0.9 1.6 15 1.7 3.5 Foothill 13 1.8 4.1 7 1.0 2.2 13 2.0 4.1 7 0.9 2.3 13 1.5 4.3 Pomona 22 3.1 3.8 14 2.0 2.4 5 0.8 0.9 13 1.7 2.4 20 2.3 3.7
South (6) 85 12.0 8.1 65 9.2 6.2 70 11.0 6.5 108 14.4 10.7 122 13.9 12.0 Compton 23 3.3 7.9 17 2.4 5.9 14 2.2 4.8 22 2.9 7.9 19 2.2 6.8 South 10 1.4 5.3 13 1.8 6.7 9 1.4 4.6 20 2.7 10.7 29 3.3 15.3 Southeast 12 1.7 6.6 9 1.3 4.9 12 1.9 6.5 12 1.6 7.1 14 1.6 8.2 Southwest 40 5.7 10.4 26 3.7 6.8 35 5.5 8.8 54 7.2 14.4 60 6.8 16.0
South Bay (8) 38 5.4 3.4 43 6.1 3.8 41 6.4 3.7 49 6.5 4.6 61 6.9 5.7 Harbor 5 0.7 2.3 2 0.3 0.9 7 1.1 3.3 7 0.9 3.5 5 0.6 2.5 Inglewood 22 3.1 5.0 29 4.1 6.7 26 4.1 6.0 30 4.0 7.3 42 4.8 10.2 Torrance 11 1.6 2.3 12 1.7 2.5 8 1.3 1.7 12 1.6 2.7 14 1.6 3.1 West (5) 38 5.4 5.9 50 7.1 7.7 41 6.4 6.2 45 6.0 7.1 49 5.6 7.7 West 38 5.4 5.9 50 7.1 7.7 41 6.4 6.2 45 6.0 7.1 49 5.6 7.7
Unknown 14 2.0 . 23 3.3 . 20 3.1 . 8 1.1 . 14 1.6 .
Total 706 7.3 703 7.2 637 6.5 750 8.1 878 9.4
1. Excludes cases from Pasadena (SPA 3) and Long Beach (SPA 8).2. Main categories.3. Subcategories.Note: Cumulative percentages may not equal 100% because of rounding.
Table a3.1. Reported Primary and Secondary Syphilis Cases and Rates per 100,000 Population by Service and Health District (HD), Los Angeles County, 2008-2012
2011 20122008 2009 2010

Sexually Transmitted Disease Morbidity Report - 2012 III-4
No. (%) Rate No. (%) Rate No. (%) Rate No. (%) Rate No. (%) Rate
MALE
0-14 0 0.0 0.0 0 0.0 0.0 0 0.0 0.0 0 0.0 0.0 0 0.0 0.015-19 0 0.0 0.0 0 0.0 0.0 1 20.0 6.0 1 12.5 5.2 0 0.0 0.020-24 0 0.0 0.0 2 28.6 10.8 2 40.0 11.2 3 37.5 19.4 4 36.4 24.525-29 0 0.0 0.0 0 0.0 0.0 1 20.0 4.9 2 25.0 15.6 2 18.2 15.330-34 0 0.0 0.0 1 14.3 9.5 1 20.0 7.8 0 0.0 0.0 1 9.1 8.535-44 0 0.0 0.0 3 42.9 14.3 0 0.0 0.0 1 12.5 4.1 3 27.3 12.845-54 0 0.0 0.0 1 14.3 3.7 0 0.0 0.0 0 0.0 0.0 1 9.1 3.655-64 0 0.0 0.0 0 0.0 0.0 0 0.0 0.0 1 12.5 5.2 0 0.0 0.065+ 0 0.0 0.0 0 0.0 0.0 0 0.0 0.0 0 0.0 0.0 0 0.0 0.0Unknown
Subtotal 0 0.0 0.0 7 100.0 3.8 5 100.0 2.7 8 100.0 4.2 11 91.7 5.7
FEMALE
0-14 0 0.0 0.0 0 0.0 0.0 0 0.0 0.0 0 0.0 0.0 0 0.0 0.015-19 0 0.0 0.0 0 0.0 0.0 0 0.0 0.0 0 0.0 0.0 0 0.0 0.020-24 0 0.0 0.0 0 0.0 0.0 0 0.0 0.0 0 0.0 0.0 0 0.0 0.025-29 0 0.0 0.0 0 0.0 0.0 0 0.0 0.0 0 0.0 0.0 0 0.0 0.030-34 0 0.0 0.0 0 0.0 0.0 0 0.0 0.0 0 0.0 0.0 1 100.0 8.735-44 0 0.0 0.0 0 0.0 0.0 0 0.0 0.0 0 0.0 0.0 0 0.0 0.045-54 0 0.0 0.0 0 0.0 0.0 0 0.0 0.0 0 0.0 0.0 0 0.0 0.055-64 0 0.0 0.0 0 0.0 0.0 0 0.0 0.0 0 0.0 0.0 0 0.0 0.065+ 0 0.0 0.0 0 0.0 0.0 0 0.0 0.0 0 0.0 0.0 0 0.0 0.0Unknown
Subtotal 0 0.0 0.0 0 0.0 0.0 0 0.0 0.0 0 0.0 0.0 1 8.3 0.5
Total1 0 0.0 7 1.9 5 1.3 8 2.1 12 3.1
1. Excludes cases reported as "Unknown" gender. May not equal to SPA total.Note: Cumulative percentages may not equal 100% because of rounding.
Table a3.2. Reported Primary and Secondary Syphilis Cases and Rates per 100,000 Population by Gender and Age, Antelope Valley Service Planning Area 1 (SPA 1), Los Angeles County, 2008-2012
2008 2009 2011 20122010

Sexually Transmitted Disease Morbidity Report - 2012 III-5
No. (%) Rate No. (%) Rate No. (%) Rate No. (%) Rate No. (%) Rate
MALE
0-14 0 0.0 0.0 0 0.0 0.0 0 0.0 0.0 0 0.0 0.0 0 0.0 0.015-19 5 4.3 6.1 2 1.9 2.4 5 4.5 6.3 4 3.2 5.0 3 1.9 3.820-24 15 12.8 18.9 21 19.4 26.0 16 14.5 20.6 19 15.2 24.8 29 18.7 37.925-29 20 17.1 26.5 18 16.7 23.1 17 15.5 18.2 34 27.2 41.9 32 20.6 39.730-34 23 19.7 30.4 20 18.5 26.7 16 14.5 19.2 20 16.0 26.0 25 16.1 32.135-44 33 28.2 19.3 24 22.2 14.1 32 29.1 19.7 30 24.0 19.3 30 19.4 19.545-54 15 12.8 9.2 14 13.0 8.4 16 14.5 9.8 14 11.2 8.9 27 17.4 17.355-64 6 5.1 5.6 6 5.6 5.3 6 5.5 5.3 4 3.2 3.4 6 3.9 5.065+ 0 0.0 0.0 3 2.8 2.8 2 1.8 1.9 0 0.0 0.0 3 1.9 2.6Unknown
Subtotal 117 95.9 10.7 108 97.3 9.8 110 100.0 10.0 125 96.9 11.8 155 96.9 14.6
FEMALE
0-14 0 0.0 0.0 0 0.0 0.0 0 0.0 0.0 0 0.0 0.0 0 0.0 0.015-19 0 0.0 0.0 0 0.0 0.0 0 0.0 0.0 0 0.0 0.0 0 0.0 0.020-24 0 0.0 0.0 0 0.0 0.0 0 0.0 0.0 0 0.0 0.0 5 100.0 7.125-29 2 40.0 2.9 0 0.0 0.0 0 0.0 0.0 2 50.0 2.6 0 0.0 0.030-34 0 0.0 0.0 1 33.3 1.4 0 0.0 0.0 1 25.0 1.3 0 0.0 0.035-44 3 60.0 1.8 2 66.7 1.2 0 0.0 0.0 0 0.0 0.0 0 0.0 0.045-54 0 0.0 0.0 0 0.0 0.0 0 0.0 0.0 1 25.0 0.6 0 0.0 0.055-64 0 0.0 0.0 0 0.0 0.0 0 0.0 0.0 0 0.0 0.0 0 0.0 0.065+ 0 0.0 0.0 0 0.0 0.0 0 0.0 0.0 0 0.0 0.0 0 0.0 0.0Unknown
Subtotal 5 4.1 0.5 3 2.7 0.3 0 0.0 0.0 4 3.1 0.4 5 3.1 0.5
Total1 122 5.6 111 5.0 110 5.0 129 6.0 160 7.5
1. Excludes cases reported as "Unknown" gender. May not equal to SPA total.Note: Cumulative percentages may not equal 100% because of rounding. Includes Transgender cases.
Table a3.3. Reported Primary and Secondary Syphilis Cases and Rates per 100,000 Population by Gender and Age, San Fernando Service Planning Area 2 (SPA 2), Los Angeles County, 2008-2012
2008 2009 2011 20122010

Sexually Transmitted Disease Morbidity Report - 2012 III-6
No. (%) Rate No. (%) Rate No. (%) Rate No. (%) Rate No. (%) Rate
MALE
0-14 0 0.0 0.0 0 0.0 0.0 0 0.0 0.0 0 0.0 0.0 0 0.0 0.015-19 4 6.6 5.8 0 0.0 0.0 2 5.9 3.1 3 8.8 4.6 1 1.6 1.520-24 16 26.2 22.7 4 8.7 5.7 10 29.4 15.0 6 17.6 9.7 16 25.0 25.425-29 12 19.7 18.8 13 28.3 19.9 8 23.5 10.4 11 32.4 19.8 15 23.4 26.730-34 6 9.8 10.3 11 23.9 19.0 1 2.9 1.5 4 11.8 8.0 8 12.5 15.935-44 15 24.6 12.6 7 15.2 5.9 6 17.6 5.3 5 14.7 4.7 16 25.0 15.445-54 8 13.1 6.9 7 15.2 6.0 5 14.7 4.4 3 8.8 2.7 6 9.4 5.455-64 0 0.0 0.0 1 2.2 1.2 0 0.0 0.0 2 5.9 2.2 1 1.6 1.165+ 0 0.0 0.0 2 4.3 2.3 1 2.9 1.2 0 0.0 0.0 1 1.6 1.1Unknown 1 2.2 . 1 2.9 .
Subtotal 61 96.8 7.2 46 93.9 5.4 34 94.4 4.0 34 97.1 4.3 64 95.5 8.1
FEMALE
0-14 0 0.0 0.0 0 0.0 0.0 0 0.0 0.0 0 0.0 0.0 0 0.0 0.015-19 0 0.0 0.0 0 0.0 0.0 0 0.0 0.0 0 0.0 0.0 1 33.3 1.620-24 1 50.0 1.5 1 33.3 1.5 0 0.0 0.0 1 100.0 1.8 0 0.0 0.025-29 0 0.0 0.0 0 0.0 0.0 1 50.0 1.4 0 0.0 0.0 1 33.3 1.930-34 0 0.0 0.0 0 0.0 0.0 0 0.0 0.0 0 0.0 0.0 1 33.3 2.035-44 1 50.0 0.8 2 66.7 1.6 1 50.0 0.9 0 0.0 0.0 0 0.0 0.045-54 0 0.0 0.0 0 0.0 0.0 0 0.0 0.0 0 0.0 0.0 0 0.0 0.055-64 0 0.0 0.0 0 0.0 0.0 0 0.0 0.0 0 0.0 0.0 0 0.0 0.065+ 0 0.0 0.0 0 0.0 0.0 0 0.0 0.0 0 0.0 0.0 0 0.0 0.0Unknown
Subtotal 2 3.2 0.2 3 6.1 0.3 2 5.6 0.2 1 2.9 0.1 3 4.5 0.4
Total² 63 3.6 49 2.8 36 2.1 35 2.2 67 4.1
Note: Cumulative percentages may not equal 100% because of rounding.
1. Excludes cases from Pasadena.2. Excludes cases reported as "Unknown" gender. May not equal to SPA total.
Table a3.4. Reported Primary and Secondary Syphilis Cases and Rates per 100,000 Population by Gender and Age, San Gabriel Service Planning Area 3 (SPA 3), Los Angeles County, 2008-2012
2008 2009 2011 20122010

Sexually Transmitted Disease Morbidity Report - 2012 III-7
No. (%) Rate No. (%) Rate No. (%) Rate No. (%) Rate No. (%) Rate
MALE
0-14 0 0.0 0.0 0 0.0 0.0 0 0.0 0.0 0 0.0 0.0 0 0.0 0.015-19 2 0.7 4.8 3 1.1 7.0 3 1.2 7.2 4 1.3 11.5 3 0.9 8.820-24 20 7.0 52.0 30 10.5 80.1 23 9.1 60.9 36 11.8 82.7 33 10.0 81.525-29 48 16.8 107.0 49 17.2 116.6 39 15.4 84.7 48 15.8 82.3 52 15.8 93.130-34 44 15.4 75.7 34 11.9 62.3 45 17.8 78.4 35 11.5 60.5 34 10.3 58.235-44 111 38.9 86.1 93 32.6 71.7 89 35.2 70.0 91 29.9 89.4 108 32.7 104.945-54 54 18.9 59.2 60 21.1 63.6 46 18.2 47.8 76 25.0 95.4 80 24.2 99.055-64 5 1.8 9.2 15 5.3 26.4 8 3.2 13.8 13 4.3 23.7 12 3.6 21.265+ 1 0.4 1.8 1 0.4 1.8 0 0.0 0.0 1 0.3 1.9 8 2.4 14.6Unknown
Subtotal 285 99.0 44.3 285 98.6 44.5 253 98.8 39.1 304 99.3 52.8 330 97.9 57.2
FEMALE
0-14 0 0.0 0.0 0 0.0 0.0 0 0.0 0.0 0 0.0 0.0 0 0.0 0.015-19 0 0.0 0.0 0 0.0 0.0 0 0.0 0.0 0 0.0 0.0 0 0.0 0.020-24 0 0.0 0.0 1 25.0 2.9 0 0.0 0.0 0 0.0 0.0 2 28.6 5.425-29 0 0.0 0.0 1 25.0 2.8 0 0.0 0.0 0 0.0 0.0 1 14.3 2.030-34 1 33.3 1.9 0 0.0 0.0 1 33.3 2.0 0 0.0 0.0 2 28.6 3.935-44 2 66.7 1.9 1 25.0 0.9 1 33.3 0.9 2 100.0 2.4 1 14.3 1.245-54 0 0.0 0.0 1 25.0 1.2 1 33.3 1.2 0 0.0 0.0 1 14.3 1.555-64 0 0.0 0.0 0 0.0 0.0 0 0.0 0.0 0 0.0 0.0 0 0.0 0.065+ 0 0.0 0.0 0 0.0 0.0 0 0.0 0.0 0 0.0 0.0 0 0.0 0.0Unknown
Subtotal 3 1.0 0.5 4 1.4 0.7 3 1.2 0.5 2 0.7 0.4 7 2.1 1.3
Total1 288 23.0 289 23.2 256 20.3 306 27.3 337 30.0
1. Excludes cases reported as "Unknown" gender. May not equal to SPA total.Note: Cumulative percentages may not equal 100% because of rounding. Includes Transgender cases.
Table a3.5. Primary and Secondary Syphilis Cases and Rates per 100,000 Population by Gender and Age, Metro Service Planning Area 4 (SPA 4), Los Angeles County, 2008-2012
2008 2009 2011 20122010

Sexually Transmitted Disease Morbidity Report - 2012 III-8
No. (%) Rate No. (%) Rate No. (%) Rate No. (%) Rate No. (%) Rate
MALE
0-14 0 0.0 0.0 0 0.0 0.0 0 0.0 0.0 0 0.0 0.0 0 0.0 0.015-19 2 5.3 11.1 1 2.1 5.4 2 4.9 11.7 0 0.0 0.0 0 0.0 0.020-24 3 7.9 17.6 5 10.6 28.9 1 2.4 6.1 7 15.9 30.0 5 10.2 23.325-29 5 13.2 28.0 4 8.5 24.6 4 9.8 20.9 5 11.4 17.6 8 16.3 29.730-34 6 15.8 22.7 4 8.5 15.9 5 12.2 17.6 5 11.4 17.7 7 14.3 24.135-44 14 36.8 22.8 16 34.0 25.9 17 41.5 28.0 13 29.5 26.7 17 34.7 34.445-54 7 18.4 14.2 11 23.4 21.6 12 29.3 23.5 11 25.0 26.1 8 16.3 19.055-64 1 2.6 2.8 6 12.8 15.9 0 0.0 0.0 2 4.5 5.5 3 6.1 8.265+ 0 0.0 0.0 0 0.0 0.0 0 0.0 0.0 0 0.0 0.0 1 2.0 2.3Unknown 1 2.3 .
Subtotal 38 100.0 12.1 47 94.0 14.8 41 100.0 12.8 44 97.8 14.3 49 100.0 15.8
FEMALE
0-14 0 0.0 0.0 0 0.0 0.0 0 0.0 0.0 0 0.0 0.0 0 0.0 0.015-19 0 0.0 0.0 0 0.0 0.0 0 0.0 0.0 0 0.0 0.0 0 0.0 0.020-24 0 0.0 0.0 1 33.3 5.8 0 0.0 0.0 0 0.0 0.0 0 0.0 0.025-29 0 0.0 0.0 1 33.3 6.4 0 0.0 0.0 1 100.0 3.4 0 0.0 0.030-34 0 0.0 0.0 0 0.0 0.0 0 0.0 0.0 0 0.0 0.0 0 0.0 0.035-44 0 0.0 0.0 0 0.0 0.0 0 0.0 0.0 0 0.0 0.0 0 0.0 0.045-54 0 0.0 0.0 1 33.3 1.9 0 0.0 0.0 0 0.0 0.0 0 0.0 0.055-64 0 0.0 0.0 0 0.0 0.0 0 0.0 0.0 0 0.0 0.0 0 0.0 0.065+ 0 0.0 0.0 0 0.0 0.0 0 0.0 0.0 0 0.0 0.0 0 0.0 0.0Unknown
Subtotal 0 0.0 0.0 3 6.0 0.9 0 0.0 0.0 1 2.2 0.3 0 0.0 0.0
Total1 38 5.9 50 7.7 41 6.2 45 7.1 49 7.7
1. Excludes cases reported as "Unknown" gender. May not equal to SPA total.Note: Cumulative percentages may not equal 100% because of rounding.
Table a3.6. Reported Primary and Secondary Syphilis Cases and Rates per 100,000 Population by Gender and Age, West Service Planning Area 5 (SPA 5), Los Angeles County, 2008-2012
2008 2009 2011 20122010

Sexually Transmitted Disease Morbidity Report - 2012 III-9
No. (%) Rate No. (%) Rate No. (%) Rate No. (%) Rate No. (%) Rate
MALE
0-14 0 0.0 0.0 0 0.0 0.0 0 0.0 0.0 0 0.0 0.0 0 0.0 0.015-19 5 6.5 10.2 5 8.8 9.9 7 10.6 14.5 7 6.7 14.7 8 7.1 17.120-24 26 33.8 58.8 12 21.1 26.9 12 18.2 26.5 17 16.2 36.3 33 29.2 70.225-29 13 16.9 30.2 12 21.1 28.1 16 24.2 33.8 30 28.6 74.4 29 25.7 70.230-34 11 14.3 28.0 8 14.0 19.9 13 19.7 28.9 18 17.1 50.2 12 10.6 32.935-44 14 18.2 20.2 11 19.3 15.7 11 16.7 15.9 17 16.2 25.9 19 16.8 28.945-54 8 10.4 14.9 8 14.0 14.6 6 9.1 10.8 11 10.5 19.2 10 8.8 17.355-64 0 0.0 0.0 1 1.8 3.1 1 1.5 3.0 3 2.9 7.9 2 1.8 5.165+ 0 0.0 0.0 0 0.0 0.0 0 0.0 0.0 2 1.9 6.4 0 0.0 0.0Unknown
Subtotal 77 90.6 15.0 57 87.7 11.1 66 94.3 12.6 105 97.2 21.4 113 92.6 22.8
FEMALE
0-14 0 0.0 0.0 0 0.0 0.0 0 0.0 0.0 0 0.0 0.0 0 0.0 0.015-19 1 12.5 2.1 2 25.0 4.0 0 0.0 0.0 1 33.3 2.1 1 11.1 2.220-24 5 62.5 11.6 0 0.0 0.0 1 25.0 2.3 2 66.7 4.4 3 33.3 6.425-29 0 0.0 0.0 2 25.0 4.9 2 50.0 4.4 0 0.0 0.0 1 11.1 2.530-34 0 0.0 0.0 0 0.0 0.0 0 0.0 0.0 0 0.0 0.0 0 0.0 0.035-44 0 0.0 0.0 3 37.5 4.2 0 0.0 0.0 0 0.0 0.0 1 11.1 1.445-54 2 25.0 3.3 1 12.5 1.7 1 25.0 1.6 0 0.0 0.0 2 22.2 3.155-64 0 0.0 0.0 0 0.0 0.0 0 0.0 0.0 0 0.0 0.0 1 11.1 2.265+ 0 0.0 0.0 0 0.0 0.0 0 0.0 0.0 0 0.0 0.0 0 0.0 0.0Unknown
Subtotal 8 9.4 1.5 8 12.3 1.5 4 5.7 0.7 3 2.8 0.6 9 7.4 1.7
Total1 85 8.1 65 6.2 70 6.5 108 10.7 122 12.0
1. Excludes cases reported as "Unknown" gender. May not equal to SPA total.Note: Cumulative percentages may not equal 100% because of rounding.
Table a3.7. Reported Primary and Secondary Syphilis Cases and Rates per 100,000 Population by Gender and Age, South Service Planning Area 6 (SPA 6), Los Angeles County, 2008-2012
2008 2009 2011 20122010

Sexually Transmitted Disease Morbidity Report - 2012 III-10
No. (%) Rate No. (%) Rate No. (%) Rate No. (%) Rate No. (%) Rate
MALE
0-14 0 0.0 0.0 1 1.6 0.6 0 0.0 0.0 0 0.0 0.0 0 0.0 0.015-19 5 9.4 8.4 2 3.3 3.3 5 9.1 8.7 2 3.3 3.5 2 3.6 3.620-24 8 15.1 14.4 20 32.8 36.1 12 21.8 21.8 13 21.7 25.0 10 17.9 18.725-29 10 18.9 18.4 12 19.7 21.8 11 20.0 17.7 9 15.0 19.2 11 19.6 23.530-34 9 17.0 17.7 8 13.1 15.8 8 14.5 14.6 17 28.3 38.0 10 17.9 22.535-44 16 30.2 16.1 11 18.0 11.0 16 29.1 16.6 12 20.0 13.3 13 23.2 14.545-54 3 5.7 3.6 7 11.5 8.3 2 3.6 2.4 5 8.3 6.2 5 8.9 6.155-64 1 1.9 1.8 0 0.0 0.0 1 1.8 1.8 2 3.3 3.3 1 1.8 1.665+ 1 1.9 1.7 0 0.0 0.0 0 0.0 0.0 0 0.0 0.0 3 5.4 4.9Unknown 1 1.8 .
Subtotal 53 91.4 7.8 61 92.4 8.9 55 94.8 8.0 60 96.8 9.4 56 100.0 8.8
FEMALE
0-14 0 0.0 0.0 0 0.0 0.0 0 0.0 0.0 0 0.0 0.0 0 0.0 0.015-19 0 0.0 0.0 0 0.0 0.0 0 0.0 0.0 0 0.0 0.0 0 0.0 0.020-24 2 40.0 3.8 1 20.0 1.9 0 0.0 0.0 1 50.0 2.0 0 0.0 0.025-29 2 40.0 4.0 0 0.0 0.0 0 0.0 0.0 1 50.0 2.2 0 0.0 0.030-34 0 0.0 0.0 1 20.0 2.1 1 33.3 1.9 0 0.0 0.0 0 0.0 0.035-44 0 0.0 0.0 1 20.0 1.0 1 33.3 1.1 0 0.0 0.0 0 0.0 0.045-54 1 20.0 1.1 1 20.0 1.1 1 33.3 1.2 0 0.0 0.0 0 0.0 0.055-64 0 0.0 0.0 1 20.0 1.6 0 0.0 0.0 0 0.0 0.0 0 0.0 0.065+ 0 0.0 0.0 0 0.0 0.0 0 0.0 0.0 0 0.0 0.0 0 0.0 0.0Unknown
Subtotal 5 8.6 0.7 5 7.6 0.7 3 5.2 0.4 2 3.2 0.3 0 0.0 0.0
Total1 58 4.2 66 4.8 58 4.2 62 4.8 56 4.3
1. Excludes cases reported as "Unknown" gender. May not equal to SPA total.Note: Cumulative percentages may not equal 100% because of rounding.
Table a3.8. Reported Primary and Secondary Syphilis Cases and Rates per 100,000 Population by Gender and Age, East Service Planning Area 7 (SPA 7), Los Angeles County, 2008-2012
2008 2009 2011 20122010

Sexually Transmitted Disease Morbidity Report - 2012 III-11
No. (%) Rate No. (%) Rate No. (%) Rate No. (%) Rate No. (%) Rate
MALE
0-14 0 0.0 0.0 0 0.0 0.0 0 0.0 0.0 0 0.0 0.0 0 0.0 0.015-19 3 8.6 6.9 3 7.3 6.8 2 5.1 4.8 2 4.3 5.0 2 3.3 5.120-24 11 31.4 28.0 8 19.5 20.0 9 23.1 23.0 7 14.9 20.3 10 16.7 28.125-29 6 17.1 16.9 13 31.7 35.6 7 17.9 16.1 12 25.5 33.3 12 20.0 33.930-34 5 14.3 14.0 4 9.8 11.7 6 15.4 16.0 7 14.9 19.6 11 18.3 30.635-44 7 20.0 8.2 8 19.5 9.6 7 17.9 8.8 8 17.0 10.9 12 20.0 16.645-54 3 8.6 3.7 3 7.3 3.7 6 15.4 7.4 9 19.1 11.6 10 16.7 13.055-64 0 0.0 0.0 1 2.4 1.8 1 2.6 1.8 2 4.3 3.5 3 5.0 5.165+ 0 0.0 0.0 1 2.4 1.8 0 0.0 0.0 0 0.0 0.0 0 0.0 0.0Unknown 1 2.6 .
Subtotal 35 92.1 6.4 41 95.3 7.4 39 95.1 7.1 47 95.9 9.1 60 98.4 11.5
FEMALE
0-14 0 0.0 0.0 0 0.0 0.0 0 0.0 0.0 0 0.0 0.0 0 0.0 0.015-19 1 33.3 2.4 0 0.0 0.0 0 0.0 0.0 0 0.0 0.0 0 0.0 0.020-24 1 33.3 2.7 1 50.0 2.6 0 0.0 0.0 0 0.0 0.0 1 100.0 3.025-29 0 0.0 0.0 1 50.0 2.9 0 0.0 0.0 2 100.0 5.6 0 0.0 0.030-34 1 33.3 2.8 0 0.0 0.0 0 0.0 0.0 0 0.0 0.0 0 0.0 0.035-44 0 0.0 0.0 0 0.0 0.0 1 50.0 1.2 0 0.0 0.0 0 0.0 0.045-54 0 0.0 0.0 0 0.0 0.0 1 50.0 1.2 0 0.0 0.0 0 0.0 0.055-64 0 0.0 0.0 0 0.0 0.0 0 0.0 0.0 0 0.0 0.0 0 0.0 0.065+ 0 0.0 0.0 0 0.0 0.0 0 0.0 0.0 0 0.0 0.0 0 0.0 0.0Unknown
Subtotal 3 7.9 0.5 2 4.7 0.3 2 4.9 0.3 2 4.1 0.4 1 1.6 0.2
Total² 38 3.4 43 3.8 41 3.7 49 4.6 61 5.7
1. Excludes cases from Long Beach.
Note: Cumulative percentages may not equal 100% because of rounding.2. Excludes cases reported as "Unknown" gender. May not equal to SPA total.
Table a3.9. Reported Primary and Secondary Syphilis Cases and Rates per 100,000 Population by Gender and Age, South Bay Service Planning Area 8 (SPA 8), Los Angeles County, 2008-2012
2008 2009 2011 20122010

Sexually Transmitted Disease Morbidity Report - 2012 III-12
Adj. Adj. Adj. Adj.No. (%) Rate No. (%) Rate No. (%) Rate No. (%) Rate No. (%) Rate
MALE
2008 0 0.0 0.0 0 0.0 0.0 0 0.0 0.0 0 0.0 0.0 0 0.0 0.02009 4 57.1 5.1 2 28.6 7.8 1 14.3 1.4 0 0.0 0.0 7 100.0 3.82010 2 40.0 2.6 1 20.0 3.8 2 40.0 2.7 0 0.0 0.0 5 100.0 2.72011 2 25.0 2.9 5 62.5 17.1 1 12.5 1.2 0 0.0 0.0 8 100.0 4.22012 1 9.1 1.5 6 54.6 20.3 3 27.3 3.5 1 9.1 14.2 11 91.7 5.7
FEMALE
2008 0 0.0 0.0 0 0.0 0.0 0 0.0 0.0 0 0.0 0.0 0 0.0 0.02009 0 0.0 0.0 0 0.0 0.0 0 0.0 0.0 0 0.0 0.0 0 0.0 0.52010 0 0.0 0.0 0 0.0 0.0 0 0.0 0.0 0 0.0 0.0 0 0.0 0.02011 0 0.0 0.0 0 0.0 0.0 0 0.0 0.0 0 0.0 0.0 0 0.0 0.02012 0 0.0 0.0 0 0.0 0.0 1 100.0 1.2 0 0.0 0.0 1 8.3 0.5
Note: If race/ethnicity was not specified, cases were prorated according to the distribution of cases for which race/ethnicity was specified. Rates were adjusted including the prorated cases. Therefore, these tables should be used only for race/ethnicity comparisons, not for overall totals or gender totals. Cumulative percentages may not
Total1
1. Includes Native Americans and cases reported as "Mixed/Other/Unknown" race/ethnicity. Excludes cases reported with "Other/Unknown" gender. May not add up to SPA total.
equal 100% because of rounding.
Table a3.10. Reported Primary and Secondary Syphilis Cases and Rates per 100,000 Population by Gender and Race/Ethnicity, Antelope Valley Service Planning Area 1 (SPA 1), Los Angeles County, 2008-2012
White Black Latino Asian-Pacific

Sexually Transmitted Disease Morbidity Report - 2012 III-13
Adj. Adj. Adj. Adj.No. (%) Rate No. (%) Rate No. (%) Rate No. (%) Rate No. (%) Rate
MALE
2008 33 28.2 6.8 11 9.4 29.9 57 48.7 14.0 9 7.7 8.7 117 95.9 10.72009 41 38.0 8.2 17 15.7 45.1 41 38.0 9.8 4 3.7 3.8 108 97.3 9.82010 45 40.9 8.9 14 12.7 35.5 44 40.0 10.1 5 4.6 4.4 110 100.0 10.02011 32 25.6 6.8 20 16.0 52.9 56 44.8 13.7 10 8.0 9.2 125 96.9 11.82012 54 34.8 11.6 18 11.6 48.0 71 45.8 17.3 5 3.2 4.6 155 96.9 14.6
FEMALE
2008 1 20.0 0.2 1 20.0 2.7 3 60.0 0.7 0 0.0 0.0 5 4.1 0.52009 1 33.3 0.2 0 0.0 0.0 2 66.7 0.5 0 0.0 0.0 3 2.7 0.32010 0 0.0 0.0 0 0.0 0.0 0 0.0 0.0 0 0.0 0.0 0 0.0 0.02011 1 25.0 0.2 0 0.0 0.0 2 50.0 0.5 1 25.0 0.8 4 3.1 0.42012 2 40.0 0.5 0 0.0 0.0 2 40.0 0.6 0 0.0 0.0 5 3.1 0.5
Note: If race/ethnicity was not specified, cases were prorated according to the distribution of cases for which race/ethnicity was specified. Rates were adjusted including the prorated cases. Therefore, these tables should be used only for race/ethnicity comparisons, not for overall totals or gender totals. Cumulative percentages may not
Total1
1. Includes Native Americans and cases reported as "Mixed/Other/Unknown" race/ethnicity. Excludes cases reported with "Other/Unknown" gender. May not add up to SPA total.
equal 100% because of rounding.
Table a3.11. Reported Primary and Secondary Syphilis Cases and Rates per 100,000 Population by Gender and Race/Ethnicity, San Fernando Service Planning Area 2 (SPA 2), Los Angeles County, 2008-2012
White Black Latino Asian-Pacific

Sexually Transmitted Disease Morbidity Report - 2012 III-14
Adj. Adj. Adj. Adj.No. (%) Rate No. (%) Rate No. (%) Rate No. (%) Rate No. (%) Rate
MALE
2008 14 23.0 7.0 3 4.9 10.1 36 59.0 9.0 6 9.8 2.8 61 96.8 7.22009 14 30.4 7.1 3 6.5 10.4 23 50.0 5.8 6 13.0 2.7 46 93.9 5.42010 5 14.7 2.6 2 5.9 6.9 22 64.7 5.5 5 14.7 2.2 34 94.4 4.02011 7 20.6 4.6 1 2.9 4.3 20 58.8 5.6 2 5.9 0.9 34 97.1 4.32012 13 20.3 8.3 4 6.3 16.6 32 50.0 8.6 14 21.9 6.3 64 95.5 8.1
FEMALE
2008 1 50.0 0.5 0 0.0 0.0 0 0.0 0.0 1 50.0 0.4 2 3.2 0.22009 0 0.0 0.0 0 0.0 0.0 3 100.0 0.7 0 0.0 0.0 3 6.1 0.32010 0 0.0 0.0 0 0.0 0.0 2 100.0 0.5 0 0.0 0.0 2 5.6 0.22011 0 0.0 0.0 0 0.0 0.0 1 100.0 0.3 0 0.0 0.0 1 2.9 0.12012 1 33.3 0.6 0 0.0 0.0 2 66.7 0.5 0 0.0 0.0 3 4.5 0.4
1. Excludes cases from Pasadena.
Note: If race/ethnicity was not specified, cases were prorated according to the distribution of cases for which race/ethnicity was specified. Rates were adjusted including the prorated cases. Therefore, these tables should be used only for race/ethnicity comparisons, not for overall totals or gender totals. Cumulative percentages may not
Total1,2
2. Includes Native Americans and cases reported as "Mixed/Other/Unknown" race/ethnicity. Excludes cases reported with "Other/Unknown" gender. May not add up to SPA total.
equal 100% because of rounding.
Table a3.12. Reported Primary and Secondary Syphilis Cases and Rates per 100,000 Population by Gender and Race/Ethnicity, San Gabriel Service Planning Area 3 (SPA 3), Los Angeles County, 2008-2012
White Black Latino Asian-Pacific

Sexually Transmitted Disease Morbidity Report - 2012 III-15
Adj. Adj. Adj. Adj.No. (%) Rate No. (%) Rate No. (%) Rate No. (%) Rate No. (%) Rate
MALE
2008 136 47.7 95.8 29 10.2 78.4 107 37.5 30.5 3 1.1 3.1 285 99.0 44.32009 152 53.3 104.1 19 6.7 50.8 92 32.3 26.7 13 4.6 13.7 285 98.6 44.52010 107 42.3 72.0 27 10.7 71.4 100 39.5 28.1 15 5.9 15.3 253 98.8 39.12011 135 44.4 91.1 31 10.2 93.0 120 39.5 41.1 10 3.3 11.1 304 99.3 52.82012 138 41.8 95.1 47 14.2 144.9 113 34.2 39.4 18 5.5 20.4 330 97.9 57.2
FEMALE
2008 0 0.0 0.0 0 0.0 0.0 2 66.7 0.8 0 0.0 0.0 3 1.0 0.52009 1 25.0 0.8 3 75.0 8.8 0 0.0 0.0 0 0.0 0.0 4 1.4 0.72010 0 0.0 0.0 1 33.3 2.9 1 33.3 0.3 0 0.0 0.0 3 1.2 0.52011 2 100.0 1.5 0 0.0 0.0 0 0.0 0.0 0 0.0 0.0 2 0.7 0.42012 0 0.0 0.0 2 28.6 7.5 5 71.4 1.8 0 0.0 0.0 7 2.1 1.3
Note: If race/ethnicity was not specified, cases were prorated according to the distribution of cases for which race/ethnicity was specified. Rates were adjusted including the prorated cases. Therefore, these tables should be used only for race/ethnicity comparisons, not for overall totals or gender totals. Cumulative percentages may not
Total1
1. Includes Native Americans and cases reported as "Mixed/Other/Unknown" race/ethnicity. Excludes cases reported with "Other/Unknown" gender. May not add up to SPA total.
equal 100% because of rounding.
Table a3.13. Reported Primary and Secondary Syphilis Cases and Rates per 100,000 Population by Gender and Race/Ethnicity, Metro Service Planning Area 4 (SPA 4), Los Angeles County, 2008-2012
White Black Latino Asian-Pacific

Sexually Transmitted Disease Morbidity Report - 2012 III-16
Adj. Adj. Adj. Adj.No. (%) Rate No. (%) Rate No. (%) Rate No. (%) Rate No. (%) Rate
MALE
2008 18 47.4 9.4 3 7.9 15.9 13 34.2 25.2 2 5.3 5.8 38 100.0 12.12009 32 68.1 15.8 5 10.6 25.3 5 10.6 9.6 4 8.5 11.5 47 94.0 14.82010 20 48.8 10.2 3 7.3 15.1 14 34.2 26.2 2 4.9 5.5 41 100.0 12.82011 22 50.0 11.5 8 18.2 48.0 11 25.0 24.6 0 0.0 0.0 44 97.8 14.32012 24 49.0 11.7 11 22.5 61.7 7 14.3 14.5 5 10.2 13.2 49 100.0 15.8
FEMALE
2008 0 0.0 0.0 0 0.0 0.0 0 0.0 0.0 0 0.0 0.0 0 0.0 0.02009 1 33.3 0.5 0 0.0 0.0 2 66.7 3.7 0 0.0 0.0 3 6.0 0.92010 0 0.0 0.0 0 0.0 0.0 0 0.0 0.0 0 0.0 0.0 0 0.0 0.02011 1 100.0 0.5 0 0.0 0.0 0 0.0 0.0 0 0.0 0.0 1 2.2 0.32012 0 0.0 0.0 0 0.0 0.0 0 0.0 0.0 0 0.0 0.0 0 0.0 0.0
Note: If race/ethnicity was not specified, cases were prorated according to the distribution of cases for which race/ethnicity was specified. Rates were adjusted including the prorated cases. Therefore, these tables should be used only for race/ethnicity comparisons, not for overall totals or gender totals. Cumulative percentages may not
Total1
1. Includes Native Americans and cases reported as "Mixed/Other/Unknown" race/ethnicity. Excludes cases reported with "Other/Unknown" gender. May not add up to SPA total.
equal 100% because of rounding.
Table a3.14. Reported Primary and Secondary Syphilis Cases and Rates per 100,000 Population by Gender and Race/Ethnicity, West Service Planning Area 5 (SPA 5), Los Angeles County, 2008-2012
White Black Latino Asian-Pacific

Sexually Transmitted Disease Morbidity Report - 2012 III-17
Adj. Adj. Adj. Adj.No. (%) Rate No. (%) Rate No. (%) Rate No. (%) Rate No. (%) Rate
MALE3
2008 1 1.3 7.8 41 53.3 27.9 32 41.6 9.5 1 1.3 11.7 77 90.6 15.02009 3 5.3 22.5 34 59.7 23.0 19 33.3 5.5 1 1.8 11.3 57 87.7 11.12010 6 9.1 44.3 29 43.9 20.2 29 43.9 8.5 0 0.0 0.0 66 94.3 12.62011 6 5.7 49.1 52 49.5 41.9 41 39.1 12.2 2 1.9 23.2 105 97.2 21.42012 5 4.4 40.4 67 59.3 52.9 39 34.5 11.2 2 1.8 22.8 113 92.6 22.8
FEMALE
2008 0 0.0 0.0 5 62.5 2.7 3 37.5 0.9 0 0.0 0.0 8 9.4 1.52009 1 12.5 7.9 6 75.0 3.3 1 12.5 0.3 0 0.0 0.0 8 12.3 1.52010 0 0.0 0.0 2 50.0 1.1 2 50.0 0.6 0 0.0 0.0 4 5.7 0.72011 0 0.0 0.0 3 100.0 1.9 0 0.0 0.0 0 0.0 0.0 3 2.8 0.62012 0 0.0 0.0 5 55.6 3.1 4 44.4 1.2 0 0.0 0.0 9 7.4 1.7
Note: If race/ethnicity was not specified, cases were prorated according to the distribution of cases for which race/ethnicity was specified. Rates were adjusted including the prorated cases. Therefore, these tables should be used only for race/ethnicity comparisons, not for overall totals or gender totals. Cumulative percentages may not
Total1
1. Includes Native Americans and cases reported as "Mixed/Other/Unknown" race/ethnicity. Excludes cases reported with "Other/Unknown" gender. May not add up to SPA total.
equal 100% because of rounding.
Table a3.15. Reported Primary and Secondary Syphilis Cases and Rates per 100,000 Population by Gender and Race/Ethnicity, South Service Planning Area 6 (SPA 6), Los Angeles County, 2008-2012
White Black Latino Asian-Pacific

Sexually Transmitted Disease Morbidity Report - 2012 III-18
Adj. Adj. Adj. Adj.No. (%) Rate No. (%) Rate No. (%) Rate No. (%) Rate No. (%) Rate
MALE
2008 12 22.6 10.4 2 3.8 11.4 36 67.9 7.5 1 1.9 1.8 53 91.4 7.82009 8 13.1 7.0 3 4.9 16.7 48 78.7 9.8 2 3.3 3.4 61 92.4 8.92010 9 16.4 8.1 2 3.6 11.3 44 80.0 8.9 0 0.0 0.0 55 94.8 8.02011 9 15.0 9.7 4 6.7 21.7 44 73.3 9.4 2 3.3 3.6 60 96.8 9.42012 9 16.1 10.1 3 5.4 16.7 41 73.2 9.0 0 0.0 0.0 56 100.0 8.8
FEMALE
2008 0 0.0 0.0 0 0.0 0.0 5 100.0 1.0 0 0.0 0.0 5 8.6 0.72009 2 40.0 1.7 2 40.0 10.3 1 20.0 0.2 0 0.0 0.0 5 7.6 0.72010 0 0.0 0.0 0 0.0 0.0 3 100.0 0.6 0 0.0 0.0 3 5.2 0.42011 0 0.0 0.0 0 0.0 0.0 2 100.0 0.4 0 0.0 0.0 2 3.2 0.32012 0 0.0 0.0 0 0.0 0.0 0 0.0 0.0 0 0.0 0.0 0 0.0 0.0
Note: If race/ethnicity was not specified, cases were prorated according to the distribution of cases for which race/ethnicity was specified. Rates were adjusted including the prorated cases. Therefore, these tables should be used only for race/ethnicity comparisons, not for overall totals or gender totals. Cumulative percentages may not
Total1
1. Includes Native Americans and cases reported as "Mixed/Other/Unknown" race/ethnicity. Excludes cases reported with "Other/Unknown" gender. May not add up to SPA total.
equal 100% because of rounding.
Table a3.16. Reported Primary and Secondary Syphilis Cases and Rates per 100,000 Population by Gender and Race/Ethnicity, East Service Planning Area 7 (SPA 7), Los Angeles County, 2008-2012
White Black Latino Asian-Pacific

Sexually Transmitted Disease Morbidity Report - 2012 III-19
Adj. Adj. Adj. Adj.No. (%) Rate No. (%) Rate No. (%) Rate No. (%) Rate No. (%) Rate
MALE
2008 3 8.6 1.8 13 37.1 16.9 13 37.1 6.3 5 14.3 6.3 35 92.1 6.42009 10 24.4 5.7 14 34.2 17.7 15 36.6 7.0 2 4.9 2.4 41 95.3 7.42010 5 12.8 3.0 21 53.9 27.2 10 25.6 4.7 1 2.6 1.2 39 95.1 7.12011 7 14.9 4.7 18 38.3 25.6 16 34.0 8.1 4 8.5 5.2 47 95.9 9.12012 5 8.3 3.3 25 41.7 35.2 22 36.7 10.9 5 8.3 6.3 60 98.4 11.5
FEMALE
2008 1 33.3 0.6 2 66.7 2.1 0 0.0 0.0 0 0.0 0.0 3 7.9 0.52009 0 0.0 0.0 1 50.0 1.0 1 50.0 0.5 0 0.0 0.0 2 4.7 0.32010 1 50.0 0.6 1 50.0 1.0 0 0.0 0.0 0 0.0 0.0 2 4.9 0.32011 0 0.0 0.0 1 50.0 1.1 1 50.0 0.5 0 0.0 0.0 2 4.1 0.42012 0 0.0 0.0 1 100.0 1.1 0 0.0 0.0 0 0.0 0.0 1 1.6 0.2
Note: If race/ethnicity was not specified, cases were prorated according to the distribution of cases for which race/ethnicity was specified. Rates were adjusted including the prorated cases. Therefore, these tables should be used only for race/ethnicity comparisons, not for overall totals or gender totals. Cumulative percentages may not equal 100% because of rounding.
Table a3.17. Reported Primary and Secondary Syphilis Cases and Rates per 100,000 Population by Gender and Race/Ethnicity, South Bay Service Planning Area 8 (SPA 8), Los Angeles County, 2008-2012
White Black Latino Asian-Pacific Total1,2
1. Excludes cases from Long Beach.2. Includes Native Americans and cases reported as "Mixed/Other/Unknown" race/ethnicity. Excludes cases reported with "Other/Unknown" gender. May not add up to SPA total.

Addendum IV:
Early Latent Syphilis

Sexually Transmitted Disease Surveillance Report - 2012 IV-1
0 8 164 Miles±
Figure a4.1 Reported Early Latent Syphilis Rates per 100,000 Population by Service Planning Area (SPA), Los Angeles County, 2012.
Excludes cases from Pasadena (SPA 3) and Long Beach (SPA 8).
Antelope Valley (SPA 1)3.4
East (SPA 7)7.2
Metro (SPA 4)52.5
San Fernando (SPA 2)7.8
San Gabriel (SPA 3)4.6
South (SPA 6)17.2
South Bay (SPA 8)7.2
West (SPA 5)11.1

Foothill7.3
West11.1
Antelope Valley3.4
San Fernando3.4
East Valley14.6
West Valley7.0
Pomona3.2
Whittier5.6
Torrance3.3
El Monte4.8
Glendale7.4
Harbor4.5
Central51.0
Alhambra4.4
Bellflower3.4
Inglewood12.9 Compton
12.8
Southwest22.6
Long Beach *0
San Antonio11.2
Northeast23.0
Pasadena *0
Hollywood-Wilshir72.2
South14.8
East Los Angeles7.8Southeast
15.2
* Data of Pasadena (SPA 3) and Long Beach (SPA 8) are not available.
0 7 143.5 Miles±
Rates per 100,000 population0.00.1 - 20.020.1 - 40.040.1 - 60.060.1 - 80.0
Figure a4.2 Reported Early Latent Syphilis Rates per 100,000 Population by Health District (HD), Los Angeles County, 2012.
Sexually Transmitted Disease Morbidity Report - 2012 IV-2

Sexually Transmitted Disease Morbidity Report - 2012 IV-3
No. (%) Rate No. (%) Rate No. (%) Rate No. (%) Rate No. (%) Rate
SPA2/HD3
Antelope Valley (1) 6 0.8 1.7 5 0.5 1.4 4 0.4 1.1 10 1.0 2.6 13 1.0 3.4 Antelope Valley 6 0.8 1.7 5 0.5 1.4 4 0.4 1.1 10 1.0 2.6 13 1.0 3.4
East (7) 61 7.9 4.4 84 8.8 6.1 89 9.7 6.5 89 8.5 6.9 93 7.3 7.2 Bellflower 12 1.6 3.2 24 2.5 6.5 11 1.2 3.0 16 1.5 4.5 12 0.9 3.4 East Los Angeles 6 0.8 2.7 21 2.2 9.5 28 3.1 12.9 14 1.3 6.9 16 1.3 7.8 San Antonio 26 3.4 5.7 24 2.5 5.3 31 3.4 6.9 37 3.6 8.8 47 3.7 11.2 Whittier 17 2.2 5.1 15 1.6 4.5 19 2.1 5.6 22 2.1 6.9 18 1.4 5.6
Metro (4) 350 45.5 27.9 432 45.1 34.7 394 43.0 31.3 464 44.6 41.4 590 46.2 52.5 Central 96 12.5 26.1 114 11.9 31.2 119 13.0 32.2 132 12.7 39.2 172 13.5 51.0 Hollywood-Wilshire 216 28.1 40.3 285 29.8 53.6 232 25.3 43.2 288 27.7 60.0 348 27.3 72.2 Northeast 38 4.9 10.9 33 3.4 9.5 43 4.7 12.2 44 4.2 14.5 70 5.5 23.0
San Fernando (2) 110 14.3 5.0 124 13.0 5.6 126 13.8 5.7 141 13.5 6.6 168 13.2 7.8 East Valley 41 5.3 8.8 45 4.7 9.6 57 6.2 12.2 55 5.3 12.5 65 5.1 14.6 Glendale 19 2.5 5.4 17 1.8 4.8 16 1.7 4.5 14 1.3 4.2 25 2.0 7.4 San Fernando 10 1.3 2.1 16 1.7 3.3 8 0.9 1.7 22 2.1 4.4 17 1.3 3.4 West Valley 40 5.2 4.5 46 4.8 5.1 45 4.9 5.0 50 4.8 5.8 61 4.8 7.0
San Gabriel (3) 58 7.5 3.4 51 5.3 2.9 73 8.0 4.2 67 6.4 4.2 75 5.9 4.6 Alhambra 5 0.6 1.4 4 0.4 1.1 14 1.5 3.8 9 0.9 2.6 15 1.2 4.4 El Monte 24 3.1 5.0 12 1.3 2.5 14 1.5 2.9 18 1.7 4.2 21 1.6 4.8 Foothill 7 0.9 2.2 11 1.1 3.5 14 1.5 4.4 14 1.3 4.6 22 1.7 7.3 Pomona 22 2.9 3.8 24 2.5 4.2 31 3.4 5.4 26 2.5 4.9 17 1.3 3.2
South (6) 82 10.6 7.8 119 12.4 11.3 115 12.6 10.8 139 13.4 13.8 175 13.7 17.2 Compton 16 2.1 5.5 22 2.3 7.6 11 1.2 3.8 26 2.5 9.3 36 2.8 12.8 South 14 1.8 7.4 23 2.4 11.9 19 2.1 9.7 30 2.9 16.0 28 2.2 14.8 Southeast 16 2.1 8.8 19 2.0 10.2 24 2.6 13.1 22 2.1 13.0 26 2.0 15.2 Southwest 36 4.7 9.4 55 5.7 14.4 61 6.7 15.3 61 5.9 16.3 85 6.7 22.6
South Bay (8) 52 6.8 4.6 61 6.4 5.4 50 5.5 4.5 73 7.0 6.9 77 6.0 7.2 Harbor 11 1.4 5.1 8 0.8 3.7 7 0.8 3.3 4 0.4 2.0 9 0.7 4.5 Inglewood 31 4.0 7.1 37 3.9 8.5 32 3.5 7.3 52 5.0 12.7 53 4.2 12.9 Torrance 10 1.3 2.1 16 1.7 3.4 11 1.2 2.3 17 1.6 3.8 15 1.2 3.3 West (5) 35 4.5 5.4 50 5.2 7.7 49 5.3 7.4 49 4.7 7.7 71 5.6 11.1 West 35 4.5 5.4 50 5.2 7.7 49 5.3 7.4 49 4.7 7.7 71 5.6 11.1
Unknown 16 2.1 . 31 3.2 . 16 1.7 . 9 0.9 . 14 1.1 .
Total 770 7.9 957 9.8 916 9.3 1,041 11.2 1,276 13.7
1. Excludes cases from Pasadena (SPA 3) and Long Beach (SPA 8).2. Main categories.3. Subcategories.Note: Cumulative percentages may not equal 100% because of rounding.
Table a4.1. Reported Early Latent Syphilis Cases and Rates per 100,000 Population by Service Planning and Health District (HD), Los Angeles County, 2008-2012
2011 2012201020092008

Sexually Transmitted Disease Morbidity Report - 2012 IV-4
No. (%) Rate No. (%) Rate No. (%) Rate No. (%) Rate No. (%) Rate
MALE
0-14 0 0.0 0.0 0 0.0 0.0 0 0.0 0.0 0 0.0 0.0 0 0.0 0.015-19 0 0.0 0.0 0 0.0 0.0 0 0.0 0.0 1 12.5 5.2 0 0.0 0.020-24 1 16.7 5.5 0 0.0 0.0 0 0.0 0.0 0 0.0 0.0 3 42.9 18.425-29 0 0.0 0.0 2 40.0 12.4 0 0.0 0.0 3 37.5 23.4 3 42.9 23.030-34 1 16.7 9.9 0 0.0 0.0 2 50.0 15.5 1 12.5 8.6 1 14.3 8.535-44 3 50.0 13.7 2 40.0 9.6 1 25.0 5.1 2 25.0 8.3 0 0.0 0.045-54 1 16.7 3.7 1 20.0 3.7 0 0.0 0.0 1 12.5 3.6 0 0.0 0.055-64 0 0.0 0.0 0 0.0 0.0 0 0.0 0.0 0 0.0 0.0 0 0.0 0.065+ 0 0.0 0.0 0 0.0 0.0 1 25.0 7.4 0 0.0 0.0 0 0.0 0.0Unknown
Subtotal 6 100.0 3.3 5 100.0 2.7 4 100.0 2.1 8 80.0 4.2 7 53.8 3.6
FEMALE
0-14 0 0.0 0.0 0 0.0 0.0 0 0.0 0.0 0 0.0 0.0 0 0.0 0.015-19 0 0.0 0.0 0 0.0 0.0 0 0.0 0.0 2 100.0 10.8 1 16.7 5.520-24 0 0.0 0.0 0 0.0 0.0 0 0.0 0.0 0 0.0 0.0 2 33.3 12.925-29 0 0.0 0.0 0 0.0 0.0 0 0.0 0.0 0 0.0 0.0 0 0.0 0.030-34 0 0.0 0.0 0 0.0 0.0 0 0.0 0.0 0 0.0 0.0 1 16.7 8.735-44 0 0.0 0.0 0 0.0 0.0 0 0.0 0.0 0 0.0 0.0 1 16.7 4.045-54 0 0.0 0.0 0 0.0 0.0 0 0.0 0.0 0 0.0 0.0 1 16.7 3.555-64 0 0.0 0.0 0 0.0 0.0 0 0.0 0.0 0 0.0 0.0 0 0.0 0.065+ 0 0.0 0.0 0 0.0 0.0 0 0.0 0.0 0 0.0 0.0 0 0.0 0.0Unknown
Subtotal 0 0.0 0.0 0 0.0 0.0 0 0.0 0.0 2 20.0 1.0 6 46.2 3.1
Total1 6 1.7 5 1.4 4 1.1 10 2.6 13 3.4
1. Excludes cases reported as "Unknown" gender. May not equal to SPA total.Note: Cumulative percentages may not equal 100% because of rounding.
Table a4.2. Reported Early Latent Syphilis Cases and Rates per 100,000 Population by Gender and Age, Antelope Valley Service Planning Area 1 (SPA 1), Los Angeles County, 2008-2012
2008 2009 2011 20122010

Sexually Transmitted Disease Morbidity Report - 2012 IV-5
No. (%) Rate No. (%) Rate No. (%) Rate No. (%) Rate No. (%) Rate
MALE
0-14 0 0.0 0.0 0 0.0 0.0 0 0.0 0.0 0 0.0 0.0 0 0.0 0.015-19 2 2.0 2.4 0 0.0 0.0 2 1.7 2.5 8 6.2 9.9 6 3.8 7.620-24 8 7.9 10.1 18 15.9 22.3 13 11.1 16.7 16 12.4 20.9 14 8.9 18.325-29 22 21.8 29.1 19 16.8 24.4 22 18.8 23.6 27 20.9 33.2 23 14.6 28.530-34 11 10.9 14.5 19 16.8 25.4 13 11.1 15.6 15 11.6 19.5 21 13.3 27.035-44 31 30.7 18.1 28 24.8 16.5 38 32.5 23.4 28 21.7 18.0 45 28.5 29.245-54 21 20.8 12.8 19 16.8 11.3 22 18.8 13.4 25 19.4 16.0 41 25.9 26.255-64 4 4.0 3.7 5 4.4 4.4 6 5.1 5.3 8 6.2 6.8 8 5.1 6.665+ 1 1.0 1.0 4 3.5 3.8 0 0.0 0.0 2 1.6 1.8 0 0.0 0.0Unknown 1 1.0 . 1 0.9 . 1 0.9 .
Subtotal 101 91.8 9.3 113 91.1 10.2 117 92.9 10.6 129 91.5 12.2 158 94.6 14.9
FEMALE
0-14 0 0.0 0.0 0 0.0 0.0 0 0.0 0.0 0 0.0 0.0 1 11.1 0.515-19 0 0.0 0.0 0 0.0 0.0 1 11.1 1.3 2 16.7 2.7 1 11.1 1.320-24 3 33.3 4.0 3 27.3 3.9 0 0.0 0.0 2 16.7 2.8 4 44.4 5.725-29 3 33.3 4.4 1 9.1 1.4 1 11.1 1.2 6 50.0 7.9 0 0.0 0.030-34 2 22.2 2.8 1 9.1 1.4 3 33.3 3.8 0 0.0 0.0 1 11.1 1.335-44 0 0.0 0.0 3 27.3 1.8 2 22.2 1.3 2 16.7 1.3 2 22.2 1.345-54 1 11.1 0.6 3 27.3 1.8 1 11.1 0.6 0 0.0 0.0 0 0.0 0.055-64 0 0.0 0.0 0 0.0 0.0 1 11.1 0.8 0 0.0 0.0 0 0.0 0.065+ 0 0.0 0.0 0 0.0 0.0 0 0.0 0.0 0 0.0 0.0 0 0.0 0.0Unknown
Subtotal 9 8.2 0.8 11 8.9 1.0 9 7.1 0.8 12 8.5 1.1 9 5.4 0.8
Total1 110 5.0 124 5.6 126 5.7 141 6.6 167 7.8
1. Excludes cases reported as "Unknown" gender. May not equal to SPA total.Note: Cumulative percentages may not equal 100% because of rounding.
Table a4.3. Reported Early Latent Syphilis Cases and Rates per 100,000 Population by Gender and Age, San Fernando Service Planning Area 2 (SPA 2), Los Angeles County, 2008-2012
2008 2009 2011 20122010

Sexually Transmitted Disease Morbidity Report - 2012 IV-6
No. (%) Rate No. (%) Rate No. (%) Rate No. (%) Rate No. (%) Rate
MALE
0-14 1 1.9 0.6 0 0.0 0.0 0 0.0 0.0 0 0.0 0.0 0 0.0 0.015-19 1 1.9 1.4 1 2.2 1.4 2 3.2 3.1 0 0.0 0.0 1 1.4 1.520-24 9 17.3 12.8 10 21.7 14.2 9 14.3 13.5 11 17.7 17.8 8 11.6 12.725-29 11 21.2 17.2 5 10.9 7.6 9 14.3 11.7 16 25.8 28.8 12 17.4 21.330-34 6 11.5 10.3 9 19.6 15.5 12 19.0 18.4 5 8.1 10.0 10 14.5 19.835-44 16 30.8 13.4 10 21.7 8.5 21 33.3 18.4 18 29.0 17.1 18 26.1 17.345-54 8 15.4 6.9 8 17.4 6.8 7 11.1 6.1 7 11.3 6.2 20 29.0 17.955-64 0 0.0 0.0 2 4.3 2.3 2 3.2 2.3 5 8.1 5.5 0 0.0 0.065+ 0 0.0 0.0 0 0.0 0.0 1 1.6 1.2 0 0.0 0.0 0 0.0 0.0Unknown 1 2.2 .
Subtotal 52 89.7 6.1 46 90.2 5.4 63 86.3 7.4 62 92.5 7.9 69 92.0 8.7
FEMALE
0-14 0 0.0 0.0 0 0.0 0.0 0 0.0 0.0 0 0.0 0.0 0 0.0 0.015-19 1 16.7 1.5 0 0.0 0.0 2 20.0 3.2 0 0.0 0.0 0 0.0 0.020-24 1 16.7 1.5 0 0.0 0.0 1 10.0 1.6 1 20.0 1.8 0 0.0 0.025-29 3 50.0 5.0 2 40.0 3.3 3 30.0 4.1 2 40.0 3.8 4 66.7 7.630-34 0 0.0 0.0 0 0.0 0.0 0 0.0 0.0 2 40.0 4.0 1 16.7 2.035-44 1 16.7 0.8 2 40.0 1.6 4 40.0 3.4 0 0.0 0.0 1 16.7 0.945-54 0 0.0 0.0 1 20.0 0.8 0 0.0 0.0 0 0.0 0.0 0 0.0 0.055-64 0 0.0 0.0 0 0.0 0.0 0 0.0 0.0 0 0.0 0.0 0 0.0 0.065+ 0 0.0 0.0 0 0.0 0.0 0 0.0 0.0 0 0.0 0.0 0 0.0 0.0Unknown
Subtotal 6 10.3 0.7 5 9.8 0.6 10 13.7 1.1 5 7.5 0.6 6 8.0 0.7
Total² 58 3.4 51 2.9 73 4.2 67 4.2 75 4.6
Note: Cumulative percentages may not equal 100% because of rounding.
1. Excludes cases from Pasadena.2. Excludes cases reported as "Unknown" gender. May not equal to SPA total.
Table a4.4. Reported Early Latent Syphilis Cases and Rates per 100,000 Population by Gender and Age, San Gabriel Service Planning Area 3 (SPA 3), Los Angeles County, 2008-2012
2008 2009 2011 20122010

Sexually Transmitted Disease Morbidity Report - 2012 IV-7
No. (%) Rate No. (%) Rate No. (%) Rate No. (%) Rate No. (%) Rate
MALE
0-14 0 0.0 0.0 0 0.0 0.0 0 0.0 0.0 0 0.0 0.0 0 0.0 0.015-19 2 0.6 4.8 4 1.0 9.4 3 0.8 7.2 3 0.7 8.6 3 0.5 8.820-24 22 6.6 57.2 21 5.1 56.0 26 6.9 68.9 28 6.3 64.3 40 7.1 98.825-29 48 14.4 107.0 57 13.9 135.7 43 11.3 93.3 50 11.3 85.7 69 12.3 123.630-34 38 11.4 65.3 62 15.1 113.6 54 14.2 94.0 66 14.9 114.2 70 12.5 119.835-44 153 45.9 118.7 167 40.7 128.8 143 37.7 112.5 168 37.8 165.0 185 33.0 179.745-54 51 15.3 55.9 81 19.8 85.9 82 21.6 85.2 101 22.7 126.8 158 28.2 195.455-64 14 4.2 25.7 14 3.4 24.6 22 5.8 37.8 25 5.6 45.6 30 5.4 53.165+ 5 1.5 9.0 4 1.0 7.1 6 1.6 10.5 2 0.5 3.9 3 0.5 5.5Unknown 1 0.2 . 2 0.4 .
Subtotal 333 95.1 51.7 410 94.9 64.1 379 96.2 58.5 444 95.7 77.1 560 95.1 97.0
FEMALE
0-14 0 0.0 0.0 0 0.0 0.0 0 0.0 0.0 0 0.0 0.0 0 0.0 0.015-19 1 5.9 2.5 2 9.1 4.9 1 6.7 2.5 1 5.0 3.1 0 0.0 0.020-24 3 17.6 8.5 1 4.5 2.9 1 6.7 2.9 3 15.0 7.6 6 20.7 16.225-29 3 17.6 7.8 2 9.1 5.6 2 13.3 5.0 3 15.0 5.7 6 20.7 11.730-34 2 11.8 3.9 3 13.6 6.2 1 6.7 2.0 3 15.0 6.0 5 17.2 9.735-44 3 17.6 2.8 4 18.2 3.7 5 33.3 4.7 6 30.0 7.1 6 20.7 7.045-54 4 23.5 5.0 7 31.8 8.6 3 20.0 3.7 4 20.0 5.9 5 17.2 7.355-64 1 5.9 1.8 1 4.5 1.7 2 13.3 3.4 0 0.0 0.0 1 3.4 1.765+ 0 0.0 0.0 2 9.1 2.6 0 0.0 0.0 0 0.0 0.0 0 0.0 0.0Unknown
Subtotal 17 4.9 2.8 22 5.1 3.6 15 3.8 2.5 20 4.3 3.7 29 4.9 5.3
Total1 350 27.9 432 34.7 394 31.3 464 41.4 589 52.4
1. Excludes cases reported as "Unknown" gender. May not equal to SPA total.Note: Cumulative percentages may not equal 100% because of rounding.
Table a4.5. Reported Early Latent Syphilis Cases and Rates per 100,000 Population by Gender and Age, Metro Service Planning Area 4 (SPA 4), Los Angeles County, 2008-2012
2008 2009 2011 20122010

Sexually Transmitted Disease Morbidity Report - 2012 IV-8
No. (%) Rate No. (%) Rate No. (%) Rate No. (%) Rate No. (%) Rate
MALE
0-14 0 0.0 0.0 0 0.0 0.0 0 0.0 0.0 0 0.0 0.0 0 0.0 0.015-19 0 0.0 0.0 1 2.1 5.4 1 2.1 5.8 1 2.1 5.6 0 0.0 0.020-24 2 6.1 11.8 8 16.7 46.2 3 6.3 18.2 3 6.3 12.9 2 2.9 9.325-29 5 15.2 28.0 2 4.2 12.3 13 27.1 67.9 5 10.4 17.6 9 13.2 33.430-34 6 18.2 22.7 7 14.6 27.8 6 12.5 21.1 8 16.7 28.3 9 13.2 31.035-44 11 33.3 17.9 15 31.3 24.3 14 29.2 23.1 9 18.8 18.5 21 30.9 42.545-54 7 21.2 14.2 12 25.0 23.6 10 20.8 19.5 20 41.7 47.5 21 30.9 49.855-64 2 6.1 5.6 3 6.3 8.0 1 2.1 2.7 1 2.1 2.8 5 7.4 13.765+ 0 0.0 0.0 0 0.0 0.0 0 0.0 0.0 1 2.1 2.4 1 1.5 2.3Unknown
Subtotal 33 94.3 10.5 48 96.0 15.2 48 98.0 15.0 48 98.0 15.6 68 95.8 22.0
FEMALE
0-14 0 0.0 0.0 0 0.0 0.0 0 0.0 0.0 0 0.0 0.0 0 0.0 0.015-19 0 0.0 0.0 0 0.0 0.0 0 0.0 0.0 0 0.0 0.0 0 0.0 0.020-24 0 0.0 0.0 1 50.0 5.8 0 0.0 0.0 0 0.0 0.0 0 0.0 0.025-29 2 100.0 11.1 0 0.0 0.0 0 0.0 0.0 0 0.0 0.0 0 0.0 0.030-34 0 0.0 0.0 1 50.0 3.8 0 0.0 0.0 0 0.0 0.0 0 0.0 0.035-44 0 0.0 0.0 0 0.0 0.0 1 100.0 1.6 0 0.0 0.0 1 33.3 2.045-54 0 0.0 0.0 0 0.0 0.0 0 0.0 0.0 0 0.0 0.0 2 66.7 4.555-64 0 0.0 0.0 0 0.0 0.0 0 0.0 0.0 1 100.0 2.5 0 0.0 0.065+ 0 0.0 0.0 0 0.0 0.0 0 0.0 0.0 0 0.0 0.0 0 0.0 0.0Unknown
Subtotal 2 5.7 0.6 2 4.0 0.6 1 2.0 0.3 1 2.0 0.3 3 4.2 0.9
Total1 35 5.4 50 7.7 49 7.4 49 7.7 71 11.1
1. Excludes cases reported as "Unknown" gender. May not equal to SPA total.Note: Cumulative percentages may not equal 100% because of rounding.
Table a4.6. Reported Early Latent Syphilis Cases and Rates per 100,000 Population by Gender and Age, West Service Planning Area 5 (SPA 5), Los Angeles County, 2008-2012
2008 2009 2011 20122010

Sexually Transmitted Disease Morbidity Report - 2012 IV-9
No. (%) Rate No. (%) Rate No. (%) Rate No. (%) Rate No. (%) Rate
MALE
0-14 0 0.0 0.0 1 1.1 0.7 0 0.0 0.0 1 0.8 0.8 0 0.0 0.015-19 4 6.3 8.1 6 6.6 11.9 3 3.0 6.2 1 0.8 2.1 7 4.5 15.020-24 14 22.2 31.7 18 19.8 40.4 14 14.1 30.9 25 19.5 53.3 23 14.9 48.925-29 10 15.9 23.2 15 16.5 35.2 13 13.1 27.4 15 11.7 37.2 38 24.7 92.030-34 5 7.9 12.7 8 8.8 19.9 13 13.1 28.9 27 21.1 75.3 28 18.2 76.835-44 18 28.6 25.9 21 23.1 30.0 34 34.3 49.1 28 21.9 42.7 28 18.2 42.645-54 12 19.0 22.3 14 15.4 25.5 17 17.2 30.7 23 18.0 40.1 24 15.6 41.455-64 0 0.0 0.0 7 7.7 21.5 3 3.0 8.9 7 5.5 18.5 5 3.2 12.665+ 0 0.0 0.0 1 1.1 3.1 2 2.0 6.2 1 0.8 3.2 1 0.6 3.0Unknown
Subtotal 63 76.8 12.3 91 76.5 17.7 99 86.1 18.9 128 92.1 26.1 154 88.0 31.1
FEMALE
0-14 0 0.0 0.0 0 0.0 0.0 0 0.0 0.0 0 0.0 0.0 0 0.0 0.015-19 4 21.1 8.2 2 7.1 4.0 3 18.8 6.4 2 18.2 4.2 1 4.8 2.220-24 3 15.8 6.9 2 7.1 4.6 4 25.0 9.2 2 18.2 4.4 8 38.1 17.225-29 3 15.8 7.3 3 10.7 7.4 0 0.0 0.0 1 9.1 2.5 2 9.5 5.130-34 0 0.0 0.0 4 14.3 10.2 0 0.0 0.0 0 0.0 0.0 1 4.8 2.735-44 4 21.1 5.6 7 25.0 9.8 4 25.0 5.7 2 18.2 2.9 5 23.8 7.245-54 5 26.3 8.4 7 25.0 11.6 3 18.8 4.9 2 18.2 3.1 4 19.0 6.255-64 0 0.0 0.0 3 10.7 7.6 2 12.5 4.9 2 18.2 4.5 0 0.0 0.065+ 0 0.0 0.0 0 0.0 0.0 0 0.0 0.0 0 0.0 0.0 0 0.0 0.0Unknown
Subtotal 19 23.2 3.6 28 23.5 5.2 16 13.9 2.9 11 7.9 2.1 21 12.0 4.0
Total1 82 7.8 119 11.3 115 10.8 139 13.8 175 17.2
1. Excludes cases reported as "Unknown" gender. May not equal to SPA total.Note: Cumulative percentages may not equal 100% because of rounding.
Table a4.7. Reported Early Latent Syphilis Cases and Rates per 100,000 Population by Gender and Age, South Service Planning Area 6 (SPA 6), Los Angeles County, 2008-2012
2008 2009 2011 20122010

Sexually Transmitted Disease Morbidity Report - 2012 IV-10
No. (%) Rate No. (%) Rate No. (%) Rate No. (%) Rate No. (%) Rate
MALE
0-14 0 0.0 0.0 0 0.0 0.0 0 0.0 0.0 0 0.0 0.0 0 0.0 0.015-19 1 2.1 1.7 2 2.8 3.3 3 3.8 5.2 3 3.8 5.2 2 2.4 3.620-24 3 6.3 5.4 7 9.7 12.6 11 13.9 20.0 13 16.3 25.0 6 7.1 11.225-29 12 25.0 22.1 10 13.9 18.1 15 19.0 24.2 20 25.0 42.6 17 20.0 36.330-34 6 12.5 11.8 9 12.5 17.8 8 10.1 14.6 8 10.0 17.9 12 14.1 26.935-44 16 33.3 16.1 26 36.1 26.1 21 26.6 21.8 18 22.5 19.9 29 34.1 32.445-54 7 14.6 8.4 12 16.7 14.1 16 20.3 19.2 12 15.0 14.8 16 18.8 19.655-64 1 2.1 1.8 5 6.9 8.8 3 3.8 5.3 6 7.5 10.0 3 3.5 4.965+ 1 2.1 1.7 1 1.4 1.7 2 2.5 3.5 0 0.0 0.0 0 0.0 0.0Unknown 1 2.1 .
Subtotal 48 78.7 7.0 72 85.7 10.5 79 88.8 11.6 80 89.9 12.6 85 91.4 13.3
FEMALE
0-14 0 0.0 0.0 0 0.0 0.0 0 0.0 0.0 0 0.0 0.0 0 0.0 0.015-19 1 7.7 1.8 0 0.0 0.0 3 30.0 5.5 1 11.1 1.8 1 12.5 1.920-24 5 38.5 9.4 3 25.0 5.6 2 20.0 3.8 1 11.1 2.0 1 12.5 2.025-29 1 7.7 2.0 6 50.0 12.0 2 20.0 3.5 1 11.1 2.2 1 12.5 2.230-34 4 30.8 8.1 1 8.3 2.1 3 30.0 5.8 1 11.1 2.2 1 12.5 2.235-44 1 7.7 1.0 1 8.3 1.0 0 0.0 0.0 3 33.3 3.2 0 0.0 0.045-54 1 7.7 1.1 1 8.3 1.1 0 0.0 0.0 1 11.1 1.2 3 37.5 3.655-64 0 0.0 0.0 0 0.0 0.0 0 0.0 0.0 1 11.1 1.5 1 12.5 1.565+ 0 0.0 0.0 0 0.0 0.0 0 0.0 0.0 0 0.0 0.0 0 0.0 0.0Unknown
Subtotal 13 21.3 1.9 12 14.3 1.7 10 11.2 1.4 9 10.1 1.4 8 8.6 1.2
Total1 61 4.4 84 6.1 89 6.5 89 6.9 93 7.2
1. Excludes cases reported as "Unknown" gender. May not equal to SPA total.Note: Cumulative percentages may not equal 100% because of rounding.
Table a4.8. Reported Early Latent Syphilis Cases and Rates per 100,000 Population by Gender and Age, East Service Planning Area 7 (SPA 7), Los Angeles County, 2008-2012
2008 2009 2011 20122010

Sexually Transmitted Disease Morbidity Report - 2012 IV-11
No. (%) Rate No. (%) Rate No. (%) Rate No. (%) Rate No. (%) Rate
MALE
0-14 0 0.0 0.0 0 0.0 0.0 0 0.0 0.0 0 0.0 0.0 0 0.0 0.015-19 2 5.1 4.6 2 3.6 4.5 0 0.0 0.0 3 4.3 7.5 1 1.4 2.520-24 8 20.5 20.4 10 18.2 25.0 6 14.3 15.3 13 18.8 37.7 17 23.6 47.925-29 3 7.7 8.5 6 10.9 16.4 8 19.0 18.4 10 14.5 27.7 19 26.4 53.730-34 4 10.3 11.2 11 20.0 32.1 9 21.4 24.1 9 13.0 25.2 3 4.2 8.335-44 9 23.1 10.6 13 23.6 15.5 11 26.2 13.8 16 23.2 21.8 24 33.3 33.245-54 9 23.1 11.2 12 21.8 14.7 8 19.0 9.9 15 21.7 19.3 7 9.7 9.155-64 3 7.7 5.6 1 1.8 1.8 0 0.0 0.0 2 2.9 3.5 1 1.4 1.765+ 1 2.6 1.8 0 0.0 0.0 0 0.0 0.0 1 1.4 1.7 0 0.0 0.0Unknown
Subtotal 39 75.0 7.1 55 90.2 10.0 42 84.0 7.6 69 94.5 13.3 72 93.5 13.8
FEMALE
0-14 0 0.0 0.0 0 0.0 0.0 0 0.0 0.0 0 0.0 0.0 0 0.0 0.015-19 2 15.4 4.8 1 16.7 2.3 2 25.0 5.0 0 0.0 0.0 0 0.0 0.020-24 3 23.1 8.0 1 16.7 2.6 3 37.5 8.0 0 0.0 0.0 0 0.0 0.025-29 2 15.4 6.0 0 0.0 0.0 0 0.0 0.0 3 75.0 8.4 1 20.0 2.930-34 1 7.7 2.8 2 33.3 5.8 0 0.0 0.0 1 25.0 2.8 2 40.0 5.535-44 2 15.4 2.3 1 16.7 1.2 1 12.5 1.2 0 0.0 0.0 2 40.0 2.645-54 1 7.7 1.2 0 0.0 0.0 2 25.0 2.4 0 0.0 0.0 0 0.0 0.055-64 1 7.7 1.7 1 16.7 1.6 0 0.0 0.0 0 0.0 0.0 0 0.0 0.065+ 1 7.7 1.4 0 0.0 0.0 0 0.0 0.0 0 0.0 0.0 0 0.0 0.0Unknown
Subtotal 13 25.0 2.3 6 9.8 1.0 8 16.0 1.4 4 5.5 0.7 5 6.5 0.9
Total² 52 4.6 61 5.4 50 4.5 73 6.9 77 7.2
1. Excludes cases from Long Beach.
Note: Cumulative percentages may not equal 100% because of rounding.2. Excludes cases reported as "Unknown" gender. May not equal to SPA total.
Table a4.9. Reported Early Latent Syphilis Cases and Rates per 100,000 Population by Gender and Age, South Bay Service Planning Area 8 (SPA 8), Los Angeles County, 2008-2012
2008 2009 2011 20122010

Sexually Transmitted Disease Morbidity Report - 2012 IV-12
Adj. Adj. Adj. Adj.No. (%) Rate No. (%) Rate No. (%) Rate No. (%) Rate No. (%) Rate
MALE
2008 2 33.3 2.4 0 0.0 0.0 4 66.7 6.0 0 0.0 0.0 6 100.0 3.32009 1 20.0 1.5 1 20.0 4.7 2 40.0 3.3 0 0.0 0.0 5 100.0 2.72010 1 25.0 1.3 2 50.0 7.7 1 25.0 1.3 0 0.0 0.0 4 100.0 2.12011 1 12.5 1.5 2 25.0 6.8 2 25.0 2.3 2 25.0 28.5 8 80.0 4.22012 1 14.3 1.5 4 57.1 13.5 2 28.6 2.3 0 0.0 0.0 7 53.8 3.6
FEMALE
2008 0 0.0 0.0 0 0.0 0.0 0 0.0 0.0 0 0.0 0.0 0 0.0 0.02009 0 0.0 0.0 0 0.0 0.0 0 0.0 0.0 0 0.0 0.0 0 0.0 0.02010 0 0.0 0.0 0 0.0 0.0 0 0.0 0.0 0 0.0 0.0 0 0.0 0.02011 0 0.0 0.0 2 100.0 6.4 0 0.0 0.0 0 0.0 0.0 2 20.0 1.02012 1 16.7 1.5 5 83.3 15.8 0 0.0 0.0 0 0.0 0.0 6 46.2 3.1
Note: If race/ethnicity was not specified, cases were prorated according to the distribution of cases for which race/ethnicity was specified. Rates were adjusted including the prorated cases. Therefore, these tables should be used only for race/ethnicity comparisons, not for overall totals or gender totals. Cumulative percentages may not
Total1
1. Includes Native Americans and cases reported as "Mixed/Other/Unknown" race/ethnicity. Excludes cases reported with "Other/Unknown" gender. May not add up to SPA total.
equal 100% because of rounding.
Table a4.10. Reported Early Latent Syphilis Cases and Rates per 100,000 Population by Gender and Race/Ethnicity, Antelope Valley Service Planning Area 1 (SPA 1), Los Angeles County, 2008-2012
White Black Latino Asian-Pacific

Sexually Transmitted Disease Morbidity Report - 2012 IV-13
Adj. Adj. Adj. Adj.No. (%) Rate No. (%) Rate No. (%) Rate No. (%) Rate No. (%) Rate
MALE
2008 35 34.7 6.9 11 10.9 28.8 50 49.5 11.8 3 3.0 2.8 101 91.8 9.32009 36 31.9 7.0 12 10.6 30.9 51 45.1 11.9 6 5.3 5.5 113 91.1 10.22010 39 33.3 7.7 14 12.0 35.2 59 50.4 13.4 4 3.4 3.5 117 92.9 10.62011 45 34.9 9.7 10 7.8 27.0 63 48.8 15.7 4 3.1 3.8 129 91.5 12.22012 63 39.9 13.3 17 10.8 44.7 59 37.3 14.2 10 6.3 9.1 158 94.6 14.9
FEMALE
2008 1 11.1 0.2 1 11.1 2.7 6 66.7 1.4 1 11.1 0.8 9 8.2 0.82009 1 9.1 0.2 2 18.2 5.2 8 72.7 1.9 0 0.0 0.0 11 8.9 1.02010 2 22.2 0.4 2 22.2 5.2 5 55.6 1.2 0 0.0 0.0 9 7.1 0.82011 2 16.7 0.4 4 33.3 10.9 6 50.0 1.4 0 0.0 0.0 12 8.5 1.12012 1 11.1 0.2 2 22.2 6.0 5 55.6 1.3 0 0.0 0.0 9 5.4 0.8
Note: If race/ethnicity was not specified, cases were prorated according to the distribution of cases for which race/ethnicity was specified. Rates were adjusted including the prorated cases. Therefore, these tables should be used only for race/ethnicity comparisons, not for overall totals or gender totals. Cumulative percentages may not
Total1
1. Includes Native Americans and cases reported as "Mixed/Other/Unknown" race/ethnicity. Excludes cases reported with "Other/Unknown" gender. May not add up to SPA total.
equal 100% because of rounding.
Table a4.11. Reported Early Latent Syphilis Cases and Rates per 100,000 Population by Gender and Race/Ethnicity, San Fernando Service Planning Area 2 (SPA 2), Los Angeles County, 2008-2012
White Black Latino Asian-Pacific

Sexually Transmitted Disease Morbidity Report - 2012 IV-14
Adj. Adj. Adj. Adj.No. (%) Rate No. (%) Rate No. (%) Rate No. (%) Rate No. (%) Rate
MALE
2008 10 19.2 5.0 4 7.7 13.4 34 65.4 8.5 4 7.7 1.8 52 89.7 6.12009 10 21.7 5.1 5 10.9 17.3 27 58.7 6.8 4 8.7 1.8 46 90.2 5.42010 12 19.1 6.3 4 6.4 13.7 41 65.1 10.2 5 7.9 2.2 63 86.3 7.42011 8 12.9 5.0 2 3.2 8.2 49 79.0 13.1 2 3.2 0.9 62 92.5 7.92012 13 18.8 8.1 8 11.6 32.6 39 56.5 10.3 9 13.0 4.0 69 92.0 8.7
FEMALE
2008 0 0.0 0.0 0 0.0 0.0 6 100.0 1.5 0 0.0 0.0 6 10.3 0.72009 0 0.0 0.0 1 20.0 3.1 3 60.0 0.7 1 20.0 0.4 5 9.8 0.62010 0 0.0 0.0 0 0.0 0.0 9 90.0 2.2 1 10.0 0.4 10 13.7 1.12011 0 0.0 0.0 0 0.0 0.0 4 80.0 1.0 1 20.0 0.4 5 7.5 0.62012 0 0.0 0.0 1 16.7 3.8 3 50.0 0.8 2 33.3 0.8 6 8.0 0.7
1. Excludes cases from Pasadena.
Note: If race/ethnicity was not specified, cases were prorated according to the distribution of cases for which race/ethnicity was specified. Rates were adjusted including the prorated cases. Therefore, these tables should be used only for race/ethnicity comparisons, not for overall totals or gender totals. Cumulative percentages may not
Total1,2
2. Includes Native Americans and cases reported as "Mixed/Other/Unknown" race/ethnicity. Excludes cases reported with "Other/Unknown" gender. May not add up to SPA total.
equal 100% because of rounding.
Table a4.12. Reported Early Latent Syphilis Cases and Rates per 100,000 Population by Gender and Race/Ethnicity,San Gabriel Service Planning Area 3 (SPA 3), Los Angeles County, 2008-2012
White Black Latino Asian-Pacific

Sexually Transmitted Disease Morbidity Report - 2012 IV-15
Adj. Adj. Adj. Adj.No. (%) Rate No. (%) Rate No. (%) Rate No. (%) Rate No. (%) Rate
MALE
2008 147 44.1 105.3 30 9.0 82.5 131 39.3 37.9 7 2.1 7.4 333 95.1 51.72009 160 39.0 108.8 47 11.5 124.7 176 42.9 50.7 16 3.9 16.7 410 94.9 64.12010 148 39.1 99.5 30 7.9 79.3 181 47.8 50.9 15 4.0 15.3 379 96.2 58.52011 162 36.5 108.1 49 11.0 145.5 212 47.8 71.8 11 2.5 12.1 444 95.7 77.12012 203 36.3 136.4 74 13.2 222.4 258 46.1 87.6 12 2.1 13.3 560 95.1 97.0
FEMALE
2008 1 5.9 0.8 3 17.7 8.9 11 64.7 3.3 2 11.8 1.8 17 4.9 2.82009 6 27.3 4.6 3 13.6 8.8 13 59.1 3.9 0 0.0 0.0 22 5.1 3.62010 0 0.0 0.0 6 40.0 17.7 9 60.0 2.7 0 0.0 0.0 15 3.8 2.52011 2 10.0 1.5 6 30.0 22.3 8 40.0 2.9 3 15.0 2.8 20 4.3 3.72012 3 10.3 2.3 10 34.5 37.3 15 51.7 5.3 1 3.5 0.9 29 4.9 5.3
Note: If race/ethnicity was not specified, cases were prorated according to the distribution of cases for which race/ethnicity was specified. Rates were adjusted including the prorated cases. Therefore, these tables should be used only for race/ethnicity comparisons, not for overall totals or gender totals. Cumulative percentages may not
Table a4.13. Reported Early Latent Syphilis Cases and Rates per 100,000 Population by Gender and Race/Ethnicity, Metro Service Planning Area 4 (SPA 4), Los Angeles County, 2008-2012
White Black Latino Asian-Pacific Total1
1. Includes Native Americans and cases reported as "Mixed/Other/Unknown" race/ethnicity. Excludes cases reported with "Other/Unknown" gender. May not add up to SPA total.
equal 100% because of rounding.

Sexually Transmitted Disease Morbidity Report - 2012 IV-16
Adj. Adj. Adj. Adj.No. (%) Rate No. (%) Rate No. (%) Rate No. (%) Rate No. (%) Rate
MALE
2008 19 57.6 9.4 2 6.1 10.1 9 27.3 16.6 1 3.0 2.8 33 94.3 10.52009 23 47.9 11.1 9 18.8 44.5 12 25.0 22.6 3 6.3 8.4 48 96.0 15.22010 17 35.4 8.5 6 12.5 29.3 19 39.6 34.6 2 4.2 5.3 48 98.0 15.02011 24 50.0 12.2 2 4.2 11.7 17 35.4 37.0 0 0.0 0.0 48 98.0 15.62012 33 48.5 16.6 9 13.2 51.9 19 27.9 40.6 2 2.9 5.5 68 95.8 22.0
FEMALE
2008 0 0.0 0.0 2 100.0 8.8 0 0.0 0.0 0 0.0 0.0 2 5.7 0.62009 0 0.0 0.0 0 0.0 0.0 2 100.0 3.7 0 0.0 0.0 2 4.0 0.62010 0 0.0 0.0 0 0.0 0.0 0 0.0 0.0 1 100.0 2.2 1 2.0 0.32011 0 0.0 0.0 0 0.0 0.0 1 100.0 1.9 0 0.0 0.0 1 2.0 0.32012 0 0.0 0.0 0 0.0 0.0 2 66.7 3.8 1 33.3 2.1 3 4.2 0.9
Note: If race/ethnicity was not specified, cases were prorated according to the distribution of cases for which race/ethnicity was specified. Rates were adjusted including the prorated cases. Therefore, these tables should be used only for race/ethnicity comparisons, not for overall totals or gender totals. Cumulative percentages may not
Total1
1. Includes Native Americans and cases reported as "Mixed/Other/Unknown" race/ethnicity. Excludes cases reported with "Other/Unknown" gender. May not add up to SPA total.
equal 100% because of rounding.
Table a4.14. Reported Early Latent Syphilis Cases and Rates per 100,000 Population by Gender and Race/Ethnicity,West Service Planning Area 5 (SPA 5), Los Angeles County, 2008-2012
White Black Latino Asian-Pacific

Sexually Transmitted Disease Morbidity Report - 2012 IV-17
Adj. Adj. Adj. Adj.No. (%) Rate No. (%) Rate No. (%) Rate No. (%) Rate No. (%) Rate
MALE
2008 2 3.2 15.5 33 52.4 22.2 28 44.4 8.2 0 0.0 0.0 63 76.8 12.32009 4 4.4 30.6 39 42.9 26.9 45 49.5 13.4 0 0.0 0.0 91 76.5 17.72010 3 3.0 21.5 45 45.5 30.5 50 50.5 14.2 1 1.0 10.9 99 86.1 18.92011 5 3.9 40.8 63 49.2 50.6 57 44.5 16.9 1 0.8 11.5 128 92.1 26.12012 8 5.2 64.7 82 53.3 64.8 64 41.6 18.5 0 0.0 0.0 154 88.0 31.1
FEMALE
2008 1 5.3 8.1 9 47.4 4.8 9 47.4 2.8 0 0.0 0.0 19 23.2 3.62009 0 0.0 0.0 15 53.6 8.1 13 46.4 4.0 0 0.0 0.0 28 23.5 5.22010 0 0.0 0.0 9 56.3 5.2 6 37.5 1.9 0 0.0 0.0 16 13.9 2.92011 0 0.0 0.0 4 36.4 2.5 7 63.6 2.1 0 0.0 0.0 11 7.9 2.12012 0 0.0 0.0 13 61.9 8.1 8 38.1 2.4 0 0.0 0.0 21 12.0 4.0
Note: If race/ethnicity was not specified, cases were prorated according to the distribution of cases for which race/ethnicity was specified. Rates were adjusted including the prorated cases. Therefore, these tables should be used only for race/ethnicity comparisons, not for overall totals or gender totals. Cumulative percentages may not
Total1
1. Includes Native Americans and cases reported as "Mixed/Other/Unknown" race/ethnicity. Excludes cases reported with "Other/Unknown" gender. May not add up to SPA total.
equal 100% because of rounding.
Table a4.15. Reported Early Latent Syphilis Cases and Rates per 100,000 Population by Gender and Race/Ethnicity, South Service Planning Area 6 (SPA 6), Los Angeles County, 2008-2012
White Black Latino Asian-Pacific

Sexually Transmitted Disease Morbidity Report - 2012 IV-18
Adj. Adj. Adj. Adj.No. (%) Rate No. (%) Rate No. (%) Rate No. (%) Rate No. (%) Rate
MALE
2008 5 10.4 4.4 2 4.2 11.7 38 79.2 8.1 1 2.1 1.8 48 78.7 7.02009 5 6.9 4.4 6 8.3 33.5 58 80.6 11.8 2 2.8 3.4 72 85.7 10.52010 12 15.2 10.9 2 2.5 11.4 63 79.8 12.9 1 1.3 1.7 79 88.8 11.62011 11 13.8 12.0 4 5.0 21.9 62 77.5 13.4 1 1.3 1.8 80 89.9 12.62012 7 8.2 7.5 4 4.7 21.5 71 83.5 15.1 3 3.5 5.4 85 91.4 13.3
FEMALE
2008 0 0.0 0.0 1 7.7 5.2 12 92.3 2.5 0 0.0 0.0 13 21.3 1.92009 2 16.7 1.7 1 8.3 5.2 9 75.0 1.8 0 0.0 0.0 12 14.3 1.72010 0 0.0 0.0 1 10.0 5.3 9 90.0 1.8 0 0.0 0.0 10 11.2 1.42011 2 22.2 2.1 1 11.1 5.0 6 66.7 1.3 0 0.0 0.0 9 10.1 1.42012 1 12.5 1.1 0 0.0 0.0 7 87.5 1.5 0 0.0 0.0 8 8.6 1.2
Note: If race/ethnicity was not specified, cases were prorated according to the distribution of cases for which race/ethnicity was specified. Rates were adjusted including the prorated cases. Therefore, these tables should be used only for race/ethnicity comparisons, not for overall totals or gender totals. Cumulative percentages may not
Total1
1. Includes Native Americans and cases reported as "Mixed/Other/Unknown" race/ethnicity. Excludes cases reported with "Other/Unknown" gender. May not add up to SPA total.
equal 100% because of rounding.
Table a4.16. Reported Early Latent Syphilis Cases and Rates per 100,000 Population by Gender and Race/Ethnicity,East Service Planning Area 7 (SPA 7), Los Angeles County, 2008-2012
White Black Latino Asian-Pacific

Sexually Transmitted Disease Morbidity Report - 2012 IV-19
Adj. Adj. Adj. Adj.No. (%) Rate No. (%) Rate No. (%) Rate No. (%) Rate No. (%) Rate
MALE
2008 3 7.7 1.7 17 43.6 21.5 18 46.2 8.5 1 2.6 1.2 39 75.0 7.12009 6 10.9 3.5 16 29.1 20.6 29 52.7 13.8 3 5.5 3.7 55 90.2 10.02010 5 11.9 3.0 19 45.2 24.6 15 35.7 7.1 2 4.8 2.5 42 84.0 7.62011 5 7.3 3.2 32 46.4 43.7 29 42.0 14.0 2 2.9 2.5 69 94.5 13.32012 3 4.2 1.9 37 51.4 51.2 27 37.5 13.1 2 2.8 2.5 72 93.5 13.8
FEMALE
2008 0 0.0 0.0 5 38.5 5.2 8 61.5 3.8 0 0.0 0.0 13 25.0 2.32009 2 33.3 1.2 2 33.3 2.1 1 16.7 0.5 1 16.7 1.1 6 9.8 1.02010 1 12.5 0.6 6 75.0 6.2 0 0.0 0.0 1 12.5 1.1 8 16.0 1.42011 0 0.0 0.0 2 50.0 2.2 2 50.0 1.0 0 0.0 0.0 4 5.5 0.72012 0 0.0 0.0 4 80.0 4.5 1 20.0 0.5 0 0.0 0.0 5 6.5 0.9
Note: If race/ethnicity was not specified, cases were prorated according to the distribution of cases for which race/ethnicity was specified. Rates were adjusted including the prorated cases. Therefore, these tables should be used only for race/ethnicity comparisons, not for overall totals or gender totals. Cumulative percentages may not
Table a4.17. Reported Early Latent Syphilis Cases and Rates per 100,000 Population by Gender and Race/Ethnicity, South Bay Service Planning Area 8 (SPA 8), Los Angeles County, 2008-2012
White Black Latino Asian-Pacific Total1,2
1. Excludes cases from Long Beach.2. Includes Native Americans and cases reported as "Mixed/Other/Unknown" race/ethnicity. Excludes cases reported with "Other/Unknown" gender. May not add up to SPA total.
equal 100% because of rounding.

Addendum V:
Late and Late Latent Syphilis

Sexually Transmitted Disease Surveillance Report - 2012 V-1
0 8 164 Miles±
Figure a5.1 Reported Late and Late Latent Syphilis Rates per 100,000 Population by Service Planning Area (SPA), Los Angeles County, 2012.
Excludes cases from Pasadena (SPA 3) and Long Beach (SPA 8).
Antelope Valley (SPA 1)5.2
East (SPA 7)5.7
Metro (SPA 4)25.2
San Fernando (SPA 2)6.9
San Gabriel (SPA 3)5.3
South (SPA 6)19.4
South Bay (SPA 8)7.6
West (SPA 5)5.5

Foothill3.0
West5.5
Antelope Valley5.2
San Fernando4.8
East Valley10.3
West Valley7.3
Pomona5.6
Whittier4.4
Torrance3.1
El Monte4.6
Glendale4.7
Harbor7.4
Central28.8
Alhambra7.9
Bellflower4.5
Inglewood12.7 Compton
10.3
Southwest23.9
Long Beach *0
San Antonio6.7
Northeast12.2
Pasadena *0
Hollywood-Wilshir30.9
South23.2
East Los Angeles7.8Southeast
19.9
* Data of Pasadena (SPA 3) and Long Beach (SPA 8) are not available.
0 7 143.5 Miles±
Rates per 100,000 population0.00.1 - 10.010.1 - 20.020.1 - 30.030.1 - 40.0
Figure a5.2 Reported Late and Late Latent Syphilis Rates per 100,000 Population by Health District (HD), Los Angeles County, 2012.
Sexually Transmitted Disease Morbidity Report - 2012 V-2

Sexually Transmitted Disease Morbidity Report - 2012 V-3
No. (%) Rate No. (%) Rate No. (%) Rate No. (%) Rate No. (%) Rate
SPA3/HD4
Antelope Valley (1) 37 2.5 10.2 25 2.2 6.8 24 2.3 6.4 27 2.8 7.0 20 2.1 5.2 Antelope Valley 37 2.5 10.2 25 2.2 6.8 24 2.3 6.4 27 2.8 7.0 20 2.1 5.2
East (7) 155 10.6 11.2 111 9.8 8.0 102 9.7 7.4 91 9.5 7.0 74 7.7 5.7 Bellflower 44 3.0 11.9 25 2.2 6.8 31 3.0 8.4 9 0.9 2.5 16 1.7 4.5 East Los Angeles 31 2.1 14.0 23 2.0 10.4 15 1.4 6.9 22 2.3 10.8 16 1.7 7.8 San Antonio 59 4.1 13.0 47 4.1 10.4 35 3.3 7.7 44 4.6 10.5 28 2.9 6.7 Whittier 21 1.4 6.2 16 1.4 4.7 21 2.0 6.2 16 1.7 5.0 14 1.5 4.4
Metro (4) 402 27.6 32.1 335 29.6 26.9 290 27.6 23.0 258 26.8 23.0 283 29.5 25.2 Central 169 11.6 46.0 112 9.9 30.6 100 9.5 27.1 97 10.1 28.8 97 10.1 28.8 Hollywood-Wilshire 174 12.0 32.5 180 15.9 33.9 146 13.9 27.2 128 13.3 26.7 149 15.5 30.9 Northeast 59 4.1 16.9 43 3.8 12.4 44 4.2 12.5 33 3.4 10.9 37 3.9 12.2
San Fernando (2) 239 16.4 10.9 160 14.1 7.2 153 14.6 6.9 149 15.5 7.0 149 15.5 6.9 East Valley 77 5.3 16.6 48 4.2 10.2 56 5.3 11.9 50 5.2 11.3 46 4.8 10.3 Glendale 30 2.1 8.5 22 1.9 6.2 18 1.7 5.0 16 1.7 4.8 16 1.7 4.7 San Fernando 39 2.7 8.2 14 1.2 2.9 11 1.0 2.3 16 1.7 3.2 24 2.5 4.8 West Valley 93 6.4 10.4 76 6.7 8.4 68 6.5 7.5 67 7.0 7.8 63 6.6 7.3
San Gabriel (3) 136 9.3 7.9 102 9.0 5.9 97 9.2 5.6 94 9.8 5.8 86 9.0 5.3 Alhambra 31 2.1 8.6 15 1.3 4.1 28 2.7 7.7 30 3.1 8.8 27 2.8 7.9 El Monte 34 2.3 7.1 31 2.7 6.5 36 3.4 7.5 23 2.4 5.3 20 2.1 4.6 Foothill 16 1.1 5.1 17 1.5 5.4 10 1.0 3.2 12 1.2 4.0 9 0.9 3.0 Pomona 55 3.8 9.6 39 3.4 6.8 23 2.2 4.0 29 3.0 5.4 30 3.1 5.6
South (6) 269 18.5 25.7 219 19.3 20.8 224 21.4 20.9 204 21.2 20.2 197 20.5 19.4 Compton 57 3.9 19.6 35 3.1 12.1 33 3.1 11.3 50 5.2 17.9 29 3.0 10.3 South 43 3.0 22.6 34 3.0 17.6 39 3.7 20.0 32 3.3 17.1 44 4.6 23.2 Southeast 53 3.6 29.1 46 4.1 24.8 46 4.4 25.0 40 4.2 23.7 34 3.5 19.9 Southwest 116 8.0 30.2 104 9.2 27.2 106 10.1 26.6 82 8.5 21.9 90 9.4 23.9
South Bay (8) 99 6.8 8.8 93 8.2 8.3 81 7.7 7.2 75 7.8 7.1 81 8.4 7.6 Harbor 15 1.0 7.0 17 1.5 7.8 12 1.1 5.6 4 0.4 2.0 15 1.6 7.4 Inglewood 64 4.4 14.7 59 5.2 13.6 60 5.7 13.8 51 5.3 12.5 52 5.4 12.7 Torrance 20 1.4 4.3 17 1.5 3.6 9 0.9 1.9 20 2.1 4.4 14 1.5 3.1 West (5) 46 3.2 7.1 38 3.4 5.8 40 3.8 6.1 29 3.0 4.6 35 3.6 5.5 West 46 3.2 7.1 38 3.4 5.8 40 3.8 6.1 29 3.0 4.6 35 3.6 5.5
Unknown 73 5.0 . 50 4.4 . 38 3.6 . 34 3.5 . 35 3.6 .
Total 1,456 15.0 1,133 11.6 1,049 10.7 961 10.4 960 10.3
1. Late and late latent syphilis is classified as late latent, latent unknown duration and late syphilis with clinical manifestations (including neurosyphilis) (Source: CDC. Sexually Transmitted Disease Surveillance).2. Excludes cases from Pasadena (SPA 3) and Long Beach (SPA 8).3. Main categories.4. Subcategories.Note: Cumulative percentages may not equal 100% because of rounding.
Table a5.1. Reported Late and Late Latent Syphilis1 Cases and Rates per 100,000 Population and Health District (HD), Los Angeles County, 2008-2012
2011 20122008 2009 2010

Sexually Transmitted Disease Morbidity Report - 2012 V-4
No. (%) Rate No. (%) Rate No. (%) Rate No. (%) Rate No. (%) Rate
MALE
0-14 0 0.0 0.0 0 0.0 0.0 0 0.0 0.0 0 0.0 0.0 0 0.0 0.015-19 0 0.0 0.0 1 6.3 5.4 0 0.0 0.0 1 5.6 5.2 0 0.0 0.020-24 1 3.7 5.5 1 6.3 5.4 3 16.7 16.8 3 16.7 19.4 2 13.3 12.225-29 5 18.5 34.3 0 0.0 0.0 1 5.6 4.9 3 16.7 23.4 2 13.3 15.330-34 0 0.0 0.0 3 18.8 28.4 0 0.0 0.0 0 0.0 0.0 1 6.7 8.535-44 8 29.6 36.6 6 37.5 28.7 3 16.7 15.2 7 38.9 29.0 4 26.7 17.145-54 7 25.9 26.2 3 18.8 11.2 5 27.8 19.3 2 11.1 7.1 3 20.0 10.855-64 2 7.4 12.6 2 12.5 12.2 5 27.8 29.7 2 11.1 10.4 1 6.7 5.065+ 4 14.8 30.3 0 0.0 0.0 1 5.6 7.4 0 0.0 0.0 2 13.3 12.7Unknown
Subtotal 27 73.0 14.8 16 64.0 8.7 18 75.0 9.6 18 66.7 9.4 15 75.0 7.8
FEMALE
0-14 0 0.0 0.0 0 0.0 0.0 0 0.0 0.0 0 0.0 0.0 0 0.0 0.015-19 1 10.0 5.8 0 0.0 0.0 0 0.0 0.0 0 0.0 0.0 0 0.0 0.020-24 4 40.0 24.0 1 11.1 5.8 0 0.0 0.0 1 11.1 6.8 2 40.0 12.925-29 1 10.0 7.8 1 11.1 7.2 0 0.0 0.0 1 11.1 8.3 0 0.0 0.030-34 0 0.0 0.0 1 11.1 10.9 1 16.7 9.1 1 11.1 8.6 1 20.0 8.735-44 3 30.0 13.4 1 11.1 4.7 3 50.0 15.2 2 22.2 7.9 0 0.0 0.045-54 0 0.0 0.0 4 44.4 14.3 2 33.3 7.3 2 22.2 6.9 0 0.0 0.055-64 0 0.0 0.0 0 0.0 0.0 0 0.0 0.0 0 0.0 0.0 1 20.0 4.965+ 1 10.0 5.9 1 11.1 5.8 0 0.0 0.0 2 22.2 10.7 1 20.0 5.0Unknown
Subtotal 10 27.0 5.5 9 36.0 4.9 6 25.0 3.2 9 33.3 4.6 5 25.0 2.6
Total2 37 10.2 25 6.8 24 6.4 27 7.0 20 5.2
2. Excludes cases reported as "Unknown" gender. May not equal to SPA total.Note: Cumulative percentages may not equal 100% because of rounding.
1. Late and late latent syphilis is classified as late latent, latent unknown duration and late syphilis with clinical manifestations (including neurosyphilis).
Table a5.2. Reported Late and Late Latent Syphilis1 Cases and Rates per 100,000 Population by Gender and Age, Antelope Valley Service Planning Area 1 (SPA 1), Los Angeles County, 2008-2012
2008 2009 2011 20122010

Sexually Transmitted Disease Morbidity Report - 2012 V-5
No. (%) Rate No. (%) Rate No. (%) Rate No. (%) Rate No. (%) Rate
MALE
0-14 0 0.0 0.0 0 0.0 0.0 1 1.0 0.4 0 0.0 0.0 0 0.0 0.015-19 0 0.0 0.0 4 4.0 4.7 3 3.0 3.8 1 0.9 1.2 4 3.3 5.020-24 13 8.9 16.4 5 5.1 6.2 6 5.9 7.7 13 11.7 17.0 13 10.7 17.025-29 13 8.9 17.2 14 14.1 18.0 17 16.8 18.2 15 13.5 18.5 24 19.8 29.830-34 16 11.0 21.1 11 11.1 14.7 16 15.8 19.2 13 11.7 16.9 20 16.5 25.735-44 36 24.7 21.0 28 28.3 16.5 35 34.7 21.5 31 27.9 19.9 31 25.6 20.145-54 20 13.7 12.2 21 21.2 12.5 14 13.9 8.5 22 19.8 14.1 17 14.0 10.955-64 24 16.4 22.3 14 14.1 12.4 7 6.9 6.2 6 5.4 5.1 9 7.4 7.565+ 24 16.4 23.3 2 2.0 1.9 2 2.0 1.9 10 9.0 9.2 3 2.5 2.6Unknown
Subtotal 146 61.1 13.4 99 61.9 9.0 101 66.0 9.1 111 75.0 10.5 121 81.2 11.4
FEMALE
0-14 0 0.0 0.0 0 0.0 0.0 0 0.0 0.0 0 0.0 0.0 0 0.0 0.015-19 1 1.1 1.3 1 1.6 1.2 1 1.9 1.3 2 5.4 2.7 0 0.0 0.020-24 3 3.2 4.0 2 3.3 2.6 5 9.6 6.9 2 5.4 2.8 4 14.3 5.725-29 8 8.6 11.7 3 4.9 4.3 4 7.7 4.7 8 21.6 10.5 2 7.1 2.630-34 7 7.5 9.8 5 8.2 7.1 7 13.5 9.0 6 16.2 8.1 4 14.3 5.335-44 18 19.4 10.8 17 27.9 10.3 17 32.7 10.8 7 18.9 4.4 7 25.0 4.545-54 16 17.2 9.7 7 11.5 4.2 8 15.4 4.8 3 8.1 1.9 2 7.1 1.255-64 18 19.4 15.5 10 16.4 8.2 7 13.5 5.7 6 16.2 4.7 6 21.4 4.665+ 21 22.6 15.1 16 26.2 11.2 3 5.8 2.1 3 8.1 2.1 3 10.7 2.0Unknown 1 1.1 .
Subtotal 93 38.9 8.5 61 38.1 5.5 52 34.0 4.7 37 25.0 3.4 28 18.8 2.6
Total2 239 10.9 160 7.2 153 6.9 148 6.9 149 6.9
2. Excludes cases reported as "Unknown" gender. May not equal to SPA total.Note: Cumulative percentages may not equal 100% because of rounding. Includes Transgender cases.
Table a5.3. Reported Late and Late Latent Syphilis1 Cases and Rates per 100,000 Population by Gender and Age, San Fernando Service Planning Area 2 (SPA 2), Los Angeles County, 2008-2012
2008 2009 2011 2012
1. Late and late latent syphilis is classified as late latent, latent unknown duration and late syphilis with clinical manifestations (including neurosyphilis).
2010

Sexually Transmitted Disease Morbidity Report - 2012 V-6
No. (%) Rate No. (%) Rate No. (%) Rate No. (%) Rate No. (%) Rate
MALE
0-14 0 0.0 0.0 0 0.0 0.0 0 0.0 0.0 0 0.0 0.0 0 0.0 0.015-19 0 0.0 0.0 4 6.5 5.7 0 0.0 0.0 2 2.9 3.0 1 1.6 1.520-24 12 14.3 17.0 7 11.3 10.0 11 16.2 16.5 9 13.0 14.6 4 6.3 6.425-29 16 19.0 25.1 4 6.5 6.1 16 23.5 20.7 6 8.7 10.8 14 21.9 24.930-34 6 7.1 10.3 9 14.5 15.5 5 7.4 7.6 5 7.2 10.0 8 12.5 15.935-44 18 21.4 15.1 24 38.7 20.3 17 25.0 14.9 19 27.5 18.0 13 20.3 12.545-54 13 15.5 11.2 11 17.7 9.4 12 17.6 10.5 18 26.1 16.0 12 18.8 10.855-64 11 13.1 13.3 2 3.2 2.3 3 4.4 3.5 6 8.7 6.6 8 12.5 8.665+ 8 9.5 9.4 1 1.6 1.2 4 5.9 4.6 4 5.8 4.5 4 6.3 4.3Unknown
Subtotal 84 61.8 9.9 62 60.8 7.3 68 70.1 8.0 69 73.4 8.8 64 74.4 8.1
FEMALE
0-14 1 1.9 0.6 0 0.0 0.0 0 0.0 0.0 0 0.0 0.0 0 0.0 0.015-19 2 3.8 3.0 0 0.0 0.0 0 0.0 0.0 0 0.0 0.0 0 0.0 0.020-24 4 7.7 5.9 2 5.0 2.9 5 17.2 7.8 2 8.0 3.5 5 22.7 8.525-29 8 15.4 13.4 5 12.5 8.2 8 27.6 11.0 2 8.0 3.8 2 9.1 3.830-34 4 7.7 7.0 5 12.5 8.9 3 10.3 4.8 4 16.0 7.9 0 0.0 0.035-44 15 28.8 12.3 12 30.0 9.9 8 27.6 6.8 6 24.0 5.4 7 31.8 6.445-54 10 19.2 7.9 6 15.0 4.7 2 6.9 1.6 6 24.0 4.9 3 13.6 2.555-64 4 7.7 4.3 6 15.0 6.2 1 3.4 1.0 1 4.0 1.0 2 9.1 1.965+ 4 7.7 3.4 4 10.0 3.4 2 6.9 1.7 4 16.0 3.4 3 13.6 2.4Unknown
Subtotal 52 38.2 5.9 40 39.2 4.5 29 29.9 3.3 25 26.6 3.0 22 25.6 2.7
Total³ 136 7.9 102 5.9 97 5.6 94 5.8 86 5.3
2012
3. Excludes cases reported as "Unknown" gender. May not equal to SPA total.2. Excludes cases from Pasadena.Note: Cumulative percentages may not equal 100% because of rounding.
1. Late and late latent syphilis is classified as late latent, latent unknown duration and late syphilis with clinical manifestations (including neurosyphilis).
Table a5.4. Reported Late and Late Latent Syphilis1 Cases and Rates per 100,000 Population by Gender and Age, San Gabriel Service Planning Area 3 (SPA 3), Los Angeles County, 2008-2012
2008 2009 20112010

Sexually Transmitted Disease Morbidity Report - 2012 V-7
No. (%) Rate No. (%) Rate No. (%) Rate No. (%) Rate No. (%) Rate
MALE
0-14 0 0.0 0.0 0 0.0 0.0 0 0.0 0.0 0 0.0 0.0 0 0.0 0.015-19 8 2.6 19.2 5 1.9 11.7 6 2.5 14.5 4 2.0 11.5 6 2.4 17.720-24 15 4.9 39.0 16 6.0 42.7 18 7.6 47.7 21 10.3 48.2 31 12.4 76.625-29 44 14.4 98.1 39 14.7 92.8 32 13.6 69.5 26 12.8 44.6 34 13.7 60.930-34 41 13.4 70.5 41 15.5 75.2 38 16.1 66.2 40 19.7 69.2 38 15.3 65.035-44 109 35.6 84.6 73 27.5 56.3 61 25.8 48.0 59 29.1 57.9 64 25.7 62.245-54 55 18.0 60.3 62 23.4 65.7 54 22.9 56.1 34 16.7 42.7 58 23.3 71.755-64 19 6.2 34.9 23 8.7 40.4 25 10.6 43.0 12 5.9 21.9 15 6.0 26.565+ 12 3.9 21.7 6 2.3 10.6 2 0.8 3.5 6 3.0 11.6 3 1.2 5.5Unknown 3 1.0 . 1 0.5 .
Subtotal 306 76.1 47.5 265 79.1 41.4 236 81.4 36.4 203 79.0 35.3 249 88.0 43.1
FEMALE
0-14 0 0.0 0.0 0 0.0 0.0 0 0.0 0.0 0 0.0 0.0 0 0.0 0.015-19 5 5.2 12.5 1 1.4 2.4 3 5.6 7.6 1 1.9 3.1 0 0.0 0.020-24 10 10.4 28.3 6 8.6 17.1 7 13.0 20.0 6 11.1 15.2 5 14.7 13.525-29 12 12.5 31.2 4 5.7 11.1 5 9.3 12.5 9 16.7 17.0 6 17.6 11.730-34 9 9.4 17.5 14 20.0 28.9 8 14.8 15.6 5 9.3 9.9 6 17.6 11.735-44 23 24.0 21.5 20 28.6 18.5 14 25.9 13.1 14 25.9 16.6 5 14.7 5.945-54 13 13.5 16.2 11 15.7 13.5 9 16.7 11.0 11 20.4 16.1 4 11.8 5.855-64 15 15.6 26.6 12 17.1 20.6 4 7.4 6.7 6 11.1 10.5 5 14.7 8.665+ 9 9.4 11.9 2 2.9 2.6 4 7.4 5.2 2 3.7 2.8 3 8.8 4.1Unknown
Subtotal 96 23.9 15.8 70 20.9 11.6 54 18.6 8.8 54 21.0 9.9 34 12.0 6.2
Total2 402 32.1 335 26.9 290 23.0 257 22.9 283 25.2
2010
Note: Cumulative percentages may not equal 100% because of rounding. Includes Transgender cases.2. Excludes cases reported as "Unknown" gender. May not equal to SPA total.
Table a5.5. Reported Late and Late Latent Syphilis1 Cases and Rates per 100,000 Population by Gender and Age, Metro Service Planning Area 4 (SPA 4), Los Angeles County, 2008-2012
2008 2009 2011 2012
1. Late and late latent syphilis is classified as late latent, latent unknown duration and late syphilis with clinical manifestations (including neurosyphilis).

Sexually Transmitted Disease Morbidity Report - 2012 V-8
No. (%) Rate No. (%) Rate No. (%) Rate No. (%) Rate No. (%) Rate
MALE
0-14 0 0.0 0.0 0 0.0 0.0 0 0.0 0.0 0 0.0 0.0 0 0.0 0.015-19 1 2.8 5.5 0 0.0 0.0 1 2.9 5.8 0 0.0 0.0 0 0.0 0.020-24 2 5.6 11.8 1 3.1 5.8 3 8.6 18.2 1 4.3 4.3 1 3.3 4.725-29 6 16.7 33.6 5 15.6 30.8 2 5.7 10.5 2 8.7 7.0 6 20.0 22.330-34 5 13.9 18.9 5 15.6 19.8 3 8.6 10.5 6 26.1 21.2 6 20.0 20.735-44 9 25.0 14.7 13 40.6 21.1 14 40.0 23.1 5 21.7 10.3 8 26.7 16.245-54 10 27.8 20.2 2 6.3 3.9 4 11.4 7.8 8 34.8 19.0 7 23.3 16.655-64 1 2.8 2.8 5 15.6 13.3 5 14.3 13.3 0 0.0 0.0 2 6.7 5.565+ 2 5.6 5.3 1 3.1 2.6 3 8.6 7.7 1 4.3 2.4 0 0.0 0.0Unknown
Subtotal 36 78.3 11.5 32 84.2 10.1 35 87.5 10.9 23 79.3 7.5 30 85.7 9.7
FEMALE
0-14 0 0.0 0.0 0 0.0 0.0 0 0.0 0.0 0 0.0 0.0 0 0.0 0.015-19 2 20.0 10.7 0 0.0 0.0 1 20.0 5.7 0 0.0 0.0 0 0.0 0.020-24 1 10.0 5.9 0 0.0 0.0 0 0.0 0.0 0 0.0 0.0 0 0.0 0.025-29 0 0.0 0.0 1 16.7 6.4 0 0.0 0.0 0 0.0 0.0 0 0.0 0.030-34 0 0.0 0.0 1 16.7 3.8 0 0.0 0.0 0 0.0 0.0 1 20.0 3.435-44 3 30.0 4.9 0 0.0 0.0 1 20.0 1.6 3 50.0 6.1 1 20.0 2.045-54 2 20.0 3.9 3 50.0 5.8 2 40.0 3.8 3 50.0 6.8 1 20.0 2.355-64 1 10.0 2.5 0 0.0 0.0 0 0.0 0.0 0 0.0 0.0 0 0.0 0.065+ 1 10.0 2.0 1 16.7 1.9 1 20.0 1.9 0 0.0 0.0 2 40.0 3.7Unknown
Subtotal 10 21.7 3.0 6 15.8 1.8 5 12.5 1.5 6 20.7 1.8 5 14.3 1.5
Total2 46 7.1 38 5.8 40 6.1 29 4.6 35 5.5
Note: Cumulative percentages may not equal 100% because of rounding.2. Excludes cases reported as "Unknown" gender. May not equal to SPA total.
Table a5.6. Reported Late and Late Latent Syphilis1 Cases and Rates per 100,000 Population by Gender and Age, West Service Planning Area 5 (SPA 5), Los Angeles County, 2008-2012
2008 2009 2011 2012
1. Late and late latent syphilis is classified as late latent, latent unknown duration and late syphilis with clinical manifestations (including neurosyphilis).
2010

Sexually Transmitted Disease Morbidity Report - 2012 V-9
No. (%) Rate No. (%) Rate No. (%) Rate No. (%) Rate No. (%) Rate
MALE
0-14 0 0.0 0.0 0 0.0 0.0 0 0.0 0.0 0 0.0 0.0 0 0.0 0.015-19 5 3.2 10.2 6 4.4 11.9 5 4.0 10.4 5 4.0 10.5 5 3.6 10.720-24 17 10.8 38.5 6 4.4 13.5 14 11.3 30.9 18 14.4 38.4 27 19.7 57.425-29 12 7.6 27.9 19 14.0 44.5 16 12.9 33.8 19 15.2 47.1 23 16.8 55.730-34 29 18.4 73.7 26 19.1 64.7 16 12.9 35.6 19 15.2 53.0 20 14.6 54.835-44 33 20.9 47.5 27 19.9 38.6 25 20.2 36.1 30 24.0 45.7 23 16.8 35.045-54 33 20.9 61.3 28 20.6 51.0 25 20.2 45.1 19 15.2 33.1 23 16.8 39.755-64 21 13.3 66.6 15 11.0 46.1 17 13.7 50.7 12 9.6 31.7 12 8.8 30.365+ 7 4.4 22.3 7 5.1 22.0 6 4.8 18.7 2 1.6 6.4 3 2.2 9.0Unknown 1 0.6 . 2 1.5 . 1 0.8 . 1 0.7 .
Subtotal 158 58.7 30.8 136 62.4 26.4 124 55.4 23.6 125 61.3 25.4 137 69.5 27.7
FEMALE
0-14 0 0.0 0.0 0 0.0 0.0 0 0.0 0.0 0 0.0 0.0 0 0.0 0.015-19 9 8.1 18.6 4 4.9 8.1 7 7.0 15.0 4 5.1 8.5 3 5.0 6.520-24 9 8.1 20.8 8 9.8 18.3 12 12.0 27.5 10 12.7 21.8 5 8.3 10.725-29 16 14.4 39.0 6 7.3 14.8 5 5.0 11.1 3 3.8 7.6 8 13.3 20.230-34 9 8.1 23.3 8 9.8 20.4 18 18.0 41.4 5 6.3 13.7 5 8.3 13.535-44 23 20.7 32.4 28 34.1 39.3 24 24.0 34.1 22 27.8 31.7 12 20.0 17.345-54 24 21.6 40.2 14 17.1 23.1 17 17.0 27.9 18 22.8 28.2 16 26.7 25.055-64 12 10.8 31.2 7 8.5 17.8 10 10.0 24.6 13 16.5 29.3 7 11.7 15.165+ 8 7.2 16.4 7 8.5 14.2 7 7.0 14.1 4 5.1 8.4 4 6.7 8.1Unknown 1 0.9 .
Subtotal 111 41.3 20.7 82 37.6 15.3 100 44.6 18.4 79 38.7 15.2 60 30.5 11.5
Total2 269 25.7 218 20.7 224 20.9 204 20.2 197 19.4
2. Excludes cases reported as "Unknown" gender. May not equal to SPA total.Note: Cumulative percentages may not equal 100% because of rounding.
1. Late and late latent syphilis is classified as late latent, latent unknown duration and late syphilis with clinical manifestations (including neurosyphilis).
Table a5.7. Reported Late and Late Latent Syphilis1 Cases and Rates per 100,000 Population by Gender and Age, South Service Planning Area 6 (SPA 6), Los Angeles County, 2008-2012
2008 2009 2011 20122010

Sexually Transmitted Disease Morbidity Report - 2012 V-10
No. (%) Rate No. (%) Rate No. (%) Rate No. (%) Rate No. (%) Rate
MALE
0-14 0 0.0 0.0 0 0.0 0.0 0 0.0 0.0 0 0.0 0.0 0 0.0 0.015-19 2 2.0 3.4 4 5.1 6.6 0 0.0 0.0 2 3.1 3.5 3 5.2 5.420-24 5 5.1 9.0 7 9.0 12.6 6 9.4 10.9 7 10.9 13.5 7 12.1 13.125-29 11 11.2 20.2 6 7.7 10.9 7 10.9 11.3 9 14.1 19.2 7 12.1 14.930-34 14 14.3 27.6 17 21.8 33.7 13 20.3 23.8 6 9.4 13.4 10 17.2 22.535-44 29 29.6 29.2 14 17.9 14.1 12 18.8 12.4 18 28.1 19.9 16 27.6 17.945-54 23 23.5 27.6 17 21.8 20.0 12 18.8 14.4 8 12.5 9.9 7 12.1 8.655-64 5 5.1 9.1 8 10.3 14.1 11 17.2 19.5 8 12.5 13.4 3 5.2 4.965+ 9 9.2 15.7 5 6.4 8.7 3 4.7 5.3 6 9.4 10.4 5 8.6 8.2Unknown
Subtotal 98 63.2 14.3 78 70.3 11.4 64 62.7 9.4 64 70.3 10.1 58 78.4 9.1
FEMALE
0-14 0 0.0 0.0 0 0.0 0.0 0 0.0 0.0 0 0.0 0.0 0 0.0 0.015-19 2 3.5 3.5 3 9.1 5.1 3 7.9 5.5 3 11.1 5.5 2 12.5 3.720-24 5 8.8 9.4 3 9.1 5.6 4 10.5 7.6 2 7.4 4.0 3 18.8 5.925-29 1 1.8 2.0 5 15.2 10.0 4 10.5 7.0 4 14.8 8.7 2 12.5 4.430-34 4 7.0 8.1 3 9.1 6.2 4 10.5 7.7 1 3.7 2.2 2 12.5 4.435-44 13 22.8 13.3 7 21.2 7.2 6 15.8 6.3 8 29.6 8.7 3 18.8 3.345-54 17 29.8 19.5 5 15.2 5.7 6 15.8 7.0 3 11.1 3.5 2 12.5 2.455-64 6 10.5 9.6 2 6.1 3.1 6 15.8 9.4 3 11.1 4.5 1 6.3 1.565+ 9 15.8 11.2 5 15.2 6.2 5 13.2 6.3 3 11.1 3.8 1 6.3 1.2Unknown
Subtotal 57 36.8 8.2 33 29.7 4.7 38 37.3 5.5 27 29.7 4.1 16 21.6 2.4
Total2 155 11.2 111 8.0 102 7.4 91 7.0 74 5.7
2. Excludes cases reported as "Unknown" gender. May not equal to SPA total.Note: Cumulative percentages may not equal 100% because of rounding.
1. Late and late latent syphilis is classified as late latent, latent unknown duration and late syphilis with clinical manifestations (including neurosyphilis).
Table a5.8. Reported Late and Late Latent Syphilis1 Cases and Rates per 100,000 Population by Gender and Age, East Service Planning Area 7 (SPA 7), Los Angeles County, 2008-2012
2008 2009 2011 20122010

Sexually Transmitted Disease Morbidity Report - 2012 V-11
No. (%) Rate No. (%) Rate No. (%) Rate No. (%) Rate No. (%) Rate
MALE
0-14 1 1.5 0.8 0 0.0 0.0 0 0.0 0.0 1 1.9 0.9 0 0.0 0.015-19 1 1.5 2.3 4 6.0 9.0 4 9.5 9.6 0 0.0 0.0 2 2.9 5.120-24 3 4.4 7.6 7 10.4 17.5 3 7.1 7.7 6 11.3 17.4 11 16.2 31.025-29 9 13.2 25.4 5 7.5 13.7 8 19.0 18.4 9 17.0 25.0 17 25.0 48.130-34 7 10.3 19.6 9 13.4 26.2 6 14.3 16.0 7 13.2 19.6 9 13.2 25.035-44 16 23.5 18.8 14 20.9 16.7 9 21.4 11.3 11 20.8 15.0 13 19.1 18.045-54 19 27.9 23.7 16 23.9 19.6 8 19.0 9.9 10 18.9 12.9 7 10.3 9.155-64 4 5.9 7.5 7 10.4 12.8 3 7.1 5.5 6 11.3 10.5 4 5.9 6.865+ 8 11.8 14.4 5 7.5 8.8 1 2.4 1.8 3 5.7 5.2 5 7.4 8.2Unknown
Subtotal 68 68.7 12.4 67 72.0 12.2 42 51.9 7.6 53 70.7 10.2 68 84.0 13.0
FEMALE
0-14 0 0.0 0.0 0 0.0 0.0 0 0.0 0.0 0 0.0 0.0 0 0.0 0.015-19 1 3.2 2.4 1 3.8 2.3 3 7.7 7.5 3 13.6 7.9 1 7.7 2.620-24 1 3.2 2.7 5 19.2 13.0 5 12.8 13.4 1 4.5 3.0 2 15.4 5.925-29 4 12.9 11.9 1 3.8 2.9 6 15.4 14.6 2 9.1 5.6 2 15.4 5.730-34 2 6.5 5.5 0 0.0 0.0 4 10.3 10.7 4 18.2 11.0 1 7.7 2.835-44 5 16.1 5.7 5 19.2 5.8 10 25.6 12.1 4 18.2 5.1 1 7.7 1.345-54 8 25.8 9.6 5 19.2 5.9 3 7.7 3.6 2 9.1 2.5 3 23.1 3.755-64 2 6.5 3.4 3 11.5 4.9 3 7.7 4.9 4 18.2 6.3 0 0.0 0.065+ 7 22.6 9.5 5 19.2 6.6 5 12.8 6.6 2 9.1 2.7 3 23.1 3.8Unknown 1 3.2 . 1 3.8 .
Subtotal 31 31.3 5.4 26 28.0 4.5 39 48.1 6.8 22 29.3 4.1 13 16.0 2.4
Total³ 99 8.8 93 8.3 81 7.2 75 7.1 81 7.6
2. Excludes cases from Long Beach.
2010
Note: Cumulative percentages may not equal 100% because of rounding.
Table a5.9. Reported Late and Late Latent Syphilis1 Cases and Rates per 100,000 Population by Gender and Age, South Bay Service Planning Area 8 (SPA 8), Los Angeles County, 2008-2012
2008 2009 2011 2012
1. Late and late latent syphilis is classified as late latent, latent unknown duration and late syphilis with clinical manifestations (including neurosyphilis).3. Excludes cases reported as "Unknown" gender. May not equal to SPA total.

Sexually Transmitted Disease Morbidity Report - 2012 V-12
Adj. Adj. Adj. Adj.No. (%) Rate No. (%) Rate No. (%) Rate No. (%) Rate No. (%) Rate
MALE
2008 3 11.1 3.8 8 29.6 33.1 14 51.9 21.7 1 3.7 15.6 27 73.0 14.82009 1 6.3 1.4 6 37.5 26.2 7 43.8 10.9 0 0.0 0.0 16 64.0 8.72010 2 11.1 3.3 4 22.2 19.6 7 38.9 11.8 0 0.0 0.0 18 75.0 9.62011 6 33.3 10.7 4 22.2 16.7 3 16.7 4.3 1 5.6 17.4 18 66.7 9.42012 4 26.7 5.8 4 26.7 13.5 7 46.7 8.1 0 0.0 0.0 15 75.0 7.8
FEMALE
2008 1 10.0 1.3 7 70.0 30.5 1 10.0 1.7 0 0.0 0.0 10 27.0 5.52009 3 33.3 4.2 2 22.2 8.5 3 33.3 4.8 0 0.0 0.0 9 36.0 4.92010 0 0.0 0.0 5 83.3 19.2 1 16.7 1.4 0 0.0 0.0 6 25.0 3.22011 2 22.2 2.9 4 44.4 12.7 2 22.2 2.3 0 0.0 0.0 9 33.3 4.62012 1 20.0 1.5 4 80.0 12.6 0 0.0 0.0 0 0.0 0.0 5 25.0 2.6
Note: If race/ethnicity was not specified, cases were prorated according to the distribution of cases for which race/ethnicity was specified. Rates were adjusted including the prorated cases. Therefore, these tables should be used only for race/ethnicity comparisons, not for overall totals or gender totals. Cumulative percentages may not
Table a5.10. Reported Late and Late Latent Syphilis1 Cases and Rates per 100,000 Population by Gender and Race/Ethnicity, Antelope Valley Service Planning Area 1 (SPA 1), Los Angeles County, 2008-2012
White Black Latino Asian-Pacific Total2
1. Late and late latent syphilis is classified as late latent, latent unknown duration and late syphilis with clinical manifestations (including neurosyphilis).2. Includes Native Americans and cases reported as "Mixed/Other/Unknown" race/ethnicity. Excludes cases reported with "Other/Unknown" gender. May not add up to SPA total.
equal 100% because of rounding.

Sexually Transmitted Disease Morbidity Report - 2012 V-13
Adj. Adj. Adj. Adj.No. (%) Rate No. (%) Rate No. (%) Rate No. (%) Rate No. (%) Rate
MALE
2008 33 22.6 7.5 9 6.2 27.0 75 51.4 20.3 3 2.1 3.2 146 61.1 13.42009 20 20.2 4.3 1 1.0 2.9 58 58.6 15.0 5 5.1 5.1 99 61.9 9.02010 26 25.7 5.6 9 8.9 24.7 51 50.5 12.6 5 5.0 4.8 101 66.0 9.12011 28 25.2 6.2 10 9.0 27.9 60 54.1 15.4 3 2.7 2.9 111 75.0 10.52012 27 22.3 6.0 18 14.9 49.6 58 47.9 14.6 5 4.1 4.8 121 81.2 11.4
FEMALE
2008 8 8.6 1.8 3 3.2 9.5 58 62.4 16.6 5 5.4 4.9 93 38.9 8.52009 7 11.5 1.6 2 3.3 6.1 39 63.9 10.7 2 3.3 1.9 61 38.1 5.52010 5 9.6 1.0 4 7.7 11.2 36 69.2 9.1 2 3.9 1.7 52 34.0 4.72011 4 10.8 0.9 1 2.7 3.0 27 73.0 7.0 2 5.4 1.7 37 25.0 3.42012 2 7.1 0.5 1 3.6 3.2 17 60.7 4.7 3 10.7 2.7 28 18.8 2.6
Note: If race/ethnicity was not specified, cases were prorated according to the distribution of cases for which race/ethnicity was specified. Rates were adjusted including the prorated cases. Therefore, these tables should be used only for race/ethnicity comparisons, not for overall totals or gender totals. Cumulative percentages may not
2. Includes Native Americans and cases reported as "Mixed/Other/Unknown" race/ethnicity. Excludes cases reported with "Other/Unknown" gender. May not add up to SPA total.
equal 100% because of rounding.
1. Late and late latent syphilis is classified as late latent, latent unknown duration and late syphilis with clinical manifestations (including neurosyphilis).
Table a5.11. Reported Late and Late Latent Syphilis1 Cases and Rates per 100,000 Population by Gender and Race/Ethnicity, San Fernando Service Planning Area 2 (SPA 2), Los Angeles County, 2008-2012
White Black Latino Asian-Pacific Total2

Sexually Transmitted Disease Morbidity Report - 2012 V-14
Adj. Adj. Adj. Adj.No. (%) Rate No. (%) Rate No. (%) Rate No. (%) Rate No. (%) Rate
MALE
2008 10 11.9 5.1 6 7.1 20.6 54 64.3 13.9 12 14.3 5.7 84 61.8 9.92009 8 12.9 4.1 2 3.2 7.0 42 67.7 10.7 8 12.9 3.7 62 60.8 7.32010 4 5.9 2.1 4 5.9 14.1 46 67.7 11.7 12 17.7 5.5 68 70.1 8.02011 7 10.1 4.7 4 5.8 17.5 40 58.0 11.4 12 17.4 5.7 69 73.4 8.82012 8 12.5 5.1 6 9.4 24.8 37 57.8 9.9 12 18.8 5.4 64 74.4 8.1
FEMALE
2008 5 9.6 2.5 3 5.8 9.5 29 55.8 7.5 12 23.1 5.3 52 38.2 5.92009 3 7.5 1.5 1 2.5 3.2 30 75.0 7.6 5 12.5 2.2 40 39.2 4.52010 1 3.5 0.5 0 0.0 0.0 14 48.3 3.5 14 48.3 5.8 29 29.9 3.32011 1 4.0 0.6 1 4.0 3.8 13 52.0 3.4 10 40.0 4.1 25 26.6 3.02012 0 0.0 0.0 3 13.6 11.4 5 22.7 1.3 14 63.6 5.7 22 25.6 2.7
2. Excludes cases from Pasadena.
Note: If race/ethnicity was not specified, cases were prorated according to the distribution of cases for which race/ethnicity was specified. Rates were adjusted including the prorated cases. Therefore, these tables should be used only for race/ethnicity comparisons, not for overall totals or gender totals. Cumulative percentages may not
3. Includes Native Americans and cases reported as "Mixed/Other/Unknown" race/ethnicity. Excludes cases reported with "Other/Unknown" gender. May not add up to SPA total
equal 100% because of rounding.
1. Late and late latent syphilis is classified as late latent, latent unknown duration and late syphilis with clinical manifestations (including neurosyphilis).
Table a5.12. Reported Late and Late Latent Syphilis1 Cases and Rates per 100,000 Population by Gender andRace/Ethnicity, San Gabriel Service Planning Area 3 (SPA 3), Los Angeles County, 2008-2012
White Black Latino Asian-Pacific Total2,3

Sexually Transmitted Disease Morbidity Report - 2012 V-15
Adj. Adj. Adj. Adj.No. (%) Rate No. (%) Rate No. (%) Rate No. (%) Rate No. (%) Rate
MALE
2008 77 25.2 58.5 39 12.8 113.7 152 49.7 46.6 4 1.3 4.5 306 76.1 47.52009 70 26.4 51.1 38 14.3 108.1 122 46.0 37.7 10 3.8 11.2 265 79.1 41.42010 52 22.0 35.9 20 8.5 54.2 143 60.6 41.2 11 4.7 11.5 236 81.4 36.42011 66 32.5 44.5 28 13.8 84.0 93 45.8 31.8 9 4.4 10.0 203 79.0 35.32012 79 31.7 56.0 27 10.8 85.6 113 45.4 40.5 10 4.0 11.7 249 88.0 43.1
FEMALE
2008 9 9.4 8.3 8 8.3 27.6 57 59.4 19.6 5 5.2 5.4 96 23.9 15.82009 5 7.1 4.1 7 10.0 22.1 44 62.9 14.2 9 12.9 9.0 70 20.9 11.62010 4 7.4 3.2 2 3.7 6.1 41 75.9 12.7 5 9.3 4.7 54 18.6 8.82011 4 7.4 3.4 6 11.1 24.3 35 64.8 13.7 4 7.4 4.1 54 21.0 9.92012 1 2.9 0.8 6 17.7 24.3 21 61.8 8.1 3 8.8 3.1 34 12.0 6.2
Note: If race/ethnicity was not specified, cases were prorated according to the distribution of cases for which race/ethnicity was specified. Rates were adjusted including the prorated cases. Therefore, these tables should be used only for race/ethnicity comparisons, not for overall totals or gender totals. Cumulative percentages may not equal 100% because of rounding.
Table a5.13. Reported Late and Late Latent Syphilis1 Cases and Rates per 100,000 Population by Gender and Race/Ethnicity, Metro Service Planning Area 4 (SPA 4), Los Angeles County, 2008-2012
White Black Latino Asian-Pacific Total2
1. Late and late latent syphilis is classified as late latent, latent unknown duration and late syphilis with clinical manifestations (including neurosyphilis).2. Includes Native Americans and cases reported as "Mixed/Other/Unknown" race/ethnicity. Excludes cases reported with "Other/Unknown" gender. May not add up to SPA total.
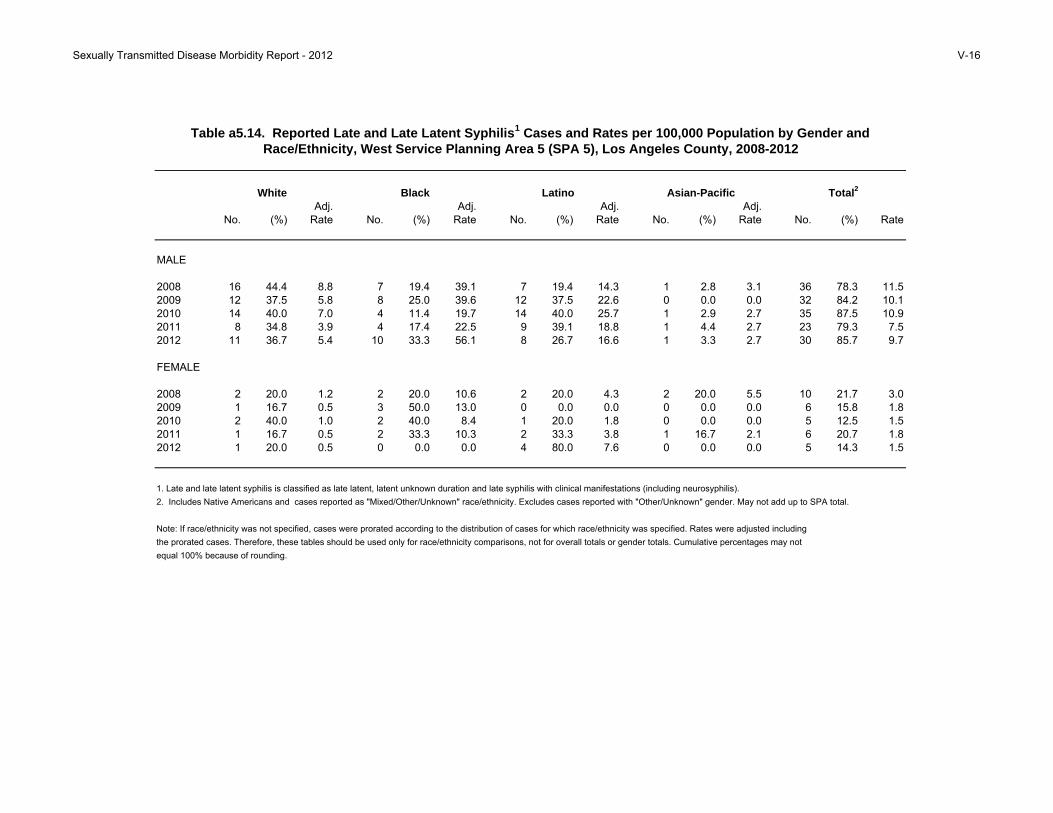
Sexually Transmitted Disease Morbidity Report - 2012 V-16
Adj. Adj. Adj. Adj.No. (%) Rate No. (%) Rate No. (%) Rate No. (%) Rate No. (%) Rate
MALE
2008 16 44.4 8.8 7 19.4 39.1 7 19.4 14.3 1 2.8 3.1 36 78.3 11.52009 12 37.5 5.8 8 25.0 39.6 12 37.5 22.6 0 0.0 0.0 32 84.2 10.12010 14 40.0 7.0 4 11.4 19.7 14 40.0 25.7 1 2.9 2.7 35 87.5 10.92011 8 34.8 3.9 4 17.4 22.5 9 39.1 18.8 1 4.4 2.7 23 79.3 7.52012 11 36.7 5.4 10 33.3 56.1 8 26.7 16.6 1 3.3 2.7 30 85.7 9.7
FEMALE
2008 2 20.0 1.2 2 20.0 10.6 2 20.0 4.3 2 20.0 5.5 10 21.7 3.02009 1 16.7 0.5 3 50.0 13.0 0 0.0 0.0 0 0.0 0.0 6 15.8 1.82010 2 40.0 1.0 2 40.0 8.4 1 20.0 1.8 0 0.0 0.0 5 12.5 1.52011 1 16.7 0.5 2 33.3 10.3 2 33.3 3.8 1 16.7 2.1 6 20.7 1.82012 1 20.0 0.5 0 0.0 0.0 4 80.0 7.6 0 0.0 0.0 5 14.3 1.5
Note: If race/ethnicity was not specified, cases were prorated according to the distribution of cases for which race/ethnicity was specified. Rates were adjusted including the prorated cases. Therefore, these tables should be used only for race/ethnicity comparisons, not for overall totals or gender totals. Cumulative percentages may not
Total2
1. Late and late latent syphilis is classified as late latent, latent unknown duration and late syphilis with clinical manifestations (including neurosyphilis).2. Includes Native Americans and cases reported as "Mixed/Other/Unknown" race/ethnicity. Excludes cases reported with "Other/Unknown" gender. May not add up to SPA total.
equal 100% because of rounding.
Table a5.14. Reported Late and Late Latent Syphilis1 Cases and Rates per 100,000 Population by Gender and Race/Ethnicity, West Service Planning Area 5 (SPA 5), Los Angeles County, 2008-2012
White Black Latino Asian-Pacific

Sexually Transmitted Disease Morbidity Report - 2012 V-17
Adj. Adj. Adj. Adj.No. (%) Rate No. (%) Rate No. (%) Rate No. (%) Rate No. (%) Rate
MALE
2008 9 5.7 77.5 55 34.8 41.1 76 48.1 24.8 0 0.0 0.0 158 58.7 30.82009 5 3.7 41.8 43 31.6 32.5 70 51.5 22.8 1 0.7 12.6 136 62.4 26.42010 3 2.4 22.0 42 33.9 29.1 76 61.3 22.0 0 0.0 0.0 124 55.4 23.62011 6 4.8 50.1 48 38.4 39.4 65 52.0 19.7 1 0.8 11.8 125 61.3 25.42012 6 4.4 50.3 55 40.2 45.0 67 48.9 20.0 4 2.9 47.2 137 69.5 27.7
FEMALE
2008 2 1.8 17.4 43 38.7 24.9 57 51.4 18.9 0 0.0 0.0 111 41.3 20.72009 2 2.4 16.7 30 36.6 17.2 43 52.4 13.9 1 1.2 10.8 82 37.6 15.32010 3 3.0 24.2 34 34.0 19.9 55 55.0 17.7 0 0.0 0.0 100 44.6 18.42011 2 2.5 17.9 24 30.4 16.3 45 57.0 14.6 1 1.3 11.4 79 38.7 15.22012 4 6.7 34.1 19 31.7 12.3 33 55.0 10.0 2 3.3 21.7 60 30.5 11.5
Note: If race/ethnicity was not specified, cases were prorated according to the distribution of cases for which race/ethnicity was specified. Rates were adjusted including the prorated cases. Therefore, these tables should be used only for race/ethnicity comparisons, not for overall totals or gender totals. Cumulative percentages may not
2. Includes Native Americans and cases reported as "Mixed/Other/Unknown" race/ethnicity. Excludes cases reported with "Other/Unknown" gender. May not add up to SPA total.
equal 100% because of rounding.
1. Late and late latent syphilis is classified as late latent, latent unknown duration and late syphilis with clinical manifestations (including neurosyphilis).
Table a5.15. Reported Late and Late Latent Syphilis1 Cases and Rates per 100,000 Population by Gender and Race/Ethnicity, South Service Planning Area 6 (SPA 6), Los Angeles County, 2008-2012
White Black Latino Asian-Pacific Total2

Sexually Transmitted Disease Morbidity Report - 2012 V-18
Adj. Adj. Adj. Adj.No. (%) Rate No. (%) Rate No. (%) Rate No. (%) Rate No. (%) Rate
MALE
2008 13 13.3 11.8 4 4.1 24.1 69 70.4 15.2 4 4.1 7.4 98 63.2 14.32009 8 10.3 7.4 2 2.6 11.9 60 76.9 13.0 2 2.6 3.6 78 70.3 11.42010 5 7.8 4.6 1 1.6 5.7 54 84.4 11.1 2 3.1 3.4 64 62.7 9.42011 5 7.8 5.5 1 1.6 5.5 57 89.1 12.4 0 0.0 0.0 64 70.3 10.12012 10 17.2 11.3 5 8.6 28.3 36 62.1 8.1 4 6.9 7.6 58 78.4 9.1
FEMALE
2008 5 8.8 4.9 2 3.5 12.4 37 64.9 9.0 2 3.5 3.8 57 36.8 8.22009 2 6.1 1.8 2 6.1 11.0 27 81.8 5.8 0 0.0 0.0 33 29.7 4.72010 3 7.9 2.7 2 5.3 11.1 31 81.6 6.6 0 0.0 0.0 38 37.3 5.52011 5 18.5 5.4 0 0.0 0.0 21 77.8 4.5 0 0.0 0.0 27 29.7 4.12012 2 12.5 2.2 2 12.5 10.6 10 62.5 2.2 1 6.3 1.7 16 21.6 2.4
Note: If race/ethnicity was not specified, cases were prorated according to the distribution of cases for which race/ethnicity was specified. Rates were adjusted including the prorated cases. Therefore, these tables should be used only for race/ethnicity comparisons, not for overall totals or gender totals. Cumulative percentages may not
2. Includes Native Americans and cases reported as "Mixed/Other/Unknown" race/ethnicity. Excludes cases reported with "Other/Unknown" gender. May not add up to SPA total.
equal 100% because of rounding.
1. Late and late latent syphilis is classified as late latent, latent unknown duration and late syphilis with clinical manifestations (including neurosyphilis).
Table a5.16. Reported Late and Late Latent Syphilis1 Cases and Rates per 100,000 Population by Gender and Race/Ethnicity, East Service Planning Area 7 (SPA 7), Los Angeles County, 2008-2012
White Black Latino Asian-Pacific Total2

Sexually Transmitted Disease Morbidity Report - 2012 V-19
Adj. Adj. Adj. Adj.No. (%) Rate No. (%) Rate No. (%) Rate No. (%) Rate No. (%) Rate
MALE
2008 5 7.4 3.1 32 47.1 43.4 22 32.4 11.1 4 5.9 5.3 68 68.7 12.42009 5 7.5 3.2 22 32.8 31.1 28 41.8 14.6 2 3.0 2.7 67 72.0 12.22010 3 7.1 1.8 13 31.0 16.4 23 54.8 10.6 3 7.1 3.6 42 51.9 7.62011 10 18.9 6.6 17 32.1 24.1 20 37.7 10.0 3 5.7 3.9 53 70.7 10.22012 9 13.2 6.2 30 44.1 43.9 20 29.4 10.3 3 4.4 4.0 68 84.0 13.0
FEMALE
2008 2 6.5 1.4 8 25.8 9.9 12 38.7 6.9 2 6.5 2.7 31 31.3 5.42009 0 0.0 0.0 7 26.9 8.4 11 42.3 6.0 3 11.5 3.9 26 28.0 4.52010 1 2.6 0.6 14 35.9 15.3 20 51.3 9.9 1 2.6 1.2 39 48.1 6.82011 1 4.6 0.7 6 27.3 7.0 8 36.4 4.0 6 27.3 6.8 22 29.3 4.12012 1 7.7 0.8 4 30.8 5.2 6 46.2 3.3 0 0.0 0.0 13 16.0 2.4
Note: If race/ethnicity was not specified, cases were prorated according to the distribution of cases for which race/ethnicity was specified. Rates were adjusted including the prorated cases. Therefore, these tables should be used only for race/ethnicity comparisons, not for overall totals or gender totals. Cumulative percentages may not
Table a5.17. Reported Late and Late Latent Syphilis1 Cases and Rates per 100,000 Population by Gender and Race/Ethnicity, South Bay Service Planning Area 8 (SPA 8), Los Angeles County, 2008-2012
White Black Latino Asian-Pacific Total2,3
equal 100% because of rounding.
1. Late and late latent syphilis is classified as late latent, latent unknown duration and late syphilis with clinical manifestations (including neurosyphilis).2. Excludes cases from Long Beach.3. Includes Native Americans and cases reported as "Mixed/Other/Unknown" race/ethnicity. Excludes cases reported with "Other/Unknown" gender. May not add up to SPA total.

Addendum VI:
Congenital Syphilis

Sexually Transmitted Disease Morbidity Report - 2012 VI-1
No. (%) Rate No. (%) Rate No. (%) Rate No. (%) Rate No. (%) Rate
SPA2/HD3
Antelope Valley (1) 1 7.1 16.4 1 7.1 17.1 2 14.3 34.2 2 33.3 37.4 0 0.0 0.0 Antelope Valley 1 7.1 16.4 1 7.1 17.1 2 14.3 34.2 2 33.3 37.4 0 0.0 0.0
East (7) 2 14.3 9.6 3 21.4 15.2 2 14.3 10.1 1 16.7 5.6 0 0.0 0.0 Bellflower 0 0.0 0.0 1 7.1 20.9 0 0.0 0.0 0 0.0 0.0 0 0.0 0.0 East Los Angeles 0 0.0 0.0 0 0.0 0.0 0 0.0 0.0 1 16.7 32.7 0 0.0 0.0 San Antonio 1 7.1 13.0 2 14.3 27.7 2 14.3 27.7 0 0.0 0.0 0 0.0 0.0 Whittier 1 7.1 22.1 0 0.0 0.0 0 0.0 0.0 0 0.0 0.0 0 0.0 0.0
Metro (4) 5 35.7 31.2 2 14.3 19.0 1 7.1 9.5 1 16.7 7.2 1 16.7 7.4 Central 2 14.3 60.0 1 7.1 21.1 0 0.0 0.0 0 0.0 0.0 0 0.0 0.0 Hollywood-Wilshire 2 14.3 27.3 1 7.1 17.7 1 7.1 17.7 0 0.0 0.0 0 0.0 0.0 Northeast 1 7.1 18.6 0 0.0 0.0 0 0.0 0.0 1 16.7 23.1 1 16.7 24.5
San Fernando (2) 1 7.1 3.5 1 7.1 3.7 1 7.1 3.7 5 83.3 20.1 0 0.0 0.0 East Valley 0 0.0 0.0 1 7.1 16.1 0 0.0 0.0 0 0.0 0.0 0 0.0 0.0 Glendale 0 0.0 0.0 0 0.0 0.0 0 0.0 0.0 1 16.7 30.9 0 0.0 0.0 San Fernando 1 7.1 15.1 0 0.0 0.0 0 0.0 0.0 1 16.7 18.5 0 0.0 0.0 West Valley 0 0.0 0.0 0 0.0 0.0 1 7.1 8.8 3 50.0 28.7 0 0.0 0.0
San Gabriel (3) 2 14.3 8.4 1 7.1 4.7 0 0.0 0.0 1 16.7 5.1 1 16.7 4.5 Alhambra 0 0.0 0.0 0 0.0 0.0 0 0.0 0.0 0 0.0 0.0 0 0.0 0.0 El Monte 1 7.1 13.4 0 0.0 0.0 0 0.0 0.0 1 16.7 15.0 0 0.0 0.0 Foothill 0 0.0 0.0 0 0.0 0.0 0 0.0 0.0 0 0.0 0.0 1 16.7 28.5 Pomona 1 7.1 13.3 1 7.1 14.9 0 0.0 0.0 0 0.0 0.0 0 0.0 0.0
South (6) 5 35.7 22.3 5 35.7 22.3 2 14.3 8.9 4 66.7 22.6 4 66.7 23.3 Compton 0 0.0 0.0 1 7.1 17.6 1 7.1 17.6 0 0.0 0.0 0 0.0 0.0 South 2 14.3 35.6 1 7.1 24.3 1 7.1 24.3 1 16.7 26.0 3 50.0 82.4 Southeast 3 21.4 73.0 2 14.3 49.9 0 0.0 0.0 2 33.3 55.8 0 0.0 0.0 Southwest 0 0.0 0.0 1 7.1 17.0 0 0.0 0.0 1 16.7 19.0 1 16.7 19.5
South Bay (8) 3 21.4 21.3 1 7.1 6.9 0 0.0 0.0 0 0.0 0.0 0 0.0 0.0 Harbor 0 0.0 0.0 1 7.1 37.9 0 0.0 0.0 0 0.0 0.0 0 0.0 0.0 Inglewood 2 14.3 32.8 0 0.0 0.0 0 0.0 0.0 0 0.0 0.0 0 0.0 0.0 Torrance 1 7.1 18.7 0 0.0 0.0 0 0.0 0.0 0 0.0 0.0 0 0.0 0.0 West (5) 0 0.0 0.0 0 0.0 0.0 0 0.0 0.0 0 0.0 0.0 0 0.0 0.0 West 0 0.0 0.0 0.0 0.0 0 0.0 0.0 0 0.0 0.0 0 0.0 0.0
Unknown4 1 7.1 ----- 1 7.1 ----- 0 0.0 ----- 0 0.0 ----- 0 0.0 -----
Total 20 14.0 15 11.5 8 6.1 14 11.5 6 4.9
1. Excludes cases from Pasadena (SPA 3) and Long Beach (SPA 8).2. Main categories.3. Subcategories.4. Corresponds to cases of unknown HD but not necessarily unknown SPA.Live birth data courtesy of L.A. County Office of Health Assessment and Epidemiology. Note: Cumulative percentages may not equal 100% because of rounding.
Table a6.1. Reported Presumptive Congenital Syphilis Cases and Rates per 100,000 Live Births by Service Planning Area (SPA)1 and Health District (HD), Los Angeles County, 2008-2012
2008 2009 2010 2011 2012

Addendum VII:
All Pelvic Inflammatory Disease

Sexually Transmitted Disease Morbidity Report - 2012 VII-1
No. (%) Rate No. (%) Rate No. (%) Rate No. (%) Rate No. (%) Rate
SPA3/HD4
Antelope Valley (1) 15 7.5 8.2 14 8.0 7.6 9 4.4 4.9 27 12.7 13.9 21 9.3 10.8 Antelope Valley 15 7.5 8.2 14 8.0 7.6 9 4.4 4.9 27 12.7 13.9 21 9.3 10.8
East (7) 15 7.5 2.1 12 6.9 6.4 16 7.8 8.5 22 10.4 3.3 20 8.9 3.0 Bellflower 8 4.0 4.2 6 3.4 5.4 5 2.4 4.6 4 1.9 2.2 4 1.8 2.2 East Los Angeles 1 0.5 0.9 1 0.6 0.4 4 2.0 1.8 2 0.9 1.9 5 2.2 4.8 San Antonio 3 1.5 1.3 5 2.9 2.9 5 2.4 2.9 11 5.2 5.2 5 2.2 2.3 Whittier 3 1.5 1.8 0 0.0 0.0 2 1.0 0.3 5 2.4 3.1 6 2.7 3.7
Metro (4) 16 8.0 2.6 18 10.3 6.9 24 11.7 9.1 20 9.4 3.7 23 10.2 4.2 Central 4 2.0 2.3 3 1.7 1.7 7 3.4 4.0 3 1.4 1.9 6 2.7 3.8 Hollywood-Wilshire 6 3.0 2.3 6 3.4 0.5 7 3.4 0.6 12 5.7 5.1 13 5.8 5.5 Northeast 6 3.0 3.4 9 5.2 3.9 10 4.9 4.3 5 2.4 3.3 4 1.8 2.6
San Fernando (2) 41 20.6 3.7 49 28.2 20.7 46 22.4 19.3 36 17.0 3.3 43 19.0 4.0 East Valley 13 6.5 5.7 19 10.9 4.1 19 9.3 4.2 9 4.3 4.1 9 4.0 4.1 Glendale 6 3.0 3.3 5 2.9 0.6 3 1.5 0.3 1 0.5 0.6 6 2.7 3.4 San Fernando 13 6.5 5.6 16 9.2 8.5 3 1.5 1.6 9 4.3 3.6 12 5.3 4.8 West Valley 9 4.5 2.0 9 5.2 3.7 21 10.2 8.7 17 8.0 3.9 16 7.1 3.7
San Gabriel (3) 18 9.0 2.0 16 9.2 5.5 13 6.3 4.5 25 11.8 3.0 34 15.0 4.1 Alhambra 5 2.5 2.7 2 1.1 0.4 1 0.5 0.2 4 1.9 2.2 3 1.3 1.7 El Monte 3 1.5 1.2 4 2.3 2.7 6 2.9 4.1 8 3.8 3.7 13 5.8 5.9 Foothill 4 2.0 2.5 4 2.3 4.0 2 1.0 2.0 3 1.4 1.9 3 1.3 1.9 Pomona 6 3.0 2.1 6 3.4 6.6 4 2.0 4.4 10 4.7 3.7 15 6.6 5.5
South (6) 54 27.1 10.0 38 21.8 6.6 52 25.4 9.1 49 23.1 9.5 37 16.4 7.1 Compton 10 5.0 6.8 6 3.4 5.5 10 4.9 9.3 11 5.2 7.6 4 1.8 2.8 South 12 6.0 12.6 6 3.4 2.7 10 4.9 4.5 12 5.7 12.5 8 3.5 8.2 Southeast 9 4.5 10.2 10 5.7 4.2 12 5.9 5.0 5 2.7 6.0 4 1.8 4.7 Southwest 23 11.6 11.4 16 9.2 4.8 20 9.8 5.9 21 9.9 10.8 21 9.3 10.7
South Bay (8) 23 11.6 4.0 13 7.5 11.6 32 15.6 11.6 19 9.0 3.5 28 12.4 5.1 Harbor 2 1.0 1.9 2 1.1 2.2 6 2.9 2.2 6 2.8 5.9 13 5.8 12.7 Inglewood 19 9.5 8.5 5 2.9 4.5 19 9.3 4.5 8 3.8 3.8 12 5.3 5.7 Torrance 2 1.0 0.8 6 3.4 4.9 7 3.4 4.8 5 2.4 2.2 3 1.3 1.3 West (5) 13 6.5 3.9 10 5.7 6.8 10 4.9 6.9 8 3.8 2.4 14 6.2 4.2 West 13 6.5 3.9 10 5.7 6.8 10 4.9 6.9 8 3.8 2.4 14 6.2 4.2
Unknown 4 2.0 . 4 2.3 . 3 1.5 . 6 2.8 . 6 2.7 .
Total 199 4.0 174 3.5 205 4.1 212 4.5 226 4.8
1. Includes chlamydial PID, gonococcal PID, and non-chlamydial/non-gonococcal PID.2. Excludes cases from Pasadena (SPA 3) and Long Beach (SPA 8).3. Main categories.4. Subcategories.Note: Cumulative percentages may not equal 100% because of rounding.
Table a7.1. Reported All Pelvic Inflammatory Disease (PID)1 Cases and Rates per 100,000 Female Population by Service Planning Area (SPA)2 and Health District (HD),
Los Angeles County, 2008-2012
2011 20122008 2009 2010

Addendum VIII:
Technical Notes and Appendices

Sexually Transmitted Disease Morbidity Report – 2012 VIII-1
TECHNICAL NOTES Data Sources: Data on sexually transmitted disease (STD) in LAC are obtained through passive and active surveillance, and stored in CaseWatch, a case management and surveillance system. California law requires that positive laboratory results of STDs and clinically identified suspected cases be reported to local health departments. Suspected and confirmed STD cases are reported confidentially to the California Department of Health Services and the Centers for Disease Control and Prevention (CDC) as required by California Code of Regulations (Section 2500 and Section 2505).
1. The STD case definitions are based on the CDC Sexually Transmitted Disease Surveillance 2011 at: http://www.cdc.gov/std/stats11/app-casedef.htm.
2. Passive surveillance relies on physicians, laboratories, and other healthcare providers to report STDs to the Department of Public Health (DPH) by submitting the Confidential Morbidity Report (CMR) form by telephone, fax, or online.
3. Active surveillance entails STD staff regularly contacting hospitals, laboratories, physicians, and other health providers in an effort to identify all cases of a given STD. In addition, STD staff contact schools, hospitals, jails, student health centers, and sentinel physicians and clinics to collect reports of STDs.
4. CaseWatch is an open system for ongoing data collection and updating. With a base of live data, the results of this report were snapshots of the CaseWatch System in September, 2013, the time the report was prepared. Therefore, the impact of reporting updates must be considered.
5. The population data were prepared by Walter R. McDonald & Associates, Inc. (WRMA) for Internal Service Department, County of Los Angeles and released by the Office of Health Assessment and Epidemiology, Los Angeles County Department of Public Health. The new birth population data were obtained from the Office of Health Assessment and Epidemiology, Los Angeles County Department of Public Health. The cover page images were from CDC Public Health Image Library.
Data Codes: The table below lists the SAS coding for the CaseWatch data that define each STD and related demographics in this report:
Subject SAS Code Interpretation Diagnosis Year (DYEAR) If DYEAR in
2008, 2009, 2010, 2011, 2012)
Years based on CDC calendar.
Chlamydia All Sub-datasets from ‘CT2008’ to ‘CT2012’. Gonorrhea All Sub-datasets from ‘GC2008’ to ‘GC2012’. Syphilis (Primary and Secondary)
If DIAGNOS in (2, 3, 56*3, 3*56)
Sub-datasets from ‘SY2008’ to ‘SY2012’: 2=”Primary (421)”; 3=”Secondary (422)”; 56=”Neurosyphilis (770)”.
Syphilis (Early Latent)
If DIAGNOS in (4, 56*4, 4*56)
Sub-datasets from ‘SY2008’ to ‘SY2012’: 4=”Early Latent (423)”; 56=”Neurosyphilis (770)”.
Syphilis (Late and Late Latent)
If DIAGNOS in (1, 6, 14, 16, 17, 55, 56*6, 6*56, 55*56, 56*55)
Sub-datasets from ‘SY2008’ to ‘SY2012’: 1=”Type Not Specified”; 6=”Late Latent (424)”; 14=”Neurosyphilis-Late Sympotomatic (426)”; 16=”Benign Late Symptomatic (427)”; 17=”Other-Late Symptomatic (427)”;

Sexually Transmitted Disease Morbidity Report – 2012 VIII-2
55=”Latent Unknown Duration (488)”; 56=”Neurosyphilis (770)”.
Congenital Syphilis If DIAGNOS in (10)
Sub-datasets from ‘SY2008’ to ‘SY2012’: 10=”Congenital-Presumptive (436)”;
Pelvic Inflammatory Disease (PID, including Chlamydial, Non-Chlamydial, Gonococcal and NonGonococcal.)
If DIAGNOS in (30, 38); Plus all from sub-datasets PID2007 to PID20011
Sub-datasets from ‘CT2008’ to ‘CT2012’: 30=”Chlamydial PID”; Sub-datasets from ‘GC2008’ to ‘GC2012’: 38=”Gonococcal PID”; Sub-datasets from PID2008 to PID2012.
Incident of EPI Treated (MORB)
If MORB='N' Then delete;
All datasets: Excluding those CT and GC cases with EPI treated.
Age Group (AGENUM) If AGENUM in (missing, 0, 1, 2, ….)
All datasets: 0<=AGENUM<=14 means ”0-14 years old”; 15<=AGENUM<=19 means ”15-19 years old”; 20<=AGENUM<=24 means ”20-24 years old”; 25<=AGENUM<=29 means ”25-29 years old”; 30<=AGENUM<=34 means ”30-34 years old”; 35<=AGENUM<=44 means ”35-44 years old”; 45<=AGENUM<=54 means ”45-54 years old”; 55<=AGENUM<=64 means ”55-64 years old”; 65<=AGENUM<=115 means ”65+ years old”; 116<=AGENUM, missing means ”Unknown”.
Gender (CWSEX) If CWSEX in (1, 2, 7, 9)
All datasets: 1, 9=”Male”; 2, 7=”Female”.
Race/Ethnicity (ETHNIC) If ETHNIC in (1, 2, 3, 4, 5, 6, 7, 8, 9)
All datasets: 1=”White”; 2=”Black” ; 7=”Hispanic”; 3, 8=”Asian/Pacific Islander”; 4, 5, 9=”Other”; 6=”Unknown”.
Service Planning Area (SPA)
If SPA in (1, 2, 3, 4, 5, 6, 7, 8, 9)
All datasets: 1=”Antelope Valley”; 2=”San Fernando Valley”; 3=”San Gabriel”; 4=”Metro”; 5=”West”; 6=”South”; 7=”East”; 8=”South Bay”; 9=”Unknown”.
Health District (RES) If RES in (‘016’,’025’) then delete;
All datasets: Excluding Long Beach and Pasadena. '000' ='Antelope Valley'; '001'='Alhambra'; '002' ='Central'; '003' ='East LA'; '004' ='El Monte'; '005' ='Foothill'; '006' ='Northeast'; '007' ='Pomona';

Sexually Transmitted Disease Morbidity Report – 2012 VIII-3
'008' ='Whittier'; '009' ='East Valley'; '010' ='Glendale'; '011' ='Hollywood Wilshire'; '012' ='San Fernando'; '013' ='West Valley'; '014' ='Bellflower'; '015' ='Compton'; '017' ='San Antonio'; '018' ='South'; '019' ='Southeast'; '020' ='Harbor'; '021' ='Inglewood'; '022' ='Southwest'; '023' ='Torrance'; '024' ='West'.
L.A. County Jurisdiction (LAMORB) and/or Out of Jurisdiction (OOJYN)
If LAMORB=2 or (LAMORB=. and OOJYN='Y') or (LAMORB=0 and OOJYN='Y') or (LAMORB=9 and OOJYN='Y') Then delete;
All datasets: Excluding those cases not in L.A. county jurisdiction.
EPI treat cases prior to diagnosis
If MORB=’N’ Then delete;
All datasets: Excluding those EPI treatment cases.
Data Limitations: The data tables in the STD Annual Morbidity Report should be interpreted considering the following notable limitations: 1. Underreporting. The proportion of cases that are not reported varies for each disease. Syphilis surveillance includes both passive and active surveillance, with detailed follow-up of cases and their sexual partners. Thus, underreporting of early syphilis cases is minimized. Due to the acuteness of symptoms for gonorrhea infection, individuals are more likely to seek treatment, and therefore cases are more likely to be reported. On the other hand, chlamydia infections are often asymptomatic and therefore are more likely to be undiagnosed and underreported. In addition, some healthcare providers may not be aware of their legal requirements to report STDs. 2. Report Delay. Report delay is defined as the time interval between the date an STD diagnosis was made and the date the case was reported to the Health Department. This delay varies by STD, ranging from 1 day to 1 year or more. Therefore, the impact of report delay must be considered when evaluating trends in case numbers and rates over time. Report delay is especially important when evaluating early syphilis data, due to delays in assigning diagnosis while the case is under investigation. 3. Reliability of Rates. All vital statistic rates including morbidity rates are subject to random variation. This variation is inversely related to the number of cases used to calculate rates. A small number of cases can result in highly unstable rates or proportions. To account for this instability, all rates in this Annual Morbidity Report based on less than 20 events are considered “unreliable”. This translates into a relative standard error of the rate of 23% or more, which is the cutoff rate reliably used by the National Center for Health Statistics. Therefore, rates in this report based on less than 20 events should be evaluated with caution. 4. Morbidity date versus Report date. Some STD cases occurring in 2012 were not reported until after the 2012 STD Annual Report was completed. Therefore, slight differences in

Sexually Transmitted Disease Morbidity Report – 2012 VIII-4 numbers of cases and rates for diseases for 2012 may be observed in the future reports. Any such disparities are likely to be small. Though not accounted for in census data, visitors and other non-residents may have an effect on STD disease occurrence. 5. Place of acquisition of infection. Some cases of STDs reported in this Annual Morbidity Report may have been acquired outside the county. Therefore, most disease rates more accurately reflect the place of diagnosis than the location where an infection was acquired. However, every effort is made in early syphilis cases to determine where the infection actually occurred, in order to more effectively investigate and control the spread of disease. Early syphilis cases determined to have been acquired outside LAC jurisdiction are not included in this report. 6. Jurisdiction. This report does not include cases identified by Long Beach or Pasadena Health Departments. Cases from these jurisdictions are reported directly to the California Department of Health Services and to the CDC. Rates: There are rates and adjusted rates used in this report: 1. Rate. Rate per 100,000 population = (# of cases / population) x 100,000. 2. Adjusted Rate. Rates appearing in the race/ethnicity related tables were adjusted for the unknown race/ethnicity. If race/ethnicity was not specified, cases were prorated according to the distribution of cases for which race/ethnicity was specified. Rates were adjusted including the prorated cases.

Sexually Transmitted Disease Morbidity Report – 2012 VIII-5
APPENDIX A: WHERE TO REPORT COMMUNICABLE DISEASES IN LOS ANGELES COUNTY
LABORATORY SLIP
CLINICIAN’S CMR SEND REPORTS TO: Syphilis Chlamydia Gonorrhea
Syphilis Chlamydia Gonorrhea Chancroid Pelvic Inflammatory Disease
Division of HIV and STD Programs Sexually Transmitted Disease 2615 S. Grand Avenue, Rm. 450 Los Angeles, CA 90007 Telephone: 213-744-3070 Fax: 213-749-9602 http://publichealth.lacounty.gov/std/
AIDS HIV (As of July 1, 2002)
AIDS HIV (As of July 1, 2002)
Division of HIV and STD Programs HIV Epidemiology 600 S. Commonwealth Ave., Suite 1920 Los Angeles, CA 90005 Telephone: 213-351-8196 Fax: 213-487-9386 http://publichealth.lacounty.gov/hiv/
Tuberculosis
Tuberculosis Tuberculosis Control
2615 S. Grand Avenue, Rm. 507 Los Angeles, CA 90007 Telephone: 213-745-0800 Fax: 213-749-0926
Cryptosporidiosis Diphtheria Encephalitis arboviral E. coli O157:H7 Hepatitis A, acute Hepatitis B, acute Listeriosis Malaria Measles (Rubeola) Plague Rabies Typhoid Vibrio Species
List of reportable diseases: http://lapublichealth.org/acd/cdrs.htm
Acute Communicable Diseases Morbidity Unit 313 N. Figueroa St., Rm. 117 Los Angeles, CA 90012 Telephone: 213-240-7821 Call toll free: 888-397-3993 Fax toll free: 888-397-3778
REQUIRED INFORMATION ON THE CMR:
Patient Information: Name, gender, ethnic group, date of birth, occupation, address,
telephone number, social security number.
Diagnosis: Diagnosis, date of diagnosis, date of onset.
Reporting Person: Name, address, telephone number.

600 South Commonwealth Avenue, 10th Floor
Los Angeles, CA 90005
Tel: (213) 351-8001 Fax: (213) 387-0912
http://publichealth.lacounty.gov/dhsp