Embed Size (px)
Citation preview
1
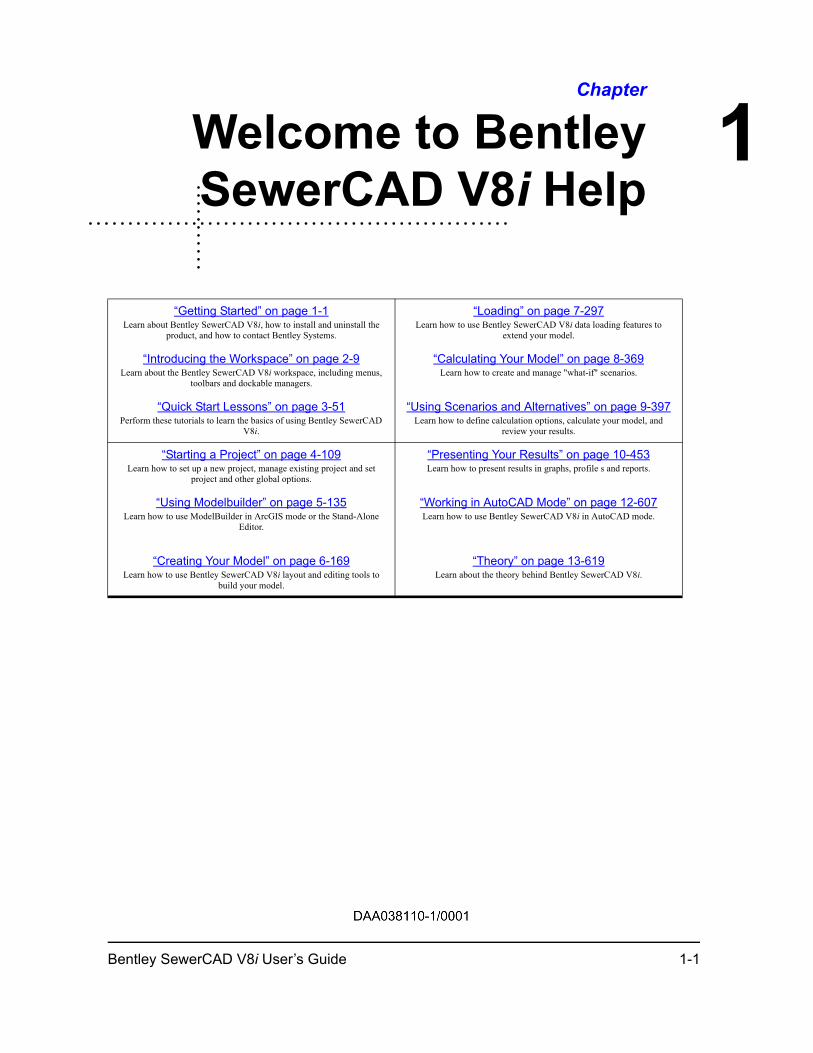
ChapterWelcome to BentleySewerCAD V8i Help
“Getting Started” on page 1-1Learn about Bentley SewerCAD V8i, how to install and uninstall the
product, and how to contact Bentley Systems.
“Loading” on page 7-297Learn how to use Bentley SewerCAD V8i data loading features to
extend your model.
“Introducing the Workspace” on page 2-9Learn about the Bentley SewerCAD V8i workspace, including menus,
toolbars and dockable managers.
“Calculating Your Model” on page 8-369Learn how to create and manage "what-if" scenarios.
“Quick Start Lessons” on page 3-51Perform these tutorials to learn the basics of using Bentley SewerCAD
V8i.
“Using Scenarios and Alternatives” on page 9-397Learn how to define calculation options, calculate your model, and
review your results.
“Starting a Project” on page 4-109Learn how to set up a new project, manage existing project and set
project and other global options.
“Presenting Your Results” on page 10-453Learn how to present results in graphs, profile s and reports.
“Using Modelbuilder” on page 5-135Learn how to use ModelBuilder in ArcGIS mode or the Stand-Alone
Editor.
“Working in AutoCAD Mode” on page 12-607Learn how to use Bentley SewerCAD V8i in AutoCAD mode.
“Creating Your Model” on page 6-169Learn how to use Bentley SewerCAD V8i layout and editing tools to
build your model.
“Theory” on page 13-619Learn about the theory behind Bentley SewerCAD V8i.
Bentley SewerCAD V8i User’s Guide 1-1

1-2 Bentley SewerCAD V8i User’s Guide

Chapter 1: Welcome to Bentley SewerCAD V8i Help1
Chapter 1: Getting Started1What is Bentley SewerCAD V8i?1-1Installation, Upgrades, and Updates1-2
Municipal License Administrator Auto-Configuration1-2Software Updates via the Web and Bentley SELECT1-3Troubleshooting1-3
UPDATING YOUR SENTINELLM LICENSES IF YOU MOVE YOUR LI-CENSE SERVER1-4UPDATING YOUR BENTLEY SELECT SERVER LICENSES IF YOU MOVE YOUR LICENSE SERVER1-4
Checking Your Current Registration Status1-4Documentation1-4Quick Start Lessons1-5Contacting Us1-6
Sales1-6Technical Support1-6
SUPPORT HOURS1-7Addresses1-7Your Suggestions Count1-8
Chapter 2: Introducing the Workspace9The Workspace2-9
Stand-Alone Editor2-9Microstation Mode2-10AutoCAD Mode2-11
Menus2-11File Menu2-11Edit Menu2-15Analysis Menu2-17Components Menu2-18View Menu2-19Tools Menu2-22Report Menu2-24Help Menu2-24
Toolbars2-25Layout Toolbar2-27Standard Toolbar2-28Edit Toolbar2-30
Bentley SewerCAD V8 XM Edition User’s Guide Contents-i
View Toolbar2-30Scenarios Toolbar2-32Analysis Toolbar2-32Compute Toolbar2-33Tools Toolbar2-33Help Toolbar2-34Zoom Toolbar2-34
Customizing the Toolbars2-36Adding and Removing Toolbar Buttons2-36Controlling Toolbars2-36
Dynamic Manager Display2-37Opening Managers2-38Customizing Managers2-40
Using Customizations2-42Customization Manager2-42
CUSTOMIZATION EDITOR DIALOG BOX2-44Using Named Views2-44Copying and Pasting Data To and From Tables2-46
Chapter 3: Quick Start Lessons51Lesson 1 - Creating a Schematic Network3-51
Part 1 - Creating a New Schematic Project File3-52Part 2 - Entering Data3-56
ENTERING DATA THROUGH THE PROPERTIES EDITOR3-57ENTERING DATA THROUGH FLEXTABLES3-59ENTERING INFILTRATION DATA FOR GRAVITY PIPES3-61STEADY STATE LOADING3-61EXTREME FLOW FACTORS3-66
Part 3- Calculating the Model3-69Lesson 2 - Automatic Design3-71
Part 1: Specifying Design Constraints3-71Part 2: Design3-75
Lesson 3 - Scenario Management3-76Part 1 - Opening the Project File3-76Part 2 - Creating Alternatives3-76Part 3 - Editing Base Scenarios3-81Part 4 - Creating Child Scenarios3-82Part 5 - Calculate and Compare3-84
Lesson 4 - Presentation of Results3-86Part 1 - Reports3-86Part 2 - FlexTables3-89Part 3 - Element Annotation3-93
Contents-ii Bentley SewerCAD V8 XM Edition User’s Guide
Part 4 - Create a Profile3-95Part 5 - Color Coding3-97
Lesson 5 - Running an Extended Period Simulation3-98Part 1 - Entering and Applying Loading Patterns3-99Part 2 - Entering Hydrographs3-101Part 3 - Running the Extended Period Simulation3-103Part 4 - Time Based Graphs and Tables3-103Part 5 - Animations3-105
Chapter 4: Starting a Project109Welcome Dialog Box4-109Projects4-110Setting Project Properties4-110Setting Options4-111
Options Dialog Box - Global Tab4-111Options Dialog Box - Project Tab4-114Options Dialog Box - Drawing Tab4-116Options Dialog Box - Units Tab4-117Options Dialog Box - Labeling Tab4-120Options Dialog Box - ProjectWise Tab4-121
Considerations for ProjectWise Users4-123General Guidelines for using ProjectWise 4-123Performing ProjectWise Operations4-124
Importing Data From Other Models4-127Importing Data from a SewerCAD V8 Database4-128Importing a Submodel4-128Importing from LandXML4-129Importing StormCAD V84-130Importing from SewerGEMS V84-131
Exporting Data4-132Exporting a .DXF File4-132Exporting a Submodel4-132Exporting to LandXML4-1334-133
Chapter 5: Using Modelbuilder135Preparing to Use ModelBuilder5-135ModelBuilder Connections Manager5-138ModelBuilder Wizard5-141
Step 1—Specify Data Source5-141Step 2—Specify Spatial Options5-142
Bentley SewerCAD V8 XM Edition User’s Guide Contents-iii
Step 3—Specify Field Mappings for each Table/Feature Class5-144Step 4—Build Operation Confirmation5-146
Reviewing Your Results5-146Multi-select Data Source Types5-147ModelBuilder Warnings and Error Messages5-147
Warnings5-147Error Messages5-148
Specifying Network Connectivity in ModelBuilder5-149Sample Spreadsheet Data Source5-151
Handling Collection and Curve Data in Modelbuilder5-152Importing Pump Definitions Using ModelBuilder5-153Using ModelBuilder to Import Pump Curves5-158Using ModelBuilder to Import Patterns5-162
Chapter 6: Creating Your Model169Elements and Element Attributes6-169
Link Elements6-170ENTERING ADDITIONAL DATA TO LINK ELEMENTS6-170
Adding a Minor Loss Collection to a Pressure Pipe6-171Diversion Rating Curve Dialog Box6-172Defining the Geometry of a Link Element6-172Irregular Channel Editor Dialog Box6-173Defining the Cross-Sectional Shape of a Link Element6-174
SECTIONS RESULTS DIALOG BOX6-175Manholes6-175
FLOW (DOWNSTREAM CONDUIT)6-176FLOW HEADLOSS CURVES DIALOG BOX6-176DROP MANHOLES6-178
Transitions6-178Wet Wells6-179
PERCENT FULL6-179INFLOW (WET) COLLECTION DIALOG BOX6-180
Outfalls6-180ADDING ELEVATION VS. FLOW DATA TO AN OUTFALL6-181
Pressure Junctions6-182Pumps6-182
PUMP DEFINITIONS DIALOG BOX6-183SUBMERSIBLE PUMPS6-189
Variable Speed Pump Batteries6-190Air Valves6-191Other Tools6-192
Adding Elements to Your Model6-193
Contents-iv Bentley SewerCAD V8 XM Edition User’s Guide

Modeling Curved Pipes6-194Connecting Elements6-194
What Is A Virtual Conduit?6-195Connecting a Pump to a Wet Well6-195
Manipulating Elements6-195Splitting Pipes6-198Disconnecting and Reconnecting Pipes6-199
Editing Element Attributes6-199Property Editor6-199
RELABELING ELEMENTS6-201SET FIELD OPTIONS DIALOG BOX6-202
What Length is Used for Conduits and Pressure Pipes When I Don't Enter a User-defined Length?6-203
Automatic Design6-204Default Design Constraints6-205
Minor Loss Coefficients6-208Using the Totalizing Flow Meters6-210
Totalizing Flow Meters Manager Dialog6-210Totalizing Flow Meter Editor Dialog6-211
System Head Curves6-213System Head Curves Manager Dialog6-213
Element Property Inferencing6-215Element Property Inferencing Dialog6-217
NEW ELEMENT LAYOUT SUMMARY DIALOG6-223Changing the Drawing View6-223
Panning6-223Zooming6-224
USING THE ZOOM CENTER COMMAND6-226Using Selection Sets6-227
Selection Sets Manager6-228Viewing Elements in a Selection Sets6-230Creating a Selection Set from a Selection6-231Creating a Selection Set from a Query6-231Adding Elements to a Selection Set6-233Removing Elements from a Selection Set6-234Performing Group-Level Operations on Selection Sets6-234
Network Navigator6-236Using Prototypes6-239
Creating Prototypes6-239Engineering Libraries6-241
Working with Engineering Libraries6-242SHARING ENGINEERING LIBRARIES ON A NETWORK6-245
Bentley SewerCAD V8 XM Edition User’s Guide Contents-v
Converting Legacy Engineering Library Files6-245Conduit Catalog Dialog Box6-247
Adding Hyperlinks to Elements6-251Hyperlinks Dialog Box6-251
Using Queries6-254Queries Manager6-255
QUERY PARAMETERS DIALOG BOX6-256Creating Queries6-257
USING THE LIKE OPERATOR6-261Controls6-262
Controls Tab6-264Conditions Tab6-269Actions Tab6-275Control Sets Tab6-279
LOGICAL CONTROL SETS DIALOG BOX6-280User Data Extensions6-280
User Data Extensions Dialog Box6-283User Data Extensions Import Dialog Box6-287Sharing User Data Extensions Among Element Types6-287Shared Field Specification Dialog Box6-288Enumeration Editor Dialog Box6-289
Batch Pipe Split Dialog Box6-290External Tools6-291
External Tools Workflow6-292TRex Wizard6-293
Chapter 7: Loading297Loading7-297
Methods for Entering Loads7-298Types of Loads7-299
Adding Fixed Loads7-301Hydrograph vs. Pattern Loads7-301Adding User Defined Hydrographs7-302Pattern Loads7-303
WORKING WITH PATTERNS7-303Pattern Manager7-305
DEFINING PATTERN SETUPS7-307Unit Sanitary Loading7-309
TYPES OF UNIT SANITARY (DRY WEATHER) LOADS7-310ADDING UNIT SANITARY (DRY WEATHER) LOADS7-311
Composite Hydrographs7-318Composite Hydrograph Window7-318
Contents-vi Bentley SewerCAD V8 XM Edition User’s Guide
Composite Hydrograph Data Table Window7-318Inflows7-319
Defining Inflow Collections7-322Inflow Control Center7-325
APPLY SANITARY INFLOW TYPE TO SELECTION DIALOG7-329Sanitary Load Control Center7-329
APPLY SANITARY LOAD TO SELECTION DIALOG7-332Sanitary (Dry Weather) Flow Collections7-332Using LoadBuilder to Assign Loading Data7-335
Allocation7-336Billing Meter Aggregation7-338Distribution7-339Projection7-341
Using LoadBuilder to Assign Loading Data7-342LoadBuilder Manager7-342LoadBuilder Wizard7-343LoadBuilder Run Summary7-354
Generating Thiessen Polygons7-354Thiessen Polygon Creator Dialog Box7-357Creating Boundary Polygon Feature Classes7-359
Pipeline Infiltration7-360Hydrograph Curve Dialog Box7-360
Extreme Flows7-361Extreme Flows Dialog7-361Extreme Flow Setups Dialog7-366
Chapter 8: Calculating Your Model369Steady State/Extended Period Simulation8-369
Steady State Simulation8-369Extended Period Simulation8-369
EPS RESULTS BROWSER8-370Calculation Options Manager8-373Creating Calculation Options8-374
Calculation Option Attributes8-376FLOW PROFILE METHOD8-382
Controlling Results Output8-382REPORTING TIME STEPS DIALOG BOX8-383
Check Data/ Validate8-383Detailed Calculation Summary Dialog Box8-384
Executive Summary Tab8-384Calculation Options Tab8-385
Bentley SewerCAD V8 XM Edition User’s Guide Contents-vii
Pressure Summary Tab8-391Pipe Report Tab8-392Node Report Tab8-392
User Notifications8-393User Notifications Manager8-393
USER NOTIFICATION DETAILS DIALOG BOX8-3958-395
Chapter 9: Using Scenarios and Alternatives397Understanding Scenarios and Alternatives9-397
Advantages of Automated Scenario Management9-398A History of What-If Analyses9-398
BEFORE HAESTAD METHODS - DISTRIBUTED SCENARIOS9-398WITH HAESTAD METHODS: SELF-CONTAINED SCENARIOS9-400
The Scenario Cycle9-400Scenario Attributes and Alternatives9-402A Familiar Parallel9-402Inheritance9-403
OVERRIDING INHERITANCE9-404DYNAMIC INHERITANCE9-404
Local and Inherited Values9-405Minimizing Effort through Attribute Inheritance9-405Minimizing Effort through Scenario Inheritance9-406
Scenario Example - Simple Water Distribution System9-407Building the Model (Average Day Conditions)9-408Analyzing Different Demands (Maximum Day Conditions)9-408Another Set of Demands (Peak Hour Conditions)9-409Correcting an Error9-409Analyzing Improvement Suggestions9-410Finalizing the Project9-411Summary9-411
Scenarios9-412Base and Child Scenarios9-413Creating Scenarios9-413Editing Scenarios9-413Running Multiple Scenarios at Once (Batch Runs)9-414Scenario Manager9-415
Alternatives9-417Types of Alternatives9-417Base and Child Alternatives9-418Creating Alternatives9-418Editing Alternatives9-419Alternative Manager9-419Alternative Editor Dialog Box9-420
Contents-viii Bentley SewerCAD V8 XM Edition User’s Guide
Active Topology Alternative9-421CREATING AN ACTIVE TOPOLOGY CHILD ALTERNATIVE9-422ACTIVE TOPOLOGY SELECTION DIALOG BOX9-423
Physical Alternatives9-424PHYSICAL ALTERNATIVE FOR CONDUITS9-424PHYSICAL ALTERNATIVE FOR MANHOLES9-431PHYSICAL ALTERNATIVE FOR TRANSITIONS9-432PHYSICAL ALTERNATIVE FOR WET WELLS9-432PHYSICAL ALTERNATIVE FOR OUTFALLS9-434PHYSICAL ALTERNATIVE FOR PRESSURE PIPES9-435PHYSICAL ALTERNATIVE FOR PRESSURE JUNCTIONS9-437PHYSICAL ALTERNATIVE FOR PUMPS9-437PHYSICAL ALTERNATIVE FOR VARIABLE SPEED PUMP BATTERIES9-438PHYSICAL ALTERNATIVE FOR AIR VALVES9-439
Design Alternative9-440Headloss Alternative9-443Boundary Condition Alternatives9-444Initial Settings Alternative9-445Sanitary Loading Alternative9-447
SANITARY LOADING ALTERNATIVE FOR MANHOLES9-448SANITARY LOADING ALTERNATIVE FOR WET WELLS9-448SANITARY LOADING ALTERNATIVE FOR PRESSURE JUNCTIONS9-448
Infiltration and Inflow Alternatives9-449INFILTRATION AND INFLOW ALTERNATIVE FOR CONDUITS9-449INFILTRATION AND INFLOW ALTERNATIVE FOR MANHOLES9-450INFILTRATION AND INFLOW ALTERNATIVE FOR WET WELLS9-450INFILTRATION AND INFLOW ALTERNATIVE FOR PRESSURE JUNC-TIONS9-450
System Flows Alternative9-451Operational Alternative9-452User Data Extensions Alternative9-452
Calculation Options9-452
Chapter 10: Presenting Your Results453Using Background Layers10-453
Background Layer Manager10-454Working with Background Layer Folders10-456Adding Background Layers10-457Deleting Background Layers10-457Editing Background Layers10-458Renaming Background Layers10-458Turning Background Layers On and Off10-458Image Properties Dialog Box10-458
Bentley SewerCAD V8 XM Edition User’s Guide Contents-ix
Shapefile Properties Dialog Box10-460DXF Properties Dialog Box10-461
Annotating Your Model10-462Element Symbology Manager10-463Using Folders in the Element Symbology Manager10-465Adding Annotations10-466Deleting Annotations10-467Editing Annotations10-467Renaming Annotations10-467Annotation Properties Dialog Box10-468
FREE FORM ANNOTATION DIALOG BOX10-469Zoom Dependent Visibility10-470
Color Coding Your Model10-470Adding Color-Coding10-471Deleting Color-Coding10-471Editing Color-Coding10-472Renaming Color-Coding10-472Color-Coding Properties Dialog Box10-472
Using Profiles10-474Profiles Manager10-475Viewing Profiles10-476Creating a New Profile10-477Editing Profiles10-478Deleting Profiles10-478Renaming Profiles10-478Profile Setup Dialog Box10-479Profile Viewer Dialog Box10-480
AXIS OPTIONS DIALOG BOX10-483Engineering Profile Viewer Dialog Box10-483
ENGINEERING PROFILE OPTIONS10-485GROUND PROFILE OPTIONS10-487ANNOTATION PROPERTIES DIALOG BOX10-487LINK ANNOTATION PROPERTIES DIALOG BOX10-487TEXT PROPERTIES10-488
Viewing and Editing Data in FlexTables10-488FlexTables Manager10-489Working with FlexTable Folders10-491FlexTable Dialog Box10-492
STATISTICS DIALOG BOX10-494Opening FlexTables10-494Creating a New FlexTable10-495Deleting FlexTables10-495Naming and Renaming FlexTables10-495Editing FlexTables10-496Sorting and Filtering FlexTable Data10-498
Contents-x Bentley SewerCAD V8 XM Edition User’s Guide
CUSTOM SORT DIALOG BOX10-501Customizing Your FlexTable10-501FlexTable Setup Dialog Box10-502Element Relabeling Dialog Box10-504Copying, Exporting, and Printing FlexTable Data10-505Using Predefined Tables10-507
Reporting10-507Using Standard Reports10-507
CREATING A PROJECT INVENTORY REPORT10-507CREATING A SCENARIO SUMMARY REPORT10-508CREATING A CONDUIT AND PRESSURE PIPE INVENTORY10-508
Reporting on Element Data10-508Report Options10-508
Graphing10-509Graph Manager10-510Creating a Graph10-511Printing a Graph10-512Working with Graph Data: Viewing and Copying10-512Graph Dialog Box10-512
GRAPH SERIES OPTIONS DIALOG BOX10-517FILTER DIALOG BOX10-517OBSERVED DATA DIALOG BOX10-517
Sample Observed Data Source10-519
Chart Options Dialog Box10-520Chart Options Dialog Box - Chart Tab10-521
SERIES TAB10-522PANEL TAB10-522AXES TAB10-525GENERAL TAB10-532TITLES TAB10-533WALLS TAB10-538PAGING TAB10-539LEGEND TAB10-5403D TAB10-546
Chart Options Dialog Box - Series Tab10-547FORMAT TAB10-547POINT TAB10-548GENERAL TAB10-549DATA SOURCE TAB10-550MARKS TAB10-551
Chart Options Dialog Box - Tools Tab10-555Chart Options Dialog Box - Export Tab10-556Chart Options Dialog Box - Print Tab10-558Border Editor Dialog Box10-559Gradient Editor Dialog Box10-560Color Editor Dialog Box10-561
Bentley SewerCAD V8 XM Edition User’s Guide Contents-xi
Color Dialog Box10-561Hatch Brush Editor Dialog Box10-562
HATCH BRUSH EDITOR DIALOG BOX - SOLID TAB10-562HATCH BRUSH EDITOR DIALOG BOX - HATCH TAB10-563HATCH BRUSH EDITOR DIALOG BOX - GRADIENT TAB10-563HATCH BRUSH EDITOR DIALOG BOX - IMAGE TAB10-564
Pointer Dialog Box10-565Change Series Title Dialog Box10-566Chart Tools Gallery Dialog Box10-566
CHART TOOLS GALLERY DIALOG BOX - SERIES TAB10-566CHART TOOLS GALLERY DIALOG BOX - AXIS TAB10-570CHART TOOLS GALLERY DIALOG BOX - OTHER TAB10-573
TeeChart Gallery Dialog Box10-578SERIES10-578FUNCTIONS10-578
Customizing a Graph10-578Print Preview Window10-587Contours10-588
Contour Definition10-590Contour Plot10-591Contour Browser Dialog Box10-592Enhanced Pressure Contours10-592
Using Named Views10-592Using Aerial View10-593
Time Series Field Data10-594SELECT ASSOCIATED MODELING ATTRIBUTE DIALOG BOX10-596
Chapter 11: Features of the MicroStation Version597
MicroStation Environment11-598MicroStation Mode Graphical Layout11-598
MicroStation Project Files11-599Bentley SewerCAD V8i Element Properties11-599
Element Properties11-600Levels11-600
ELEMENT LEVELS DIALOG11-601Text Styles11-601
Working with Elements11-601Edit Elements11-601Deleting Elements11-602Modifying Elements11-602
CHANGE PIPE WIDTHS11-602
Contents-xii Bentley SewerCAD V8 XM Edition User’s Guide

EDIT ELEMENTS11-602Working with Elements Using MicroStation Commands11-602
BENTLEY SEWERCAD V8I CUSTOM MICROSTATION ENTITIES11-603MICROSTATION COMMANDS11-603MOVING ELEMENTS11-603MOVING ELEMENT LABELS11-604
Snap Menu11-604Undo/Redo11-604Special Considerations11-605
Import Bentley SewerCAD V8i11-605Annotation Display11-605Use SewerCAD V8i Z Order Command11-605
Chapter 12: Working in AutoCAD Mode607The AutoCAD Workspace12-608
AutoCAD Integration with SewerCAD V8i12-608AutoCAD Mode Graphical Layout12-609Menus12-609Toolbars12-609Drawing Setup12-610Symbol Visibility12-610Layout Options Dialog12-610
AutoCAD Project Files12-611AutoCAD Project Files12-611
Drawing Synchronization12-612Working with Elements Using AutoCAD Commands12-613
SewerCAD V8i Custom AutoCAD Entities12-613SewerCAD V8i Custom AutoCAD Entities12-614AutoCAD Commands12-614Explode Elements12-614Moving Elements12-615Moving Element Labels12-615Snap Menu12-615
Undo/Redo12-615Special Considerations12-616
Importing SewerCAD V8i Data12-617Importing SewerCAD V8i Data12-617Working with Proxies12-617
Bentley SewerCAD V8 XM Edition User’s Guide Contents-xiii
Chapter 13: Theory619Loading13-620
Common Load Types13-620HYDROGRAPHS13-620PATTERN LOADS13-621HYDROGRAPHS VS. PATTERN LOADS13-621
Sanitary (Dry Weather) Loading13-621UNIT SANITARY (DRY WEATHER) LOADS13-622EXTREME FLOW FACTOR13-622COMMON VARIABLE PEAKING FACTORS13-623
Wet Weather Loading13-624INFILTRATION13-624INFLOW13-625
Known Flow13-625Gravity Pipe Hydraulics13-626
The Energy Principle13-626THE ENERGY EQUATION13-627
Hydraulic and Energy Grades13-628HYDRAULIC GRADE13-629ENERGY GRADE13-629
Friction Loss Methods13-629CHEZY’S EQUATION13-629COLEBROOK-WHITE EQUATION13-630HAZEN-WILLIAMS EQUATION13-631DARCY-WEISBACH EQUATION13-631
Swamee and Jain Equation13-633MANNING’S EQUATION13-633
Flow Regime13-634PRESSURE FLOW13-635UNIFORM FLOW AND NORMAL DEPTH13-635CRITICAL FLOW, CRITICAL DEPTH, AND CRITICAL SLOPE13-635SUBCRITICAL FLOW13-636SUPERCRITICAL FLOW13-636
Gradually Varied Flow Analysis13-636SLOPE CLASSIFICATION13-636ZONE CLASSIFICATION13-638PROFILE CLASSIFICATION13-639
Energy Balance13-640STANDARD STEP METHOD13-641DIRECT STEP METHOD13-641
Mixed Flow Profiles13-641SEALING (SURCHARGING) CONDITIONS13-642RAPIDLY VARIED FLOW13-642
Backwater Analysis13-642FREE OUTFALL13-643STRUCTURE FLOODING13-643
Contents-xiv Bentley SewerCAD V8 XM Edition User’s Guide

Frontwater Analysis13-643Pipe Average Velocity13-644
UNIFORM FLOW VELOCITY13-644FULL FLOW VELOCITY13-644SIMPLE AVERAGE VELOCITY13-644WEIGHTED AVERAGE VELOCITY13-645PIPE AVERAGE VELOCITY AND TRAVEL TIME13-645
Capacity Analysis (Approximate Profiles)13-645FULL CAPACITY PROFILES13-646EXCESS CAPACITY PROFILES13-646COMPOSITE EXCESS CAPACITY PROFILES13-648
Junction Headlosses and Minor Losses13-648Manhole Head Loss Equations (AASHTO/HEC-2 Overview)13-649Junction Headlosses13-649
STRUCTURE HEADLOSS13-649SPECIAL ASSUMPTIONS13-652
Pressure Flow, Free Surface Flow, and Transitional Flow13-652Initial Headloss Coefficient13-652Correction for Pipe Diameter13-653Correction for Flow Depth13-653Correction for Relative Flow13-654Correction for Plunging Flow13-654Correction for Benching13-655Headloss - AASHTO Method13-656AASHTO Contraction Loss13-657AASHTO Bend Loss13-657AASHTO Bend Loss Original Equation13-658AASHTO Expansion Loss13-659AASHTO Correction For Non-Piped Flow13-660AASHTO Correction for Shaping13-660
Minor Losses13-660FITTING LOSS COEFFICIENTS13-661
Pump Theory13-662Variable Speed Pumps13-663Constant Horsepower Pumps13-666Conservation of Mass and Energy13-667
CONSERVATION OF MASS13-667CONSERVATION OF ENERGY13-668
The Gradient Algorithm13-668Derivation of the Gradient Algorithm13-669The Linear System Equation Solver13-671
Extended Period Simulations13-673Extended Period Simulations Overview13-673Routing Overview13-673Convex Routing13-674Weighted Translation Routing13-675
Bentley SewerCAD V8 XM Edition User’s Guide Contents-xv
Hydrologic and Hydraulic Time Steps13-676Transitioning Between Gravity and Pressure Networks13-676
Identifying Gravity Pipes and Force Mains13-676Direction of Flow in Gravity and Pressure Systems13-677Transitioning From Gravity Pipes to Force Mains13-677Transitioning From Force Mains to Gravity Elements13-678Subnetworks13-682
Constraint Based Automatic Design13-683Gravity Pipes and Structures Design13-683Part Full Design13-683Allow Multiple Sections13-684Limit Section Size13-685Pipe Matching13-685Offset Matching13-686Drop Structures13-686Structure invert Elevations13-686Design Priorities13-686Automatic Design with Hydrograph and Pattern Loads13-689Constraint Based Warning Messages13-690
Open and Closed Channel Weighting Methods13-690Note to HEC-2, WSP-2, and WSPRO Users13-693
Special Considerations13-693Energy Discontinuity13-693Structure Energy Grade13-694Design Considerations13-694Reporting Flow Attributes13-694
Manning’s n Coefficients13-695Headloss Coefficients for Junctions13-698
Roughness Values—Manning’s Equation13-699Roughness Values—Darcy-Weisbach Equation (Colebrook-White)13-700
Appendix 14: References703
Chapter 15: About Bentley Systems705Software15-705
CivilStorm15-706SewerGEMS15-707SewerGEMS15-707WaterGEMS15-708WaterCAD15-708StormCAD15-709
Contents-xvi Bentley SewerCAD V8 XM Edition User’s Guide

PondPack15-709FlowMaster15-709CulvertMaster15-710HAMMER15-710GISConnect15-710
Bentley Institute Press15-711Training15-712
Accreditations15-712
Bentley SewerCAD V8 XM Edition User’s Guide Contents-xvii

Contents-xviii Bentley SewerCAD V8 XM Edition User’s Guide
1
ChapterGetting Started
Thank you for purchasing Bentley SewerCAD V8i. At Bentley Systems, we pride ourselves in providing the very best engineering software available. Our goal is to make software that is easy to install and use, yet so powerful and intuitive that it antic-ipates your needs without getting in your way.
When you first use Bentley SewerCAD V8i, use the intuitive interface and interactive dialog boxes to guide you. If you need more information, use the online help by pressing the F1 key or selecting Bentley SewerCAD V8i Help from the Help menu. A help topic describing the area of the program in which you are working appears.
•
• “Documentation” on page 1-4
• “Quick Start Lessons” on page 1-5
• “Contacting Us” on page 1-6
What is Bentley SewerCAD V8i?SewerCAD V8i is an extremely powerful program for the design and analysis of gravity flow and pressure flow through pipe networks and pumping stations. The program can be run in Microstation and AutoCAD mode, giving you all the power of Microstation and AutoCAD’s capabilities, or in Stand-Alone mode utilizing our own graphical interface.
SewerCAD V8i allows you to construct a graphical representation of a pipe network containing information such as pipe data, pump data, loading, and infiltration. You have a choice of conveyance elements including circular pipes, arches, boxes and more.
Bentley SewerCAD V8i User’s Guide 1-1
Installation, Upgrades, and Updates
The gravity network is calculated using the built-in numerical model, which utilizes both the direct step and standard step gradually varied flow methods. Flow calcula-tions are valid for both surcharged and varied flow situations, including hydraulic jumps, backwater, and drawdown curves. You also have the flexibility to mix gravity and pressure components freely, building your systems in parallel or in series as they exist in the field. Pressure elements can be controlled based on system hydraulics, turning pumps on and off due to changes in flows and pressures.
SewerCAD V8i’s flexible reporting feature allows you to customize and print the model results in both a report format and as a graphical plot.
Installation, Upgrades, and Updates For instructions on installing, registering, activating, and updating the software please refer to the Readme.pdf in the Program Files/Bentley/SewerCAD8 directory.
Municipal License Administrator Auto-Configuration
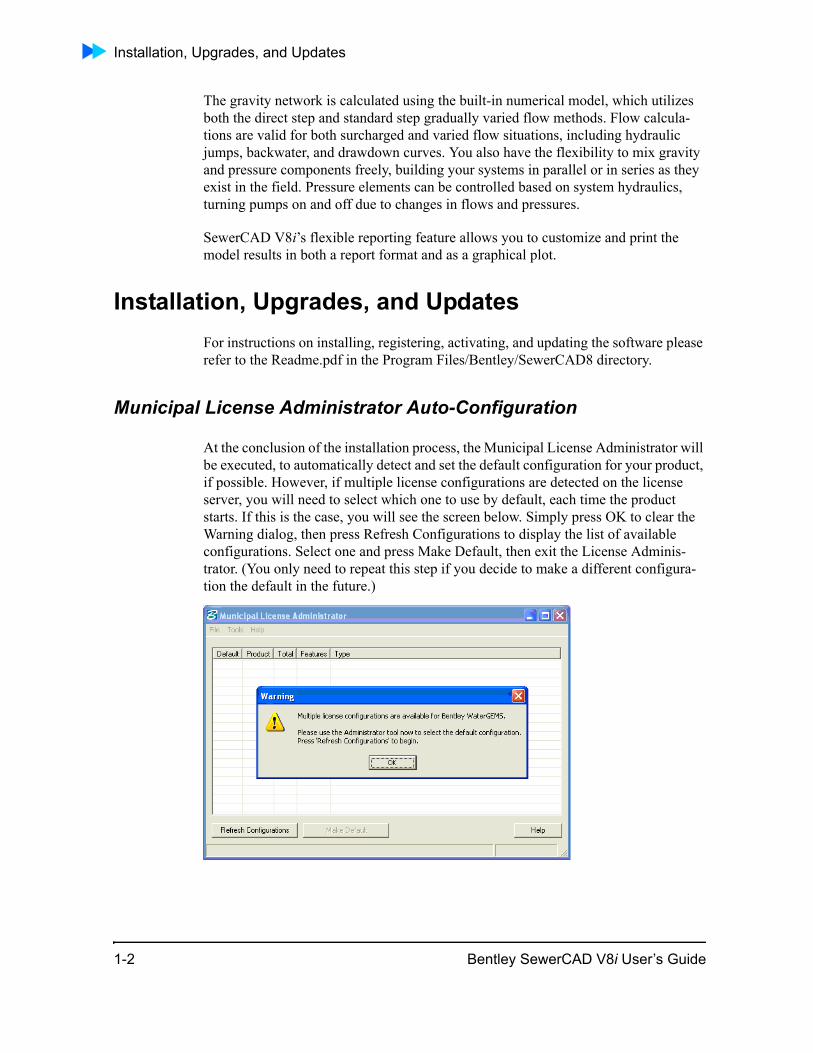
At the conclusion of the installation process, the Municipal License Administrator will be executed, to automatically detect and set the default configuration for your product, if possible. However, if multiple license configurations are detected on the license server, you will need to select which one to use by default, each time the product starts. If this is the case, you will see the screen below. Simply press OK to clear the Warning dialog, then press Refresh Configurations to display the list of available configurations. Select one and press Make Default, then exit the License Adminis-trator. (You only need to repeat this step if you decide to make a different configura-tion the default in the future.)
1-2 Bentley SewerCAD V8i User’s Guide
Getting Started
Software Updates via the Web and Bentley SELECT
Note: Your PC must be connected to the Internet to use the Check for Updates button.
Bentley SELECT is the comprehensive delivery and support subscription program that features product updates and upgrades via Web downloads, around-the-clock technical support, exclusive licensing options, discounts on training and consulting services, as well as technical information and support channels. It’s easy to stay up-to-date with the latest advances in our software. Software updates can be downloaded from our Web site, and your version of Bentley SewerCAD V8i can then be upgraded to the current version quickly and easily. Just click the Check for Updates button on the toolbar to launch your preferred Web browser and open our Web site. The Web site automatically checks to see if your installed version is the latest available, and if not, it provides you with the opportunity to download the correct upgrade to bring it up-to-date. You can also access our Knowledgebase for answers to your Frequently Asked Questions (FAQs).
For more information, see “Technical Support” on page 1-6.
Troubleshooting
Because of the multitasking capabilities of Windows, you may have applications running in the background that make it difficult for software setup and installations to determine the configuration of your current system. If you have difficulties during the installation or uninstallation process, please try these steps before contacting our tech-nical support staff:
1. Shut down and restart your computer.
2. Verify that there are no other programs running. You can see applications currently in use by pressing Ctrl+Shift+Esc in Windows 2000 and Windows XP. Exit any applications that are running.
3. Disable any antivirus software that you are running.
Caution: After you install Bentley SewerCAD V8i, make certain that you restart any antivirus software you have disabled. Failure to restart your antivirus software leaves you exposed to potentially destructive computer viruses.
4. Try running the installation or uninstallation again (without running any other program first).
If these three steps fail to successfully install or uninstall the product, contact our Technical Support staff. For more information, see “Contacting Us” on page 1-6.
Bentley SewerCAD V8i User’s Guide 1-3
Documentation
Updating Your SentinelLM Licenses if You Move Your License Server
If you move your SentinelLM license manager to a different server, following these steps to update the licenses:
1. Install the license file on the new server.
2. Replace the server name in the license.ini file on all client workstations with the new server name (on the line containing “Server=”). Don’t forget to save the file on each workstation. The license.ini file is usually located in the Haestad Method product directory.
Updating Your Bentley SELECT Server Licenses if you Move Your License Server
If you move your Bentley SELECT Server license manager to a different server, following these steps to update the licenses:
1. Obtain a new license file (license string) from Bentley Systems, then update the license.lic file on the new server with the new license string.
2. Replace the server name in the license.lic file on all client workstations with the new server name. Don’t forget to save the file on each workstation. The license.lic file is usually located in the Haestad Method product directory.
Checking Your Current Registration Status
After you have registered the software, you can check your current registration status by opening the About... box from within the software itself.
To view your registration information
1. Select Help > About Bentley SewerCAD V8i Edition.
2. The version and build number for Bentley SewerCAD V8i Edition display in the lower-left corner of the About Bentley Bentley SewerCAD V8i dialog box.
The current registration status is also displayed, including: user name and company, serial number, license type and check-in status, feature level, expiration date, and SELECT Server information.
DocumentationBentley SewerCAD V8i documentation is available in two parts:
1-4 Bentley SewerCAD V8i User’s Guide
Getting Started
Online help: The online help is accessible from the Help menu or by pressing F1. Additionally, when you are using Bentley SewerCAD V8i, you can call the online help at any time by clicking a help button in any dialog box or window.
The context-sensitive online help is designed to make it easy for you to quickly find specific information about a feature you are using in Bentley SewerCAD V8i. The online help makes extensive use of hyperlinks and provides a table of contents, index, and keyword search to help you locate the information you need.
Online PDF Book: The content in the online help is also available in .pdf format and is available at docs.bentley.com. This pdf contains the same content as the online help, but includes hypertext and is designed to be printed by you from a local printing device. As well as being more easily printable than the online help, the online book also uses hypertext and is searchable.
Note: On-screen display of graphics in .pdf files is dependent on the zoom level you use. For more optimal viewing of graphics in Adobe® Acrobat® Reader, try using 167% and 208% zoom.
Quick Start LessonsThe lessons quickly introduce you to specific features of Bentley SewerCAD V8i. To access the lessons, select Quick Start Lessons from the Help menu. Run a lesson by selecting one of the entries in the list.
Bentley SewerCAD V8i User’s Guide 1-5

Contacting Us
Contacting UsContact Bentley Systems if you want product information, to upgrade your software, or need technical support.
Sales
Bentley Systems, Inc.’ professional staff is ready to answer your questions. Please contact your sales representative for any questions regarding Bentley Systems, Inc.’ latest products and prices.
Toll-free U.S. Phone: 800-727-6555
Worldwide Phone: +1-203-755-1666
Fax: +1-203-597-1488
Email: [email protected]
Technical Support
We hope that everything runs smoothly and you never have a need for our technical support staff. However, if you do need support, our highly-skilled staff offers their services seven days a week, and may be contacted by phone, fax, email, and the Internet. For information on the various levels of support that we offer, contact our sales team today and request information on our ClientCare program, or visit our Web site.
When calling for support, in order to assist our technicians in troubleshooting your problem, please be in front of your computer and have the following information available:
• Your computer’s operating system (Windows 2000 or Windows XP).
• Name and build number of the Bentley Systems, Inc. software you are calling about. The build number can be determined by clicking Help > About Bentley SewerCAD V8i. The build number is the number in brackets located in the lower-left corner of the dialog box that opens.
• A note of exactly what you were doing when you encountered the problem.
• Any error messages or other information displayed on your screen.
1-6 Bentley SewerCAD V8i User’s Guide

Getting Started
When emailing or faxing for support, please provide the following details, in addition to the above, to enable us to provide a more timely and accurate response:
• Company name, address, and phone number
• A detailed explanation of your concerns
• If you are emailing us, the Haestad Bentley SewerCAD V8i.log files located in the product directory (e.g., C:\Documents and Settings\All Users\Application Data\Haestad\Bentley SewerCAD V8i\1)
Support Hours
:Technical Support is available 24 hours a day, seven days a week.
You can contact our technical support team at:
Phone: +1-203-755-1666
Fax: +1-203-597-1488
Email: [email protected]
Addresses
Use this address information to contact us:
Internet: http://www.haestad.com
Email: [email protected]
Toll-free U.S. Phone: 800-727-6555
Worldwide Phone: +1-203-755-1666
Fax: +1-203-597-1488
Mail: Bentley Systems, Inc., Incorporated
Haestad Methods Solutions Center
Suite 200W
37 Brookside Road
Watertown, CT 06795
Bentley SewerCAD V8i User’s Guide 1-7

Contacting Us
Your Suggestions Count
Bentley Systems, Inc. strives to continually provide you with sophisticated software and documentation. We are very interested in hearing your suggestions for improving the Bentley SewerCAD V8i software, online help, and printed manual. Your feedback guides us in developing products that make your work easier.
Please let us hear from you!
1-8 Bentley SewerCAD V8i User’s Guide
2
ChapterIntroducing theWorkspace
Click one of the following links to learn more about the Bentley SewerCAD V8i workspace.
• “The Workspace” on page 2-9
• “Menus” on page 2-11
• “Toolbars” on page 2-25
• “Customizing the Toolbars” on page 2-36
• “Dynamic Manager Display” on page 2-37
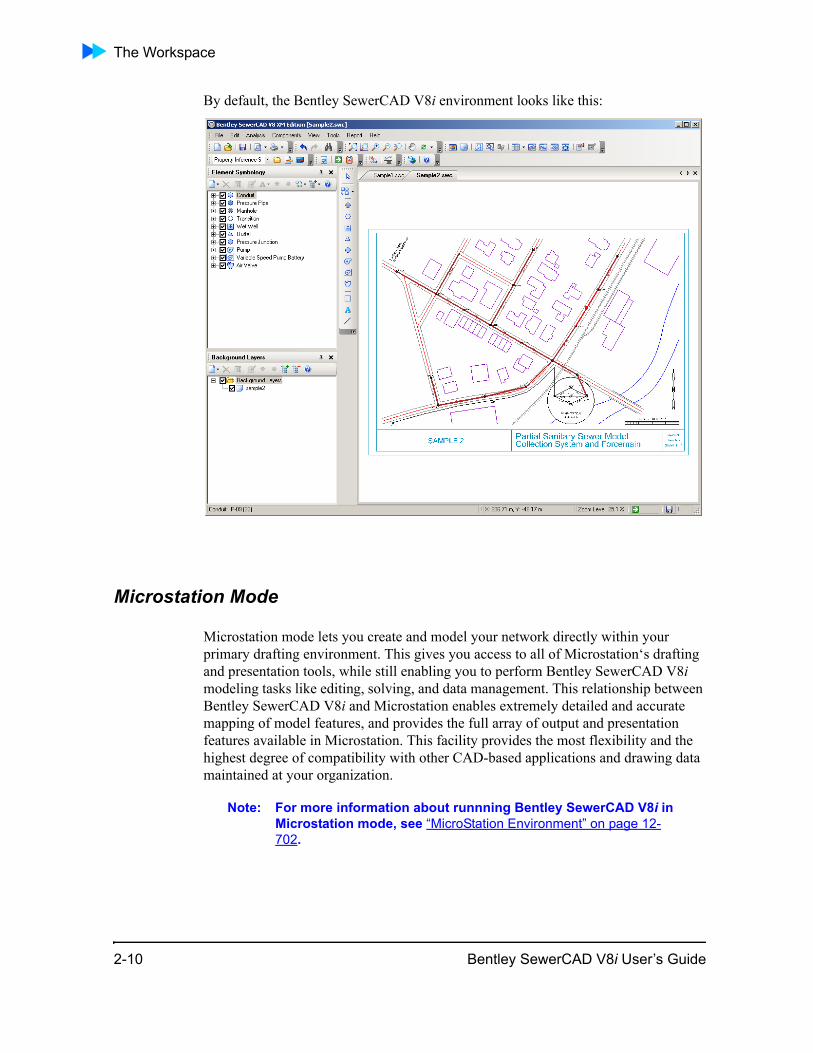
The WorkspaceYou use Bentley SewerCAD V8i in one of these modes:
• “Stand-Alone Editor” on page 2-9
• “Microstation Mode” on page 2-10
• “AutoCAD Mode” on page 2-11
Stand-Alone Editor
The Stand-Alone Editor is the workspace that contains the various managers, toolbars, and menus, along with the drawing pane, that make up the Bentley SewerCAD V8i interface. The Bentley SewerCAD V8i interface uses dockable windows and toolbars, so the position of the various interface elements can be manually adjusted to suit your preference.
Bentley SewerCAD V8i User’s Guide 2-9
The Workspace
By default, the Bentley SewerCAD V8i environment looks like this:
Microstation Mode
Microstation mode lets you create and model your network directly within your primary drafting environment. This gives you access to all of Microstation‘s drafting and presentation tools, while still enabling you to perform Bentley SewerCAD V8i modeling tasks like editing, solving, and data management. This relationship between Bentley SewerCAD V8i and Microstation enables extremely detailed and accurate mapping of model features, and provides the full array of output and presentation features available in Microstation. This facility provides the most flexibility and the highest degree of compatibility with other CAD-based applications and drawing data maintained at your organization.
Note: For more information about runnning Bentley SewerCAD V8i in Microstation mode, see “MicroStation Environment” on page 12-702.
2-10 Bentley SewerCAD V8i User’s Guide

Introducing the Workspace
AutoCAD Mode
AutoCAD mode lets you create and model your network directly within your primary drafting environment. This gives you access to all of AutoCAD’s drafting and presen-tation tools, while still enabling you to perform Bentley SewerCAD V8i modeling tasks like editing, solving, and data management. This relationship between Bentley SewerCAD V8i and AutoCAD enables extremely detailed and accurate mapping of model features, and provides the full array of output and presentation features avail-able in AutoCAD. This facility provides the most flexibility and the highest degree of compatibility with other CAD-based applications and drawing data maintained at your organization.
Note: For more information about runnning Bentley SewerCAD V8i in AutoCAD mode, see “Working in AutoCAD Mode” on page 13-711.
MenusMenus are located at the top of Bentley SewerCAD V8i stand-alone editor window and provide access to program commands, which are broken down by type of func-tionality.
The following menus are available:
• “File Menu” on page 2-11
• “Edit Menu” on page 2-15
• “Analysis Menu” on page 2-17
• “View Menu” on page 2-19
• “Tools Menu” on page 2-22
• “Report Menu” on page 2-24
• “Help Menu” on page 2-24
File Menu
The File menu contains the following commands:
New Creates a new project. When you select this command, a new untitled project is created.
Open Opens an existing project. When you select this command, the Open dialog box appears, allowing you to browse to the project to be opened.
Bentley SewerCAD V8i User’s Guide 2-11

Menus
Close Closes the current project without exiting the program.
Close All Closes all currently open projects.
Save Saves the current project.
Save As Saves the current project under a new project name and/or to a different directory location.
Save All Saves all currently open projects.
2-12 Bentley SewerCAD V8i User’s Guide
Introducing the Workspace
ProjectWise Opens a submenu containing the following commands:
• Open—Open an existing SewerCAD V8i project from ProjectWise. You are prompted to log into a ProjectWise datasource if you are not already logged in.
Note: Only projects that were originally saved into ProjectWise from the SewerCAD V8i application can be opened
• Save As—Saves the current project to a ProjectWise datasource. You are prompted to log into a ProjectWise datasource if you are not already logged in.
• Change Datasource—Lets you connect to a different ProjectWise datasource for future Open and Save As operations.
• Import—Lets you import the following file types into the ProjectWise project:
• SewerCAD V8 Database—Lets you import a Bentley SewerCAD V8i project database file.
• Submodel—Lets you import a SewerCAD submodel file.
• LandXML—Lets you import a LandXML file.
• StormCAD V8 —Lets you import a StormCAD V8 file.
• SewerGEMS V8 —Lets you import a SewerGEMS V8 file.
Note: For more information about using SewerCAD V8i with ProjectWise, see “Considerations for ProjectWise Users” on page 4-158
Bentley SewerCAD V8i User’s Guide 2-13
Menus
Import Opens a submenu containing the following commands:
• Bentley SewerCAD V8i Database—Lets you import a Bentley SewerCAD V8i project data-base file.
• Submodel—Lets you import a SewerCAD submodel file.
• LandXML—Lets you import a LandXML file.
• StormCAD V8—Lets you import a StormCAD V8 file.
• SewerGEMS V8 —Lets you import a SewerGEMS V8 file.
Export Opens a submenu containing the following commands:
• DXF—Lets you export the current network layout as a DXF drawing.
• Submodel—Exports the currently selected area of the network as a SewerCAD submodel file.
• LandXML—Exports the current project as a LandXML file.
Page Setup Defines the print settings that will be used when the current view is printed.
Print Preview Opens the Print Preview window, displaying the current view exactly as it will be printed. You can select whether you want the print preview to be Fit to Page or Scaled:
• Fit to Page—The view will be zoomed in or out so that the current view fits to a single page of the default page size.
• Scaled—The view will be scaled so that it matches the user-defined drawing scale (this is defined on the Drawing Tab of the Options dialog: Tools > Options).
2-14 Bentley SewerCAD V8i User’s Guide
Introducing the Workspace
Edit Menu
The Edit menu contains the following commands:
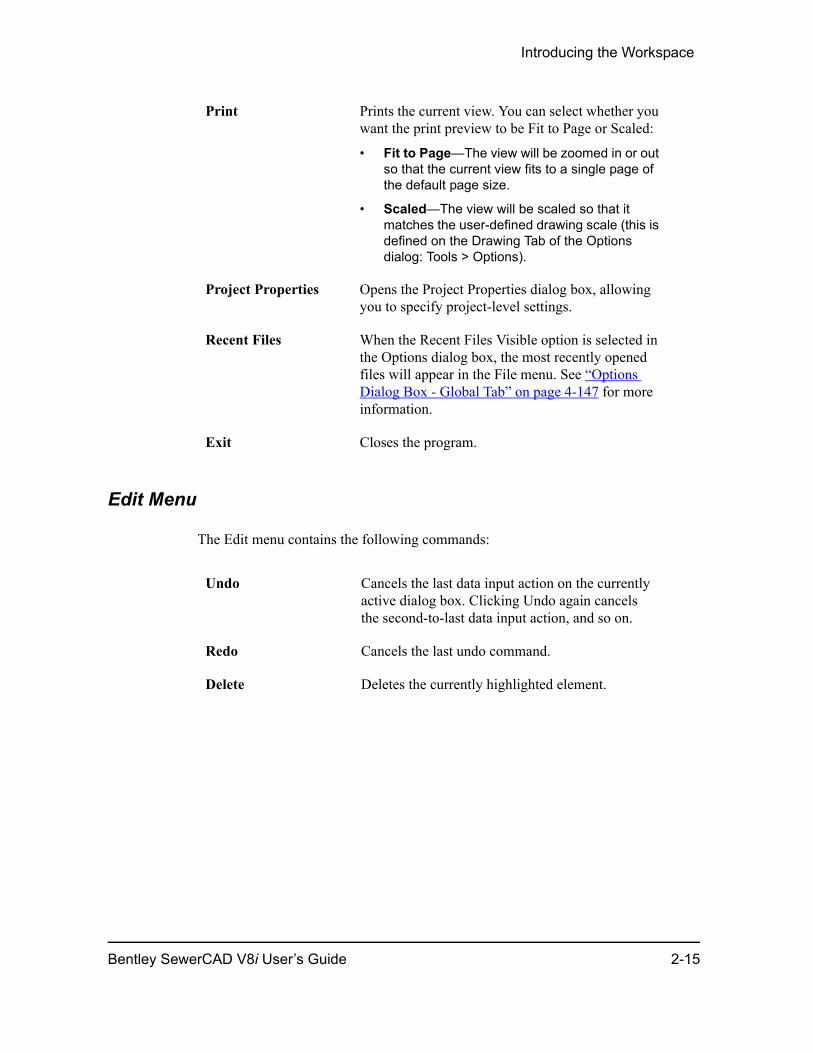
Print Prints the current view. You can select whether you want the print preview to be Fit to Page or Scaled:
• Fit to Page—The view will be zoomed in or out so that the current view fits to a single page of the default page size.
• Scaled—The view will be scaled so that it matches the user-defined drawing scale (this is defined on the Drawing Tab of the Options dialog: Tools > Options).
Project Properties Opens the Project Properties dialog box, allowing you to specify project-level settings.
Recent Files When the Recent Files Visible option is selected in the Options dialog box, the most recently opened files will appear in the File menu. See “Options Dialog Box - Global Tab” on page 4-147 for more information.
Exit Closes the program.
Undo Cancels the last data input action on the currently active dialog box. Clicking Undo again cancels the second-to-last data input action, and so on.
Redo Cancels the last undo command.
Delete Deletes the currently highlighted element.
Bentley SewerCAD V8i User’s Guide 2-15

Menus
Select By Polygon Lets you select elements in your model by drawing a polygon in the drawing pane. Click in the drawing pane to draw each side of the polygon. After the polygon has been drawn, right-click to select from the following options:• As Selected - All elements contained within
the polygon will be selected. Elements that were selected before the Select By Polygon opperation will be de-selected.
• Add to Selection - All elements contained within the polygon will be selected in addition to any elements that were selected before the Select By Polygon operation were performed.
• Invert Selection - All elements contained within the polygon that were selected before the operation will be de-selected; all elements contained within the polygon that were not selected before the operation will be selected
• Remove From Selection - All elements contained within the polygon that were selected before the operation will be de-selected.
Select All Selects all of the elements in the network.
Invert Selection Selects all currently unselected elements and deselects all currently selected ones.
Select by Element Opens a submenu listing all available element types. Select one of the element types from the submenu to select all elements of that type in the model.
Select by Attribute Opens a menu listing all available attribute types. Select one of the attribute types from the menu and the Query Builder dialog box opens.
Clear Selection Deselects the currently selected element(s).
Clear Highlight Removes Network Navigator highlighting for all elements.
Find Element Lets you find a specific element by entering the element’s label.
2-16 Bentley SewerCAD V8i User’s Guide
Introducing the Workspace
Analysis Menu
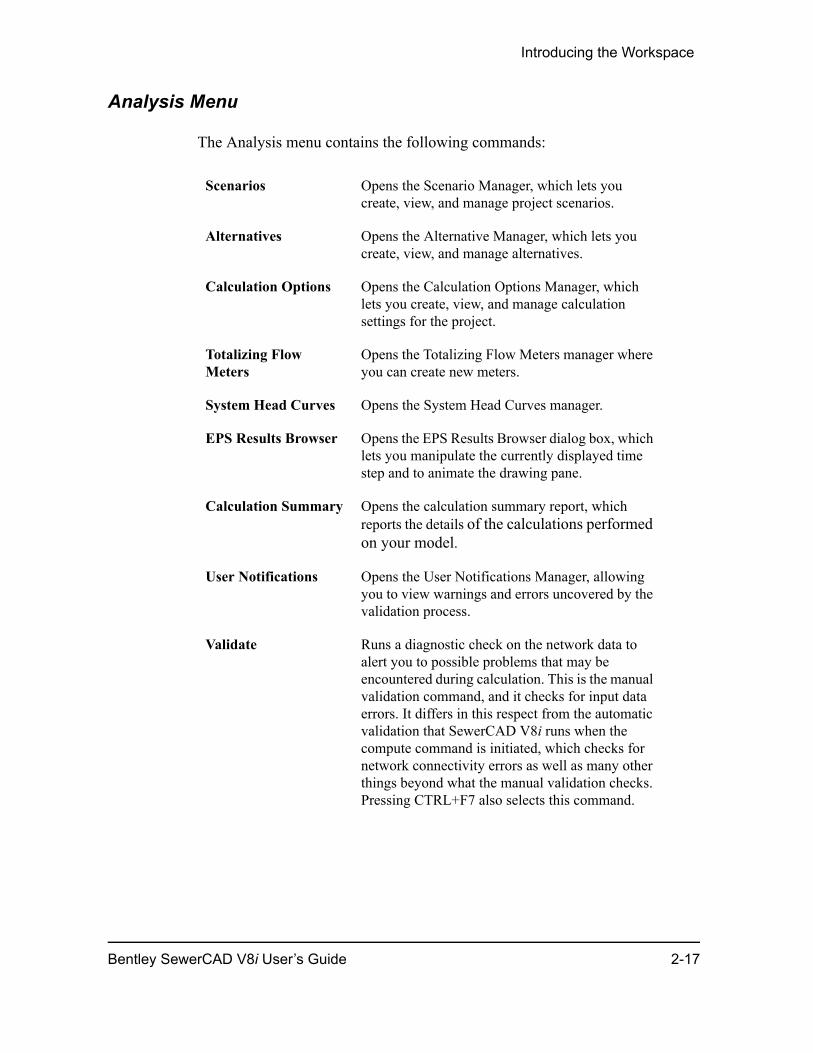
The Analysis menu contains the following commands:
Scenarios Opens the Scenario Manager, which lets you create, view, and manage project scenarios.
Alternatives Opens the Alternative Manager, which lets you create, view, and manage alternatives.
Calculation Options Opens the Calculation Options Manager, which lets you create, view, and manage calculation settings for the project.
Totalizing Flow Meters
Opens the Totalizing Flow Meters manager where you can create new meters.
System Head Curves Opens the System Head Curves manager.
EPS Results Browser Opens the EPS Results Browser dialog box, which lets you manipulate the currently displayed time step and to animate the drawing pane.
Calculation Summary Opens the calculation summary report, which reports the details of the calculations performed on your model.
User Notifications Opens the User Notifications Manager, allowing you to view warnings and errors uncovered by the validation process.
Validate Runs a diagnostic check on the network data to alert you to possible problems that may be encountered during calculation. This is the manual validation command, and it checks for input data errors. It differs in this respect from the automatic validation that SewerCAD V8i runs when the compute command is initiated, which checks for network connectivity errors as well as many other things beyond what the manual validation checks. Pressing CTRL+F7 also selects this command.
Bentley SewerCAD V8i User’s Guide 2-17
Menus
Components Menu
The Components menu contains the following commands:
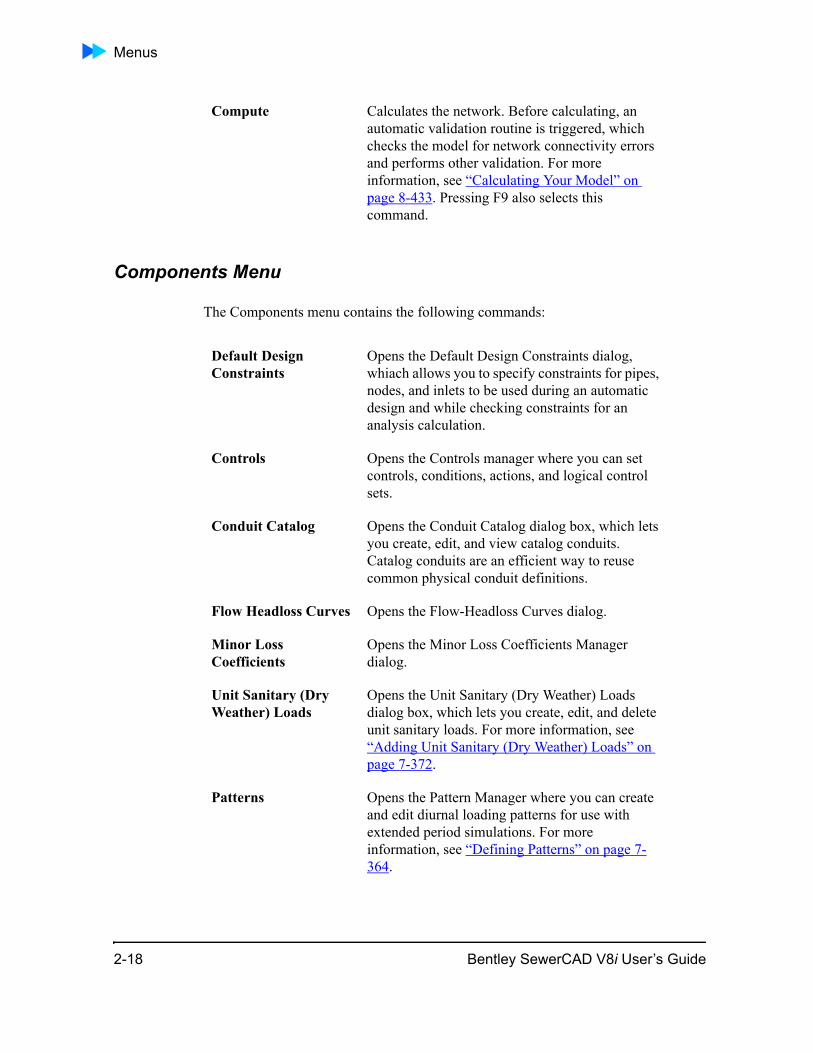
Compute Calculates the network. Before calculating, an automatic validation routine is triggered, which checks the model for network connectivity errors and performs other validation. For more information, see “Calculating Your Model” on page 8-433. Pressing F9 also selects this command.
Default Design Constraints
Opens the Default Design Constraints dialog, whiach allows you to specify constraints for pipes, nodes, and inlets to be used during an automatic design and while checking constraints for an analysis calculation.
Controls Opens the Controls manager where you can set controls, conditions, actions, and logical control sets.
Conduit Catalog Opens the Conduit Catalog dialog box, which lets you create, edit, and view catalog conduits. Catalog conduits are an efficient way to reuse common physical conduit definitions.
Flow Headloss Curves Opens the Flow-Headloss Curves dialog.
Minor Loss Coefficients
Opens the Minor Loss Coefficients Manager dialog.
Unit Sanitary (Dry Weather) Loads
Opens the Unit Sanitary (Dry Weather) Loads dialog box, which lets you create, edit, and delete unit sanitary loads. For more information, see “Adding Unit Sanitary (Dry Weather) Loads” on page 7-372.
Patterns Opens the Pattern Manager where you can create and edit diurnal loading patterns for use with extended period simulations. For more information, see “Defining Patterns” on page 7-364.
2-18 Bentley SewerCAD V8i User’s Guide

Introducing the Workspace
View Menu
The View menu contains the following commands:
Pattern Setups Opens the Pattern Setup Manager where you can associate diurnal patterns with the appropriate unit sanitary loads for a given scenario. For more information, see “Defining Pattern Setups” on page 7-367.
Extreme Flows Opens the Extreme Flows dialog.
Extreme Flow Setups Opens the Extreme Flow Setups dialog.
Pump Definitions Opens the Pump Definitions dialog box, which lets you view, edit, and create pump curve definitions. For more information, see “Pump Curve Definitions Dialog Box” on page 6-235.
Time Series Field Data
Opens the Time Series Field Data dialog.
Engineering Libraries Opens the Engineering Libraries Manager.
Element Symbology Opens the Element Symbology Manager, which lets you create, view, and manage annotation and color-coding in your project.
Background Layers Opens the Background Layers Manager, which lets you create, view, and manage the background layers associated with the project.
Network Navigator Opens the Network Navigator.
Selection Sets Opens the Selection Sets Manager, which lets you create, view, and manage selection sets associated with the project.
Queries Opens the Query Manager, which lets you create SQL expressions for use with selection sets and FlexTables. For more information, see ADD LINK
Bentley SewerCAD V8i User’s Guide 2-19
Menus
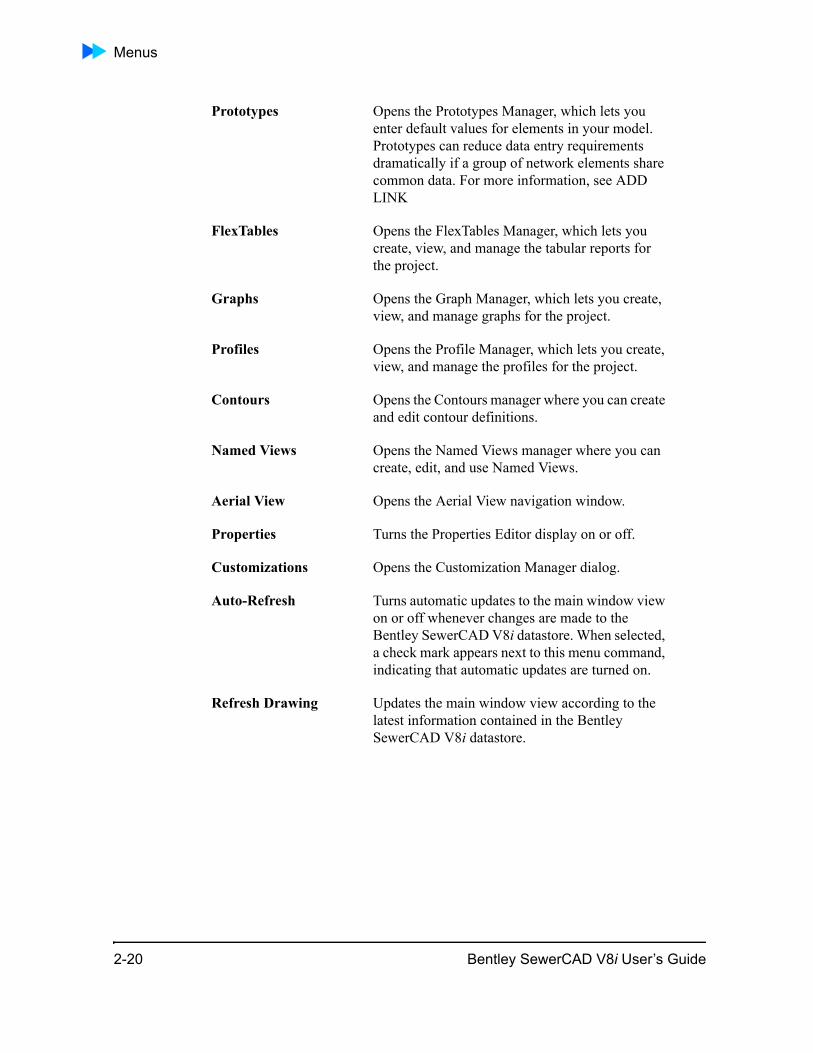
Prototypes Opens the Prototypes Manager, which lets you enter default values for elements in your model. Prototypes can reduce data entry requirements dramatically if a group of network elements share common data. For more information, see ADD LINK
FlexTables Opens the FlexTables Manager, which lets you create, view, and manage the tabular reports for the project.
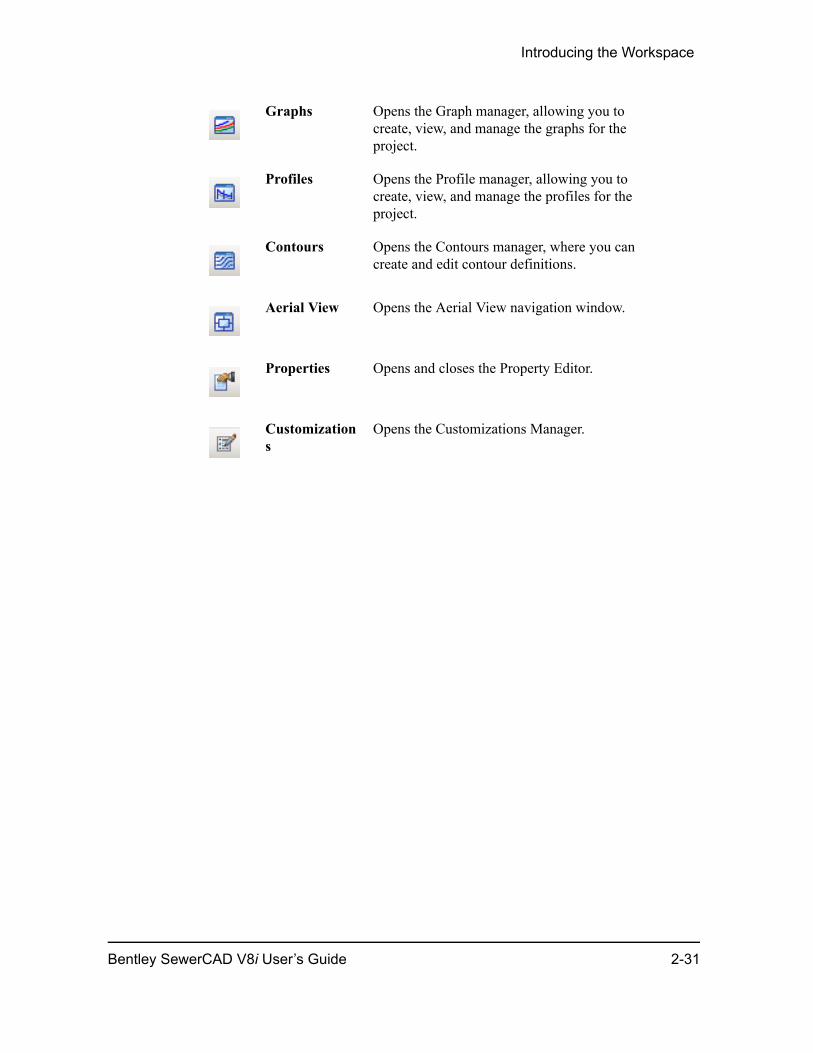
Graphs Opens the Graph Manager, which lets you create, view, and manage graphs for the project.
Profiles Opens the Profile Manager, which lets you create, view, and manage the profiles for the project.
Contours Opens the Contours manager where you can create and edit contour definitions.
Named Views Opens the Named Views manager where you can create, edit, and use Named Views.
Aerial View Opens the Aerial View navigation window.
Properties Turns the Properties Editor display on or off.
Customizations Opens the Customization Manager dialog.
Auto-Refresh Turns automatic updates to the main window view on or off whenever changes are made to the Bentley SewerCAD V8i datastore. When selected, a check mark appears next to this menu command, indicating that automatic updates are turned on.
Refresh Drawing Updates the main window view according to the latest information contained in the Bentley SewerCAD V8i datastore.
2-20 Bentley SewerCAD V8i User’s Guide
Introducing the Workspace
Zoom Opens a submenu containing the following commands:
• Zoom Extents—Sets the view so that the entire network is visible in the drawing pane.
• Zoom Window—Activates the manual zoom tool, which lets you specify a portion of the drawing to enlarge.
• Zoom In—Enlarges the size of the model in the drawing pane.
• Zoom Out—Reduces the size of the model in the drawing pane.
• Zoom Realtime—Enables the realtime zoom tool, which lets you zoom in and out by moving the mouse while holding down the left mouse button.
• Zoom Center—Opens the Zoom Center dialog box, which lets you enter drawing coor-dinates that will be centered in the drawing pane.
• Zoom to Selection—Zooms to the element(s) that are currently selected in the drawing pane.
• Zoom Previous—Resets the zoom level to the last setting.
• Zoom Next—Resets the zoom level to the setting that was active before a Zoom Previous command was executed.
Pan Activates the Pan tool, which lets you move the model within the drawing pane. When you select this command, the cursor changes to a hand, indicating that you can click and hold the left mouse button and move the mouse to move the drawing.
Toolbars Opens a submenu that lists each of the available toolbars. Select one of the toolbars in the submenu to turn that toolbar on or off. For more information, see “Toolbars” on page 2-25.
Reset Workspace Resets the Bentley SewerCAD V8i workspace so that the dockable managers appear in their default factory-set positions.
Bentley SewerCAD V8i User’s Guide 2-21
Menus
Tools Menu
The Tools menu contains the following commands:
Active Topology Selection
Opens a Select dialog to select elements in the drawing to make them Inactive or Active.
ModelBuilder Opens the ModelBuilder Connections Manager, which lets you create, edit, and manage ModelBuilder connections to be used in the model-building/model-synchronizing process. For more information, see “ModelBuilder Connections Manager” on page 5-175.
TRex Opens the TRex node elevation assignment tool.
LoadBuilder Opens the LoadBuilder manager where you can assign demands to model nodes using data from outside sources.
Thiessen Polygon Opens the Wizard used to create Thiessen polygons for use with LoadBuilder.
Inflow Control Center Opens the Inflow Control Center, allowing you to create, edit, and delete sanitary inflow definitions.
Element Property Inferencing
Opes the Element Property Inferencing dialog.
Hyperlinks Lets you associate external files, such as pictures or movie files, with elements. For more information, see “Adding Hyperlinks to Elements” on page 6-326.
User Data Extensions User Data Extensions—Opens the User Data Extension dialog box, which lets you add and define custom data fields. For example, you can add new fields such as the pipe installation date. For more information, see “User Data Extensions” on page 6-337.
Sanitary Load Control Center
Opens the Sanitary Load Control Center, allowing you to create, edit, and delete sanitary load definitions.
2-22 Bentley SewerCAD V8i User’s Guide
Introducing the Workspace
Database Utilities Opens a submenu containing the following commands:
• Compact Database—When you delete data from a Bentley SewerCAD V8i project, such as elements or alternatives, the database store that Bentley SewerCAD V8i uses can become frag-mented, causing unnecessarily large data files, which impact performance substantially. Compacting the database eliminates the empty data records, thereby defragmenting the datastore and improving the performance of the file.
Note: Every tenth time a file is saved, Bentley SewerCAD V8i will automatically prompt you to compact the database. If you open a file without saving it, the count does not go up. If you open and save a file multiple times in the same session, the count only goes up on the first save. If you open, save, and close the file, the count goes up. Click Yes to compact the database, or no to close the prompt dialog box without compacting. Since compacting the database can take time, especially for larger models, you may want to postpone the compact procedure until a later time. You can modify how Bentley SewerCAD V8i compacts the database in the Options dialog box.
• Synchronize Drawing—Synchronizes the current model drawing with the project database.
• Update Database cache—Updates the current model to reflect any changes made in the database.
• Update Results from Project Directory—This command copies the model result files (if any) from the project directory (the directory where the project .mdb file is saved) to the custom result file directory. The custom result directory is specified in Tools>Options>Project tab. This allows you to make a copy of the results that may exist in the model's save directory and replace the current results being worked on with them.
• Copy Results to Project Directory—This command copies the result files that are currently being used by the model to the project directory (where the project .mdb is stored).
Bentley SewerCAD V8i User’s Guide 2-23
• Batch Update Conduit Descriptions—Updates the Conduit Description field to reflect any changes made to the underlying attributes.

Menus
Report Menu
The Report menu contains the following commands:
Help Menu
The Help menu contains the following commands:
Layout Opens a submenu that lists each of the available element types. Select one of the element types in the submenu to place that element in your model.
External Tools Run an existing external tool or create a new one by opening up the External Tools manager.
Options Opens the Options dialog box, which lets you change global settings such as display pane settings, drawing scale, units, display precision and format used, and element labeling.
Element Tables Opens a submenu that lets you display FlexTables for any link or node element. These predefined FlexTables contain most of the input data and results for each instance of the selected element in the model.
Element Details Allows you to select one or more elements from the drawing view. A report is generated containing the details of the selected element(s).
Scenario Summary Opens the Scenario Summary Report.
Project Inventory Opens the Project Inventory Report, which contains the number of each of the various element types that are in the network.
Conduit and Pressure Pipe Inventory
Opens the Conduit and Pressure Pipe Inventory report.
Report Options Opens the Report Options box where you can set Headers and Footers for the predefined reports.
2-24 Bentley SewerCAD V8i User’s Guide
Introducing the Workspace
ToolbarsToolbars provide access to frequently used menu commands and are organized by the type of functionality offered. Many of the toolbars have additional buttons available that are not displayed by default. You can display these additional buttons by following the procedure in “Adding and Removing Toolbar Buttons” on page 2-36.
The following toolbars are available:
• “Layout Toolbar” on page 2-27
• “Standard Toolbar” on page 2-28
• “Edit Toolbar” on page 2-30
• “View Toolbar” on page 2-30
Bentley SewerCAD V8i Help
Opens the online help Table of Contents.
Quick Start Lessons Opens the online help to the Quick Start Lessons Overview topic.
Welcome Dialog Opens the Welcome dialog box.
Check for Updates Opens your Web browser to the our Web site, allowing you to check for Bentley SewerCAD V8i updates.
Bentley Institute Training
Opens your browser to the Bentley Institute Training web site.
Bentley Professional Services
Opens your browser to the Bentley Professional Services web site.
Online Support Opens your browser to SELECTservices area of the Bentley web site.
Discussion Groups Opens your browser to Bentley’s Haestad Discussion Groups.
Bentley.com Opens the home page on the Bentley web site.
About Bentley SewerCAD V8i
Opens the About Bentley SewerCAD V8i dialog box, which displays copyright information about the product, registration information, and the current version number of this release.
Bentley SewerCAD V8i User’s Guide 2-25

Toolbars
• “Scenarios Toolbar” on page 2-32
• “Analysis Toolbar” on page 2-32
• “Compute Toolbar” on page 2-33
• “Tools Toolbar” on page 2-33
• “Help Toolbar” on page 2-34
• “Zoom Toolbar” on page 2-34
2-26 Bentley SewerCAD V8i User’s Guide
Introducing the Workspace
Layout Toolbar
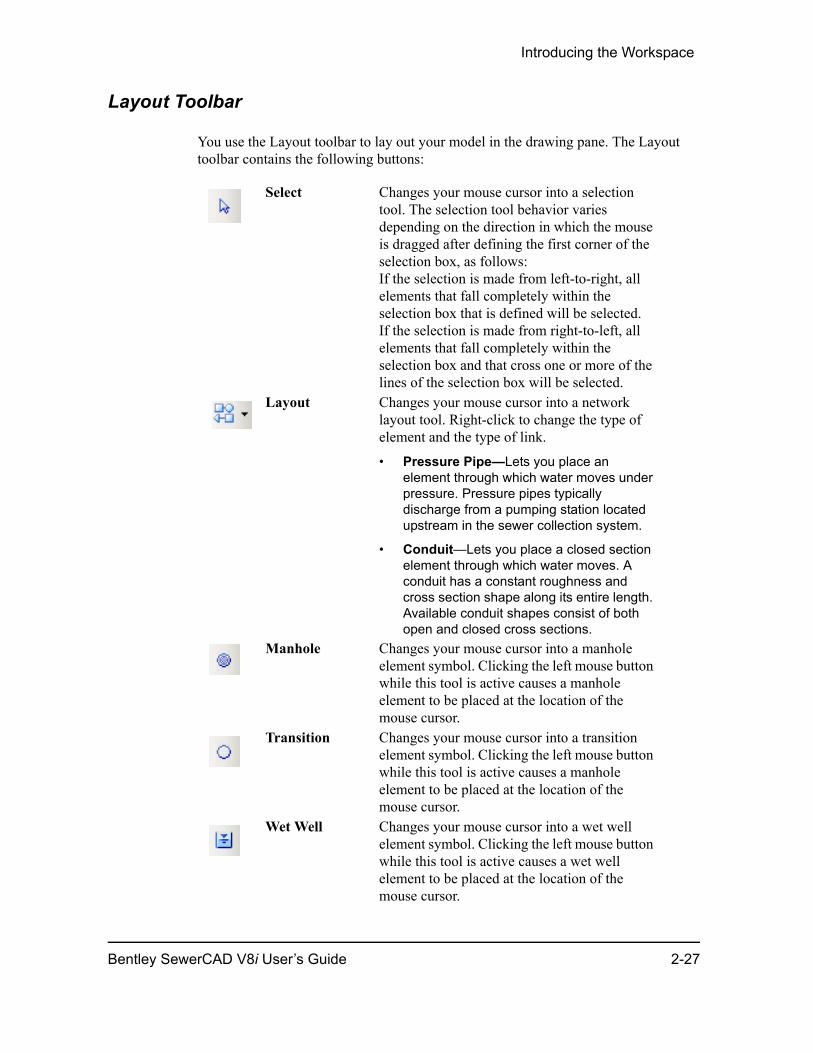
You use the Layout toolbar to lay out your model in the drawing pane. The Layout toolbar contains the following buttons:
Select Changes your mouse cursor into a selection tool. The selection tool behavior varies depending on the direction in which the mouse is dragged after defining the first corner of the selection box, as follows:If the selection is made from left-to-right, all elements that fall completely within the selection box that is defined will be selected.If the selection is made from right-to-left, all elements that fall completely within the selection box and that cross one or more of the lines of the selection box will be selected.
Layout Changes your mouse cursor into a network layout tool. Right-click to change the type of element and the type of link.
• Pressure Pipe—Lets you place an element through which water moves under pressure. Pressure pipes typically discharge from a pumping station located upstream in the sewer collection system.
• Conduit—Lets you place a closed section element through which water moves. A conduit has a constant roughness and cross section shape along its entire length. Available conduit shapes consist of both open and closed cross sections.
Manhole Changes your mouse cursor into a manhole element symbol. Clicking the left mouse button while this tool is active causes a manhole element to be placed at the location of the mouse cursor.
Transition Changes your mouse cursor into a transition element symbol. Clicking the left mouse button while this tool is active causes a manhole element to be placed at the location of the mouse cursor.
Wet Well Changes your mouse cursor into a wet well element symbol. Clicking the left mouse button while this tool is active causes a wet well element to be placed at the location of the mouse cursor.
Bentley SewerCAD V8i User’s Guide 2-27
Toolbars
Standard Toolbar
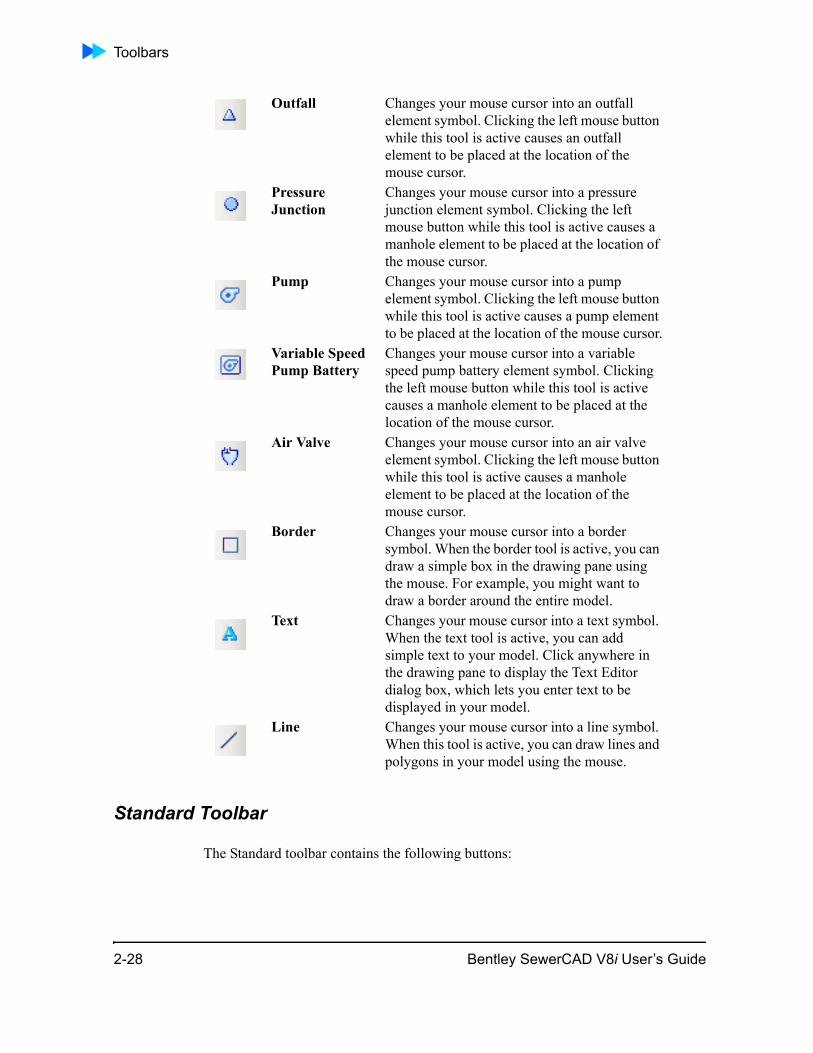
The Standard toolbar contains the following buttons:
Outfall Changes your mouse cursor into an outfall element symbol. Clicking the left mouse button while this tool is active causes an outfall element to be placed at the location of the mouse cursor.
Pressure Junction
Changes your mouse cursor into a pressure junction element symbol. Clicking the left mouse button while this tool is active causes a manhole element to be placed at the location of the mouse cursor.
Pump Changes your mouse cursor into a pump element symbol. Clicking the left mouse button while this tool is active causes a pump element to be placed at the location of the mouse cursor.
Variable Speed Pump Battery
Changes your mouse cursor into a variable speed pump battery element symbol. Clicking the left mouse button while this tool is active causes a manhole element to be placed at the location of the mouse cursor.
Air Valve Changes your mouse cursor into an air valve element symbol. Clicking the left mouse button while this tool is active causes a manhole element to be placed at the location of the mouse cursor.
Border Changes your mouse cursor into a border symbol. When the border tool is active, you can draw a simple box in the drawing pane using the mouse. For example, you might want to draw a border around the entire model.
Text Changes your mouse cursor into a text symbol. When the text tool is active, you can add simple text to your model. Click anywhere in the drawing pane to display the Text Editor dialog box, which lets you enter text to be displayed in your model.
Line Changes your mouse cursor into a line symbol. When this tool is active, you can draw lines and polygons in your model using the mouse.
2-28 Bentley SewerCAD V8i User’s Guide
Introducing the Workspace
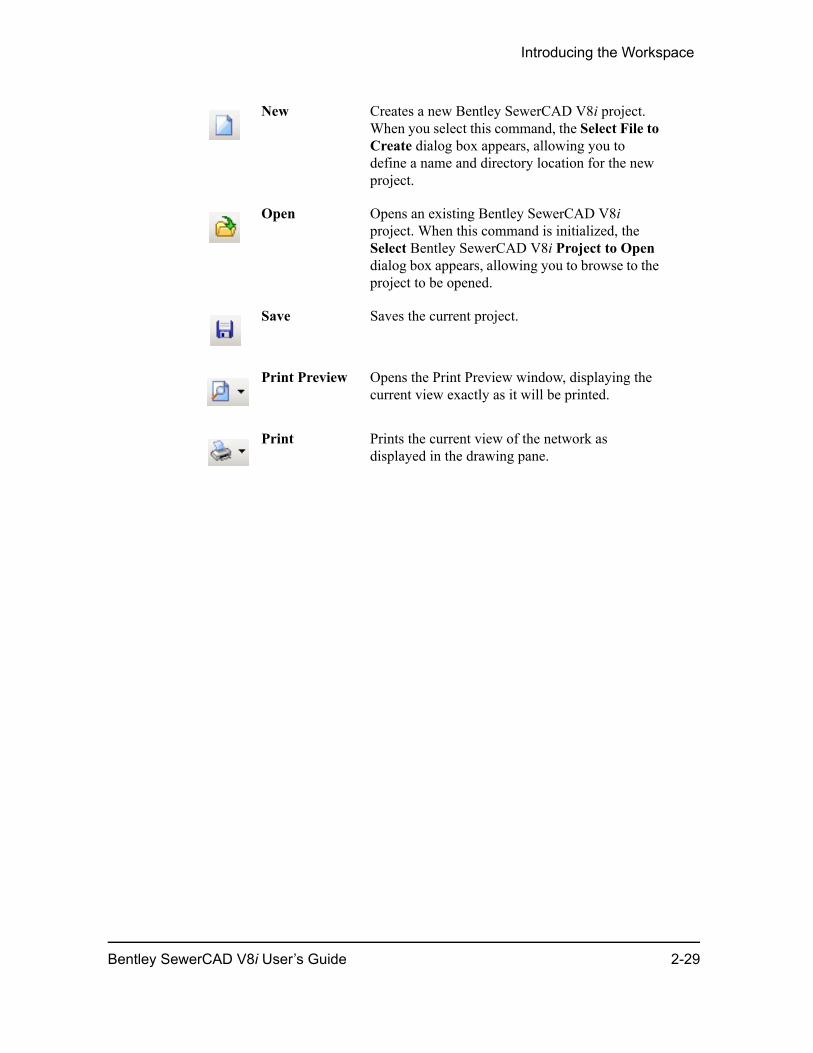
New Creates a new Bentley SewerCAD V8i project. When you select this command, the Select File to Create dialog box appears, allowing you to define a name and directory location for the new project.
Open Opens an existing Bentley SewerCAD V8i project. When this command is initialized, the Select Bentley SewerCAD V8i Project to Open dialog box appears, allowing you to browse to the project to be opened.
Save Saves the current project.
Print Preview Opens the Print Preview window, displaying the current view exactly as it will be printed.
Print Prints the current view of the network as displayed in the drawing pane.
Bentley SewerCAD V8i User’s Guide 2-29
Toolbars
Edit Toolbar
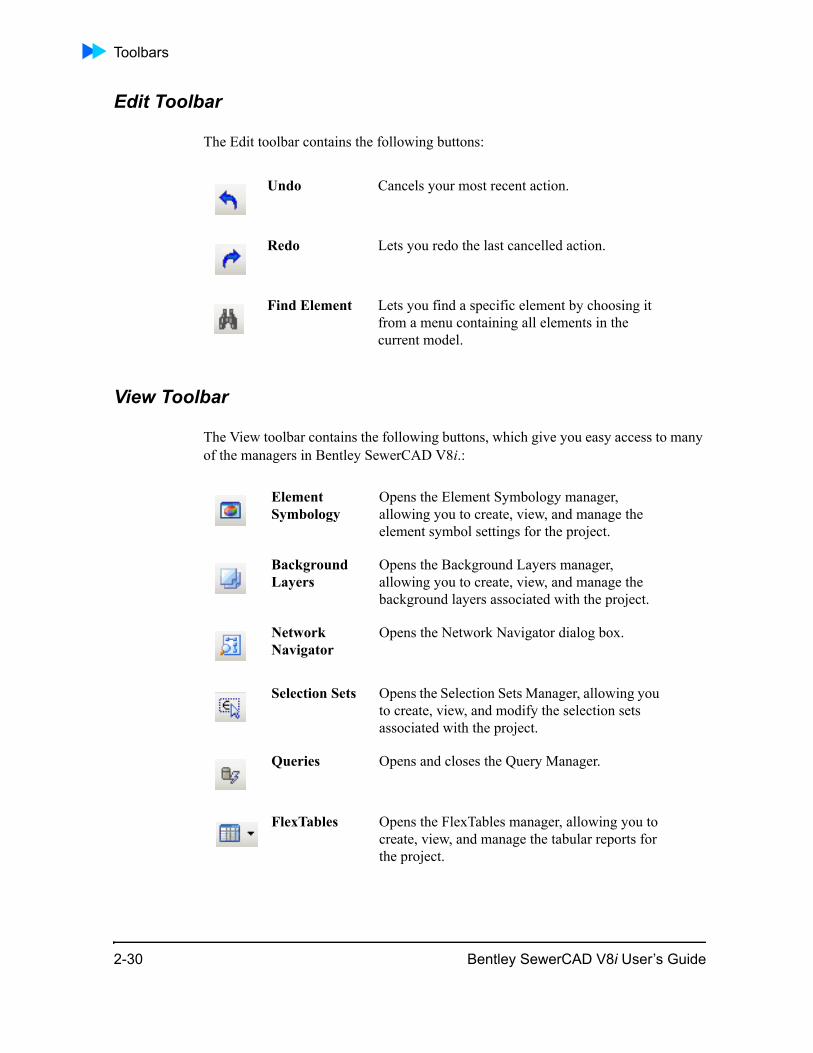
The Edit toolbar contains the following buttons:
View Toolbar
The View toolbar contains the following buttons, which give you easy access to many of the managers in Bentley SewerCAD V8i.:
Undo Cancels your most recent action.
Redo Lets you redo the last cancelled action.
Find Element Lets you find a specific element by choosing it from a menu containing all elements in the current model.
Element Symbology
Opens the Element Symbology manager, allowing you to create, view, and manage the element symbol settings for the project.
Background Layers
Opens the Background Layers manager, allowing you to create, view, and manage the background layers associated with the project.
Network Navigator
Opens the Network Navigator dialog box.
Selection Sets Opens the Selection Sets Manager, allowing you to create, view, and modify the selection sets associated with the project.
Queries Opens and closes the Query Manager.
FlexTables Opens the FlexTables manager, allowing you to create, view, and manage the tabular reports for the project.
2-30 Bentley SewerCAD V8i User’s Guide
Introducing the Workspace
Graphs Opens the Graph manager, allowing you to create, view, and manage the graphs for the project.
Profiles Opens the Profile manager, allowing you to create, view, and manage the profiles for the project.
Contours Opens the Contours manager, where you can create and edit contour definitions.
Aerial View Opens the Aerial View navigation window.
Properties Opens and closes the Property Editor.
Customizations
Opens the Customizations Manager.
Bentley SewerCAD V8i User’s Guide 2-31
Toolbars
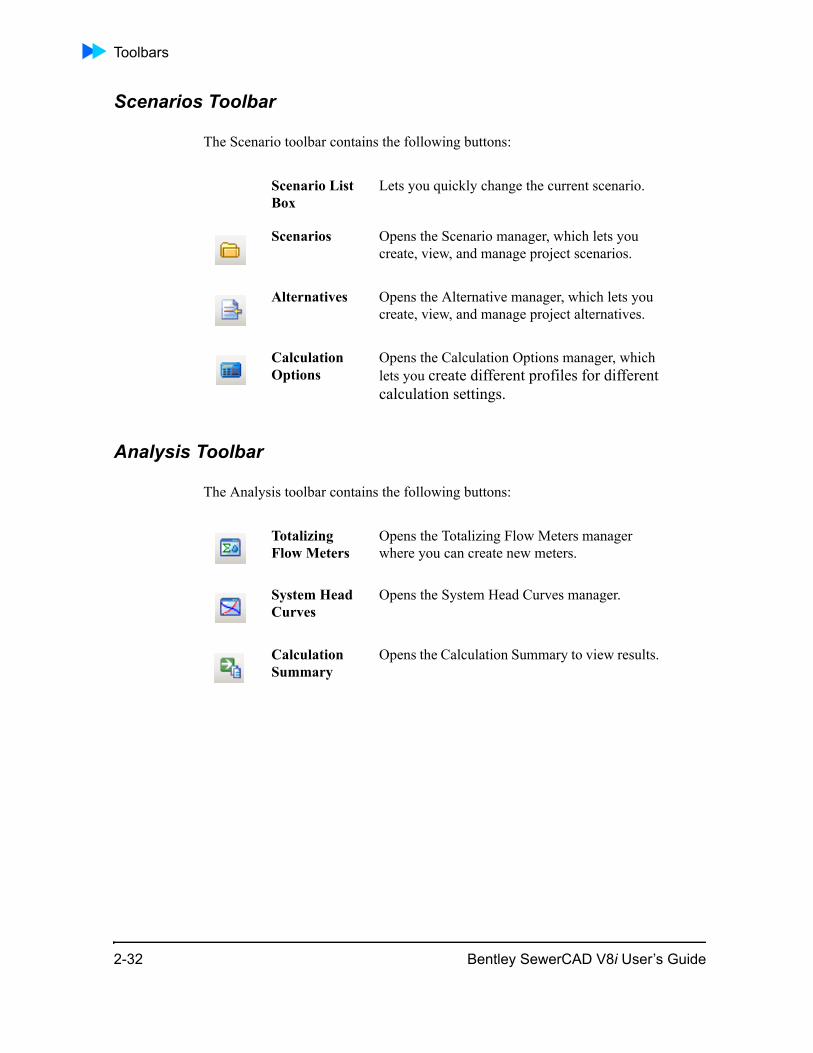
Scenarios Toolbar
The Scenario toolbar contains the following buttons:
Analysis Toolbar
The Analysis toolbar contains the following buttons:
Scenario List Box
Lets you quickly change the current scenario.
Scenarios Opens the Scenario manager, which lets you create, view, and manage project scenarios.
Alternatives Opens the Alternative manager, which lets you create, view, and manage project alternatives.
Calculation Options
Opens the Calculation Options manager, which lets you create different profiles for different calculation settings.
Totalizing Flow Meters
Opens the Totalizing Flow Meters manager where you can create new meters.
System Head Curves
Opens the System Head Curves manager.
Calculation Summary
Opens the Calculation Summary to view results.
2-32 Bentley SewerCAD V8i User’s Guide
Introducing the Workspace
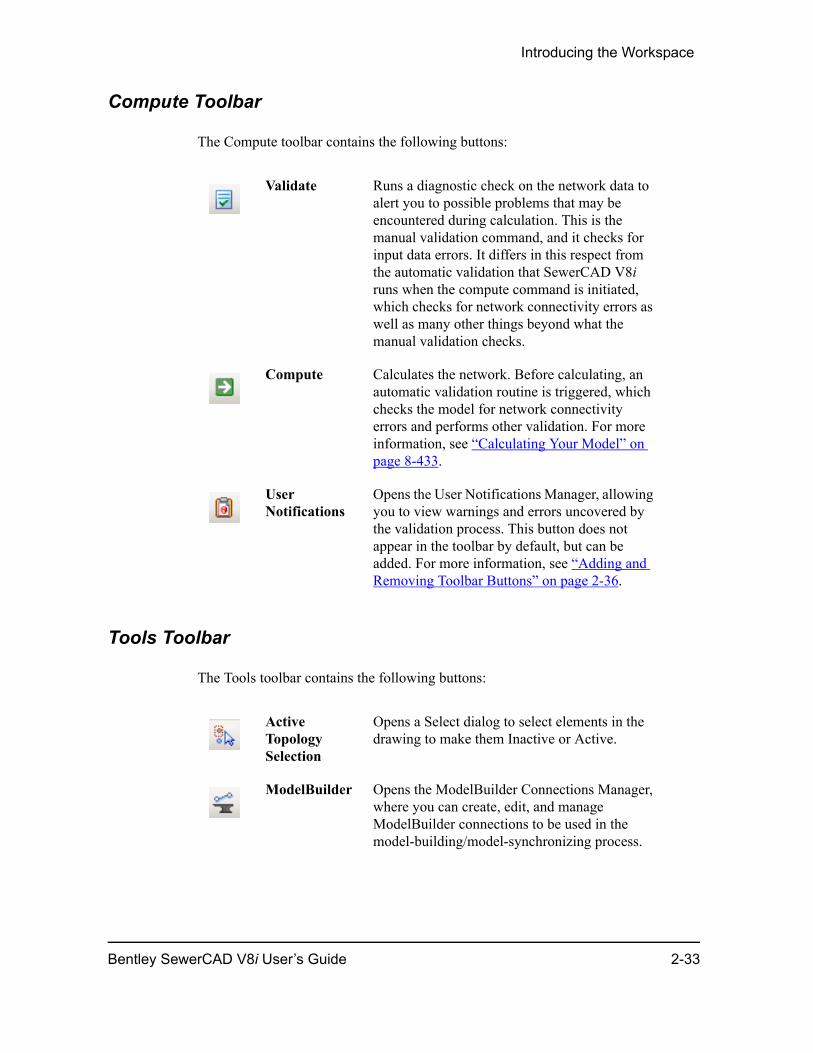
Compute Toolbar
The Compute toolbar contains the following buttons:
Tools Toolbar
The Tools toolbar contains the following buttons:
Validate Runs a diagnostic check on the network data to alert you to possible problems that may be encountered during calculation. This is the manual validation command, and it checks for input data errors. It differs in this respect from the automatic validation that SewerCAD V8i runs when the compute command is initiated, which checks for network connectivity errors as well as many other things beyond what the manual validation checks.
Compute Calculates the network. Before calculating, an automatic validation routine is triggered, which checks the model for network connectivity errors and performs other validation. For more information, see “Calculating Your Model” on page 8-433.
User Notifications
Opens the User Notifications Manager, allowing you to view warnings and errors uncovered by the validation process. This button does not appear in the toolbar by default, but can be added. For more information, see “Adding and Removing Toolbar Buttons” on page 2-36.
Active Topology Selection
Opens a Select dialog to select elements in the drawing to make them Inactive or Active.
ModelBuilder Opens the ModelBuilder Connections Manager, where you can create, edit, and manage ModelBuilder connections to be used in the model-building/model-synchronizing process.
Bentley SewerCAD V8i User’s Guide 2-33
Toolbars
Help Toolbar
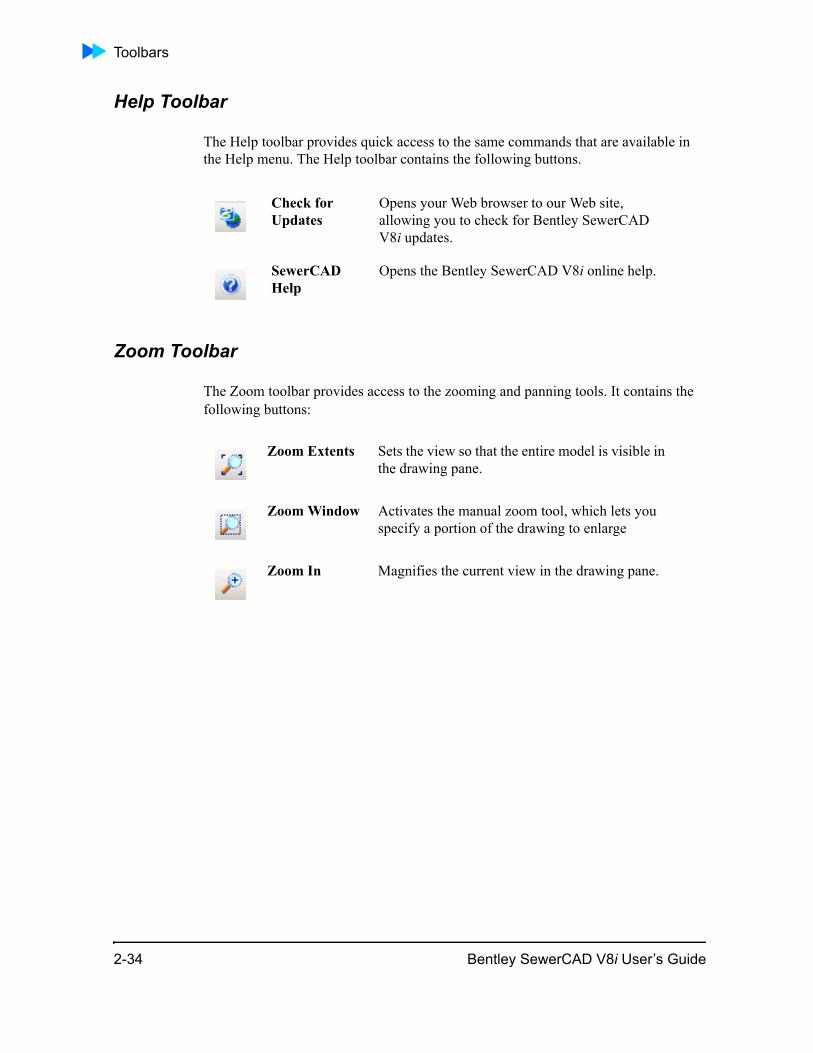
The Help toolbar provides quick access to the same commands that are available in the Help menu. The Help toolbar contains the following buttons.
Zoom Toolbar
The Zoom toolbar provides access to the zooming and panning tools. It contains the following buttons:
Check for Updates
Opens your Web browser to our Web site, allowing you to check for Bentley SewerCAD V8i updates.
SewerCAD Help
Opens the Bentley SewerCAD V8i online help.
Zoom Extents Sets the view so that the entire model is visible in the drawing pane.
Zoom Window Activates the manual zoom tool, which lets you specify a portion of the drawing to enlarge
Zoom In Magnifies the current view in the drawing pane.
2-34 Bentley SewerCAD V8i User’s Guide
Introducing the Workspace
Zoom Out Reduces the current view in the drawing pane.
Zoom Realtime
Enables the realtime zoom tool, which lets you zoom in and out by moving the mouse while the left mouse button is depressed.
Pan Activates the Pan tool, which lets you move the model within the drawing pane. When you select this command, the cursor changes to a hand, indicating that you can click and hold the left mouse button and move the mouse to move the drawing.
Refresh Drawing
Updates the main window view according to the latest information contained in the Bentley SewerCAD V8i datastore. If you click the arrow a submenu will open offering the following commands:
• Auto-refresh: When this control is toggled on, the drawing will automatically refresh.
• Refresh Drawing: Updates the main window view according to the latest information contained in the datastore.
Bentley SewerCAD V8i User’s Guide 2-35
Customizing the Toolbars
Customizing the ToolbarsYou can customize Bentley SewerCAD V8i toolbars in any of the following ways:
• “Adding and Removing Toolbar Buttons” on page 2-36
• “Controlling Toolbars” on page 2-36
Adding and Removing Toolbar Buttons
Toolbar buttons represent Bentley SewerCAD V8i menu commands. You can remove buttons from any toolbar, and add commands to any toolbar on the Commands tab of the Customize dialog box.
To add or remove a button from a toolbar:
1. Click the down arrow on the end of the toolbar you want to customize. A series of submenus appear, allowing you to select or deselect any button in that toolbar.
2. Click Add or Remove Buttons then move the mouse cursor to the right until all of the submenus appear, as shown in the following figure:
3. Click the space to left of the toolbar button you want to add. A check mark appears in the submenu and the button appears in the toolbar.
or
Click the check mark next to the toolbar button you want to remove. The button will no longer appear in the toolbar.
Controlling Toolbars
You can control toolbars in Bentley SewerCAD V8i on the Toolbars tab of the Customize dialog box. You can turn toolbars on and off, or move the toolbar to a different location in the workspace.
2-36 Bentley SewerCAD V8i User’s Guide
Introducing the Workspace
To turn toolbars off:
Click View > Toolbars, then click the check mark next to the toolbar you want to turn off.
To turn toolbars on:
Click View > Toolbars, then click in the space to the left of the toolbar you want to turn on.
To move a toolbar to a different location in the workspace:
Move your mouse to the vertical dotted line on the left side of any toolbar, then drag the toolbar to the desired location. If you move a toolbar away from the other toolbar, the toolbar becomes a floating dialog box.
Related Topic
• “Adding and Removing Toolbar Buttons” on page 2-36
Dynamic Manager DisplayYou access most of the features in Bentley SewerCAD V8i through a system of dynamic windows called managers. For example, the look of the elements is controlled in the Element Symbology manager while animation is controlled in the EPS Results Browser manager.
When you first start Bentley SewerCAD V8i, only two managers are displayed: the Element Symbology and Background Layers managers. This is the default workspace. You can display as many managers as you want and move them to any location in the Bentley SewerCAD V8i workspace.
To return to the default workspace:
Click View > Reset Workspace.
• If you return to the default workspace, the next time you start Bentley SewerCAD V8i, you will lose any customizations you might have made to the dynamic manager display.
Bentley SewerCAD V8i User’s Guide 2-37
Dynamic Manager Display
Opening Managers
To open a manager:
1. Do one of the following:
– Select the desired manager from the View menu.
– Click a manager’s button on one of the toolbars.
– Press the keyboard shortcut for the desired manager.
2. If the manager is not already docked, you can drag it to the top, left- or right-side, or bottom of the SewerCAD V8i window to dock it. For more information on docking managers, see “Customizing Managers” on page 2-40.
Bentley SewerCAD V8i Managers
The following table lists all the Bentley SewerCAD V8i managers, their toolbar buttons, and keyboard shortcuts.
Toolbar Button Manager
Keyboard Shortcut
Scenarios—lets you build a model run from alternatives. For more information, see “Scenario Manager” on page 9-471.
ALT+1
Alternatives—lets you create and manage alternatives. For more information, see “Alternative Manager” on page 9-475.
ALT+2
Calculation Options—lets you set parameters for the numerical engine. For more information, see “Calculation Options Manager” on page 8-433.
ALT+3
Element Symbology—controls how elements look and what attributes are displayed. For more information, see “Element Symbology Manager” on page 10-540.
CTRL+1
Background Layers—lets you control the display of background layers. For more information, see “Background Layer Manager” on page 10-531.
CTRL+2
2-38 Bentley SewerCAD V8i User’s Guide
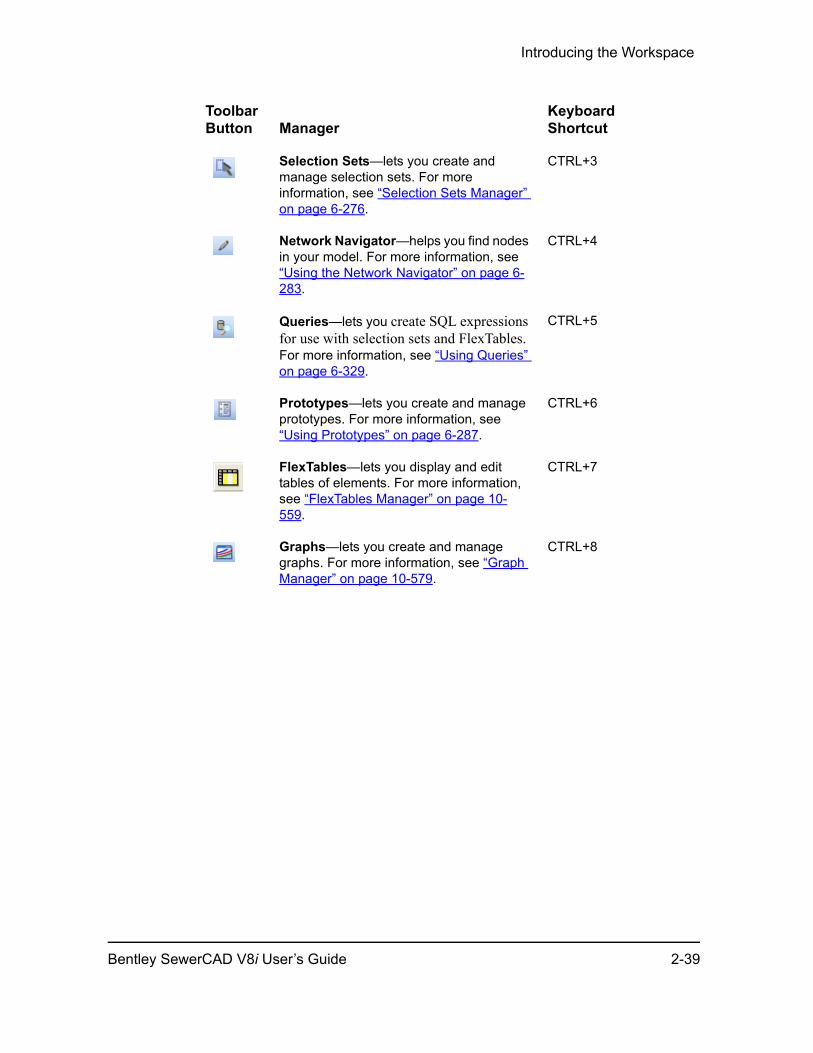
Introducing the Workspace
Selection Sets—lets you create and manage selection sets. For more information, see “Selection Sets Manager” on page 6-276.
CTRL+3
Network Navigator—helps you find nodes in your model. For more information, see “Using the Network Navigator” on page 6-283.
CTRL+4
Queries—lets you create SQL expressions for use with selection sets and FlexTables. For more information, see “Using Queries” on page 6-329.
CTRL+5
Prototypes—lets you create and manage prototypes. For more information, see “Using Prototypes” on page 6-287.
CTRL+6
FlexTables—lets you display and edit tables of elements. For more information, see “FlexTables Manager” on page 10-559.
CTRL+7
Graphs—lets you create and manage graphs. For more information, see “Graph Manager” on page 10-579.
CTRL+8
Toolbar Button Manager
Keyboard Shortcut
Bentley SewerCAD V8i User’s Guide 2-39
Dynamic Manager Display
Customizing Managers
When you first start Bentley SewerCAD V8i, you will see the default workspace, in which a limited set of dockable managers are visible. You can decide which managers will be displayed at any time and where they will be displayed. You can also return to the default workspace any time.
There are four states for each manager:
Floating—A floating manager sits above the Bentley SewerCAD V8i workspace like a dialog box. You can drag a floating manager anywhere and continue to work.
You can also:
• Resize a floating manager by dragging its edges.
• Close a floating manager by clicking on the x in the top right-hand corner of the title bar.
• Change the properties of the manager by right-clicking on the title bar.
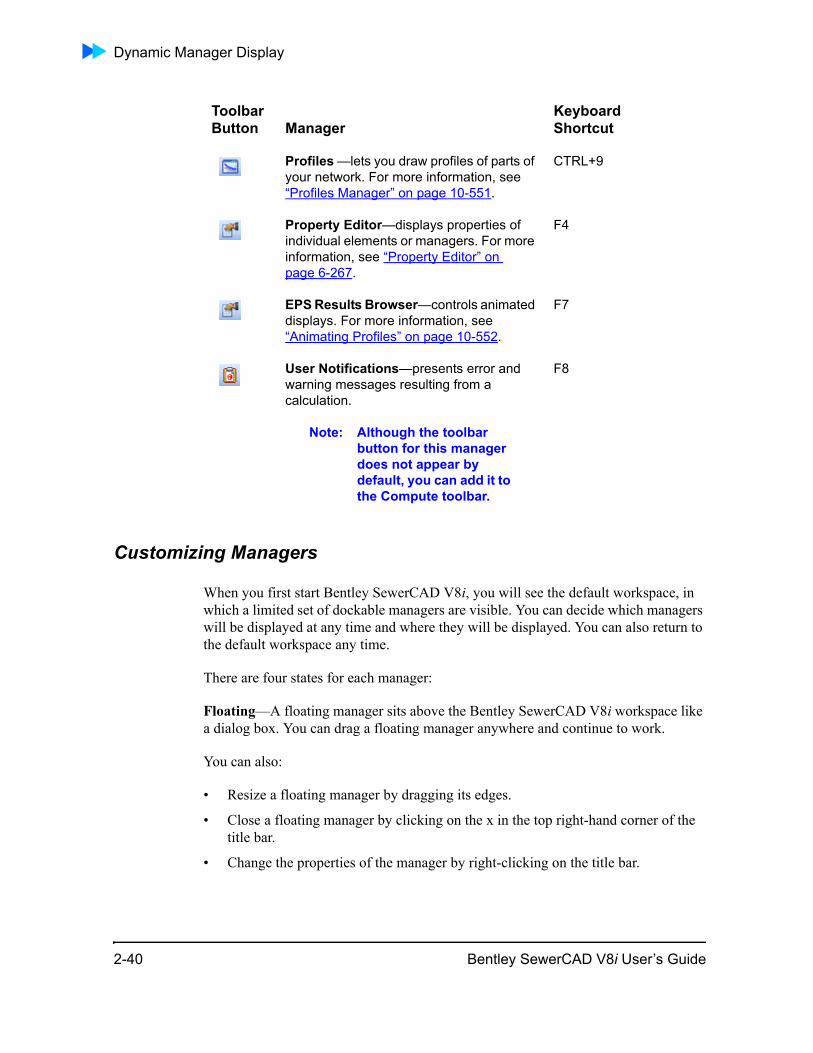
Profiles —lets you draw profiles of parts of your network. For more information, see “Profiles Manager” on page 10-551.
CTRL+9
Property Editor—displays properties of individual elements or managers. For more information, see “Property Editor” on page 6-267.
F4
EPS Results Browser—controls animated displays. For more information, see “Animating Profiles” on page 10-552.
F7
User Notifications—presents error and warning messages resulting from a calculation.
Note: Although the toolbar button for this manager does not appear by default, you can add it to the Compute toolbar.
F8
Toolbar Button Manager
Keyboard Shortcut
2-40 Bentley SewerCAD V8i User’s Guide
Introducing the Workspace
• Switch between multiple floating managers in the same location by clicking the manager’s tab.
• Dock the manager by double-clicking the title bar.
Docked static—A docked static manager attaches to any of the four sides of the Bentley SewerCAD V8i window. If you drag a floating manager to any of the four sides of the Bentley SewerCAD V8i window, the manager will attach or dock itself to that side of the window. The manager will stay in that location unless you close it or make it dynamic. A vertical pushpin in the manager’s title bar indicates its static state; click the pushpin to change the manager’s state to dynamic. When the push pin is pointing downward (vertical push pin), the manager is docked.
You can also:
• Close a docked manager by left clicking on the x in the upper right corner of the title bar.
• Change a docked manager into a floating manager by double-clicking the title bar, or by dragging the manager to the desired location (for example, away from the side of the Bentley SewerCAD V8i window).
• Change a static docked manager into a dynamically docked manager by clicking the push pin in the title bar.
• Switch between multiple docked managers in the same location by clicking the manager’s tab.
Docked dynamic—A docked dynamic manager also docks to any of the four sides of the Bentley SewerCAD V8i window, but remains hidden except for a single tab. Show a docked dynamic manager by moving the mouse over the tab, or by clicking the tab. When the manager is showing (not hidden), a horizontal pushpin in its title bar indi-cates its dynamic state.
You can also:
• Close a docked manager by left clicking on the x in the upper right corner of the title bar.
• Change a docked dynamic manager into a docked static manager by clicking the push pin (converting it from vertical to horizontal).
• Switch between multiple docked managers in the same location by moving the mouse over the manager’s tab or by clicking the manager’s tab.
Closed—When a manager is closed, you cannot view it. Close a manager by clicking the x in the right corner of the manager’s title bar. Open a manager by selecting the manager from the View menu (for example, View > Element Symbology), or by selecting the button for that manager on the appropriate toolbar.
Bentley SewerCAD V8i User’s Guide 2-41
Using Customizations
Using CustomizationsThe Customization Manager allows you to turn on/off the visibility of properties in the Properties Editor.
Customizations are created, removed, and modified in the Customization Manager (see “Customization Manager” on page 2-42).
Customization Manager
The property grid Customization Manager allows you to turn on/off the visibility of properties in the Properties Editor. The customization manager can be accessed by selecting View > Customizations.
Customization Profiles can be created for a single project or shared across projects. There are also a number of predefined profiles.
The Customization Manager consists of the following controls:
New This button opens a submenu containing the following commands:
• Folder: This command creates a new folder under the currently highlighted node in the list pane.
• Customization: This command creates a new customization profile under the currently highlighted node in the list pane.
Delete This button deletes the currently highlighted folder or customization profile.
Rename This button allows you to rename the currently highlighted folder or customization profile.
Edit Opens the Customization Editor dialog allowing you to edit the currently highlighted customization profile.
Help Opens the online help.
2-42 Bentley SewerCAD V8i User’s Guide

Introducing the Workspace
Create a customization by highlighting Project (specific to this file), or Shared (avail-able for other projects on your computer) customizations.
Pick New and name the new Customization (default name = Customization 1). Select the elements for which you want to create customizations. (you cannot edit Predefined customizations).
After you have selected the type of element for which you want to customize the prop-erty grid, you will see a tree view of all of the available properties. Uncheck those which you do not want to see appearing in the grid. You may also hide entire catego-ries. (The Calculation Options cannot be customized.)
A defined customization is applied after the automatic filter is applied. For example, if you have a customization to show all design-related properties but a conduit does not have the "Design Conduit?" property set to true then you will not see all the prop-erties. You must first set the "Design Conduit?" property to true and then you will see the design properties.
To use a customization, open a property grid, and select the drop down list near the top. The default customization is <Default View> which displays every property. Any customization created by the user is displayed in the drop down list, plus a predefined customization called <minimal> which is intended for beginner users who do not need to see more advanced items. It hides the following:
• Tractive stress
• Hyper links
• Known flows
• Design
• User defined properties
• Parsing
If you want to create a specific view of the property grid you can either start from <Default View> and remove items, or from a previous customization using the Dupli-cate button.
Customizations are stored in xml files at the locations described below:
In Windows XP:
Predefined customizations are stored in C:\Documents and Setting \All users\ Appli-cation Data/Bentley\SewerCAD\<versionnumber>\Predefinedworkspaces.xml.
Shared customizations are stored in your C:\Document and Settings\<user name>\Local Settings\Application Data/Bentley\SewerCAD\<version no>\Shared-workspaces.xml.
Bentley SewerCAD V8i User’s Guide 2-43
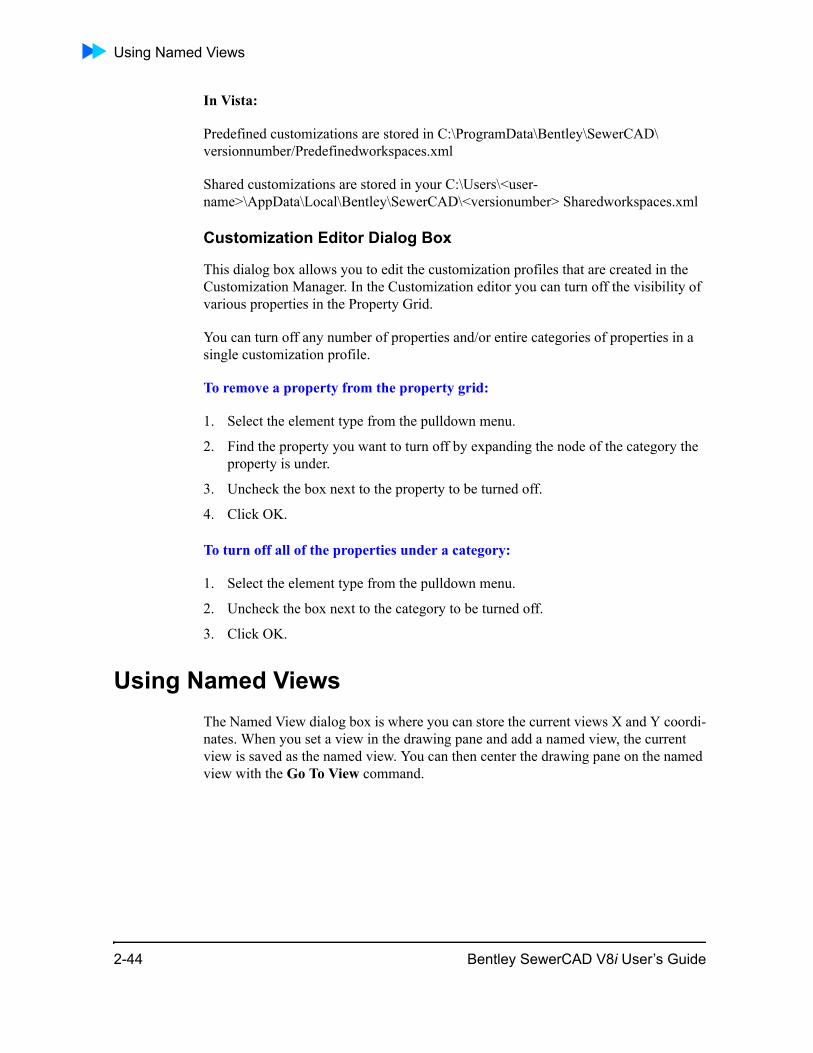
Using Named Views
In Vista:
Predefined customizations are stored in C:\ProgramData\Bentley\SewerCAD\ versionnumber/Predefinedworkspaces.xml
Shared customizations are stored in your C:\Users\<user-name>\AppData\Local\Bentley\SewerCAD\<versionumber> Sharedworkspaces.xml
Customization Editor Dialog Box
This dialog box allows you to edit the customization profiles that are created in the Customization Manager. In the Customization editor you can turn off the visibility of various properties in the Property Grid.
You can turn off any number of properties and/or entire categories of properties in a single customization profile.
To remove a property from the property grid:
1. Select the element type from the pulldown menu.
2. Find the property you want to turn off by expanding the node of the category the property is under.
3. Uncheck the box next to the property to be turned off.
4. Click OK.
To turn off all of the properties under a category:
1. Select the element type from the pulldown menu.
2. Uncheck the box next to the category to be turned off.
3. Click OK.
Using Named ViewsThe Named View dialog box is where you can store the current views X and Y coordi-nates. When you set a view in the drawing pane and add a named view, the current view is saved as the named view. You can then center the drawing pane on the named view with the Go To View command.
2-44 Bentley SewerCAD V8i User’s Guide
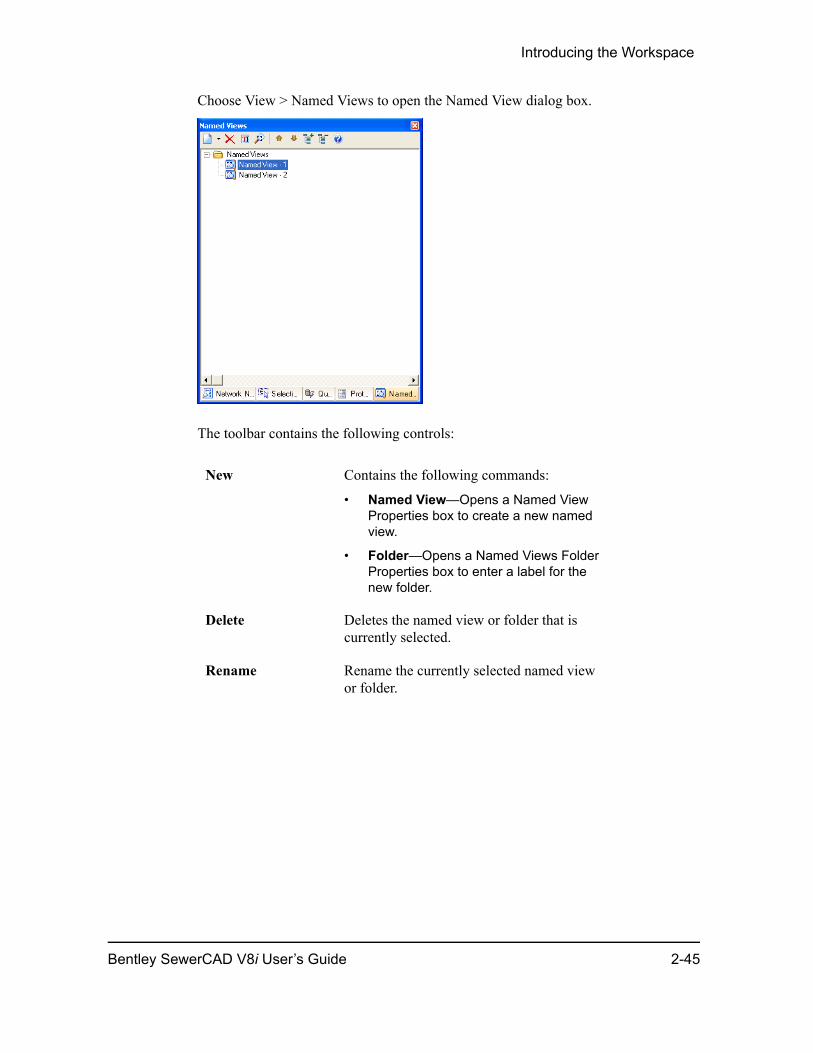
Introducing the Workspace
Choose View > Named Views to open the Named View dialog box.
The toolbar contains the following controls:
New Contains the following commands:
• Named View—Opens a Named View Properties box to create a new named view.
• Folder—Opens a Named Views Folder Properties box to enter a label for the new folder.
Delete Deletes the named view or folder that is currently selected.
Rename Rename the currently selected named view or folder.
Bentley SewerCAD V8i User’s Guide 2-45
Copying and Pasting Data To and From Tables
Copying and Pasting Data To and From TablesThis topic describes the best practices used to copy and paste data from and to the various tables.
Copying data from a table
Go to View Centers the drawing pane on the named view.
Shift Up and Shift Down
Moves the selected named view or folder up or down.
Expand All or Collapse All
Expands or collapses the named views and folders.
Help Displays online help for Named Views.
2-46 Bentley SewerCAD V8i User’s Guide
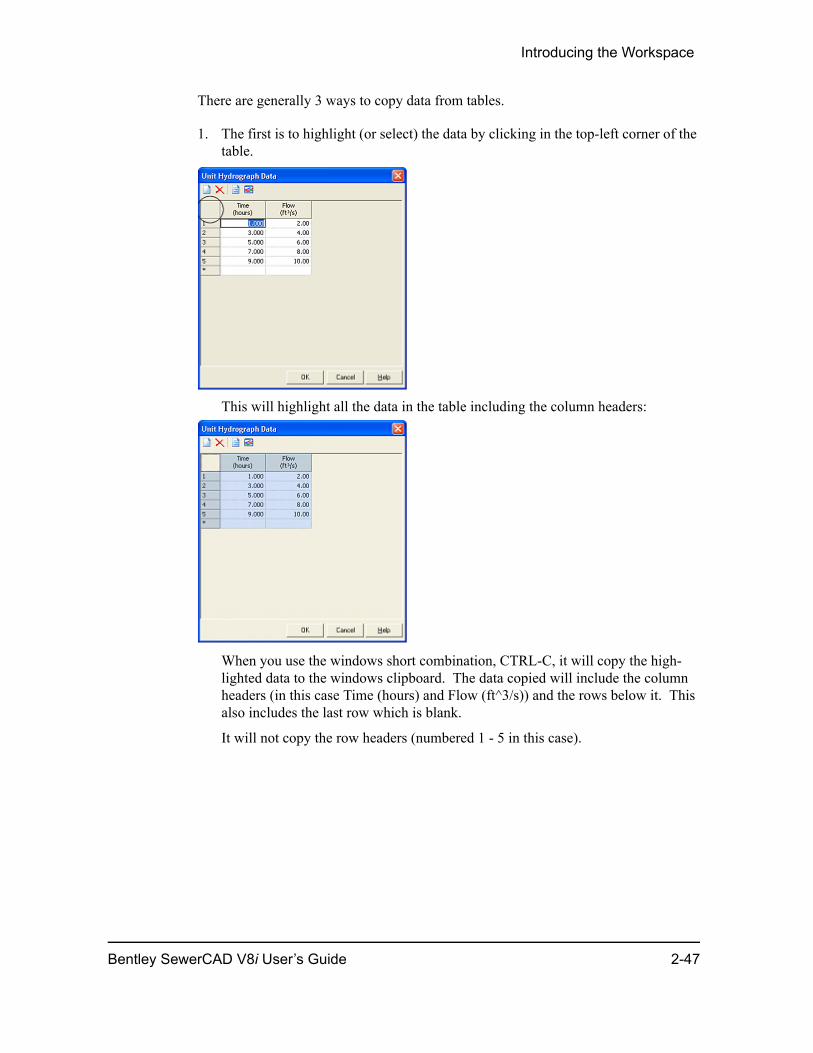
Introducing the Workspace
There are generally 3 ways to copy data from tables.
1. The first is to highlight (or select) the data by clicking in the top-left corner of the table.
This will highlight all the data in the table including the column headers:
When you use the windows short combination, CTRL-C, it will copy the high-lighted data to the windows clipboard. The data copied will include the column headers (in this case Time (hours) and Flow (ft^3/s)) and the rows below it. This also includes the last row which is blank.
It will not copy the row headers (numbered 1 - 5 in this case).
Bentley SewerCAD V8i User’s Guide 2-47
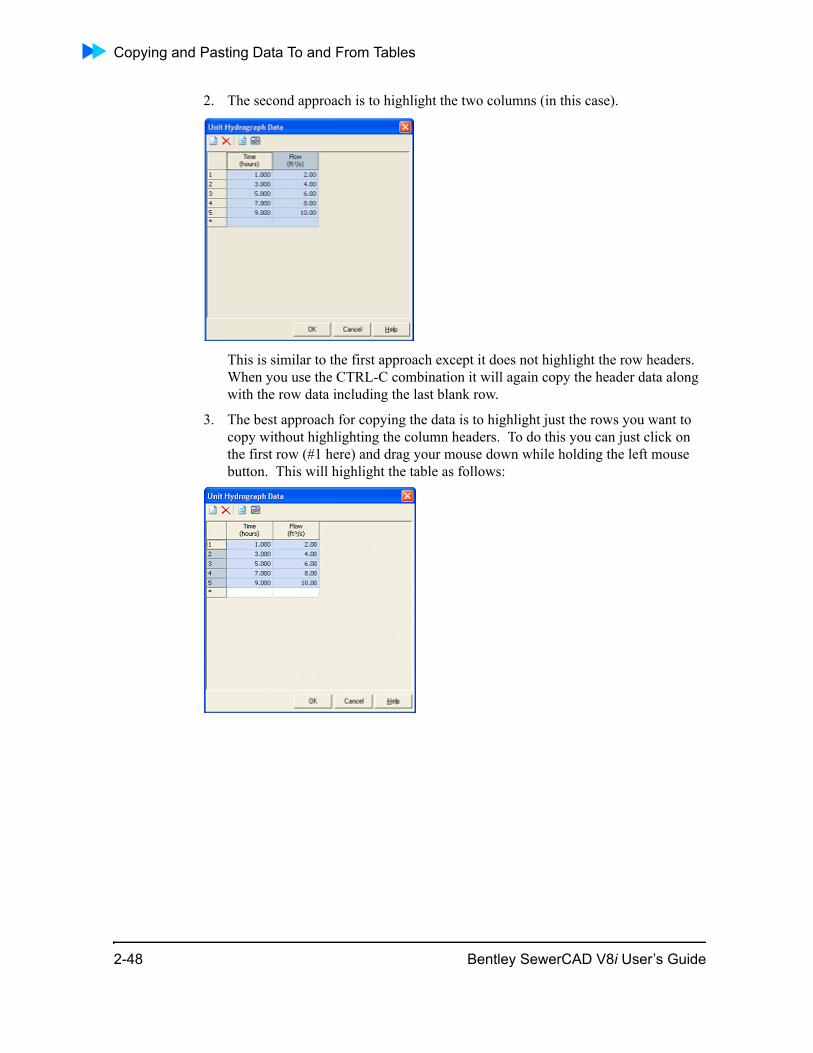
Copying and Pasting Data To and From Tables
2. The second approach is to highlight the two columns (in this case).
This is similar to the first approach except it does not highlight the row headers. When you use the CTRL-C combination it will again copy the header data along with the row data including the last blank row.
3. The best approach for copying the data is to highlight just the rows you want to copy without highlighting the column headers. To do this you can just click on the first row (#1 here) and drag your mouse down while holding the left mouse button. This will highlight the table as follows:
2-48 Bentley SewerCAD V8i User’s Guide
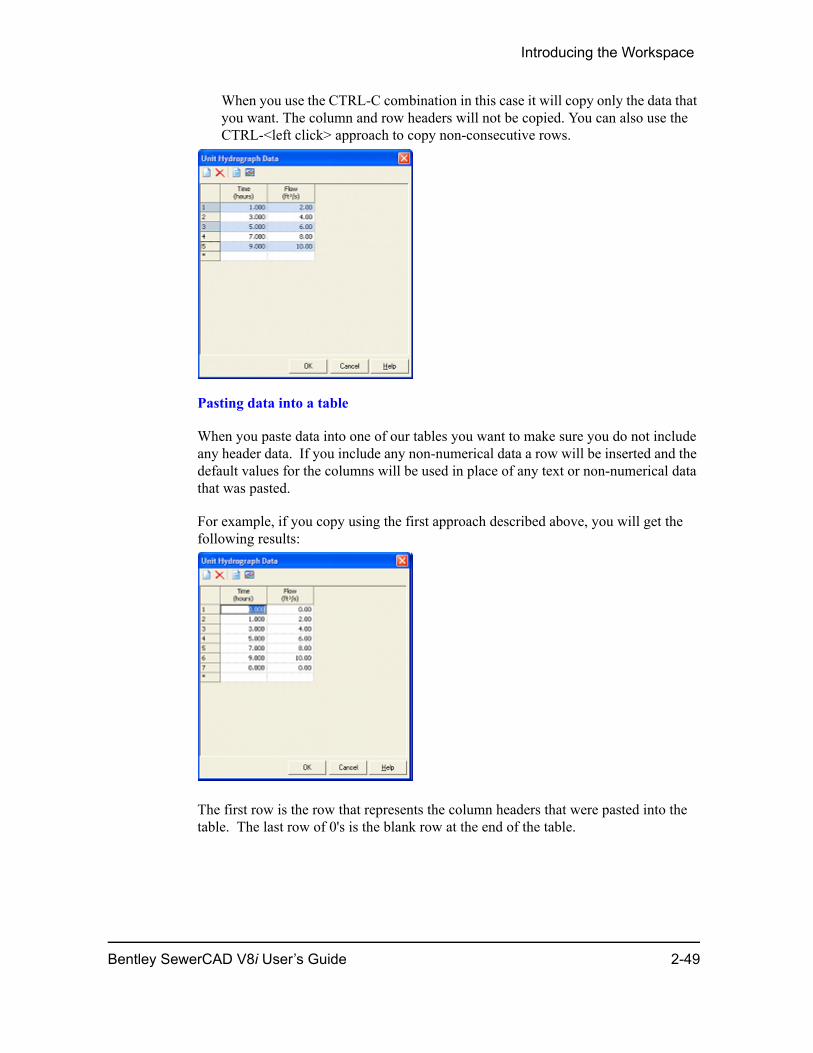
Introducing the Workspace
When you use the CTRL-C combination in this case it will copy only the data that you want. The column and row headers will not be copied. You can also use the CTRL-<left click> approach to copy non-consecutive rows.
Pasting data into a table
When you paste data into one of our tables you want to make sure you do not include any header data. If you include any non-numerical data a row will be inserted and the default values for the columns will be used in place of any text or non-numerical data that was pasted.
For example, if you copy using the first approach described above, you will get the following results:
The first row is the row that represents the column headers that were pasted into the table. The last row of 0's is the blank row at the end of the table.
Bentley SewerCAD V8i User’s Guide 2-49
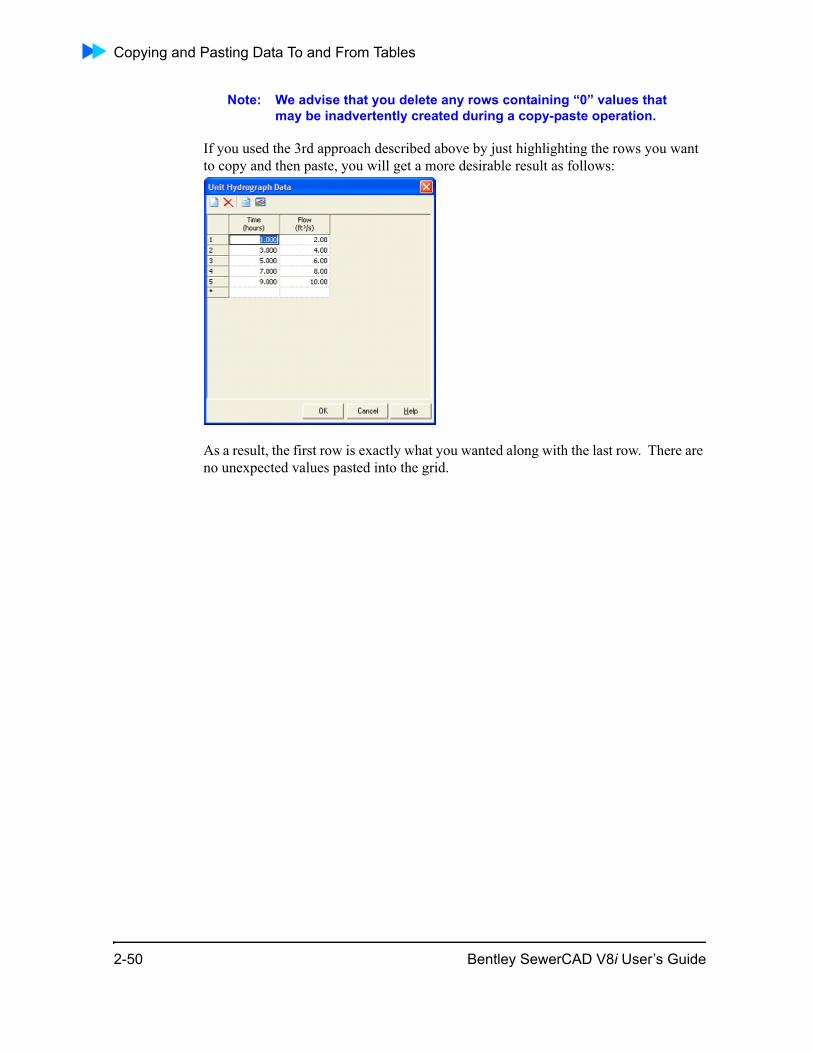
Copying and Pasting Data To and From Tables
Note: We advise that you delete any rows containing “0” values that may be inadvertently created during a copy-paste operation.
If you used the 3rd approach described above by just highlighting the rows you want to copy and then paste, you will get a more desirable result as follows:
As a result, the first row is exactly what you wanted along with the last row. There are no unexpected values pasted into the grid.
2-50 Bentley SewerCAD V8i User’s Guide
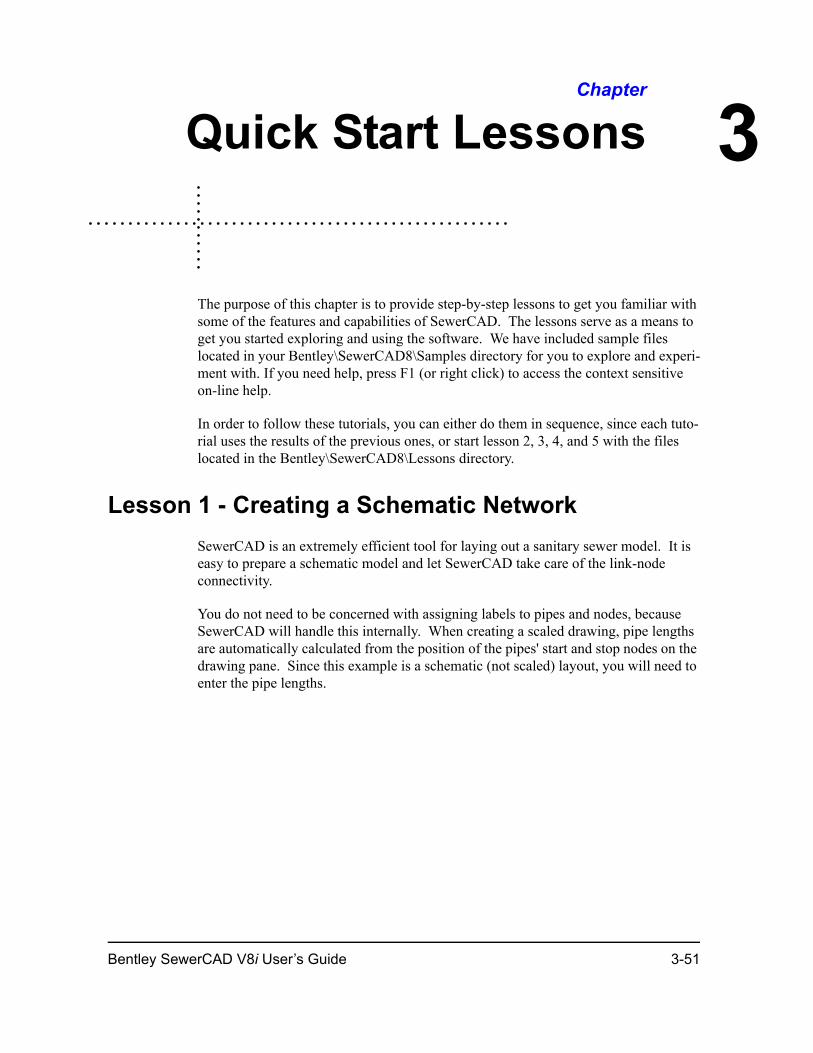
3
ChapterQuick Start Lessons
The purpose of this chapter is to provide step-by-step lessons to get you familiar with some of the features and capabilities of SewerCAD. The lessons serve as a means to get you started exploring and using the software. We have included sample files located in your Bentley\SewerCAD8\Samples directory for you to explore and experi-ment with. If you need help, press F1 (or right click) to access the context sensitive on-line help.
In order to follow these tutorials, you can either do them in sequence, since each tuto-rial uses the results of the previous ones, or start lesson 2, 3, 4, and 5 with the files located in the Bentley\SewerCAD8\Lessons directory.
Lesson 1 - Creating a Schematic NetworkSewerCAD is an extremely efficient tool for laying out a sanitary sewer model. It is easy to prepare a schematic model and let SewerCAD take care of the link-node connectivity.
You do not need to be concerned with assigning labels to pipes and nodes, because SewerCAD will handle this internally. When creating a scaled drawing, pipe lengths are automatically calculated from the position of the pipes' start and stop nodes on the drawing pane. Since this example is a schematic (not scaled) layout, you will need to enter the pipe lengths.
Bentley SewerCAD V8i User’s Guide 3-51
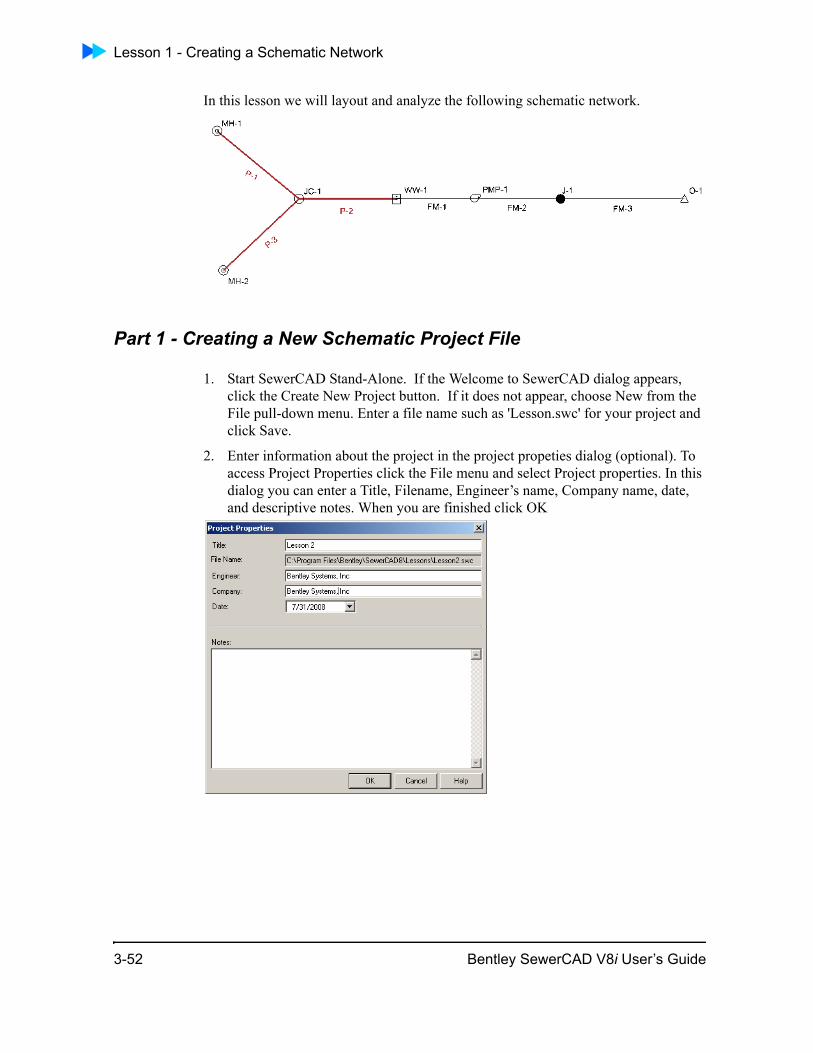
Lesson 1 - Creating a Schematic Network
In this lesson we will layout and analyze the following schematic network.
Part 1 - Creating a New Schematic Project File
1. Start SewerCAD Stand-Alone. If the Welcome to SewerCAD dialog appears, click the Create New Project button. If it does not appear, choose New from the File pull-down menu. Enter a file name such as 'Lesson.swc' for your project and click Save.
2. Enter information about the project in the project propeties dialog (optional). To access Project Properties click the File menu and select Project properties. In this dialog you can enter a Title, Filename, Engineer’s name, Company name, date, and descriptive notes. When you are finished click OK
3-52 Bentley SewerCAD V8i User’s Guide
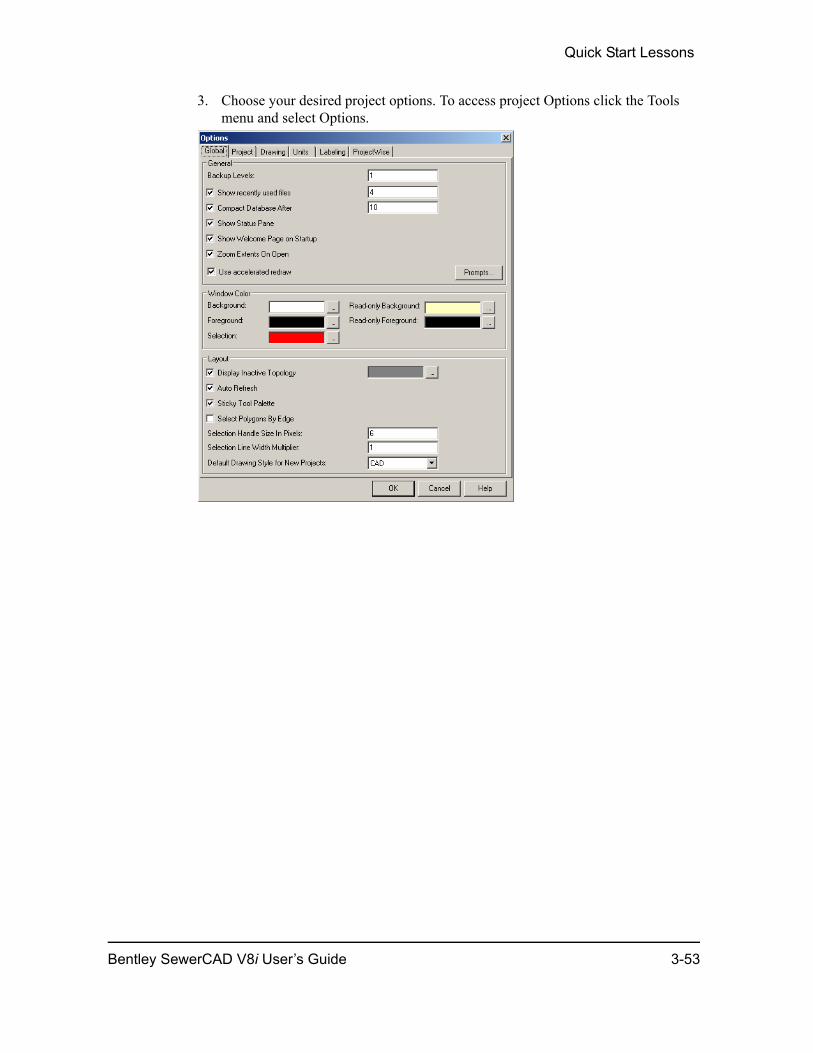
Quick Start Lessons
3. Choose your desired project options. To access project Options click the Tools menu and select Options.
Bentley SewerCAD V8i User’s Guide 3-53
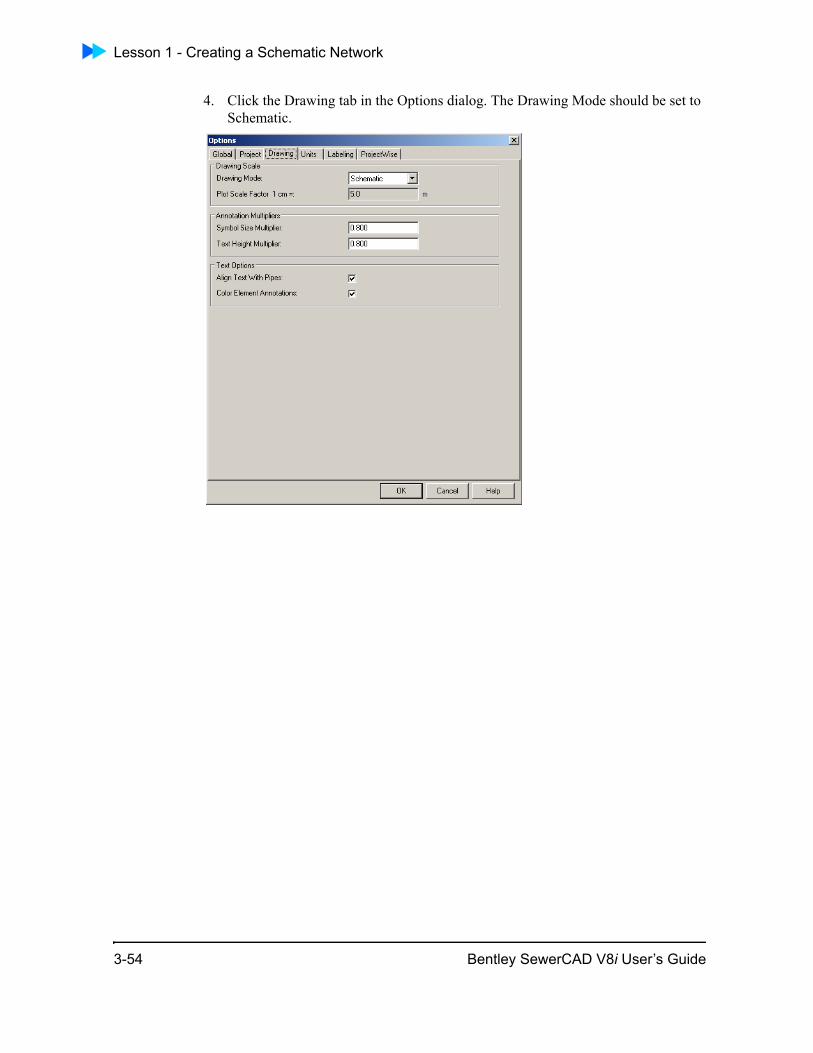
Lesson 1 - Creating a Schematic Network
4. Click the Drawing tab in the Options dialog. The Drawing Mode should be set to Schematic.
3-54 Bentley SewerCAD V8i User’s Guide
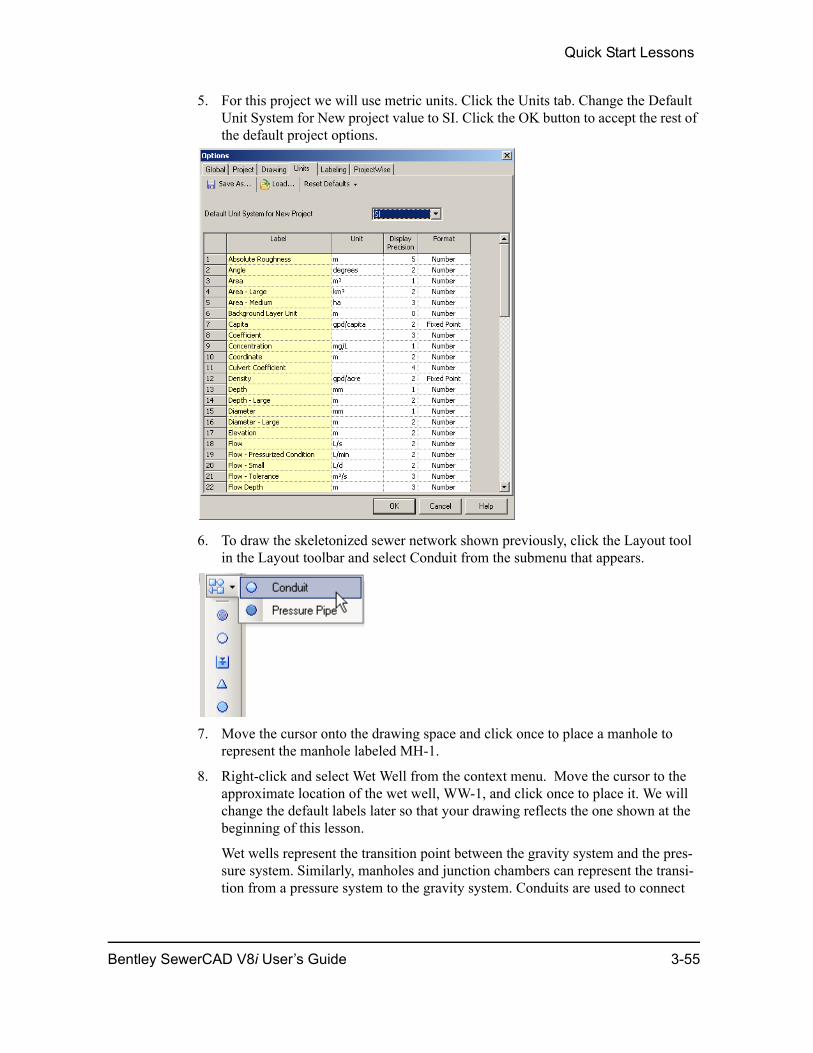
Quick Start Lessons
5. For this project we will use metric units. Click the Units tab. Change the Default Unit System for New project value to SI. Click the OK button to accept the rest of the default project options.
6. To draw the skeletonized sewer network shown previously, click the Layout tool in the Layout toolbar and select Conduit from the submenu that appears.
7. Move the cursor onto the drawing space and click once to place a manhole to represent the manhole labeled MH-1.
8. Right-click and select Wet Well from the context menu. Move the cursor to the approximate location of the wet well, WW-1, and click once to place it. We will change the default labels later so that your drawing reflects the one shown at the beginning of this lesson.
Wet wells represent the transition point between the gravity system and the pres-sure system. Similarly, manholes and junction chambers can represent the transi-tion from a pressure system to the gravity system. Conduits are used to connect
Bentley SewerCAD V8i User’s Guide 3-55
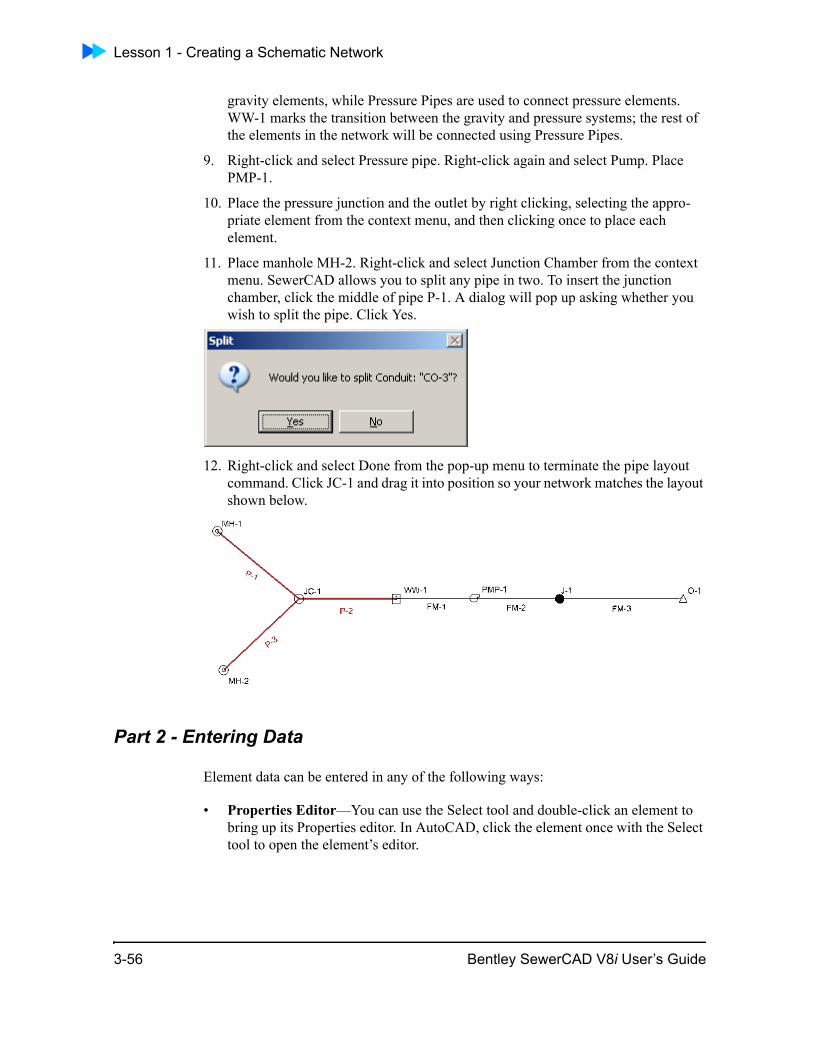
Lesson 1 - Creating a Schematic Network
gravity elements, while Pressure Pipes are used to connect pressure elements. WW-1 marks the transition between the gravity and pressure systems; the rest of the elements in the network will be connected using Pressure Pipes.
9. Right-click and select Pressure pipe. Right-click again and select Pump. Place PMP-1.
10. Place the pressure junction and the outlet by right clicking, selecting the appro-priate element from the context menu, and then clicking once to place each element.
11. Place manhole MH-2. Right-click and select Junction Chamber from the context menu. SewerCAD allows you to split any pipe in two. To insert the junction chamber, click the middle of pipe P-1. A dialog will pop up asking whether you wish to split the pipe. Click Yes.
12. Right-click and select Done from the pop-up menu to terminate the pipe layout command. Click JC-1 and drag it into position so your network matches the layout shown below.
Part 2 - Entering Data
Element data can be entered in any of the following ways:
• Properties Editor—You can use the Select tool and double-click an element to bring up its Properties editor. In AutoCAD, click the element once with the Select tool to open the element’s editor.
3-56 Bentley SewerCAD V8i User’s Guide
Quick Start Lessons
• FlexTables—You can use FlexTables to bring up dynamic tables that allow you to edit and display the model data in a tabular format. You can edit the data as you would in a spreadsheet.
• Alternative Editors—Alternatives are used to enter data for different “What If?” situations used in Scenario Management.
• User Data Extensions—The User Data Extensions feature allows you to import and export element data directly from XML files.
Entering Data Through the Properties Editor
To access an element’s dialog box in SewerCAD V8i mode, double-click the element. In AutoCAD, first click the Select tool on the toolbar, then click the element whose attributes you wish to modify.
1. Double-click the outlet, O-1. Enter the data including ground elevation, rim eleva-tion, and sump elevation as outlined in the following Outlet Data table. Change the label to match the model schematic as necessary. If the Set Rim to Ground Elevation box is checked, SewerCAD will automatically set the rim elevation to the ground elevation. Finally, select Free Outfall from the Tailwater Conditions menu.
2. Enter the data for the manholes, transition, and wet well as outlined in the Manhole data, Transition data, and Wet Well data tables below. Select Standard from the list of available headloss methods in the Headloss Method field. Then enter the headloss coefficient for each structure.
Table 3-1: Outlet Input Data
Label Elevation (Ground)
(m)
Elevation (Rim) (m)
Elevation (Invert) (m)
Tailwater Condition
(m)
O-1 16 16 14 Free Outfall
Table 3-2: Manhole Input Data
Label Elevation (Ground)
(m)
Elevation (Rim) (m)
Elevation (Invert)
(m)
Diameter (m)
Headloss Method
Headloss Coefficien
t
MH-1 11.1 11 9 1 Standard 0.25
MH-2 11.1 11.1 9 1 Standard 0.25
Bentley SewerCAD V8i User’s Guide 3-57
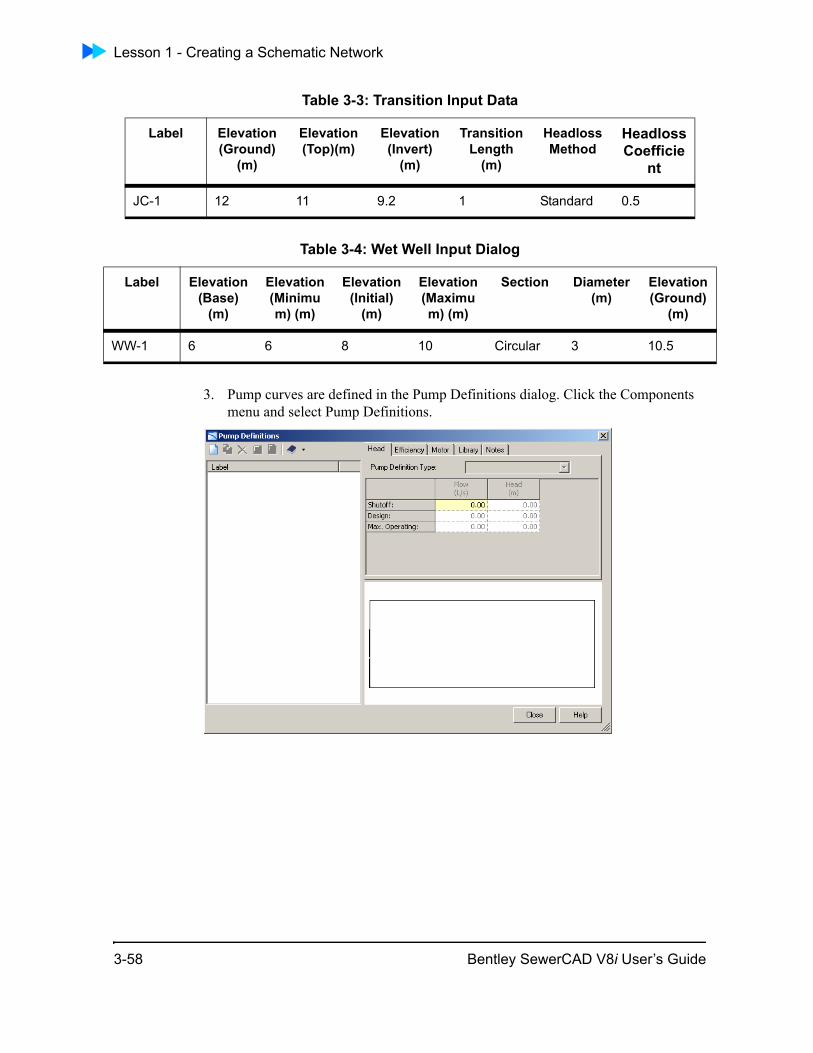
Lesson 1 - Creating a Schematic Network
3. Pump curves are defined in the Pump Definitions dialog. Click the Components menu and select Pump Definitions.
Table 3-3: Transition Input Data
Label Elevation (Ground)
(m)
Elevation (Top)(m)
Elevation (Invert)
(m)
Transition Length
(m)
Headloss Method
Headloss Coefficie
nt
JC-1 12 11 9.2 1 Standard 0.5
Table 3-4: Wet Well Input Dialog
Label Elevation (Base)
(m)
Elevation (Minimum) (m)
Elevation (Initial)
(m)
Elevation (Maximum) (m)
Section Diameter (m)
Elevation (Ground)
(m)
WW-1 6 6 8 10 Circular 3 10.5
3-58 Bentley SewerCAD V8i User’s Guide
Quick Start Lessons
4. In the Pump Definitions dialog, click the New button. Change the label of the newly created definition to PMP-1. Right-click the Flow column and select units and Formatting. Change the unit to m3/s. Leave the Pump Definition Type set to Standard (3 Point) and enter the following values: Close the Pump Definitions
dialog.
5. Double-click PMP-1 to enter data in the Properties editor. Enter the following data:
Note that the pump has an upstream pipe and a downstream pipe to define the direction. The downstream pipe is indicated in the Downstream Link field of the Properties editor. If the pump is going in the wrong direction, click the Reverse command in this field to switch it. In this example the downstream link should be FM-2.
6. Enter an Elevation of 13m and Elevation (Ground) of 14.2m for Pressure Junction J-1.
Entering Data Through FlexTables
Often it is more convenient to enter data for similar elements into a tabular form rather than to individually click every element, enter the data into the dialog, and then click the next element.
1. Double-click P-1 and change the Set Invert to Start and Set Invert to Stop fields to False. Change the Has User Defined length? field value to True. Repeat for P-2 and P-3. This will allow you to change these values in the Flextable.
2. To access the FlexTables click the View menu and select FlexTables.
Table 3-5: Pump Definition
Flow (m3/s) Head (m)
Shutoff 0.00 53.33
Design 0.25 40
Max Operating
0.5 0.00
Table 3-6: Pump Input Data
Label Elevation (Ground)
(m)
Elevation (Invert) (m)
Pump Definition
PMP-1 7.8 7.8 PMP-1
Bentley SewerCAD V8i User’s Guide 3-59
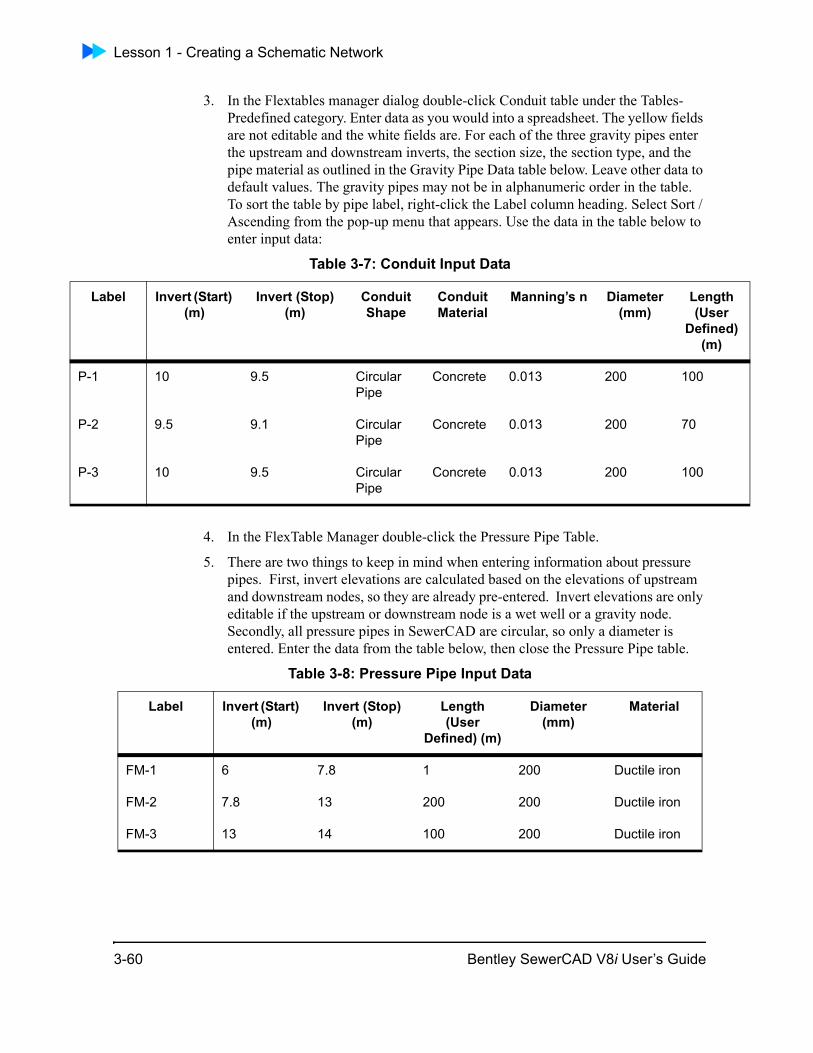
Lesson 1 - Creating a Schematic Network
La th r
ed)
P-1
P-2
P-3
3. In the Flextables manager dialog double-click Conduit table under the Tables-Predefined category. Enter data as you would into a spreadsheet. The yellow fields are not editable and the white fields are. For each of the three gravity pipes enter the upstream and downstream inverts, the section size, the section type, and the pipe material as outlined in the Gravity Pipe Data table below. Leave other data to default values. The gravity pipes may not be in alphanumeric order in the table. To sort the table by pipe label, right-click the Label column heading. Select Sort / Ascending from the pop-up menu that appears. Use the data in the table below to enter input data:
4. In the FlexTable Manager double-click the Pressure Pipe Table.
5. There are two things to keep in mind when entering information about pressure pipes. First, invert elevations are calculated based on the elevations of upstream and downstream nodes, so they are already pre-entered. Invert elevations are only editable if the upstream or downstream node is a wet well or a gravity node. Secondly, all pressure pipes in SewerCAD are circular, so only a diameter is entered. Enter the data from the table below, then close the Pressure Pipe table.
Table 3-7: Conduit Input Data
bel Invert (Start) (m)
Invert (Stop) (m)
Conduit Shape
Conduit Material
Manning’s n Diameter (mm)
Leng(Use
Defin(m)
10 9.5 Circular Pipe
Concrete 0.013 200 100
9.5 9.1 Circular Pipe
Concrete 0.013 200 70
10 9.5 Circular Pipe
Concrete 0.013 200 100
Table 3-8: Pressure Pipe Input Data
Label Invert (Start) (m)
Invert (Stop) (m)
Length (User
Defined) (m)
Diameter (mm)
Material
FM-1 6 7.8 1 200 Ductile iron
FM-2 7.8 13 200 200 Ductile iron
FM-3 13 14 100 200 Ductile iron
3-60 Bentley SewerCAD V8i User’s Guide
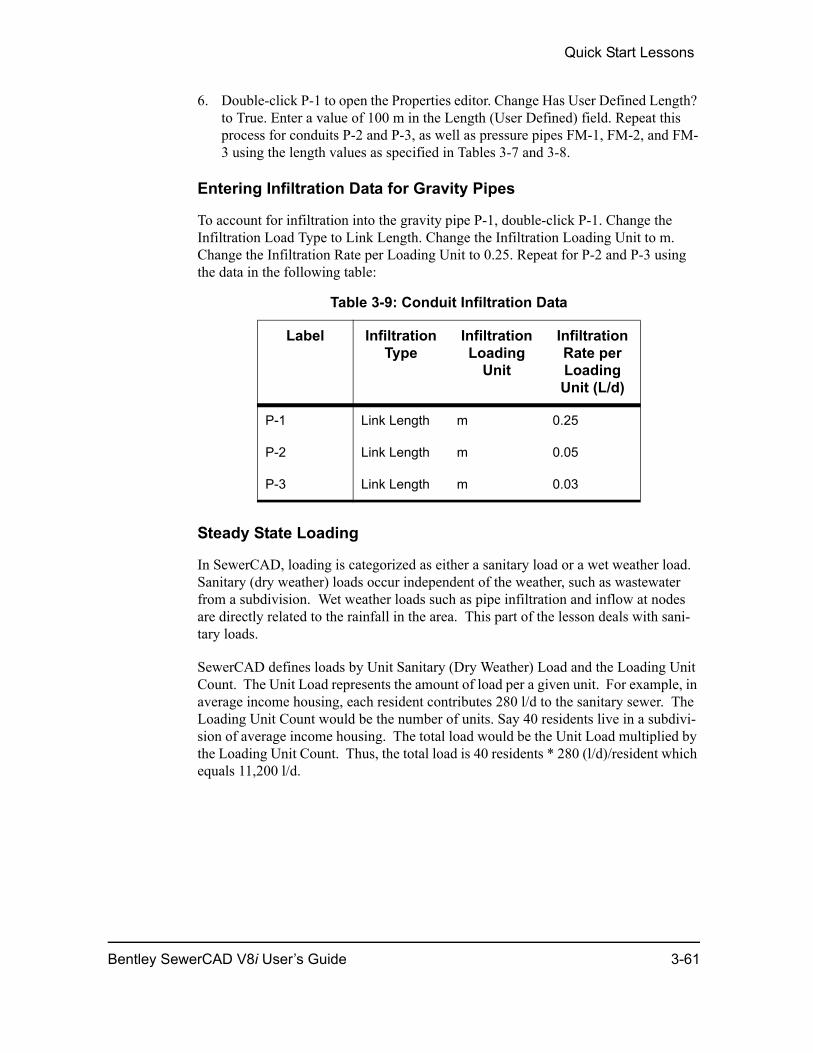
Quick Start Lessons
6. Double-click P-1 to open the Properties editor. Change Has User Defined Length? to True. Enter a value of 100 m in the Length (User Defined) field. Repeat this process for conduits P-2 and P-3, as well as pressure pipes FM-1, FM-2, and FM-3 using the length values as specified in Tables 3-7 and 3-8.
Entering Infiltration Data for Gravity Pipes
To account for infiltration into the gravity pipe P-1, double-click P-1. Change the Infiltration Load Type to Link Length. Change the Infiltration Loading Unit to m. Change the Infiltration Rate per Loading Unit to 0.25. Repeat for P-2 and P-3 using the data in the following table:
Steady State Loading
In SewerCAD, loading is categorized as either a sanitary load or a wet weather load. Sanitary (dry weather) loads occur independent of the weather, such as wastewater from a subdivision. Wet weather loads such as pipe infiltration and inflow at nodes are directly related to the rainfall in the area. This part of the lesson deals with sani-tary loads.
SewerCAD defines loads by Unit Sanitary (Dry Weather) Load and the Loading Unit Count. The Unit Load represents the amount of load per a given unit. For example, in average income housing, each resident contributes 280 l/d to the sanitary sewer. The Loading Unit Count would be the number of units. Say 40 residents live in a subdivi-sion of average income housing. The total load would be the Unit Load multiplied by the Loading Unit Count. Thus, the total load is 40 residents * 280 (l/d)/resident which equals 11,200 l/d.
Table 3-9: Conduit Infiltration Data
Label Infiltration Type
Infiltration Loading
Unit
Infiltration Rate per Loading Unit (L/d)
P-1 Link Length m 0.25
P-2 Link Length m 0.05
P-3 Link Length m 0.03
Bentley SewerCAD V8i User’s Guide 3-61
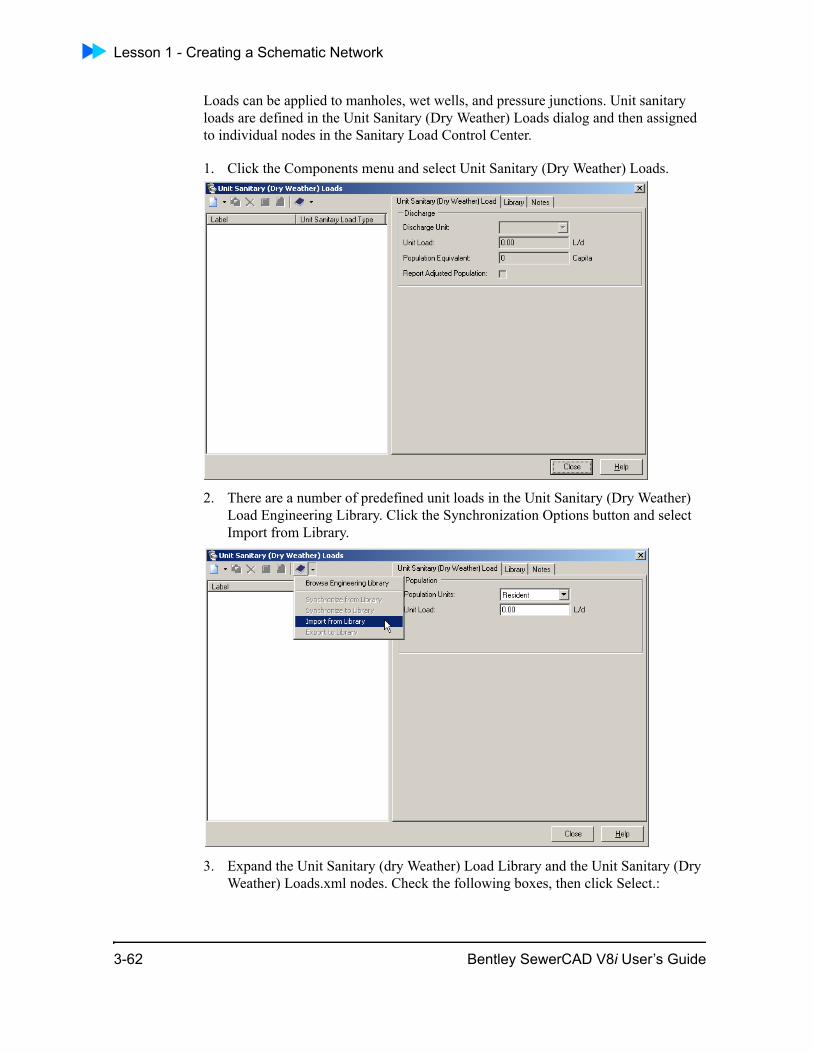
Lesson 1 - Creating a Schematic Network
Loads can be applied to manholes, wet wells, and pressure junctions. Unit sanitary loads are defined in the Unit Sanitary (Dry Weather) Loads dialog and then assigned to individual nodes in the Sanitary Load Control Center.
1. Click the Components menu and select Unit Sanitary (Dry Weather) Loads.
2. There are a number of predefined unit loads in the Unit Sanitary (Dry Weather) Load Engineering Library. Click the Synchronization Options button and select Import from Library.
3. Expand the Unit Sanitary (dry Weather) Load Library and the Unit Sanitary (Dry Weather) Loads.xml nodes. Check the following boxes, then click Select.:
3-62 Bentley SewerCAD V8i User’s Guide
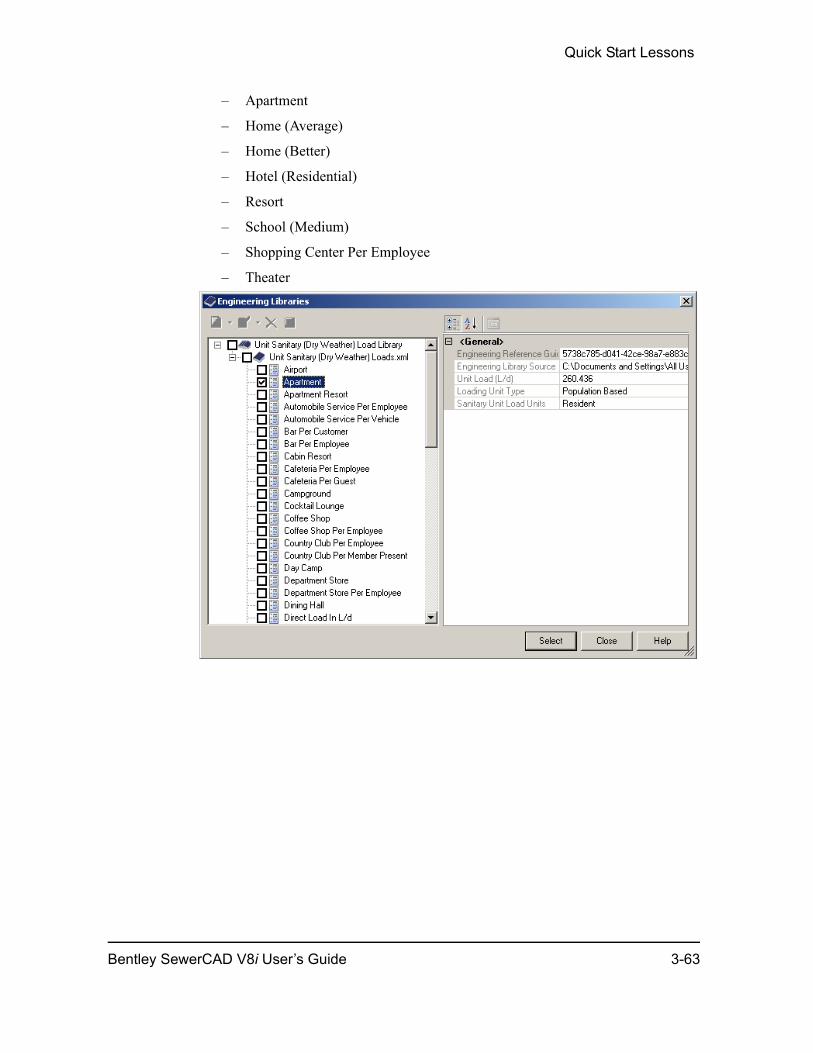
Quick Start Lessons
– Apartment
– Home (Average)
– Home (Better)
– Hotel (Residential)
– Resort
– School (Medium)
– Shopping Center Per Employee
– Theater
Bentley SewerCAD V8i User’s Guide 3-63
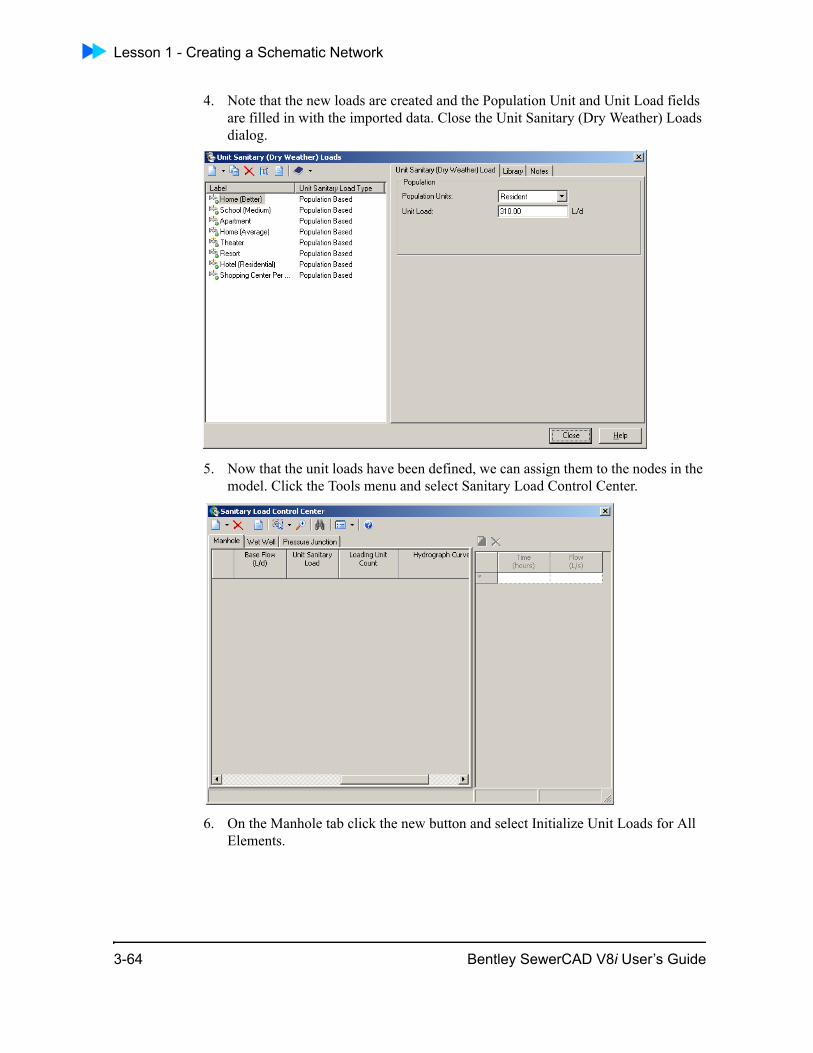
Lesson 1 - Creating a Schematic Network
4. Note that the new loads are created and the Population Unit and Unit Load fields are filled in with the imported data. Close the Unit Sanitary (Dry Weather) Loads dialog.
5. Now that the unit loads have been defined, we can assign them to the nodes in the model. Click the Tools menu and select Sanitary Load Control Center.
6. On the Manhole tab click the new button and select Initialize Unit Loads for All Elements.
3-64 Bentley SewerCAD V8i User’s Guide
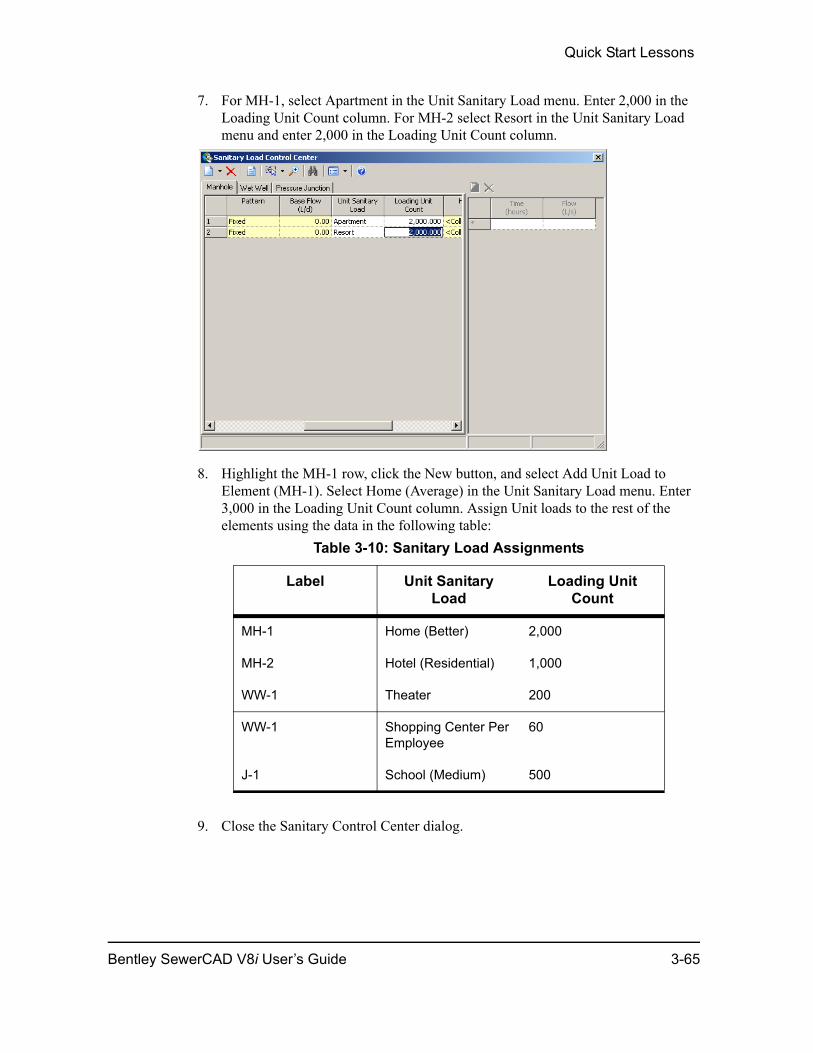
Quick Start Lessons
7. For MH-1, select Apartment in the Unit Sanitary Load menu. Enter 2,000 in the Loading Unit Count column. For MH-2 select Resort in the Unit Sanitary Load menu and enter 2,000 in the Loading Unit Count column.
8. Highlight the MH-1 row, click the New button, and select Add Unit Load to Element (MH-1). Select Home (Average) in the Unit Sanitary Load menu. Enter 3,000 in the Loading Unit Count column. Assign Unit loads to the rest of the elements using the data in the following table:
9. Close the Sanitary Control Center dialog.
Table 3-10: Sanitary Load Assignments
Label Unit Sanitary Load
Loading Unit Count
MH-1 Home (Better) 2,000
MH-2 Hotel (Residential) 1,000
WW-1 Theater 200
WW-1 Shopping Center Per Employee
60
J-1 School (Medium) 500
Bentley SewerCAD V8i User’s Guide 3-65
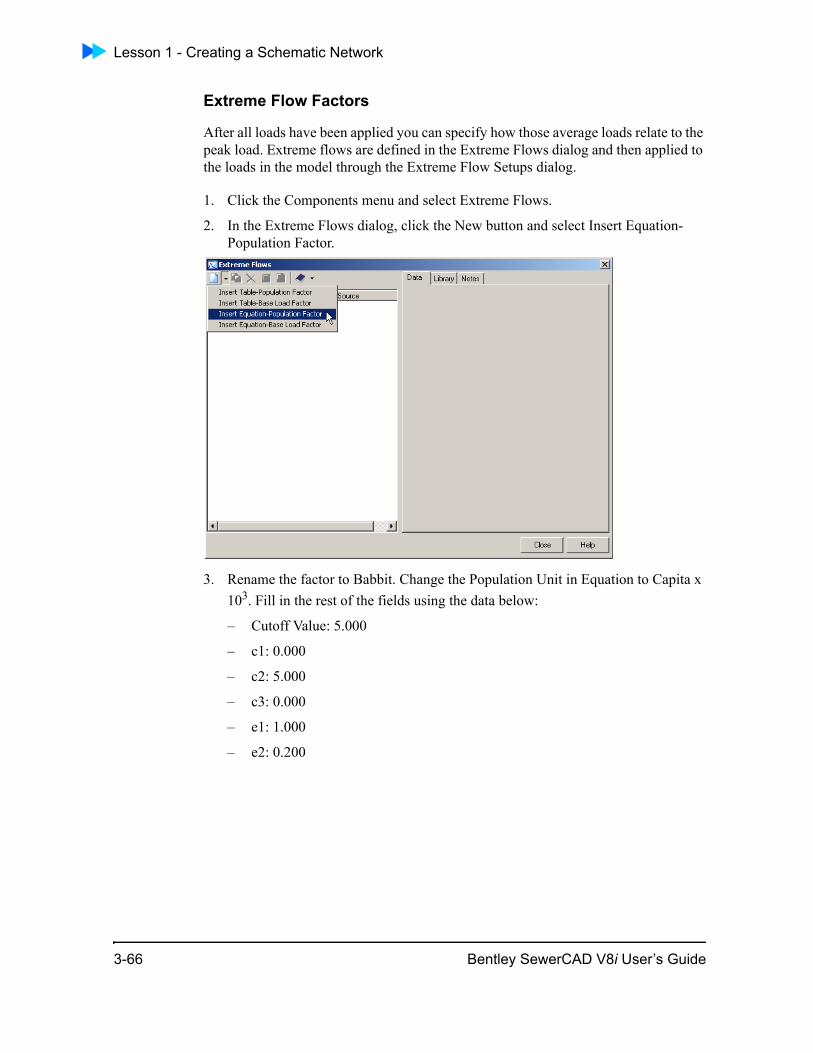
Lesson 1 - Creating a Schematic Network
Extreme Flow Factors
After all loads have been applied you can specify how those average loads relate to the peak load. Extreme flows are defined in the Extreme Flows dialog and then applied to the loads in the model through the Extreme Flow Setups dialog.
1. Click the Components menu and select Extreme Flows.
2. In the Extreme Flows dialog, click the New button and select Insert Equation-Population Factor.
3. Rename the factor to Babbit. Change the Population Unit in Equation to Capita x 103. Fill in the rest of the fields using the data below:
– Cutoff Value: 5.000
– c1: 0.000
– c2: 5.000
– c3: 0.000
– e1: 1.000
– e2: 0.200
3-66 Bentley SewerCAD V8i User’s Guide
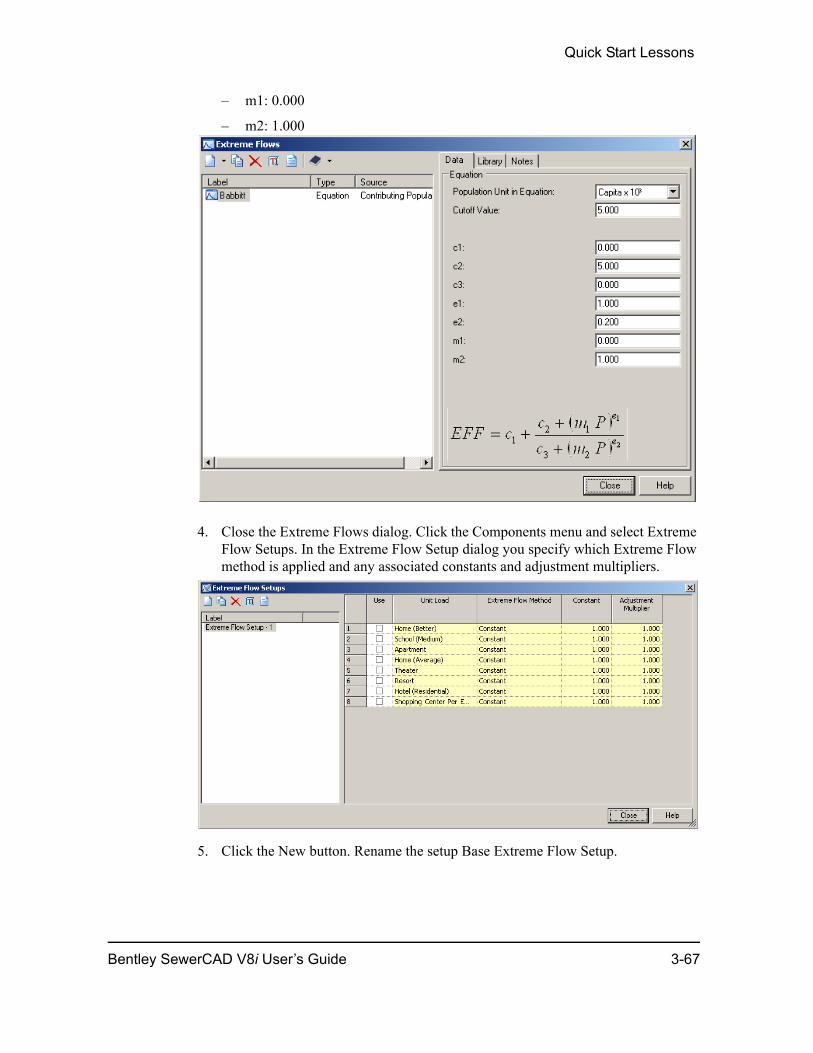
Quick Start Lessons
– m1: 0.000
– m2: 1.000
4. Close the Extreme Flows dialog. Click the Components menu and select Extreme Flow Setups. In the Extreme Flow Setup dialog you specify which Extreme Flow method is applied and any associated constants and adjustment multipliers.
5. Click the New button. Rename the setup Base Extreme Flow Setup.
Bentley SewerCAD V8i User’s Guide 3-67
Lesson 1 - Creating a Schematic Network
6. To apply an extreme flow method to a unit load check the associated Use box to make the other fields editable. Right-click the Use column and select Global Edit. In the Global Edit dialog put a check in the Value box and click OK.
7. Right-click the Extreme Flow Method column and select Global Edit. Change the Value field to Babbit and click OK.
8. Close the Extreme Flow Setups dialog.
3-68 Bentley SewerCAD V8i User’s Guide
Quick Start Lessons
Part 3- Calculating the Model
1. Click the Analysis menu and select Calculation Options. Double-click Base Calculation Options. The Properties editor will display the settings used by this calculation option.
2. Make sure the Time Analysis Type is set to Steady-State and that the Calculation Type is set to Analysis.
3. Choose Base Extreme Flow Setup from the Extreme Flow Setups menu.
4. Close the Calculation Options dialog.
5. Click the Validate button to catch any data input errors.
6. Click the Compute button.
Bentley SewerCAD V8i User’s Guide 3-69
Lesson 1 - Creating a Schematic Network
7. The Detailed Calculation Summary appears.
8. Although Convergence was acheived and the calculation was completed success-fully, the yellow indicator in the bottom left shows that warnings were generated. These warnings can be viewed in the User Notifications manager. Click the Anal-ysis menu and select User Notifications.
9. You can double-click a warning in the User Notifications manager to zoom to the element that generated the warning.
10. Close the user Notifications dialog.
3-70 Bentley SewerCAD V8i User’s Guide
Quick Start Lessons
Lesson 2 - Automatic DesignThis lesson will illustrate how SewerCAD can automatically design all or parts of the gravity portion of a sanitary sewer system within the design constraints set by the user. After specifying parameters such as lengths, ground elevations, and boundary condi-tions, SewerCAD will work to find a satisfactory design. In this lesson, we will use this feature to develop a new design to replace the undersized sanitary sewer system created in Lesson 1.
This lesson is based on the project created in Lesson 1. If you have not completed Lesson 1, open the Lesson2.swc project located in the Bentley\SewerCAD8\Lessons directory.
Part 1: Specifying Design Constraints
SewerCAD requires parameters by which to measure the validity of a possible design. These parameters, or design constraints, can either be set locally for each individual element or they can be entered as default design constraints.
Bentley SewerCAD V8i User’s Guide 3-71
Lesson 2 - Automatic Design
Default design constraints are specified in the Default Design Constraints dialog.
1. Click the Components menu and select Default Design Constraints.
2. On the Gravity Pipe tab, enter the minimum and maximum flow velocities, slopes, and covers that the newly designed pipe's characteristics should fall between in the Velocity, Cover, and Slope tabs respectively. These values are listed in the table below.
You could further hone the design with the Extended Design features on the right side of the dialog by checking the box for one or more of the three extended design criteria in their tabs and entering a constraining value to have SewerCAD utilize the feature.
3. Click the Node tab to set constraints for gravity structures. Set the Pipe Matching constraint to Inverts and the Matchline Offset to 0.0 m. From this, SewerCAD knows to set the inverts of the incoming pipe at the same elevation as the invert of the outgoing pipe for the same structure. Click Close to exit the dialog.
Table 3-11: Design Constraint Data
Minimum Maximum
Velocity 0.60 m/s 4.00 m/s
Cover 0.70 m 4.00 m
Slope 0.005 m/m 0.10 m/m
3-72 Bentley SewerCAD V8i User’s Guide
Quick Start Lessons
4. Consider that the downstream invert of conduit P-2, entering into the wet well, WW-1, is at a known elevation and should not be adjusted by SewerCAD's auto-matic design process. In this situation, you can locally specify that SewerCAD not design the downstream invert of P-2. Double-click P-2 to open the Properties editor for that element. Change the value of the Design Stop Invert? field to False.
If you were to set the Specify Local Pipe Constraints? field to True, you would then be able to fill in pipe design constraints specific to the currently highlighted element.
5. When designing gravity pipes, SewerCAD will choose from among only the pipes that are specified as available for design in the Conduit Catalog. Click the Compo-nents menu and select Conduit Catalog.
6. A large number of predefined pipes are stored in the Conduit Engineering Library. Click the Synchronization Options button and select Import from library. Expand the Conduit Catalog and Conduits Library - Metric.xml nodes.
Bentley SewerCAD V8i User’s Guide 3-73
Lesson 2 - Automatic Design
7. Check the box next to Circular - Concrete to import all of the defined concrete circular conduits. Click the Select button.
8. The Conduit Catalog is now populated with the imported conduits. Note that the Available for Design? box is checked for each of them, indicating that SewerCAD can consider these conduits as replacements for the existing ones during the Design run. Close the Conduit Catalog.
3-74 Bentley SewerCAD V8i User’s Guide
Quick Start Lessons
Part 2: Design
To run an automatic design the Calculation Type calculation option must be changed from Analysis to Design.
1. Click the Analysis menu and select Calculation Options. Highlight Base Calcula-tion Options. The Properties editor will display the settings used by this calcula-tion option. Change the Calculation Type to Design.
2. Close the Calculation Options manager.
3. Click the Compute button.
4. A prompt appears, asking whether you would like to create a new Physical alter-native to capture any modifications made by the design run.
Alternatives are groups of data that describe a specific part of your model such as physical data, loading data, and infiltration data. Alternatives will be discussed further in Lesson 3. By clicking Yes, the model remembers the initial design as well as the new design for the sake of comparison. In this case click No and allow the model to overwrite the current physical alternative.
5. Close the Detailed Calculation Summary dialog.
6. Note that SewerCAD has replaced the 200mm pipes for P-1, P-2, and P-3 with larger diameter ones.
7. Save the project before proceeding to the next lesson.
This lesson introduced one possible application of the automatic design feature. This is a powerful tool that will save you time and effort. Spend some time to learn more about this feature by experimenting with the software, and if you have any questions press the F1 key to access our context sensitive on-line help. See Lesson 3 for more information on SewerCAD's scenario management feature.
Bentley SewerCAD V8i User’s Guide 3-75
Lesson 3 - Scenario Management
Lesson 3 - Scenario ManagementOne of SewerCAD's many powerful and versatile project tools is Scenario Manage-ment. Scenarios allow you to calculate multiple "What If?" situations in a single project file. You may wish to try several designs and compare the results, or analyze an existing system using several different loading possibilities and compare the resulting profiles. A scenario consists of a group of alternatives, which are groups of actual model data. Both scenarios and alternatives are based on a parent/child rela-tionship where child scenarios and alternatives inherit data from the parent scenarios and alternatives.
In this lesson we will use Scenario Management to set up the scenarios needed to test four "What If?" situations for the purpose of analyzing a new sanitary sewer system design. At the end of the lesson, we will compare all of the results using the Scenario Comparison tool.
Part 1 - Opening the Project File
For this lesson we will use the system designed in Lesson 2. Click the Open Existing File button in the Welcome dialog, or select File / Open from the pull-down menus to bring up the Open Project File dialog. Open the project you saved from Lesson 2, or find Lesson3.swc in the Bentley\SewerCAD8\Lessons directory.
In Lesson 2 we designed the gravity portion of this system using the automatic design tool. In this lesson, we will use scenario management to model different force main designs.
Part 2 - Creating Alternatives
First, we need to set up the required data sets (alternatives). An alternative is a group of data describing a specific part of the model. There are eleven alternatives: Active Topology, Physical, Design, Headloss, Boundary Condition, Initial Settings, Sanitary Loading, Infiltration and Inflow, System Flows, Operational, and User Data Exten-sions. In this example, we need to set up a different physical alternative for each design trial we want to evaluate. Each physical alternative will contain different pres-sure pipe data.
1. Click the Analysis menu and select Alternatives to open the Alternatives manager. Expand the Physical Alternative node.
In SewerCAD, we create families of alternatives. There are parent alternatives (base alternatives) and there are child alternatives. A child alternative inherits data from its parent. You can, however, override data inherited from the parent, making it local to the child.
3-76 Bentley SewerCAD V8i User’s Guide
Quick Start Lessons
2. Currently, there is only one Physical Alternative listed. The Base Physical alter-native contains the properties for the current undersized force mains. We would like to add a child of the Base-Physical alternative so we can inherit most of the data but change only the properties that we want to modify. Right-click the Base Physical alternative and select New > Child Alternative. Rename the new alterna-tive to have a descriptive name such as "Larger Pressure Pipes".
3. Double-click the Larger Pressure Pipes alternative to open the Physical alternative editor.
4. Select the Pressure Pipe tab at the top of the dialog. Notice the legend at the bottom describing the check boxes. It indicates, all of our data is inherited. If you change any piece of data, the check box will automatically become checked because that record is now local to this alternative and not inherited from the
Bentley SewerCAD V8i User’s Guide 3-77
Lesson 3 - Scenario Management
parent. Set up this design trial by making the changes shown in the table below. Click Close to exit the Physical Alternative Editor and return to the Alternatives manager.
5. Next, we will add another physical alternative for another design trial. Right-click the Base Physical alternative and select New > Child Alternative. Rename the new alternative to Smaller Pump. Double-click the Smaller Pump Alternative to open the alternative editor.
6. Select the Pump tab. For this trial, we will leave the existing system the same but with a different size pump. To change the pump curve click the ellipsis (...) button in the Pump Definition field.
Table 3-12: Pressure Pipe Alternative Data
Change From:
To:
Diameter (mm)
Diameter (mm)
FM-1 200 300
FM-2 200 300
FM-3 200 300
3-78 Bentley SewerCAD V8i User’s Guide
Quick Start Lessons
7. In the Pump Definition dialog click the New button. Rename the new definition Smaller Pump. Enter the pump data using the following information:
8. Close the Pump Definition dialog. In the alternative editor, change the Pump Defi-nition to Smaller Pump. Close the alternative editor.
Table 3-13: Smaller Pump Alternative Data
Change From: To:
Discharge (m3/s)
Head (m) Discharge (m3/s)
Head (m)
Shutoff 0.00 53.33 0.00 48.00
Design 0.25 40.00 0.20 35.00
Max Operating
0.50 0.00 0.40 0.00
Bentley SewerCAD V8i User’s Guide 3-79
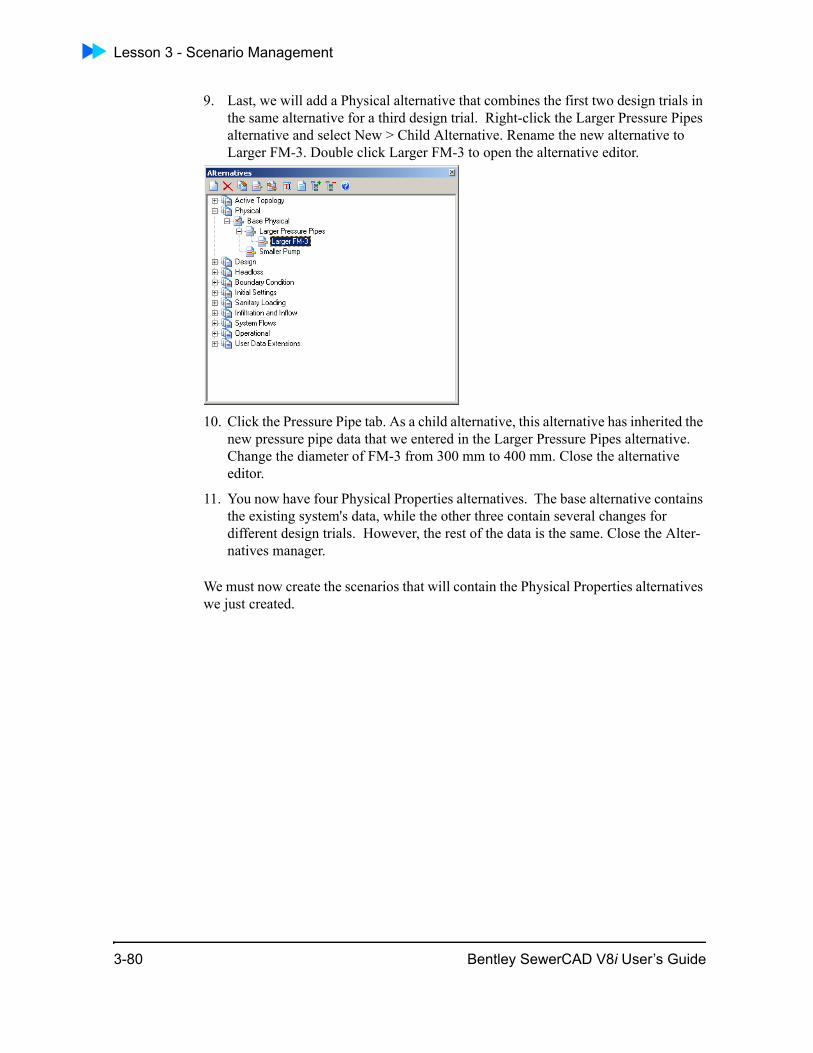
Lesson 3 - Scenario Management
9. Last, we will add a Physical alternative that combines the first two design trials in the same alternative for a third design trial. Right-click the Larger Pressure Pipes alternative and select New > Child Alternative. Rename the new alternative to Larger FM-3. Double click Larger FM-3 to open the alternative editor.
10. Click the Pressure Pipe tab. As a child alternative, this alternative has inherited the new pressure pipe data that we entered in the Larger Pressure Pipes alternative. Change the diameter of FM-3 from 300 mm to 400 mm. Close the alternative editor.
11. You now have four Physical Properties alternatives. The base alternative contains the existing system's data, while the other three contain several changes for different design trials. However, the rest of the data is the same. Close the Alter-natives manager.
We must now create the scenarios that will contain the Physical Properties alternatives we just created.
3-80 Bentley SewerCAD V8i User’s Guide
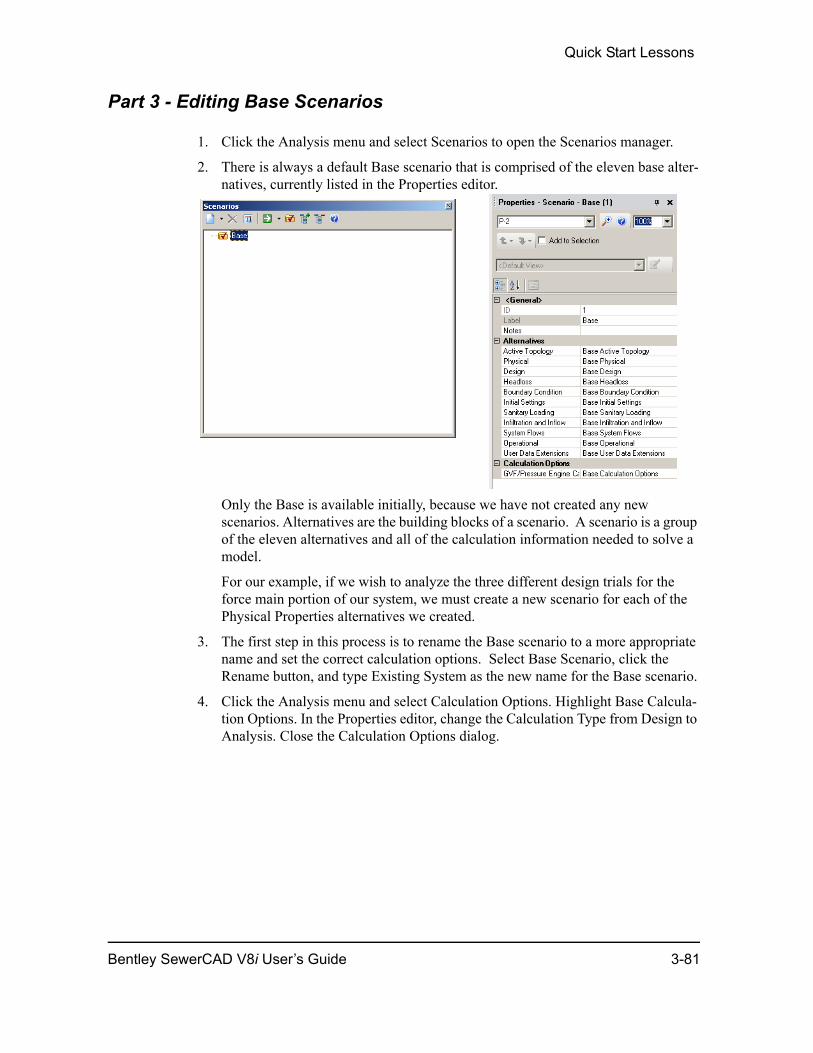
Quick Start Lessons
Part 3 - Editing Base Scenarios
1. Click the Analysis menu and select Scenarios to open the Scenarios manager.
2. There is always a default Base scenario that is comprised of the eleven base alter-natives, currently listed in the Properties editor.
Only the Base is available initially, because we have not created any new scenarios. Alternatives are the building blocks of a scenario. A scenario is a group of the eleven alternatives and all of the calculation information needed to solve a model.
For our example, if we wish to analyze the three different design trials for the force main portion of our system, we must create a new scenario for each of the Physical Properties alternatives we created.
3. The first step in this process is to rename the Base scenario to a more appropriate name and set the correct calculation options. Select Base Scenario, click the Rename button, and type Existing System as the new name for the Base scenario.
4. Click the Analysis menu and select Calculation Options. Highlight Base Calcula-tion Options. In the Properties editor, change the Calculation Type from Design to Analysis. Close the Calculation Options dialog.
Bentley SewerCAD V8i User’s Guide 3-81
Lesson 3 - Scenario Management
Part 4 - Creating Child Scenarios
The last step in setting up our scenarios is to create child scenarios. The new child scenarios will contain the Physical Properties alternatives created earlier.
1. Highlight the base scenario entitled Existing System and click the New button, then select Child Scenario. Rename the new scenario Design Trial #1.
Scenarios work in families just like alternatives, except scenarios do not inherit data directly. A scenario is a group of alternatives, so a child scenario will inherit the parent's alternatives. To change the new scenario you need to change one or more of the alternatives.
Our new child scenario initially consists of the same alternatives as its parent scenario. We want to set the Physical Properties alternative to the first alternative we created, Larger Pressure Pipes.
3-82 Bentley SewerCAD V8i User’s Guide
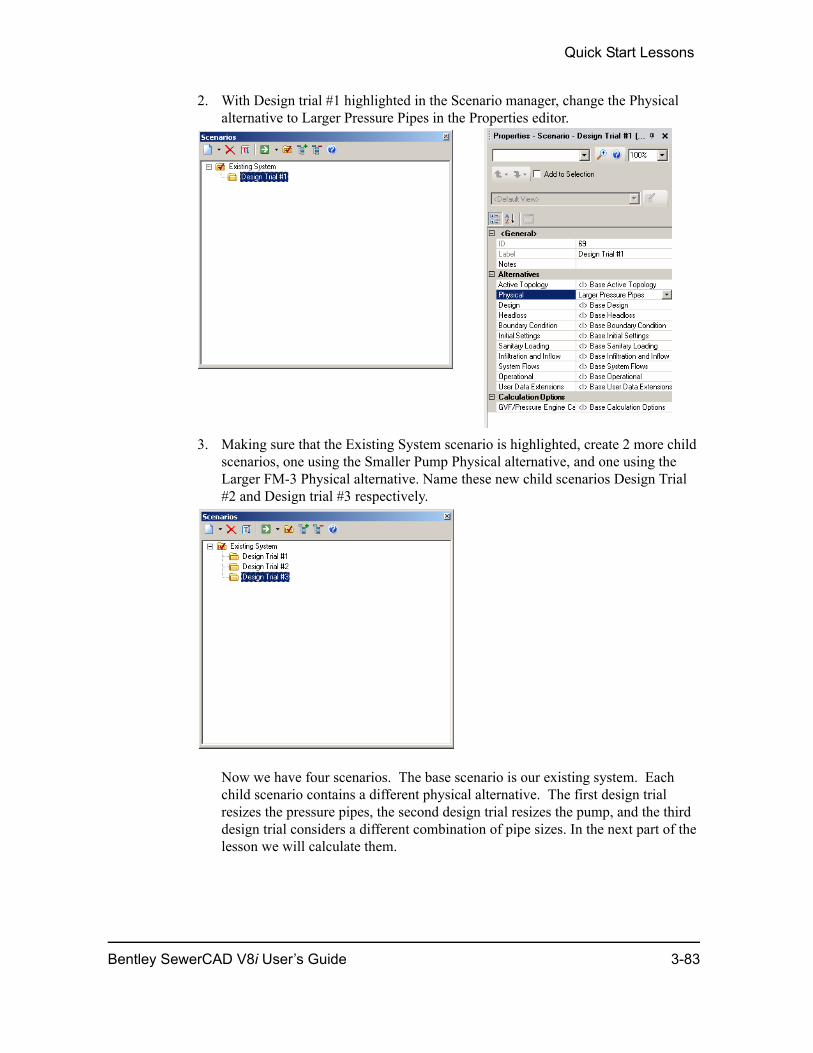
Quick Start Lessons
2. With Design trial #1 highlighted in the Scenario manager, change the Physical alternative to Larger Pressure Pipes in the Properties editor.
3. Making sure that the Existing System scenario is highlighted, create 2 more child scenarios, one using the Smaller Pump Physical alternative, and one using the Larger FM-3 Physical alternative. Name these new child scenarios Design Trial #2 and Design trial #3 respectively.
Now we have four scenarios. The base scenario is our existing system. Each child scenario contains a different physical alternative. The first design trial resizes the pressure pipes, the second design trial resizes the pump, and the third design trial considers a different combination of pipe sizes. In the next part of the lesson we will calculate them.
Bentley SewerCAD V8i User’s Guide 3-83
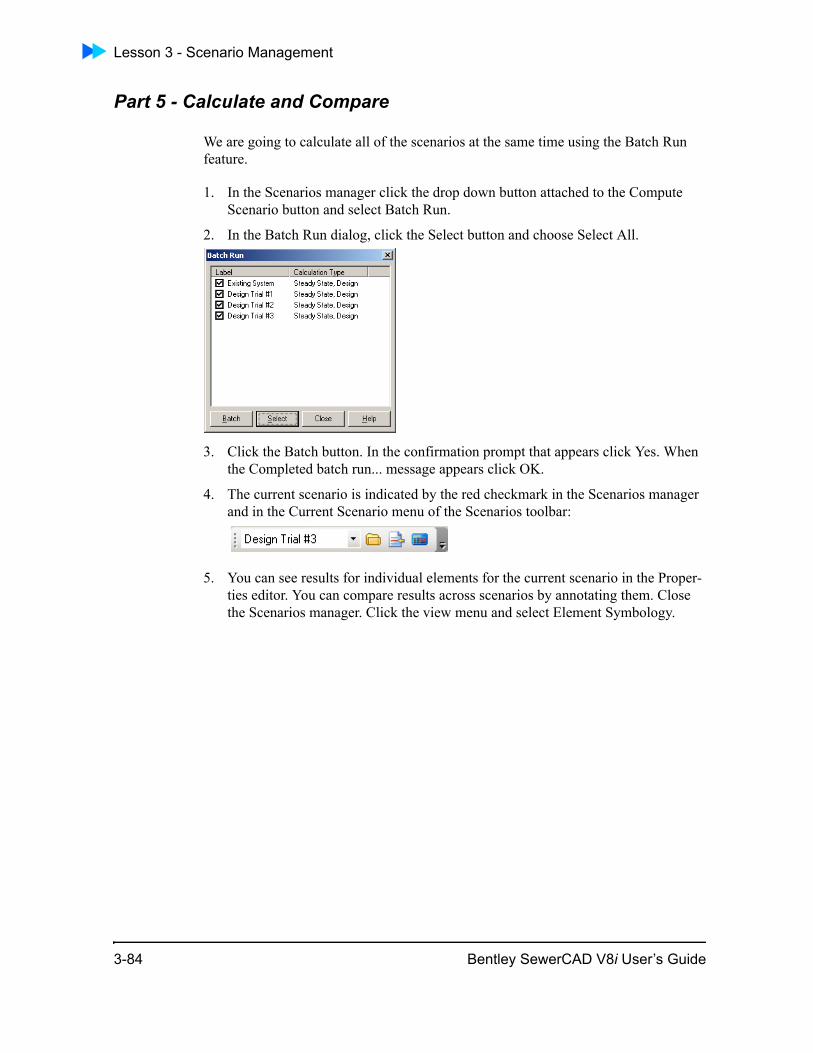
Lesson 3 - Scenario Management
Part 5 - Calculate and Compare
We are going to calculate all of the scenarios at the same time using the Batch Run feature.
1. In the Scenarios manager click the drop down button attached to the Compute Scenario button and select Batch Run.
2. In the Batch Run dialog, click the Select button and choose Select All.
3. Click the Batch button. In the confirmation prompt that appears click Yes. When the Completed batch run... message appears click OK.
4. The current scenario is indicated by the red checkmark in the Scenarios manager and in the Current Scenario menu of the Scenarios toolbar:
5. You can see results for individual elements for the current scenario in the Proper-ties editor. You can compare results across scenarios by annotating them. Close the Scenarios manager. Click the view menu and select Element Symbology.
3-84 Bentley SewerCAD V8i User’s Guide
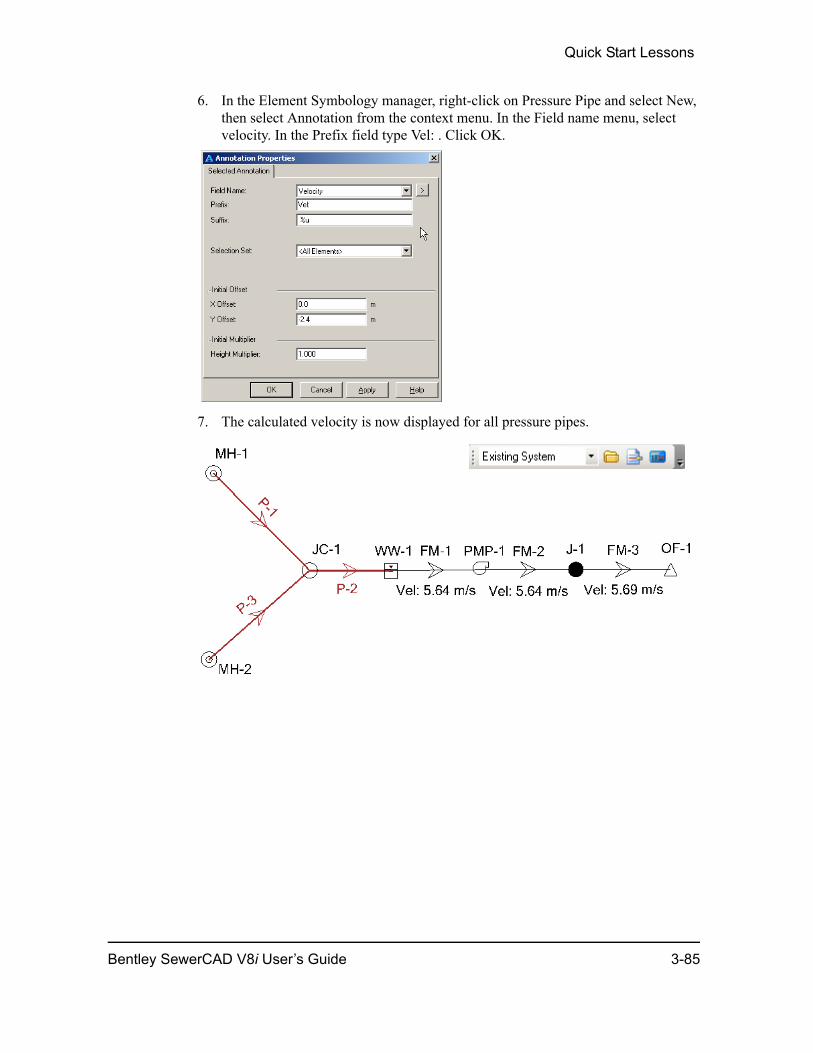
Quick Start Lessons
6. In the Element Symbology manager, right-click on Pressure Pipe and select New, then select Annotation from the context menu. In the Field name menu, select velocity. In the Prefix field type Vel: . Click OK.
7. The calculated velocity is now displayed for all pressure pipes.
Bentley SewerCAD V8i User’s Guide 3-85
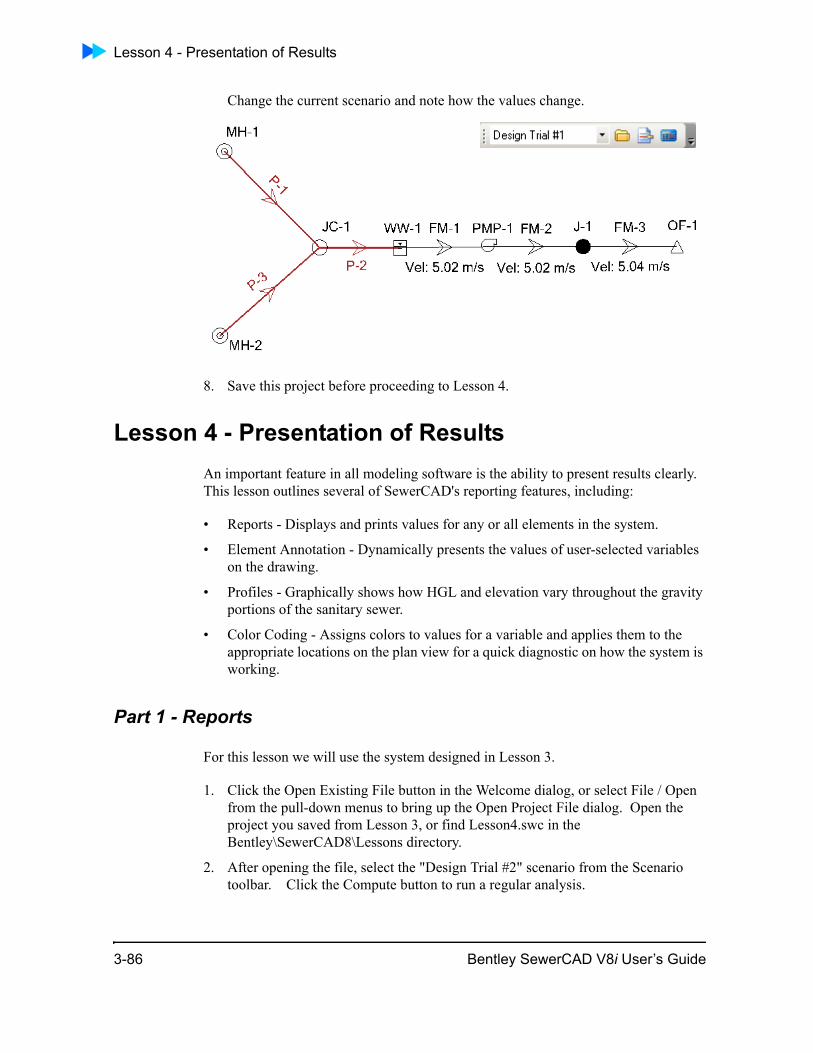
Lesson 4 - Presentation of Results
Change the current scenario and note how the values change.
8. Save this project before proceeding to Lesson 4.
Lesson 4 - Presentation of ResultsAn important feature in all modeling software is the ability to present results clearly. This lesson outlines several of SewerCAD's reporting features, including:
• Reports - Displays and prints values for any or all elements in the system.
• Element Annotation - Dynamically presents the values of user-selected variables on the drawing.
• Profiles - Graphically shows how HGL and elevation vary throughout the gravity portions of the sanitary sewer.
• Color Coding - Assigns colors to values for a variable and applies them to the appropriate locations on the plan view for a quick diagnostic on how the system is working.
Part 1 - Reports
For this lesson we will use the system designed in Lesson 3.
1. Click the Open Existing File button in the Welcome dialog, or select File / Open from the pull-down menus to bring up the Open Project File dialog. Open the project you saved from Lesson 3, or find Lesson4.swc in the Bentley\SewerCAD8\Lessons directory.
2. After opening the file, select the "Design Trial #2" scenario from the Scenario toolbar. Click the Compute button to run a regular analysis.
3-86 Bentley SewerCAD V8i User’s Guide
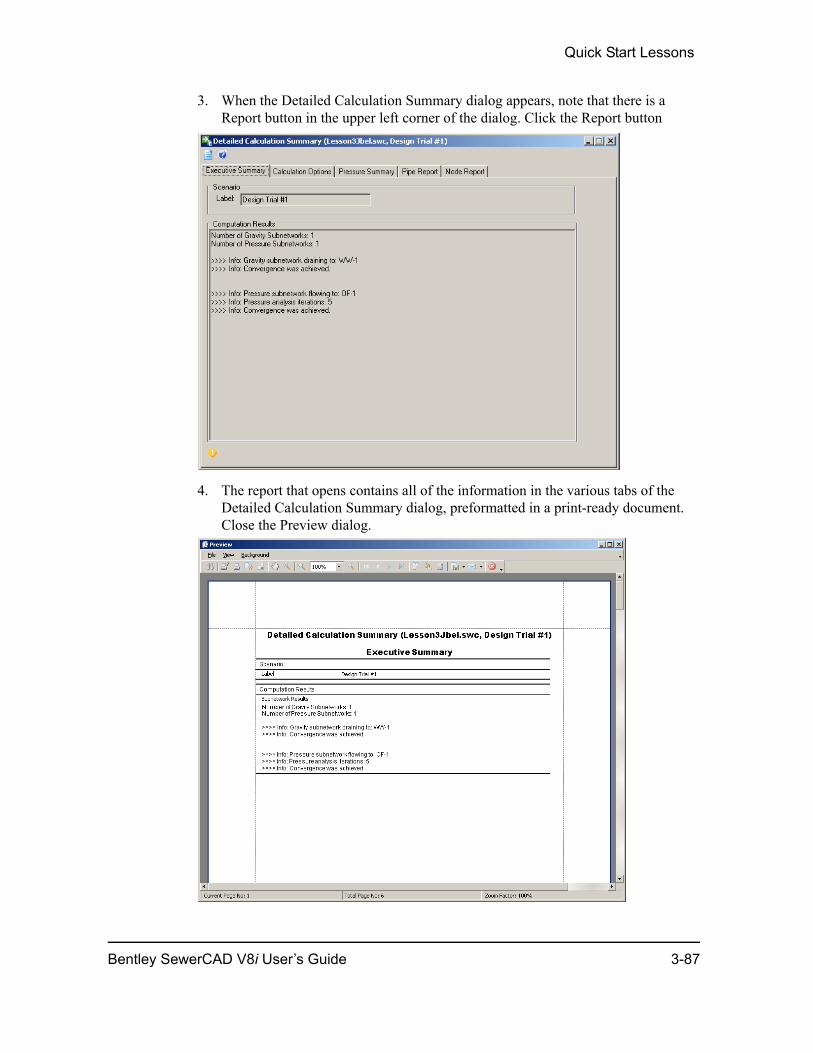
Quick Start Lessons
3. When the Detailed Calculation Summary dialog appears, note that there is a Report button in the upper left corner of the dialog. Click the Report button
4. The report that opens contains all of the information in the various tabs of the Detailed Calculation Summary dialog, preformatted in a print-ready document. Close the Preview dialog.
Bentley SewerCAD V8i User’s Guide 3-87
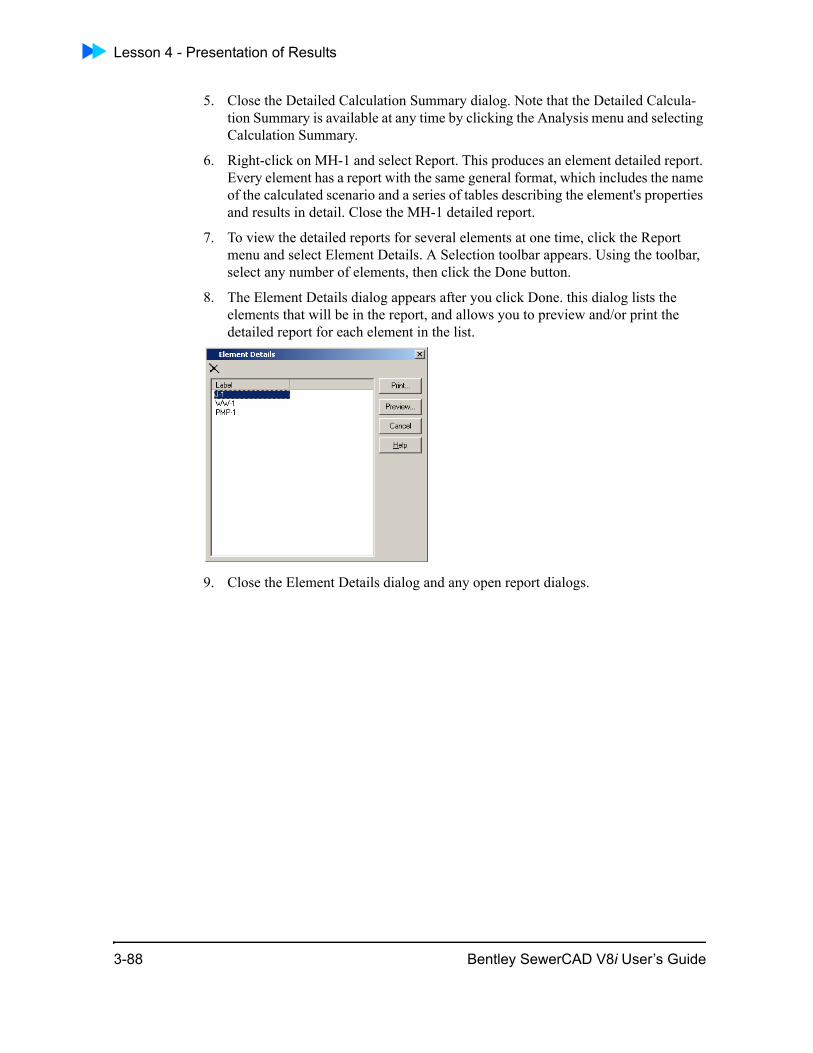
Lesson 4 - Presentation of Results
5. Close the Detailed Calculation Summary dialog. Note that the Detailed Calcula-tion Summary is available at any time by clicking the Analysis menu and selecting Calculation Summary.
6. Right-click on MH-1 and select Report. This produces an element detailed report. Every element has a report with the same general format, which includes the name of the calculated scenario and a series of tables describing the element's properties and results in detail. Close the MH-1 detailed report.
7. To view the detailed reports for several elements at one time, click the Report menu and select Element Details. A Selection toolbar appears. Using the toolbar, select any number of elements, then click the Done button.
8. The Element Details dialog appears after you click Done. this dialog lists the elements that will be in the report, and allows you to preview and/or print the detailed report for each element in the list.
9. Close the Element Details dialog and any open report dialogs.
3-88 Bentley SewerCAD V8i User’s Guide
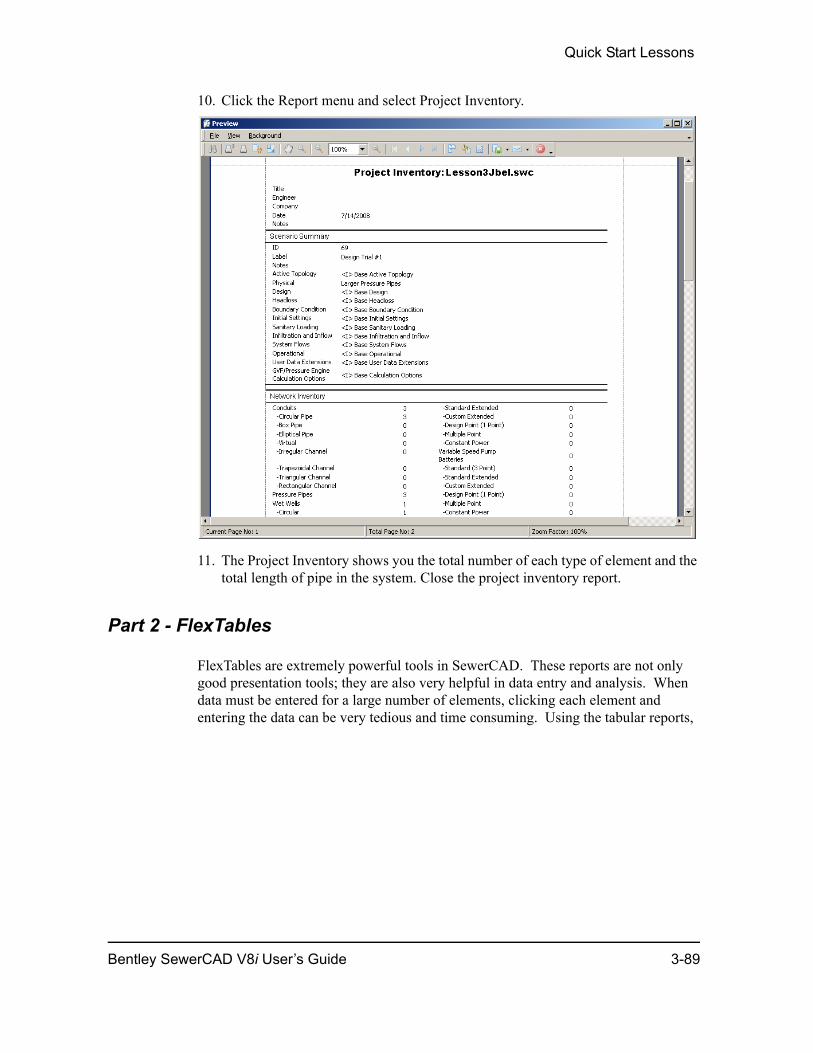
Quick Start Lessons
10. Click the Report menu and select Project Inventory.
11. The Project Inventory shows you the total number of each type of element and the total length of pipe in the system. Close the project inventory report.
Part 2 - FlexTables
FlexTables are extremely powerful tools in SewerCAD. These reports are not only good presentation tools; they are also very helpful in data entry and analysis. When data must be entered for a large number of elements, clicking each element and entering the data can be very tedious and time consuming. Using the tabular reports,
Bentley SewerCAD V8i User’s Guide 3-89
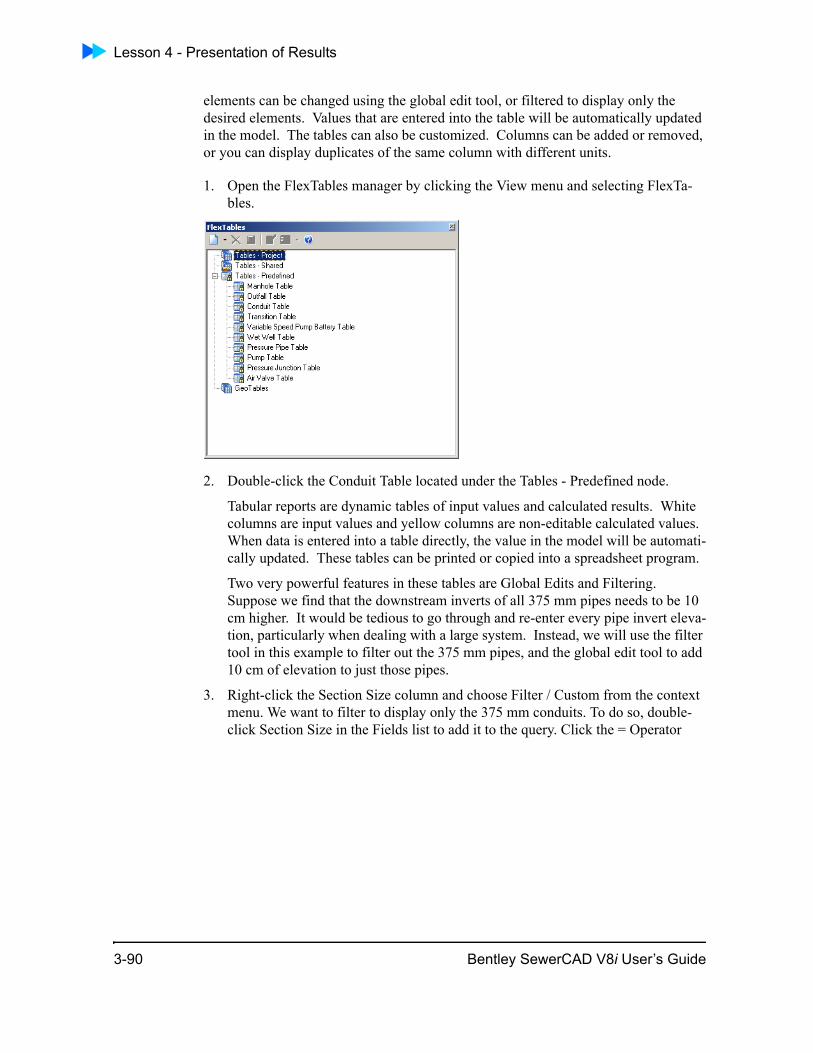
Lesson 4 - Presentation of Results
elements can be changed using the global edit tool, or filtered to display only the desired elements. Values that are entered into the table will be automatically updated in the model. The tables can also be customized. Columns can be added or removed, or you can display duplicates of the same column with different units.
1. Open the FlexTables manager by clicking the View menu and selecting FlexTa-bles.
2. Double-click the Conduit Table located under the Tables - Predefined node.
Tabular reports are dynamic tables of input values and calculated results. White columns are input values and yellow columns are non-editable calculated values. When data is entered into a table directly, the value in the model will be automati-cally updated. These tables can be printed or copied into a spreadsheet program.
Two very powerful features in these tables are Global Edits and Filtering. Suppose we find that the downstream inverts of all 375 mm pipes needs to be 10 cm higher. It would be tedious to go through and re-enter every pipe invert eleva-tion, particularly when dealing with a large system. Instead, we will use the filter tool in this example to filter out the 375 mm pipes, and the global edit tool to add 10 cm of elevation to just those pipes.
3. Right-click the Section Size column and choose Filter / Custom from the context menu. We want to filter to display only the 375 mm conduits. To do so, double-click Section Size in the Fields list to add it to the query. Click the = Operator
3-90 Bentley SewerCAD V8i User’s Guide
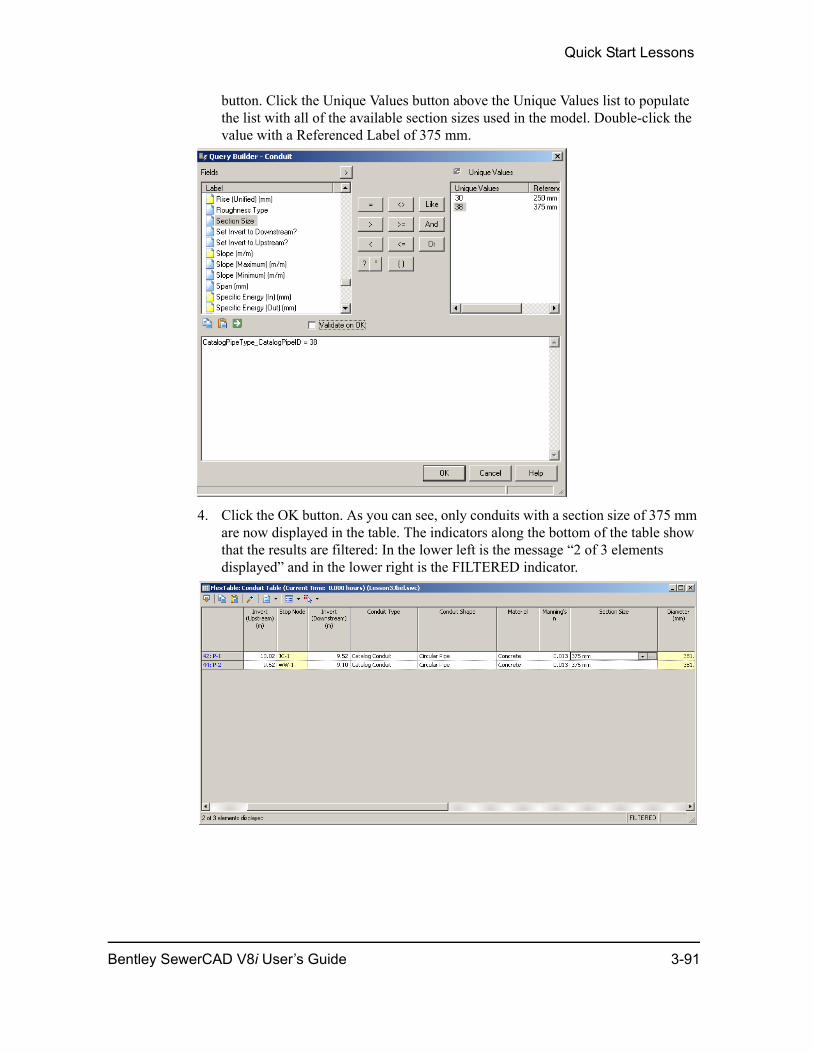
Quick Start Lessons
button. Click the Unique Values button above the Unique Values list to populate the list with all of the available section sizes used in the model. Double-click the value with a Referenced Label of 375 mm.
4. Click the OK button. As you can see, only conduits with a section size of 375 mm are now displayed in the table. The indicators along the bottom of the table show that the results are filtered: In the lower left is the message “2 of 3 elements displayed” and in the lower right is the FILTERED indicator.
Bentley SewerCAD V8i User’s Guide 3-91
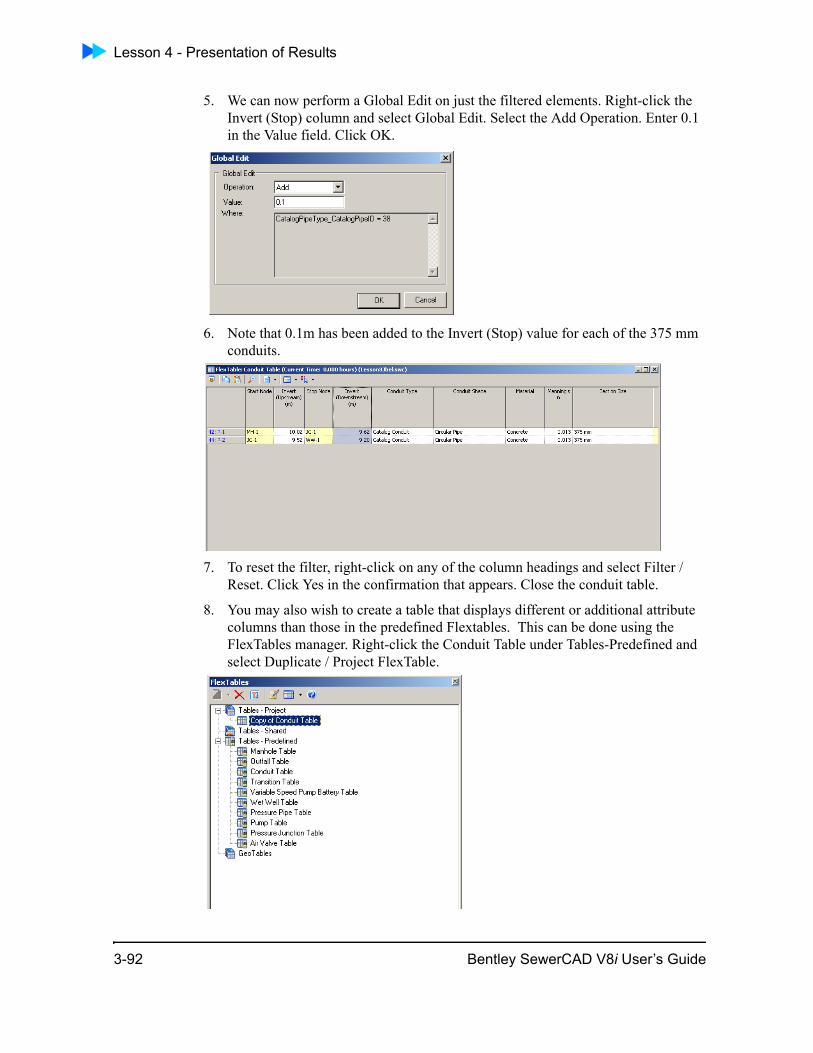
Lesson 4 - Presentation of Results
5. We can now perform a Global Edit on just the filtered elements. Right-click the Invert (Stop) column and select Global Edit. Select the Add Operation. Enter 0.1 in the Value field. Click OK.
6. Note that 0.1m has been added to the Invert (Stop) value for each of the 375 mm conduits.
7. To reset the filter, right-click on any of the column headings and select Filter / Reset. Click Yes in the confirmation that appears. Close the conduit table.
8. You may also wish to create a table that displays different or additional attribute columns than those in the predefined Flextables. This can be done using the FlexTables manager. Right-click the Conduit Table under Tables-Predefined and select Duplicate / Project FlexTable.
3-92 Bentley SewerCAD V8i User’s Guide
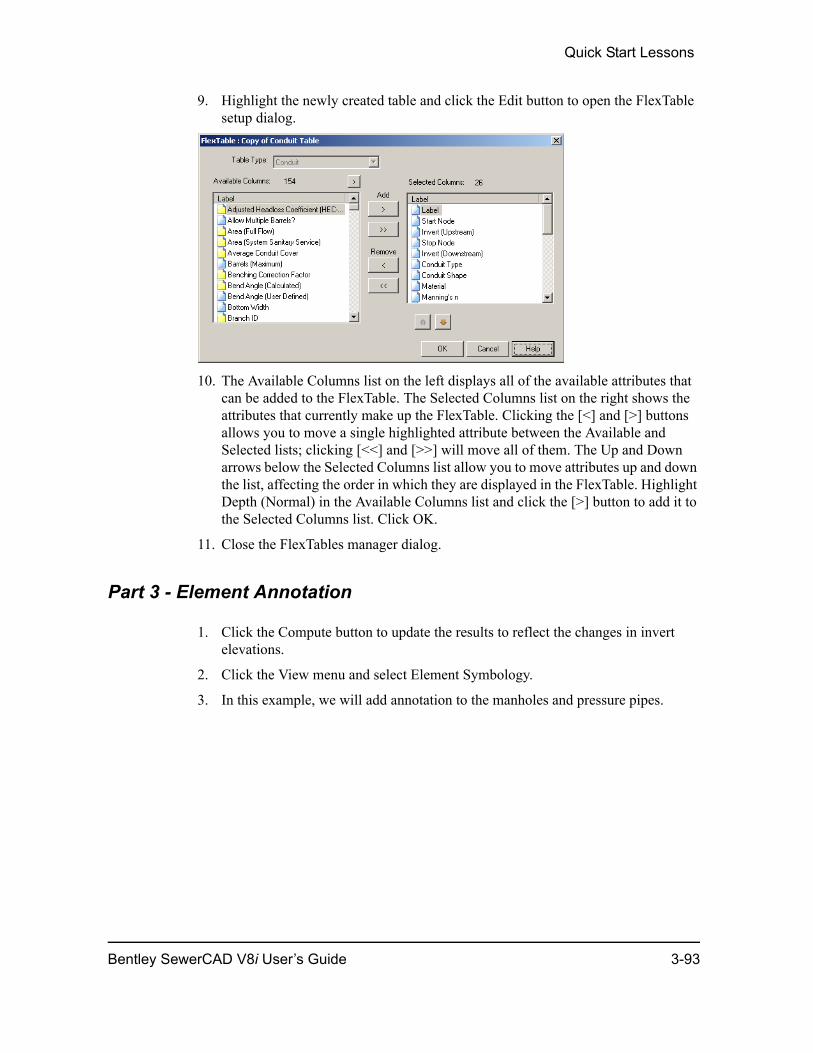
Quick Start Lessons
9. Highlight the newly created table and click the Edit button to open the FlexTable setup dialog.
10. The Available Columns list on the left displays all of the available attributes that can be added to the FlexTable. The Selected Columns list on the right shows the attributes that currently make up the FlexTable. Clicking the [<] and [>] buttons allows you to move a single highlighted attribute between the Available and Selected lists; clicking [<<] and [>>] will move all of them. The Up and Down arrows below the Selected Columns list allow you to move attributes up and down the list, affecting the order in which they are displayed in the FlexTable. Highlight Depth (Normal) in the Available Columns list and click the [>] button to add it to the Selected Columns list. Click OK.
11. Close the FlexTables manager dialog.
Part 3 - Element Annotation
1. Click the Compute button to update the results to reflect the changes in invert elevations.
2. Click the View menu and select Element Symbology.
3. In this example, we will add annotation to the manholes and pressure pipes.
Bentley SewerCAD V8i User’s Guide 3-93
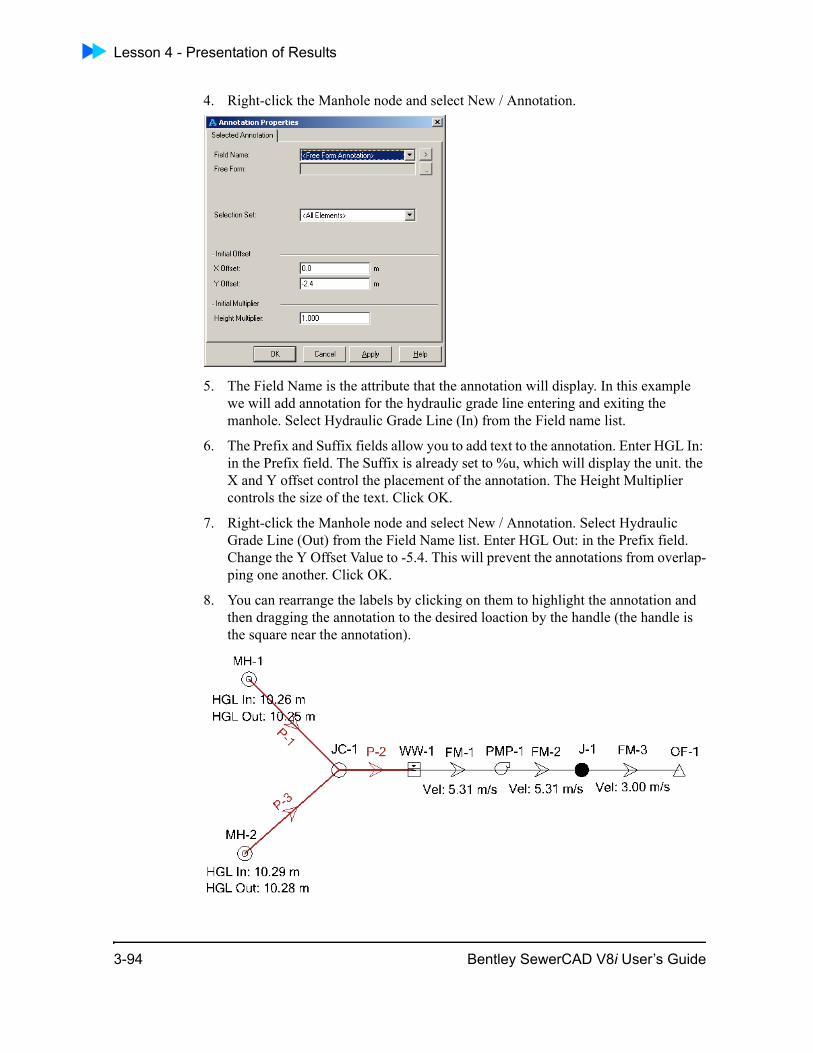
Lesson 4 - Presentation of Results
4. Right-click the Manhole node and select New / Annotation.
5. The Field Name is the attribute that the annotation will display. In this example we will add annotation for the hydraulic grade line entering and exiting the manhole. Select Hydraulic Grade Line (In) from the Field name list.
6. The Prefix and Suffix fields allow you to add text to the annotation. Enter HGL In: in the Prefix field. The Suffix is already set to %u, which will display the unit. the X and Y offset control the placement of the annotation. The Height Multiplier controls the size of the text. Click OK.
7. Right-click the Manhole node and select New / Annotation. Select Hydraulic Grade Line (Out) from the Field Name list. Enter HGL Out: in the Prefix field. Change the Y Offset Value to -5.4. This will prevent the annotations from overlap-ping one another. Click OK.
8. You can rearrange the labels by clicking on them to highlight the annotation and then dragging the annotation to the desired loaction by the handle (the handle is the square near the annotation).
3-94 Bentley SewerCAD V8i User’s Guide
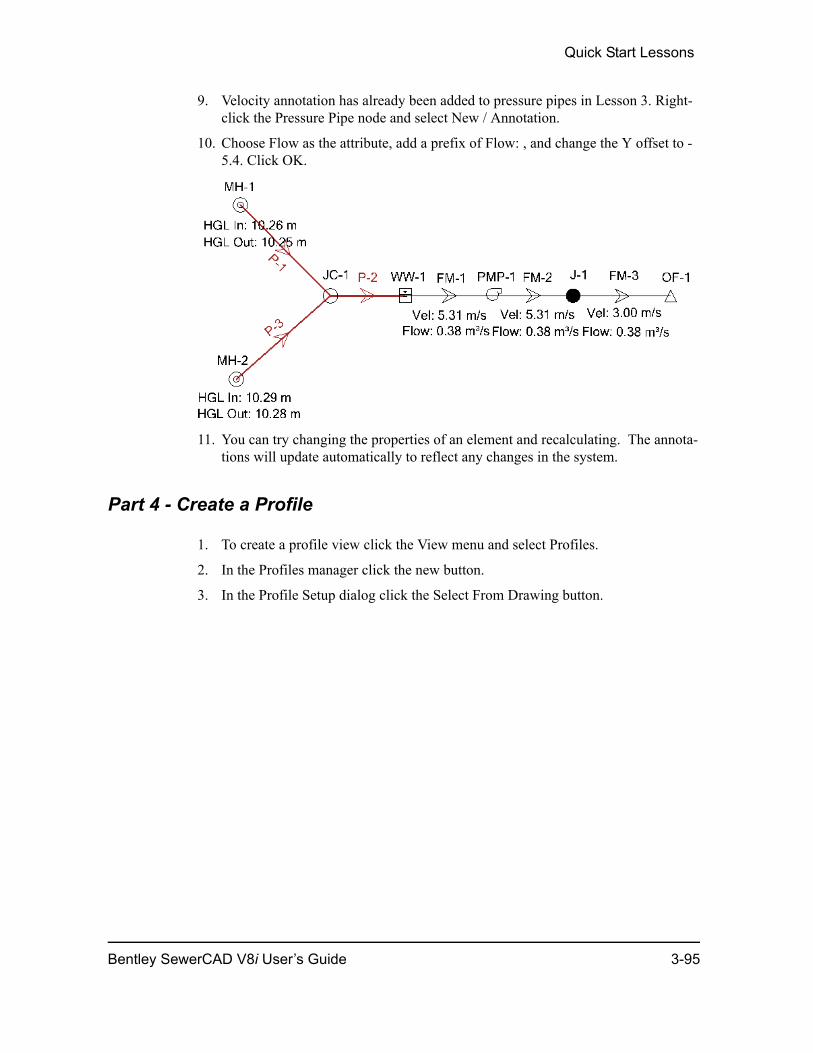
Quick Start Lessons
9. Velocity annotation has already been added to pressure pipes in Lesson 3. Right-click the Pressure Pipe node and select New / Annotation.
10. Choose Flow as the attribute, add a prefix of Flow: , and change the Y offset to -5.4. Click OK.
11. You can try changing the properties of an element and recalculating. The annota-tions will update automatically to reflect any changes in the system.
Part 4 - Create a Profile
1. To create a profile view click the View menu and select Profiles.
2. In the Profiles manager click the new button.
3. In the Profile Setup dialog click the Select From Drawing button.
Bentley SewerCAD V8i User’s Guide 3-95

Lesson 4 - Presentation of Results
4. Click P-3 and P-2. Note that the nodes at the end of the pipes are also selected. Click the Done button.
5. In the Profile Setup dialog click the Open Profile button.
6. In the profile view you can zoom in and out, copy the profile view to the clip-board, and print the profile view. You can export the profile view as a DXF file by clicking Chart Settings / Export to DXF. You can change the scale and direction of the profile view by clicking Chart Settings and then Axis Options.
7. You can add a legend describing the various colored lines in the profile by clicking Chart Settings / Legend.
8. You can add Annotation lablels by clicking Chart Settings and selecting Display Annotation Labels. You can add a table displaying the values of various attributes below the profile view by clicking Chart Settings / Profile Annotation Table. Experiment with the various settings, then close the profile view and the Profiles Manager.
9. Save the project before continuing.
3-96 Bentley SewerCAD V8i User’s Guide
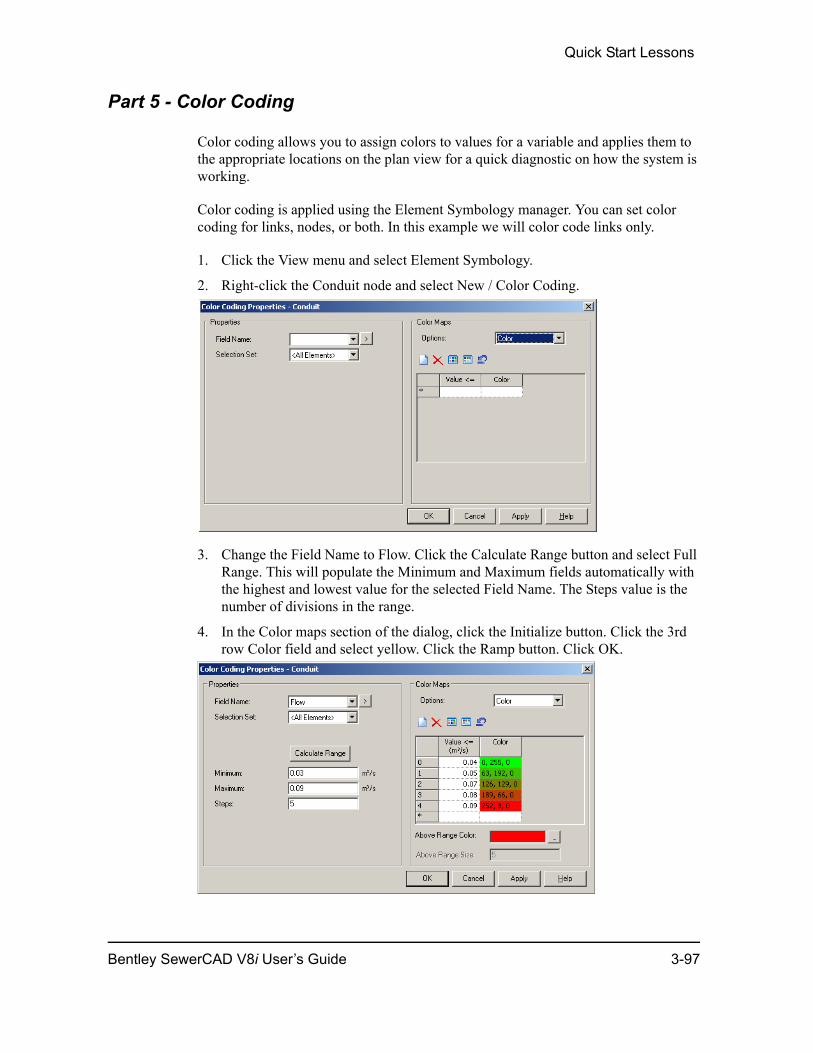
Quick Start Lessons
Part 5 - Color Coding
Color coding allows you to assign colors to values for a variable and applies them to the appropriate locations on the plan view for a quick diagnostic on how the system is working.
Color coding is applied using the Element Symbology manager. You can set color coding for links, nodes, or both. In this example we will color code links only.
1. Click the View menu and select Element Symbology.
2. Right-click the Conduit node and select New / Color Coding.
3. Change the Field Name to Flow. Click the Calculate Range button and select Full Range. This will populate the Minimum and Maximum fields automatically with the highest and lowest value for the selected Field Name. The Steps value is the number of divisions in the range.
4. In the Color maps section of the dialog, click the Initialize button. Click the 3rd row Color field and select yellow. Click the Ramp button. Click OK.
Bentley SewerCAD V8i User’s Guide 3-97
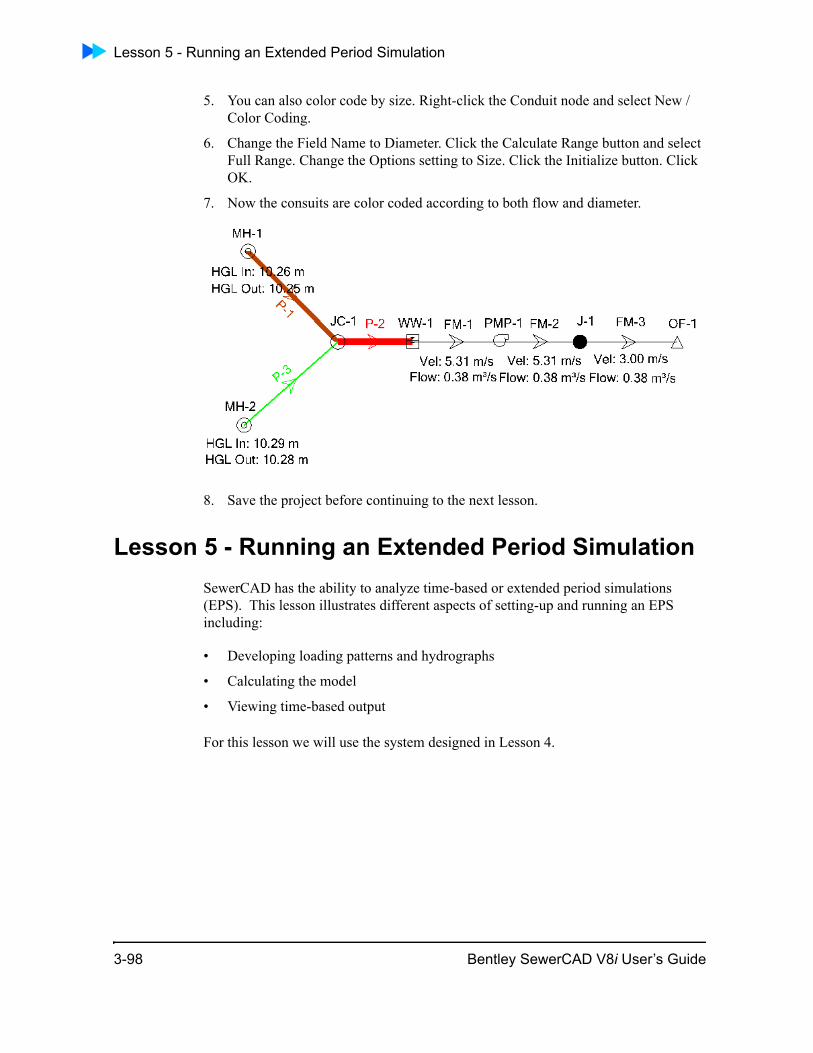
Lesson 5 - Running an Extended Period Simulation
5. You can also color code by size. Right-click the Conduit node and select New / Color Coding.
6. Change the Field Name to Diameter. Click the Calculate Range button and select Full Range. Change the Options setting to Size. Click the Initialize button. Click OK.
7. Now the consuits are color coded according to both flow and diameter.
8. Save the project before continuing to the next lesson.
Lesson 5 - Running an Extended Period Simulation SewerCAD has the ability to analyze time-based or extended period simulations (EPS). This lesson illustrates different aspects of setting-up and running an EPS including:
• Developing loading patterns and hydrographs
• Calculating the model
• Viewing time-based output
For this lesson we will use the system designed in Lesson 4.
3-98 Bentley SewerCAD V8i User’s Guide
Quick Start Lessons
Part 1 - Entering and Applying Loading Patterns
Loading patterns are a series of time-based multipliers that are applied to average loads, which describe how the load varies over time. In this lesson, we are going to create a loading pattern and apply it to the unit sanitary loads established with the model in an earlier lesson, and to a new Pattern Load.
1. Click the Open Existing File button in the Welcome dialog, or select File / Open from the pull-down menus to bring up the Open Project File dialog. Open the project you saved from Lesson 4, or find Lesson5.swc in the Bentley\SewerCAD8\Lessons directory.
2. To create a new loading pattern click the Components menu and select Patterns.
3. Highlight the Hydraulic node and click the New button.
4. Rename the pattern Lesson 5 Pattern. Leave the Start Time set to 12:00:00 AM but change the Starting Multiplier to 0.4. Change the Pattern Format to Contin-uous. Fill in the pattern using the following data:
Table 3-14: Loading Pattern Data
Time from Start
(hours)
Multiplier
3 0.8
6 1.2
9 1.7
12 1.4
15 1.2
18 1.3
21 0.6
24 0.4
Bentley SewerCAD V8i User’s Guide 3-99
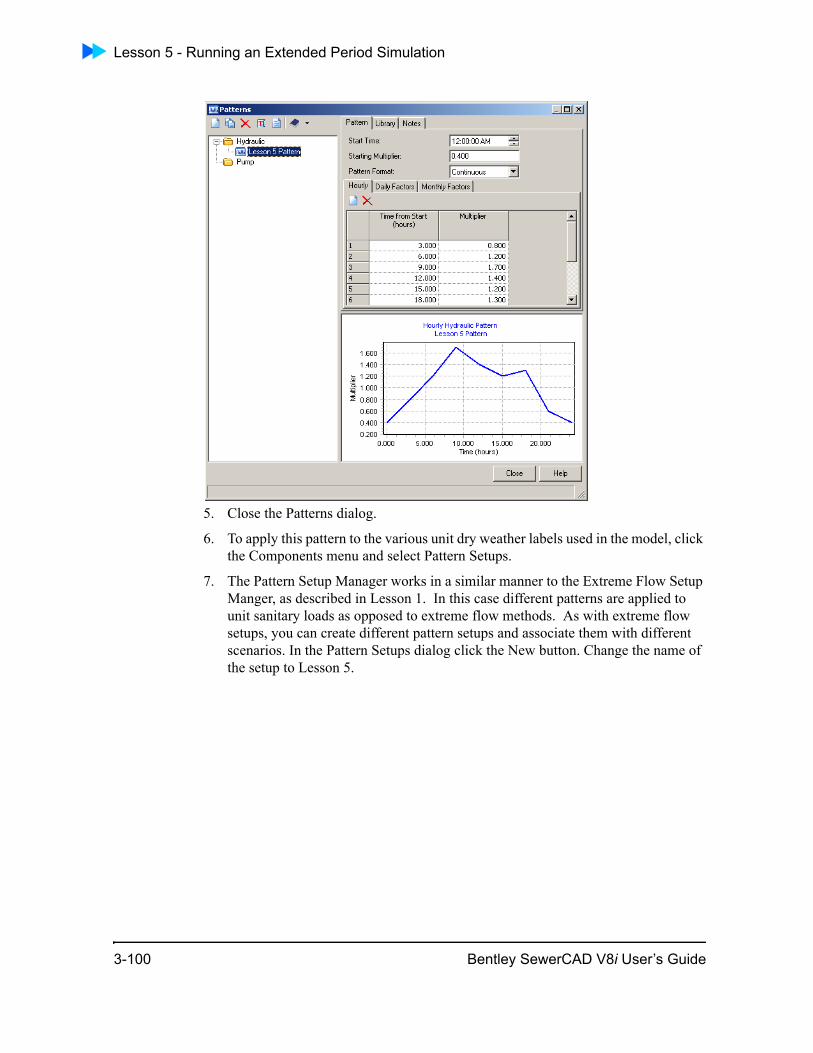
Lesson 5 - Running an Extended Period Simulation
5. Close the Patterns dialog.
6. To apply this pattern to the various unit dry weather labels used in the model, click the Components menu and select Pattern Setups.
7. The Pattern Setup Manager works in a similar manner to the Extreme Flow Setup Manger, as described in Lesson 1. In this case different patterns are applied to unit sanitary loads as opposed to extreme flow methods. As with extreme flow setups, you can create different pattern setups and associate them with different scenarios. In the Pattern Setups dialog click the New button. Change the name of the setup to Lesson 5.
3-100 Bentley SewerCAD V8i User’s Guide
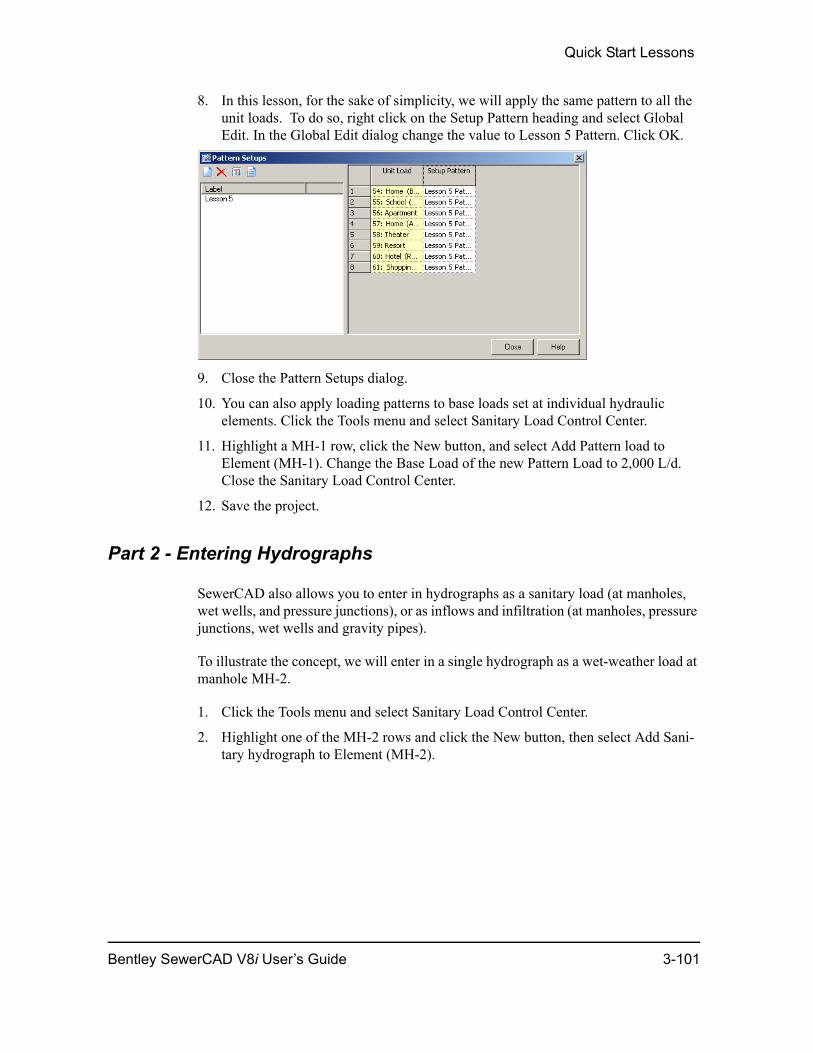
Quick Start Lessons
8. In this lesson, for the sake of simplicity, we will apply the same pattern to all the unit loads. To do so, right click on the Setup Pattern heading and select Global Edit. In the Global Edit dialog change the value to Lesson 5 Pattern. Click OK.
9. Close the Pattern Setups dialog.
10. You can also apply loading patterns to base loads set at individual hydraulic elements. Click the Tools menu and select Sanitary Load Control Center.
11. Highlight a MH-1 row, click the New button, and select Add Pattern load to Element (MH-1). Change the Base Load of the new Pattern Load to 2,000 L/d. Close the Sanitary Load Control Center.
12. Save the project.
Part 2 - Entering Hydrographs
SewerCAD also allows you to enter in hydrographs as a sanitary load (at manholes, wet wells, and pressure junctions), or as inflows and infiltration (at manholes, pressure junctions, wet wells and gravity pipes).
To illustrate the concept, we will enter in a single hydrograph as a wet-weather load at manhole MH-2.
1. Click the Tools menu and select Sanitary Load Control Center.
2. Highlight one of the MH-2 rows and click the New button, then select Add Sani-tary hydrograph to Element (MH-2).
Bentley SewerCAD V8i User’s Guide 3-101
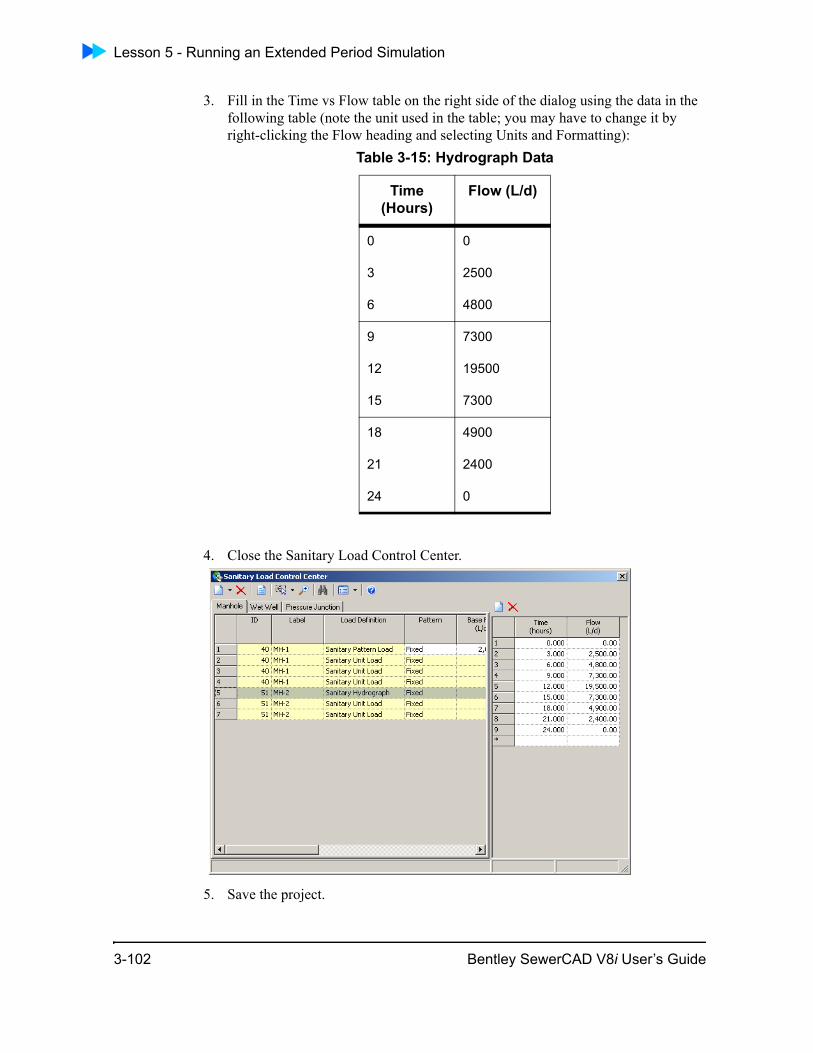
Lesson 5 - Running an Extended Period Simulation
3. Fill in the Time vs Flow table on the right side of the dialog using the data in the following table (note the unit used in the table; you may have to change it by right-clicking the Flow heading and selecting Units and Formatting):
4. Close the Sanitary Load Control Center.
5. Save the project.
Table 3-15: Hydrograph Data
Time (Hours)
Flow (L/d)
0 0
3 2500
6 4800
9 7300
12 19500
15 7300
18 4900
21 2400
24 0
3-102 Bentley SewerCAD V8i User’s Guide
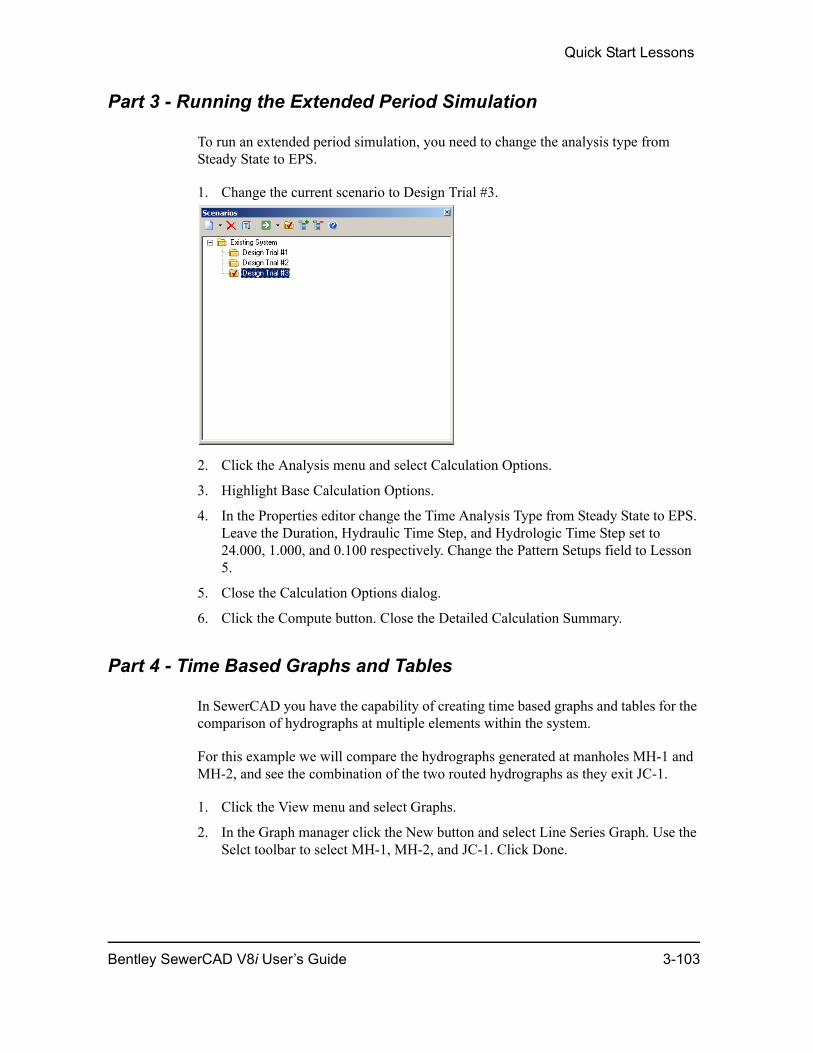
Quick Start Lessons
Part 3 - Running the Extended Period Simulation
To run an extended period simulation, you need to change the analysis type from Steady State to EPS.
1. Change the current scenario to Design Trial #3.
2. Click the Analysis menu and select Calculation Options.
3. Highlight Base Calculation Options.
4. In the Properties editor change the Time Analysis Type from Steady State to EPS. Leave the Duration, Hydraulic Time Step, and Hydrologic Time Step set to 24.000, 1.000, and 0.100 respectively. Change the Pattern Setups field to Lesson 5.
5. Close the Calculation Options dialog.
6. Click the Compute button. Close the Detailed Calculation Summary.
Part 4 - Time Based Graphs and Tables
In SewerCAD you have the capability of creating time based graphs and tables for the comparison of hydrographs at multiple elements within the system.
For this example we will compare the hydrographs generated at manholes MH-1 and MH-2, and see the combination of the two routed hydrographs as they exit JC-1.
1. Click the View menu and select Graphs.
2. In the Graph manager click the New button and select Line Series Graph. Use the Selct toolbar to select MH-1, MH-2, and JC-1. Click Done.
Bentley SewerCAD V8i User’s Guide 3-103
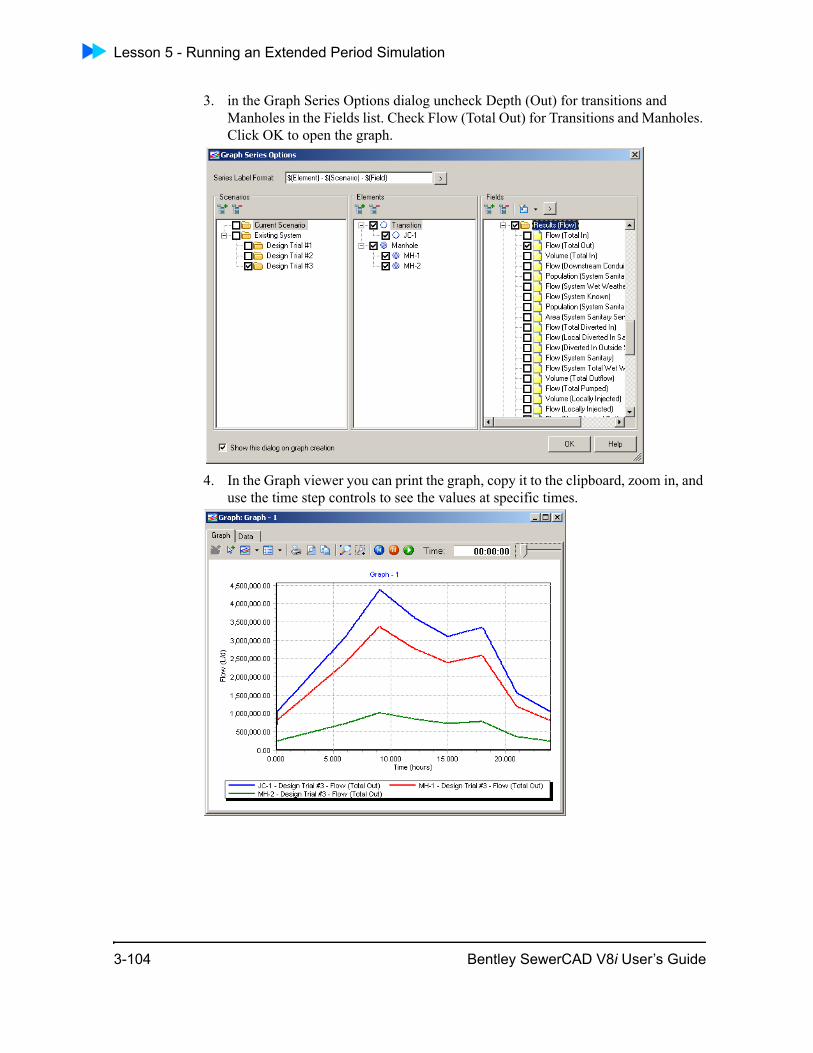
Lesson 5 - Running an Extended Period Simulation
3. in the Graph Series Options dialog uncheck Depth (Out) for transitions and Manholes in the Fields list. Check Flow (Total Out) for Transitions and Manholes. Click OK to open the graph.
4. In the Graph viewer you can print the graph, copy it to the clipboard, zoom in, and use the time step controls to see the values at specific times.
3-104 Bentley SewerCAD V8i User’s Guide
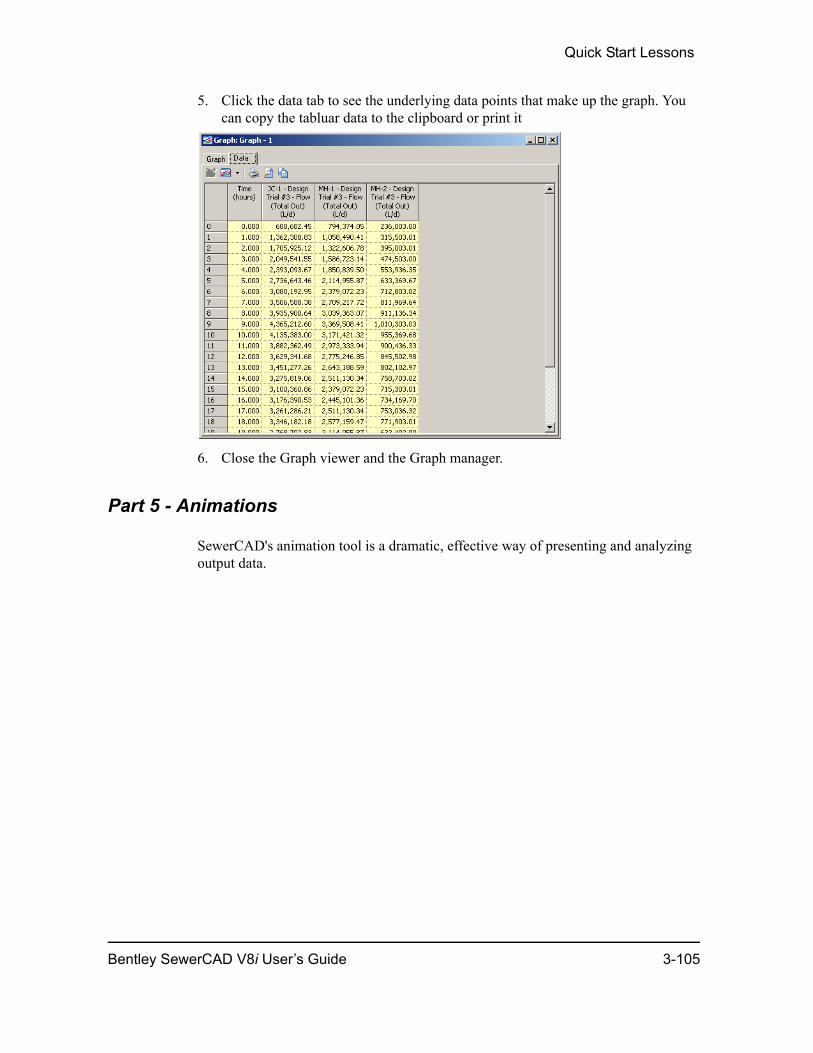
Quick Start Lessons
5. Click the data tab to see the underlying data points that make up the graph. You can copy the tabluar data to the clipboard or print it
6. Close the Graph viewer and the Graph manager.
Part 5 - Animations
SewerCAD's animation tool is a dramatic, effective way of presenting and analyzing output data.
Bentley SewerCAD V8i User’s Guide 3-105
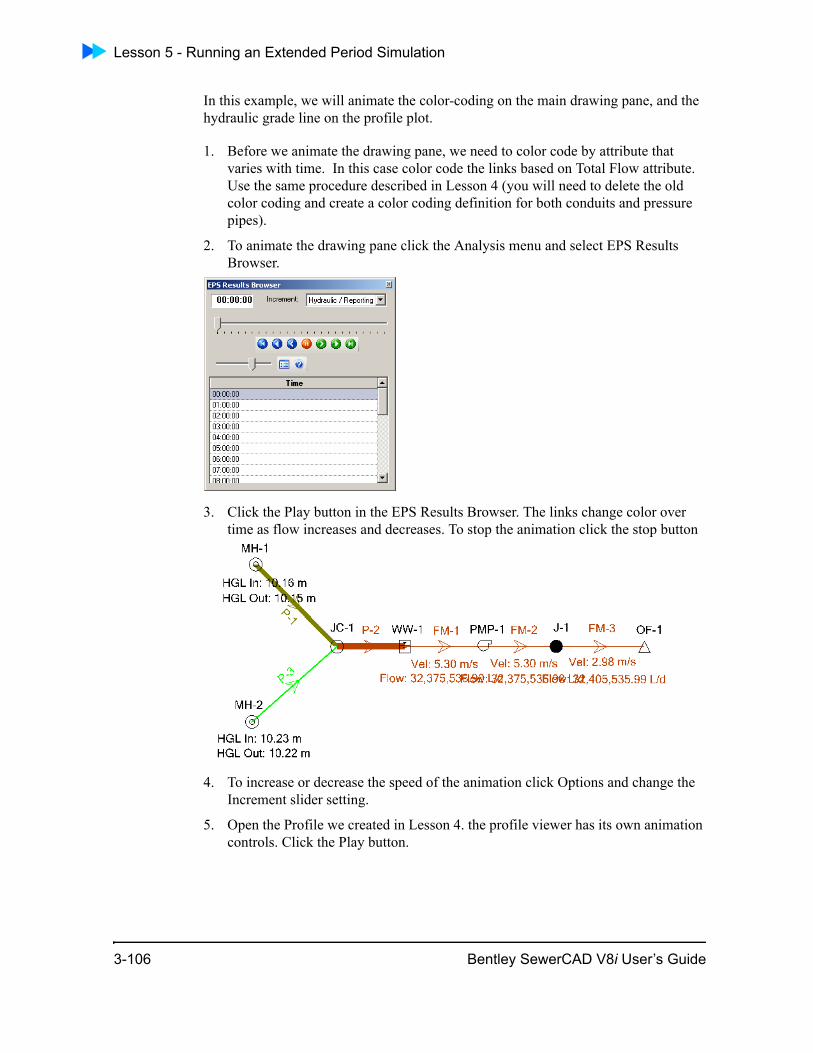
Lesson 5 - Running an Extended Period Simulation
In this example, we will animate the color-coding on the main drawing pane, and the hydraulic grade line on the profile plot.
1. Before we animate the drawing pane, we need to color code by attribute that varies with time. In this case color code the links based on Total Flow attribute. Use the same procedure described in Lesson 4 (you will need to delete the old color coding and create a color coding definition for both conduits and pressure pipes).
2. To animate the drawing pane click the Analysis menu and select EPS Results Browser.
3. Click the Play button in the EPS Results Browser. The links change color over time as flow increases and decreases. To stop the animation click the stop button
4. To increase or decrease the speed of the animation click Options and change the Increment slider setting.
5. Open the Profile we created in Lesson 4. the profile viewer has its own animation controls. Click the Play button.
3-106 Bentley SewerCAD V8i User’s Guide

Quick Start Lessons
From these five lessons, you have had a brief introduction to the capabilities of SewerCAD. Feel free to continue to play with the program. Use this model to explore and become familiar with all of the features. For additional help, click F1 to open the context sensitive online help.
Bentley SewerCAD V8i User’s Guide 3-107

Lesson 5 - Running an Extended Period Simulation
3-108 Bentley SewerCAD V8i User’s Guide
4
ChapterStarting a Project
Welcome Dialog BoxWhen you first start Bentley SewerCAD V8i, the Welcome dialog box appears. The Welcome dialog box contains the following controls:
You can access the Welcome dialog box at any time from the Help menu in Bentley SewerCAD V8i.
Quick Start Lessons Opens the online help to the Quick Start Lessons Overview topic.
Create New Project Creates a new Bentley SewerCAD V8i project. When you click this button, an untitled Bentley SewerCAD V8i project is created.
Open Existing Project Opens an existing project. When you click this button, the Windows Select Bentley SewerCAD V8i Project to Open dialog box appears, allowing you to browse to the project to be opened.
Open from ProjectWise
Open an existing Bentley SewerCAD V8i project from ProjectWise. You are prompted to log into a ProjectWise datasource if you are not already logged in.
Show This Dialog at Start
When selected, the Welcome dialog box appears whenever you start Bentley SewerCAD V8i. Clear this box if you do not want the Welcome dialog box to appear whenever you start Bentley SewerCAD V8i.
Bentley SewerCAD V8i User’s Guide 4-109
Projects
ProjectsAll data for a model are stored in Bentley SewerCAD V8i as a project. Bentley SewerCAD V8i project files have the file name extension .swc. Bentley SewerCAD V8i lets you open more than one project at a time. You can assign a title, date, notes and other identifying information about each project using the Project Properties dialog box. You can have up to five Bentley SewerCAD V8i projects open at one time.
Starting a New Project
To start a new project, select File > New or press Ctrl+N. An untitled project is opened in the drawing pane.
Opening an Existing Project
To open an existing project, select File > Open or press Ctrl+O. A dialog box appears allowing you to browse for the project you want to open.
Displaying Multiple Projects
To switch between multiple open projects, click the appropriate tab at the top of the drawing pane. The file name of the project is displayed on the tab.
Setting Project PropertiesThe Project Properties dialog box let you enter project-specific information to help identify the project. Project properties are stored with the project.
To set project properties:
Select File > Project Properties, enter information in the Project Properties dialog box and click OK.
Project Properties Dialog Box
The dialog box contains the following text fields and controls:
Title Lets you type a title for the project.
File Name Displays the file name for the current project. If you have not saved the project yet, the file name is listed as “Untitled.swc.”
Engineer Lets you type name of the project engineer.
4-110 Bentley SewerCAD V8i User’s Guide
Starting a Project
Setting OptionsYou can change global settings for Bentley SewerCAD V8i in the Options dialog box. The Options dialog box contains six tabs, each of which lets you change a different group of global settings.
Click one of the following links to learn more about the Options dialog box:
• “Options Dialog Box - Global Tab” on page 4-111
• “Options Dialog Box - Project Tab” on page 4-114
• “Options Dialog Box - Drawing Tab” on page 4-116
• “Options Dialog Box - Units Tab” on page 4-117
• “Options Dialog Box - Labeling Tab” on page 4-120
• “Options Dialog Box - ProjectWise Tab” on page 4-121
Options Dialog Box - Global Tab
The Global tab lets you change general program settings for the Bentley SewerCAD V8i stand-alone editor, including whether or not to display the status pane, as well as window color and layout settings.
Company Lets you type the name of your company.
Date Click this field to display a calendar, which lets you use your mouse to set a date for the project.
Notes Lets you type additional information about the project.
Bentley SewerCAD V8i User’s Guide 4-111
Setting Options
The Global tab contains the following controls:
General Settings
Backup Levels Indicates the number of backup copies that are retained when a project is saved. The default value is 1.
Note: The higher this number, the more .BAK files (backup files) are created, thereby using more hard disk space on your computer.
Show recently used files
The checkbox turns the list of recently opened files on and off. The File menu has the ability to display a list of recently opened files, providing shortcuts that let you quickly access projects. When this check box is cleared, these shortcuts are not available from the File menu. When the box is checked, you can specify a number of files between 1 and 15 to show by typing the number in the adjacent field.
Compact Database After
When selected, the Bentley SewerCAD V8i database is automatically compacted when you save a particular file the specified number of times.
Show Status Pane When selected, activates the Status Pane display at the bottom of the Bentley SewerCAD V8i stand-alone editor. This check box is selected by default.
Show Welcome Page on Startup
When selected, activates the Welcome dialog that appears when you first start Bentley SewerCAD V8i. This check box is selected by default.
Zoom Extents on Open
When this box is checked a Zoom Extents operation is performed upon file open, so that the entire network is displayed in the drawing pane.
4-112 Bentley SewerCAD V8i User’s Guide
Starting a Project
Use accelerated redraw
Some video cards use “triple buffering”, which we do not support at this time. If you see anomalies in the drawing (such as trails being left behind from the selection rectangle), then you can shut this option off to attempt to fix the problem. However, when this option is off, you could see some performance degradation in the drawing.
Window Color Settings
Background Color Displays the color that is currently assigned to the drawing pane background. You can change the color by clicking the ellipsis button (...) to open the Color dialog box.
Foreground Color Displays the color that is currently assigned to elements and labels in the drawing pane. You can change the color by clicking the ellipsis button (...) to open the Color dialog box.
Read Only Background Color
Displays the color that is currently assigned to data field backgrounds. You can change the color by clicking the ellipsis button (...) to open the Color dialog box.
Read Only Foreground Color
Displays the color that is currently assigned to data field text. You can change the color by clicking the ellipsis button (...) to open the Color dialog box.
Selection Displays the color that is currently assigned to elements that are selected in the drawing pane. You can change the color by clicking the ellipsis button (...) to open the Color dialog box.
Layout Settings
Display Inactive Topology
When selected, activates the display of inactive elements in the drawing pane in the color defined in the adjacent color box. When not selected, inactive elements will not be visible in the drawing pane. This check box is selected by default.
Bentley SewerCAD V8i User’s Guide 4-113

Setting Options
Options Dialog Box - Project Tab
Auto Refresh Activates Auto Refresh. When Auto-Refresh is active, the drawing pane automatically updates whenever changes are made to the Bentley SewerCAD V8i datastore. This check box is selected by default.
Sticky Tool Palette When selected, activates the Sticky Tools feature. When Sticky Tools is activated, the drawing pane cursor does not reset to the Select tool after you create a node or finish a pipe run in your model, allowing you to continue dropping new elements into the drawing without re-selecting the tool. When Sticky Tools is not activated, the drawing pane cursor resets to the Select tool after you create a node. This check box is selected by default.
Select Polygons by Edge
When selected, lets you select polygons in your model at their edges instead of anywhere inside the polygon. This check box is cleared by default.
Selection Handle Size In Pixels
Specifies, in pixels, the size of the handles that appear on selected elements. Enter a number from 1 to 10.
Selection Line Width Multiplier
Increases or decreases the size of pipes that are selected in the drawing view by the factor indicated. For example, a multiplier of 2 would result in the line width being doubled.
Default Drawing Style for New Projects
Choose the style in which elements are displayed in the drawing pane. Under GIS style, the size of element symbols in the drawing pane will remain the same regardless of zoom level. Under CAD style, element symbols will appear larger or smaller depending on zoom level.
Geospatial Settings
Spatial Reference Used for integration with Projectwise Geospatial. You can leave the field blank if there is no spatial information.
4-114 Bentley SewerCAD V8i User’s Guide
Starting a Project
Element Labeling Options
Element Identifier Format
Specifies the format in which reference fields are used. Reference fields are fields that link to another element or support object (pump definitions, patterns, controls, zones, etc.).
Result Files
Specify Custom Results File Path?
When checked, allows you to edit the results file path and format by enabling the other controls in this section.
Root Path Allows you to specify the root path where results files are stored. You can type the path manually or choose the path from a Browse dialog by clicking the ellipsis (...) button.
Path Format Allows you to specify the path format. You can type the path manually and use predefined attributes from the menu accessed with the [>] button..
Path Displays a dynamically updated view of the custom result file path based on the settings in the Root Path and Path Format fields.
Pipe Length
Round Pipe Length to Nearest
The program will round to the nearest unit specified in this field when calculating scaled pipe length
Calculate Pipe Lengths Using Node Elevations (3D Length)
When this box is checked, differences in Z (elevation) between nodes is considered when calculating conduit lengths.
Hydraulic Analysis
Friction Method Select the friction method that will be used for the gravity portion of the network during hydraulic analysis.
Bentley SewerCAD V8i User’s Guide 4-115
Setting Options
Options Dialog Box - Drawing Tab
This tab contains drawing layout and display settings. You can set the scale that you want to use as the finished drawing scale for the plan view output. Drawing scale is based upon engineering judgment and the destination sheet sizes to be used in the final presentation. The Drawing tab contains the following controls:
Pressure Friction Method
Select the friction method that will be used for the pressure portion of the network during hydraulic analysis.
Conduit Description Options
Conduit Shape Select the conduit shape you wish to modify in the Conduit Description Format field.
Conduit Description Format
This field displays the format of the conduit description for the conduit shape currently selected in the Conduit Shape list. The arrow button next to this field provides access to the preformatted variables available for the associated conduit shape.
The text box below this control displays the conduit description format string in a localized format, primarily for non-English versions of the software.
Drawing Scale Settings
Drawing Mode Drop-down list that lets you select either Scaled or Schematic mode for models in the drawing pane.
Plot Scale Factor 1 in. =:
Controls the scale of the plan view. This value affects the text height when printing-to-scale and does not affect the scaled length or area results.
Annotation Multipliers Settings
4-116 Bentley SewerCAD V8i User’s Guide
Starting a Project
Options Dialog Box - Units Tab
The Units tab lets you modify the unit settings for the current project. The Units tab contains the following controls:
Symbol Size Mulitplier Increases or decreases the size of your symbols by the factor indicated. For example, a multiplier of 2 would result in the symbol size being doubled. The program selects a default symbol height that corresponds to 4.0 ft. (approximately 1.2 m) in actual-world units, regardless of scale.
Text Height Multiplier Increases or decreases the default size of the text associated with element labeling by the factor indicated. The program automatically selects a default text height that displays at approximately 2.5 mm (0.1 in) high at the user-defined drawing scale. A scale of 1.0 mm = 0.5 m, for example, results in a text height of approximately 1.25 m. Likewise, a 1 in. = 40 ft. scale equates to a text height of around 4.0 ft.
Text Options
Align Text with Pipes Turns text alignment on and off. When this check box is selected, labels are aligned to their associated pipes. When the check box is cleared, labels are displayed horizontally near the center of the associated pipe.
Color Element Annotations
When this box is checked, color coding settings are applied to the element annotation.
Save As Lets you save the current unit settings as a separate .xml file. This file allows you to reuse your Units settings in another project. When the button is clicked, a Windows Save As dialog box appears, allowing you to enter a name and specify the directory location of the .xml file.
Bentley SewerCAD V8i User’s Guide 4-117

Setting Options
Load Lets you load a previously created Units project .xml file, thereby transferring the unit and format settings that were defined in the previous project. When the button is clicked, a Windows Load dialog box appears, allowing you to browse to the location of the desired .xml file.
Reset Defaults - SI Resets the unit and formatting settings to the original factory defaults for the System International (Metric) system.
Reset Defaults - US Resets the unit and formatting settings to the original factory defaults for the Imperial (U.S.) system.
Default Unit System for New Project
Lets you specify the unit system that is used globally across the project. Note that you can locally change any number of attributes to use system other than the one specified here.
4-118 Bentley SewerCAD V8i User’s Guide
Starting a Project
Units Table The units table contains the following columns:
• Label—Displays the parameter measured by the unit.
• Unit—Displays the type of measurement. To change the unit of an attribute type, click the choice list and click the unit you want. This option also allows you to use both U.S. customary and SI units in the same worksheet.
• Display Precision—Sets the rounding of numbers and number of digits displayed after the decimal point. Enter a negative number for rounding to the nearest power of 10: (-1) rounds to 10, (-2) rounds to 100, (-3) rounds to 1000, and so on. Enter a number from 0 to 15 to indicate the number of digits after the decimal point.
• Format Menu—Lets you select the display format used by the current field. Choices include:
• Scientific—Converts the entered value to a string of the form "-d.ddd...E+ddd" or "-d.ddd...e+ddd", where each 'd' indicates a digit (0-9). The string starts with a minus sign if the number is negative.
• Fixed Point—Abides by the display precision setting, and automatically enters zeros after the decimal place to do so. With a display precision of 3, an entered value of 3.5 displays as 3.500.
• General—Truncates any zeros after the decimal point, regardless of the display preci-sion value. With a display precision of 3, the value that would appear as 5.200 in Fixed Point format displays as 5.2 when using General format. The number is also rounded. So, an entered value of 5.35 displays as 5.4, regardless of the display precision.
• Number—Converts the entered value to a string of the form "-d,ddd,ddd.ddd...", where each 'd' indicates a digit (0-9). The string starts with a minus sign if the number is nega-tive. Thousand separators are inserted between each group of three digits to the left of the decimal point.
Bentley SewerCAD V8i User’s Guide 4-119
Setting Options
Options Dialog Box - Labeling Tab
The Element Labeling tab is used to specify the automatic numbering format of new elements as they are added to the network. You can save your settings to an .xml file for later use. The Element Labeling tab contains the following controls:
Save As Lets you save your element labeling settings to an element label project file, which is an. xml file.
Load Lets you open an existing element label project file.
Reset Fills in the Next column for each element based on the labels already used in the model and the increment value that has been set. So, for example, if the model contains conduits CO-1, CO-2, and CO-3 and the Increment value is 1, clicking Reset will fill in the Next column with CO-4 for the Conduit row.
4-120 Bentley SewerCAD V8i User’s Guide
Starting a Project
Options Dialog Box - ProjectWise Tab
Note: These settings affect ProjectWise users only.
The ProjectWise tab contains options for using SewerCAD V8i with ProjectWise.
Labeling Table The labeling table contains the following columns:
• Element—Shows the type of element to which the label applies.
• On—Lets you turn automatic element labeling on and off for the associated element type.
• Next—Lets you enter the integer you want to use as the starting value for the ID number portion of the label. Bentley SewerCAD V8i generates labels beginning with this number and chooses the first available unique label.
• Increment—Lets you enter the integer that is added to the ID number after each element is created to yield the number for the next element.
• Prefix—Lets you enter the letters or numbers that appear in front of the ID number for the elements in your network.
• Digits—Lets you enter the minimum number of digits that the ID number has. For instance, 1, 10, and 100 with a digit setting of two would be 01, 10, and 100.
• Suffix—Lets you enter the letters or numbers that appear after the ID number for the elements in your network.
• Preview—Lets you see what the label looks like, based on the information you have entered in the previous fields.
Bentley SewerCAD V8i User’s Guide 4-121
Setting Options
This tab contains the following controls:
For more information about using SewerCAD V8i with ProjectWise, see “Consider-ations for ProjectWise Users” on page 4-123.
Default Datasource Displays the current ProjectWise datasource. If you have not yet logged into a datasource, this field will display <login>. To change the datasource, click the Ellipses (...) button to open the Change Datasource dialog box. If you click Cancel after you have changed the default datasource, the new default datasource is retained.
Update Server When Saving
When this is checked, any time you save your SewerCAD V8i project locally using the File > Save menu command, the files on your ProjectWise server will also be updated and all changes to the files will immediately become visible to other ProjectWise users. This option is turned off by default.
Note: This option, when turned on, can significantly affect performance, especially for large, complex projects.
4-122 Bentley SewerCAD V8i User’s Guide

Starting a Project
Considerations for ProjectWise UsersBentley ProjectWise provides managed access to SewerCAD V8i content within a workgroup, across a distributed organization, or among collaborating professionals. When ProjectWise is integrated with SewerCAD V8i, project files can be accessed quickly, checked out for use, and checked back in directly from within SewerCAD V8i.
If ProjectWise is installed on your system, SewerCAD V8i automatically installs all the components necessary for you to use ProjectWise to store and share your SewerCAD V8i projects.
To learn more about ProjectWise, refer to the ProjectWise online help. To learn more about using ProjectWise with SewerCAD V8i, see the following topics:
• “General Guidelines for using ProjectWise” on page 4-123
• “Performing ProjectWise Operations” on page 4-124
General Guidelines for using ProjectWise
Follow these guidelines when using SewerCAD V8i with ProjectWise:
• Use the File > ProjectWise commands to perform ProjectWise file operations, such as Save, Open, and Change Datasource.
• The first time you choose one of the File > ProjectWise menu commands in your current SewerCAD V8i session, you are prompted to log into a ProjectWise data-source. The datasource you log into remains the current datasource until you change it using the File > ProjectWise > Change Datasource command.
• Use SewerCAD V8i’s File > New command to create a new project. The project is not stored in ProjectWise until you select File > ProjectWise > Save As.
• Use SewerCAD V8i’s File > Open command to open a local copy of the current project.
• Use SewerCAD V8i’s File > Save command to save a copy of the current project to your local computer.
• When you Close a project already stored in ProjectWise using File > Close, you are prompted to select one of the following options:
– Check In—Updates the project in ProjectWise with your latest changes and unlocks the project so other ProjectWise users can edit it.
– Unlock—Unlocks the project so other ProjectWise users can edit it but does not update the project in ProjectWise. Note that this will abandon any changes you have made since the last server update.
Bentley SewerCAD V8i User’s Guide 4-123
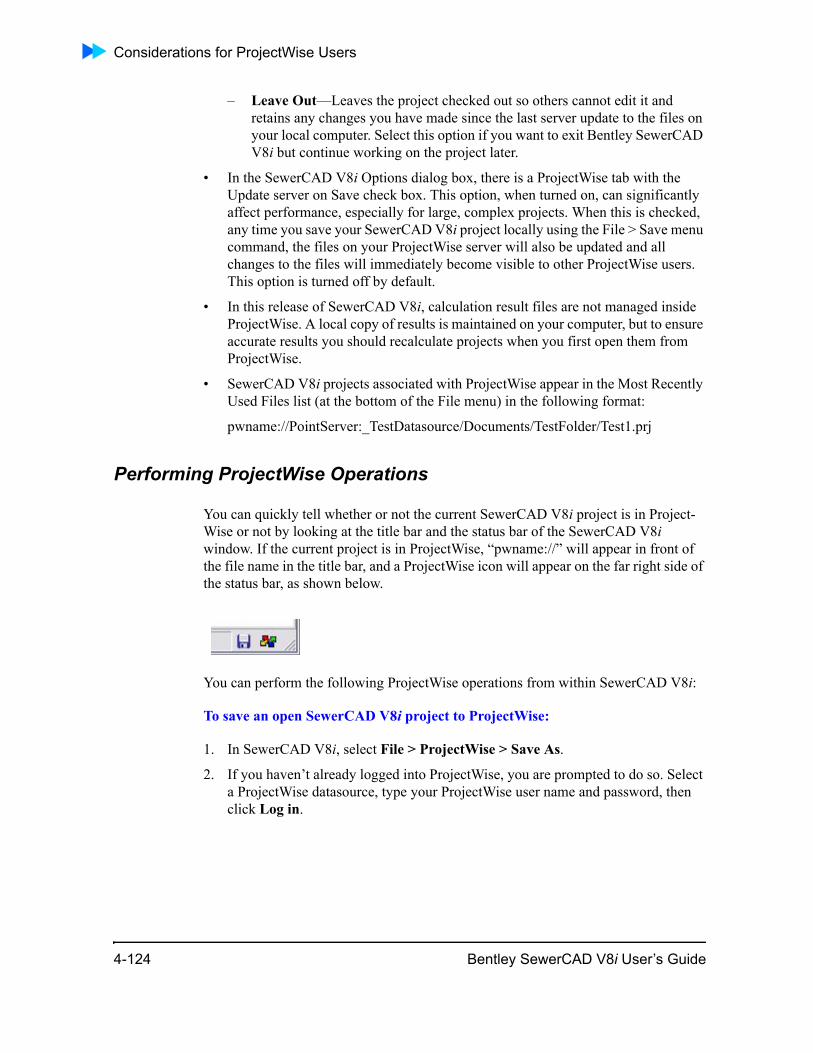
Considerations for ProjectWise Users
– Leave Out—Leaves the project checked out so others cannot edit it and retains any changes you have made since the last server update to the files on your local computer. Select this option if you want to exit Bentley SewerCAD V8i but continue working on the project later.
• In the SewerCAD V8i Options dialog box, there is a ProjectWise tab with the Update server on Save check box. This option, when turned on, can significantly affect performance, especially for large, complex projects. When this is checked, any time you save your SewerCAD V8i project locally using the File > Save menu command, the files on your ProjectWise server will also be updated and all changes to the files will immediately become visible to other ProjectWise users. This option is turned off by default.
• In this release of SewerCAD V8i, calculation result files are not managed inside ProjectWise. A local copy of results is maintained on your computer, but to ensure accurate results you should recalculate projects when you first open them from ProjectWise.
• SewerCAD V8i projects associated with ProjectWise appear in the Most Recently Used Files list (at the bottom of the File menu) in the following format:
pwname://PointServer:_TestDatasource/Documents/TestFolder/Test1.prj
Performing ProjectWise Operations
You can quickly tell whether or not the current SewerCAD V8i project is in Project-Wise or not by looking at the title bar and the status bar of the SewerCAD V8i window. If the current project is in ProjectWise, “pwname://” will appear in front of the file name in the title bar, and a ProjectWise icon will appear on the far right side of the status bar, as shown below.
You can perform the following ProjectWise operations from within SewerCAD V8i:
To save an open SewerCAD V8i project to ProjectWise:
1. In SewerCAD V8i, select File > ProjectWise > Save As.
2. If you haven’t already logged into ProjectWise, you are prompted to do so. Select a ProjectWise datasource, type your ProjectWise user name and password, then click Log in.
4-124 Bentley SewerCAD V8i User’s Guide
Starting a Project
3. In the ProjectWise Save Document dialog box, enter the following information:
a. Click Change next to the Folder field, then select a folder in the current ProjectWise datasource in which to store your project.
b. Type the name of your SewerCAD V8i project in the Name field. We recom-mend that you keep the ProjectWise name the same as or as close to the SewerCAD V8i project name as possible.
c. Keep the default entries for the rest of the fields in the dialog box
d. Click OK.
To open a SewerCAD V8i project from a ProjectWise datasource:
1. Select File > ProjectWise > Open.
2. If you haven’t already logged into ProjectWise, you are prompted to do so. Select a ProjectWise datasource, type your ProjectWise user name and password, then click Log in.
3. In the ProjectWise Select Document dialog box, perform these steps:
a. From the Folder drop-down menu, select a folder that contains SewerCAD V8i projects.
b. In the Document list box, select a SewerCAD V8i project.
c. Keep the default entries for the rest of the fields in the dialog box
d. Click Open.
To copy an open SewerCAD V8i project from one ProjectWise datasource to another:
1. Select File > ProjectWise > Open to open a project stored in ProjectWise.
2. Select File > ProjectWise > Change Datasource.
3. In the ProjectWise Log in dialog box, select a different ProjectWise datasource, then click Log in.
4. Select File > ProjectWise > Save As.
5. In the ProjectWise Save Document dialog box, change information about the project as required, then click OK.
To make a local copy of a SewerCAD V8i project stored in a ProjectWise data-source:
1. Select File > ProjectWise > Open.
2. If you haven’t already logged into ProjectWise, you are prompted to do so. Select a ProjectWise datasource, type your ProjectWise user name and password, then click Log in.
Bentley SewerCAD V8i User’s Guide 4-125

Considerations for ProjectWise Users
3. Select File > Save As.
4. Save the SewerCAD V8i project to a folder on your local computer.
To change the default ProjectWise datasource:
1. Start SewerCAD V8i.
2. Select File > ProjectWise > Change Datasource.
3. In the ProjectWise Log in dialog box, type the name of ProjectWise datasource you want to log into, then click Log in.
To use background layer files with ProjectWise:
• Using File > ProjectWise > Save As—If there are background files, you are prompted with two options: you can copy the background layer files to the project folder for use by the project, or you can remove the background references and manually reassign them once the project is in ProjectWise to other existing ProjectWise documents.
• Using File > ProjectWise > Open—This works the same as the normal Project-Wise > Open command, except that background layer files are not locked in ProjectWise for the current user to edit. The files are intended to be shared with other users at the same time.
• To add a background layer file reference to a project that exists in Project Wise—The ProjectWise Select Document dialog box opens, and you can choose any existing ProjectWise document. You must have previously added these back-ground layer files as described in the first bullet above, or by using the Project-Wise Explorer.
• When you remove a background layer file reference from a project that exists in ProjectWise, the reference to the file is removed but the file itself is not deleted from ProjectWise.
• Using File > Save As—When you use File > Save As on a project that is already in ProjectWise and there are background layer files, you are prompted with two options: you can copy all the files to the local project folder for use by the project, or you can remove the background references and manually reassign them after you have saved the project locally.
Using ProjectWise with Bentley SewerCAD V8i for AutoCAD
Bentley SewerCAD V8i for AutoCAD maintains a one to one relationship between the AutoCAD drawing (.dwg) and the Bentley SewerCAD V8i project file. When using ProjectWise with this data, we recommend that you create a Set in the Project-Wise Explorer. Included in this set should be the AutoCAD drawing (example.dwg), the Bentley SewerCAD V8i database (example.swc.mdb), the Bentley SewerCAD V8i project file (example.swc), and optionally for stand-alone, the stand-alone drawing setting file (example.swc.dwh).
4-126 Bentley SewerCAD V8i User’s Guide

Starting a Project
If you use the Set and the ProjectWise Explorer for all of your check-in / check-out procedures, you will maintain the integrity of this relationship. We recommended that you do not use the default ProjectWise integration in AutoCAD, as this will only work with the .dwg file.
Using ProjectWise with Bentley SewerCAD V8i for MicroStation
When using ProjectWise with a MicroStation SewerCAD V8i project, we recommend that you create a Set in the ProjectWise Explorer. Included in this set should be the MicroStation drawing (example.dgn), the Bentley SewerCAD V8i database (example.swc.mdb), the Bentley SewerCAD V8i project file (example.swc), and optionally for stand-alone, the stand-alone drawing setting file (example.swc.dwh).
If you use the Set and the ProjectWise Explorer for all of your check-in / check-out procedures, you will maintain the integrity of this relationship. We recommended that you do not use the default ProjectWise integration in AutoCAD, as this will only work with the .dgn file.
Importing Data From Other ModelsBentley SewerCAD V8i lets you import data from a variety of data sources, including Bentley SewerCAD V8i, LandXML, SewerCAD, and StormCAD.
Bentley SewerCAD V8i lets you import data from EPA SWMM, CivilStorm, and StormCAD.
Click one of the following links to learn more:
• “Importing Data from a SewerCAD V8 Database” on page 4-128
• “Importing a Submodel” on page 4-128
• “Importing from LandXML” on page 4-129
• “Importing StormCAD V8” on page 4-130
• “Importing from SewerGEMS V8” on page 4-131
Bentley SewerCAD V8i User’s Guide 4-127
Importing Data From Other Models
Importing Data from a SewerCAD V8 Database
You can import data from another SewerCAD V8i project by importing the SewerCAD V8i database (.MDB) file. You might want to do this if you need to rebuild your model, or if you want to open a SewerCAD V8i project sent to you by another SewerCAD V8i user.
When you import a SewerCAD V8i database (.MDB) file, the model will notice that the model does not have any element symbology definitions (annotations and color-coding), project-level options, text customizations, or border and line customizations that may have been associated with the project. These are stored in the project’s .swc and .DWH files, which are not imported.
Note: SewerCAD V8i can only import SewerCAD V8i databases created in SewerCAD V8i version 8.9.20.9 or later. If the database you want to import was created in an older version, you will need to open the file in a newer version of SewerCAD V8i before the import into SewerCAD V8i will work.
To import data from a SewerCAD V8i project:
1. Select File > Import > SewerCAD V8i Database.
2. In the Select Database File to Import dialog box, select the SewerCAD V8i .mdb file (database file). The data will display as a new project in SewerCAD V8i.
Importing a Submodel
Using the Submodel Import feature, you can import another model, or any portion thereof, into your project. Input data stored in the Alternatives as well as any supporting data (i.e. Patterns, etc) will also be imported. It is important to notice that existing elements in the model you want to import the submodel into (i.e. the target model) will be matched with incoming elements by using their label. Incoming input data will override existing data in the target model for any element matched by its label. That also applies to scenarios, alternatives, calculation options and supporting data. Furthermore, any element in the incoming submodel that could not be matched with any existing element by their label, will be created in the target model.
For example, the submodel you want to import contains input data that you would like to transfer in two Physical Alternatives named "Smaller Conduits" and "Larger Conduits". The target model contains only one Physical Alternative named "Larger Conduits". In that case, the input data in the alternative labeled "Larger Conduits" in the submodel will replace the alternative with the same name in the target model. Moreover, the alternative labeled "Smaller Conduits" as well as its input data will be
4-128 Bentley SewerCAD V8i User’s Guide

Starting a Project
added to the target model without replacing any existing data on it because there is no existing alternative with the same label. Notice that imported elements will be assigned default values in those existing alternatives in the target model that could not be matched.
Notice that regular models can be imported as a submodel of a larger model as their file format and extension are the same.
For more information about input data transfer, see Exporting a Submodel.
The label-matching strategy used during submodel import will be applied to any set of alternatives, including Active Topology alternatives. Therefore, if no Active Topology alternative stored in the submodel matches the existing ones in the target model, the imported elements will preserve their active topology values in the alternatives created from the submodel, but they will be left as "Inactive" in those previously existing alternatives in the target model. That is because the default value for the "Is Active" attribute in active topology alternatives other than the one that is current is "False".
Note: User-defined data is not transferred during submodel import and export operations.
To import a submodel
1. Click the File menu and select Import...Submodel.
2. In the Select Submodel File to Import dialog box, select the submodel file to be imported. Click the Open button.
Importing from LandXML
You can import a model from a LandXML format .xml file. LandXML is a non-proprietary data standard for the persistence of civil engineering and survey measure-ment data commonly used in the Land Development and Transportation Industries.
SewerCAD V8i utilizes the PipeNetworks functionality of the LandXML file. SewerCAD V8i is primarily concerned with the overall physical structure and connec-tivity of the pipe network; hence some of the available hydrologic and hydraulic data necessary for a hydraulic analysis is not transferred during export/import.
To import a LandXML .xml file:
1. Select File > Import > LandXML.
2. In the Select LandXML File to Import dialog, browse to the LandXML file to be imported, highlight it, and click Open.
Bentley SewerCAD V8i User’s Guide 4-129
Importing Data From Other Models
Importing StormCAD V8
You can import a model created in StormCAD V8 into SewerCAD V8i. Note that, unlike the StormCAD Exchange Database import, the StormCAD V8 import does not require you to create an exchange database file in StormCAD first - SewerCAD V8i handles the StormCAD V8 edition model files natively.
After importing the StormCAD model database, the model will notice that the model does not have any element symbology definitions (annotations and color-coding), project-level options, text customizations, or border and line customizations that may have been associated with the project. These are stored in the project's .swc and .dwh files, which are not imported.
Because of differences between StormCAD and SewerGEMS, some data will either not be imported or will be imported using near-equivalent substitutes, including the following:
• Only Mannings roughness values will be imported.
• AASHTO and Headloss Flow Curves from StormCAD will not be imported into SewerCAD V8i.
• Catalog Inlets and Percent Capacity Inlets' are converted to Inflow-Capture curves.
• For StormCAD gutters, SewerCAD V8i will set the shape as trapezoidal, set the appropriate side slopes, leave the bottom width = 0 and set an appropriate Manning's N. The depth value must be entered by the user. Additionally, gutters are set to inactive automatically upon import. You will need to make the gutters active and fill in missing data before the gutter can be included in the calculations.
When a StormCAD model is imported, an Inlet Flow Settings dialog will appear. The data entered here is required to define the inlet flow-capture curves. The two pieces of data required in this dialog are as follows:
• Flow Increment: The flow increment value should be a value that will give the flow-capture curves satisfactory resolution.
• Maximum Flow: The value entered here should exceed the highest flow expected at any inlet.
4-130 Bentley SewerCAD V8i User’s Guide
Starting a Project
Note: The flow-capture curves are only for on-grade inlets Sag inlets are set to "full capture".
To import a StormCAD V8 model
1. Click the File menu and select Import > StormCAD V8.
2. In the Select Database File to Import dialog, browse to the stc.mdb file for the StormCAD model you are importing. Highlight the file and click the Open button.
3. In the Inlet Flow Settings dialog, enter vlaues for the Flow Increment and Maximum Flow, then click OK.
Importing from SewerGEMS V8
You can import a SewerGEMS V8 model database (swg.mdb) file. Please note the following:
• Pumps: When importing a SewerGEMs pump into SewerCAD, each component of the SewerGEMs pump collection is turned into a SewerCAD pump, with appropriate connectivity. The on and off elevations of the SewerGEMs pump are translated into two controls (pump on if node x HGL is greater than y, etc…) on the SewerCAD side.
SewerGEMs supports two pump definition types that are not supported by SewerCAD, Volume-Flow and Depth Flow. This data will be imported but you will have to either change these pump definitions to a supported type, or change the references to these pump definitions to ones of a supported type for the model to calculate.
• Control Structures: SewerCAD does not support control structures on conduits like SewerGEMS. This information is lost on import. You can approximate control structures in SewerCAD by using diversions and creating an appropriate rating curve which describes the relationship between inflow and flow diverted.
To import a SewerGEMS V8 model
1. Click the File menu and select Import > SewerGEMS V8.
2. In the Select Database File to Import dialog, browse to the swc.mdb file for the SewerGEMS model you are importing. Highlight the file and click the Open button.
Bentley SewerCAD V8i User’s Guide 4-131
Exporting Data
Exporting DataYou can export your SewerCAD V8i data as a submodel, export to LandXML, or export the graphical representation of your model as a .DXF file.
Click one of the following links to learn more:
• “Exporting a .DXF File” on page 4-132
• “Exporting a Submodel” on page 4-132
• “Exporting to LandXML” on page 4-133
Exporting a .DXF File
You can export your SewerCAD V8i model as a .DXF file if you plan to edit the file in AutoCAD or another program. When you export a .DXF file, you export only the graphical (vector) representation of the model. The DXF file is an ASCII file.
To export the current project to a .DXF file:
1. Select File > Export > DXF.
2. Type the name of the DXF file, then click Save.
You may now open the DXF file in another program.
Exporting a Submodel
You can export any portion of a model as a submodel for import into other projects. Input data is also stored in the file that is created in the process of Exporting a Submodel. This input data will be imported following a label-matching strategy for any element, alternative, scenario, calculation option or supporting data in the submodel. For more information about input data transfer, see Importing Submodels.
User-defined data is not transferred during submodel import and export operations.
To export a submodel
1. In the drawing view, highlight the elements to be exported as a submodel. To highlight multiple elements, hold down the Shift key while clicking elements.
2. Click the File menu and select Export...Submodel.
3. In the Select Submodel File to Export dialog box, specify the directory to which the file should be saved, enter a name for the submodel and click the Save button.
4-132 Bentley SewerCAD V8i User’s Guide

Starting a Project
Exporting to LandXML
You can export a model to LandXML format. See “Importing from LandXML” on page 4-129 for information about the data that will be exported.
To export the current project to a LandXML .xml file:
1. Select File > Export > LandXML.
2. Type the name of the xml file , then click Save.
You may now open the .xml file in another program.
Bentley SewerCAD V8i User’s Guide 4-133

Exporting Data
4-134 Bentley SewerCAD V8i User’s Guide
5
ChapterUsing Modelbuilder
ModelBuilder lets you use your existing GIS asset to construct a new SewerCAD V8i model or update an existing SewerCAD V8i model. ModelBuilder supports a wide variety of data formats, from simple databases (such as Access and DBase), spread-sheets (such as Excel or Lotus), GIS data (such as shape files), to high end data stores (such as Oracle, and SQL Server), and more.
Using ModelBuilder, you map the tables and fields contained within your data source to element types and attributes in your SewerCAD V8i model. The result is that a SewerCAD V8i model is created. ModelBuilder can be used in any of the Bentley SewerCAD V8i platforms - Stand-Alone, MicroStation mode, or AutoCAD mode.
Note: ModelBuilder lets you bring a wide range of data into your model. However, some data is better suited to the use of the more specialized SewerCAD V8i modules. For instance, LoadBuilder offers many powerful options for incorporating loading data into your model.
ModelBuilder is the first tool you will use when constructing a model from GIS data. The steps that you take at the outset will impact how the rest of the process goes. Take the time now to ensure that this process goes as smoothly and efficiently as possible:
• “Preparing to Use ModelBuilder” on page 5-135
• “Reviewing Your Results” on page 5-146
Preparing to Use ModelBuilder• Determine the purpose of your model—Once you establish the purpose of your
model, you can start to make decisions about how detailed the model should be.
Bentley SewerCAD V8i User’s Guide 5-135
Preparing to Use ModelBuilder
• Get familiar with your data—ModelBuilder supports several data source types, including tabular and geometric. Tabular data sources include spreadsheets, data-bases, and other data sources without geometric information. Some supported tabular data source types include Microsoft Excel and Microsoft Access. Geometric data sources, while also internally organized by tables, include geometric characteristics such as shape type, size, and location. Some supported geometric data source types include the major CAD and GIS file types
If you obtained your model data from an outside source, you should take the time to get acquainted with it in its native platform. For example, review spatial and attribute data directly in your GIS environment. Do the nodes have coordinate information, and do the pipes have start and stop nodes specified? If not, the best method of specifying network connectivity must be determined.
Contact those involved in the development of the GIS to learn more about the GIS tables and associated attributes. Find out the purpose of any fields that may be of interest, ensure that data is of an acceptable accuracy, and determine units associ-ated with fields containing numeric data.
Ideally, there will be one source data table for each SewerCAD V8i element type. This isn’t always the case, and there are two other possible scenarios:
Many tables for one element type—In this case, there may be several tables in the datasource corresponding to a single GEMS modeling element, component, or collection. In this case each data source table must be individually mapped to the SewerCAD V8i table type, or the tables must be combined into a single table from within its native platform before running ModelBuilder.
One table containing many element types—In this case, there may be entries that correspond to several SewerCAD V8i table types in one datasource table. You should separate these into individual tables before running ModelBuilder.
• Preparing your data—When using ModelBuilder to get data from your data source into your model, you will be associating rows in your data source to elements in SewerCAD V8i. Your data source needs to contain a Key/Label field that can be used to uniquely identify every element in your model. The data source tables should have identifying column labels, or ModelBuilder will inter-pret the first row of data in the table as the column labels. Be sure data is in a format suited for use in ModelBuilder. Note that while ModelBuilder allows duplicate labels, they may cause ModelBuilder to give unexpected results when two elements of the same type have the same label. Where applicable, use powerful GIS and Database tools to perform Database Joins, Spatial Joins, and Update Joins to get data into the appropriate table, and in the desired format.
5-136 Bentley SewerCAD V8i User’s Guide
Using Modelbuilder
Note: When working with ID fields, the expected model input is the SewerCAD V8i ID. After creating these items in your SewerCAD V8i model, you can obtain the assigned ID values directly from your SewerCAD V8i modeling file. Before synchronizing your model, get these SewerCAD V8i IDs into your data source table (e.g., by performing a database join).
• Preparing your CAD Data—In previous versions of SewerCAD V8i, the Poly-line-to-Pipe feature was was used to import CAD data into a SewerCAD V8i model. In v8, CAD data is imported using ModelBuilder. When using Model-Builder to import data from your CAD file into your model, you will be associ-ating cells in your CAD drawing with elements in SewerCAD V8i.
Different CAD cells will be recognized as different element types and presented as tables existing in your CAD data source. It is recommended that you natively export your AutoCAD .dwg or Microstation .dgn files first as a .dxf file, then select this .dxf as the data source in ModelBuilder. Your data source will most likely not contain a Key/Label field that can be used to uniquely identify every element in your model, so ModelBuilder will automatically generate one for you using the default "<label>". This "<label>" field is a combination of an element's cell type label, its shape type, and a numeric ID that represents the order in which it was created.
• Build first, Synchronize later—ModelBuilder allows you to construct a new model or synchronize to an existing model. This gives you the ability to develop your model in multiple passes. On the first pass, use a simple connection to build your model. Then, on a subsequent pass, use a connection to load additional data into your model, such as supporting pattern or collection data.
Note: Upon completion of your ModelBuilder run, it is suggested you use the Network Navigator to identify any connectivity or topological problems in your new model. For instance, Pipe Split Candidates can be identified and then automatically modified with the Batch Split Pipe Tool (see “Batch Pipe Split Dialog Box” on page 4-262). See “Using the Network Navigator” on page 4-278 for more information.
• Going Beyond ModelBuilder—Keep in mind that there are additional ways to get data into your model. ModelBuilder can import loads if you have already assigned a load to each node. If, however, this information is not available from the GIS data, or if your loading data is in a format unrecognized by ModelBuilder (meter data, etc.), use LoadBuilder; this module is a specialized tool for getting this data into your model. In addition, with its open database format, SewerCAD V8i gives you unprecedented access to your modeling data.
Bentley SewerCAD V8i User’s Guide 5-137
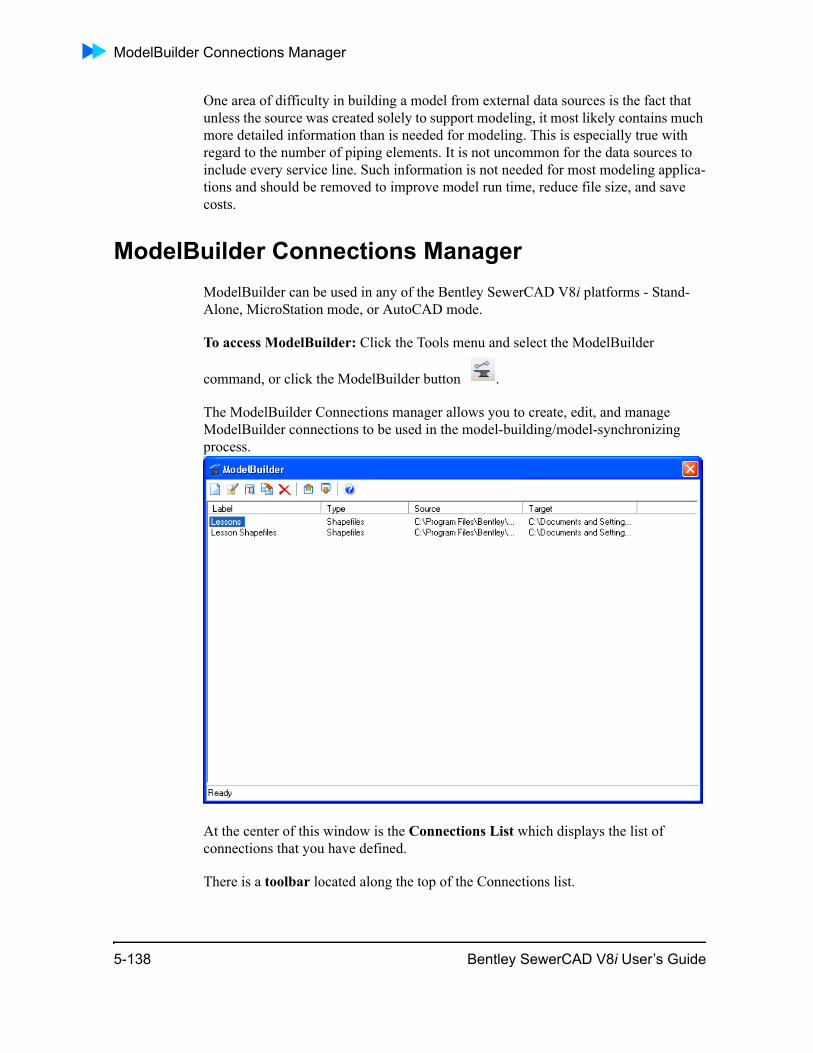
ModelBuilder Connections Manager
One area of difficulty in building a model from external data sources is the fact that unless the source was created solely to support modeling, it most likely contains much more detailed information than is needed for modeling. This is especially true with regard to the number of piping elements. It is not uncommon for the data sources to include every service line. Such information is not needed for most modeling applica-tions and should be removed to improve model run time, reduce file size, and save costs.
ModelBuilder Connections ManagerModelBuilder can be used in any of the Bentley SewerCAD V8i platforms - Stand-Alone, MicroStation mode, or AutoCAD mode.
To access ModelBuilder: Click the Tools menu and select the ModelBuilder
command, or click the ModelBuilder button .
The ModelBuilder Connections manager allows you to create, edit, and manage ModelBuilder connections to be used in the model-building/model-synchronizing process.
At the center of this window is the Connections List which displays the list of connections that you have defined.
There is a toolbar located along the top of the Connections list.
5-138 Bentley SewerCAD V8i User’s Guide
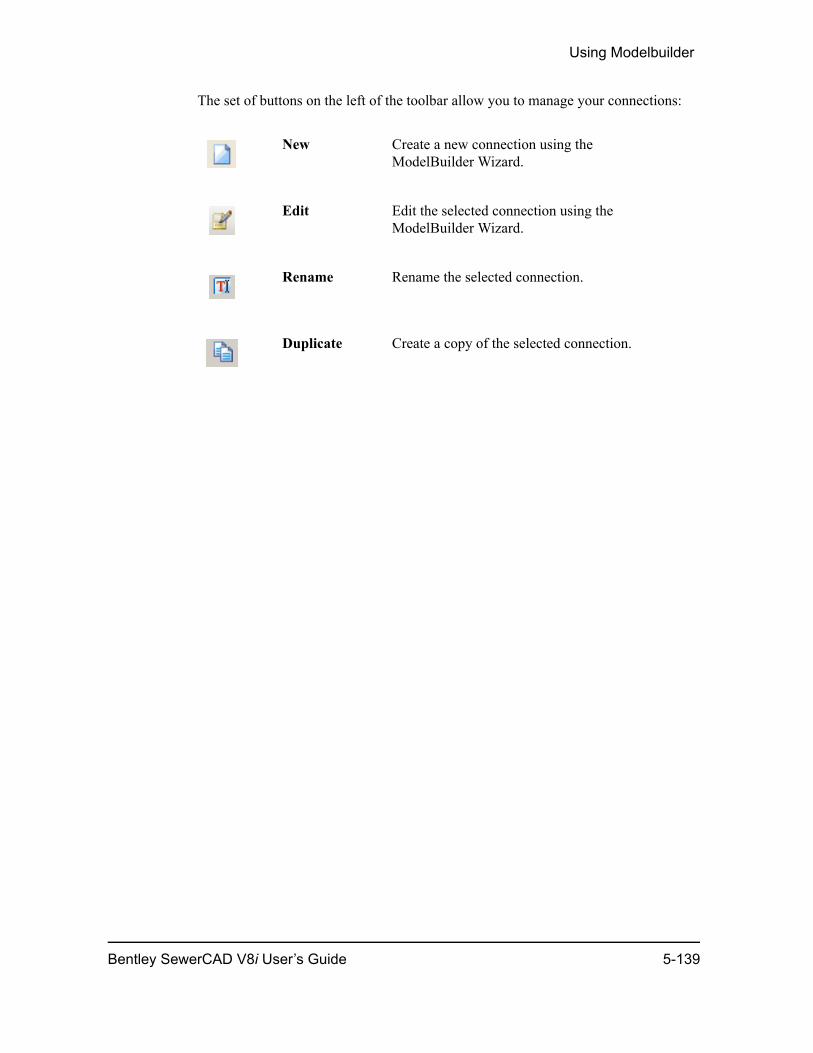
Using Modelbuilder
The set of buttons on the left of the toolbar allow you to manage your connections:
New Create a new connection using the ModelBuilder Wizard.
Edit Edit the selected connection using the ModelBuilder Wizard.
Rename Rename the selected connection.
Duplicate Create a copy of the selected connection.
Bentley SewerCAD V8i User’s Guide 5-139
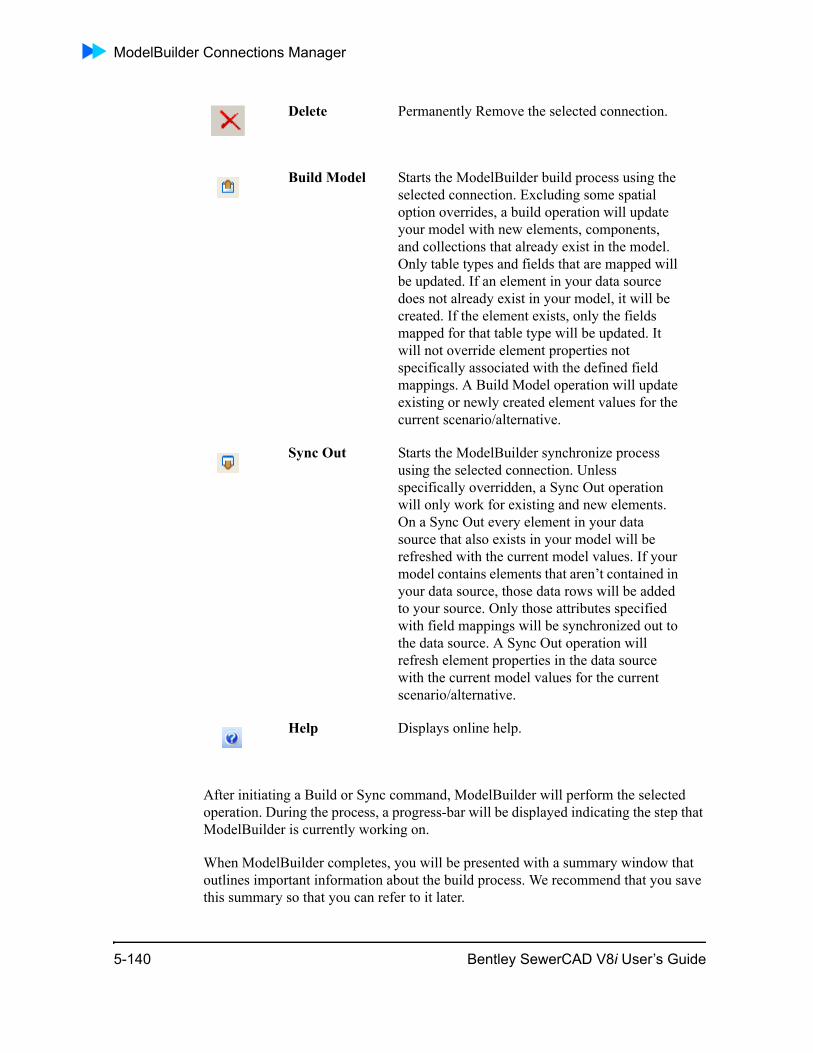
ModelBuilder Connections Manager
After initiating a Build or Sync command, ModelBuilder will perform the selected operation. During the process, a progress-bar will be displayed indicating the step that ModelBuilder is currently working on.
When ModelBuilder completes, you will be presented with a summary window that outlines important information about the build process. We recommend that you save this summary so that you can refer to it later.
Delete Permanently Remove the selected connection.
Build Model Starts the ModelBuilder build process using the selected connection. Excluding some spatial option overrides, a build operation will update your model with new elements, components, and collections that already exist in the model. Only table types and fields that are mapped will be updated. If an element in your data source does not already exist in your model, it will be created. If the element exists, only the fields mapped for that table type will be updated. It will not override element properties not specifically associated with the defined field mappings. A Build Model operation will update existing or newly created element values for the current scenario/alternative.
Sync Out Starts the ModelBuilder synchronize process using the selected connection. Unless specifically overridden, a Sync Out operation will only work for existing and new elements. On a Sync Out every element in your data source that also exists in your model will be refreshed with the current model values. If your model contains elements that aren’t contained in your data source, those data rows will be added to your source. Only those attributes specified with field mappings will be synchronized out to the data source. A Sync Out operation will refresh element properties in the data source with the current model values for the current scenario/alternative.
Help Displays online help.
5-140 Bentley SewerCAD V8i User’s Guide
Using Modelbuilder
Note: ModelBuilder connection mappings are persisted. They are saved by default in "C:\Documents and Settings\username\Application Data\Bentley\ SewerCAD V8i\8\ModelBuilder.xml". ModelBuilder connections are preserved even after SewerCAD V8i is closed.
ModelBuilder WizardThe ModelBuilder Wizard assists in the creation of ModelBuilder connections. The Wizard will guide you through the process of selecting your data source and mapping that data to the desired input of your model.
Tip: The ModelBuilder Wizard can be resized, making it easier to preview tables in your data source. In addition, Step 1 and Step 3 of the wizard offer a vertical split bar, letting you adjust the size of the list located on the left side of these pages.
There are 4 steps involved:
• “Step 1—Specify Data Source” on page 5-141
• “Step 2—Specify Spatial Options” on page 5-142
• “Step 3—Specify Field Mappings for each Table/Feature Class” on page 5-144
• “Step 4—Build Operation Confirmation” on page 5-146
Step 1—Specify Data Source
In this step, the data source type and location are specified. After selecting your data source, the desired database tables can be chosen and previewed.
The following fields are available:
• Data Source type (drop-down list)—This field allows you to specify the type of data you would like to work with.
Bentley SewerCAD V8i User’s Guide 5-141
ModelBuilder Wizard
Note: If your specific data source type is not listed in the Data Source type field, try using the OLE DB data source type. OLE DB can be used to access many database systems (including ORACLE, and SQL Server, to name a few).
FoxPro datasources are not explicitly supported in ModelBuilder. FoxPro database users will need to install the Microsoft OLE DB Provider for Visual FoxPro, and use an OleDB datasource.
• Data Source (text field)—This read-only field displays the path to your data source.
• Browse (button)—This button opens a browse dialog box that allows you to inter-actively select your data source.
Note: Some Data Source types expect you to choose more than one item in the Browse dialog box. For more information, see “Multi-select Data Source Types” on page 5-147.
• Table/Feature Class (list)—This pane lists the tables/feature classes that are contained within the data source. Use the check boxes (along the left side of the list) to specify the tables you would like to include.
Tip: The list can be resized using the split bar (located on the right side of the list).
Right-click to Select All or Clear the current selection in the list.
• Preview Pane—A tabular preview of the highlighted table is displayed in this pane when the Show Preview check box is enabled.
Step 2—Specify Spatial Options
In this step you will specify the spatial options to be used during the ModelBuilder process. The spatial options will determine the placement and connectivity of the model elements. The fields available in this step will vary depending on the data source type.
• Specify the Coordinate Unit of your data source (drop-down list)—This field allows you to specify the coordinate unit of the spatial data in your data source.
• Create nodes if none found at pipe endpoint (check box)—When this box is checked, ModelBuilder will create a pressure junction at any pipe endpoint that: a) doesn’t have a connected node, and b) is not within the specified tolerance of an existing node. This field is only active when the Establish connectivity using spatial data box is checked. (This option is not available if the connection is bringing in only point type geometric data.)
5-142 Bentley SewerCAD V8i User’s Guide
Using Modelbuilder
• Establish connectivity using spatial data (check box)—When this box is checked, ModelBuilder will connect pipes to nodes that fall within a specified tolerance of a pipe endpoint. (This option is available if the connection is bringing in only polyline type geometric data.)
• Tolerance (numeric field)—This field dictates how close a node must be to a pipe endpoint in order for connectivity to be established. The Tolerance field is only available when the Establish connectivity using spatial data box is checked. (This option is available if the connection is bringing in only polyline type geometric data.)
Note: Pipes will be connected to the closest node within the specified tolerance.
The unit associated with the tolerance is dictated by the Specify the Coordinate Unit of your data source field.
For more information, see “Specifying Network Connectivity in ModelBuilder” on page 5-149.
• Create referenced element automatically (check box)—When this box is checked, ModelBuilder will create referenced start and stop node's automatically at the pipe's start and stop locations.
• Add objects to destination if present in source (check box)—When this box is not checked, ModelBuilder will not append the model with new element data from the data source.
• Prompt before adding objects (check box)—When this box is checked, Model-Builder will pause during model generation to present a confirmation message box to the user each time an element is about to be created in the model.
• Remove objects from destination if missing from source (check box)—When this box is checked, ModelBuilder will delete elements from the model if they do not exist in the data source.
• Prompt before removing objects (check box)—When this box is checked, ModelBuilder will pause during model generation to present a confirmation message box to the user each time an element is about to be deleted from the model.
Bentley SewerCAD V8i User’s Guide 5-143
ModelBuilder Wizard
Step 3—Specify Field Mappings for each Table/Feature Class
In this step, data source tables are mapped to the desired modeling element types, and data source fields are mapped to the desired model input attributes. You will assign mappings for each Table/Feature Class that appears in the list; Step 1 of the wizard can be used to exclude tables, if you wish.
• Tables (list)—This pane, located along the left side of the dialog box, lists the data source Tables/Feature Classes to be used in the ModelBuilder process. Select an item in the list to specify the settings for that item.
Tip: The list can be resized using the split bar.
There are two toolbar buttons located directly above Tables list (these buttons can be a great time saver when setting up multiple mappings with similar settings).
– Copy Mappings (button)—This button copies the mappings (associated with the currently selected table) to the clipboard.
– Paste Mappings (button)—This button applies the copied mappings to the currently selected table.
• Settings Tab—The Settings tab allows you to specify mappings for the selected item in the Tables list.
The top section of the Settings tab allows you to specify the common data mappings:
– Table Type (drop-down list)—This field allows you to specify the target modeling element type that the source table/feature class represents. For example, a source table that contains pipe data should be associated with the Pressure Pipe element type.
There are three categories of Table Types: Element Types, Components, and Collections. For geometric data sources, only Element Types are available. However with tabular data sources all table types can be used. The catego-rized menu accessed by the [>] button assists in quicker selection of the desired table type.
- Element Types—This category of Table Type includes elements symbol-ically represented in the drawing view such as pipes, junctions, tanks, etc.
- Components—This category of Table Type includes the supporting data items in your model that are potentially shared among elements such as patterns, pump definitions, and controls.
- Collections—This category of Table Type includes table types that are typically lists of 2-columned data. For instance, if one table in your connection consists of a list of (Time From Start, Multiplier) pairs, use a Pattern collection table type selection.
5-144 Bentley SewerCAD V8i User’s Guide
Using Modelbuilder
Note: Each table in your data source can be assigned to a single element type. For this reason, individual tables in your data source should contain only data that will be assigned to items of the same type. For instance, the source data table that will be designated as the Pressure Junction element type should contain only data that will be applied to Pressure Junctions, not data relating to pressure valves, tanks, etc.
– Key/Label Field (drop-down list)—This required field allows you to asso-ciate a row in this table to a particular element in the model. The model refer-ences each element using a unique alphanumeric label. Your data source must have a field that can be used to uniquely identify all elements in the model.
Note: If you do not have a field that can be used to uniquely identify each element, you may use the <label> field (which is automatically generated by ModelBuilder for this purpose).
These optional fields are available for Pipe element types:
– Start/Stop—Select the fields in your pipe table that contain the Label of the start and stop nodes. For more information, see “Specifying Network Connec-tivity in ModelBuilder” on page 5-149. This field only applies to polyline table types.
These fields are available for Node element types:
– X/Y Field—These fields are used to specify the node X and Y coordinate data. This field only applies to point table types.
Note: The Coordinate Unit setting in Step 2 of the wizard allows you to specify the units associated with these fields.
These optional fields are available for Pump element types:
– Downstream Edge (drop-down list)—For tables that define pump or valve data, select a pipe label or other unique identifier to set the direction of the pump or valve.
The bottom section of the Settings tab allows you to specify additional data mappings.
– Field—Field refers to a field in the selected data source. The Field list displays the associations between fields in the database to attributes in the model.
– Attribute (drop-down list)—Attribute refers to a Bentley SewerCAD V8i attribute. Use the Attribute drop-down list to map the highlighted field to the desired attribute.
– Unit (drop-down list)—This field allows you to specify the units of the values in the datasource (no conversion on your part is required). This field only applies if the selected attribute is unitized.
Bentley SewerCAD V8i User’s Guide 5-145
Reviewing Your Results
To map a field in your table to a particular SewerCAD V8i attribute:
1. In the Field list, select the item you would like to update.
2. In the Attribute drop-down list, select the desired SewerCAD V8i attribute. You can also click the flyout button to access a submenu that categorizes attributes by type.
3. If the attribute is unitized, specify the unit of this field in your data source in the Unit drop-down list.
To remove the mapping for a particular field:
1. Select the field you would like to update.
2. In the Attribute drop-down list, select <none>.
– Preview Tab—The Preview tab displays a tabular preview of the currently highlighted source data table when the Show Preview check box is checked.
Step 4—Build Operation Confirmation
In this step, you are prompted to build a new model or update an existing model.
To build a new model, click the Yes radio button under Would you like to build the model now?.
If you choose No, you will be returned to the ModelBuilder Manager dialog. The connection you defined will appear in the list pane. To build the model from the ModelBuilder Manager, highlight the connection and click the Build Model button.
Reviewing Your ResultsAt the end of the ModelBuilder process, you will be presented with statistics, and a list of any warning/error messages reported during the process. You should closely review this information, and be sure to save this data to disk where you can refer to it later.
5-146 Bentley SewerCAD V8i User’s Guide
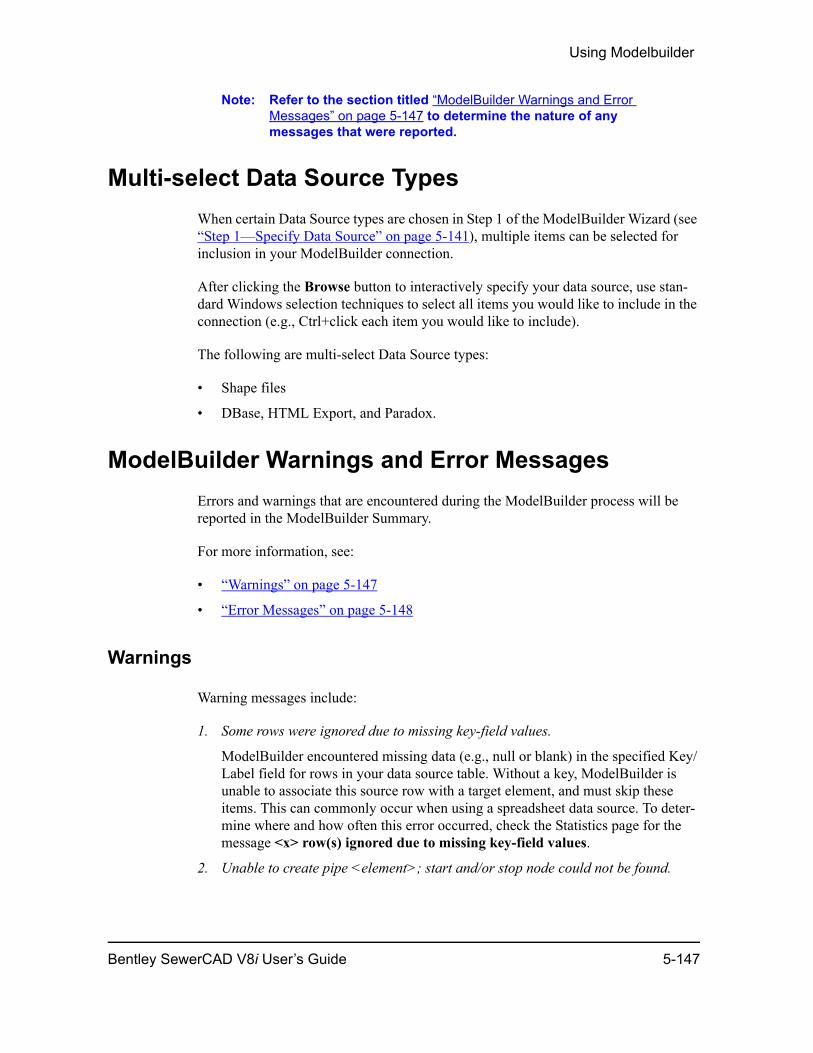
Using Modelbuilder
Note: Refer to the section titled “ModelBuilder Warnings and Error Messages” on page 5-147 to determine the nature of any messages that were reported.
Multi-select Data Source TypesWhen certain Data Source types are chosen in Step 1 of the ModelBuilder Wizard (see “Step 1—Specify Data Source” on page 5-141), multiple items can be selected for inclusion in your ModelBuilder connection.
After clicking the Browse button to interactively specify your data source, use stan-dard Windows selection techniques to select all items you would like to include in the connection (e.g., Ctrl+click each item you would like to include).
The following are multi-select Data Source types:
• Shape files
• DBase, HTML Export, and Paradox.
ModelBuilder Warnings and Error MessagesErrors and warnings that are encountered during the ModelBuilder process will be reported in the ModelBuilder Summary.
For more information, see:
• “Warnings” on page 5-147
• “Error Messages” on page 5-148
Warnings
Warning messages include:
1. Some rows were ignored due to missing key-field values.
ModelBuilder encountered missing data (e.g., null or blank) in the specified Key/Label field for rows in your data source table. Without a key, ModelBuilder is unable to associate this source row with a target element, and must skip these items. This can commonly occur when using a spreadsheet data source. To deter-mine where and how often this error occurred, check the Statistics page for the message <x> row(s) ignored due to missing key-field values.
2. Unable to create pipe <element>; start and/or stop node could not be found.
Bentley SewerCAD V8i User’s Guide 5-147
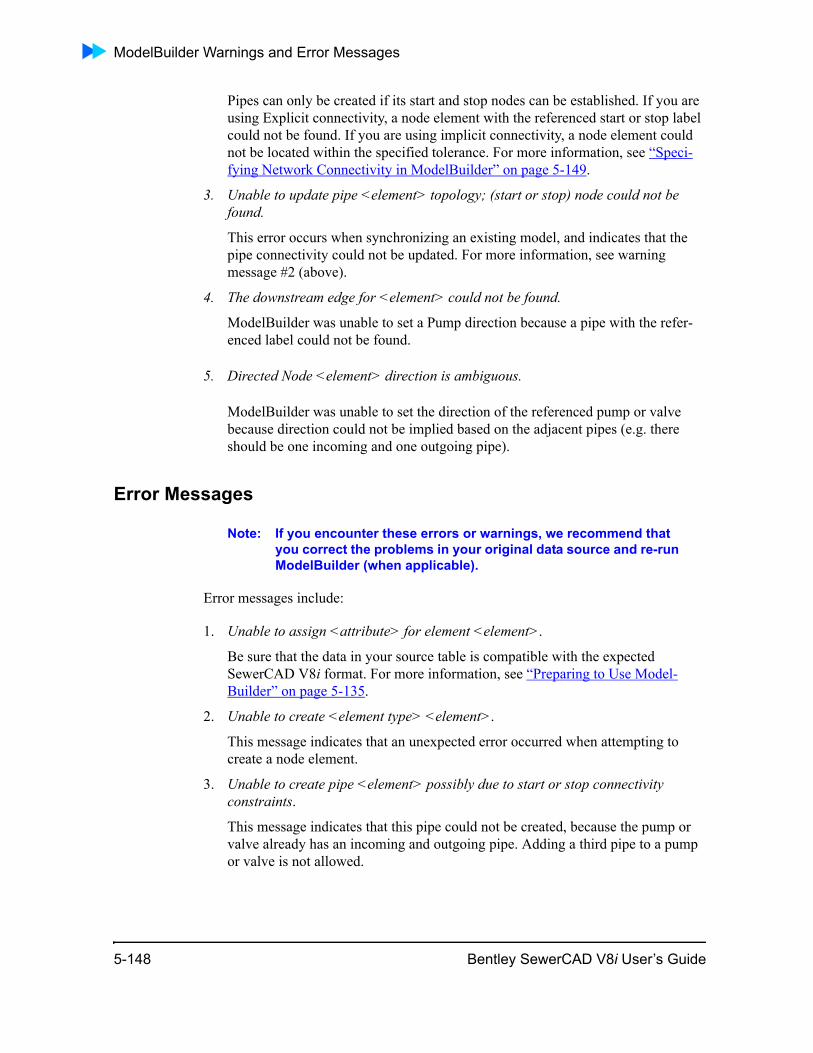
ModelBuilder Warnings and Error Messages
Pipes can only be created if its start and stop nodes can be established. If you are using Explicit connectivity, a node element with the referenced start or stop label could not be found. If you are using implicit connectivity, a node element could not be located within the specified tolerance. For more information, see “Speci-fying Network Connectivity in ModelBuilder” on page 5-149.
3. Unable to update pipe <element> topology; (start or stop) node could not be found.
This error occurs when synchronizing an existing model, and indicates that the pipe connectivity could not be updated. For more information, see warning message #2 (above).
4. The downstream edge for <element> could not be found.
ModelBuilder was unable to set a Pump direction because a pipe with the refer-enced label could not be found.
5. Directed Node <element> direction is ambiguous.
ModelBuilder was unable to set the direction of the referenced pump or valve because direction could not be implied based on the adjacent pipes (e.g. there should be one incoming and one outgoing pipe).
Error Messages
Note: If you encounter these errors or warnings, we recommend that you correct the problems in your original data source and re-run ModelBuilder (when applicable).
Error messages include:
1. Unable to assign <attribute> for element <element>.
Be sure that the data in your source table is compatible with the expected SewerCAD V8i format. For more information, see “Preparing to Use Model-Builder” on page 5-135.
2. Unable to create <element type> <element>.
This message indicates that an unexpected error occurred when attempting to create a node element.
3. Unable to create pipe <element> possibly due to start or stop connectivity constraints.
This message indicates that this pipe could not be created, because the pump or valve already has an incoming and outgoing pipe. Adding a third pipe to a pump or valve is not allowed.
5-148 Bentley SewerCAD V8i User’s Guide

Using Modelbuilder
4. Unable to update pipe <element> topology; possibly due to start element connec-tivity constraints.
This error occurs when synchronizing. For more information, see error message #3 (above).
5. Operation terminated by user.
You pressed the Cancel button during the ModelBuilder process.
6. Unable to create < element>; pipe start and stop must be different.
This message indicates that the start and stop specified for this pipe refer to the same node element.
7. Unable to update <element> topology; pipe start and stop must be different.
This message indicates that the start and stop specified for this pipe refer to the same node element.
8. Unable to update the downstream edge for <element>.
An unexpected error occurred attempting to set the downstream edge for this pump or valve.
9. Nothing to do. Some previously referenced tables may be missing from your data source.
This data source has changed since this connection was created. Verify that tables/feature-classes in your data source have not been renamed or deleted.
Specifying Network Connectivity in ModelBuilderWhen importing spatial data (ArcGIS Geodatabases or shapefile data contain spatial geometry data that ModelBuilder can use to establish network connectivity by connecting pipe ends to nodes, creating nodes at pipe endpoints if none are found.), ModelBuilder provides two ways to specify network connectivity:
• Explicit connectivity—based on pipe Start node and Stop node (see “Step 3—Specify Field Mappings for each Table/Feature Class” on page 5-144).
• Implicit connectivity—based on spatial data. When using implicit connectivity, ModelBuilder allows you to specify a Tolerance, and provides a second option allowing you to Create nodes if none found (see “Step 2—Specify Spatial Options” on page 5-142).
The method that you use will vary depending on the quality of your data. The possible situations include (in order from best case to worst case):
• You have pipe start and stop information—Explicit connectivity is definitely the preferred option.
Bentley SewerCAD V8i User’s Guide 5-149
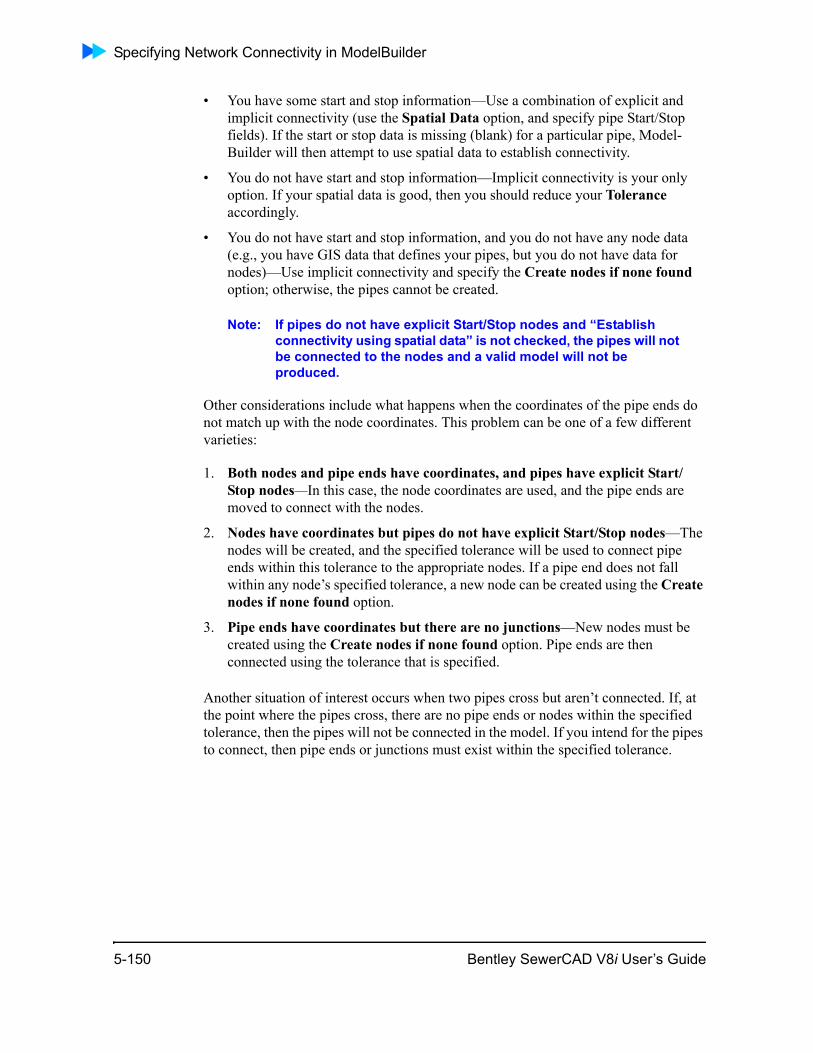
Specifying Network Connectivity in ModelBuilder
• You have some start and stop information—Use a combination of explicit and implicit connectivity (use the Spatial Data option, and specify pipe Start/Stop fields). If the start or stop data is missing (blank) for a particular pipe, Model-Builder will then attempt to use spatial data to establish connectivity.
• You do not have start and stop information—Implicit connectivity is your only option. If your spatial data is good, then you should reduce your Tolerance accordingly.
• You do not have start and stop information, and you do not have any node data (e.g., you have GIS data that defines your pipes, but you do not have data for nodes)—Use implicit connectivity and specify the Create nodes if none found option; otherwise, the pipes cannot be created.
Note: If pipes do not have explicit Start/Stop nodes and “Establish connectivity using spatial data” is not checked, the pipes will not be connected to the nodes and a valid model will not be produced.
Other considerations include what happens when the coordinates of the pipe ends do not match up with the node coordinates. This problem can be one of a few different varieties:
1. Both nodes and pipe ends have coordinates, and pipes have explicit Start/Stop nodes—In this case, the node coordinates are used, and the pipe ends are moved to connect with the nodes.
2. Nodes have coordinates but pipes do not have explicit Start/Stop nodes—The nodes will be created, and the specified tolerance will be used to connect pipe ends within this tolerance to the appropriate nodes. If a pipe end does not fall within any node’s specified tolerance, a new node can be created using the Create nodes if none found option.
3. Pipe ends have coordinates but there are no junctions—New nodes must be created using the Create nodes if none found option. Pipe ends are then connected using the tolerance that is specified.
Another situation of interest occurs when two pipes cross but aren’t connected. If, at the point where the pipes cross, there are no pipe ends or nodes within the specified tolerance, then the pipes will not be connected in the model. If you intend for the pipes to connect, then pipe ends or junctions must exist within the specified tolerance.
5-150 Bentley SewerCAD V8i User’s Guide
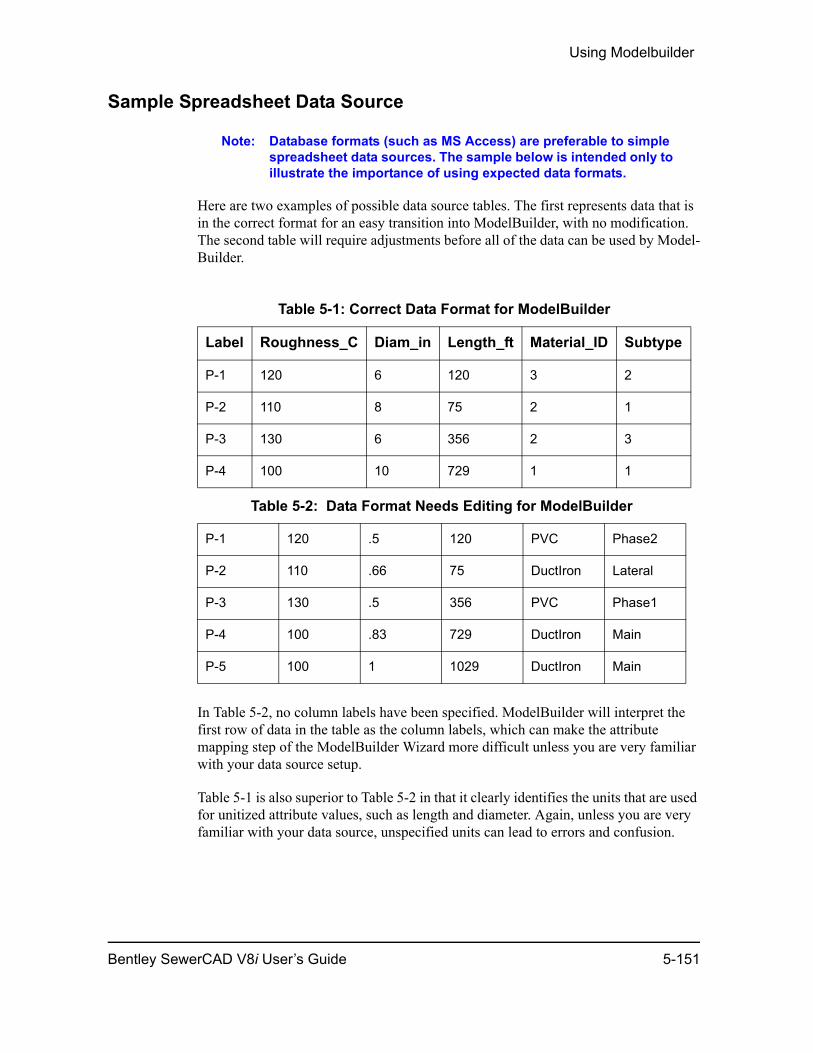
Using Modelbuilder
Sample Spreadsheet Data Source
Note: Database formats (such as MS Access) are preferable to simple spreadsheet data sources. The sample below is intended only to illustrate the importance of using expected data formats.
Here are two examples of possible data source tables. The first represents data that is in the correct format for an easy transition into ModelBuilder, with no modification. The second table will require adjustments before all of the data can be used by Model-Builder.
In Table 5-2, no column labels have been specified. ModelBuilder will interpret the first row of data in the table as the column labels, which can make the attribute mapping step of the ModelBuilder Wizard more difficult unless you are very familiar with your data source setup.
Table 5-1 is also superior to Table 5-2 in that it clearly identifies the units that are used for unitized attribute values, such as length and diameter. Again, unless you are very familiar with your data source, unspecified units can lead to errors and confusion.
Table 5-1: Correct Data Format for ModelBuilder
Label Roughness_C Diam_in Length_ft Material_ID Subtype
P-1 120 6 120 3 2
P-2 110 8 75 2 1
P-3 130 6 356 2 3
P-4 100 10 729 1 1
Table 5-2: Data Format Needs Editing for ModelBuilder
P-1 120 .5 120 PVC Phase2
P-2 110 .66 75 DuctIron Lateral
P-3 130 .5 356 PVC Phase1
P-4 100 .83 729 DuctIron Main
P-5 100 1 1029 DuctIron Main
Bentley SewerCAD V8i User’s Guide 5-151
Handling Collection and Curve Data in Modelbuilder
Finally, Table 5-2 is storing the Material and Subtype attributes as alphanumeric values, while ModelBuilder uses integer ID values to access this input. This data is unusable by ModelBuilder in alphanumeric format, and must be translated to an integer ID system in order to read this data.
Handling Collection and Curve Data in ModelbuilderModeBuilder has the ability to import Collection and Curve data, such as pump curves, hydrographs, and pattern curves, among others. In the model, these data types are always associated to either Domain elements (pumps, pipes, …) or Components (pump definitions, patterns, …). You can just import the collection data, and Model-Builder will create a default domain/component element if it doesn't yet exist, and if the creation option to automatically create referenced elements is enabled. But a better technique would be to import the domain/component element from an external table, and then import the collection data into those created domain/component elements. This gives you the ability to import the most amount of detail.
The external tabular data for a collection curve must have a label field, where the label field contains string values that match the label of the associated domain/component element. For example, if two pattern curves are defined in an external table, the table would look something like the following:
This would assign 4 entries to the 'Normal' pattern, and 3 entries to the 'High' pattern. The Order field is optional, and is discussed below. The same approach applies to nodes, for such things as a variable area tank curve, or junction demands. In these cases, the label field would contain the name of the node that collection entries are being added into.
Table 5-3: Sample Tabular Data
Label Time from Start Multiplier Order
Normal 1.2 .8 1
Normal 1.7 .7 2
Normal 12 .2 3
Normal 17 .5 4
High 5 1.0 1
High 19 .85 3
High 12 .65 2
5-152 Bentley SewerCAD V8i User’s Guide
Using Modelbuilder
ModelBuilder also includes an advanced feature to allow precise ordering of the collection records. For some collections, the order of the records does not matter and this feature isn't needed. For other cases, order of the records is meaningful. For these types of collections, there is a Sort By Field in the ModelBuilder mapping form. By default, it uses the record order as the records exist in the external data source. If the records are not ordered correctly in the data source, then the external table must have an additional field that contains numeric values. These values will represent the order that the records should be imported. So for the above example data, normally the records would be imported in the order entered (5, 19, then 12 for the High pattern). However the user can set the Sort By Field in the ModelBuilder form to use the 'Order' external field, and this will import the records based on either Ascending 'Order' values (5, 12, 19) or Descending 'Order' values (19, 12, 5).
The following topics provide examples of using ModelBuilder to import collection data:
• “Importing Pump Definitions Using ModelBuilder” on page 5-153
• “Using ModelBuilder to Import Pump Curves” on page 5-158
• “Using ModelBuilder to Import Patterns” on page 5-162
Importing Pump Definitions Using ModelBuilder
Pump definition information can be extracted from an external data source using ModelBuilder.
Most of this importing is accomplished by setting up mappings under the Pump Defi-nition Table Type. However, to import multipoint head, efficiency or speed vs. effi-ciency curves, the tabular values must be imported under Table Types: Pump Definition - Pump Curves, Pump Definition - Flow-Efficiency Curve, and Pump Definition - Speed-Efficiency Curve respectively.
The list of properties that can be imported under Pump Definition is given below. The only property in the list that is required is a Key or Label. Most of the properties are numerical values.
• BEP Efficiency
• BEP Flow
• Define BEP Max Flow?
• Design Flow
• Design Head
• GemsID (imported)
• Inertia (Pump and Motor)
Bentley SewerCAD V8i User’s Guide 5-153
Handling Collection and Curve Data in Modelbuilder
• Is Variable Speed Drive?
• Max Extended Flow
• Max Operating Flow
• Max Operating Head
• Motor Efficiency
• Notes
• Pump Definition Type (ID)
• Pump Definition Type (Label)
• Pump Efficiency
• Pump Efficiency (ID)
• Pump Efficiency (Label)
• Pump Power
• Reverse Spin Allowed?
• Specific Speed
• Speed (Full)
• Shutoff Head
• User Defined BEP Max Flow
Those properties that are text such as Pump Efficiency and Pump Definition Type are alphanumeric and must be spelled correctly. For example Standard (3 Point) must be spelled exactly as shown in the Pump Definition drop down. Properties with a ques-tion mark above, require a TRUE or FALSE value. Those with ID next to the name are internal IDs and are usually only useful when syncing out from a model.
To import data, create a table in a data source (e.g. spreadsheet, data base), and then create columns/fields for each of the properties to be imported. In Excel for example, the columns are created by entering column headings in the first row of a sheet for each of the properties. Starting with the second row in the table, there will be one row for each pump definition to be imported.
Once the table is created in the source file, the file must be saved before it can be imported.
In the Specify your data source step in the wizard, the user indicates the source file name and the sheet or table corresponding to the pump definition data. In the Specify field mappings for each table step, the user selects Pump Definition as the table type, indicates the name of the pump definition in the Key>Label field and then maps each of the fields to be imported with the appropriate property in the Attribute drop down.
5-154 Bentley SewerCAD V8i User’s Guide
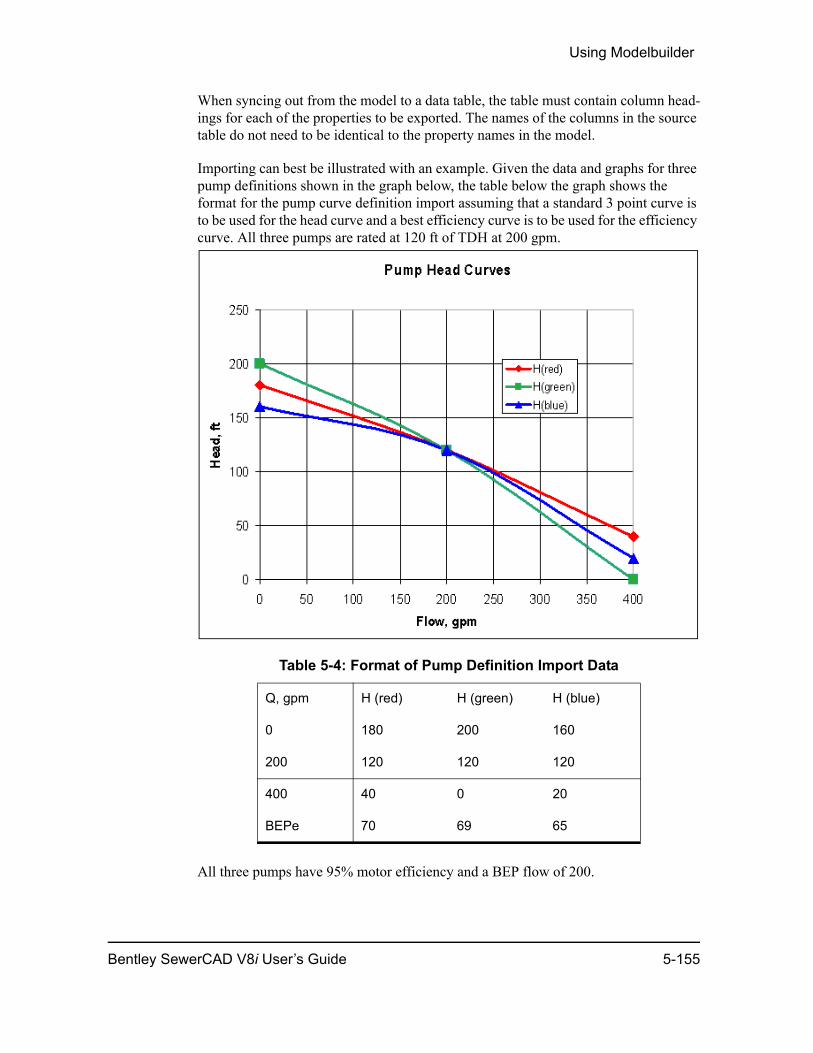
Using Modelbuilder
When syncing out from the model to a data table, the table must contain column head-ings for each of the properties to be exported. The names of the columns in the source table do not need to be identical to the property names in the model.
Importing can best be illustrated with an example. Given the data and graphs for three pump definitions shown in the graph below, the table below the graph shows the format for the pump curve definition import assuming that a standard 3 point curve is to be used for the head curve and a best efficiency curve is to be used for the efficiency curve. All three pumps are rated at 120 ft of TDH at 200 gpm.
All three pumps have 95% motor efficiency and a BEP flow of 200.
Table 5-4: Format of Pump Definition Import Data
Q, gpm H (red) H (green) H (blue)
0 180 200 160
200 120 120 120
400 40 0 20
BEPe 70 69 65
Bentley SewerCAD V8i User’s Guide 5-155
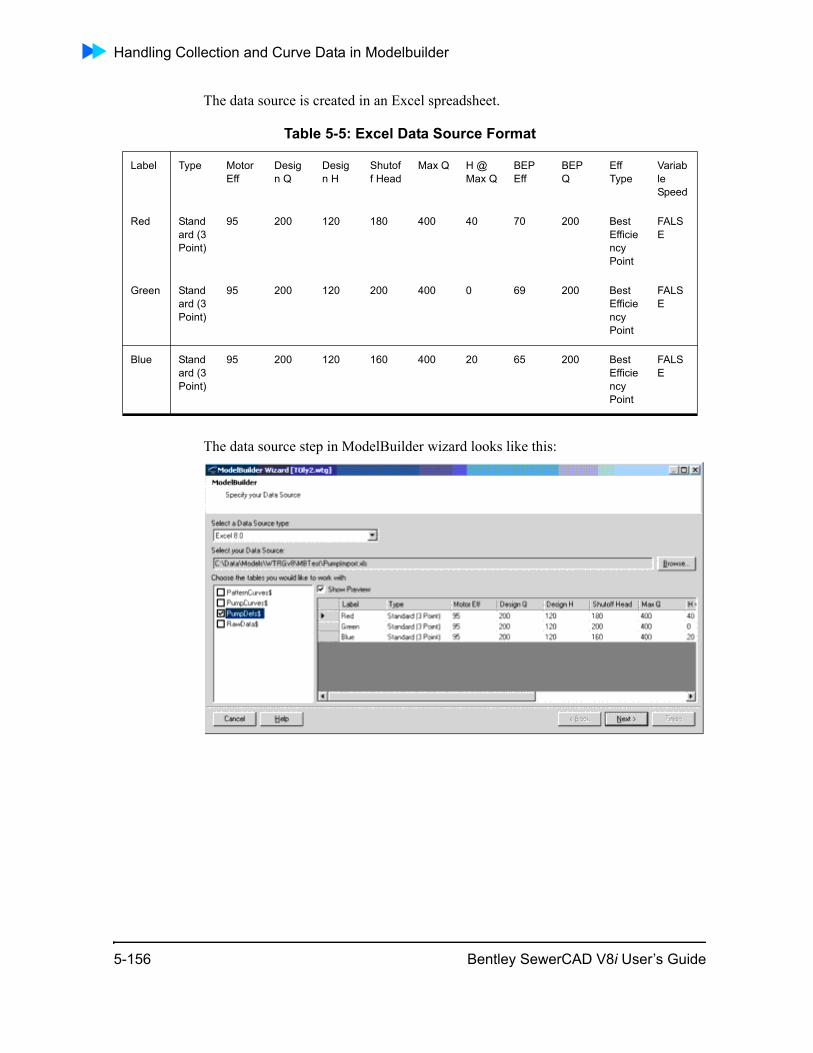
Handling Collection and Curve Data in Modelbuilder
The data source is created in an Excel spreadsheet.
The data source step in ModelBuilder wizard looks like this:
Table 5-5: Excel Data Source Format
Label Type Motor Eff
Design Q
Design H
Shutoff Head
Max Q H @ Max Q
BEP Eff
BEP Q
Eff Type
Variable Speed
Red Standard (3 Point)
95 200 120 180 400 40 70 200 Best Efficiency Point
FALSE
Green Standard (3 Point)
95 200 120 200 400 0 69 200 Best Efficiency Point
FALSE
Blue Standard (3 Point)
95 200 120 160 400 20 65 200 Best Efficiency Point
FALSE
5-156 Bentley SewerCAD V8i User’s Guide
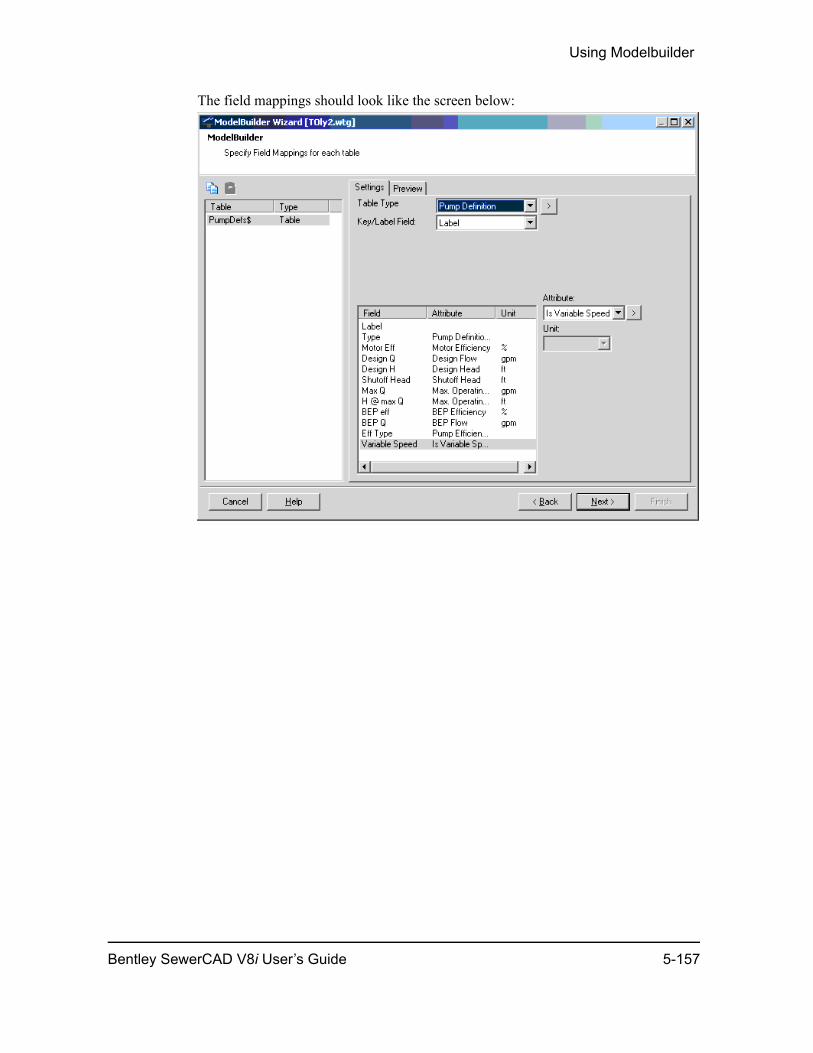
Using Modelbuilder
The field mappings should look like the screen below:
Bentley SewerCAD V8i User’s Guide 5-157
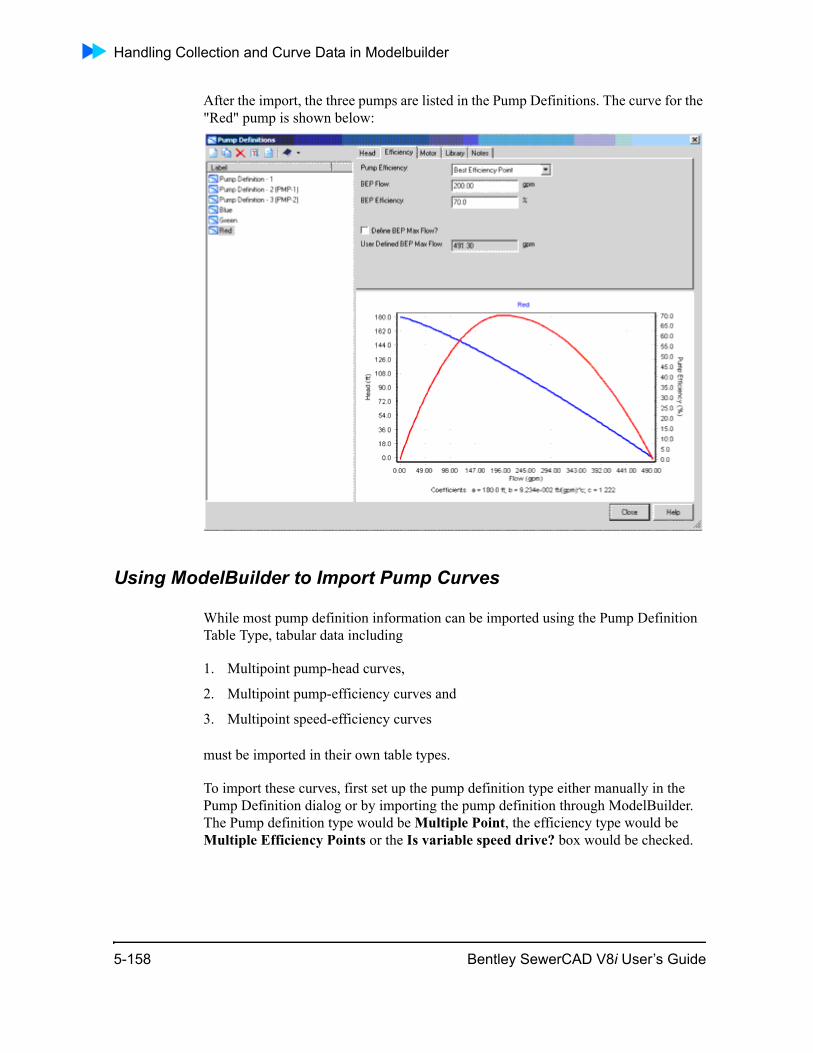
Handling Collection and Curve Data in Modelbuilder
After the import, the three pumps are listed in the Pump Definitions. The curve for the "Red" pump is shown below:
Using ModelBuilder to Import Pump Curves
While most pump definition information can be imported using the Pump Definition Table Type, tabular data including
1. Multipoint pump-head curves,
2. Multipoint pump-efficiency curves and
3. Multipoint speed-efficiency curves
must be imported in their own table types.
To import these curves, first set up the pump definition type either manually in the Pump Definition dialog or by importing the pump definition through ModelBuilder. The Pump definition type would be Multiple Point, the efficiency type would be Multiple Efficiency Points or the Is variable speed drive? box would be checked.
5-158 Bentley SewerCAD V8i User’s Guide
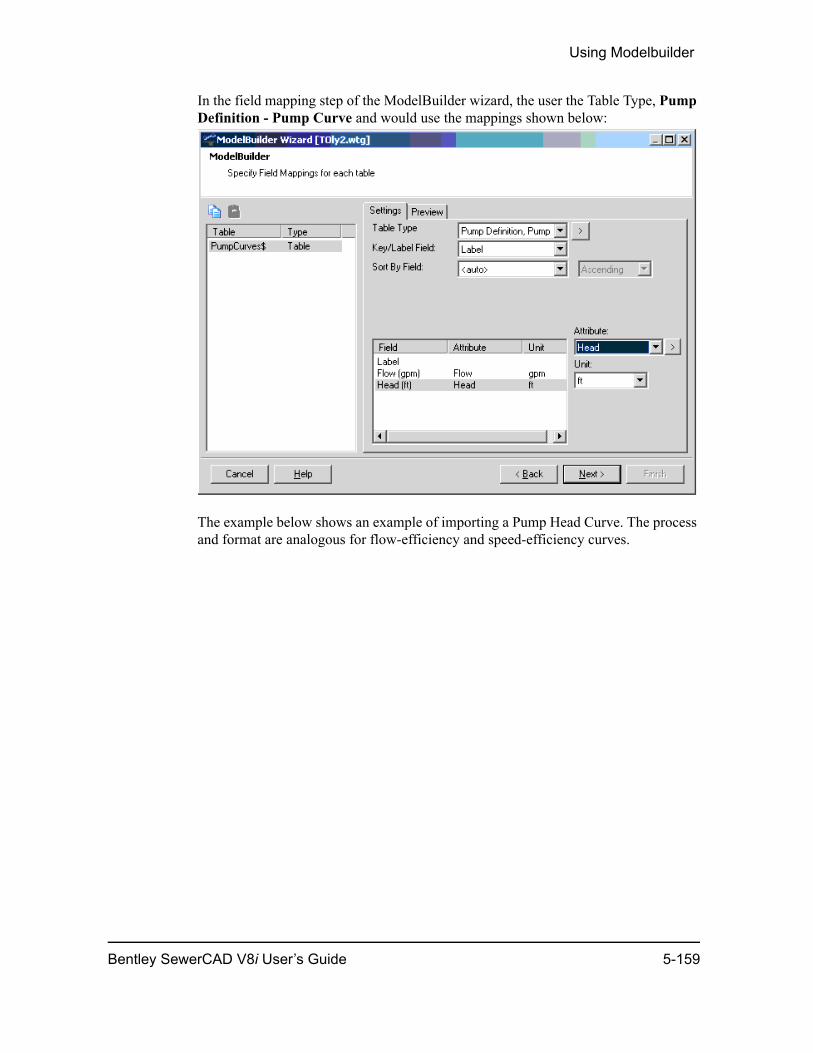
Using Modelbuilder
In the field mapping step of the ModelBuilder wizard, the user the Table Type, Pump Definition - Pump Curve and would use the mappings shown below:
The example below shows an example of importing a Pump Head Curve. The process and format are analogous for flow-efficiency and speed-efficiency curves.
Bentley SewerCAD V8i User’s Guide 5-159
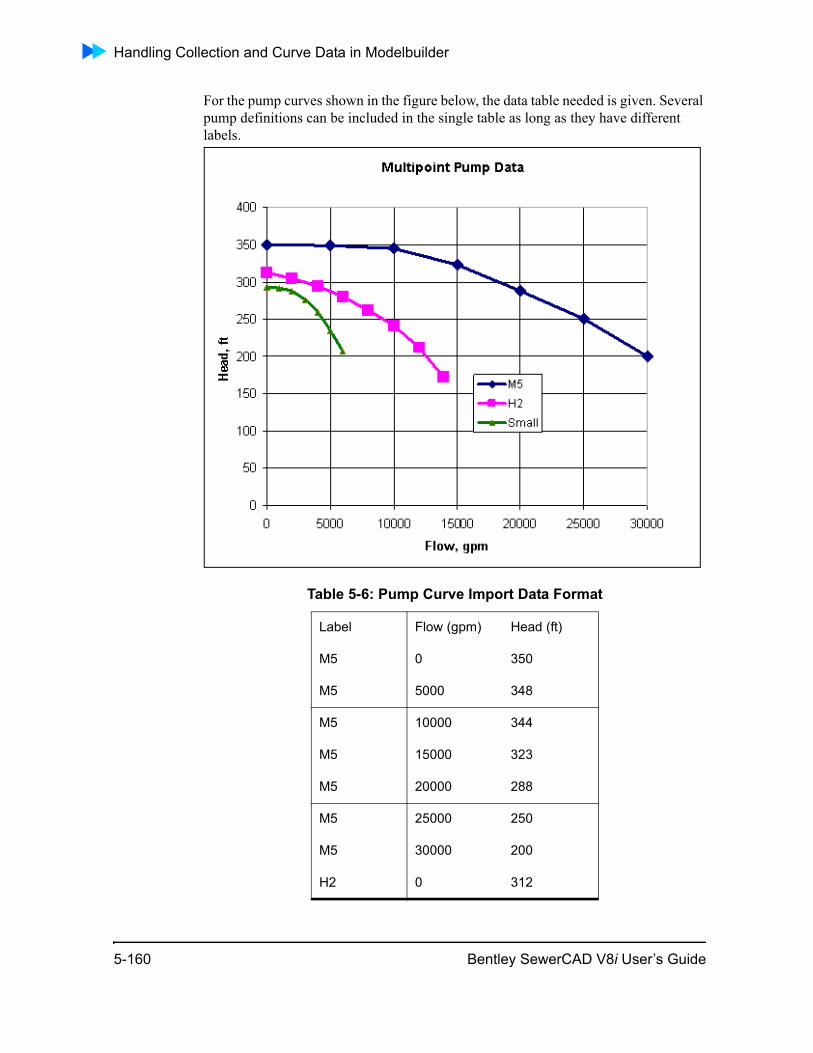
Handling Collection and Curve Data in Modelbuilder
For the pump curves shown in the figure below, the data table needed is given. Several pump definitions can be included in the single table as long as they have different labels.
Table 5-6: Pump Curve Import Data Format
Label Flow (gpm) Head (ft)
M5 0 350
M5 5000 348
M5 10000 344
M5 15000 323
M5 20000 288
M5 25000 250
M5 30000 200
H2 0 312
5-160 Bentley SewerCAD V8i User’s Guide
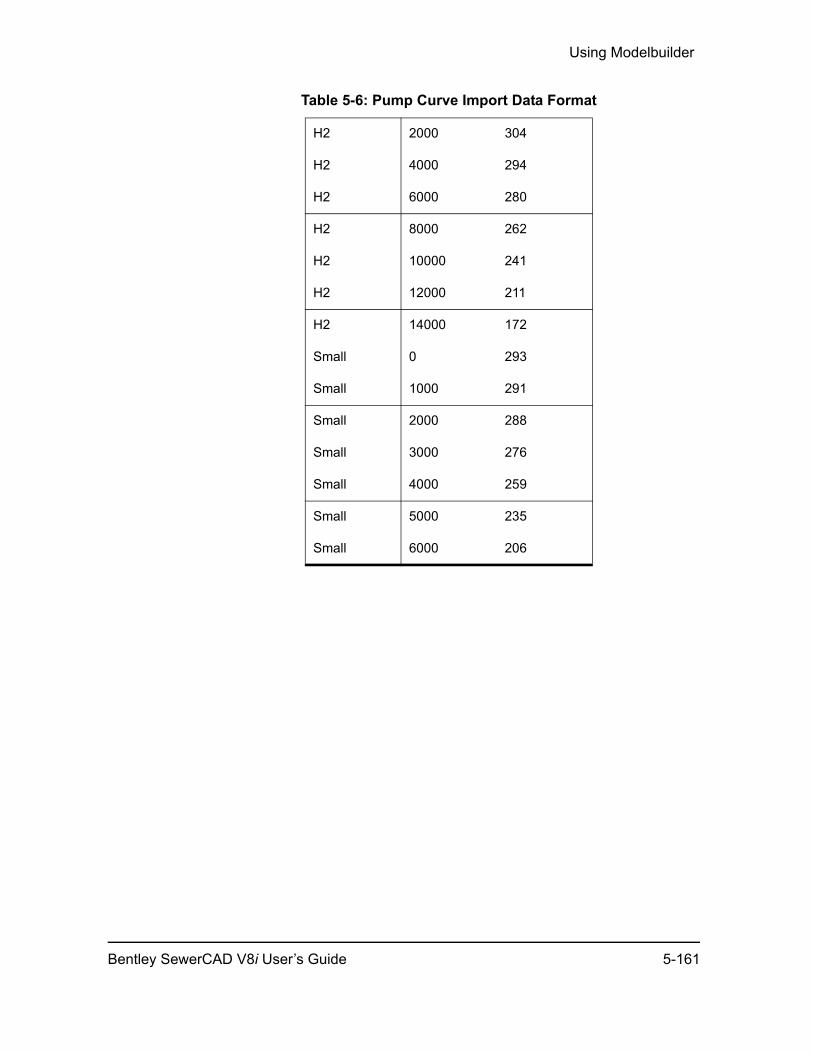
Using Modelbuilder
H2 2000 304
H2 4000 294
H2 6000 280
H2 8000 262
H2 10000 241
H2 12000 211
H2 14000 172
Small 0 293
Small 1000 291
Small 2000 288
Small 3000 276
Small 4000 259
Small 5000 235
Small 6000 206
Table 5-6: Pump Curve Import Data Format
Bentley SewerCAD V8i User’s Guide 5-161
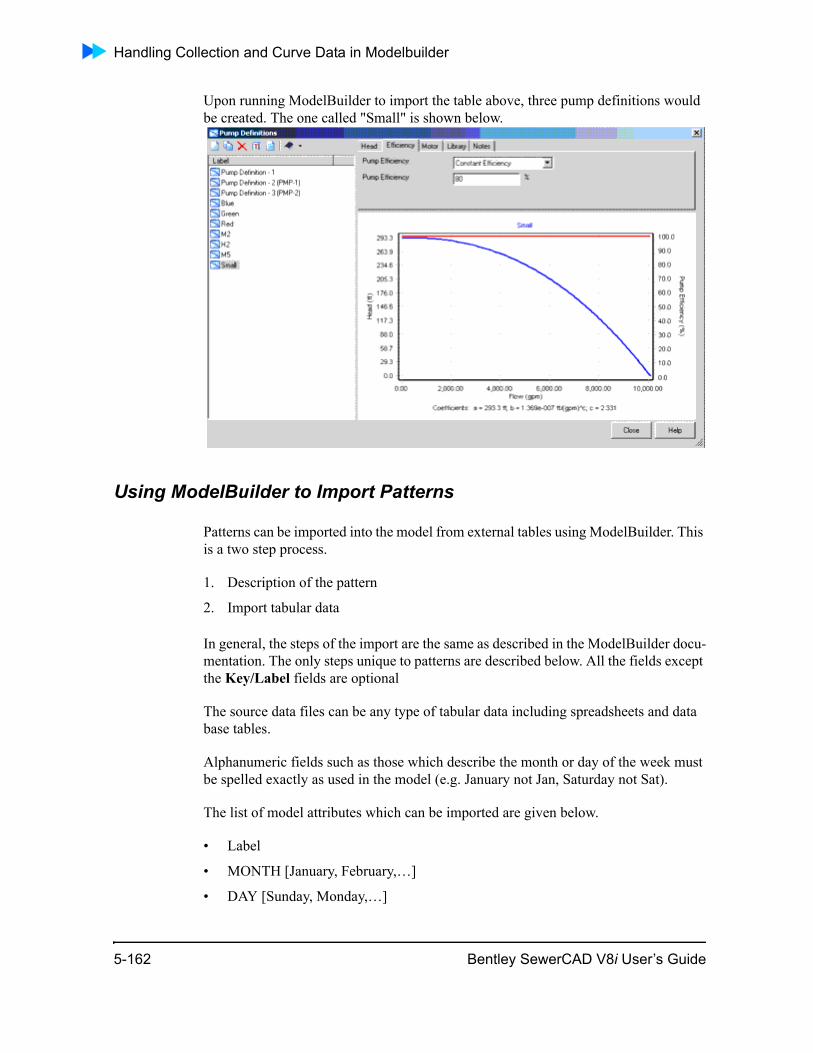
Handling Collection and Curve Data in Modelbuilder
Upon running ModelBuilder to import the table above, three pump definitions would be created. The one called "Small" is shown below.
Using ModelBuilder to Import Patterns
Patterns can be imported into the model from external tables using ModelBuilder. This is a two step process.
1. Description of the pattern
2. Import tabular data
In general, the steps of the import are the same as described in the ModelBuilder docu-mentation. The only steps unique to patterns are described below. All the fields except the Key/Label fields are optional
The source data files can be any type of tabular data including spreadsheets and data base tables.
Alphanumeric fields such as those which describe the month or day of the week must be spelled exactly as used in the model (e.g. January not Jan, Saturday not Sat).
The list of model attributes which can be imported are given below.
• Label
• MONTH [January, February,…]
• DAY [Sunday, Monday,…]
5-162 Bentley SewerCAD V8i User’s Guide
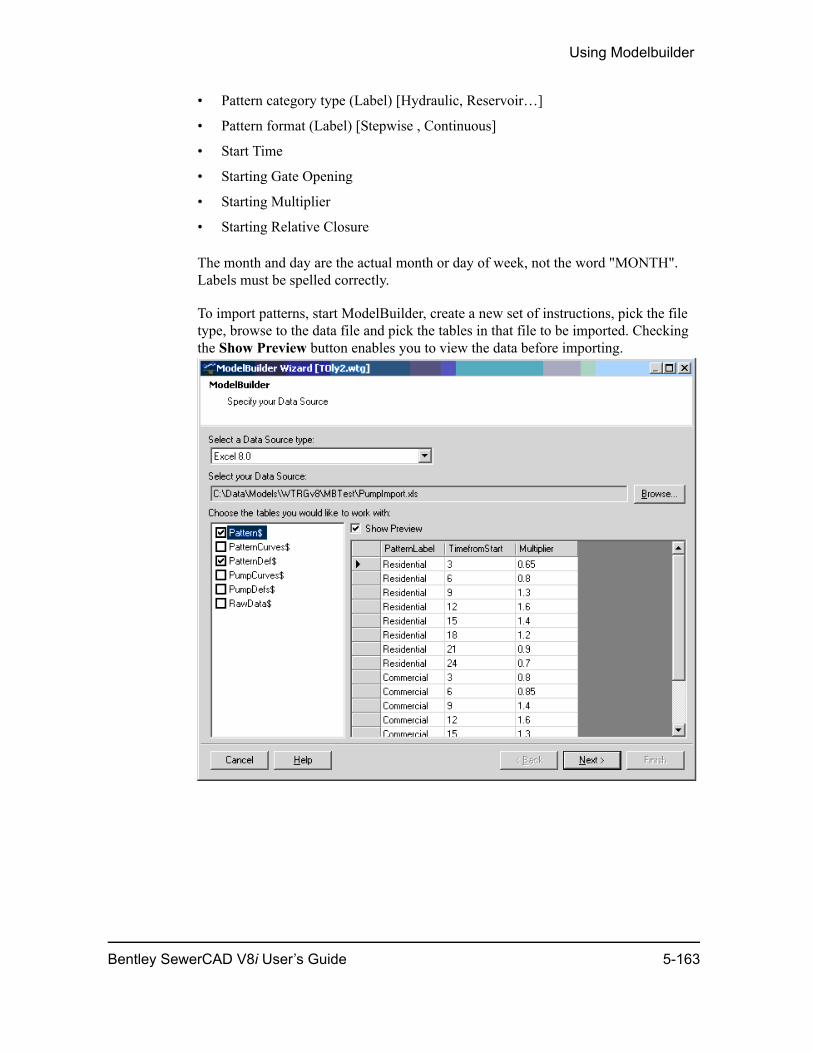
Using Modelbuilder
• Pattern category type (Label) [Hydraulic, Reservoir…]
• Pattern format (Label) [Stepwise , Continuous]
• Start Time
• Starting Gate Opening
• Starting Multiplier
• Starting Relative Closure
The month and day are the actual month or day of week, not the word "MONTH". Labels must be spelled correctly.
To import patterns, start ModelBuilder, create a new set of instructions, pick the file type, browse to the data file and pick the tables in that file to be imported. Checking the Show Preview button enables you to view the data before importing.
Bentley SewerCAD V8i User’s Guide 5-163
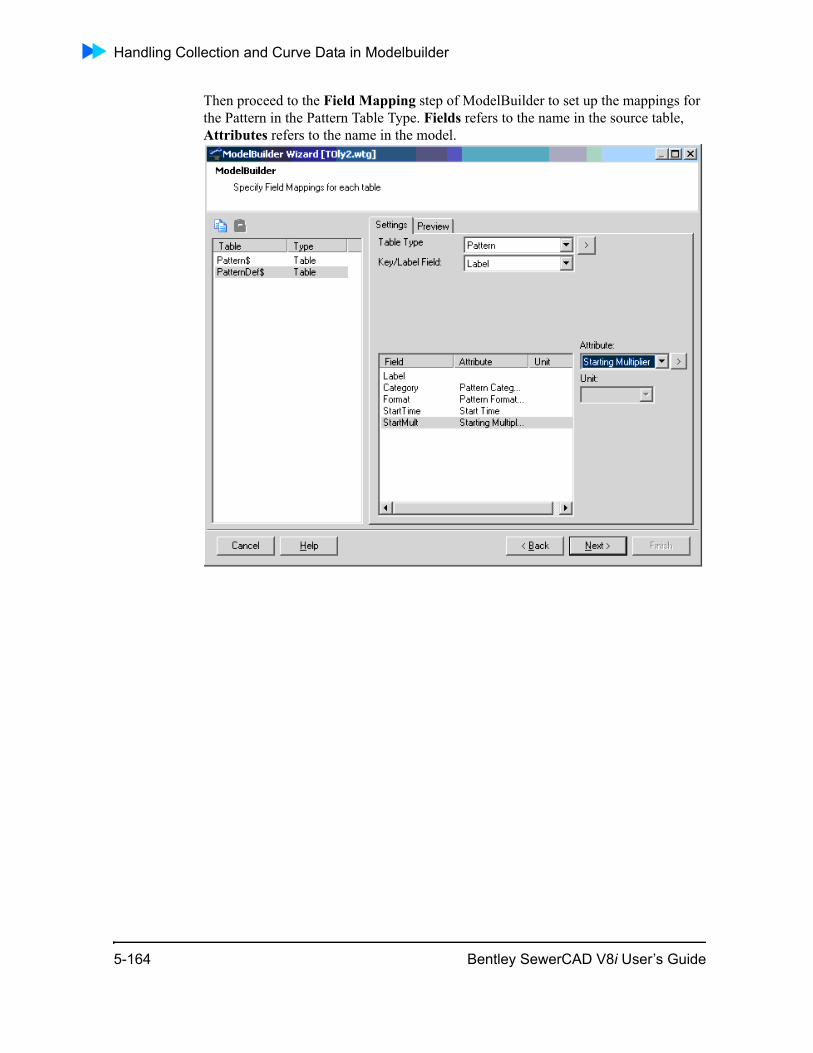
Handling Collection and Curve Data in Modelbuilder
Then proceed to the Field Mapping step of ModelBuilder to set up the mappings for the Pattern in the Pattern Table Type. Fields refers to the name in the source table, Attributes refers to the name in the model.
5-164 Bentley SewerCAD V8i User’s Guide
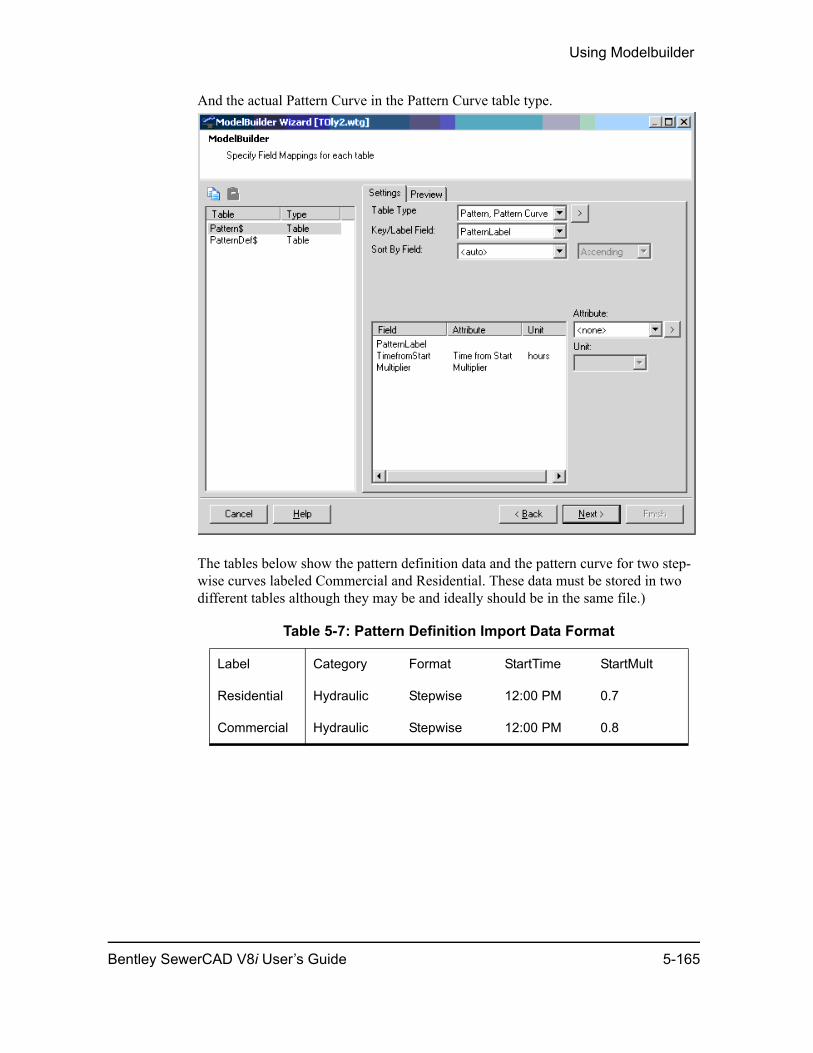
Using Modelbuilder
And the actual Pattern Curve in the Pattern Curve table type.
The tables below show the pattern definition data and the pattern curve for two step-wise curves labeled Commercial and Residential. These data must be stored in two different tables although they may be and ideally should be in the same file.)
Table 5-7: Pattern Definition Import Data Format
Label Category Format StartTime StartMult
Residential Hydraulic Stepwise 12:00 PM 0.7
Commercial Hydraulic Stepwise 12:00 PM 0.8
Bentley SewerCAD V8i User’s Guide 5-165
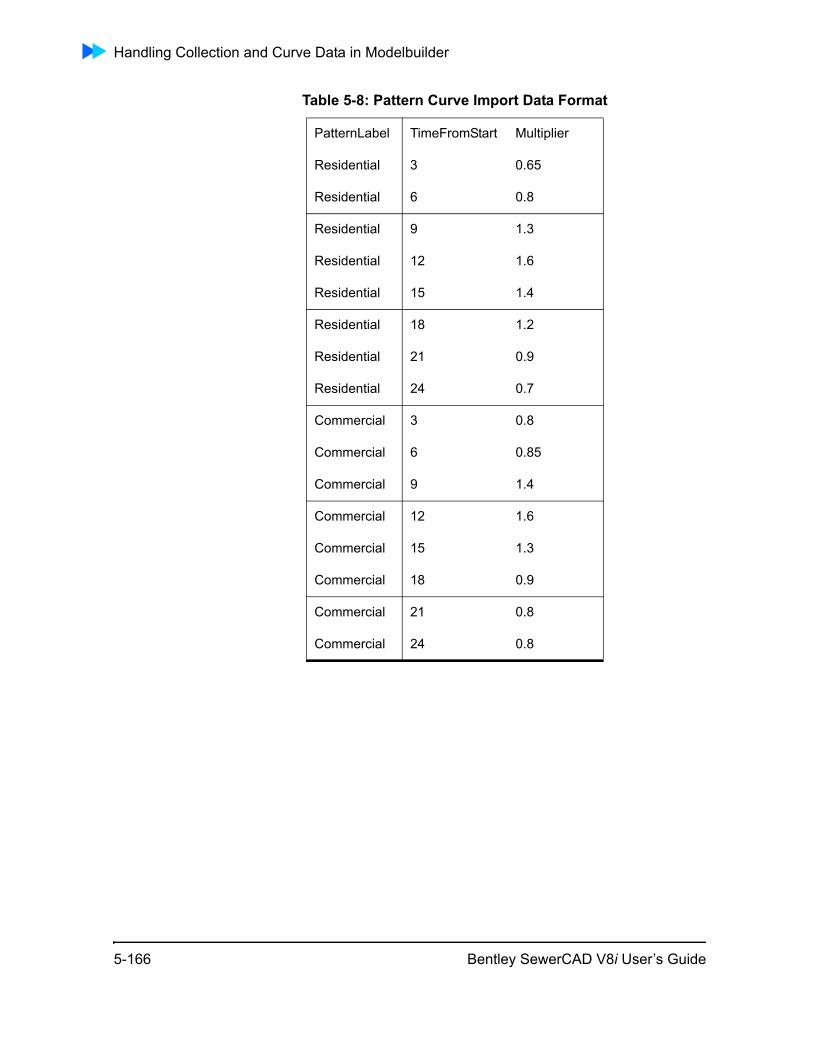
Handling Collection and Curve Data in Modelbuilder
Table 5-8: Pattern Curve Import Data Format
PatternLabel TimeFromStart Multiplier
Residential 3 0.65
Residential 6 0.8
Residential 9 1.3
Residential 12 1.6
Residential 15 1.4
Residential 18 1.2
Residential 21 0.9
Residential 24 0.7
Commercial 3 0.8
Commercial 6 0.85
Commercial 9 1.4
Commercial 12 1.6
Commercial 15 1.3
Commercial 18 0.9
Commercial 21 0.8
Commercial 24 0.8
5-166 Bentley SewerCAD V8i User’s Guide
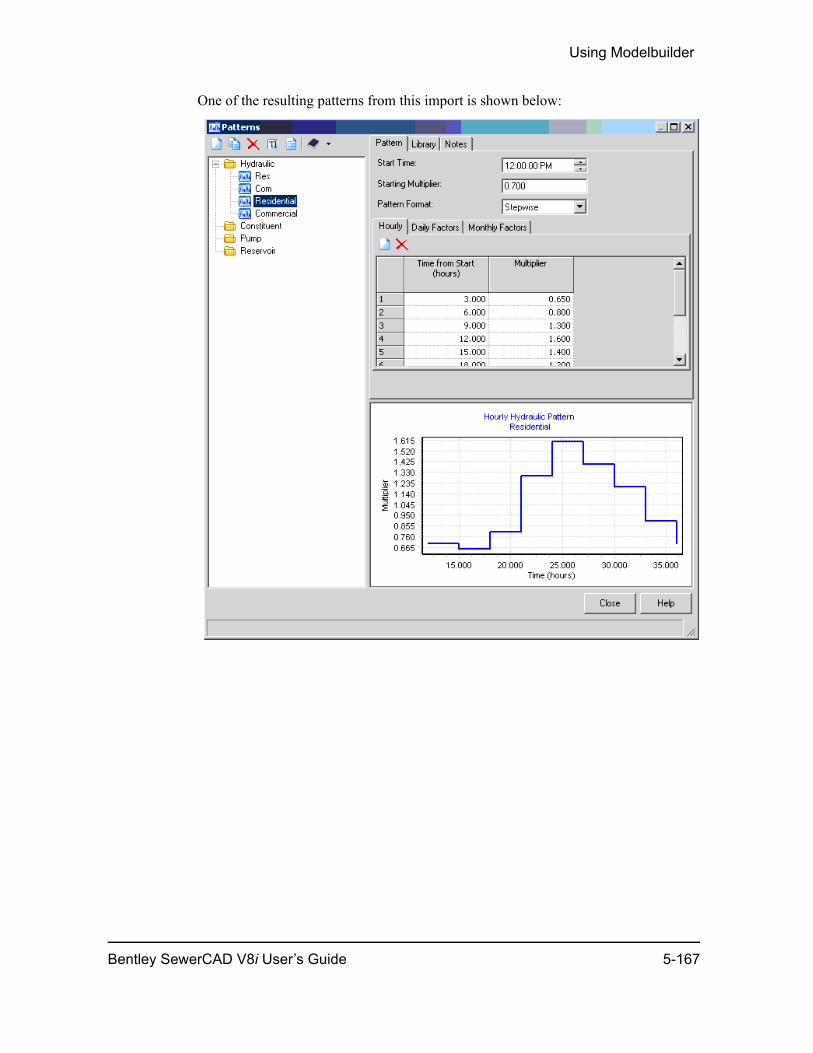
Using Modelbuilder
One of the resulting patterns from this import is shown below:
Bentley SewerCAD V8i User’s Guide 5-167

Handling Collection and Curve Data in Modelbuilder
5-168 Bentley SewerCAD V8i User’s Guide
6
ChapterCreating Your Model
Click one of the following links to learn how to create your model using Bentley SewerCAD V8i’ layout and editing tools:
• “Elements and Element Attributes” on page 6-169
• “Adding Elements to Your Model” on page 6-193
• “Connecting Elements” on page 6-194
• “Manipulating Elements” on page 6-195
• “Editing Element Attributes” on page 6-199
• “Changing the Drawing View” on page 6-223
• “Using Selection Sets” on page 6-227
• “Network Navigator” on page 6-236
• ”Using Prototypes’
• “Engineering Libraries” on page 6-241
• “Adding Hyperlinks to Elements” on page 6-251
• “Using Queries” on page 6-254
• “User Data Extensions” on page 6-280
Elements and Element AttributesYou use the Layout toolbar to add elements to your model and edit the attributes of elements using the Property Editor, one of the dockable managers in Bentley SewerCAD V8i’ stand-alone editor.
To learn about the different elements available in Bentley SewerCAD V8i, click one of the following links:
• “Link Elements” on page 6-170
• “Manholes” on page 6-175
Bentley SewerCAD V8i User’s Guide 6-169
Elements and Element Attributes
• “Transitions” on page 6-178
• “Pumps” on page 6-182
• “Outfalls” on page 6-180
• “Pressure Junctions” on page 6-182
• “Pumps” on page 6-182
• “Variable Speed Pump Batteries” on page 6-190
• “Air Valves” on page 6-191
• “Other Tools” on page 6-192
Link Elements
Link elements connect the other elements to form the sewer network. The link elements are the conveyance elements that carry flow through the network to its even-tual discharge point at an outlet. You can add any of the following link elements to your model, depending on the link element’s location within the network:
• Pressure pipes
• Conduits
When you click the Layout tool on the Layout toolbar, you select the type of link element to add (pressure pipe or conduit), then select an element. You can place multiple elements with different kinds of connections using the Layout tool.
Entering Additional Data to Link Elements
There are several dialog boxes that are available from the Property Editors that let you enter additional data for link elements.
• “Adding a Minor Loss Collection to a Pressure Pipe” on page 6-171
• “Defining the Geometry of a Link Element” on page 6-172
• “Defining the Cross-Sectional Shape of a Link Element” on page 6-174
Layout tool
6-170 Bentley SewerCAD V8i User’s Guide
Creating Your Model
Adding a Minor Loss Collection to a Pressure Pipe
Pressure pipes can have an unlimited number of minor loss elements associated with them. SewerCAD V8i provides an easy-to-use table for editing these minor loss collections in the Minor Loss Collection dialog box.
Note: For more information on minor losses, see “Minor Losses” on page 13-660.
To add a minor loss collection to a pressure pipe:
1. Click a pressure pipe in your model to display the Property Editor, or right-click a pressure pipe and select Properties from the shortcut menu.
2. In the Physical: Minor Losses section of the Property Editor, click the Ellipses (...) button next to the Minor Loss Coefficient field.
3. In the Minor Loss Collection dialog box, each row in the table represents a single minor loss type and its associated headloss coefficient. For each row in the table, perform the following steps:
a. Type the number of minor losses of the same type to be added to the composite minor loss for the pipe in the Quantity column, then press the Tab key to move to the Minor Loss column.
b. Click the Ellipses (...) button in the Minor Loss column to display the Minor Loss Libraries in the Engineering Libraries.
c. Click the plus signs to expand the Minor Loss Libraries, then select the desired minor loss type and click the Select button. The minor loss type and its associated headloss coefficient appears in the table in the Minor Loss Collection dialog box. Note that the Headloss Coefficient column in the table is not editable.
Note: You can edit the values of a minor loss type in the Engineering Libraries in the Editor pane.
4. When you are finished adding minor losses to the table, click Close. The composite minor loss coefficient for the minor loss collection appears in the Prop-erty Editor.
5. Perform the following optional steps:
– To delete a row from the table, select the row label then click Delete.
– To view a report on the minor loss collection, click Report.
6. You can override the headloss coefficient for the minor loss collection by typing a custom value in the Minor Loss Coefficient field of the Property Editor.
Bentley SewerCAD V8i User’s Guide 6-171
Elements and Element Attributes
Minor Loss Collection Dialog Box
The Minor Loss Collection dialog box contains buttons and a minor loss table. The dialog box contains the following controls:
The table contains the following columns:
Diversion Rating Curve Dialog Box
This dialog allows you to define the rating curve using Upstream Flow vs. Diverted Flow points. The rating curve determines the flow into the associated conduit. At each upstream flow point, you define how much of the flow is diverted.
Defining the Geometry of a Link Element
You define the geometry of a link element by entering the location and angle of bends for the selected link element. You enter X vs. Y points that plot the shape of the polyline that represents the element in the Polyline Vertices dialog box .
New This button creates a new row in the table.
Delete This button deletes the currently highlighted row from the table.
Report Opens a print preview window containing a report that details the input data for this dialog box.
Column Description
Quantity The number of minor losses of the same type to be added to the composite minor loss for the pipe.
Minor Loss The type of minor loss element. Clicking the Ellipses button next to this field displays the Minor Loss Engineering Libraries, where you select an existing minor loss type to be included in your minor loss collection.
Headloss Coefficient The headloss coefficient for a single minor loss element of the specified type.
6-172 Bentley SewerCAD V8i User’s Guide
Creating Your Model
To define the geometry of a link element:
1. Click a link element in your model to display the Property Editor, or right-click a link element and select Properties from the shortcut menu.
2. In the Geometry section of the Property Editor, click the Ellipses (...) button next to the Geometry field.
3. In the Polyline Vertices dialog box, click the New button to add a new row to the table.
4. Type values for X and Y points for each row in the table.
5. To remove rows from the table, click the Delete button.
6. Click OK.
Polyline Vertices Dialog Box
This dialog box contains the X vs. Y table that allows you to define any number of points that plot the shape of the polyline representing the selected link element.
The dialog box contains the following controls:
Irregular Channel Editor Dialog Box
The Irregular Channel editor dialog box contains buttons, a Station vs Depth table, and a diagram window that plots the station-elevation curve defined by the points in the table. The dialog box contains the following controls:
New This button creates a new row in the table.
Delete This button deletes the currently highlighted row from the table.
Bentley SewerCAD V8i User’s Guide 6-173
Elements and Element Attributes
The table contains the following columns:
Defining the Cross-Sectional Shape of a Link Element
You define the cross-sectional shapes of link elements in their respective Property Editor as follows:
• Define the cross-sectional shape of a conduit section by entering data in the Phys-ical section of the element’s Property Editor.
• Define the circular shape of a pressure pipe by entering data in the Physical section of the element’s Property Editor.
You access the curve dialog boxes in the selected link element’s Property Editor.
New This button creates a new row in the Station vs Depth table.
Delete This button deletes the currently highlighted row from the Station vs Depth table.
Report Opens a print preview window containing a report that details the input data for this dialog box.
Help Opens the online help.
Column Description
Station This field allows you to define the cross-sectional distance at the current curve point. You can enter these in any order that defines the channel (e.g., from left-to-right, from right-to-left, with an upstream or downstream perspective).
Depth This field allows you to define the depth at the corresponding station for an irregular channel. The depth value is relative to the invert of the channel (a Depth value of 1.0 ft will be 1.0 ft above the invert, a Depth value of -1.0 ft will be 1.0 ft below the invert). This value can be a negative number.
6-174 Bentley SewerCAD V8i User’s Guide
Creating Your Model
Sections Results Dialog Box
The Section Results dialog box shows the calculated flow variables at the start, middle and end of a pipe, conduit, or channel section. You can view the data but you cannot edit it while in the dialog.
The dialog box contains a table displaying the section results and the following control:
The table displays the following section results:
• Section Distance
• Section Velocity
• Section Flow
• Section Hydraulic Grade
• Section Depth
• Section Flow-Width
• Section Flow-Area
• Section Is Overflowing?
• Section Froude Number
To open this dialog box, go to the Results section of the Property Editor for a pipe, conduit, or a channel after the model has been calculated. Then click the Ellipsis (…) button in the Section Results field.
Manholes
Manholes are placed in a sewer system to provide access for inspection, maintenance, and emergency service. Manholes should be placed at sewer junctions (i.e., tees, wyes, and crosses), upstream terminal ends of sewers, and locations where there is a change in sewer grade or direction. Manholes are locations where loads enter the gravity portion of the sewer system.
Report Opens a print preview window containing a report of the sections results.
Manhole element
Bentley SewerCAD V8i User’s Guide 6-175
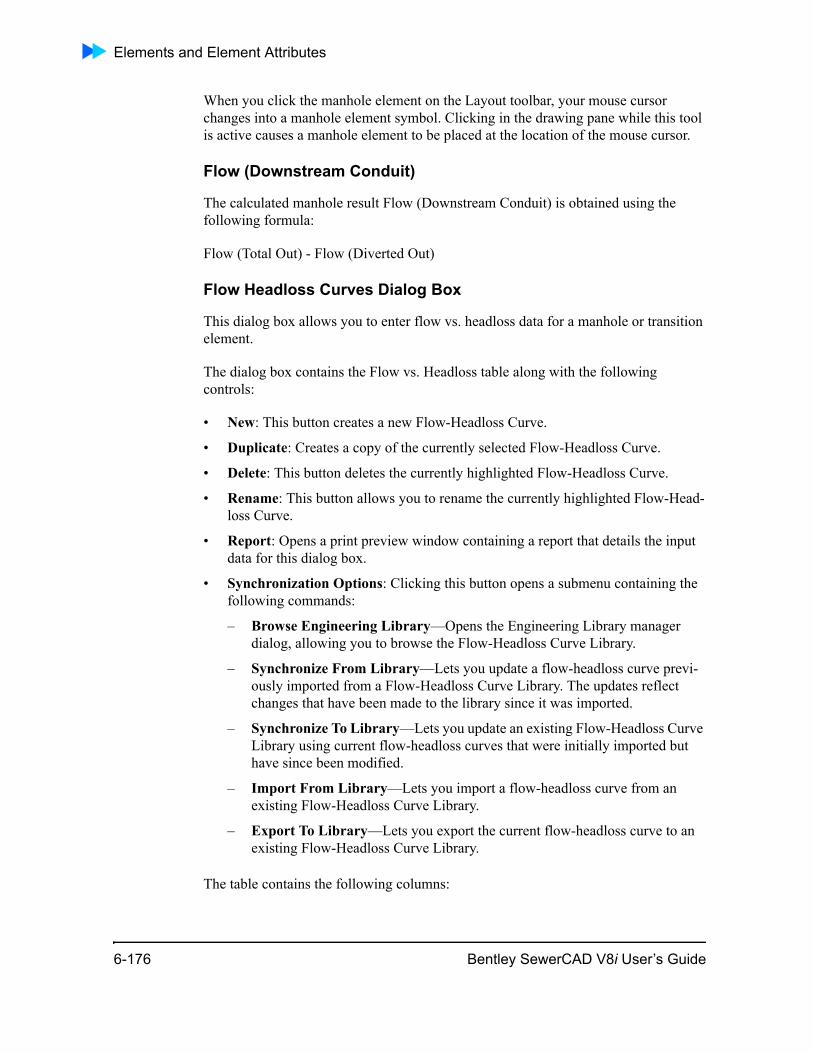
Elements and Element Attributes
When you click the manhole element on the Layout toolbar, your mouse cursor changes into a manhole element symbol. Clicking in the drawing pane while this tool is active causes a manhole element to be placed at the location of the mouse cursor.
Flow (Downstream Conduit)
The calculated manhole result Flow (Downstream Conduit) is obtained using the following formula:
Flow (Total Out) - Flow (Diverted Out)
Flow Headloss Curves Dialog Box
This dialog box allows you to enter flow vs. headloss data for a manhole or transition element.
The dialog box contains the Flow vs. Headloss table along with the following controls:
• New: This button creates a new Flow-Headloss Curve.
• Duplicate: Creates a copy of the currently selected Flow-Headloss Curve.
• Delete: This button deletes the currently highlighted Flow-Headloss Curve.
• Rename: This button allows you to rename the currently highlighted Flow-Head-loss Curve.
• Report: Opens a print preview window containing a report that details the input data for this dialog box.
• Synchronization Options: Clicking this button opens a submenu containing the following commands:
– Browse Engineering Library—Opens the Engineering Library manager dialog, allowing you to browse the Flow-Headloss Curve Library.
– Synchronize From Library—Lets you update a flow-headloss curve previ-ously imported from a Flow-Headloss Curve Library. The updates reflect changes that have been made to the library since it was imported.
– Synchronize To Library—Lets you update an existing Flow-Headloss Curve Library using current flow-headloss curves that were initially imported but have since been modified.
– Import From Library—Lets you import a flow-headloss curve from an existing Flow-Headloss Curve Library.
– Export To Library—Lets you export the current flow-headloss curve to an existing Flow-Headloss Curve Library.
The table contains the following columns:
6-176 Bentley SewerCAD V8i User’s Guide
Creating Your Model
• Flow: This field allows you to define the flow at the current curve point.
• Headloss: This field allows you to define the headloss for the current curve point.
The tab section is used to define the settings for the flow-headloss curve that is currently highlighted in the flow-headloss curve list pane. The following controls are available:
To assign a Flow-Headloss curve to a node element:
1. Double-click the node element in your model to display the Property Editor, or right-click a node and select Properties from the shortcut menu.
2. In the Physical (Structure Losses) section of the Property Editor, select Flow-Headloss Curve as the Headloss Method. The Flow-Headloss Curve field becomes available.
3. Click the <Select...> list item in the Flow-Headloss Curve field.
4. In the Flow-Headloss Curves Dialog Box, all of the Flow-Headloss Curves that have been created for the model are listed in the left pane. Create a new Curve by clicking the New button.
Data Tab This tab consists of input data fields that allow you to define the points that make up the flow-headloss curve.
Flow Enter the flow data point.
Headloss Headloss at the associated flow data point value.
Library Tab This tab displays information about the flow-headloss curve that is currently highlighted in the flow-headloss curve list pane. If the curve is derived from an engineering library, the synchronization details can be found here. If the curve was created manually for this project, the synchronization details will display the message Orphan (local), indicating that the curve was not derived from a library entry.
Notes Tab This tab contains a text field that is used to type descriptive notes that will be associated with the flow-headloss curve that is currently highlighted in the flow-headloss curve list pane.
Bentley SewerCAD V8i User’s Guide 6-177
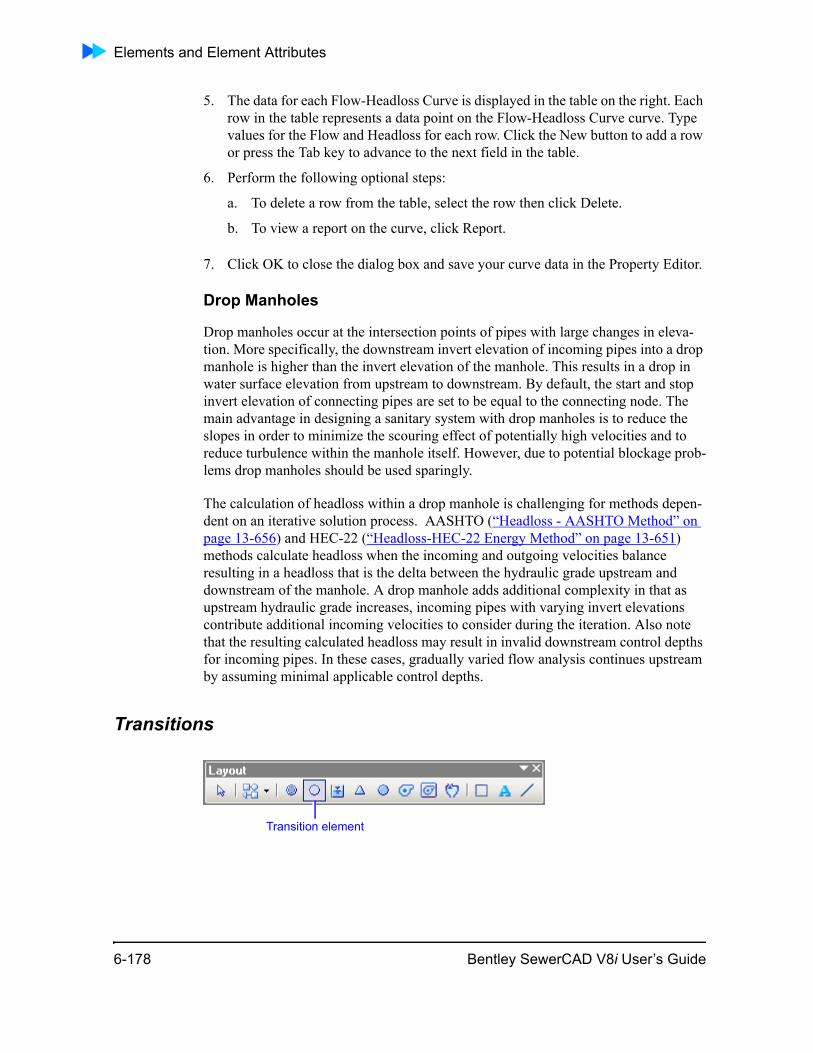
Elements and Element Attributes
5. The data for each Flow-Headloss Curve is displayed in the table on the right. Each row in the table represents a data point on the Flow-Headloss Curve curve. Type values for the Flow and Headloss for each row. Click the New button to add a row or press the Tab key to advance to the next field in the table.
6. Perform the following optional steps:
a. To delete a row from the table, select the row then click Delete.
b. To view a report on the curve, click Report.
7. Click OK to close the dialog box and save your curve data in the Property Editor.
Drop Manholes
Drop manholes occur at the intersection points of pipes with large changes in eleva-tion. More specifically, the downstream invert elevation of incoming pipes into a drop manhole is higher than the invert elevation of the manhole. This results in a drop in water surface elevation from upstream to downstream. By default, the start and stop invert elevation of connecting pipes are set to be equal to the connecting node. The main advantage in designing a sanitary system with drop manholes is to reduce the slopes in order to minimize the scouring effect of potentially high velocities and to reduce turbulence within the manhole itself. However, due to potential blockage prob-lems drop manholes should be used sparingly.
The calculation of headloss within a drop manhole is challenging for methods depen-dent on an iterative solution process. AASHTO (“Headloss - AASHTO Method” on page 13-656) and HEC-22 (“Headloss-HEC-22 Energy Method” on page 13-651) methods calculate headloss when the incoming and outgoing velocities balance resulting in a headloss that is the delta between the hydraulic grade upstream and downstream of the manhole. A drop manhole adds additional complexity in that as upstream hydraulic grade increases, incoming pipes with varying invert elevations contribute additional incoming velocities to consider during the iteration. Also note that the resulting calculated headloss may result in invalid downstream control depths for incoming pipes. In these cases, gradually varied flow analysis continues upstream by assuming minimal applicable control depths.
Transitions
Transition element
6-178 Bentley SewerCAD V8i User’s Guide
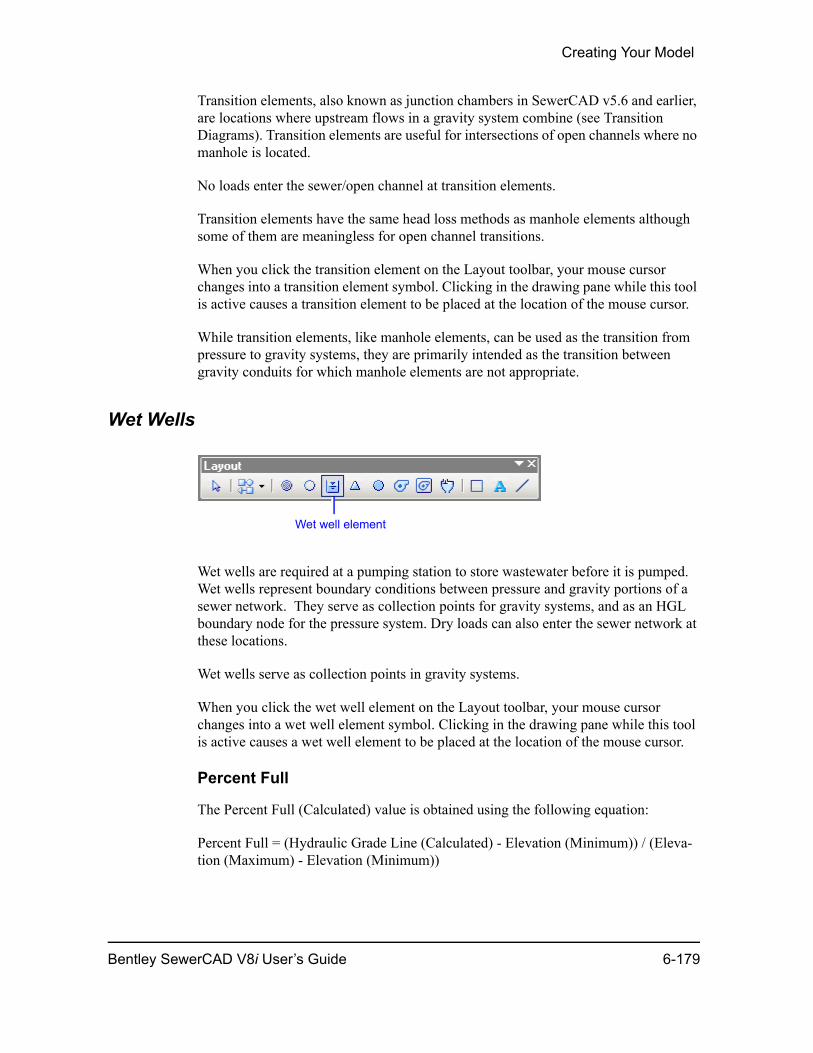
Creating Your Model
Transition elements, also known as junction chambers in SewerCAD v5.6 and earlier, are locations where upstream flows in a gravity system combine (see Transition Diagrams). Transition elements are useful for intersections of open channels where no manhole is located.
No loads enter the sewer/open channel at transition elements.
Transition elements have the same head loss methods as manhole elements although some of them are meaningless for open channel transitions.
When you click the transition element on the Layout toolbar, your mouse cursor changes into a transition element symbol. Clicking in the drawing pane while this tool is active causes a transition element to be placed at the location of the mouse cursor.
While transition elements, like manhole elements, can be used as the transition from pressure to gravity systems, they are primarily intended as the transition between gravity conduits for which manhole elements are not appropriate.
Wet Wells
Wet wells are required at a pumping station to store wastewater before it is pumped. Wet wells represent boundary conditions between pressure and gravity portions of a sewer network. They serve as collection points for gravity systems, and as an HGL boundary node for the pressure system. Dry loads can also enter the sewer network at these locations.
Wet wells serve as collection points in gravity systems.
When you click the wet well element on the Layout toolbar, your mouse cursor changes into a wet well element symbol. Clicking in the drawing pane while this tool is active causes a wet well element to be placed at the location of the mouse cursor.
Percent Full
The Percent Full (Calculated) value is obtained using the following equation:
Percent Full = (Hydraulic Grade Line (Calculated) - Elevation (Minimum)) / (Eleva-tion (Maximum) - Elevation (Minimum))
Wet well element
Bentley SewerCAD V8i User’s Guide 6-179
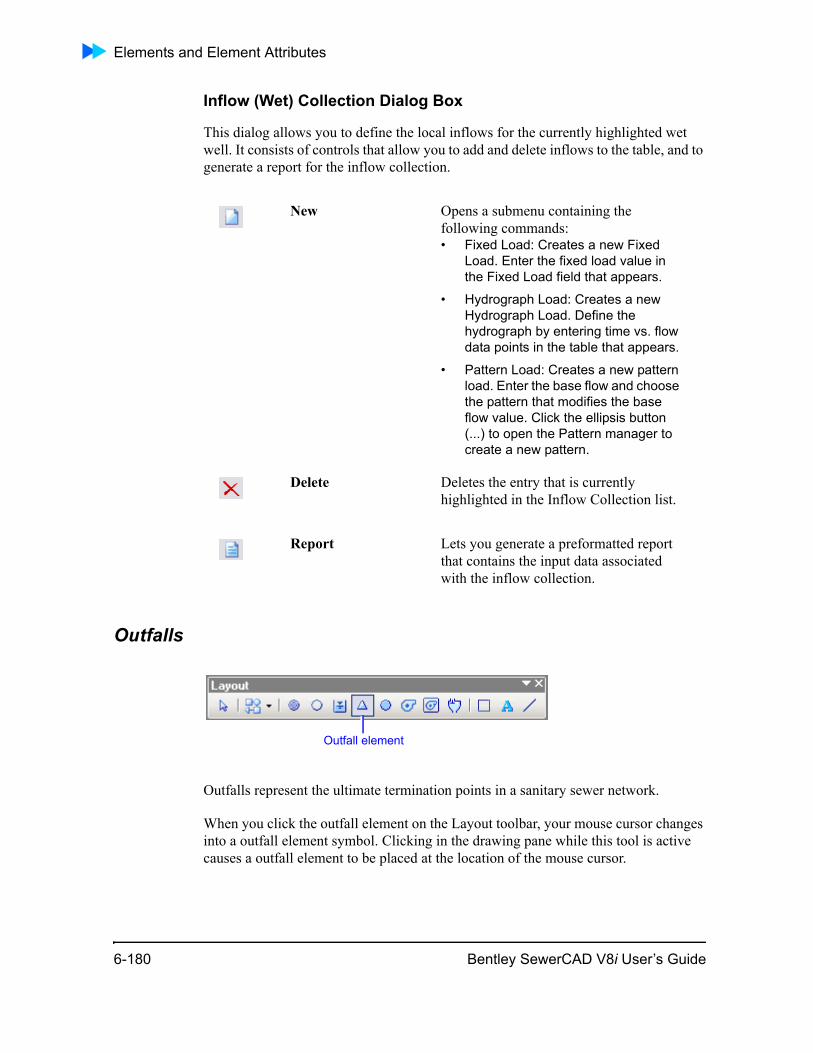
Elements and Element Attributes
Inflow (Wet) Collection Dialog Box
This dialog allows you to define the local inflows for the currently highlighted wet well. It consists of controls that allow you to add and delete inflows to the table, and to generate a report for the inflow collection.
Outfalls
Outfalls represent the ultimate termination points in a sanitary sewer network.
When you click the outfall element on the Layout toolbar, your mouse cursor changes into a outfall element symbol. Clicking in the drawing pane while this tool is active causes a outfall element to be placed at the location of the mouse cursor.
New Opens a submenu containing the following commands:• Fixed Load: Creates a new Fixed
Load. Enter the fixed load value in the Fixed Load field that appears.
• Hydrograph Load: Creates a new Hydrograph Load. Define the hydrograph by entering time vs. flow data points in the table that appears.
• Pattern Load: Creates a new pattern load. Enter the base flow and choose the pattern that modifies the base flow value. Click the ellipsis button (...) to open the Pattern manager to create a new pattern.
Delete Deletes the entry that is currently highlighted in the Inflow Collection list.
Report Lets you generate a preformatted report that contains the input data associated with the inflow collection.
Outfall element
6-180 Bentley SewerCAD V8i User’s Guide
Creating Your Model
Adding Elevation vs. Flow Data to an Outfall
You can add an Elevation-Flow (E-Q-T) curve to an outfall in SewerCAD V8i.
To add an Elevation vs. Flow (E-Q-T) curve to an outfall:
1. Click an outfall in your model to display the Property Editor, or right-click an outfall and select Properties from the shortcut menu.
2. In the Boundary Condition section of the Property Editor, select Elevation-Flow Curve in the Boundary Condition Type field. The Elevation-Flow Curve field becomes available.
3. Click the Ellipses (...) button next to the Elevation-Flow Curve field.
4. In the Elevation-Flow Curve dialog box, each row in the table represents a point on the Elevation-Flow curve. Type values for Elevation and Outlet Flow for each row. Click the New button to add a row or press the Tab key to advance to the next field in the table.
5. Perform the following optional steps:
– To delete a row from the table, select the row then click Delete.
– To view a report on the curve, click Report.
– To view a plot of the curve, click Graph.
6. Click OK to close the dialog box and save your curve data in the Property Editor.
Elevation-Flow Curve Dialog Box
The dialog box contains the elevation vs. flow table and the following buttons:
The table contains the following columns:
New This button creates a new row in the E-Q-TW curve table.
Delete This button deletes the currently highlighted row from the E-Q-TW curve table.
Report This button opens a print preview window containing a report that details the input data for this dialog box.
Graph This button opens a graph window plotting the elevation-volume curve defined by the points in the table.
Bentley SewerCAD V8i User’s Guide 6-181
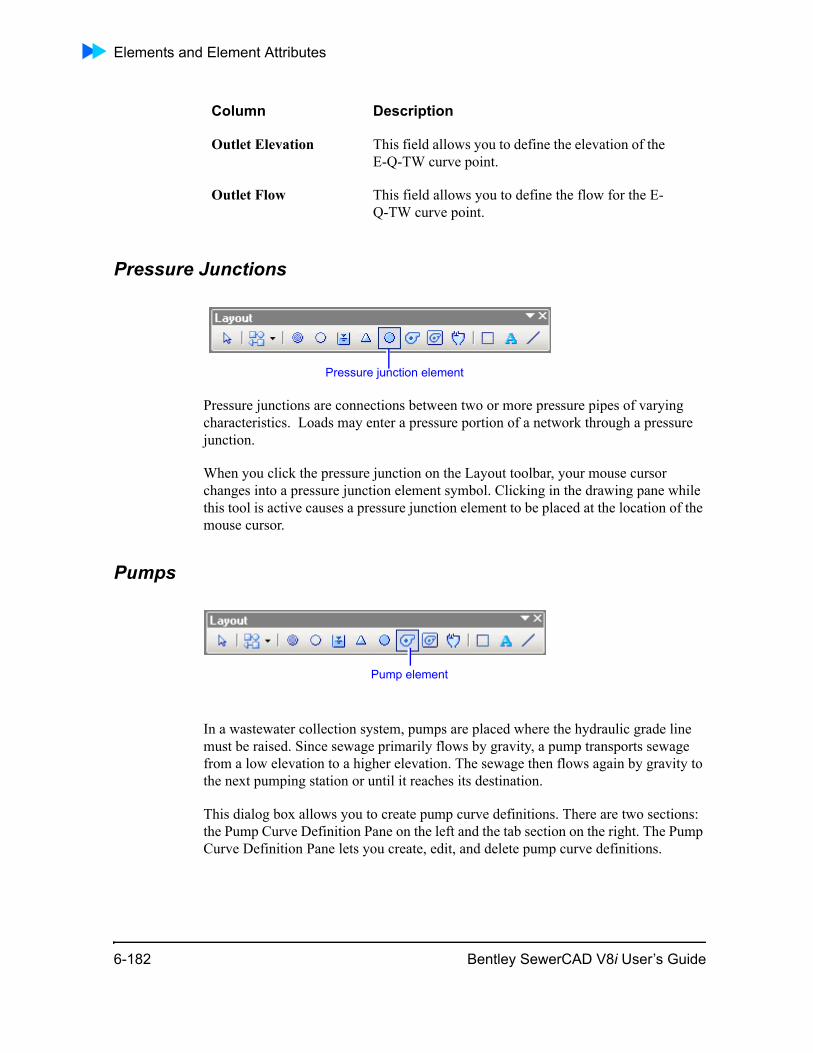
Elements and Element Attributes
Pressure Junctions
Pressure junctions are connections between two or more pressure pipes of varying characteristics. Loads may enter a pressure portion of a network through a pressure junction.
When you click the pressure junction on the Layout toolbar, your mouse cursor changes into a pressure junction element symbol. Clicking in the drawing pane while this tool is active causes a pressure junction element to be placed at the location of the mouse cursor.
Pumps
In a wastewater collection system, pumps are placed where the hydraulic grade line must be raised. Since sewage primarily flows by gravity, a pump transports sewage from a low elevation to a higher elevation. The sewage then flows again by gravity to the next pumping station or until it reaches its destination.
This dialog box allows you to create pump curve definitions. There are two sections: the Pump Curve Definition Pane on the left and the tab section on the right. The Pump Curve Definition Pane lets you create, edit, and delete pump curve definitions.
Column Description
Outlet Elevation This field allows you to define the elevation of the E-Q-TW curve point.
Outlet Flow This field allows you to define the flow for the E-Q-TW curve point.
Pressure junction element
Pump element
6-182 Bentley SewerCAD V8i User’s Guide
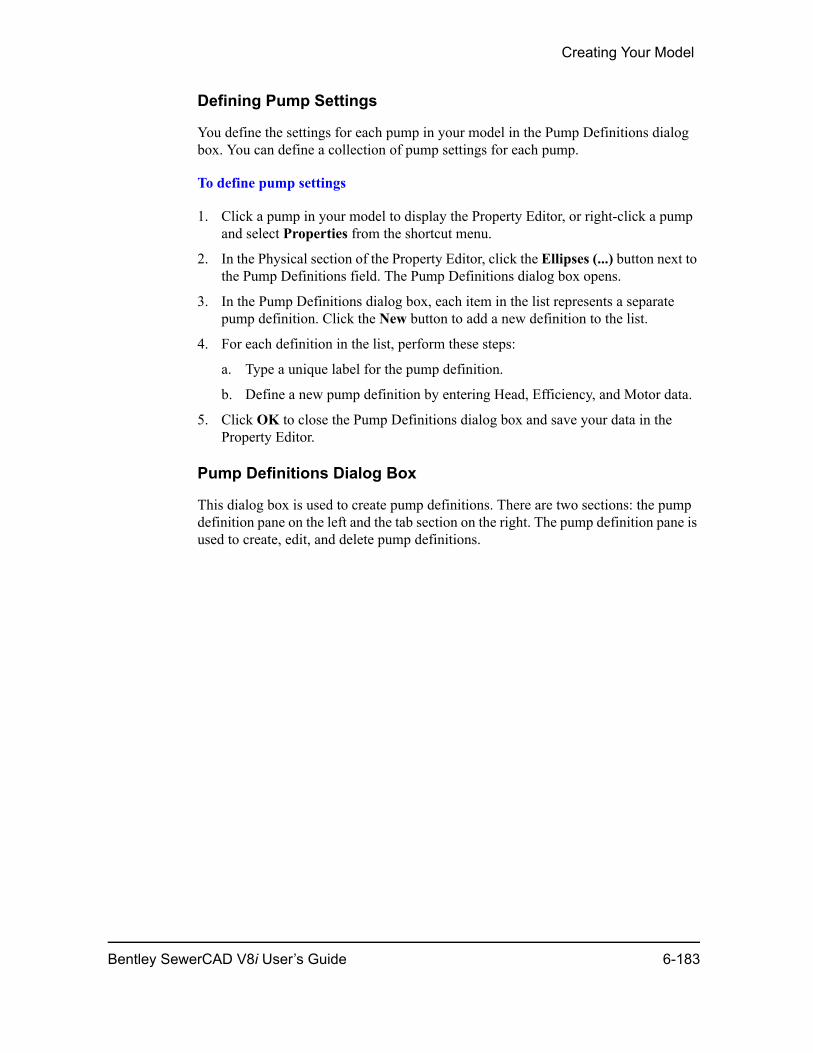
Creating Your Model
Defining Pump Settings
You define the settings for each pump in your model in the Pump Definitions dialog box. You can define a collection of pump settings for each pump.
To define pump settings
1. Click a pump in your model to display the Property Editor, or right-click a pump and select Properties from the shortcut menu.
2. In the Physical section of the Property Editor, click the Ellipses (...) button next to the Pump Definitions field. The Pump Definitions dialog box opens.
3. In the Pump Definitions dialog box, each item in the list represents a separate pump definition. Click the New button to add a new definition to the list.
4. For each definition in the list, perform these steps:
a. Type a unique label for the pump definition.
b. Define a new pump definition by entering Head, Efficiency, and Motor data.
5. Click OK to close the Pump Definitions dialog box and save your data in the Property Editor.
Pump Definitions Dialog Box
This dialog box is used to create pump definitions. There are two sections: the pump definition pane on the left and the tab section on the right. The pump definition pane is used to create, edit, and delete pump definitions.
Bentley SewerCAD V8i User’s Guide 6-183
Elements and Element Attributes
The following controls are available in the pump definitions dialog box:
The tab section includes the following controls:
New Creates a new entry in the pump definition Pane.
Duplicate Creates a copy of the currently highlighted pump definition.
Delete Deletes the currently highlighted entry in the pump definition Pane.
Rename Renames the currently highlighted entry in the pump definition Pane.
Report Generates a pre-formatted report that contains the input data associated with the currently highlighted entry in the pump definition Pane.
Synchronization Options
Clicking this button opens a submenu containing the following commands:
• Browse Engineering Library—Opens the Engineering Library manager dialog, allowing you to browse the Pump Defini-tion Libraries.
• Synchronize From Library—Updates a set of pump definition entries previously imported from a Pump Definition Engi-neering Library. The updates reflect changes that have been made to the library since it was imported.
• Synchronize To Library—Updates an existing Pump Definition Engineering Library using current pump definition entries that were initially imported but have since been modified.
• Import From Library—Imports pump definition entries from an existing Pump Definition Engineering Library.
• Export To Library—Exports the current pump definition entries to an existing Pump Definition Engineering Library.
6-184 Bentley SewerCAD V8i User’s Guide
Creating Your Model
Head Tab This tab consists of input data fields that allow you to define the pump head curve. The specific fields vary depending on which type of pump is selected in the Pump Definition type field.
Pump Definition Type
A pump is an element that adds head to the system as water passes through it. This software can currently be used to model eight different pump types:
• Constant Power—When selecting a Constant Power pump, the following attribute must be defined:
• Pump Power—Represents the water horsepower, or horsepower that is actually transferred from the pump to the water. Depending on the pump's effi-ciency, the actual power consumed (brake horse-power) may vary.
• Design Point (One-Point)—When selecting a Design Point pump, the following flow vs. head points must be defined:
• Shutoff—Point at which the pump will have zero discharge. It is typically the maximum head point on a pump curve. This value is automatically calcu-lated for Design Point pumps.
• Design—Point at which the pump was originally intended to operate. It is typically the best efficiency point (BEP) of the pump. At discharges above or below this point, the pump is not operating under optimum conditions.
• Max Operating—Highest discharge for which the pump is actually intended to run. At discharges above this point, the pump may behave unpredict-ably, or its performance may decline rapidly. This value is automatically calculated for Design Point pumps.
• Standard (Three-Point)—When selecting a Standard Three-Point pump, the following flow vs. head points must be defined:
• Shutoff—Point at which the pump will have zero discharge. It is typically the maximum head point on a pump curve.
• Design—Point at which the pump was originally intended to operate. It is typically the best efficiency point (BEP) of the pump. At discharges above or below this point, the pump is not operating under optimum conditions.
• Max Operating—Highest discharge for which the pump is actually intended to run. At discharges above this point, the pump may behave unpredict-ably, or its performance may decline rapidly.
Bentley SewerCAD V8i User’s Guide 6-185
Elements and Element Attributes
Pump Definition Type (cont’d)
• Standard Extended—When selecting a Standard Extended pump, the following flow vs. head points must be defined:
• Shutoff—Point at which the pump will have zero discharge. It is typically the maximum head point on a pump curve.
• Design—Point at which the pump was originally intended to operate. It is typically the best efficiency point (BEP) of the pump. At discharges above or below this point, the pump is not operating under optimum conditions.
• Max Operating—Highest discharge for which the pump is actually intended to run. At discharges above this point, the pump may behave unpredict-ably, or its performance may decline rapidly.
• Max Extended—Absolute maximum discharge at which the pump can operate, adding zero head to the system. This value may be computed by the program, or entered as a custom extended point. This value is automatically calculated for Standard Extended pumps.
• Custom Extended—When selecting a Custom Extended pump, the following attributes must be defined:
• Shutoff—Point at which the pump will have zero discharge. It is typically the maximum head point on a pump curve.
• Design—Point at which the pump was originally intended to operate. It is typically the best efficiency point (BEP) of the pump. At discharges above or below this point, the pump is not operating under optimum conditions.
• Max Operating—Highest discharge for which the pump is actually intended to run. At discharges above this point, the pump may behave unpredict-ably, or its performance may decline rapidly.
• Max Extended—Absolute maximum discharge at which the pump can operate, adding zero head to the system. This value may be computed by the program, or entered as a custom extended point.
• Multiple Point—When selecting a Multiple Point pump, an unlimited number of Flow vs. Head points may be defined.
• Volume vs Flow—When selecting a Volume vs Flow pump, an unlimited number of Volume vs. Flow points may be defined.
• Depth vs Flow—When selecting a Depth vs Flow pump, an unlimited number of Depth vs. Flow points may be defined.
6-186 Bentley SewerCAD V8i User’s Guide
Creating Your Model
Efficiency Tab This tab allows you to specify efficiency settings for the pump that is being edited.
Pump Efficiency Allows you to specify the pump efficiency type for the pump that is being edited. The following efficiency types are available:
• Constant Efficiency—This efficiency type main-tains the efficiency determined by the input value regardless of changes in discharge. When the Constant Efficiency type is selected, the input field is as follows:
• Pump Efficiency—The Pump Efficiency value is representative of the ability of the pump to transfer the mechanical energy generated by the motor to Water Power.
• Best Efficiency Point—This efficiency type generates a parabolic efficiency curve using the input value as the best efficiency point. When the Best Efficiency Point type is selected, the input fields are as follows:
• BEP Flow—The flow delivered when the pump is operating at its Best Efficiency point.
• BEP Efficiency—The efficiency of the pump when it is operating at its Best Efficiency Point.
• Define BEP Max Flow—When this box is checked the User Defined BEP Max Flow field is enabled, allowing you to enter a maximum flow for the Best Efficiency Point.
• User Defined BEP Max Flow—Allows you to enter a maximum flow value for the Best Effi-ciency Point.
• Multiple Efficiency Points—This efficiency type generates an efficiency curve based upon two or more user-defined efficiency points. These points are linearly interpolated to form the curve. When the Multiple Efficiency Points type is selected, the input field is as follows:
• Efficiency Points Table—This table allows you to enter the pump's efficiency at various discharge rates.
Bentley SewerCAD V8i User’s Guide 6-187
Elements and Element Attributes
To create a pump definition
1. Select Components > Pump Definitions.
2. Click New to create a new pump definition.
3. For each pump definition, perform these steps:
a. Select the type of pump definition in the Pump Definition Type menu.
b. Type values for Pump Power, Shutoff, Design point, Max Operating, and/or Max Extended as required. The available table columns or fields change depending on which definition type you choose.
Motor Tab This tab allows you to define the pump's motor efficiency settings. It contains the following controls:
Motor Efficiency
The Motor Efficiency value is representative of the ability of the motor to transform electrical energy to rotary mechanical energy.
Is Variable Speed Drive?
This check box allows you to specify whether or not the pump is a Variable Speed Pump. Toggling this check box On allows you to input points on the Efficiency Points table.
Efficiency Points Table
This table allows you to enter speed/efficiency points for variable speed pumps. This table is activated by toggling the "Variable Speed Drive" check box On.
Library Tab This tab displays information about the pump that is currently highlighted in the Pump Curves Definition Pane. If the pump is derived from an engineering library, the synchronization details can be found here. If the pump was created manually for this project, the synchronization details will display the message Orphan (local), indicating that the pump was not derived from a library entry.
Notes Tab This tab contains a text field that is used to type descriptive notes that will be associated with the pump that is currently highlighted in the Pump Curves Definition Pane.
6-188 Bentley SewerCAD V8i User’s Guide
Creating Your Model
c. For Multiple Point pumps, click the New button above the curve table to add a new row to the table, or press the Tab key to move to the next column in the table. Click the Delete button above the curve table to delete the currently highlighted row from the table.
d. Define efficiency and motor settings in the Efficiency and Motor tabs.
4. You can save your new pump definition in SewerCAD V8i’ Engineering Libraries for future use. To do this, perform these steps:
a. Click the Synchronization Options button, then select Export to Library. The Engineering Libraries dialog box opens.
b. Use the plus and minus signs to expand and collapse the list of available libraries, then select the library into which you want to export your new unit sanitary load.
c. Click Close to close the Engineering Libraries dialog box.
5. Perform the following optional steps:
– To delete a pump definition, select the curve label then click Delete.
– To rename a pump definition, select the label of the pump definition you want to rename, click Rename, then type the new name.
– To view a report on a pump definition, select the label for the pump definition, then click Report.
6. Click Close to close the dialog box.
Submersible Pumps
Wastewater collection systems frequently use submersible pumps. The pressure solver in SewerCAD needs a suction pipe (pressure pipe) connecting the pump to a suction node (a wet well for submersible pumps). To simulate a submersible pump in SewerCAD, you should connect the wet well to the pump with a short piece of pres-sure pipe (about 1 ft) to move the water into the pump with negligible head loss.
The Elevation (Invert) for the submersible pump should be the low point of the pump inlet.
Bentley SewerCAD V8i User’s Guide 6-189
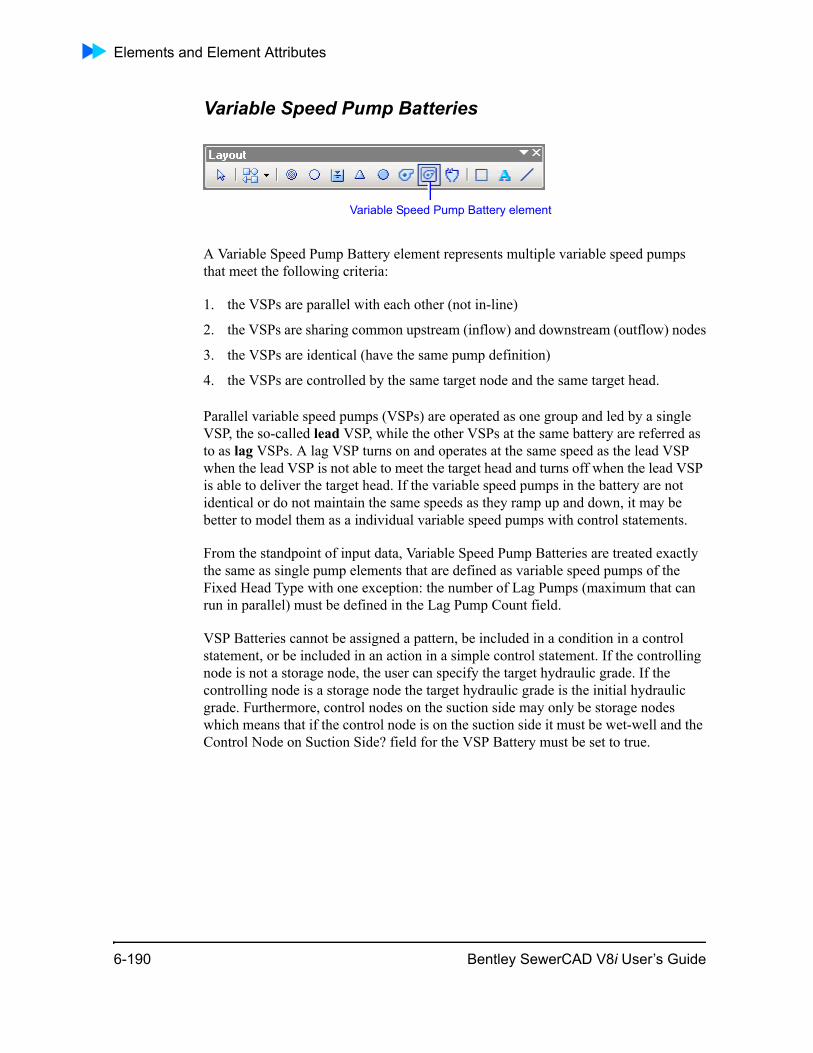
Elements and Element Attributes
Variable Speed Pump Batteries
A Variable Speed Pump Battery element represents multiple variable speed pumps that meet the following criteria:
1. the VSPs are parallel with each other (not in-line)
2. the VSPs are sharing common upstream (inflow) and downstream (outflow) nodes
3. the VSPs are identical (have the same pump definition)
4. the VSPs are controlled by the same target node and the same target head.
Parallel variable speed pumps (VSPs) are operated as one group and led by a single VSP, the so-called lead VSP, while the other VSPs at the same battery are referred as to as lag VSPs. A lag VSP turns on and operates at the same speed as the lead VSP when the lead VSP is not able to meet the target head and turns off when the lead VSP is able to deliver the target head. If the variable speed pumps in the battery are not identical or do not maintain the same speeds as they ramp up and down, it may be better to model them as a individual variable speed pumps with control statements.
From the standpoint of input data, Variable Speed Pump Batteries are treated exactly the same as single pump elements that are defined as variable speed pumps of the Fixed Head Type with one exception: the number of Lag Pumps (maximum that can run in parallel) must be defined in the Lag Pump Count field.
VSP Batteries cannot be assigned a pattern, be included in a condition in a control statement, or be included in an action in a simple control statement. If the controlling node is not a storage node, the user can specify the target hydraulic grade. If the controlling node is a storage node the target hydraulic grade is the initial hydraulic grade. Furthermore, control nodes on the suction side may only be storage nodes which means that if the control node is on the suction side it must be wet-well and the Control Node on Suction Side? field for the VSP Battery must be set to true.
Variable Speed Pump Battery element
6-190 Bentley SewerCAD V8i User’s Guide
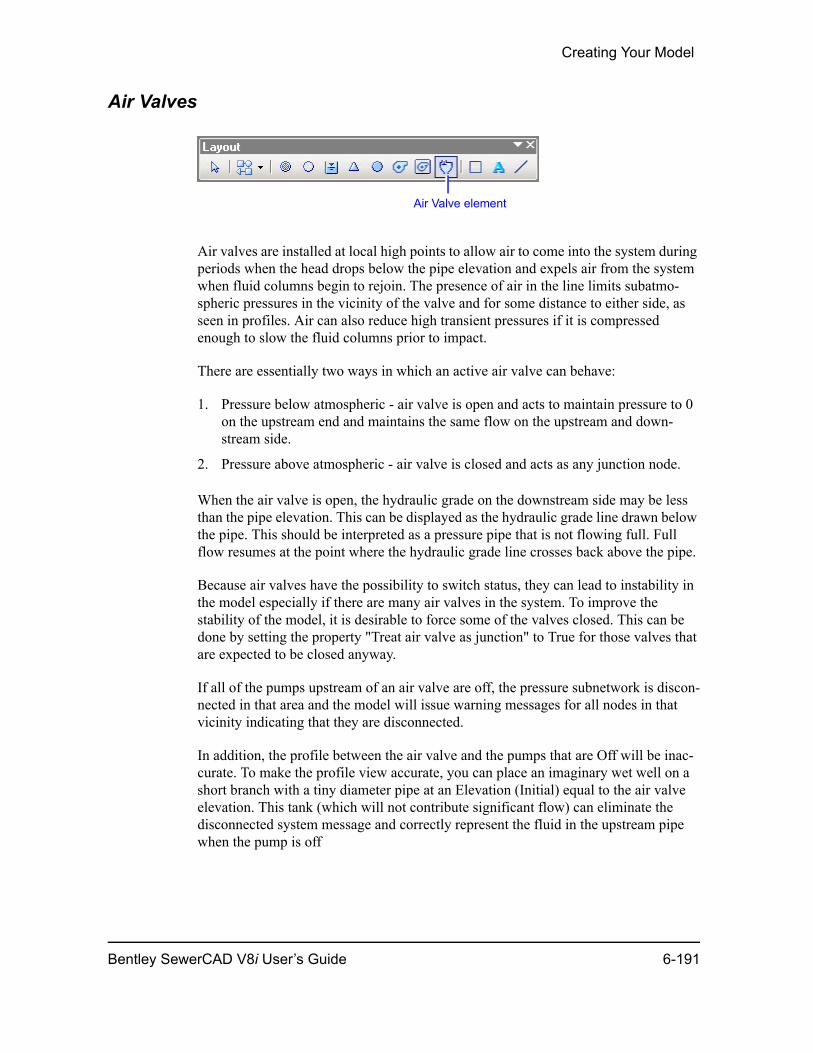
Creating Your Model
Air Valves
Air valves are installed at local high points to allow air to come into the system during periods when the head drops below the pipe elevation and expels air from the system when fluid columns begin to rejoin. The presence of air in the line limits subatmo-spheric pressures in the vicinity of the valve and for some distance to either side, as seen in profiles. Air can also reduce high transient pressures if it is compressed enough to slow the fluid columns prior to impact.
There are essentially two ways in which an active air valve can behave:
1. Pressure below atmospheric - air valve is open and acts to maintain pressure to 0 on the upstream end and maintains the same flow on the upstream and down-stream side.
2. Pressure above atmospheric - air valve is closed and acts as any junction node.
When the air valve is open, the hydraulic grade on the downstream side may be less than the pipe elevation. This can be displayed as the hydraulic grade line drawn below the pipe. This should be interpreted as a pressure pipe that is not flowing full. Full flow resumes at the point where the hydraulic grade line crosses back above the pipe.
Because air valves have the possibility to switch status, they can lead to instability in the model especially if there are many air valves in the system. To improve the stability of the model, it is desirable to force some of the valves closed. This can be done by setting the property "Treat air valve as junction" to True for those valves that are expected to be closed anyway.
If all of the pumps upstream of an air valve are off, the pressure subnetwork is discon-nected in that area and the model will issue warning messages for all nodes in that vicinity indicating that they are disconnected.
In addition, the profile between the air valve and the pumps that are Off will be inac-curate. To make the profile view accurate, you can place an imaginary wet well on a short branch with a tiny diameter pipe at an Elevation (Initial) equal to the air valve elevation. This tank (which will not contribute significant flow) can eliminate the disconnected system message and correctly represent the fluid in the upstream pipe when the pump is off
Air Valve element
Bentley SewerCAD V8i User’s Guide 6-191
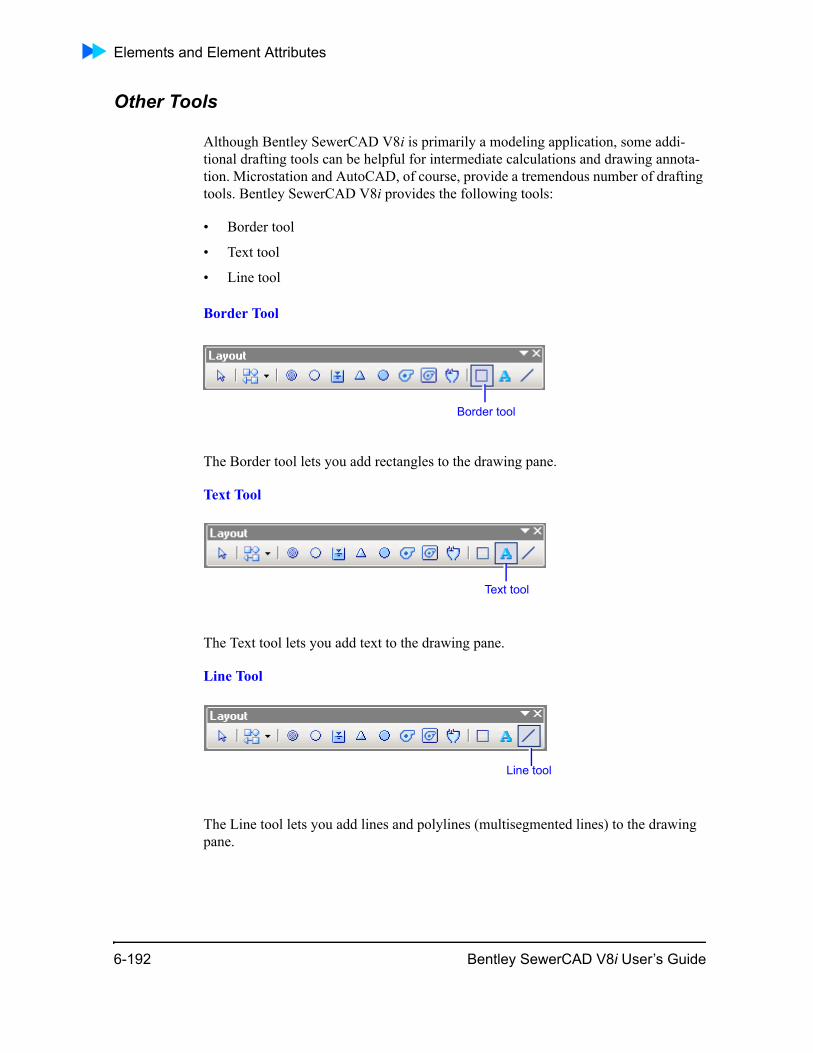
Elements and Element Attributes
Other Tools
Although Bentley SewerCAD V8i is primarily a modeling application, some addi-tional drafting tools can be helpful for intermediate calculations and drawing annota-tion. Microstation and AutoCAD, of course, provide a tremendous number of drafting tools. Bentley SewerCAD V8i provides the following tools:
• Border tool
• Text tool
• Line tool
Border Tool
The Border tool lets you add rectangles to the drawing pane.
Text Tool
The Text tool lets you add text to the drawing pane.
Line Tool
The Line tool lets you add lines and polylines (multisegmented lines) to the drawing pane.
Border tool
Text tool
Line tool
6-192 Bentley SewerCAD V8i User’s Guide
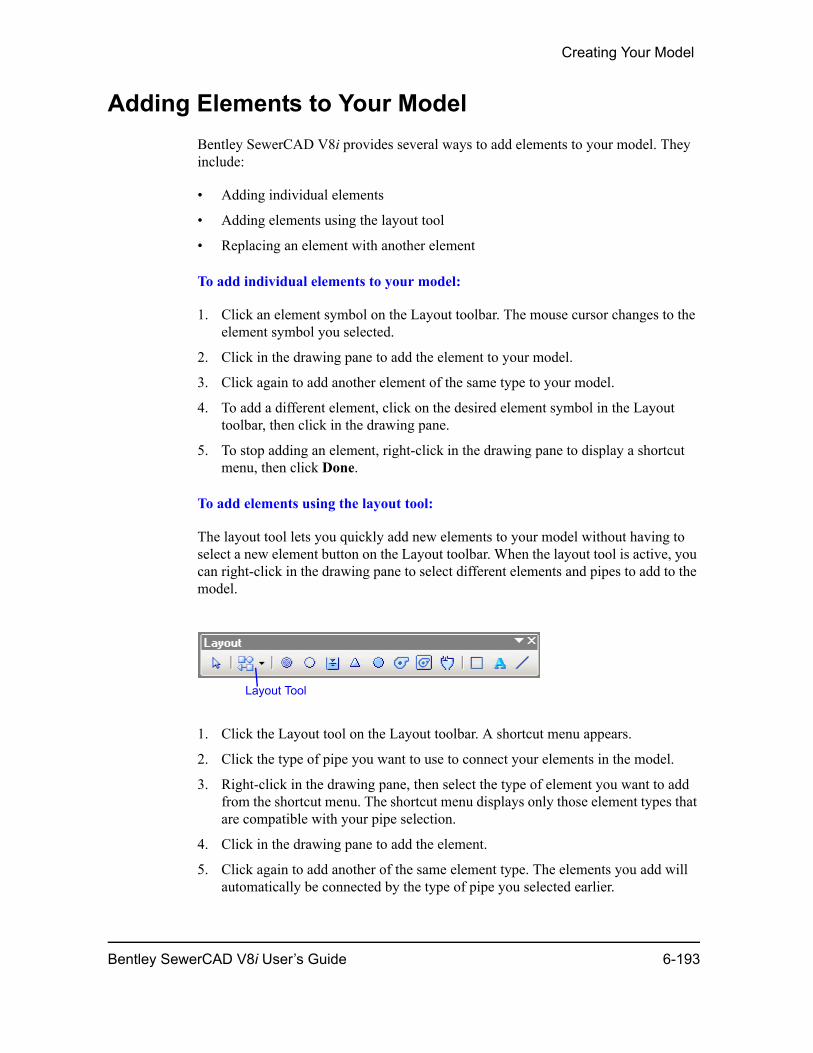
Creating Your Model
Adding Elements to Your ModelBentley SewerCAD V8i provides several ways to add elements to your model. They include:
• Adding individual elements
• Adding elements using the layout tool
• Replacing an element with another element
To add individual elements to your model:
1. Click an element symbol on the Layout toolbar. The mouse cursor changes to the element symbol you selected.
2. Click in the drawing pane to add the element to your model.
3. Click again to add another element of the same type to your model.
4. To add a different element, click on the desired element symbol in the Layout toolbar, then click in the drawing pane.
5. To stop adding an element, right-click in the drawing pane to display a shortcut menu, then click Done.
To add elements using the layout tool:
The layout tool lets you quickly add new elements to your model without having to select a new element button on the Layout toolbar. When the layout tool is active, you can right-click in the drawing pane to select different elements and pipes to add to the model.
1. Click the Layout tool on the Layout toolbar. A shortcut menu appears.
2. Click the type of pipe you want to use to connect your elements in the model.
3. Right-click in the drawing pane, then select the type of element you want to add from the shortcut menu. The shortcut menu displays only those element types that are compatible with your pipe selection.
4. Click in the drawing pane to add the element.
5. Click again to add another of the same element type. The elements you add will automatically be connected by the type of pipe you selected earlier.
Layout Tool
Bentley SewerCAD V8i User’s Guide 6-193
Connecting Elements
6. To change the type of pipe, right-click and select a different type from the shortcut menu.
7. To change the element, right-click and select a different element from the shortcut menu.
8. To stop adding elements using the Layout tool, right-click anywhere in the drawing pane and click Done.
Note: In AutoCAD, you must hold down the mouse button to keep the submenu open while selecting an element from the layout toolbar. Alternate layout methods include using the right-click menu to select elements or using the command line.
Modeling Curved Pipes
You can model curved pipes in SewerCAD V8i by using the Bend command, which is available by right-clicking in the Drawing Pane when placing a link element.
Bentley SewerCAD V8i does not account for any additional head loss due to the curvature because in most cases the increased head loss is negligible. If you feel the extra head loss is significant, it is possible to increase the Manning's n value to account for such losses.
To model a curved pipe:
1. Select the desired link element using the Layout button on the Layout toolbar.
2. Place the first segment of the curved pipe in your model, then right click and select Bend from the shortcut menu.
3. Repeat Step 2 for each segment in the curved pipe. Be sure to insert bends to clearly show the curved alignment.
4. When the curved pipe is complete, right click and select the next downstream element (for a conduit, this is usually a manhole).
Connecting ElementsWhen building your model, you must consider these rules of connectivity:
“What Is A Virtual Conduit?” on page 6-195
“Connecting a Pump to a Wet Well” on page 6-195
6-194 Bentley SewerCAD V8i User’s Guide
Creating Your Model
What Is A Virtual Conduit?
Virtual links have slightly different uses in other Bentley products (SewerGEMs and CivilStorm), virtual links in StormCAD and SewerCAD are solely used as the shape of the conduits which are set up as diversion links. This behavior is meant to main-tain fidelity with older versions of SewerCAD v5.6 which directly transfers diverted flow to the diversion target without worrying about any type of Gradually Varied Flow or Capacity analysis. The older versions established diversions at the nodes, SewerCAD (and StormCAD) allow the user to more accurately depict the diversions as a conduit. The profiles in the virtual links are established by the hydraulic grade at the bounding node.
If importing a SewerGEMs model containing conduits of virtual shape, you will either have to remove the conduit, change its shape to something else, or establish a diver-sion on it in order for the model to calculate.
Connecting a Pump to a Wet Well
Bentley SewerCAD V8i assumes that either the pump is a submersible pump in the wet well or the pump is connected to the wet well through a short piece of pressure pipe with negligible head loss.
Do not connect a conduit or channel between the wet well and pump.
Pumps can also use ponds or manholes as suction elements. If a pressure pipe is used as the suction element, it is assumed that the distance is so short that the head loss is negligible. If head loss is significant in determining pump flow, then add pipe length or minor loss to the discharge pipe.
To specify the relationship between a wet well and a pump:
1. Double-click the pump in your model to open the Property Editor for the pump.
2. Select Select Suction Element as the Suction Side Node.
SewerCAD V8i prompts you to select the suction side node or link from your model (which can be a wet well, pressure pipe, or manhole).
3. Select the appropriate node in your model. A dashed line appears to connect the two elements. If a manhole is used as a suction line, it cannot be the most down-stream end of a gravity network.
Manipulating ElementsYou can manipulate elements in your model in any one of the following ways:
Bentley SewerCAD V8i User’s Guide 6-195

Manipulating Elements
• Select elements—manually select individual elements, manually select multiple elements, select all elements, or select all elements of a single element type
• Move elements
• Delete elements
• Split pipes
6-196 Bentley SewerCAD V8i User’s Guide
Creating Your Model
To manually select an element:
Click the element. Selected elements appear in red.
Note: You can change the selection color in the Options dialog box, which is accessible by selecting Tools > Options.
To manually select multiple elements:
Click the first element, then click additional elements while holding down Shift or Ctrl.
To select all elements:
To select all of the elements in your model, select Edit > Select All.
To select all elements of the same type:
To select all elements of the same type (for example, all junction chambers), select Edit > Select by Element, then click the desired element type.
All elements of the selected type appear in red, including connecting pipes.
To clear selected elements:
Click the Select tool then click any blank space in the drawing pane.
or
Click Edit > Clear Selection.
or
Press the Esc key.
You can also clear a selected element by clicking a different element.
To move an element in the model:
1. Click the Select tool on the Layout toolbar.
2. Select the element(s) you want to move, then drag it to its new location. Pipe connections move with the element.
Bentley SewerCAD V8i User’s Guide 6-197
Manipulating Elements
To delete an element:
Select the element, then press Delete.
or
Select Edit > Delete.
Splitting Pipes
You may encounter a situation in which you need to add a new element in the middle of an existing pipe. For example, you may want to insert a new manhole to maintain maximum access hole spacing.
To split an existing pipe:
1. Select the desired element symbol on the Layout toolbar.
2. In the drawing pane, place the cursor over the pipe you want to split and click.
3. You are prompted to confirm that you want to split the pipe.
– If you choose to split the pipe, the element will be inserted and two new pipes will be created with the same characteristics as the original pipe (lengths are split proportionally).
– If you choose not to split the pipe, the new element will be placed on top of the pipe without connecting to anything.
If you accidentally split a pipe, this action can be undone by selecting Edit > Undo.
You can also split an existing pipe with an existing element:
To do this in the Stand-Alone version, drag the element into position along the pipe to be split, then right-click the node and select Split <Pipe Label> from the shortcut menu (where <Pipe Label> is the name of the pipe to be split).
To do this in the Microstation version, drag the element into position along the pipe to be split. Hold down the Shift key, then right-click the node and select Split <Pipe Label> from the shortcut menu (where <Pipe Label> is the name of the pipe to be split).
6-198 Bentley SewerCAD V8i User’s Guide
Creating Your Model
Disconnecting and Reconnecting Pipes
In certain circumstances, you may wish to disconnect a pipe from a node without deleting and redrawing the pipe in question. For example, if the model was built from a database and the Establish By Spatial Data option was used to determine pipe connectivity, a pipe may have been connected to the wrong node.
To disconnect and reconnect a pipe:
1. Right-click the pipe to be disconnected close to the end of the pipe nearest the end you want to disconnect.
2. Pick Reconnect from the menu.
3. One end of the pipe is now connected to the node it will remain connected to and the other end is connected to your mouse cursor. Hover the mouse cursor over the node to which you would like to connect the pipe and click the left mouse button. The pipe will now be connected to this node.
You must reconnect a pipe to an existing node. The Reconnect command will not split a pipe or create a new node in an open area. If you want to reconnect along an existing pipe, you must first split the pipe with a new node.
Editing Element AttributesYou edit element properties in the Property Editor, one of the dockable managers in Bentley SewerCAD V8i.
To edit element properties:
Double-click the element in the drawing pane. The Property Editor displays the attributes of the selected element.
or
Select the element whose properties you want to edit, then select View > Properties or click the Properties button on the Analysis toolbar.
Property Editor
The Property Editor is a contextual dialog box that changes depending on the status of other dialog boxes. For example, when a network element is highlighted in the drawing pane, the Property Editor displays the attributes and values associated with that element. When one of the manager dialog boxes is active, the Property Editor displays the properties pertaining to the currently highlighted manager element.
Bentley SewerCAD V8i User’s Guide 6-199
Editing Element Attributes
Attributes displayed in the Property Editor are grouped into categories. An expanded category can be collapsed by clicking the plus (+) button next to the category heading. A collapsed category can be expanded by clicking the minus (-) button next to the category heading.
For the most efficient data entry in Text Box style fields, instead of clicking on the Field, click on the label to the left of the field you want to edit, and start typing. Press Enter to commit the value, then use the Up/Down keyboard arrows to navigate to the next field you want to edit. You can then edit the field data without clicking the label first; when you are finished editing the field data, press the Enter key, and proceed to the next field using the arrow keys, and so on.
Find Element
The top section of the Property Editor contains the Find Element tool. The Find Element tool lets you:
• Quickly find a recently-created or added element in your model. The Element menu contains a list of the most recently-created and added elements. Click an element in the Element menu to center the drawing pane around that element and highlight it.
• Find an element in your model by typing the element label or ID in the Element menu then clicking the Find button or pressing Enter. The drawing pane centers around the highlighted element.
• Find all elements of a certain type by using an asterisk (*) as a wild-card char-acter. For example, if you want to find all of the conduits in your model, you type co* (this is not case-sensitive) then click the Find button. The drawing pane centers around and highlights the first instance of a conduit in your model, and lists all conduits in your model in the Element menu. Once the Element menu is populated with a list of elements, you can use the Find Next and Find Previous buttons to quickly navigate to the next or previous element in the list.
Note: See the ”Using the Like Operator’ topic for more information about wildcard symbols.
6-200 Bentley SewerCAD V8i User’s Guide
Creating Your Model
The following controls are included:
Relabeling Elements
You can relabel elements from within the Property Editor.
Element Type an element label or ID in this field then click the Find button to quickly locate it in your model. The element selected in this menu will be centered in the drawing pane when the Zoom To command is initiated, at the magnification level specified by the Zoom Level menu. The drop-down menu lists recently-created or added elements, elements that are part of a selection set, and that are part of the results from a recent Find operation.
Find Previous This button allows you to find the previous element in the list of results from a recent Find operation.
Find Zooms the drawing pane view to the element typed or selected in the Element menu at the magnification level specified in the Zoom Level menu.
Find Next This button allows you to find the next element in the list of results from a recent Find operation.
Help Displays online help for the Property Editor.
Zoom Level Allows you to specify the magnification level at which elements are displayed in the drawing pane when the Zoom To command is initiated.
Alphabetic Displays the attribute fields in the Property Editor in alphabetical order.
Categorized Displays the attribute fields in the Property Editor in categories. This is the default.
Bentley SewerCAD V8i User’s Guide 6-201
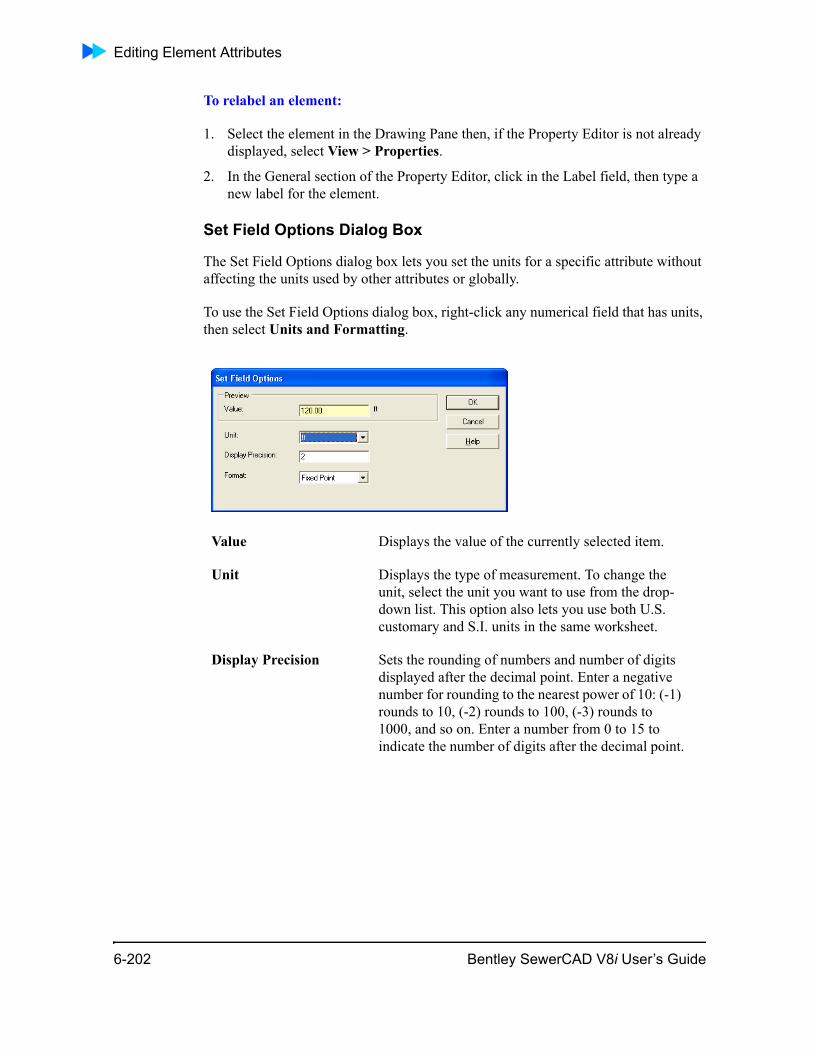
Editing Element Attributes
To relabel an element:
1. Select the element in the Drawing Pane then, if the Property Editor is not already displayed, select View > Properties.
2. In the General section of the Property Editor, click in the Label field, then type a new label for the element.
Set Field Options Dialog Box
The Set Field Options dialog box lets you set the units for a specific attribute without affecting the units used by other attributes or globally.
To use the Set Field Options dialog box, right-click any numerical field that has units, then select Units and Formatting.
Value Displays the value of the currently selected item.
Unit Displays the type of measurement. To change the unit, select the unit you want to use from the drop-down list. This option also lets you use both U.S. customary and S.I. units in the same worksheet.
Display Precision Sets the rounding of numbers and number of digits displayed after the decimal point. Enter a negative number for rounding to the nearest power of 10: (-1) rounds to 10, (-2) rounds to 100, (-3) rounds to 1000, and so on. Enter a number from 0 to 15 to indicate the number of digits after the decimal point.
6-202 Bentley SewerCAD V8i User’s Guide
Creating Your Model
What Length is Used for Conduits and Pressure Pipes When I Don't Enter a User-defined Length?
If you do not enter a user-defined length in the attributes for conduits and pressure pipes, the length used in Bentley SewerCAD V8i is the plan view distance between the coordinates at each end of the link element. This length is used as the actual length in hydraulic calculations. However, as the slope increases, the difference between the plan length and the actual length also increases as shown below.
The table below shows the difference between the actual and plan length as a function of slope. Note that for most reasonable slopes, the difference between the actual and plan view length is less than one percent. (100% slope is 1:1 slope.) As the slope approaches vertical, you must enter the actual length.
Format Lets you select the display format used by the current field. Choices include:
• Scientific—Converts the entered value to a string of the form "-d.ddd...E+ddd" or "-d.ddd...e+ddd", where each 'd' indicates a digit (0-9). The string starts with a minus sign if the number is negative.
• Fixed Point—Abides by the display precision setting, and automatically enters zeros after the decimal place to do so. With a display precision of 3, an entered value of 3.5 displays as 3.500.
• General—Truncates any zeros after the decimal point, regardless of the display preci-sion value. With a display precision of 3, the value that would appear as 5.200 in Fixed Point format displays as 5.2 when using General format. The number is also rounded. So, an entered value of 5.35 displays as 5.4 regardless of the display precision.
• Number—Converts the entered value to a string of the form "-d,ddd,ddd.ddd...", where each 'd' indicates a digit (0-9). The string starts with a minus sign if the number is negative. Thousand separators are inserted between each group of three digits to the left of the decimal point.
Bentley SewerCAD V8i User’s Guide 6-203

Automatic Design
* The model’s generalized friction formulation is only valid for slopes less than 10%.
If you are not satisfied with the plan view length, you can enter a user-defined length, which you can determine using the following equation:
Automatic DesignThis program allows you to automatically design gravity piping and structures. The design is flexible enough to allow you to specify the elements to be designed, from a single pipe size to the entire system, or anything in between.
The design algorithm adjusts invert elevations and the section size of the pipe to meet several constraints, such as allowable ranges of slope, velocity and cover. In general, the design algorithm attempts to minimize pipe size and excavation, which is typically the most expensive part of installing sewer piping and structures.
Some of the other things that are considered include:
• Pipe Matching
• Offset Matching
• Drop Structures
• Structure Sump Elevations
The designed pipe will be the smallest available section size from the Engineering Library that meets the constraints and has a capacity greater than its discharge. In a situation where there are no pipe sizes with adequate capacity, the largest available size will be used.
Table 6-1: Actual and Plan Length as a Function of Slope
Slope, % * Actual/Plan Length
0 1.000
10 1.005
20 1.020
30 1.044
))100/(%1( 22 lopesPlanActual +=
6-204 Bentley SewerCAD V8i User’s Guide
Creating Your Model
Default Design Constraints
The Default Design Constraints dialog allows you to edit the pipe and node constraints governing the design of the system. It also allows you to specify which gravity elements you want designed, and the extent to which you want them designed.
For example, you may want to design a particular pipe. However, you may also want to design the downstream invert elevation to meet a particular velocity, cover, and slope constraint.
The tabbed dialog for each particular type of element follows the same general format. The top of the dialog box contains several fields where the design constraints can be entered. The constraints entered in these fields are applied to every element of that type.
The following attributes are available in this section:
Pipe diameters, invert elevations, and node structures can be all designed with the same set of design constraints. You also have the option to adjust these values individ-ully for each pipe or node.
The Default Design Constraints dialog is divided into the following tabs:
• Gravity Pipe
• Node
Gravity Pipe Tab
The Gravity Pipe tab allows you to enter default constraints to be used for the design of pipes when performing a calculation run in design mode. The dialog is divided into the following sections:
• Default Constraints
• Extended Design
Default Constraints Section
In this section, there is a Velocity tab, a Cover tab, and a Slope tab. You can specify the following default constraints to be used for the design of gravity pipes:
• Velocity Tab: The Velocity tab consists of the following controls:
– Velocity Constraints Type–When Simple is chosen, a single minimum and maximum Velocity value is selected. When Table is chosen, you can specify multiple Rise vs Velocity (Minimum) vs Velocity (Maximum) points in tabular format.
Bentley SewerCAD V8i User’s Guide 6-205
Automatic Design
– Velocity (Minimum)–Specify the minimum allowable velocity value. This control is only available when the Velocity Constraint Type is set to Simple.
– Velocity (Maximum)–Specify the maximum allowable velocity value. This control is only available when the Velocity Constraint Type is set to Simple.
• Cover Tab: The Cover tab consists of the following controls:
– Cover Constraints Type–When Simple is chosen, a single minimum and maximum Cover value is selected. When Table is chosen, you can specify multiple Rise vs Cover (Minimum) vs Cover (Maximum) points in tabular format.
– Cover (Minimum)–Specify the minimum allowable cover value. This control is only available when the Cover Constraint Type is set to Simple.
– Cover (Maximum)–Specify the maximum allowable cover value. This control is only available when the Cover Constraint Type is set to Simple.
• Slope Tab: The Slope tab consists of the following controls:
– Slope Constraints Type–When Simple is chosen, a single minimum and maximum Slope value is selected. When Table is chosen, you can specify multiple Rise vs Slope (Minimum) vs Slope (Maximum) points in tabular format.
– Slope (Minimum)–Specify the minimum allowable slope value. This control is only available when the Slope Constraint Type is set to Simple.
– Slope (Maximum)–Specify the maximum allowable slope value. This control is only available when the Slope Constraint Type is set to Simple.
Extended Design Section
This section lets you specify if the following design parameters are to be used. If they are to be used, you can also specify the associated default value. The Extended Design section is split into three tabs:
• Part Full Design Tab: The Part Full Design tab consists of the following controls:
– Is Part Full Design?–When checked, allows you to specify the Percent Full target to be used by the design algorithm.
– Percent Full Constraint Type–Allows you to specify how the Percent Full constraints are defined. When Simple is chosen, a single Percentage Full value is selected. When Table is chosen, you can specify multiple Rise vs Percent Full points in tabular format.
6-206 Bentley SewerCAD V8i User’s Guide

Creating Your Model
– Percentage Full–Specify the Percent Full value to be used when the Is Part Full Design? box is checked. This control is only available when the Percent Full Constraint Type is set to Simple.
– Rise vs Percent Full Table–This table becomes available when the Percent Full Constraint Type is set to Table. Enter any number of Rise vs Percent Full points to describe a range of values. Values not explicity listed will be linearly interpolated by the software.
• Number of Barrels Tab: The Number of Barrels tab consists of the following controls:
– Allow Multiple Barrels?–When checked, allows the design algorithm to use more than one identical section in parallel, up to the specified Maximum Number of Barrels.
– Maximum Number of Barrels–The maximum number of identical sections allowed to be used in parallel when the Allow Multiple Barrels? box is checked.
• Section Size Tab: The Section Size tab consists of the following controls:
– Limit Section Size?–When checked, limits the pipe section height to the specified Maximum Rise value during the design process.
– Maximum Rise–The maximum rise a section height is allowed to be used in the design when the Limit Section Size? box is checked.
Node Tab
This tab lets you specify the design constraints to be used by default for all gravity structures when performing calculations in design mode. During an automatic design, the program will adjust the elevations of the pipes adjacent to the structure according to the structure's matching constraints. The two choices for matching are Inverts and Crowns. Additionally, the downstream pipe can be offset from the upstream pipe(s) by a specified amount. This value is called the Matchline Offset. Optionally, the program supports the design of drop structures. In some situations, drop structures can mini-mize pipe cover depths while maintaining adequate hydraulic performance.
Bentley SewerCAD V8i User’s Guide 6-207
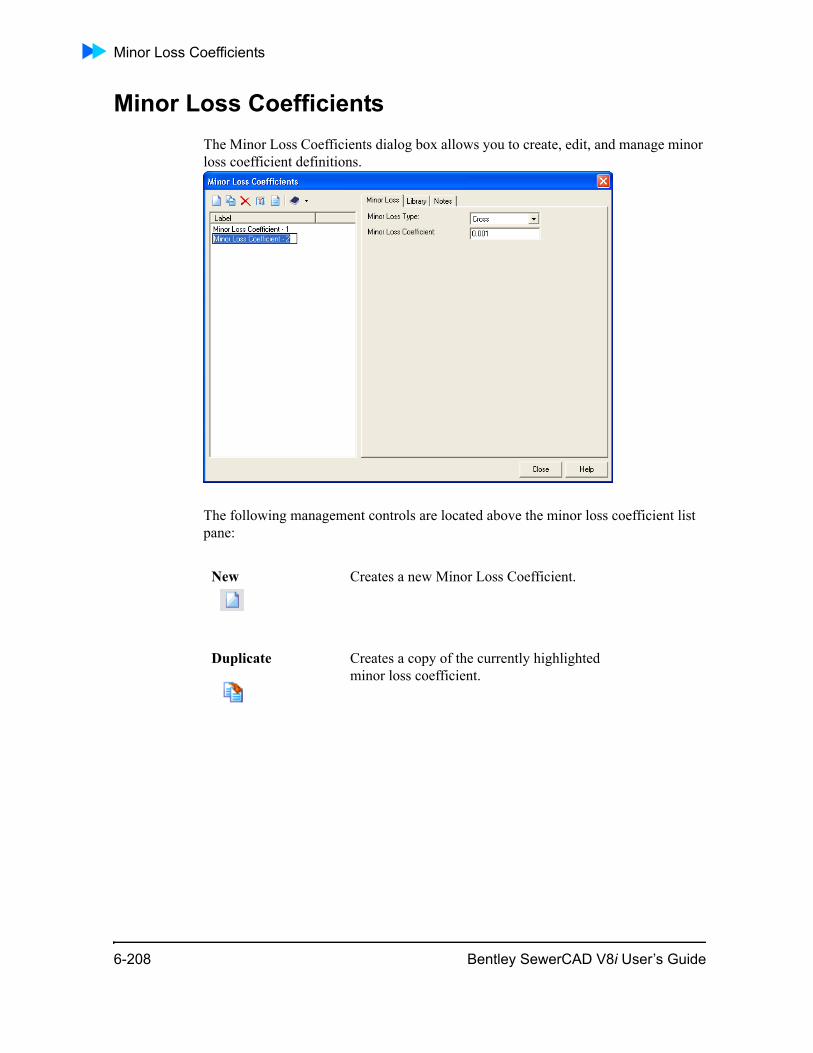
Minor Loss Coefficients
Minor Loss CoefficientsThe Minor Loss Coefficients dialog box allows you to create, edit, and manage minor loss coefficient definitions.
The following management controls are located above the minor loss coefficient list pane:
New Creates a new Minor Loss Coefficient.
Duplicate Creates a copy of the currently highlighted minor loss coefficient.
6-208 Bentley SewerCAD V8i User’s Guide
Creating Your Model
The tab section is used to define the settings for the minor loss that is currently high-lighted in the minor loss list pane. The following controls are available:
Delete Deletes the minor loss coefficient that is currently highlighted in the list pane.
Rename Renames the minor loss coefficient that is currently highlighted in the list pane.
Report Opens a report of the data associated with the minor loss coefficient that is currently highlighted in the list pane.
Synchronization Options
Browses the Engineering Library, synchronizes to or from the library, imports from the library or exports to the library.
Minor Loss Tab This tab consists of input data fields that allow you to define the minor loss.
Minor Loss Type General type of fitting or loss element. This field is used to limit the number of minor loss elements available in choice lists. For example, the minor loss choice list on the valve dialog box only includes minor losses of the valve type. You cannot add or delete types.
Minor Loss Coefficient Headloss coefficient for the minor loss. This unitless number represents the ratio of the headloss across the minor loss element to the velocity head of the flow through the element.
Bentley SewerCAD V8i User’s Guide 6-209
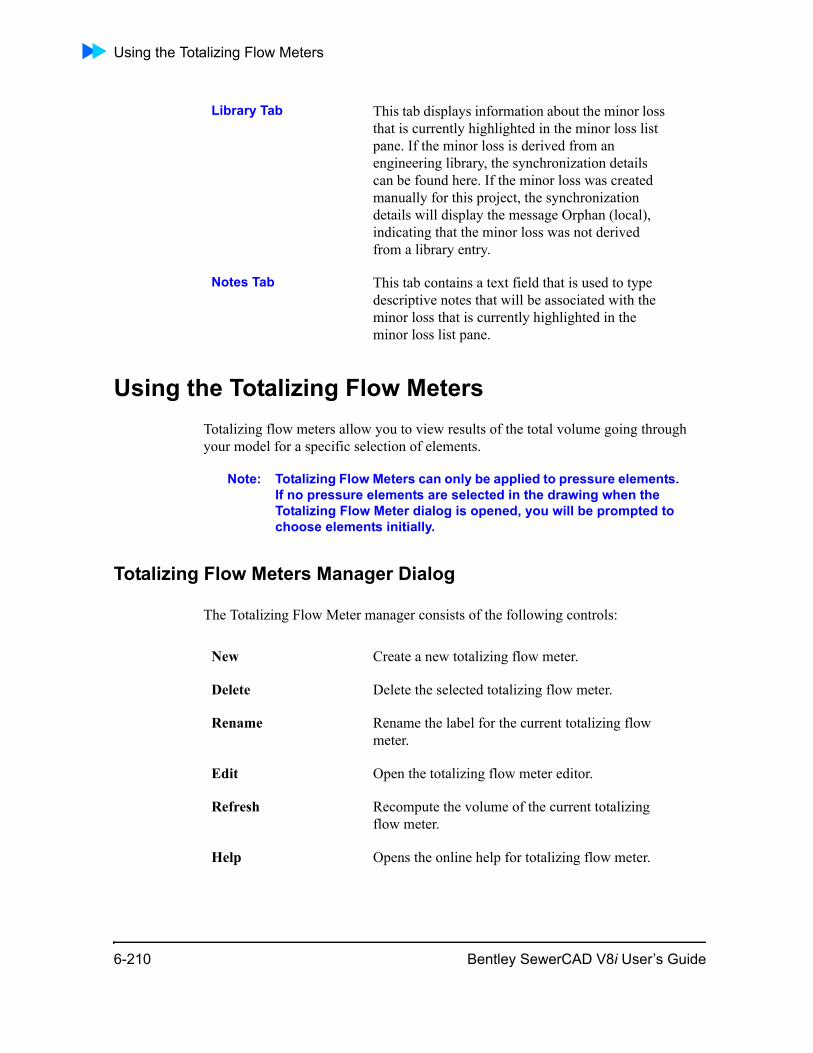
Using the Totalizing Flow Meters
Using the Totalizing Flow MetersTotalizing flow meters allow you to view results of the total volume going through your model for a specific selection of elements.
Note: Totalizing Flow Meters can only be applied to pressure elements. If no pressure elements are selected in the drawing when the Totalizing Flow Meter dialog is opened, you will be prompted to choose elements initially.
Totalizing Flow Meters Manager Dialog
The Totalizing Flow Meter manager consists of the following controls:
Library Tab This tab displays information about the minor loss that is currently highlighted in the minor loss list pane. If the minor loss is derived from an engineering library, the synchronization details can be found here. If the minor loss was created manually for this project, the synchronization details will display the message Orphan (local), indicating that the minor loss was not derived from a library entry.
Notes Tab This tab contains a text field that is used to type descriptive notes that will be associated with the minor loss that is currently highlighted in the minor loss list pane.
New Create a new totalizing flow meter.
Delete Delete the selected totalizing flow meter.
Rename Rename the label for the current totalizing flow meter.
Edit Open the totalizing flow meter editor.
Refresh Recompute the volume of the current totalizing flow meter.
Help Opens the online help for totalizing flow meter.
6-210 Bentley SewerCAD V8i User’s Guide
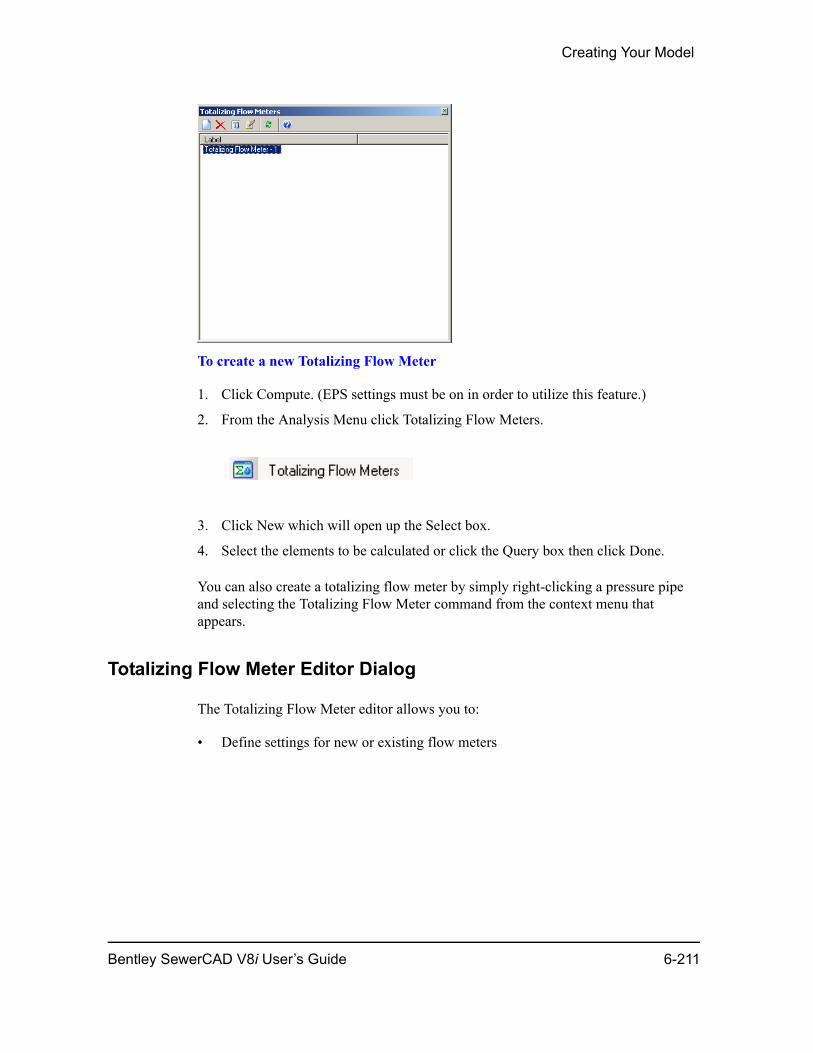
Creating Your Model
To create a new Totalizing Flow Meter
1. Click Compute. (EPS settings must be on in order to utilize this feature.)
2. From the Analysis Menu click Totalizing Flow Meters.
3. Click New which will open up the Select box.
4. Select the elements to be calculated or click the Query box then click Done.
You can also create a totalizing flow meter by simply right-clicking a pressure pipe and selecting the Totalizing Flow Meter command from the context menu that appears.
Totalizing Flow Meter Editor Dialog
The Totalizing Flow Meter editor allows you to:
• Define settings for new or existing flow meters
Bentley SewerCAD V8i User’s Guide 6-211
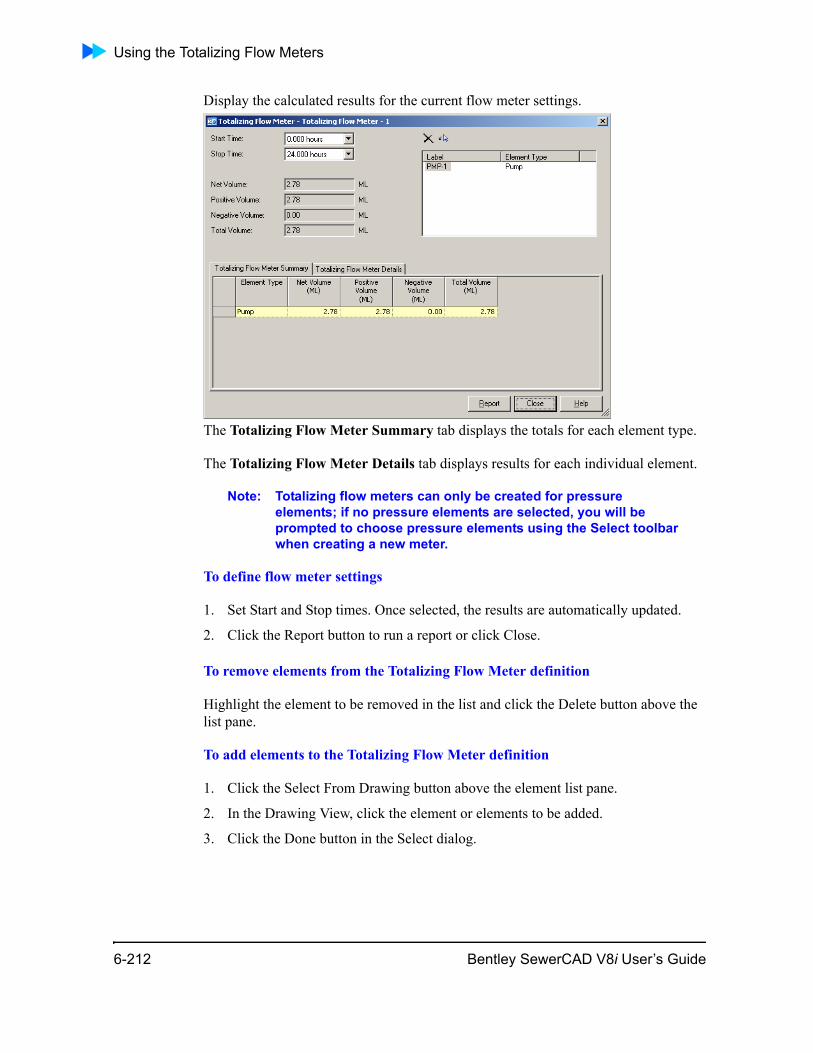
Using the Totalizing Flow Meters
Display the calculated results for the current flow meter settings.
The Totalizing Flow Meter Summary tab displays the totals for each element type.
The Totalizing Flow Meter Details tab displays results for each individual element.
Note: Totalizing flow meters can only be created for pressure elements; if no pressure elements are selected, you will be prompted to choose pressure elements using the Select toolbar when creating a new meter.
To define flow meter settings
1. Set Start and Stop times. Once selected, the results are automatically updated.
2. Click the Report button to run a report or click Close.
To remove elements from the Totalizing Flow Meter definition
Highlight the element to be removed in the list and click the Delete button above the list pane.
To add elements to the Totalizing Flow Meter definition
1. Click the Select From Drawing button above the element list pane.
2. In the Drawing View, click the element or elements to be added.
3. Click the Done button in the Select dialog.
6-212 Bentley SewerCAD V8i User’s Guide
Creating Your Model
System Head CurvesThe purpose of a pump is to overcome elevation differences and head losses due to pipe friction and fittings. The amount of head the pump must add to overcome eleva-tion differences is dependent on system characteristics and topology (and independent of the pump discharge rate), and is referred to as static head. Friction and minor losses, however, are highly dependent on the rate of discharge through the pump. When these losses are added to the static head for a series of discharge rates, the resulting plot is called a system head curve.
Pumps are designed to lift water from one elevation to another, while overcoming the friction and minor losses associated with the piping system. To correctly size a pump, one must understand the static head (elevation differences) and dynamic head (friction and minor losses) conditions under which the pump is expected to operate. The static head will vary due to changes in reservoir or tank elevations on both the suction and discharge sides of the pump, and the dynamic head is dependent on the rate of discharge through the pump.
System head curves are a useful tool for visualizing the static and dynamic head for varying rates of discharge and various static head conditions. The system head curve is a graph of head vs. flow that shows the head required to move a given flow rate through the pump and into the distribution system.
System Head Curves Manager Dialog
The System Head Curves manager allows you to create, edit, and manager system head curves. It consists of the following controls:
New Create a new system head curve.
Delete Delete the selected system head curve.
Rename Rename the label for the current system head curve.
Edit Open the system head curve editor.
Help Open the online help for system head curves.
Bentley SewerCAD V8i User’s Guide 6-213
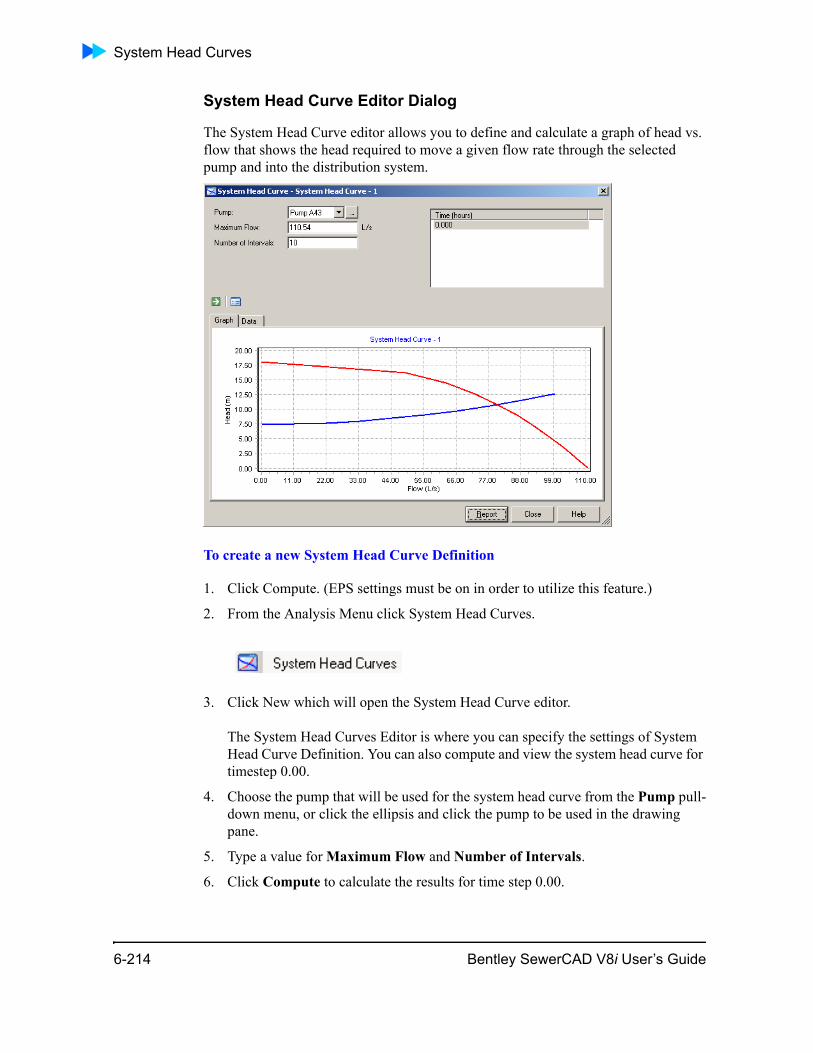
System Head Curves
System Head Curve Editor Dialog
The System Head Curve editor allows you to define and calculate a graph of head vs. flow that shows the head required to move a given flow rate through the selected pump and into the distribution system.
To create a new System Head Curve Definition
1. Click Compute. (EPS settings must be on in order to utilize this feature.)
2. From the Analysis Menu click System Head Curves.
3. Click New which will open the System Head Curve editor.
The System Head Curves Editor is where you can specify the settings of System Head Curve Definition. You can also compute and view the system head curve for timestep 0.00.
4. Choose the pump that will be used for the system head curve from the Pump pull-down menu, or click the ellipsis and click the pump to be used in the drawing pane.
5. Type a value for Maximum Flow and Number of Intervals.
6. Click Compute to calculate the results for time step 0.00.
6-214 Bentley SewerCAD V8i User’s Guide
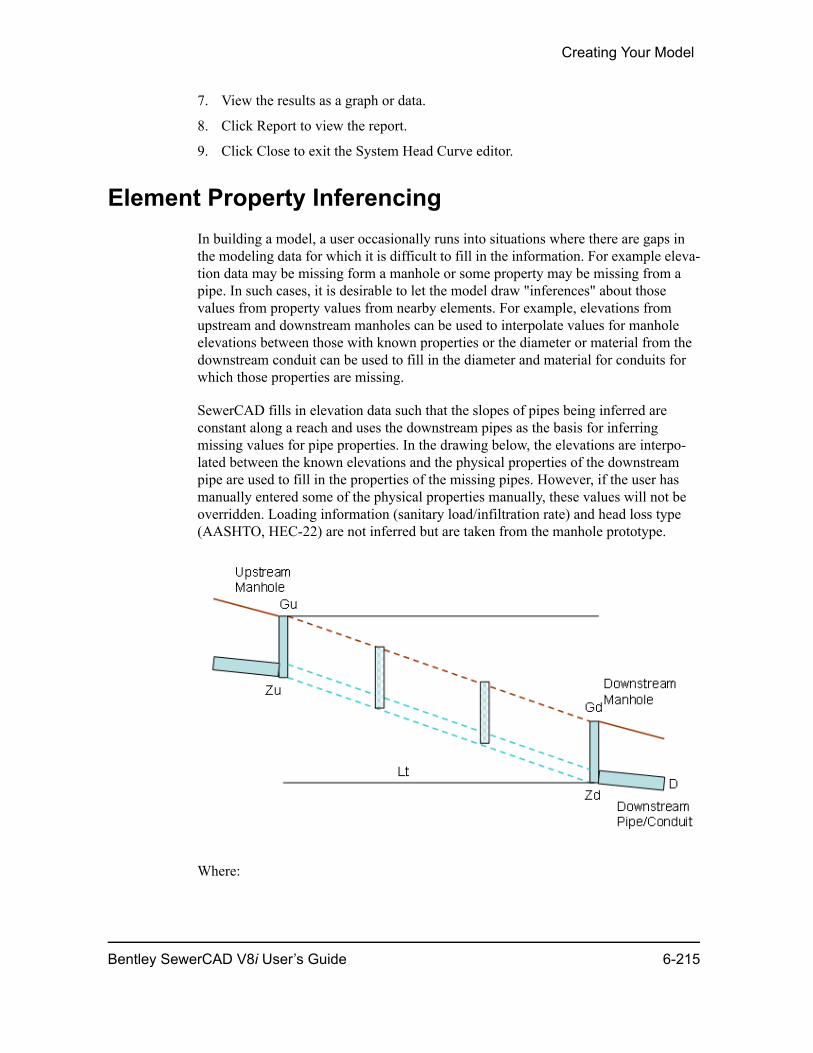
Creating Your Model
7. View the results as a graph or data.
8. Click Report to view the report.
9. Click Close to exit the System Head Curve editor.
Element Property InferencingIn building a model, a user occasionally runs into situations where there are gaps in the modeling data for which it is difficult to fill in the information. For example eleva-tion data may be missing form a manhole or some property may be missing from a pipe. In such cases, it is desirable to let the model draw "inferences" about those values from property values from nearby elements. For example, elevations from upstream and downstream manholes can be used to interpolate values for manhole elevations between those with known properties or the diameter or material from the downstream conduit can be used to fill in the diameter and material for conduits for which those properties are missing.
SewerCAD fills in elevation data such that the slopes of pipes being inferred are constant along a reach and uses the downstream pipes as the basis for inferring missing values for pipe properties. In the drawing below, the elevations are interpo-lated between the known elevations and the physical properties of the downstream pipe are used to fill in the properties of the missing pipes. However, if the user has manually entered some of the physical properties manually, these values will not be overridden. Loading information (sanitary load/infiltration rate) and head loss type (AASHTO, HEC-22) are not inferred but are taken from the manhole prototype.
Where:
Bentley SewerCAD V8i User’s Guide 6-215
Element Property Inferencing
• Gu = upstream ground
• Gd = downstream ground
• Zu = upstream invert
• Zd = downstream invert
• N = number of additional manholes
• D = diameter (rise) of downstream pipe
In SewerCAD V8i, element property inferencing is only available for gravity elements.
There are two general cases for this tool
1. Layout new manholes - In this case, the user knows the elevations of the manholes at the beginning and end of a run and the physical properties of the downstream conduit but has not yet placed the intervening manholes and pipes. The user indi-cates the number of manholes that will be places in the gap and they will automat-ically be inserted. This is useful in laying out new systems.
2. Follow existing path - In this case, the user has laid out the manholes and the conduits between them. The user employs this tool to assign properties to the elements between the upstream and downstream nodes. This is more useful in filling in details of the system when the path is already determined whether for a new or existing run of conduits.
6-216 Bentley SewerCAD V8i User’s Guide
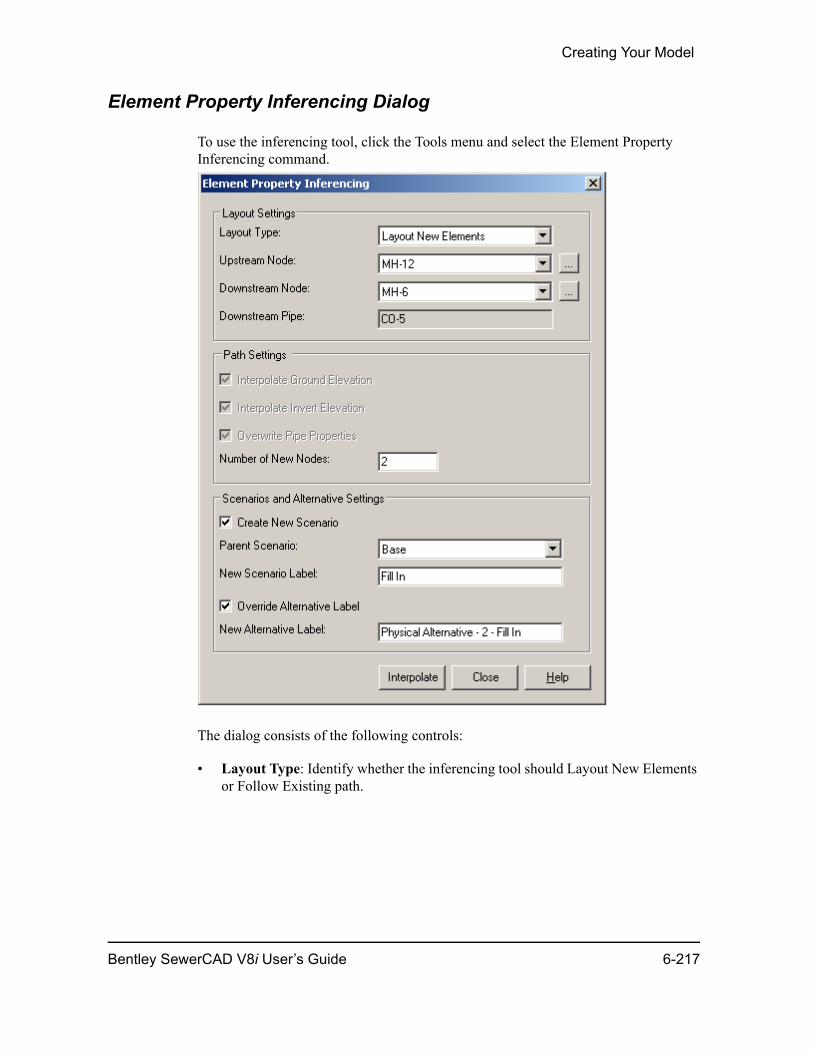
Creating Your Model
Element Property Inferencing Dialog
To use the inferencing tool, click the Tools menu and select the Element Property Inferencing command.
The dialog consists of the following controls:
• Layout Type: Identify whether the inferencing tool should Layout New Elements or Follow Existing path.
Bentley SewerCAD V8i User’s Guide 6-217
Element Property Inferencing
• Upstream Node and Downstream node: Pick the upstream and downstream nodes between which element properties are to be inferred. Click on the Ellipse (…) button to select the element from the drawing. Picking the element automati-cally returns control to this dialog. It is important that all data for the upstream and downstream elements already be entered when opening this dialog. If for example ground elevations are missing from a node, then the user should close this dialog and enter that data before opening this dialog.
• Downstream pipe: Field is automatically filled in when the user picks the Down-stream Node. If the user has attached more than a single downstream conduit to the downstream node, an error is generated.
• Interpolate ground elevations, Interpolate invert elevations and Overwrite pipe properties: If checked, the inference tool will overwrite default values in the nodes and pipes between the upstream and downstream nodes. However, if the user has manually assigned properties to these elements, those properties will be retained. These check boxes are only available when Follow Existing Path has been selected because for new elements (Layout New Elements), the user has no choice but to accept inferred values. The SewerCAD default elevation is 0 and default pipe size is 12 in. (300 mm). If the ground elevation has been set to 512 ft (156 m) and the pipe size set to 18 in. (450 mm), then the inference tool will only interpolate invert elevations for those elements.
• Number of New Nodes: This field is only available when the user has selected "Layout New Elements." If the user sets this value to N, the inference tool will place N nodes and N+1 conduits (of equal length) in a straight line between the upstream and downstream nodes. For example, if the distance is 1376 ft (419 m) and the user wants 2 new elements, then the inferencing tool will add two manholes and three pipes each 459 ft (140 m) long.
• Create new scenario: If the user checks this box, the tool will prompt for the name and the parent scenario for the scenario being created. If the user does not check this box, then the new elements and properties will be placed in the current scenario.
When a new scenario is created and the Parent Scenario is set to None, the alterna-tives that make up the scenario are selected based on the first scenario listed in the Scenario Manager, usually the Base scenario. After the Element Property Infer-encing tool creates a scenario, ensure that the other alternatives in the new scenario are set up properly (double-check active topology, inflows, initial setting, etc.).
• Parent scenario: Name of parent scenario if new scenario is being created.
• New scenario label: Name of new scenario if new scenario is being created.
• Override alternative label: When a new scenario is being created, the user can check this box if the user wants to control the name of the new physical alternative being created. If not, then the default new name is used.
• New alternative label: if the "Override alternative label" box is checked, then the user provides the new name here.
6-218 Bentley SewerCAD V8i User’s Guide
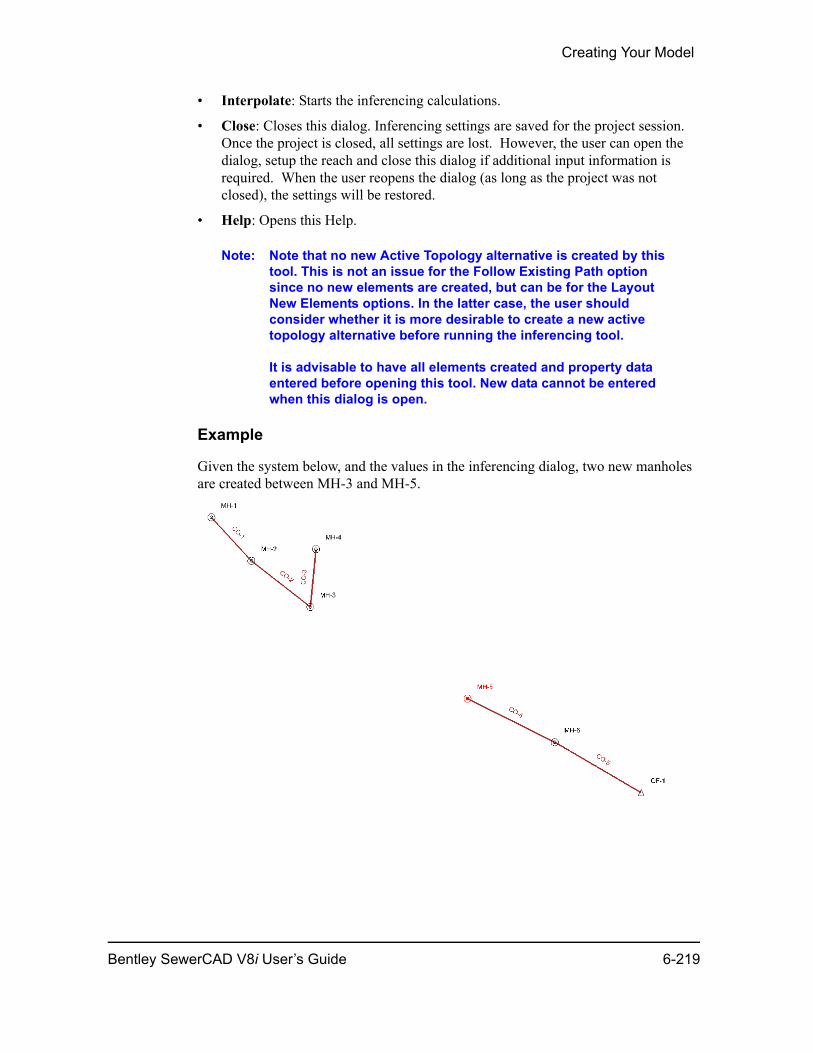
Creating Your Model
• Interpolate: Starts the inferencing calculations.
• Close: Closes this dialog. Inferencing settings are saved for the project session. Once the project is closed, all settings are lost. However, the user can open the dialog, setup the reach and close this dialog if additional input information is required. When the user reopens the dialog (as long as the project was not closed), the settings will be restored.
• Help: Opens this Help.
Note: Note that no new Active Topology alternative is created by this tool. This is not an issue for the Follow Existing Path option since no new elements are created, but can be for the Layout New Elements options. In the latter case, the user should consider whether it is more desirable to create a new active topology alternative before running the inferencing tool.
It is advisable to have all elements created and property data entered before opening this tool. New data cannot be entered when this dialog is open.
Example
Given the system below, and the values in the inferencing dialog, two new manholes are created between MH-3 and MH-5.
Bentley SewerCAD V8i User’s Guide 6-219
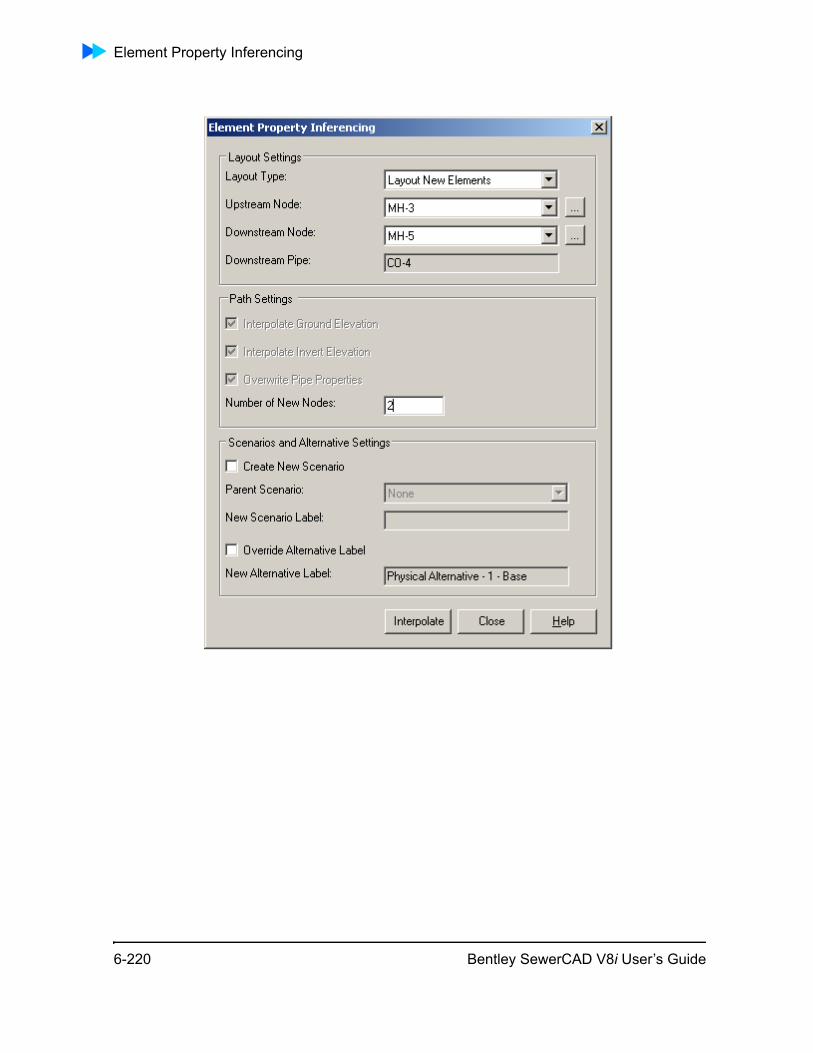
Element Property Inferencing
6-220 Bentley SewerCAD V8i User’s Guide
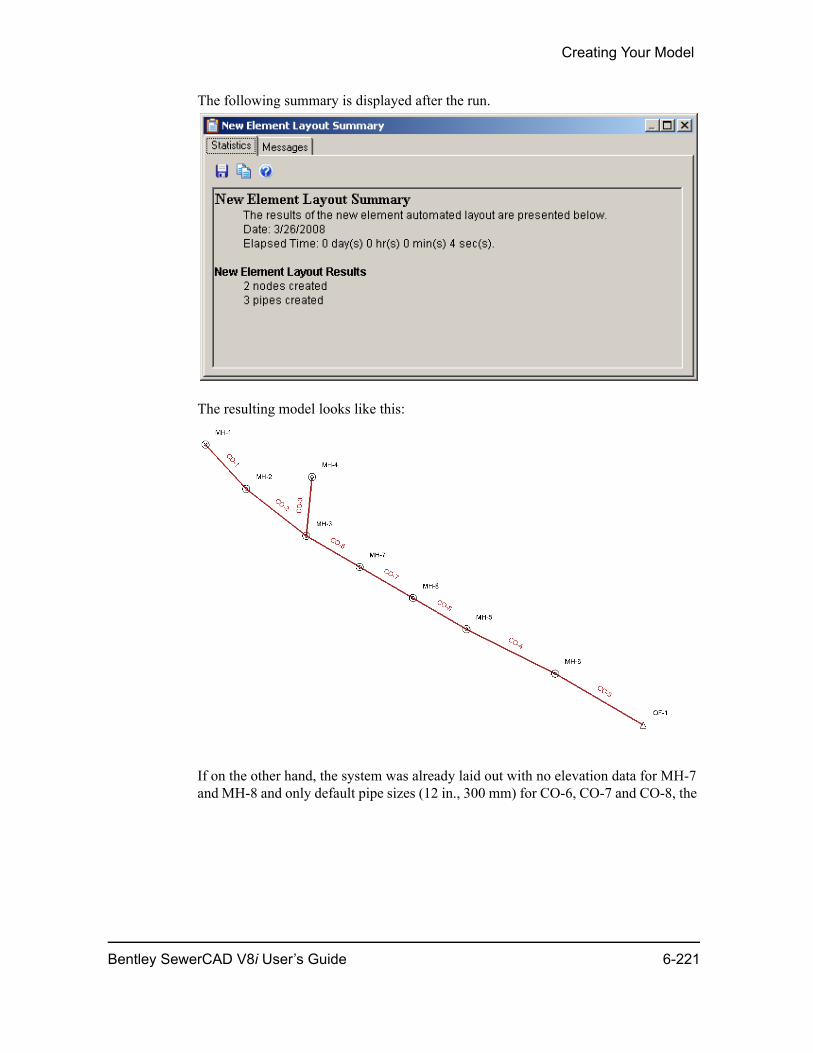
Creating Your Model
The following summary is displayed after the run.
The resulting model looks like this:
If on the other hand, the system was already laid out with no elevation data for MH-7 and MH-8 and only default pipe sizes (12 in., 300 mm) for CO-6, CO-7 and CO-8, the
Bentley SewerCAD V8i User’s Guide 6-221
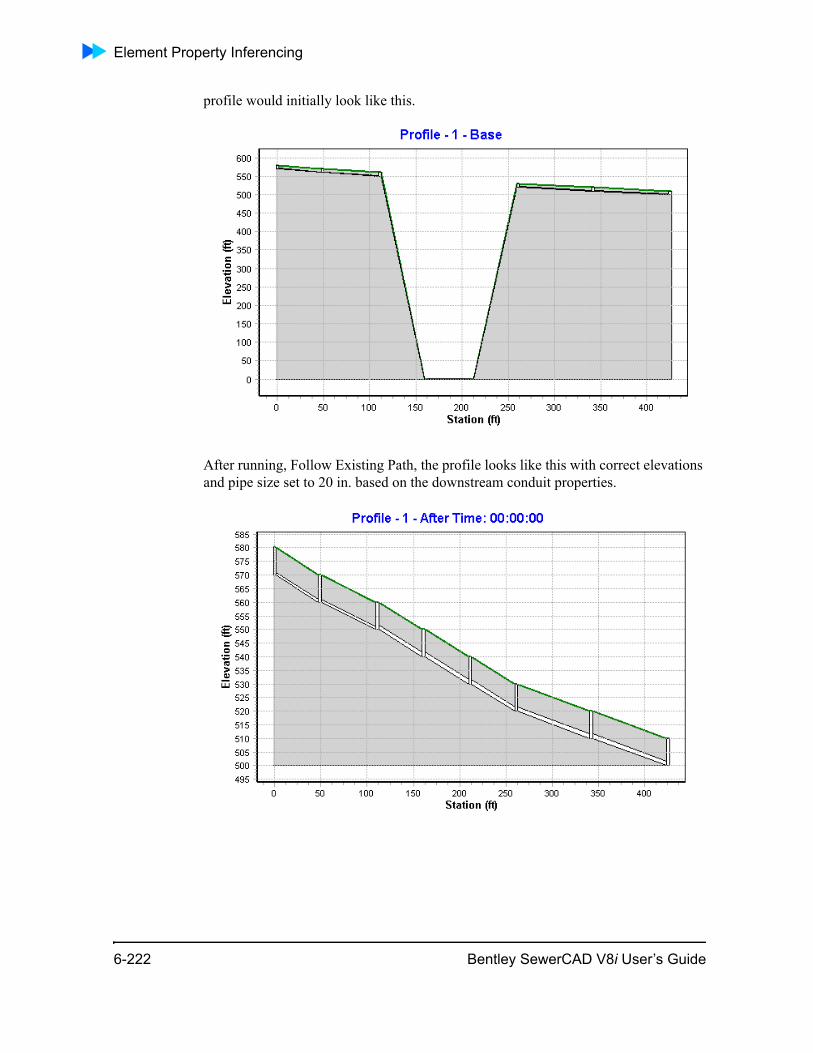
Element Property Inferencing
profile would initially look like this.
After running, Follow Existing Path, the profile looks like this with correct elevations and pipe size set to 20 in. based on the downstream conduit properties.
6-222 Bentley SewerCAD V8i User’s Guide
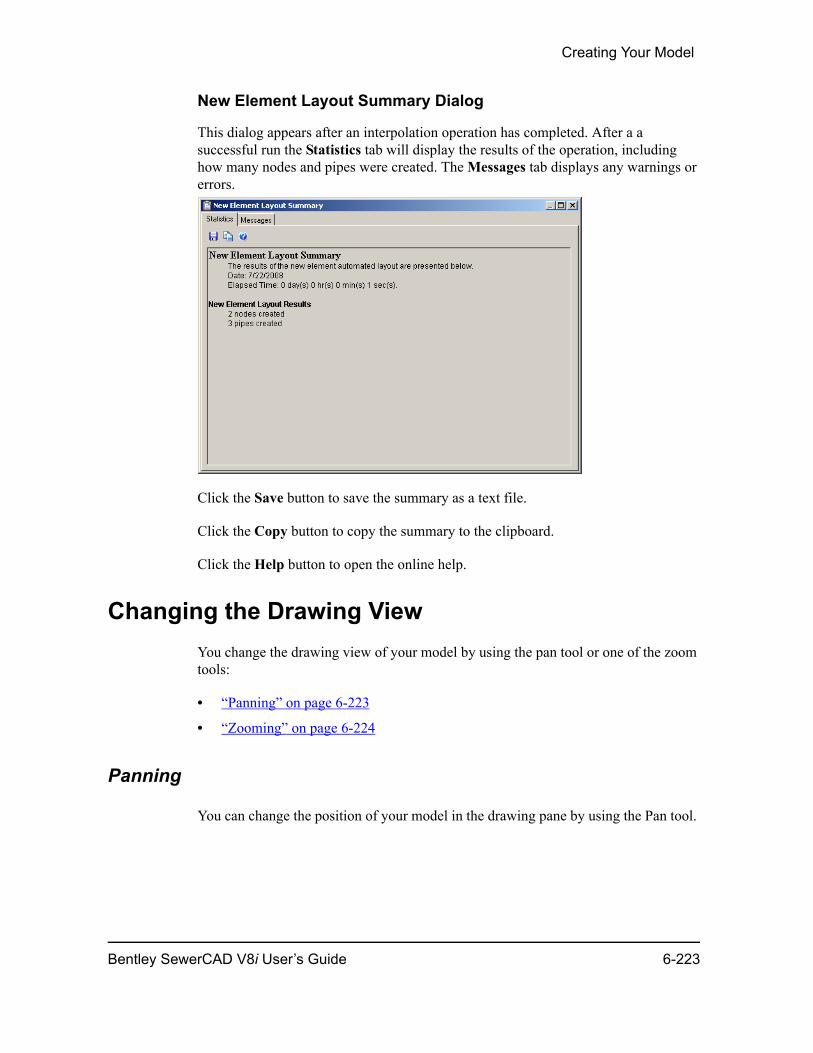
Creating Your Model
New Element Layout Summary Dialog
This dialog appears after an interpolation operation has completed. After a a successful run the Statistics tab will display the results of the operation, including how many nodes and pipes were created. The Messages tab displays any warnings or errors.
Click the Save button to save the summary as a text file.
Click the Copy button to copy the summary to the clipboard.
Click the Help button to open the online help.
Changing the Drawing ViewYou change the drawing view of your model by using the pan tool or one of the zoom tools:
• “Panning” on page 6-223
• “Zooming” on page 6-224
Panning
You can change the position of your model in the drawing pane by using the Pan tool.
Bentley SewerCAD V8i User’s Guide 6-223
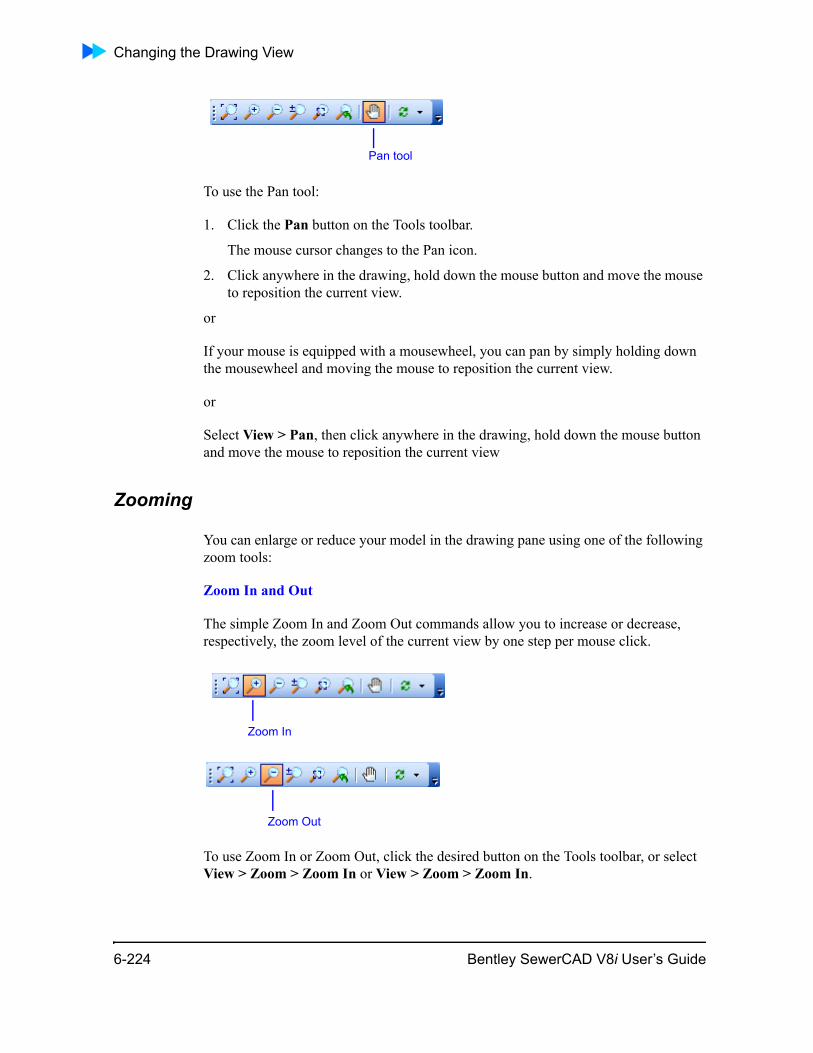
Changing the Drawing View
To use the Pan tool:
1. Click the Pan button on the Tools toolbar.
The mouse cursor changes to the Pan icon.
2. Click anywhere in the drawing, hold down the mouse button and move the mouse to reposition the current view.
or
If your mouse is equipped with a mousewheel, you can pan by simply holding down the mousewheel and moving the mouse to reposition the current view.
or
Select View > Pan, then click anywhere in the drawing, hold down the mouse button and move the mouse to reposition the current view
Zooming
You can enlarge or reduce your model in the drawing pane using one of the following zoom tools:
Zoom In and Out
The simple Zoom In and Zoom Out commands allow you to increase or decrease, respectively, the zoom level of the current view by one step per mouse click.
To use Zoom In or Zoom Out, click the desired button on the Tools toolbar, or select View > Zoom > Zoom In or View > Zoom > Zoom In.
Pan tool
Zoom In
Zoom Out
6-224 Bentley SewerCAD V8i User’s Guide
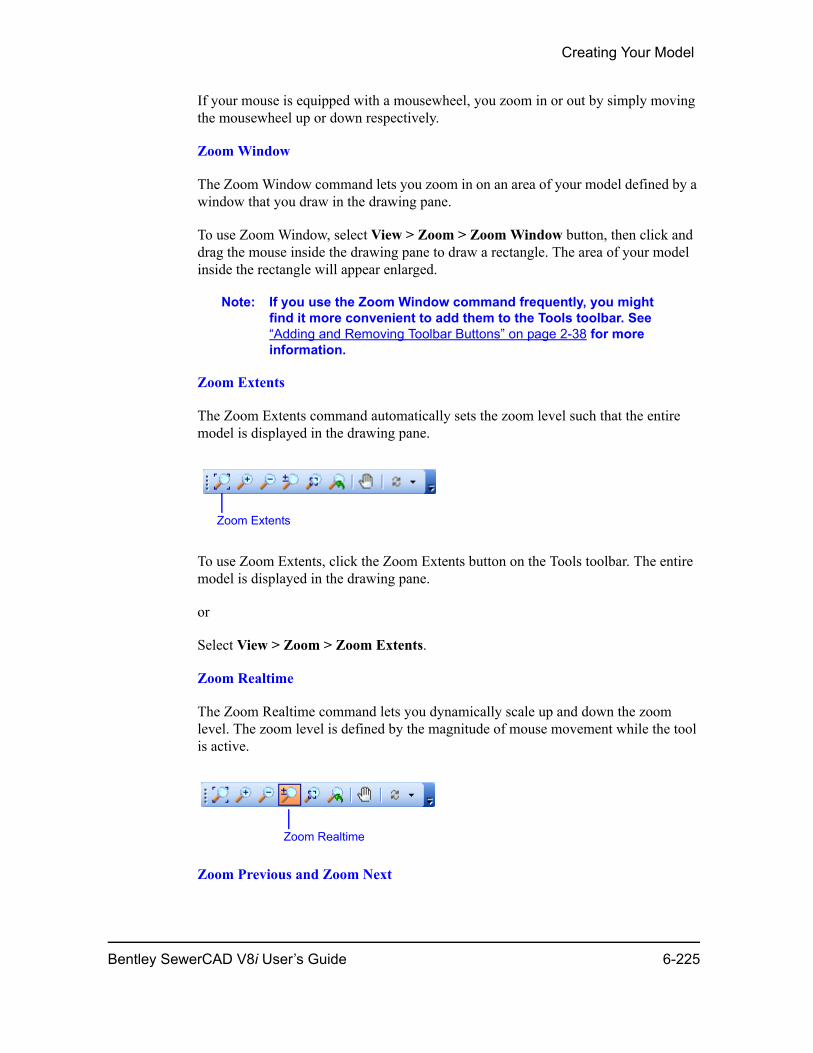
Creating Your Model
If your mouse is equipped with a mousewheel, you zoom in or out by simply moving the mousewheel up or down respectively.
Zoom Window
The Zoom Window command lets you zoom in on an area of your model defined by a window that you draw in the drawing pane.
To use Zoom Window, select View > Zoom > Zoom Window button, then click and drag the mouse inside the drawing pane to draw a rectangle. The area of your model inside the rectangle will appear enlarged.
Note: If you use the Zoom Window command frequently, you might find it more convenient to add them to the Tools toolbar. See “Adding and Removing Toolbar Buttons” on page 2-38 for more information.
Zoom Extents
The Zoom Extents command automatically sets the zoom level such that the entire model is displayed in the drawing pane.
To use Zoom Extents, click the Zoom Extents button on the Tools toolbar. The entire model is displayed in the drawing pane.
or
Select View > Zoom > Zoom Extents.
Zoom Realtime
The Zoom Realtime command lets you dynamically scale up and down the zoom level. The zoom level is defined by the magnitude of mouse movement while the tool is active.
Zoom Previous and Zoom Next
Zoom Extents
Zoom Realtime
Bentley SewerCAD V8i User’s Guide 6-225
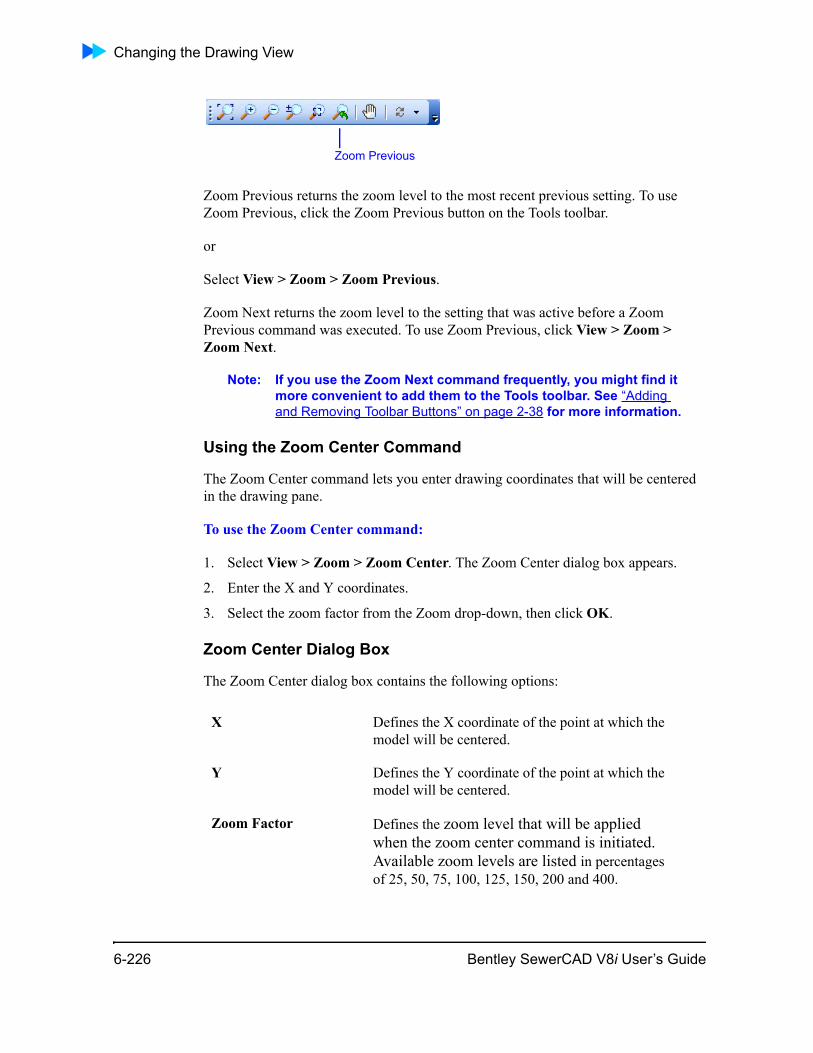
Changing the Drawing View
Zoom Previous returns the zoom level to the most recent previous setting. To use Zoom Previous, click the Zoom Previous button on the Tools toolbar.
or
Select View > Zoom > Zoom Previous.
Zoom Next returns the zoom level to the setting that was active before a Zoom Previous command was executed. To use Zoom Previous, click View > Zoom > Zoom Next.
Note: If you use the Zoom Next command frequently, you might find it more convenient to add them to the Tools toolbar. See “Adding and Removing Toolbar Buttons” on page 2-38 for more information.
Using the Zoom Center Command
The Zoom Center command lets you enter drawing coordinates that will be centered in the drawing pane.
To use the Zoom Center command:
1. Select View > Zoom > Zoom Center. The Zoom Center dialog box appears.
2. Enter the X and Y coordinates.
3. Select the zoom factor from the Zoom drop-down, then click OK.
Zoom Center Dialog Box
The Zoom Center dialog box contains the following options:
Zoom Previous
X Defines the X coordinate of the point at which the model will be centered.
Y Defines the Y coordinate of the point at which the model will be centered.
Zoom Factor Defines the zoom level that will be applied when the zoom center command is initiated. Available zoom levels are listed in percentages of 25, 50, 75, 100, 125, 150, 200 and 400.
6-226 Bentley SewerCAD V8i User’s Guide
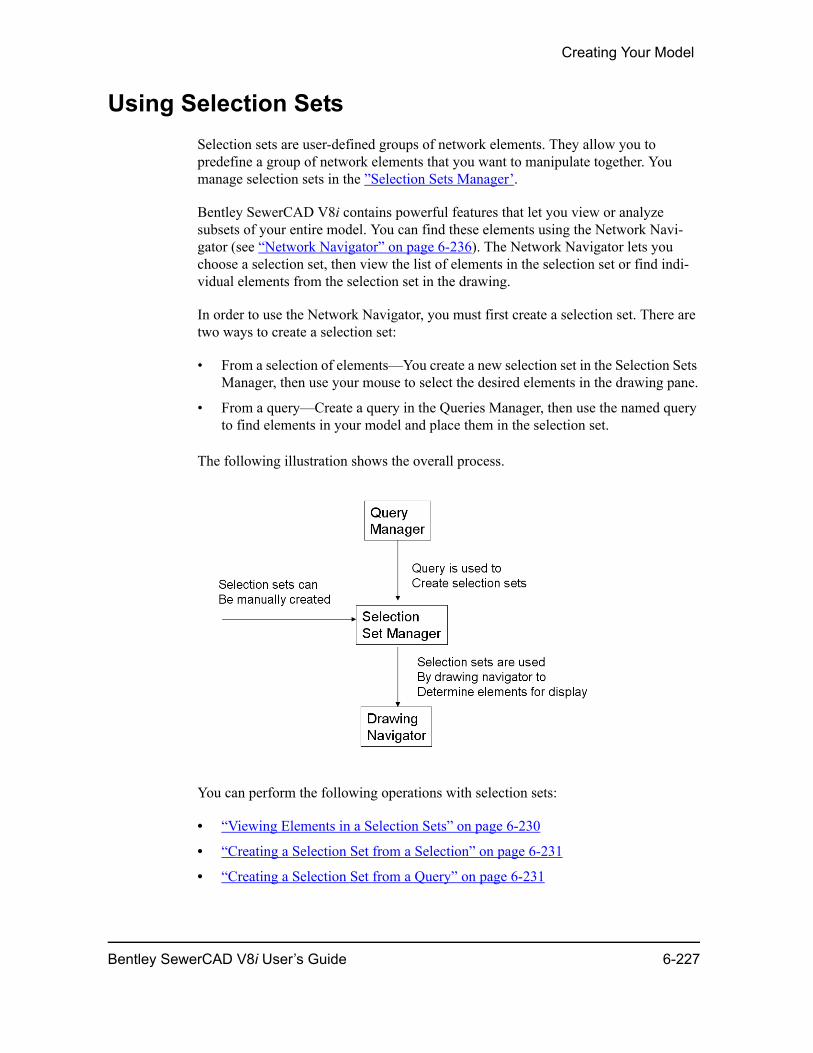
Creating Your Model
Using Selection SetsSelection sets are user-defined groups of network elements. They allow you to predefine a group of network elements that you want to manipulate together. You manage selection sets in the ”Selection Sets Manager’.
Bentley SewerCAD V8i contains powerful features that let you view or analyze subsets of your entire model. You can find these elements using the Network Navi-gator (see “Network Navigator” on page 6-236). The Network Navigator lets you choose a selection set, then view the list of elements in the selection set or find indi-vidual elements from the selection set in the drawing.
In order to use the Network Navigator, you must first create a selection set. There are two ways to create a selection set:
• From a selection of elements—You create a new selection set in the Selection Sets Manager, then use your mouse to select the desired elements in the drawing pane.
• From a query—Create a query in the Queries Manager, then use the named query to find elements in your model and place them in the selection set.
The following illustration shows the overall process.
You can perform the following operations with selection sets:
• “Viewing Elements in a Selection Sets” on page 6-230
• “Creating a Selection Set from a Selection” on page 6-231
• “Creating a Selection Set from a Query” on page 6-231
Bentley SewerCAD V8i User’s Guide 6-227
Using Selection Sets
• “Adding Elements to a Selection Set” on page 6-233
• “Removing Elements from a Selection Set” on page 6-234
Selection Sets Manager
The Selection Sets Manager allows you to create, edit, and navigate to selection sets. The Selection Sets Manager consists of a toolbar and a list pane, which displays all of the selection sets that are associated with the current project.
6-228 Bentley SewerCAD V8i User’s Guide
Creating Your Model
The toolbar contains the following buttons:
New Contains the following commands:
• Create from Selection—Creates a new static selection set from elements you select in your model.
• Create from Query—Creates a new dynamic selection set from existing queries.
Delete Deletes the selection set that is currently highlighted in the list pane. This command is also available from the short-cut menu, which you can access by right-clicking an item in the list pane.
Bentley SewerCAD V8i User’s Guide 6-229
Using Selection Sets
You can view the properties of a selection in the Property Editor by right-clicking the selection set in the list pane and selecting Properties from the shortcut menu.
Viewing Elements in a Selection Sets
You use the Network Navigator to view the elements that make up a selection set.
Edit • When a selection-based selection set is highlighted when you click this button, opens the Selection Set Element Removal dialog box, which lets you edit the selection set. This command is also available from the short-cut menu, which you can access by right-clicking an item in the list pane.
• When a query-based selection set is highlighted when you click this button, opens the Selection By Query dialog box, which lets you add or remove queries from the selection set. This command is also available from the short-cut menu, which you can access by right-clicking an item in the list pane.
Rename Lets you rename the selection set that is currently highlighted in the list pane. This command is also available from the short-cut menu, which you can access by right-clicking an item in the list pane.
Select In Drawing Lets you quickly select all the elements in the drawing pane that are part of the currently highlighted selection set. Once you have selected the elements in a selection set using Select In Drawing, you can delete them all at once or create a report on them. This command is also available from the short-cut menu, which you can access by right-clicking an item in the list pane.
Help Displays online help for the Selection Sets Manager.
6-230 Bentley SewerCAD V8i User’s Guide
Creating Your Model
To view the elements that make up a selection set:
1. Open the Network Navigator by selecting View > Network Navigator or clicking the Network Navigator button on the View toolbar.
2. Select a selection set from the Selection Set drop-down list. The elements in the selection set appear in the Network Navigator.
Tip: You can double-click an element in the Network Navigator to select and center it in the Drawing Pane.
Creating a Selection Set from a Selection
You create a new selection set by selecting elements in your model.
To create a new selection set from a selection:
1. Select all of the elements you want in the selection set by either drawing a selec-tion box around them or by holding down the Ctrl key while clicking each one in turn.
2. When all of the desired elements are highlighted, right-click and select Create Selection Set.
3. Type the name of the selection set you want to create, then click OK to create the new selection set. Click Cancel to close the dialog box without creating the selec-tion set.
4. Alternatively, you can open the Selection Set Manager and click the New button and select Create from Selection. Bentley SewerCAD V8i prompts you to select one or more elements.
Create Selection Set Dialog Box
This dialog box appears when you create a new selection set. It contains the following field:
Creating a Selection Set from a Query
You create a dynamic selection set by creating a query-based selection set. A query-based selection set can contain one or more queries, which are valid SQL expressions.
New selection set name Lets you type the name of the new selection set.
Bentley SewerCAD V8i User’s Guide 6-231
Using Selection Sets
To create a new selection set from a query:
1. In the Selection Sets Manager, click the New button and select Create from Query. The Selection by Query dialog box appears.
2. Available queries appear in the list pane on the left; queries selected to be part of the selection set appear in the list pane on the right. Use the arrow buttons in the middle of the dialog to add one or all queries from the Available Queries list to the Selected Queries list, or to remove queries from the Selected list.
– You can also double-click queries on either side of the dialog box to add them to or remove them from the selection set.
Selection by Query Dialog Box
The Selection by Query dialog box lets you create selection sets from available queries. The dialog box contains the following controls:
Available Queries Contains all the queries that are available for your selection set. The Available Columns list is located on the left side of the dialog box.
Selected Queries Contains queries that are part of the selection set. To add queries to the Selected Queries list, select one or more queries in the Available Queries list, then click the Add button [>].
6-232 Bentley SewerCAD V8i User’s Guide
Creating Your Model
Adding Elements to a Selection Set
You can add a single or multiple elements to a static selection set.
To add an element to a static selection set:
1. Right-click the element to be added, then select Add to Selection Set from the shortcut menu.
2. In the Add to Selection Set dialog box, select the selection set to which you want to add the element.
3. Click OK to close the dialog box and add the element to the selected selection set. Click Cancel to close the dialog box without creating the selection set.
To add a group of elements to a static selection set all at once:
1. Select all of the elements to be added by either drawing a selection box around them, or by holding down the Ctrl key while clicking each one in turn.
2. When all of the desired elements are highlighted, right-click and select Add to Selection Set.
Query Manipulation Buttons
Lets you select or clear queries to be used in the selection set:
• [ > ] Adds the selected items from the Avail-able Queries list to the Selected Queries list.
• [ >> ] Adds all of the items in the Available Queries list to the Selected Queries list.
• [ < ] Removes the selected items from the Selected Queries list.
• [ << ] Removes all items from the Selected Queries list.
Note: You can select multiple queries in the Available Queries list by holding down the Shift key or the Control key while clicking with the mouse. Holding down the Shift key provides group selection behavior. Holding down the Control key provides single element selection behavior.
Bentley SewerCAD V8i User’s Guide 6-233
Using Selection Sets
3. In the Add to Selection Set dialog box, select the selection set to which you want to add the element.
4. Click OK to close the dialog box and add the element to the selected selection set. Click Cancel to close the dialog box without creating the selection set.
Add To Selection Set Dialog Box
This dialog box appears when you select the Add to Selection Set command. It contains the following field:
Removing Elements from a Selection Set
You can easily remove elements from a static selection set in the Selection Set Element Removal dialog box.
To remove an element from a static selection set:
1. Display the Selection Sets Manager by selecting View > Selection Sets or clicking the Selection Sets button on the View toolbar.
2. In the Selection Sets Manager, select the desired selection set then click the Edit button.
3. In the Selection Set Element Removal dialog box, find the element you want to remove in the table. Select the element label or the entire table row, then click the Delete button.
4. Click OK.
Selection Set Element Removal Dialog Box
This dialog appears when you click the edit button from the Selection Set Manager. It allows you to remove elements from the selection set that is highlighted in the Selec-tion Sets Manager when the Edit button is clicked.
Performing Group-Level Operations on Selection Sets
SewerCAD V8i lets you perform group-level deletions on elements in a selection set using the Select In Drawing button in the Selection Sets Manager.
Add to: Drop-down menu that lets you select the selection set to which the currently highlighted element or elements will be added.
6-234 Bentley SewerCAD V8i User’s Guide

Creating Your Model
Note: While it is not possible to directly edit groups of elements in a selection set, you can use the Next button in the Network Navigator to quickly navigate through each element in the selection set and edit its properties in the Property Editor.
To delete multiple elements from a selection set:
1. Open the Selection Sets Manager by selecting View > Selection Sets or clicking the Selection Sets button on the View toolbar.
2. In the Selection Sets Manager, highlight the selection set that contains elements you want to delete.
3. Click the Select In Drawing button in the Selection Sets Manager to highlight all of the selection set’s elements in the drawing pane.
– If there is only one selection set listed in the Selection Set Manager, you don’t have to highlight it before clicking the Select In Drawing button.
4. Shift-click (hold down the Shift key and click the left mouse button) any selected elements that you do not want to delete.
5. Right-click and select Delete. The highlighted elements in the selection set are deleted from your model.
To create a report on a group of elements in a selection set:
1. Open the Selection Sets Manager by selecting View > Selection Sets or clicking the Selection Sets button on the View toolbar.
2. In the Selection Sets Manager, highlight the selection set that contains elements you want to report on.
3. Click the Select In Drawing button in the Selection Sets Manager to highlight all of the selection set’s elements in the drawing pane.
– If there is only one selection set listed in the Selection Set Manager, you don’t have to highlight it before clicking the Select In Drawing button.
4. Shift-click (hold down the Shift key and click the left mouse button) any selected elements that you do not want to include in the report.
5. Right-click and select Report. A report window displays the report.
Bentley SewerCAD V8i User’s Guide 6-235
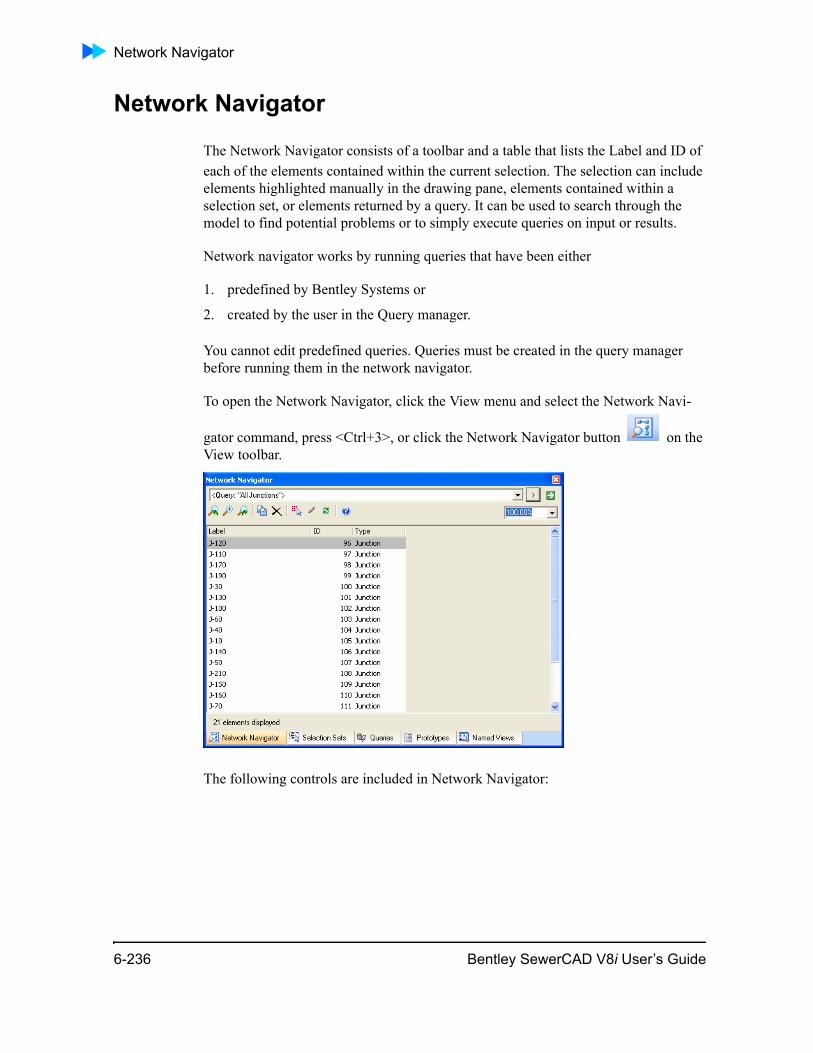
Network Navigator
Network Navigator
The Network Navigator consists of a toolbar and a table that lists the Label and ID of each of the elements contained within the current selection. The selection can include elements highlighted manually in the drawing pane, elements contained within a selection set, or elements returned by a query. It can be used to search through the model to find potential problems or to simply execute queries on input or results.
Network navigator works by running queries that have been either
1. predefined by Bentley Systems or
2. created by the user in the Query manager.
You cannot edit predefined queries. Queries must be created in the query manager before running them in the network navigator.
To open the Network Navigator, click the View menu and select the Network Navi-
gator command, press <Ctrl+3>, or click the Network Navigator button on the View toolbar.
The following controls are included in Network Navigator:
6-236 Bentley SewerCAD V8i User’s Guide
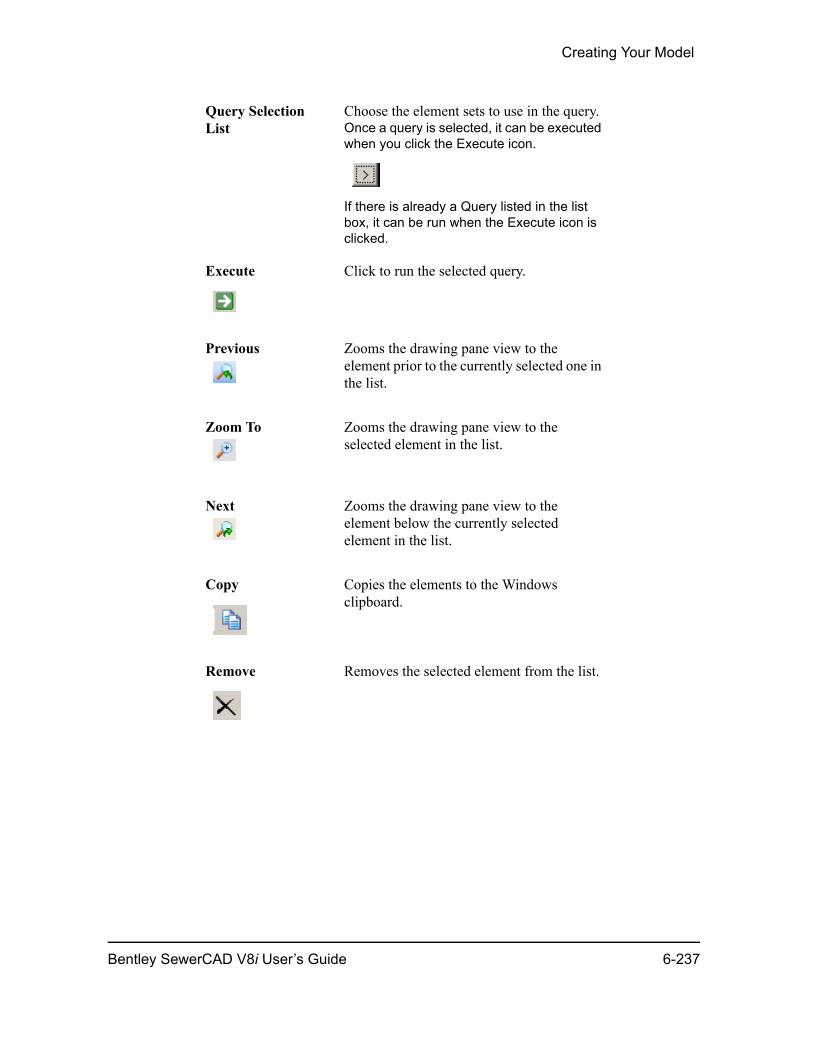
Creating Your Model
Query Selection List
Choose the element sets to use in the query.Once a query is selected, it can be executed when you click the Execute icon.
If there is already a Query listed in the list box, it can be run when the Execute icon is clicked.
Execute Click to run the selected query.
Previous Zooms the drawing pane view to the element prior to the currently selected one in the list.
Zoom To Zooms the drawing pane view to the selected element in the list.
Next Zooms the drawing pane view to the element below the currently selected element in the list.
Copy Copies the elements to the Windows clipboard.
Remove Removes the selected element from the list.
Bentley SewerCAD V8i User’s Guide 6-237

Network Navigator
Predefined Queries
The Network Navigator provides access to a number of predefined queries grouped categorically, accessed by clicking the [>] button. Categories and the queries contained therein include:
Element types - finds all elements of a specified type (e.g. all pumps).
Network review - finds potential problems in the model (e.g. finding disconnected elements). This is a very powerful tool for model cleanup.
Network trace - finds elements with specific relationships between them (e.g. trace downstream to outfall)
Input - finds elements in model with specified properties (e.g. find elliptical pipes)
Results - finds elements in model with results that meet the query criteria (e.g. conduits that are surcharged in this time step)
User Defined Queries
In addition to predefined queries, you can create your own queries in the ”Queries Manager’. These queries can be saved with the project or in a shared file.
Select In Drawing Selects the elements in the drawing pane and performs a zoom extent based on the selection.
Highlight When this toggle button is on, elements returned by a query will be highlighted in the drawing pane to increase their visibility.
Refresh Drawing Refreshes the current selection.
Help Opens SewerCAD V8i Help.
6-238 Bentley SewerCAD V8i User’s Guide
Creating Your Model
Using PrototypesPrototypes allow you to enter default values for elements in your network. These values are used while laying out the network. Prototypes can reduce data entry requirements dramatically if a group of network elements share common data.
For example, if a section of the network contains all three foot-diameter manholes , use the manhole prototype to set the Diameter field to 3.00 ft. When you create a new manhole in your model, its diameter attribute will default to 3.00 ft.
Note: Changes to the prototypes are not retroactive and will not affect any elements created prior to the change.
If a section of your system has distinctly different characteristics than the rest of the system, adjust your prototypes before laying out that section. This will save time when you edit the properties later.
For instructions on how to create prototypes, see “Creating Prototypes” on page 6-239.
Creating Prototypes
Prototypes contain default values for Bentley SewerCAD V8i elements. You create prototypes in the Prototypes Manager.
To create a prototype:
1. Open your Bentley SewerCAD V8i project or start a new project.
2. Select View > Prototypes or press Ctrl+6.
The Prototypes Manager opens. All Bentley SewerCAD V8i element types are displayed in an expanding and collapsing list.
3. Select the element type for which you want to create a prototype, then click the New button.
The element type in the list expands to display all the prototypes that exist for that element type.
Each element type contains a default prototype, which is not editable, and any prototypes that you have created. The current set of default values for each element type is identified by the Make Current icon.
4. Double-click the prototype you just created. The Property Editor for the element type opens.
5. Edit the attribute values in the Property Editor as required.
Bentley SewerCAD V8i User’s Guide 6-239
Using Prototypes
6. To make the new prototype the default, click the Make Current button in the Prototypes Manager.
The icon next to the prototype changes to indicate that the values in the prototype will be applied to all instances of that element type that you add to your current project.
7. Perform the following optional steps:
– To rename a prototype, select the prototype in the list and click the Rename button.
– To delete a prototype, select the prototype in the list and click the Delete button.
– To view a report of the default values in the prototype, select the prototype in the list and click the Report button.
Prototypes Manager
The Prototypes Manager allows you to create prototypes, which contain default common data for each element type. The Prototypes Manager consists of a toolbar and a list pane, which displays all of the elements available in Bentley SewerCAD V8i.
The list of elements in the Prototypes Manager list pane is expandable and collapsible. Click on the Plus sign to expand an element and see its associated prototypes. Click on the Minus sign to collapse the element.
Each element in the list pane contains a default prototype; you cannot edit this default prototype. The default prototypes contains common values for each element type; if you add elements to your model without creating new prototypes, the data values in the default prototypes appear in the Property Editor for that element type.
The toolbar contains the following buttons:
6-240 Bentley SewerCAD V8i User’s Guide
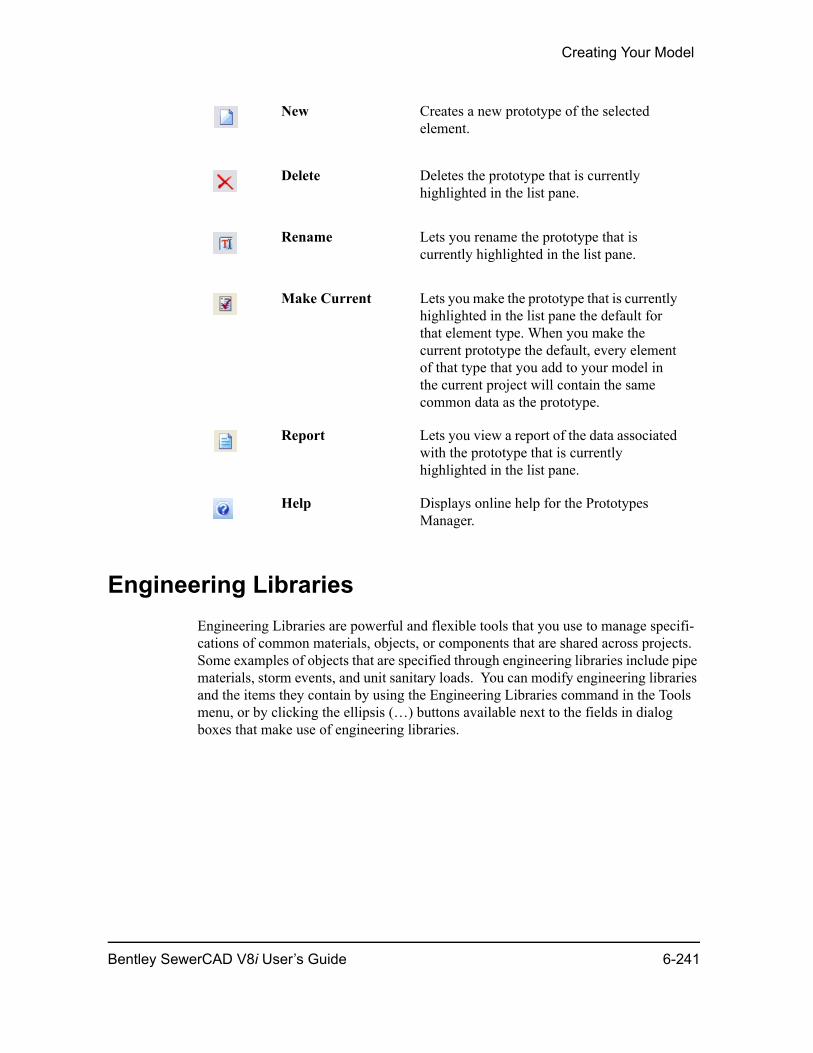
Creating Your Model
Engineering LibrariesEngineering Libraries are powerful and flexible tools that you use to manage specifi-cations of common materials, objects, or components that are shared across projects. Some examples of objects that are specified through engineering libraries include pipe materials, storm events, and unit sanitary loads. You can modify engineering libraries and the items they contain by using the Engineering Libraries command in the Tools menu, or by clicking the ellipsis (…) buttons available next to the fields in dialog boxes that make use of engineering libraries.
New Creates a new prototype of the selected element.
Delete Deletes the prototype that is currently highlighted in the list pane.
Rename Lets you rename the prototype that is currently highlighted in the list pane.
Make Current Lets you make the prototype that is currently highlighted in the list pane the default for that element type. When you make the current prototype the default, every element of that type that you add to your model in the current project will contain the same common data as the prototype.
Report Lets you view a report of the data associated with the prototype that is currently highlighted in the list pane.
Help Displays online help for the Prototypes Manager.
Bentley SewerCAD V8i User’s Guide 6-241
Engineering Libraries
Note: The data for each engineering library is stored in an XML file in your Bentley SewerCAD V8i program directory. We strongly recommend that you edit these files only using the built-in tools available by selecting Tools > Engineering Libraries.
You work with engineering libraries and the items they contain in the Engineering Libraries dialog box, which contains all of the project’s engineering libraries. Indi-vidual libraries are compilations of library entries, along with their attributes. For more information about working with engineering libraries, see “Working with Engi-neering Libraries” on page 6-242.
By default, each project you create in SewerCAD V8i uses the items in the default libraries. In special circumstances, you may wish to create custom libraries to use with one or more projects. You can do this by copying a standard library or creating a new library.
When you change the properties for an item in an engineering library, those changes affect all projects that use that library item. At the time a project is loaded, all of its engineering library items are synchronized to the current library. Items are synchro-nized based on their label. If the label is the same, then the item’s values will be made the same.
The default libraries that are installed with Bentley SewerCAD V8i are editable. In addition, you can create a new library of any type, and can then create new entries of your own definition.
• Library types are displayed in the Engineering Library manager in an expanding/collapsing tree view.
• Library types can contain categories and subcategories, represented as folders in the tree view.
• Individual library entries are contained within the categories, subcategories, and folders in the tree view.
• Libraries, categories, folders, and library entries are displayed in the tree view with their own unique icons. You can right-click these icons to display submenus with different commands.
Working with Engineering Libraries
When you select a library entry in the tree view, the attributes and attribute values associated with the entry are displayed in the editor pane on the right side of the dialog box.
Working with Libraries
6-242 Bentley SewerCAD V8i User’s Guide

Creating Your Model
Right-clicking a Library icon in the tree view opens a shortcut menu containing the following commands:
Create Library Creates a new engineering library of the currently highlighted type.
Add Existing Library Lets you add an existing engineering library that has been stored on your hard drive as an .xml file to the current project.
Bentley SewerCAD V8i User’s Guide 6-243
Engineering Libraries
Working with Categories
Right-clicking a Category icon in the tree view opens a shortcut menu containing the following commands:
Working with Folders
Right-clicking a Folder icon in the tree view opens a shortcut menu containing the following commands:
Working with Library Entries
Right-clicking a Library Entry icon in the tree view opens a shortcut menu containing the following commands:
Add Item Creates a new entry within the current library.
Add Folder Creates a new folder under the currently highlighted library.
Save As Lets you save the currently highlighted category as an .xml file that can then be used in future projects.
Remove Deletes the currently highlighted category from the library.
Add Item Creates a new entry within the current folder.
Add Folder Creates a new folder under the currently highlighted folder.
Rename Lets you rename the currently highlighted folder.
Delete Deletes the currently highlighted folder and its contents.
Rename Lets you rename the currently highlighted entry.
Delete Deletes the currently highlighted entry from the library.
6-244 Bentley SewerCAD V8i User’s Guide
Creating Your Model
Engineering Libraries Dialog Box
The Engineering Libraries dialog box contains an explorer tree-view pane on the left, a library entry editor pane on the right, and the following buttons above the explorer tree view pane:
Sharing Engineering Libraries On a Network
You can share engineering libraries with other SewerCAD V8i users in your organiza-tion by storing the engineering libraries on a network drive. All users who will have access to the shared engineering library should have read-write access to the network folder in which the library is located.
To share an engineering library on a network, open the Engineering Libraries in SewerCAD V8i and create a new library in a network folder to which all users have read-write access.
Converting Legacy Engineering Library Files
You can convert your legacy format engineering library files (.hlb) to the .xml format used in SewerCAD V8i using the WaterObjects.Net.EngineeringLibraryCon-verter.exe utility. This utility can be found in your Bentley/SewerCAD8 folder.
The utility consists of the following controls:
• Product: Select whether the .hlb file to be converted is a SewerGEMS, Water-GEMS, StormCAD, or SewerCAD engineering library file.
• Library Type: Select the type of engineering library you are converting.
New Opens a submenu containing the following commands:
• Create Library—Creates a new engi-neering library.
• Add Existing Library—Lets you add an existing engineering library that has been stored on your hard drive as an .xml file to the current project.
Delete Removes the currently highlighted engineering library from the current project.
Rename Lets you rename the currently highlighted engineering library.
Bentley SewerCAD V8i User’s Guide 6-245

Engineering Libraries
• HLB Library File: Enter the path of the .hlb file to be converted, or click the Browse button to find it using a Windows browse dialog.
• Material Library: Enter the path of the material.hlb file. This control is only available when the Library Type being converted is a Section Size library.
• Use SI Label: Check this box if the library being converted uses System Interna-tional (SI) units.
• Destination Root: Enter the path where the converted .xml file should be created, or click the Browse button to browse to the location.
• Convert: Click this button to perform the conversion.
• Close: Closes the utility dialog.
To convert an .hlb Engineering Library file to an .xml Engineering Library file
1. Double-click the WaterObjects.Net.EngineeringLibraryConverter.exe utility found in the Bentley/SewerCAD8 folder.
2. In the Classic Engineering Library Converter Utility dialog that appears, select SewerCAD from the Product menu.
3. Choose the Library Type that is stored in the .hlb file to be converted.
4. Click the Browse button next to the HLB Library File field and find the .hlb file to be converted.
5. If the Library Type you are converting is a Section Size library:
a. Click the Browse button next to the Material Library field and find the material.hlb file associated with the Section Size .hlb file to be converted.
b. Place a check in the Use SI Label box if the Section Size library file uses SI units.
6. Click the Browse button next to the Destination Root field and browse to the directory where you want the new .xml engineering library file to be created.
7. Click the Convert button.
To import the converted .xml Engineering Library file
1. Click the Components menu and select Engineering Libraries.
2. In the Engineering Libraries dialog, highlight the library type associated with the .xml file to be imported.
3. Click the New button and select Add Existing Library.
4. Browse to the directory you specifed during step 6 of the conversion process above, select the .xml file, and click Open.
6-246 Bentley SewerCAD V8i User’s Guide

Creating Your Model
Conduit Catalog Dialog Box
This dialog box allows you to create, edit, and view catalog conduits. Catalog conduits are an efficient way to reuse common physical conduit definitions.
Bentley SewerCAD V8i User’s Guide 6-247
Engineering Libraries
The dialog box contains a toolbar, a Conduit Catalog list pane, and two tabs. The toolbar contains the following buttons:
New Creates a new entry in the Conduit Catalog List Pane.
Delete Deletes the entry that is currently highlighted in the Conduit Catalog List Pane.
Rename Lets you rename the entry that is currently highlighted in the Conduit Catalog List Pane.
Report Lets you generate a preformatted report that contains the input data associated with the entry that is currently highlighted in the Conduit Catalog List Pane.
Synchronize Clicking this button opens a submenu containing the following commands:• Browse Engineering Library—This
command opens the Engineering Library manager dialog, allowing you to browse the Conduit Catalog Library.
• Synchronize From Library—This command allows you to update a conduit catalog that was previously imported from a Conduit Catalog Engineering Library to reflect changes that have been made to the library since it was imported.
• Synchronize To Library—This command allows you to update an existing Conduit Catalog Engineering Library using current Conduit Catalog entries that were initially imported but have since been modified.
• Import From Library—This command allows you to import catalog entries from an existing Conduit Catalog Engineering Library.
• Export To Library—This command allows you to export the current catalog entries to an existing Conduit Catalog Engineering Library.
6-248 Bentley SewerCAD V8i User’s Guide
Creating Your Model
The following table describes the rest of the controls in the Conduit Catalog dialog box.
Conduit Catalog List Pane
Located on the left side of the dialog box, displays a list of all of the catalog conduits that have been defined in the current project. Highlighting a catalog conduit in this list causes the Cross Section Shape and Roughness Sections to display the associated information with the highlighted conduit.
Cross Section Shape Located in the top-right corner of the Conduit Catalog tab, contains controls that allow you to define the size and shape of the catalog conduit currently highlighted in the List Pane. The controls that appear change according to the Cross Section Type that is selected.
Cross Section Type Lets you define the type of cross section for the currently highlighted catalog conduit.The following conduit cross section types are only available in the catalog conduit to support import from SewerGEMS:• Basket Handle
• Horseshoe
• Egg
• Semi-Elliptical
They can be created in the conduit catalog but can not be referenced by a conduit in the model.
Diameter Lets you define the diameter of the conduit. This field is only available for Circular catalog conduits.
<Section Type> Rise Lets you define the rise (height) of the catalog conduit. This field is available for all cross section types except Circular.
<Section Type> Span Lets you define the span (width) of the catalog conduit. This field is available for all cross section types except Circular.
Roughness Located in the bottom-right corner of the Conduit Catalog tab, lets you define the roughness attributes of the catalog conduit currently highlighted in the List Pane. The controls that are available change depending on the Roughness Type selected.
Bentley SewerCAD V8i User’s Guide 6-249
Engineering Libraries
Roughness Type Lets you specify which of the available roughness methods to be applied to the catalog conduit currently highlighted in the List Pane. The other controls available in section are dependent on the selection made in this box.
Material Lets you enter a material label. This field is informational only, and will not affect the roughness properties of the associated catalog entry.
Manning’s n Lets you define the roughness value for the catalog conduit. This field is available only when the Roughness Type is Single Manning’s n.
Depth vs. Manning’s Table
Lets you define a depth vs. roughness curve for the catalog conduit. This field is available only when the Roughness Type is Manning’s n-Depth Curve.
Manning’s vs. Discharge Table
Lets you define a flow vs. roughness curve for the catalog conduit. This field is available only when the Roughness Type is Manning’s n-Flow.
Library Tab Displays information pertaining to the catalog entry that is currently highlighted in the List Pane, including:
• ID
• Label
• Modified Date
• Library Source
• Library Modified Date
• Synchronization Status
6-250 Bentley SewerCAD V8i User’s Guide
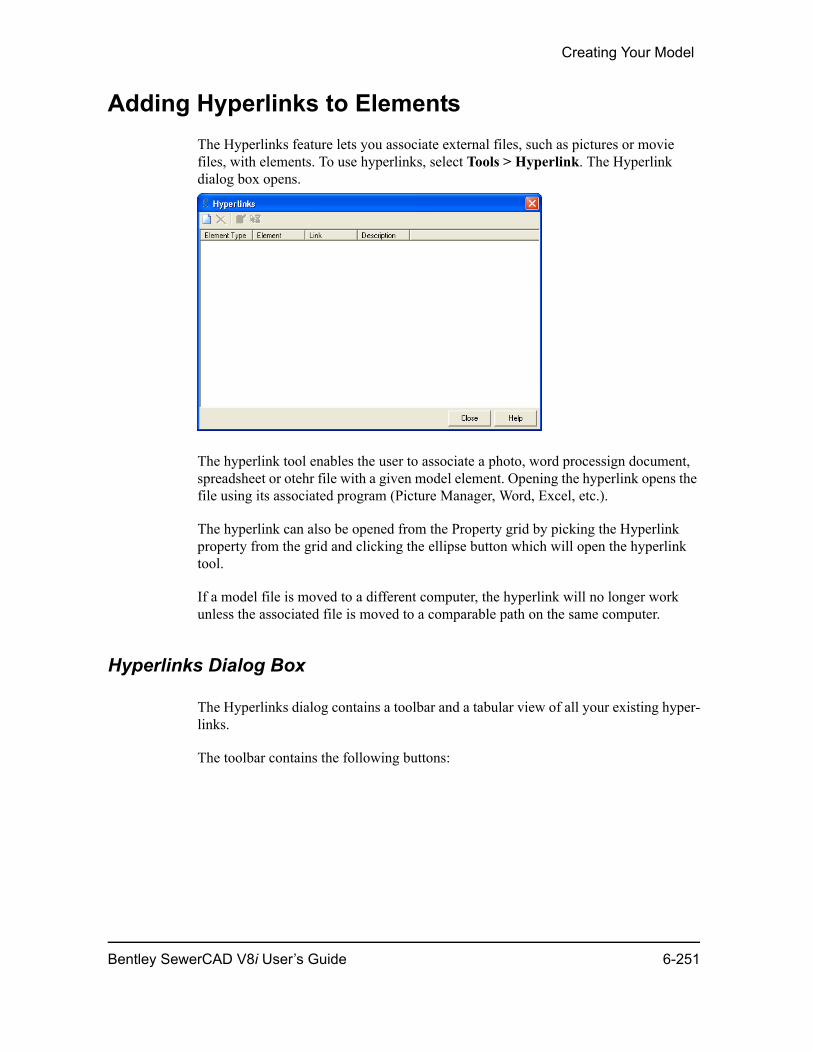
Creating Your Model
Adding Hyperlinks to ElementsThe Hyperlinks feature lets you associate external files, such as pictures or movie files, with elements. To use hyperlinks, select Tools > Hyperlink. The Hyperlink dialog box opens.
The hyperlink tool enables the user to associate a photo, word processign document, spreadsheet or otehr file with a given model element. Opening the hyperlink opens the file using its associated program (Picture Manager, Word, Excel, etc.).
The hyperlink can also be opened from the Property grid by picking the Hyperlink property from the grid and clicking the ellipse button which will open the hyperlink tool.
If a model file is moved to a different computer, the hyperlink will no longer work unless the associated file is moved to a comparable path on the same computer.
Hyperlinks Dialog Box
The Hyperlinks dialog contains a toolbar and a tabular view of all your existing hyper-links.
The toolbar contains the following buttons:
Bentley SewerCAD V8i User’s Guide 6-251
Adding Hyperlinks to Elements
The table contains the following columns:
Adding a Hyperlink
To add a hyperlink:
Note: You can add more than one associated file to an element using the hyperlink feature, but you must add the associations one at a time.
1. Select Tools > Hyperlink. The Hyperlink dialog box opens.
2. Click Add to add a hyperlink. The Add Hyperlink dialog box opens.
3. Select the element to which you want to associate an external file.
4. Browse to the external file you want to use. This might be something like a picture of the element or a movie about the element.
New Lets you create a new hyperlink. Launches the Add Hyperlink dialog box.
Delete Deletes the currently highlight hyperlink.
Edit Lets you edit the currently highlighted hyperlink. Launches the Edit Hyperlink dialog box.
Launch Launches the external file associated with the currently highlighted hyperlink.
Column Description
Element Type Displays the element type of the element associated with the hyperlink.
Element Displays the label of the element associated with the hyperlink.
Link Displays the complete path of the hyperlink.
Description Displays a description of the hyperlink, which you can optionally enter when you create or edit the hyperlink.
6-252 Bentley SewerCAD V8i User’s Guide
Creating Your Model
Add Hyperlink Dialog Box
You create new hyperlinks in the Add Hyperlink dialog box. The dialog box contains the following controls:
Editing a Hyperlink
You can edit existing hyperlinks using the Edit Hyperlink dialog box.
To edit a hyperlink:
1. Select Tools > Hyperlink. The Hyperlink dialog box opens.
2. Select the hyperlink you want to edit.
3. Click Edit to modify a hyperlink. The Edit Hyperlink dialog box opens.
4. Select the element you want to edit.
5. Edit the hyperlink by adding or deleting an associated file.
Edit Hyperlink Dialog Box
You edit existing hyperlinks in the Edit Hyperlink dialog box. The dialog box contains the following controls:
Element Type Lets you select an element type from the drop-down list.
Element Lets you select an element from a drop-down list of specific elements from your model. Only those element types selected in the Element Type drop-down list are displayed.
Link Lets you enter the complete path of the external file you want to associate with the selected element. You can type the path yourself or click the Ellipsis (...) button to search your computer for the file. Once you have selected the file, you can test the hyperlink by clicking the Launch button.
Description Lets you type a description of the hyperlink.
Bentley SewerCAD V8i User’s Guide 6-253
Using Queries
Deleting a Hyperlink
To delete a hyperlink:
1. Select Tools > Hyperlink. The Hyperlink dialog box opens.
2. Select the hyperlink you want to edit.
3. Click Edit to modify a hyperlink. The Edit Hyperlink dialog box opens.
4. Select the element you want to delete.
5. Click Delete.
Using QueriesA query in Bentley SewerCAD V8i is a user-defined SQL expression that applies to a single element type. You use the Queries Manager to create and store queries; you use the Query Builder dialog box to construct the actual SQL expression.
You can create the following types of queries:
• Project queries—Queries you define that are available only in the Bentley SewerCAD V8i project in which you define them.
• Shared queries—Queries you define that are available in all Bentley SewerCAD V8i projects you create. You can edit shared queries.
• Predefined queries—Factory-defined queries included with Bentley SewerCAD V8i that are available in all projects you create. You cannot edit predefined queries.
You can also use queries in the following ways:
Link Lets you edit the complete path of the external file associated with the selected hyperlink. You can type the path yourself or click the Ellipsis (...) button to search your computer for the file. Once you have selected the file, you can test the hyperlink by clicking the Launch button.
Description Lets you edit an existing description of the hyperlink or type a new description.
6-254 Bentley SewerCAD V8i User’s Guide

Creating Your Model
• Create dynamic selection sets based on one or more queries. For more informa-tion, see “Creating a Selection Set from a Query” on page 6-231.
• Filter the data in a FlexTable using a query. For more information, see “Sorting and Filtering FlexTable Data” on page 10-568.
For more information on how to construct queries, see “Creating Queries” on page 6-257.
Queries Manager
The Queries Manager is a docking manager that displays all queries in the current project, including predefined, shared, and project queries. You can create, edit, or delete shared and project queries from within the Queries Manager, as well as use it to select all elements in your model that are part of the selected query.
Queries created with the query manager can be saved with the current project (Project query) or saved in a file that can be shared with other projects (Shared query).
Queries are not executed in the query manager but are executed in the Network navi-gator or used in FlexTables to filter the table.
The Queries Manager consists of a toolbar and a tree view, which displays all of the queries that are associated with the current project. The toolbar contains the following buttons:
Bentley SewerCAD V8i User’s Guide 6-255
Using Queries
Query Parameters Dialog Box
Some predefined queries require that a parameter be defined. When one of these queries is selected, the Query Parameters dialog box will open, allowing you to type the parameter value that will be used in the query. For example, when the Pipe Split Candidates query is used the Query Parameters dialog will open, allowing the Toler-ance parameter to be defined.
New Contains the following commands:
• Query—Lets you create a new SQL expression as either a project or shared query, depending on which item is high-lighted in the tree view.
• Folder—Creates a folder in the tree view, allowing you to group queries. You can right-click a folder and create queries or folders in that folder.
Delete Deletes the currently-highlighted query or folder from the tree view. When you delete a folder, you also delete all of its contents (the queries it contains).
Rename Lets you rename the query or folder that is currently highlighted in the tree view.
Edit Opens the Query Builder dialog box, allowing you to edit the SQL expression that makes up the currently-highlighted query.
Expand All and Collapse All
Expands or collapses the named views and folders.
Select in Drawing Lets you quickly select all the elements in the drawing pane that are part of the currently highlighted query. Once you have selected the elements in a selection set using Select In Drawing, you can delete them all at once.
Help Displays online help for the Queries Manager.
6-256 Bentley SewerCAD V8i User’s Guide

Creating Your Model
Creating Queries
A query is a valid SQL expression that you construct in the Query Builder dialog box. You create and manage queries in the Queries Manager. You also use queries to filter FlexTables and as the basis for a selection set.
To create a query from the Queries Manager:
1. Open the Queries Manager by selecting View > Queries, clicking the Queries button on the View toolbar, or by pressing CTRL+5.
Bentley SewerCAD V8i User’s Guide 6-257
Using Queries
2. Perform one of the following steps:
– To create a new project query, highlight Queries - Project in the list pane, then click the New button and select Query.
– To create a new shared query, highlight Queries - Shared in the list pane, then click the New button and select Query.
Note: You can also right-click an existing item or folder in the list pane and select New > Query from the shortcut menu.
3. In the Select Element Type dialog box, select the desired element type from the drop-down menu. The Query Builder dialog box appears.
4. All input and results fields for the selected element type appear in the Fields list pane, available SQL operators and keywords are represented by buttons, and available values for the selected field are listed in the Unique Values list pane. Perform the following steps to construct your query:
a. Double-click the field you wish to include in your query. The database column name of the selected field appears in the preview pane.
b. Click the desired operator or keyword button. The SQL operator or keyword is added to the SQL expression in the preview pane.
c. Click the Refresh button above the Unique Values list pane to see a list of unique values available for the selected field. Note that the Refresh button is disabled after you use it for a particular field (because the unique values do not change in a single query-building session).
d. Double-click the unique value you want to add to the query. The value is added to the SQL expression in the preview pane.
Note: You can also manually edit the expression in the preview pane.
e. Check the Validate on OK box above the preview pane to validate your SQL expression when you click the OK button. If the expression is valid, the query will be created. If the query is invalid, a message to that effect will appear.
f. Click the Apply button above the preview pane to execute the query. If you didn’t validate the expression, the Apply button validates it before executing it.
g. Click OK.
6-258 Bentley SewerCAD V8i User’s Guide
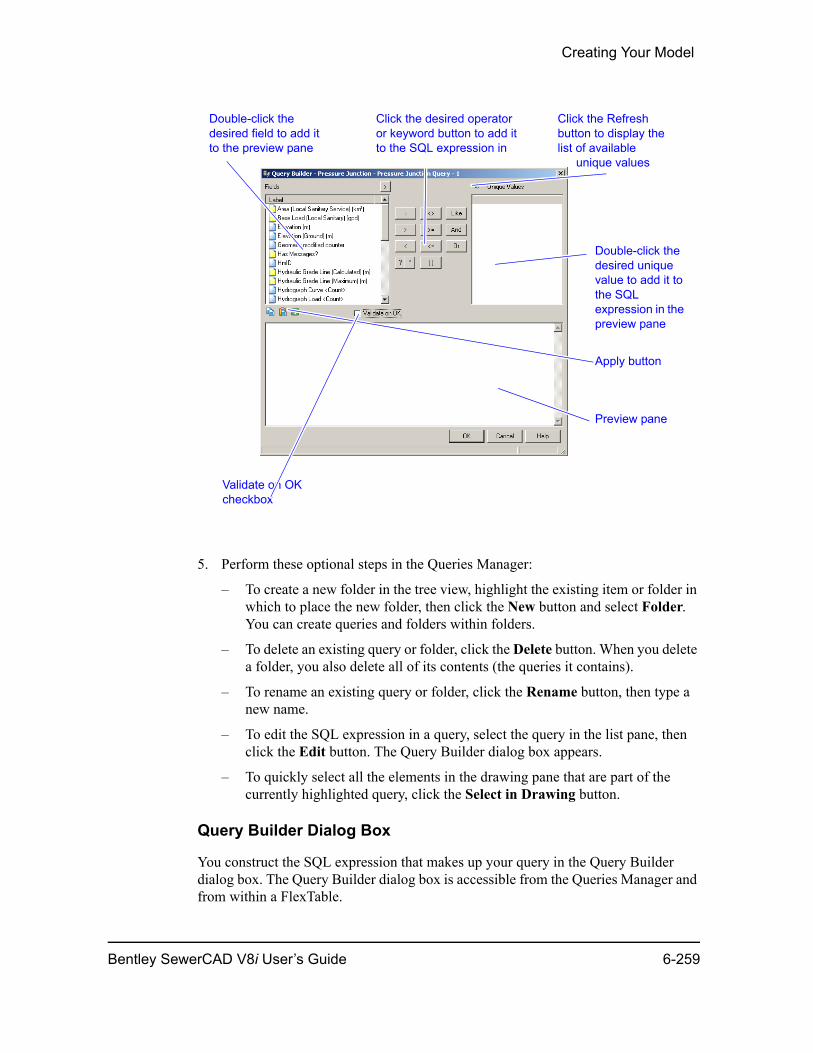
Creating Your Model
5. Perform these optional steps in the Queries Manager:
– To create a new folder in the tree view, highlight the existing item or folder in which to place the new folder, then click the New button and select Folder. You can create queries and folders within folders.
– To delete an existing query or folder, click the Delete button. When you delete a folder, you also delete all of its contents (the queries it contains).
– To rename an existing query or folder, click the Rename button, then type a new name.
– To edit the SQL expression in a query, select the query in the list pane, then click the Edit button. The Query Builder dialog box appears.
– To quickly select all the elements in the drawing pane that are part of the currently highlighted query, click the Select in Drawing button.
Query Builder Dialog Box
You construct the SQL expression that makes up your query in the Query Builder dialog box. The Query Builder dialog box is accessible from the Queries Manager and from within a FlexTable.
Validate on OK checkbox
Apply button
Click the desired operator or keyword button to add it to the SQL expression in
Click the Refresh button to display the list of available
unique values
Double-click the desired field to add it to the preview pane
Double-click the desired unique value to add it to the SQL expression in the preview pane
Preview pane
Bentley SewerCAD V8i User’s Guide 6-259
Using Queries
The top part of the dialog box contains all the controls you need to construct your query: a list pane displaying all available attributes for the selected element type, a SQL control panel containing available SQL keywords and operators, and list view that displays all the available values for the selected attribute. The bottom part of the dialog box contains a preview pane that displays your SQL expression as you construct it.
All the dialog box controls are described in the following table.
Fields Lists all input and results fields applicable to the selected element type. This list displays the labels of the fields, while the underlying database column names of the fields become visible in the preview pane when you add them to the expression. Double-click a field to add it to your SQL expression.
SQL Controls These buttons represent all the SQL operators and controls that you can use in your query. They include =, >, <, _, ?, *, <>, >=, <=, [ ], Like, And, and Or. Click the appropriate button to add the operator or keyword to the end of your SQL expression, which is displayed in the preview pane.
Unique Values When you click the Refresh button, this list displays all the available unique values selected field. Double-click a value in the list to add it to the end of your SQL expression, which is displayed in the preview pane. If you select a different field, you must click the Refresh button again to update the list of unique values for the selected field. When you first open the Query Builder dialog box, this list is empty.
Refresh Updates the list of unique values for the selected field. This button is disabled after you use it for a particular field.
Copy Copies the entire SQL expression displayed in the preview pane to the Windows clipboard.
6-260 Bentley SewerCAD V8i User’s Guide
Creating Your Model
Using the Like Operator
The Like operator compares a string expression to a pattern in an SQL expression.
Syntax
expression Like “pattern”
The Like operator syntax has these parts:
You can use the Like operator to find values in a field that match the pattern you specify. For pattern, you can specify the complete value (for example, Like “Smith”), or you can use wildcard characters to find a range of values (for example, Like “Sm*”).
Paste Pastes the contents of the Windows clipboard into the preview pane at the location of the text cursor. For example, if your cursor is at the end of the SQL expression in the preview pane and you click the Paste button, the contents of your clipboard will be added to the end of the expression.
Validate on Ok Validates the SQL expression in the preview pane when you click the OK button. If the expression is not valid, a message appears.
Apply Executes the query. The results of the query are displayed at bottom of the Query Builder dialog box in the form “x of x elements returned.”
Preview Pane Displays the SQL expression as you add fields, operators and/keywords, and values to it.
Part Description
expression SQL expression used in a WHERE clause .
pattern String or character string literal against which expression is compared.
Bentley SewerCAD V8i User’s Guide 6-261
Controls
In an expression, you can use the Like operator to compare a field value to a string expression. For example, if you enter Like “C*” in an SQL query, the query returns all field values beginning with the letter C. In a parameter query , you can prompt the user for a pattern to search for.
The following example returns data that begins with the letter P followed by any letter between A and F and three digits:
Like “P[A-F]###”
The following table shows how you can use Like to test expressions for different patterns.
ControlsControls give you a way to specify an action for virtually any element based on almost any property of the system. Controls are included in a scenario when they are speci-fied in the Operational Alternative. The controls become part of an Operational Alter-native when you specify the name of a Control Set to use in a given Operational Alternative.
Kind of match PatternMatch(returns True)
No match(returns False)
Multiple characters a*a aa, aBa, aBBBa aBC
*ab* abc, AABB, Xab aZb, bac
Special character a[*]a a*a aaa
Multiple characters ab* abcdefg, abc cab, aab
Single character a?a aaa, a3a, aBa aBBBa
Single digit a#a a0a, a1a, a2a aaa, a10a
Range of characters [a-z] f, p, j 2, &
Outside a range [!a-z] 9, &, % b, a
Not a digit [!0-9] A, a, &, ~ 0, 1, 9
Combined a[!b-m]# An9, az0, a99 abc, aj0
6-262 Bentley SewerCAD V8i User’s Guide
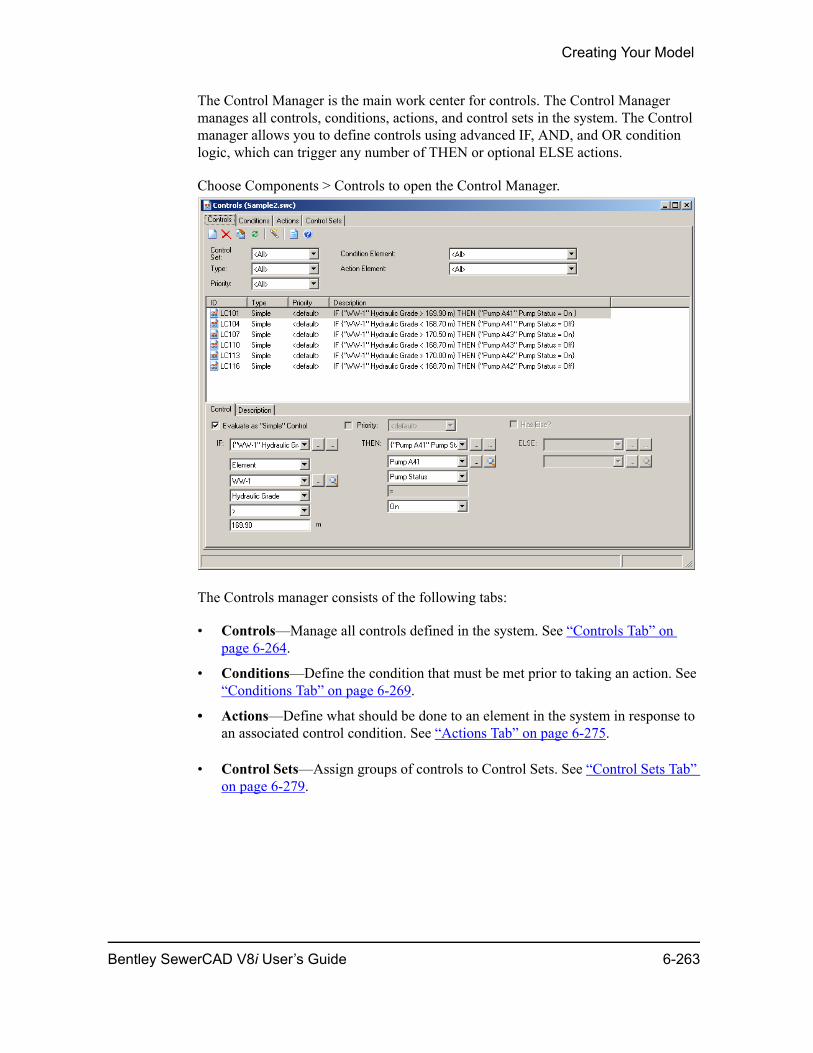
Creating Your Model
The Control Manager is the main work center for controls. The Control Manager manages all controls, conditions, actions, and control sets in the system. The Control manager allows you to define controls using advanced IF, AND, and OR condition logic, which can trigger any number of THEN or optional ELSE actions.
Choose Components > Controls to open the Control Manager.
The Controls manager consists of the following tabs:
• Controls—Manage all controls defined in the system. See “Controls Tab” on page 6-264.
• Conditions—Define the condition that must be met prior to taking an action. See “Conditions Tab” on page 6-269.
• Actions—Define what should be done to an element in the system in response to an associated control condition. See “Actions Tab” on page 6-275.
• Control Sets—Assign groups of controls to Control Sets. See “Control Sets Tab” on page 6-279.
Bentley SewerCAD V8i User’s Guide 6-263
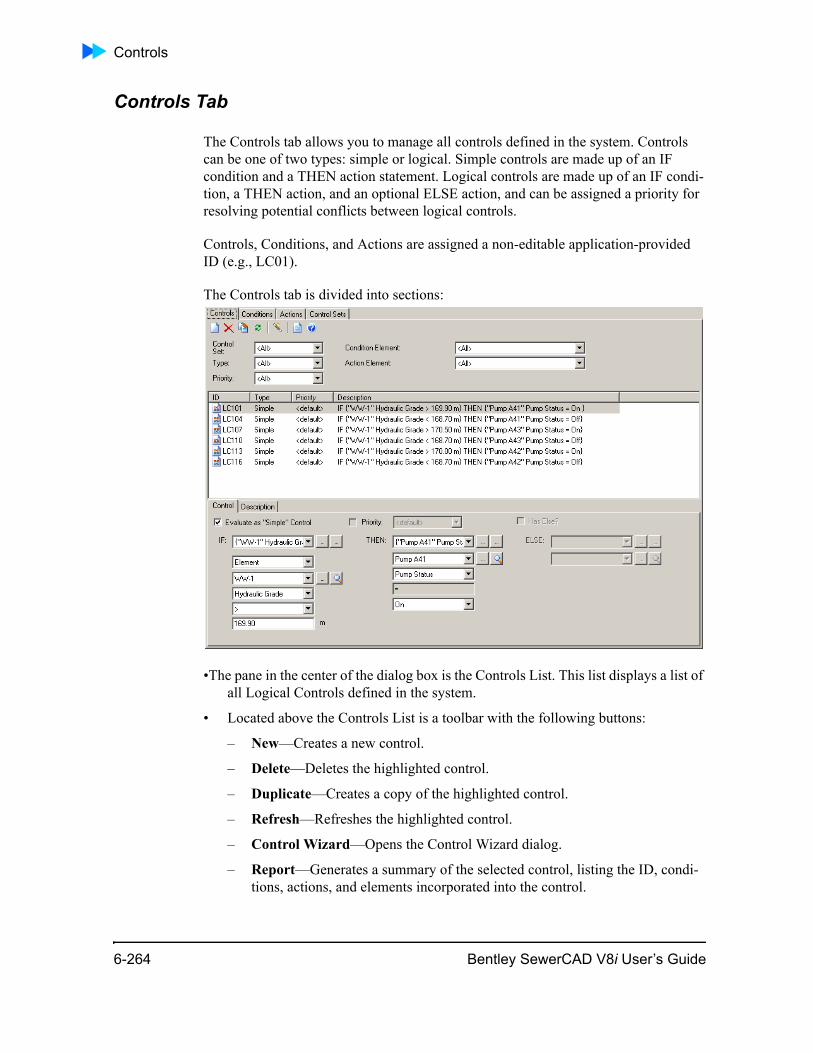
Controls
Controls Tab
The Controls tab allows you to manage all controls defined in the system. Controls can be one of two types: simple or logical. Simple controls are made up of an IF condition and a THEN action statement. Logical controls are made up of an IF condi-tion, a THEN action, and an optional ELSE action, and can be assigned a priority for resolving potential conflicts between logical controls.
Controls, Conditions, and Actions are assigned a non-editable application-provided ID (e.g., LC01).
The Controls tab is divided into sections:
•The pane in the center of the dialog box is the Controls List. This list displays a list of all Logical Controls defined in the system.
• Located above the Controls List is a toolbar with the following buttons:
– New—Creates a new control.
– Delete—Deletes the highlighted control.
– Duplicate—Creates a copy of the highlighted control.
– Refresh—Refreshes the highlighted control.
– Control Wizard—Opens the Control Wizard dialog.
– Report—Generates a summary of the selected control, listing the ID, condi-tions, actions, and elements incorporated into the control.
6-264 Bentley SewerCAD V8i User’s Guide
Creating Your Model
– Help—Opens the online help.
• Below the toolbar is a set of filters that allow you to only display controls that meet criteria defined by the filter settings. The following filters are available:
– Type—When a Type filter other than <All> is specified, only controls of that type will be displayed in the Controls list.
– Priority—When a Priority filter other than <All> is specified, only controls of that priority will be displayed in the Controls list.
– Condition Element—When a Condition filter other than <All> is specified, only controls containing the selected Condition element will be displayed in the Controls list.
– Action Element—When an Action filter other than <All> is specified, only controls containing the selected Action element will be displayed in the Controls list.
You can edit or create controls consisting of an IF condition, a THEN action, and an optional ELSE action. The lower pane is split into sections:
• Evaluate as Simple Control—Turn on in order to evaluate the condition as a simple control.
– IF Condition—The drop-down list allows you to choose from a list of condi-tions that have already been created in the Conditions tab.
– THEN Action—The drop-down list allows you to choose from a list of actions that have already been created in the Actions tab.
– ELSE Action (optional)—The ELSE action is used when the conditions for the control are not met. To specify an ELSE action, click the check box to activate the drop-down list. The drop-down list allows you to choose from a list of actions that have already been created in the Actions tab.
• Priority—This area of the dialog box is optional. To set a priority for the control being created, turn on to activate the priority drop-down list. You can set a priority of 1-5, 5 being the highest priority. If multiple controls meet a certain condition and they have conflicting actions, the control with the highest priority will be used.
Bentley SewerCAD V8i User’s Guide 6-265
Controls
Note: At calculation time, the priority is used to determine the logical control to apply when multiple controls require that conflicting actions be taken. Logical controls with identical priorities will be prioritized based on the order they appear in the Logical Control Set alternative. A rule without a priority value always has a lower priority than one with a value. For two rules with the same priority value, the rule that appears first is given the higher priority.
Relative speed pump patterns take precedence over any controls (simple or logical) that are associated with the pump.
Hovering the mouse cursor over a control in the list will open a tooltip which displays the conditions and actions that make up that control.
When creating a new condition or action for a new control, the condition and action input fields will be initialized with the data used in the last condition or action that was created.
Once created, the Logical Control will be assigned an application generated ID (e.g., LC04).
• Description—This area is preset with a default description. There is an option to change the default description. To do so, turn on to activate the description field, and enter your description in the text box.
• Summary—This area of the dialog box displays a description of the control.
• Status Pane—When one or more filters are active, the lower left corner of the dialog will show the number of controls currently displayed out of the number of total controls. Additionally, a FILTERED flag is displayed in the lower right corner.
Logical, or rule-based controls allow far more flexibility and control over the behavior of your network elements than is possible with simple controls. This is accomplished by allowing you to specify one or more conditions and then link these to one or more Actions by using logical IF, AND, THEN, OR, and ELSE statements.
Note: Logical Controls are not executed during Steady State analyses.
Logical controls consist of any combination of simple conditions and simple actions. Controls are defined as:
IF: Condition 1 AND condition 2 OR condition 3 AND condition 4, etc., where condition X is a a condition clause.
THEN: Action 1 AND action 2, etc. where action X is an action clause.
6-266 Bentley SewerCAD V8i User’s Guide
Creating Your Model
ELSE (Optional): Action 3 AND action 4, etc. where action X is an action clause.
Priority (Optional): Priority where priority is a priority value (1 to 5, 5 being the highest priority).
In addition to the high level of flexibility provided by allowing multiple conditions and actions, the functionality of Logical controls is also enhanced by the range of Condition types that are available. You can activate the stated actions based on element demands, element hydraulic grade or pressure, system demand, clock time, time from start, tank level, or time to fill or drain a tank.
You can also create composite conditions and actions. You can cause actions to be performed when multiple conditions are met simultaneously, or when one or the other conditions are met. You can also activate multiple actions when a single condition is met.
EXAMPLE:
To create a logical control in which a pump (PMP-1) is turned on when the level in a tank (T-1) falls below a specified value (5 ft.) or when the system demands exceed a certain level (5000 gpm):
• Conditions—Because this control needs to be triggered by multiple condi-tions, a Composite Condition is chosen. In this instance, the operator OR is chosen to link the conditions, because the pump should be turned on if either condition is true.
IF condition—{T-1 Level < 5 ft.}
OR condition—{System Demand > 5000 gpm}
• Actions—Because this control has a single desired outcome if one of the conditions is met, a simple action is chosen. The first action in a logical control is always linked to the conditions by a logical THEN statement. In this instance, an ELSE action will also be used, to keep the pump off if neither of the conditions is true.
THEN action—{PMP-1 Status = On}
ELSE action—{PMP-1 Status = Off}
The finished logical control looks like this:
IF {T-1 Level < 5 ft.} OR {System Demand > 5000 gpm} THEN {PMP-1 Status = On} ELSE {PMP-1 Status = Off}
Bentley SewerCAD V8i User’s Guide 6-267
Controls
This example illustrates the power of using logical controls. To achieve the same func-tionality using simple controls, you would need to create four separate controls—one to turn the pump on if the tank level is below the specified value, one to turn the pump off if the tank level is above a specified value, one to turn the pump on if the system demand is greater than the specified value, and one to turn the pump off if the system demand is less than the specified value.
Tip: Use the optional ELSE field to cause actions to be performed when the conditions in the control are not being met. For example, if you are creating a control that states, “If the level in Tank 1 is less than 5 ft., Then turn Pump 1 On,” use an ELSE action to turn the pump off if the tank level is above 5 ft.
Note: Logical Controls are not executed during Steady State analyses.
When defining a logical control, you have the option to share conditions and/or actions. In other words, more than one control can reference the same condition or action. Keep in mind that when you change an underlying condition or action, it will affect all controls that reference that condition or action.
Control Wizard
The Control Wizard allows you to quickly create pump controls based on wet well HGL.
Click the New button to create a new row in the controls list.
Click the Delete button to remove the currently highlighted control.
Choose the controlled pump from the list box in the Pump column.
Choose the controlling wet well from the list box in the Wet Well column. Choose the desired On and Off Operators and enter the HGL values that will turn the pump On and Off.
6-268 Bentley SewerCAD V8i User’s Guide
Creating Your Model
Click the Create button to generate the control(s), or click the Cancel button to close the wizard without creating a control.
Conditions Tab
Conditions allow you to define the condition that must be met prior to taking an action. The Conditions tab provides a list of all conditions defined in the system. There are two types of conditions: simple conditions and composite conditions.
The Conditions tab is divided into sections:
• The pane in the middle of the dialog box is the Conditions List. The Conditions List displays a list of all logical conditions defined in the system. The list contains four columns: ID (the application defined id, e.g., C01 for simple, CC01 for composite), Type (simple or composite), description, and references (logical control references).
• Located above the Conditions List is a toolbar with the following buttons:
– New—Create a simple or composite condition.
– Duplicate—Copy the selected condition.
– Delete—Deletes the selected condition.
– Refresh—Refreshes the selected condition.
– Report—Generates a summary of the selected condition.
Bentley SewerCAD V8i User’s Guide 6-269
Controls
• Below the toolbar is a set of filters that allow you to only display controls that meet criteria defined by the filter settings. The following filters are available:
– Control Set—When a control set is specifed, only conditions that are a component of that control set are displayed in the Conditions list.
– Type—When a Type filter other than <All> is specified, only conditions of that type will be displayed in the Conditions list.
– Condition Element—When a Condition filter other than <All> is specified, only conditions containing the selected Condition element will be displayed in the Conditions list.
• The controls used to create or edit a condition vary depending on whether the condition is simple or composite:
Simple Conditions
The input fields for a simple condition change depending on the condition type that is selected in the condition Type field. The Simple Condition Types and the corre-sponding input data are as follows:
Element—This will create a condition based on specified attributes at a selected element. The fields available when this condition type is selected are as follows:
• Element—The Element field allows you to specify which element the condition will be based upon, and provides three methods of choosing this element. The drop-down list displays elements that have been used in other logical controls, the Ellipsis (…) button, which opens the Single Element Selection dialog box, and the Select From Drawing button, which allows you to select the element using the graphical Drawing view.
Attribute—This field displays the available attributes for the element type currently specified in the Element field.
• Pressure Junctions—The following attributes are available for use when a Junc-tion is chosen in the Element field:
– Demand—This attribute is used to create a condition based on a specified demand at the corresponding junction (e.g., If J-1 has a demand…).
– Hydraulic Grade—This attribute is used to create a condition based on a specified hydraulic grade at the corresponding junction (e.g., If J-1 has a hydraulic grade of…).
– Pressure—This attribute is used to create a condition based on a specified pressure at the corresponding junction (e.g., If J-1 has a pressure of…).
• Pumps—The following attributes are available for use when a Pump is chosen in the Element field:
6-270 Bentley SewerCAD V8i User’s Guide
Creating Your Model
– Discharge—This attribute is used to create a condition based on a specified rate of discharge at the corresponding pump (e.g., If PMP-1 has a discharge of…).
– Setting—This attribute is used to create a condition based on the Relative Speed Factor of the corresponding pump (e.g., If PMP-1 has a relative speed factor of 1.5…).
– Status—This attribute is used to create a condition based on the status (On or Off) of the corresponding pump (e.g., If PMP-1 is On…).
Note: Relative Speed Pump patterns take precedence over any controls (Simple or Logical) that are associated with the pump.
• Tanks—The following attributes are available for use when a Tank is chosen in the Element field:
– Demand—This attribute is used to create a condition based on a specified demand at the corresponding tank. For tanks, this demand can represent an inflow or outflow (e.g., If T-1 has a demand…).
– Hydraulic Grade—This attribute is used to create a condition based on a specified hydraulic grade at the corresponding tank (e.g., If T-1 has a hydraulic grade of…).
– Pressure—This attribute is used to create a condition based on a specified pressure at the corresponding tank (e.g., If T-1 has a pressure of…).
– Level—This attribute is used to create a condition based on a specified water level at the corresponding tank (e.g., If the water in T-1 is at a level of…).
– Time to Drain—This attribute is to create a condition based on the amount of time required for the tank to drain (e.g., If T-1 drains in X hours…).
– Time to Fill—This attribute is to create a condition based on the amount of time required for the tank to fill (e.g., If T-1 fills in X hours…).
• Reservoirs—The following attributes are available for use when a Reservoir is chosen in the Element field:
– Demand—This attribute is used to create a condition based on a specified demand at the corresponding reservoir. For reservoirs, this demand can repre-sent an inflow or outflow (e.g., If R-1 has a demand…).
– Hydraulic Grade—This attribute is used to create a condition based on a specified hydraulic grade at the corresponding reservoir (e.g., If R-1 has a hydraulic grade of…).
– Pressure—This attribute is used to create a condition based on a specified pressure at the corresponding reservoir (e.g., If R-1 has a pressure of…).
• Pipes—The following attributes are available for use when a Pipe is chosen in the Element field:
Bentley SewerCAD V8i User’s Guide 6-271
Controls
– Discharge—This attribute is used to create a condition based on a specified rate of discharge at the corresponding pipe (e.g., If P-1 has a discharge of…).
– Status—This attribute is used to create a condition based on the status (Open or Closed) of the corresponding pipe (e.g., If P-1 is Open…).
• Valves—The following attributes are available for use when a valve is chosen in the Element field:
– Discharge—This attribute is used to create a condition based on a specified rate of discharge at the corresponding valve (e.g., If PRV-1 has a discharge of…).
Note: The Setting attribute is not available when a GPV is selected in the Element field.
• Setting—This attribute is used to create a condition based on the setting of the corresponding valve. The type of setting will change depending on the type of valve that is chosen. The valves and their associated setting types are as follows:
– PRV—Choosing the Setting attribute in conjunction with a PRV will create a condition based on a specified pressure at the PRV (e.g., If PRV-1 has a pres-sure of…).
– PSV—Choosing the Setting attribute in conjunction with a PRV will create a condition based on a specified pressure at the PRV (e.g., If PSV-1 has a pres-sure of…).
– PBV—Choosing the Setting attribute in conjunction with a PRV will create a condition based on a specified pressure at the PRV (e.g., If PBV-1 has a pres-sure of…).
– FCV—Choosing the Setting attribute in conjunction with a PRV will create a condition based on a specified rate of discharge at the PRV (e.g., If FCV-1 has a discharge of…).
– TCV—Choosing the Setting attribute in conjunction with a PRV will create a condition based on a specified headloss coefficient at the PRV (e.g., If TCV-1 has a headloss of…).
• Status—This attribute is used to create a condition based on the status (Closed or Inactive) of the corresponding valve (e.g., If PRV-1 is Inactive…).
System Demand—This will create a condition based on the demands for the entire system. The fields available when this condition type is selected are: xxxx checkout this
6-272 Bentley SewerCAD V8i User’s Guide
Creating Your Model
• Operator—This field allows you to specify the relationship between the Attribute and the target value for that attribute. The choices include Greater Than (>), Greater Than Or Equal To (>=), Less Than (<), Less Than Or Equal To (<=), Equal To (=), or Not Equal To (<>).
• System Demand—This field lets you set a system-wide demand.
Clock Time—This will create a condition based on the clock time during an extended period simulation. If the extended period simulation is for a period longer than 24 hours, this condition will be triggered every day at the specified time.
• Operator—This field allows you to specify the relationship between the Attribute and the target value for that attribute. The choices include Greater Than (>), Greater Than Or Equal To (>=), Less Than (<), Less Than Or Equal To (<=), Equal To (=), or Not Equal To (<>).
Time From Start—This will create a condition based on the amount of time that has passed since the beginning of an extended period simulation. The following fields are available when this condition type is selected:
• Operator—This field allows you to specify the relationship between the Attribute and the target value for that attribute. The choices include Greater Than (>), Greater Than Or Equal To (>=), Less Than (<), Less Than Or Equal To (<=), Equal To (=), or Not Equal To (<>).
xxxx is target value okay?
Target Value—This field’s label will change depending on the attribute that is chosen. The value entered here is used in conjunction with the operator that is chosen to determine if the condition has been met.
Description—This area of the dialog box is preset with a default description. There is an option to change the default description. To do so, click the check box to activate the description field, and enter your description in the text box. Additionally, the description field supports the following expandable masks:
%# ID
%e Element
%a Attribute
%o Operator
%v Value
%u Unit
Bentley SewerCAD V8i User’s Guide 6-273
Controls
Note: Click the description list box to select one of the predefined masks.
Aside from reducing the amount of data input, using these masks provides the addi-tional benefit of automatically updating the corresponding information when changes are made to the various condition components.
Summary— This area of the dialog box displays an automatically updated preview of the expanded description.
Composite Conditions
When a Composite Condition is being defined or edited, the lower part of the dialog box is comprised of a two column table and two buttons. The buttons are as follows:
• Insert—Adds a new row to the Condition list.
• Delete—Deletes the highlighted row from the Condition list.
• Refresh—Updates the referenced conditions.
The table contains two columns, as follows:
• Operator—This column allows you to choose the way in which the related Condition logic will be evaluated. The available choices are If, And, and Or.
Note: The first condition in the list will use the If operator. Any additional conditions will allow you to choose between AND and OR.
Any combination of AND and OR clauses can be used in a rule. When mixing AND and OR clauses, the OR operator has higher precedence than AND. Therefore, “IF A or B and C” is equivalent to “IF (A or B) and C”. If the interpretation was meant to be IF A or (B and C), this can be expressed using two Logical Controls: Logical Control 1: “IF A THEN...” and Logical Control 2: “IF B AND C THEN...”
• Condition—The drop-down list allows you to choose a condition that was already created beforehand.
Description—This area of the dialog box is preset with a default description. There is an option to change the default description. To do so, click the check box to activate the description field, and enter your description in the text box. Additionally, the description field supports the following expandable masks:
%# ID
%v Value
6-274 Bentley SewerCAD V8i User’s Guide
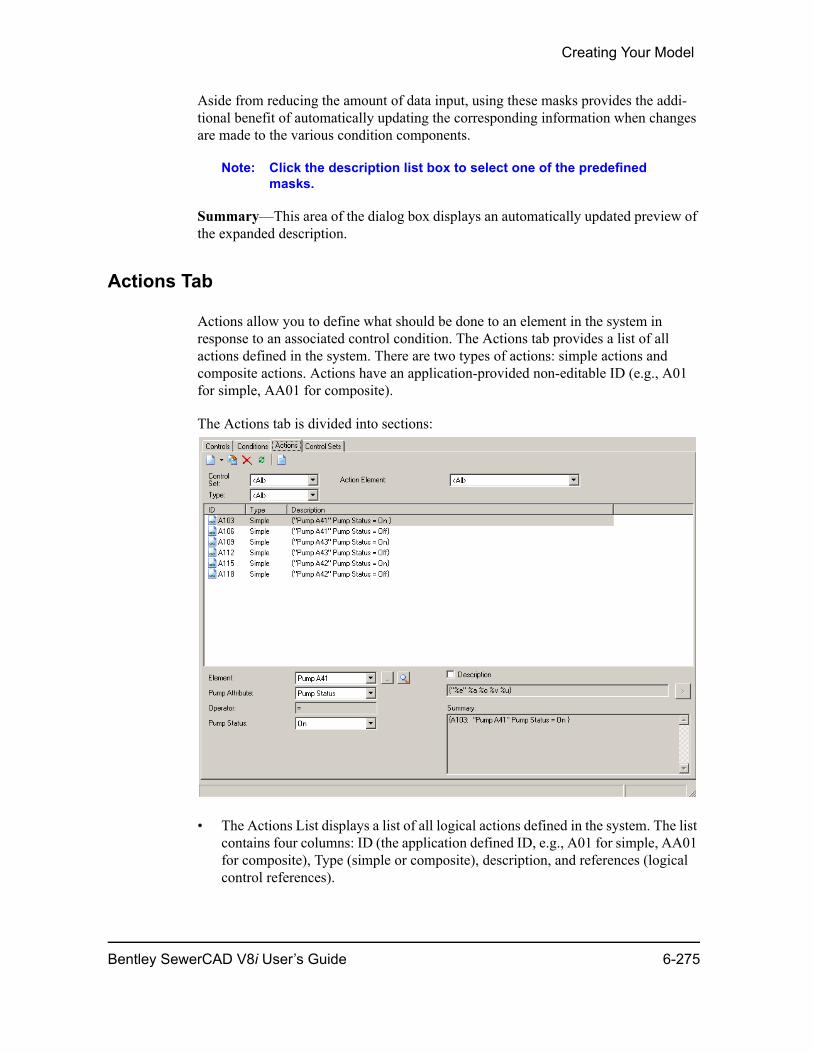
Creating Your Model
Aside from reducing the amount of data input, using these masks provides the addi-tional benefit of automatically updating the corresponding information when changes are made to the various condition components.
Note: Click the description list box to select one of the predefined masks.
Summary—This area of the dialog box displays an automatically updated preview of the expanded description.
Actions Tab
Actions allow you to define what should be done to an element in the system in response to an associated control condition. The Actions tab provides a list of all actions defined in the system. There are two types of actions: simple actions and composite actions. Actions have an application-provided non-editable ID (e.g., A01 for simple, AA01 for composite).
The Actions tab is divided into sections:
• The Actions List displays a list of all logical actions defined in the system. The list contains four columns: ID (the application defined ID, e.g., A01 for simple, AA01 for composite), Type (simple or composite), description, and references (logical control references).
Bentley SewerCAD V8i User’s Guide 6-275
Controls
• Located above the Conditions List is a toolbar with the following buttons:
- New—Opens the New Logical Action dialog box, where you can create a new logical action.
- Edit—Depending on whether a simple or composite action is highlighted, this button opens the Simple Logical Action or Composite Logical Action dialog box, which allows you to edit the highlighted action.
- Delete—Deletes the highlighted action. You will be prompted to confirm this action.
- Find—Opens the Find Logical Action dialog box, which allows you to find a particular action based on a variety of criteria.
- Report—Generates a summary of the highlighted action.
– Below the toolbar is a set of filters that allow you to only display controls that meet criteria defined by the filter settings. The following filters are available:
- Control Set—When a control set is specifed, only actions that are a component of that control set are displayed in the Actions list.
- Type—When a Type filter other than <All> is specified, only actions of that type will be displayed in the Actions list.
- Action Element—When an Action Element filter other than <All> is specified, only actions containing the selected Element will be displayed in the Actions list.
• The controls used to create or edit an action vary depending on whether the action is simple or composite:
Simple Actions
The following controls are used to define or edit Simple Actions:
• Element—The Element field allows you to specify which element the action will be based upon and provides three methods of choosing this element. The drop-down list displays elements that have been used in other logical controls, the Ellipsis (…) button, which opens the Single Element Selection box, and the Select From Drawing button, which allows you to select the element using the graphical Drawing view.
• Attribute—This field displays the available attributes for the element type speci-fied in the Element field. Not all attributes are available for all element types. The available attributes include:
– Status – This attribute is used to change the status of a pipe, pump, or valve when the related conditions are met. The available choices are dependant on the element type.
6-276 Bentley SewerCAD V8i User’s Guide
Creating Your Model
– Setting—This attribute is used to change the settings of a pump or valve when the related conditions are met. The setting type varies depending on the type of element.
Note: Pipes can only utilize the Status Attribute, Pumps and all Valves except for the GPV can utilize either the Status or Setting Attribute. GPVs can only use the Status Attribute.
For all valves except for the GPV, there is no explicit Active status with which to base a control upon—the status choices are Inactive or Closed. After a control sets a valve to Inactive or Closed, to reactivate the valve another control must be created with a Setting attribute. This is because a valve cannot be set to Active, but must have specific input data to work with.
For GPVs, there is no Inactive setting. GPVs can only be set to Active or Closed. If the GPV is not closed, the valve will always produce the headlosses associated with it through the Head-Discharge Points table.
• Operator—The operator for logical actions is always EQUAL TO (=).
• Attribute Value—This field’s label will change depending on the attribute that is chosen. Depending on the element type and the attribute that was chosen, the input field may also change to a drop-down list, which contains the possible settings for that element. Not all settings are available for all element types.
Note: Pipes can be set to Open or Closed, Pumps can be set to On, Off, or have their relative speed factors increase or decrease. GPVs can be set to Active or Closed. All other valves can be set to Inactive, Closed, or have their respective settings changed, depending on the Valve type.
Description—This area of the dialog box is preset with a default description. There is an option to change the default description. To do so, click the check box to activate the description field, and enter your description in the text box. Additionally, the description field supports the following expandable masks:
%# ID
%e Element
%a Attribute
%o Operator
%v Value (and Unit, if applicable)
Bentley SewerCAD V8i User’s Guide 6-277
Controls
Aside from reducing the amount of data input, using these masks provides the addi-tional benefit of automatically updating the corresponding information when changes are made to the various control components.
Note: Click the description list box to select one of the predefined masks.
Summary—This area of the dialog displays an automatically updated preview of the expanded description.
Composite Actions
When a Composite Action is being defined or edited, the lower section of the dialog box is comprised of a single column table and two buttons. The Table contains a list of the Actions to be used. Each row is a drop-down list that allows you to choose an action that was already created beforehand.
• Insert—Adds a new row to the Action list
• Delete—Deletes the highlighted row from the Action list.
Description—This area of the dialog box is preset with a default description. There is an option to change the default description. To do so, click the check box to activate the description field, and enter your description in the text box. Additionally, the description field supports the following expandable masks:
Aside from reducing the amount of data input, using these masks provides the addi-tional benefit of automatically updating the corresponding information when changes are made to the various control components.
Note: Click the description list box to select one of the predefined masks.
Composite logical actions consist of multiple simple logical actions. These actions are linked with an AND statement.
Summary—This area of the dialog box displays an automatically updated preview of the expanded description.
%# ID
%v Value
6-278 Bentley SewerCAD V8i User’s Guide
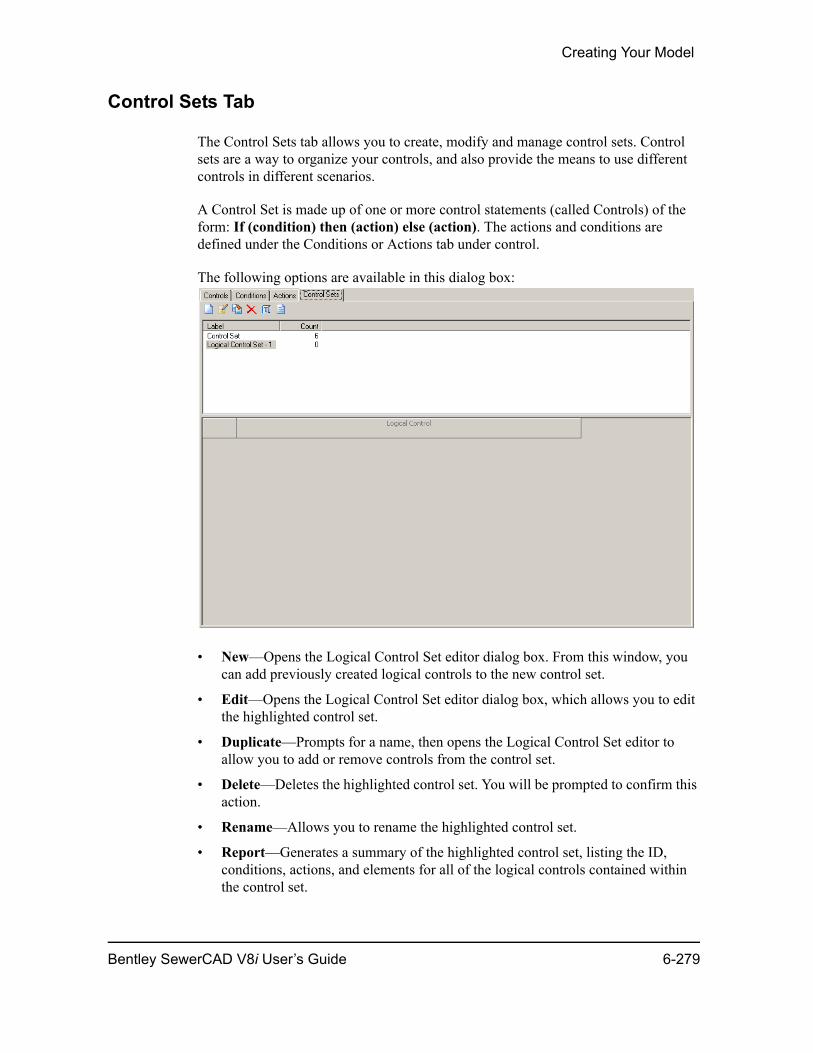
Creating Your Model
Control Sets Tab
The Control Sets tab allows you to create, modify and manage control sets. Control sets are a way to organize your controls, and also provide the means to use different controls in different scenarios.
A Control Set is made up of one or more control statements (called Controls) of the form: If (condition) then (action) else (action). The actions and conditions are defined under the Conditions or Actions tab under control.
The following options are available in this dialog box:
• New—Opens the Logical Control Set editor dialog box. From this window, you can add previously created logical controls to the new control set.
• Edit—Opens the Logical Control Set editor dialog box, which allows you to edit the highlighted control set.
• Duplicate—Prompts for a name, then opens the Logical Control Set editor to allow you to add or remove controls from the control set.
• Delete—Deletes the highlighted control set. You will be prompted to confirm this action.
• Rename—Allows you to rename the highlighted control set.
• Report—Generates a summary of the highlighted control set, listing the ID, conditions, actions, and elements for all of the logical controls contained within the control set.
Bentley SewerCAD V8i User’s Guide 6-279
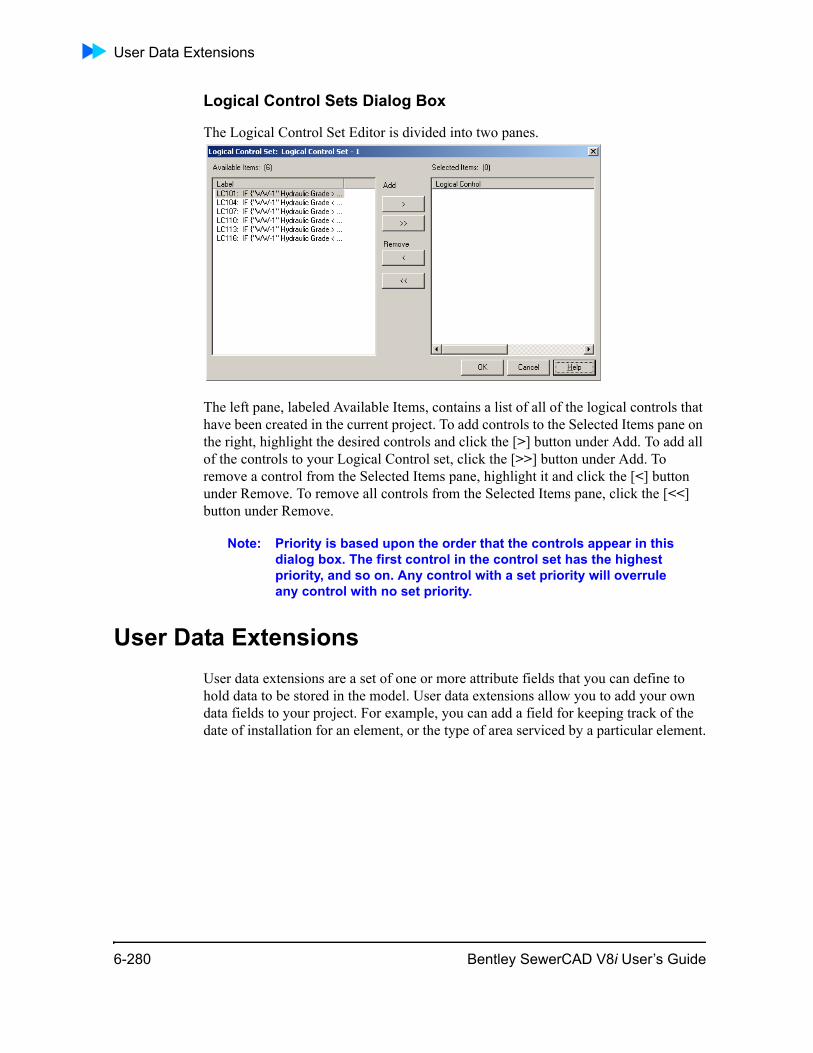
User Data Extensions
Logical Control Sets Dialog Box
The Logical Control Set Editor is divided into two panes.
The left pane, labeled Available Items, contains a list of all of the logical controls that have been created in the current project. To add controls to the Selected Items pane on the right, highlight the desired controls and click the [>] button under Add. To add all of the controls to your Logical Control set, click the [>>] button under Add. To remove a control from the Selected Items pane, highlight it and click the [<] button under Remove. To remove all controls from the Selected Items pane, click the [<<] button under Remove.
Note: Priority is based upon the order that the controls appear in this dialog box. The first control in the control set has the highest priority, and so on. Any control with a set priority will overrule any control with no set priority.
User Data ExtensionsUser data extensions are a set of one or more attribute fields that you can define to hold data to be stored in the model. User data extensions allow you to add your own data fields to your project. For example, you can add a field for keeping track of the date of installation for an element, or the type of area serviced by a particular element.
6-280 Bentley SewerCAD V8i User’s Guide
Creating Your Model
Note: The user data does not affect the hydraulic model calculations. However, their behavior concerning capabilities like editing, annotating, sorting and database connections is identical to any of the standard pre-defined attributes.
User data extensions exhibit the same characteristics as the predefined data used in and produced by the model calculations. This means that user data extensions can be imported or exported through database and shapefile connections, viewed and edited in the Property Editor or in FlexTables, included in tabular reports or element detailed reports, annotated in the drawing, color coded, and reported in the detailed element reports.
Note: The terms “user data extension” and “field” are used interchangeably here. In the context of the User Data Extension feature, these terms mean the same thing.
You define user data extensions in the User Data Extensions dialog box.
To define a user data extension:
1. Select Tools > User Data Extensions.
2. In the list pane on the left, select the element type for which you want to define a new attribute field.
3. Click the New button to create a new user data extension. A user data extension with a default name appears under the element type. You can rename the new field if you wish.
4. In the Property Editor for the new field, enter the following:
– Type the name of the new field. This is the unique identifier for the field. The name field in the Property Editor is the name of the column in the data source.
– Type the label for the new field. This is the label that will appear next to the field for the user data extension in the Property Editor for the selected element type. This is also the column heading if the data extension is selected to appear in a FlexTable.
– Click the Ellipses (...) button in the Category field, then use the drop-down menu in the Select Category dialog box to select an existing category in which the new field will appear in the Property Editor. To create a new category, simply type the category name in the field.
– Type a number in the Field Order Index field. This is the display order of fields within a particular category in the Property Editor. This order also controls the order of columns in Alternative tables. An entry of 0 means the new field will be displayed first within the specified category.
– Type a description for the field. This description will appear at the bottom of the Property Editor when the field is selected for an element in your model. You can use this field as a reminder about the purpose of the field.
Bentley SewerCAD V8i User’s Guide 6-281
User Data Extensions
– Select an alternative from the drop-down menu in the Alternative field. This is the alternative that you want to extend with the new field. Need more infor-mation on this.
– Select a data type from the drop-down menu in the Data Type field.
- If you select Enumerated, an Ellipses (...) button appears in the Default Value field. Enumerated user data extensions are fields that present multiple choices.
– Enter the default value for the new field. If the data type is Enumerated, click the Ellipses (...) button to display the Enumeration Editor dialog box, where you define enumerated members.
5. Perform the following optional steps:
– To import an existing User Data Extension XML File, click the Import button, then select the file you want to import. User Data Extension XML Files contain the file name extension .xml or .udx.xml.
– To export existing user data extensions, click the Export to XML button, then type the name of the udx.xml file. All user data extensions for all element types defined in the current project are exported.
– To share the new field among two or more element types, select the user data extension in the list pane, then click the Sharing button or right-click and select Sharing. In the Shared Field Specification dialog box, select the check box next to the element or elements that will share the user data extension. The icon next to the user data extension changes to indicate that it is a shared field. For more information, see “Sharing User Data Extensions Among Element Types” on page 6-287.
– To delete an existing user data extension, select the user data extension you want to delete in the list pane, then click the Delete button, or right-click and select Delete.
– To rename a the display label of an existing user data extension, select the user data extension in the list pane, click the Rename button or right-click and select Rename, then type the new display label.
– To expand the list of elements and view all user data extensions, click the Expand All button.
– To collapse the list of elements so that no user data extensions are displayed, click the Collapse All button.
6. Click OK to close the dialog box and save your user data extensions. The new field(s) you created will appear in the Property Editor for every instance of the specified element type in your model.
6-282 Bentley SewerCAD V8i User’s Guide
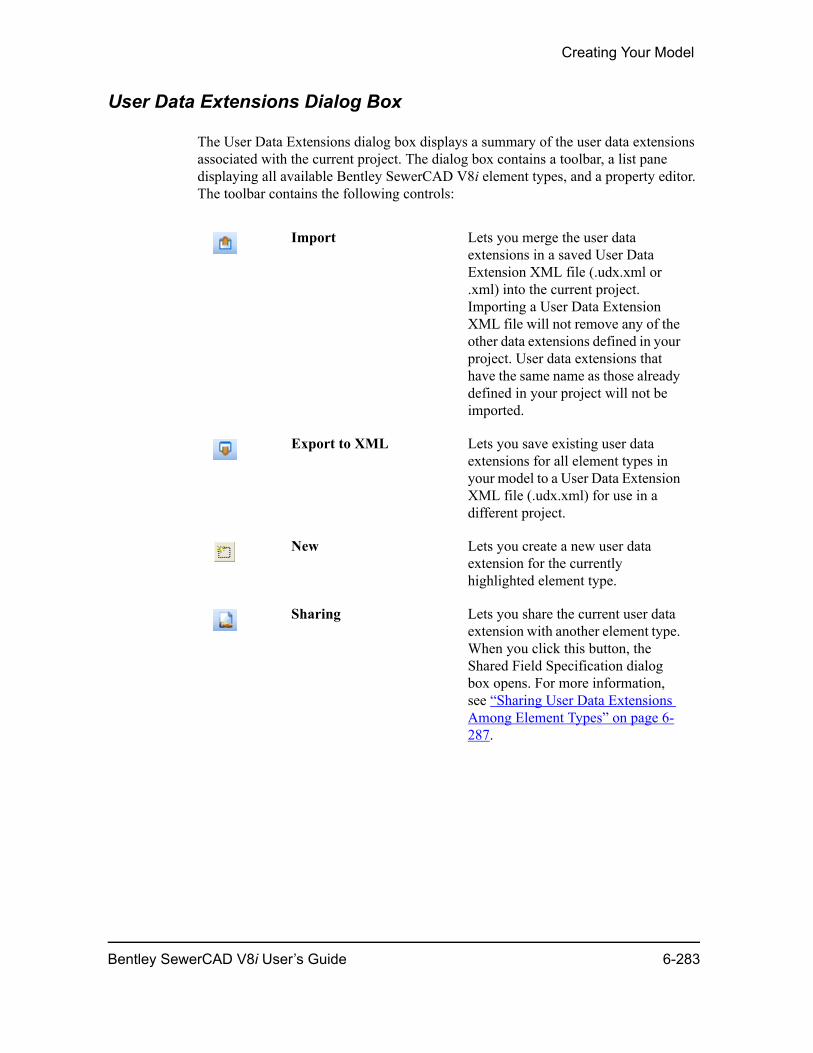
Creating Your Model
User Data Extensions Dialog Box
The User Data Extensions dialog box displays a summary of the user data extensions associated with the current project. The dialog box contains a toolbar, a list pane displaying all available Bentley SewerCAD V8i element types, and a property editor. The toolbar contains the following controls:
Import Lets you merge the user data extensions in a saved User Data Extension XML file (.udx.xml or .xml) into the current project. Importing a User Data Extension XML file will not remove any of the other data extensions defined in your project. User data extensions that have the same name as those already defined in your project will not be imported.
Export to XML Lets you save existing user data extensions for all element types in your model to a User Data Extension XML file (.udx.xml) for use in a different project.
New Lets you create a new user data extension for the currently highlighted element type.
Sharing Lets you share the current user data extension with another element type. When you click this button, the Shared Field Specification dialog box opens. For more information, see “Sharing User Data Extensions Among Element Types” on page 6-287.
Bentley SewerCAD V8i User’s Guide 6-283
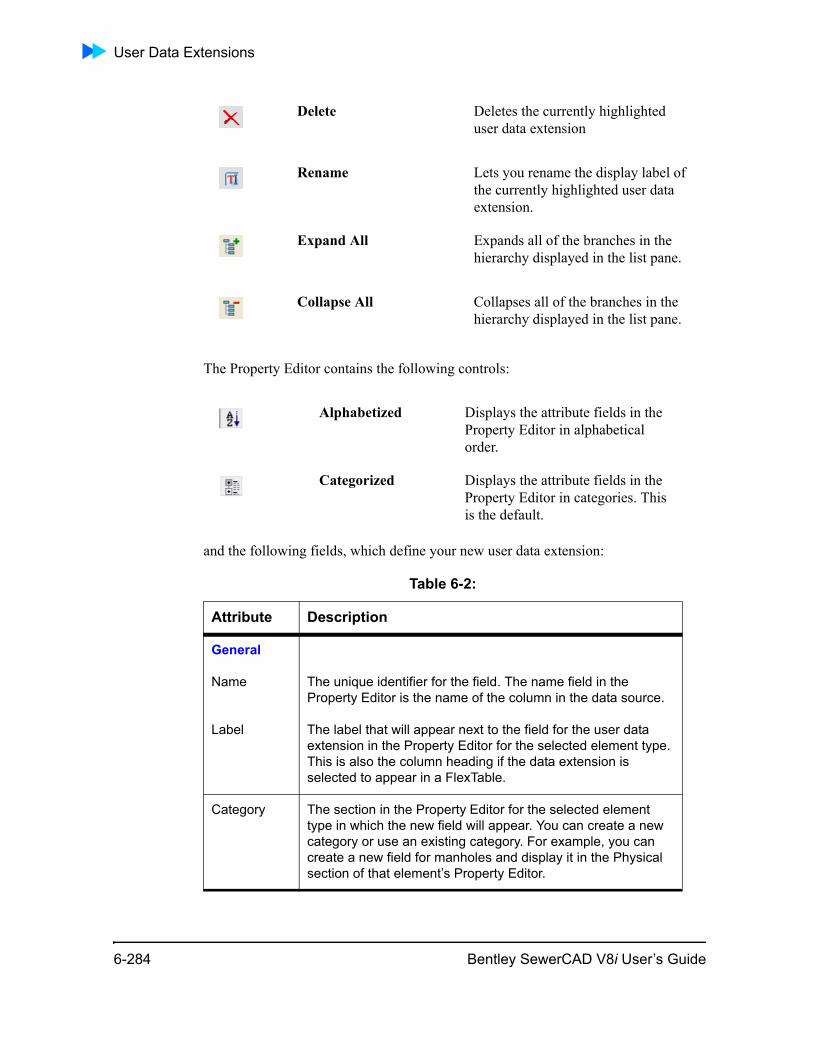
User Data Extensions
The Property Editor contains the following controls:
and the following fields, which define your new user data extension:
Delete Deletes the currently highlighted user data extension
Rename Lets you rename the display label of the currently highlighted user data extension.
Expand All Expands all of the branches in the hierarchy displayed in the list pane.
Collapse All Collapses all of the branches in the hierarchy displayed in the list pane.
Alphabetized Displays the attribute fields in the Property Editor in alphabetical order.
Categorized Displays the attribute fields in the Property Editor in categories. This is the default.
Table 6-2:
Attribute Description
General
Name The unique identifier for the field. The name field in the Property Editor is the name of the column in the data source.
Label The label that will appear next to the field for the user data extension in the Property Editor for the selected element type. This is also the column heading if the data extension is selected to appear in a FlexTable.
Category The section in the Property Editor for the selected element type in which the new field will appear. You can create a new category or use an existing category. For example, you can create a new field for manholes and display it in the Physical section of that element’s Property Editor.
6-284 Bentley SewerCAD V8i User’s Guide
Creating Your Model
Field Order Index
The display order of fields within a particular category in the Property Editor. This order also controls the order of columns in Alternative tables. An entry of 0 means the new field will be displayed first within the specified category.
Field Description
The description of the field. This description will appear at the bottom of the Property Editor when the field is selected for an element in your model. You can use this field as a reminder about the purpose of the field.
Alternative Lets you select an existing alternative to extend with the new field.
Referenced By
Displays all the element types that are using the field. For example, if you create a field called "Installation Date" and you set it up to be shared, this field will show the element types that share this field. So for example, if you set up a field to be shared by manholes and transitions, the Referenced By field would show "Manhole, Transition".
Units
Data Type Lets you specify the data type for the user data extension. Click the down arrow in the field then select one of the following data types from the drop-down menu:• Integer—Any positive or negative whole number.
• Real—Any fractional decimal number (for example, 3.14). It can also be unitized with the provided options.
• Text—Any string (text) value up to 255 characters long.
• Long Text—Any string (text) up to 65,526 characters long.
• Date/Time—The current date. The current date appears by default in the format month/day/year. Click the down arrow to change the default date.
• Boolean—True or False.
• Enumerated—When you select this data type, an Ellipses button appears in the Default Value field. Click the Ellipses (...) button to display the Enumeration Editor dialog box, where you can add enumerated members and their associated values. For more information, see “Enumeration Editor Dialog Box” on page 6-289.
Table 6-2:
Attribute Description
Bentley SewerCAD V8i User’s Guide 6-285
User Data Extensions
Default Value The default value for the user data extension. The default value must consistent with the selected data type. If you chose Enumerated as the data type, click the Ellipses (...) button to display the Enumeration Editor.
Dimension Lets you specify the unit type. Click the drop-down arrow in the field to see a list of all available dimensions. This field is available only when you select Real as the Data Type.
Storage Unit Lets you specify the storage units for the field. Click the drop-down arrow in the field to see a list of all available units; the units listed change depending on the Dimension you select. This field is available only when you select Real as the Data Type.
Numeric Formatter
Lets you select a number format for the field. Click the drop-down arrow in the field to see a list of all available number formats; the number formats listed change depending on the Dimension you select. For example, if you select Flow as the Dimension, you can select Flow, Flow - Pressurized Condition, Flow Tolerance, or Unit Load as the Numeric Formatter. This field is available only when you select Real as the Data Type.
Table 6-2:
Attribute Description
6-286 Bentley SewerCAD V8i User’s Guide
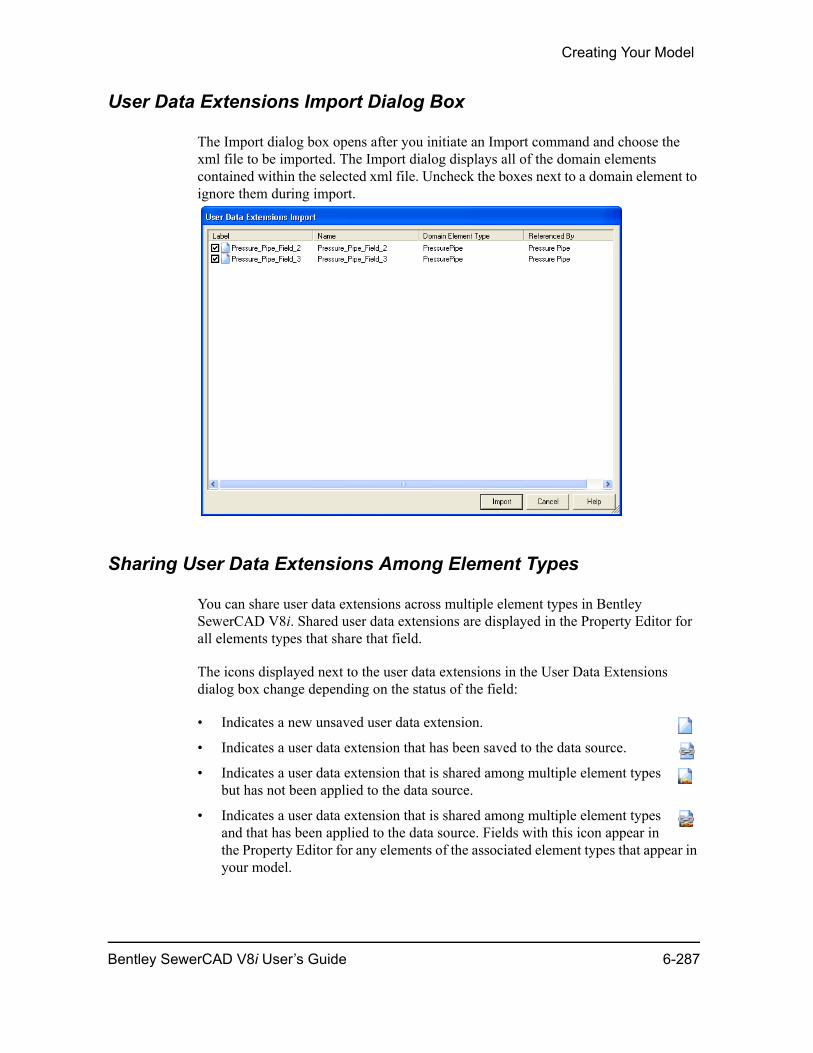
Creating Your Model
User Data Extensions Import Dialog Box
The Import dialog box opens after you initiate an Import command and choose the xml file to be imported. The Import dialog displays all of the domain elements contained within the selected xml file. Uncheck the boxes next to a domain element to ignore them during import.
Sharing User Data Extensions Among Element Types
You can share user data extensions across multiple element types in Bentley SewerCAD V8i. Shared user data extensions are displayed in the Property Editor for all elements types that share that field.
The icons displayed next to the user data extensions in the User Data Extensions dialog box change depending on the status of the field:
• Indicates a new unsaved user data extension.
• Indicates a user data extension that has been saved to the data source.
• Indicates a user data extension that is shared among multiple element types but has not been applied to the data source.
• Indicates a user data extension that is shared among multiple element types and that has been applied to the data source. Fields with this icon appear in the Property Editor for any elements of the associated element types that appear in your model.
Bentley SewerCAD V8i User’s Guide 6-287
User Data Extensions
Observe the following rules when sharing user data extensions:
• You can select any number of element types with which to share the field. The list is limited to element types that support the Alternative defined for the Field. For example, the Physical Alternative may only apply to five of the element types. In this case, you will only see these five items listed in the Alternative drop-down menu.
• You cannot use the sharing feature to move a field from one element type to another. Validation is in place to ensure that only one item is selected and if it is the same as the original, default selection. If it is not, a message appears telling you that when sharing a field, you must select at least two element types, or select the original element type.
• To unshare a field that is shared among multiple element types, right-click the user data extension you want to keep in the list pane, then select Sharing. Clear all the element types that do not want to share the field with and click OK. If you leave only one element type checked in the Shared Field Specification dialog box, it must be the original element type for which you created the user data extension.
– The fields that were located under the manhole and conduit element type root nodes will be removed completely.
– You can also unshare a field by using the Delete button or right-clicking and selecting Delete. This will unshare and delete the field.
To share a user data extension:
1. Open the User Data Extensions dialog box by selecting Tools > User Data Exten-sions.
2. In the list pane, create a new user data extension to share or select an existing user data extension you want to share, then click the Sharing button.
3. In the Shared Field Specification dialog box, select the check box next to each element type that will share the user data extension.
4. Click OK.
5. The icon next to the user data extension in the list pane changes to indicate that it is a shared field.
Shared Field Specification Dialog Box
You select element types to share a user data extension in the Shared Field Specifica-tion dialog box. The dialog box contains a list of all possible element types with check boxes.
6-288 Bentley SewerCAD V8i User’s Guide
Creating Your Model
Select element types to share the current user data extension by selecting the check box next to the element type. Clear a selection if you no longer want that element type to share the current field.
Enumeration Editor Dialog Box
The Enumeration Editor dialog box appears when you select Enumerated as the Data Type for a user data extension, then click the Ellipses (...) button in the Default Value field. Enumerated fields are fields that contain multiple selections - you define these as members in the Enumeration Editor dialog box.
For example, suppose you want to identify conduits in a model of a new subdivision by one of the following states: Existing, Proposed, Abandoned, Removed, and Retired. You can define a new user data extension with the label “Pipe Status” for conduits, and select Enumerated as the data type. Click the Ellipses (...) button in the Default Value field in the Property Editor for the user data extension to display the Enumeration Editor dialog box. Then enter five members with unique labels (one member for each unique pipe status) and enumeration values in the table. After you close the User Data Extensions dialog box, the new field and its members will be available in the Property Editor for all conduits in your model. You will be able to select any of the statuses defined as members in the new Pipe Status field.
You can specify an unlimited number of members for each user data extension, but member labels and values must be unique. If they are not unique, an error message appears when you try to close the dialog box.
The dialog box contains a table and the following controls:
• New—Lets you add a new row to the table. Each row in the table represents a unique enumerated member of the current user data extension.
• Delete—Deletes the current row from the table. The enumerated member defined in that row is deleted from the user data extension.
You define enumerated members in the table, which contains the following columns:
• Enumeration Member Display Label—The label of the member. This is the label you will see in Bentley SewerCAD V8i where ever the user data extension appears (Property Editor, FlexTables, etc.).
• Enumeration Value—A unique integer index associated with the member label. Bentley SewerCAD V8i uses this number when it performs operations such as queries.
Bentley SewerCAD V8i User’s Guide 6-289
Batch Pipe Split Dialog Box
Batch Pipe Split Dialog BoxThe Batch Pipe Split dialog allows you to split pipes with neighboring nodes that are found within the specified tolerance.
• Choose Features to Process: Allows you to specify which pipes to include in the split operation. The following options are available:
– All: All pipes in the model that have a neighboring node within the specified tolerance will be split by that junction.
– Selection: Only the pipes that are currently selected in the drawing pane will be split by a neighboring junction that lies within the specified tolerance.
– Selection Set: Only those pipes that are contained within the selection set specified in the drop down list or pipes that lie within the tolerance of a node that is contained in the selection set will be split by a neighboring junction that lies within the specified tolerance.
• Allow splitting with inactive nodes: When this box is checked, nodes that are marked Inactive will not be ignored during the split operation.
• Tolerance: This value is used to determine how close a pipe must be to a node in order for the pipe to be split by that junction.
Pipes will be split by every node that falls within the specified tolerance. To prevent unwanted pipe splits, first use the Network Navigator's "Network Review > Pipe Split Candidates" query to verify that the tolerance you intend to use for the Batch Split operation will not include nodes that you do not want involved in the pipe split operation.
To use the Network Navigator to assist in Batch Pipe Split operations
1. Open the Network Navigator.
2. Click the [>] button and select the Network Review...Pipe Split Candidates query.
3. In the Query Parameters dialog box, type the tolerance you will be using in the pipe split operation and click OK.
4. In the Network Navigator, highlight nodes in the list that you do not want to be included in the pipe split operation and click the Remove button.
5. Open the Batch Pipe Split dialog.
6. Click the Selection button.
7. Type the tolerance you used in the Network Review query and click OK.
6-290 Bentley SewerCAD V8i User’s Guide
Creating Your Model
External ToolsUse the External Tool Manager to manage custom menu commands, which are then located in the Tools menu for quick accessibility.
Click Tools>External Tools to create a custom menu command from any executable file. Executable file types include:
• .exe
• .com
• .pif
• .bat
• .cmd
The External Tool Manager consists of the following elements:
• External Tool List Pane—This pane lists the external tools that have been created. All of the tools listed in this pane will be displayed in the Tools > External Tools menu.
• New—Creates a new external tool in the list pane.
• Delete—Deletes the currently highlighted tool.
• Rename—Allows you to rename the currently highlighted tool.
• Command—This field allows you to enter the full path to the executable file that the tool will initiate. Click the ellipsis button to open a Windows Open dialog to allow you to browse to the executable.
• Arguments—This optional field allows you to enter command line variables that are passed to the tool or command when it is activated. Click the > button to open a submenu containing predefined arguments. Arguments containing spaces must be enclosed in quotes. The available arguments are:
– Project Directory—This argument passes the current project directory to the executable upon activation of the tool. The argument string is %(ProjDir).
– Project File Name—This argument passes the current project file name to the executable upon activation of the tool. The argument string is %(ProjFile-Name).
– Project Store File Name—This argument passes the current project datastore file name to the executable upon activation of the tool. The argument string is %(ProjStoreFileName).
– Working Directory—This argument passes the current working directory to the executable upon activation of the tool. The argument string is %(Proj-WorkDir).
Bentley SewerCAD V8i User’s Guide 6-291
External Tools
• Initial Directory—Specifies the initial or working directory of the tool or command. Click the > button to open a submenu containing predefined directory variables. The available variables are:
– Project Directory—This variable specifies the current project directory as the Initial Directory. The variable string is %(ProjDir).
– Working Directory—This variable specifies the current working directory as the Initial Directory. The variable string is %(ProjWorkDir).
Test—This button executes the external tool using the specified settings.
External Tools Workflow
Access External Tools from Tools->External Tools->Customize.
If there are any existing tools they will appear as menu items above Customize with a separator.
1. In the External Tools dialog, click the new button to create a new external tool.
2. The command field should contain the entire path and filename to execute. Use the […] button to browse to the program or file that will execute. This can be any file with the following extensions:
a. exe
b. com
c. pif (shortcut file)
d. bat
e. cmd
3. The arguments field is optional. If the program you selected can receive argu-ments you have a number to choose from.
a. Project Directory - this is the directory to the currently open project. Displayed as %(ProjDir)
b. Project Filename - this is the filename of the currently open project (what you see in the project file tab near the top of the drawing window). Displayed as %(ProjFileName)
c. Project Store Filename - this is the temporary filename that is used and is stored in the user's temporary directory. Displayed as %(ProjStoreFileName)
d. Working Directory - this is normally the temporary folder location (the user's temporary folder) where the project store file is located. Displayed as %(Proj-WorkDir)
6-292 Bentley SewerCAD V8i User’s Guide

Creating Your Model
4. The initial directory is also optional. This is used to set a working directory if one is required by the program you selected. Normally it is not required. You have the choice between the following:
a. Project Directory - the directory where the project file is located. Displayed as %(ProjDir)
b. Working Directory - the directory where the project store file is located. Displayed as %(ProjWorkDir)
TRex WizardThe TRex Wizard steps you through the process of automatically assigning elevations to specified nodes based on data from a Digital Elevation Model or a Digital Terrain Model.
Bentley SewerCAD V8i User’s Guide 6-293
TRex Wizard
Step 1: File Selection
The DEM, DTM, DDF, or SHP (contour shapefile) file, the SewerCAD V8i model, and the features to which elevations will be assigned are specified.
• Data Source Type—This menu allows you to choose the type of file that contains the input data you will use.
• File—This field displays the path where the DXF, XML, or SHP file is located. Use the browse button to find and select the desired file.
• Spatial Reference —Click the Ellipsis (...) next to this field to open the Spatial Reference Properties dialog box, allowing you to specify the spatial reference being used by the elevation data file.
• Select Elevation Field—Select the elevation unit.
• X-Y Units—This menu allows the selection of the measurement unit type associ-ated with the X and Y coordinates of the elevation data file.
• Z Units—This menu allows the selection of the measurement unit type associated with the Z coordinates of the elevation data file.
• Clip Dataset to Model—In some cases, the data source contains elevation data for an area that exceeds the dimensions of the area being modeled. When this box is checked, TRex will calculate the model’s bounding box, find the larger dimen-sion (width or height), calculate the Buffering Percentage of that dimension, and increase both the width and height of the model bounding box by that amount. Then any data point that falls outside of the new bounding box will not be used to generate the elevation mesh. If this box isn’t checked, all the source data points are used to generate the elevation mesh. Checking this box should result in faster calculation speed and use less memory.
• Buffering Percentage—This field is only active when the Clip Dataset to Model box is checked. The percentage entered here is the percentage of the larger dimen-sion (width or height) of the model’s bounding box that will be added to both the bounding box width and height to find the area within which the source data points will be used to build the elevation mesh.
• Spatial Reference (ArcGIS Mode Only)—Click the Ellipsis (...) next to this field to open the Spatial Reference Properties dialog box, allowing you to specify the spatial reference being used by the SewerCAD V8i model file.
• Also update inactive elements—Check this box to include inactive elements in the elevation assignment operation. When this box is unchecked, elements that are marked Inactive will be ignored by TRex.
• All—When this button is selected, TRex will attempt to assign elevations to all nodes within the SewerCAD V8i model.
• Selection—When this button is selected, TRex will attempt to assign elevations to all currently highlighted nodes.
6-294 Bentley SewerCAD V8i User’s Guide

Creating Your Model
• Selection Set—When this is selected, the Selection Set menu is activated. When the Selection Set button is selected, TRex will assign elevations to all nodes within the selection set that is specified in this menu.
Note: If the SewerCAD V8i model (which may or may not have a spatial reference explicitly associated with it) is in a different spatial reference than the DEM/DTM (which does have a spatial reference explicitly associated with it), then the features of the model will be projected from the model’s spatial reference to the spatial reference used by the DEM/DTM.
Bentley SewerCAD V8i User’s Guide 6-295
TRex Wizard
Step 2: Completing the TRex Wizard
The results of the elevation extraction process are displayed and the results can be applied to a new or existing physical alternative.
• Results Preview Pane—This tabular pane displays the elevations that were calculated by TRex. The table can be sorted by label by clicking the Label column heading and by elevation by clicking the Elevation column heading. You can filter the table by right-clicking a column in the table and selecting the Filter...Custom command. You can also right-click any of the values in the elevation column to change the display options.
• Use Existing Alternative—When this is selected, the results will be applied to the physical alternative that is selected in the Use Existing Alternative menu. This menu allows the selection of the physical alternative to which the results will be applied.
• New Alternative —When this is selected, the results will be applied to a new physical alternative. First, the currently active physical alternative will be dupli-cated, then the results generated by TRex will be applied to the newly created alternative. The name of this new alternative must be supplied in the New Alter-native text field.
• Parent Alternative—Select an alternative to duplicate from the menu, or select <None> to create a new Base alternative.
• Export Results—This exports the results generated by TRex to a tab or comma-delimited text file (.TXT). These files can then be re-used by SewerCAD V8i or imported into other programs.
• Click Finish when complete, or Cancel to close without making any changes.
6-296 Bentley SewerCAD V8i User’s Guide
7
ChapterLoading
Click one of the following links to learn how to add loading data to your Bentley SewerCAD V8i model:
• “Loading” on page 7-297
• “Types of Loads” on page 7-299
• “Composite Hydrographs” on page 7-318
• “Inflows” on page 7-319
• “Sanitary (Dry Weather) Flow Collections” on page 7-332
• “Using LoadBuilder to Assign Loading Data” on page 7-335
• “Pipeline Infiltration” on page 7-360
LoadingThe word "loading" is used in Bentley SewerCAD V8i to describe flow entering the sewer system. Depending on the type of system, available data and level of detail, there are numerous ways of loading Bentley SewerCAD V8i models. Some of the distinctions relate to whether the system is a combined or sanitary system, whether the loads are existing with flow data or proposed loads with only land use descriptions, whether the flow refers to dry weather sanitary flows or wet weather flow.
Note: For more information on loading, see Chapter 6 "Dry weather wastewater flows" and Chapter 7 "Wet weather wastewater flows" in the book Wastewater Collection System Modeling and Design" by Haestad Press.
With the exception of known fixed flows, the loading to the model consists of a table of flow or pattern values vs. time. The generic word "collection" is used to describe inputs to Bentley SewerCAD V8i that are not a single value but are some type of table. For example, you will see Inflow Collections, which are simply a table of inflow vs. time.
Bentley SewerCAD V8i User’s Guide 7-297
Loading
Methods for Entering Loads
There are several methods for entering loads into Bentley SewerCAD V8i. In general, most of the methods described can be applied to any node type element (i.e., manhole, pressure junction, but not outfalls). Some such as stormwater loading must be applied to catchments and conduit infiltration can only be applied to conduits. They are summarized below and described in more detail later in this chapter.
• Inflow consists of data which may be:
– Known constant flow
– Hydrograph - flow vs. time
– Pattern Load - baseline flow times multiplier
In general, the hydrograph input is used for wet weather events while pattern loads are used for sanitary flows which repeat from one day to the next. For more information, see “Inflows” on page 7-319.
• Sanitary loading consists of data which may be
– Know constant flow
– Hydrograph - flow vs. time
– Pattern Load - baseline flow times multiplier
– Unit loads - number of units (e.g. houses) times unit load (e.g. flow/house/day)
Sanitary loads are generally used to describe dry weather contribution to flow from domestic, commercial and industrial customers. For more information, see “Sanitary (Dry Weather) Flow Collections” on page 7-332.
• Load Builder consists of using the LoadBuilder model to place loads on nodes using ArcGIS functions. Unlike the methods above which are applicable when the loads are already known for each node, LoadBuilder is used when the loading data is not yet associated with individual nodes. For example, the data can be in the form of:
– Customer water use billing data
– Area-wide flow measurement
– Load (e.g. population or land use assigned to polygons) times unit loading factors (e.g. flow/day/area)
This method must be started from ArcMap or ArcCatalog. For more information, see “Using LoadBuilder to Assign Loading Data” on page 7-335.
7-298 Bentley SewerCAD V8i User’s Guide
Loading
• Conduit infiltration can be used to model infiltration into pipes along the length of the pipe. This can be specified as:
– Known unit flow based on Length, Area, Diameter-length, or Count.
– Hydrograph
– Pattern
For more information, see “Pipeline Infiltration” on page 7-360.
Summary
In general:
• Dry weather load can be entered using Inflow, Sanitary Loading and LoadBuilder.
• Wet weather flow in sanitary systems can be entered using inflow, RDII or conduit infiltration.
• Wet weather flow in stormwater and combined systems can be entered using Inflow, Stormwater flow or Conduit infiltration.
Types of LoadsWithin each of the loading methods available in Bentley SewerCAD V8i, there are several ways to enter (add) data. For example, under the method Inflow for loading the model, there are two types of inflow - fixed and hydrograph. For example, under the method Inflow for loading the model, there are three types of inflow - fixed, hydrograph and pattern load. These loading types may be used by several methods. For example, pattern loading is used by the Inflow, Sanitary and Pipeline Infiltration methods. The dialogs for each of these types are the same regardless of the method being used.
Bentley SewerCAD V8i User’s Guide 7-299
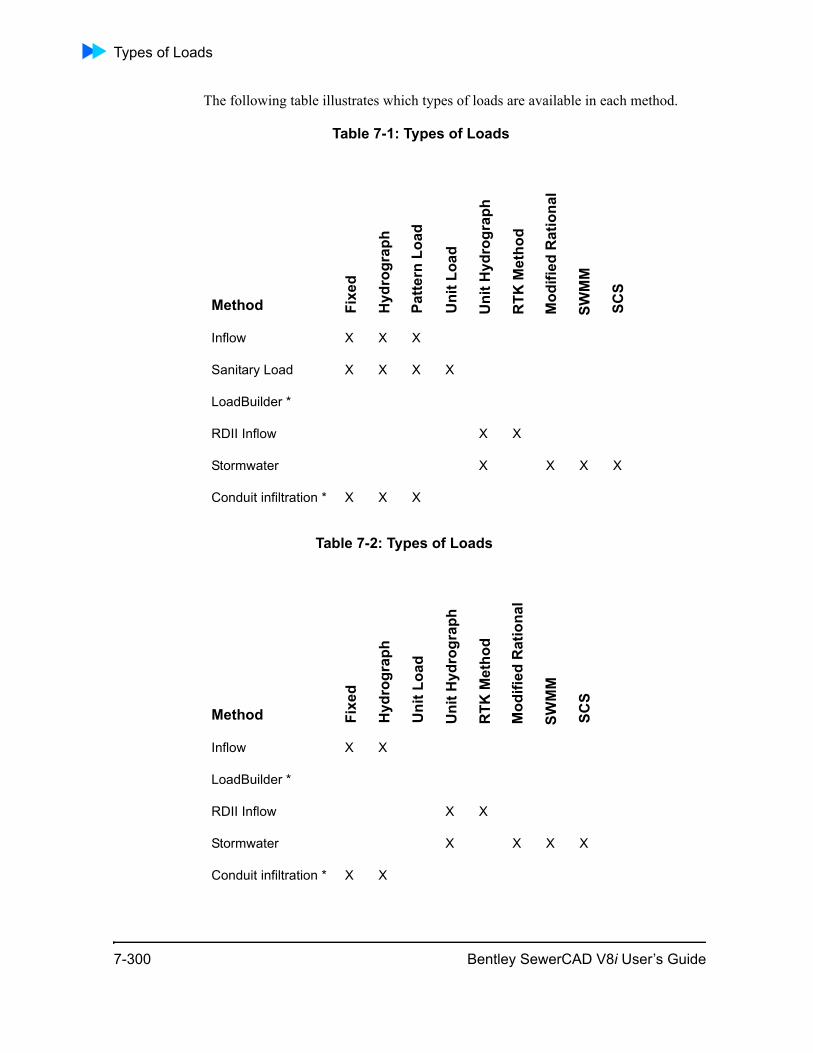
Types of Loads
The following table illustrates which types of loads are available in each method.
Table 7-1: Types of Loads
Method
Inflow X X X
Sanitary Load X X X X
LoadBuilder *
RDII Inflow X X
Stormwater X X X X
Conduit infiltration * X X X
Table 7-2: Types of Loads
Method
Inflow X X
LoadBuilder *
RDII Inflow X X
Stormwater X X X X
Conduit infiltration * X X
Fixe
d
Hyd
rogr
aph
Patte
rn L
oad
Uni
t Loa
d
Uni
t Hyd
rogr
aph
RTK
Met
hod
Mod
ified
Rat
iona
l
SWM
M
SCS
Fixe
d
Hyd
rogr
aph
Uni
t Loa
d
Uni
t Hyd
rogr
aph
RTK
Met
hod
Mod
ified
Rat
iona
l
SWM
M
SCS
7-300 Bentley SewerCAD V8i User’s Guide
Loading
*LoadBuilder used GIS based calculations described in [hot link].
*Conduit infiltrations uses fixed flows on a per length or area basis.
Adding Fixed Loads
A fixed load can be entered as a:
• Known flow under sanitary loading
• Pattern load with the multiplier set to 1
• Hydrograph inflow with "fixed" specified
Hydrograph vs. Pattern Loads
Hydrographs and pattern loads are two distinct ways to describe how flow varies over time. Ultimately, you can attain the same results using either type but there are some behavioral and semantic differences that should be noted.
Pattern loads consists of a single average base load and a series of dimensionless multipliers used to delineate how the load varies over time. A hydrograph, simply, is a time-discharge series.
Hydrographs are usually applied as wet weather loads, and are generated using hydro-logic methods, while patterns are more typically applied to sanitary loads. Pattern multipliers are usually developed based on flow monitoring data for the system under consideration. The multipliers are used to account for time-of-day variations in sewer loads. Usually a handful of patterns are developed (e.g. residential area, commercial area, large industry) and these patterns are assigned to the appropriate nodes. These statements represent typical usage of both loading types; they do not represent hard and fast rules.
During an extended period simulation if the duration of the simulation exceeds the duration of a pattern then the pattern will repeat itself. If the duration of the simula-tion exceeds the duration of a hydrograph the last point of the hydrograph will remain constant for the extent of the remaining time.
The following figure shows the difference between a hydrograph and pattern load.
Bentley SewerCAD V8i User’s Guide 7-301
Types of Loads
Figure 7-1: Difference between a Hydrograph and Pattern Load
Adding User Defined Hydrographs
You can directly associate a user-defined unit hydrograph to a node element (e.g. manhole, wet well) for runoff calculations.
To add a user defined hydrograph to a node:
1. Click a node in your model to display the Property Editor, or right-click a node and select Properties from the shortcut menu.
2. In the Inflow (Sanitary Loading) or Inflow (Wet) section of the Property Editor, click the Ellipses (...) button next to the Sanitary Loads or the Inflow (Wet) Collection field.
3. In the Sanitary Loads dialog click the New button and select Hydrograph - Flow vs. Time. In the Inflow (Wet)) Collection dialog click the New button and select Hydrograph Load.
4. Click the New button to add a row to the Time vs. Flow table.
5. Enter Time vs. Flow data into the table. Press Enter after typing a value to add a new row to the table (or click the New button to add a new row).
To insert a row at a time in between two other times, simply insert at the bottom of the table. When you close the table then reopen it, the row will be in the correct position.
7-302 Bentley SewerCAD V8i User’s Guide
Loading
Note: Time and flow units must be consistent with time and flow units used throughout the model.
6. Click the Graph button to view a plot of the Time vs. Flow data.
7. Click OK to close the dialog box and add the hydrograph to the Property Editor for the node.
Pattern Loads
A pattern load consists of a base flow and a pattern, which is a set of multipliers used to adjust base flow over the course of a day (or some other period). Patterns can also be used with unit loads by assigning a pattern setup for a particular scenario.
Working with Patterns
A dynamic analysis is actually a series of Steady State analyses run against time-vari-able loads such as sewer inflows, demands, or chemical constituents. Patterns allow you to apply automatic time-variable changes within the system. The most common application of patterns is for residential or industrial loads. Diurnal curves are patterns that relate to the changes in loads over the course of the day, reflecting times when people are using more or less water than average. Most patterns are based on a multi-plication factor versus time relationship, whereby a multiplication factor of one repre-sents the base value (which is often the average value).
Using a representative diurnal curve for a residence as illustrated below, we see that there is a peak in the diurnal curve in the morning as people take showers and prepare breakfast, another slight peak around noon, and a third peak in the evening as people arrive home from work and prepare dinner. Throughout the night, the pattern reflects the relative inactivity of the system, with very low flows compared to the average.
Bentley SewerCAD V8i User’s Guide 7-303
Types of Loads
Note: This curve is conceptual and should not be construed as representative of any particular network.
There are two basic forms for representing a pattern: stepwise and continuous. A step-wise pattern is one that assumes a constant level of usage over a period of time, and then jumps instantaneously to another level where it remains steady until the next jump. A continuous pattern is one for which several points in the pattern are known and sections in between are transitional, resulting in a smoother pattern. For the continuous pattern in the figure above, the multiplication factor and slope at the start time and end times are the same. This is a continuity that is recommended for patterns that repeat.
Because of the finite time steps used for calculations, this software converts contin-uous patterns into stepwise patterns for use by the algorithms. In other words for a time step a multiplier is interpolated from the pattern curve. That multiplier is then used for the duration of the time step, until a new multiplier is selected for the next time step.
Patterns provide a convenient way to define the time variable aspects of system loads.
7-304 Bentley SewerCAD V8i User’s Guide

Loading
Pattern Manager
A pattern is a series of time step values, each having an associated multiplier value. During an extended period analysis, each time step of the simulation uses the multi-plier from the pattern corresponding to that time. If the duration of the simulation is longer than the pattern, the pattern is repeated. The selected multiplier is applied to any baseline load that is associated with the pattern. You can also define daily and monthly multipliers for any pattern.
Patterns provide an effective means of applying time-variable system demands to the distribution model. The Pattern Manager allows you to create the following types of patterns:
• Hydraulic—This type of pattern can be applied to Junctions or Tanks. Use this pattern type to describe demand or inflow patterns over time.
• Pump—This type of pattern can be applied to Variable Speed Pumps only. Use this pattern type to describe changes in the pump’s Relative Speed Factor. In the Property dialog box for the pump, Is Variable Speed Pump needs to be set to True and the VSP type needs to be Pattern Based.
The following management controls are located above the pattern list pane:
New Creates a new pattern of the highlighted type.
Copy Creates a copy of the pattern that is currently highlighted in the list pane.
Bentley SewerCAD V8i User’s Guide 7-305
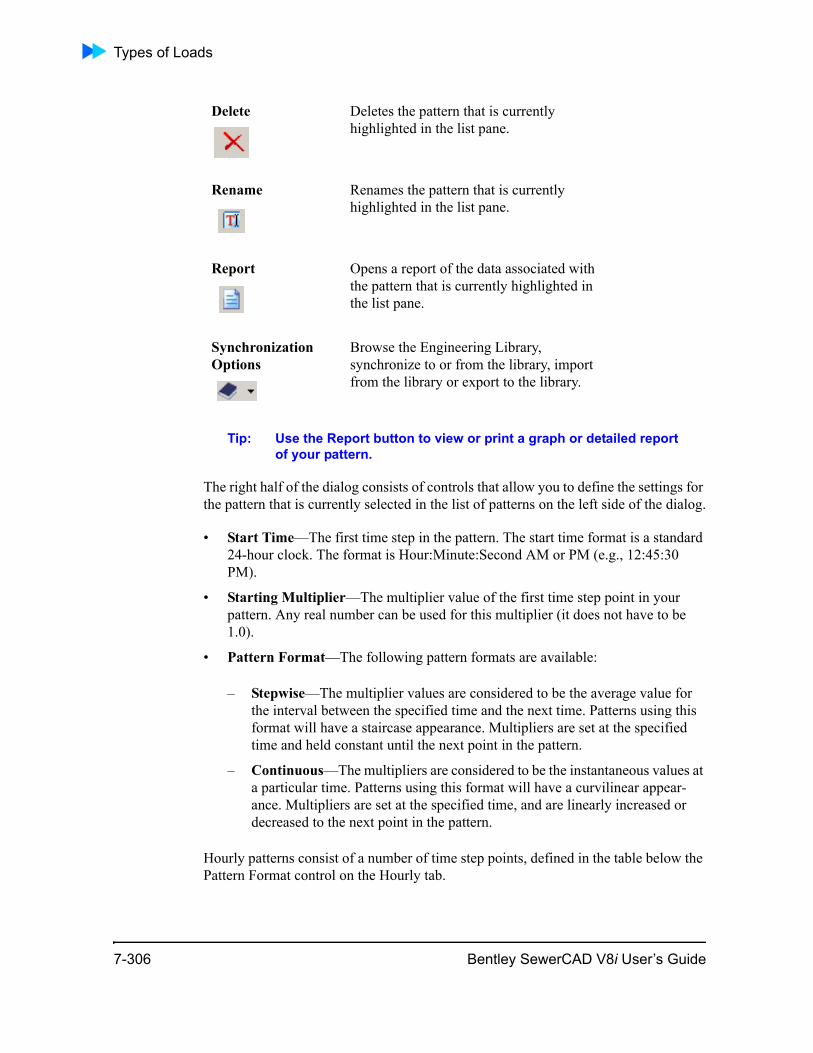
Types of Loads
Tip: Use the Report button to view or print a graph or detailed report of your pattern.
The right half of the dialog consists of controls that allow you to define the settings for the pattern that is currently selected in the list of patterns on the left side of the dialog.
• Start Time—The first time step in the pattern. The start time format is a standard 24-hour clock. The format is Hour:Minute:Second AM or PM (e.g., 12:45:30 PM).
• Starting Multiplier—The multiplier value of the first time step point in your pattern. Any real number can be used for this multiplier (it does not have to be 1.0).
• Pattern Format—The following pattern formats are available:
– Stepwise—The multiplier values are considered to be the average value for the interval between the specified time and the next time. Patterns using this format will have a staircase appearance. Multipliers are set at the specified time and held constant until the next point in the pattern.
– Continuous—The multipliers are considered to be the instantaneous values at a particular time. Patterns using this format will have a curvilinear appear-ance. Multipliers are set at the specified time, and are linearly increased or decreased to the next point in the pattern.
Hourly patterns consist of a number of time step points, defined in the table below the Pattern Format control on the Hourly tab.
Delete Deletes the pattern that is currently highlighted in the list pane.
Rename Renames the pattern that is currently highlighted in the list pane.
Report Opens a report of the data associated with the pattern that is currently highlighted in the list pane.
Synchronization Options
Browse the Engineering Library, synchronize to or from the library, import from the library or export to the library.
7-306 Bentley SewerCAD V8i User’s Guide
Loading
• Time From Start—The amount of time from the Start Time of the pattern to the time step point being defined.
• Multiplier—The multiplier value associated with the time step point.
Daily and Monthly factors are defined in the same way as hourly ones, the difference being that rather than defining time steps you enter multipliers for each day of the week (for Daily patterns) or for each month of the year (for monthly patterns).
A graph of the currently selected pattern is displayed in the lower right corner of the dialog.
Note: Patterns must begin and end with the same multiplier value. This is because patterns will be repeated if the duration of the Extended Period Analysis is longer than the pattern duration. In other words, the last point in the pattern is really the start point of the pattern’s next cycle.
An Extended Period Analysis is actually a series of Steady State analyses for which the boundary conditions of the current time step are calculated from the conditions at the previous time step. This software will automatically convert a continuous pattern format to a stepwise format so that the demands and source concentrations remain constant during a time step.
An individual node can support multiple hydraulic demands. Furthermore, each load can be assigned any hydraulic demand pattern. This powerful functionality makes it easy to combine two or more types of demand patterns (such as residential and institutional) at a single loading node.
Defining Pattern Setups
A pattern setup allows you to match unit sanitary (dry weather) loads with appropriate loading patterns. A pattern setup is associated with each scenario as specified in the Calculation Options Manager. Each scenario can use a different pattern setup, thus allowing you to model different loading alternatives for different extended period simulations.
Bentley SewerCAD V8i User’s Guide 7-307
Types of Loads
Note: You must have at least one unit sanitary (dry weather) load set up in your model and at least one pattern defined before you can define a pattern setup.
To define a pattern setup:
1. Define at least one unit sanitary (dry weather) load in your current project. For more information, see “Adding Unit Sanitary (Dry Weather) Loads” on page 7-311.
2. Define at least one pattern in your current project.
3. Select Analysis > Pattern Setups or click the Pattern Setups button on the Anal-ysis toolbar.
4. In the Pattern Setups dialog box, click the New button to create a new pattern setup.
5. The table on the right side of the dialog box displays all of the unit sanitary (dry weather) loads currently associated with your current project. For each unit load in the table, select an existing pattern from the Setup Pattern submenu.
6. Perform the following optional steps:
– To delete an existing pattern setup, select the pattern setup label in the list pane, then click the Delete button.
– To rename an existing pattern setup, select the pattern setup label in the list pane, then click the Rename button and type the new name of the pattern setup.
– To view a report on an existing pattern setup, select the pattern setup label in the list pane, then click the Report button.
7. Click Close.
Pattern Setups Dialog Box
The Pattern Setups dialog box lets you define a list of pattern setups. The dialog box contains a list pane on the left and a table on the right:
7-308 Bentley SewerCAD V8i User’s Guide
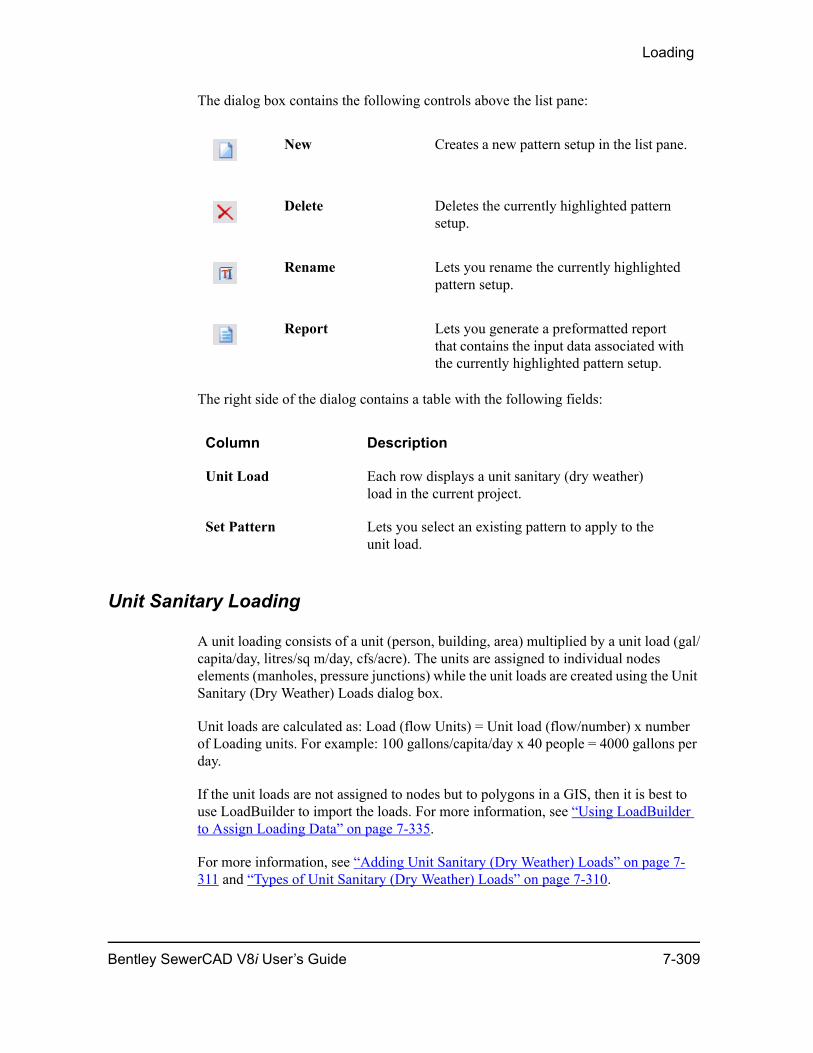
Loading
The dialog box contains the following controls above the list pane:
The right side of the dialog contains a table with the following fields:
Unit Sanitary Loading
A unit loading consists of a unit (person, building, area) multiplied by a unit load (gal/capita/day, litres/sq m/day, cfs/acre). The units are assigned to individual nodes elements (manholes, pressure junctions) while the unit loads are created using the Unit Sanitary (Dry Weather) Loads dialog box.
Unit loads are calculated as: Load (flow Units) = Unit load (flow/number) x number of Loading units. For example: 100 gallons/capita/day x 40 people = 4000 gallons per day.
If the unit loads are not assigned to nodes but to polygons in a GIS, then it is best to use LoadBuilder to import the loads. For more information, see “Using LoadBuilder to Assign Loading Data” on page 7-335.
For more information, see “Adding Unit Sanitary (Dry Weather) Loads” on page 7-311 and “Types of Unit Sanitary (Dry Weather) Loads” on page 7-310.
New Creates a new pattern setup in the list pane.
Delete Deletes the currently highlighted pattern setup.
Rename Lets you rename the currently highlighted pattern setup.
Report Lets you generate a preformatted report that contains the input data associated with the currently highlighted pattern setup.
Column Description
Unit Load Each row displays a unit sanitary (dry weather) load in the current project.
Set Pattern Lets you select an existing pattern to apply to the unit load.
Bentley SewerCAD V8i User’s Guide 7-309

Types of Loads
Unit loads correspond to a baseline load and time of day patterns can be assigned to scenarios. For more information, see “Defining Pattern Setups” on page 7-307.
Default unit load information is not stored with the project but with a library that can be shared between projects. Default values are provided in the library called "HMI Unit Sanitary (Dry Weather) Loads.xml"
Types of Unit Sanitary (Dry Weather) Loads
The following types of unit sanitary loads are supported in Bentley SewerCAD V8i:
Population-based
The most common way of specifying sanitary loads to a sewer system is to make them proportional to the contributing population. Population-based unit sanitary loads define loads as a function of adjusted contributing population. You can select the population loading units that will be used and the unit load per population unit. For example, the unit sanitary load, Home (Average), specifies Resident as the population loading unit, and 280 l/d per Resident as the unit load per population unit.
Non-population-based
Non-population-based unit sanitary loads can be area-based (function of contributing area), discharge-based (function of direct discharge), or count-based (function of a user-defined count).
Area-based
Area-based unit sanitary loads are commonly used to specify industrial loads and steady inflows. Use these unit sanitary loads whenever your load is specified as a function of contributing area. For example, you may use "area residential" (in hectare) as a property of each node and 400 L/day/hectare as the unit loading.
Discharge-based
Discharge-based unit sanitary loads are used to directly specify loads without speci-fying them on the basis of some other count, such as population or area.
There are two general ways to use discharge based loads:
7-310 Bentley SewerCAD V8i User’s Guide
Loading
• Specify 1.0 discharge unit (e.g. l/day, gpd, cfs, etc.) as the unit load. Then, when using the load, specify the total desired load for the loading unit count. For example, you can create a load called Liter per Day whose loading unit type is Discharge, loading unit is l/day, and unit load is 1.0. When you use this load at a manhole, a wet well, or a pressure junction, you specify 50.0 as the loading unit count. This yields a base load of 50 l/day.
• Specify total desired load as the unit load. Then, when using the load, only specify 1.0 as the loading unit count. For example, you can create a load called Industry XYZ whose loading unit type is Discharge, loading unit is l/day, and unit load is 2000.0. When you use this load at the manhole, wet well, or pressure junc-tion, you would specify 1.0 as the loading unit count. This yields a base load of 2000 l/day.
In other words, you can specify a unit load of 1.0 in the Unit Sanitary Load Library and determine the total load at each node through the loading unit count, or you can specify the total load in the Unit Sanitary Load Library and then have a loading unit count of 1.0.
Count-based
Count-based unit sanitary loads should be used for any load that is not area, popula-tion, nor discharge-based. These loads allow you to specify any loading unit such as loading per vehicle, machine, or anything else.
Loading units in user-defined counts are treated only as labels. Conversion between these units is always 1 to 1.
Adding Unit Sanitary (Dry Weather) Loads
Bentley SewerCAD V8i defines unit sanitary loads in editable Engineering Libraries, allowing you to edit predefined unit sanitary loads and insert new ones. A unit sanitary load is used to specify loads to a sewer system for a user-selected loading unit. Unit sanitary loads can be either population-based or non-population-based. Population-based unit sanitary loads specify a load to the sewer system as a function of the contributing population. Non-population-based loads specify loads based on service area, discharge, or user-defined counts.
You add unit sanitary loads using the Unit Sanitary (Dry Weather) Loads dialog box or Bentley SewerCAD V8i’ Engineering Libraries.
Bentley SewerCAD V8i User’s Guide 7-311
Types of Loads
To add a unit sanitary (dry weather) load:
1. Select Component > Unit Sanitary (Dry Weather) Loads, or click the Unit Sanitary (Dry Weather) Loads button on the Analysis toolbar.
2. In the Unit Sanitary (Dry Weather) Loads dialog box, click the New button, then select the type of unit sanitary load you want to create from the submenu (Area, Count, Discharge, or Population).
3. On the Unit Sanitary Load tab, enter the following data:
– For area-based loads, select the desired unit from the Area Unit drop-down menu.
– For discharge-based loads, select the desired unit from the Discharge Units drop down menu.
– For count-based loads, type the base unit used to define the count-based load in the Count Load Unit field. You can specify any unit you want, such as loading per vehicle, machine, or anything else.
– For population-based loads, select the desired unit from the Population Units drop-down menu.
– Type the amount of flow contributed per loading unit in the Unit Load field.
– Type the count of adjusted population per loading unit in the Population Equivalent field. For area based loads, this is essentially a population density, or population per unit area.
– Check the Report Adjusted Population check box to report the adjusted popu-lation with other populations. If you clear this check box, the adjusted popula-tion will be not be reported as part of the total population.
4. You can save your new load in Bentley SewerCAD V8i’ Engineering Libraries for future use. To do this, perform these steps:
a. Click the Synchronization Options button, then select Export to Library. The Engineering Libraries dialog box appears.
b. Use the plus and minus signs to expand and collapse the list of available libraries, then select the library into which you want to export your new unit sanitary load.
c. Click Close to close the Engineering Libraries dialog box.
5. Perform the following optional steps:
– To delete a load, select the load label then click Delete.
7-312 Bentley SewerCAD V8i User’s Guide
Loading
– To rename an load, select the load label you want to rename, click Rename, then type the new name for the load.
– To view a report on a load, select the load label for which you want a report then click Report.
6. Click Close to close the Unit Sanitary (Dry Weather) Loads dialog box.
To add a unit sanitary load in the Engineering Library:
1. Select Tools > Engineering Libraries to display the Engineering Libraries dialog box.
2. Click the plus sign next to the Unit Sanitary (Dry Weather) Loads Library to expand the list of items (categories and folders) included in that library. This library includes a category entitled Unit Sanitary (Dry Weather) Loads.
Note: You can add new items to a category or a folder, add new folders to categories, and add new categories to libraries. For more information, see “Engineering Libraries” on page 6-290.
3. Right-click the Unit Sanitary (Dry Weather) Loads category (or a different cate-gory or folder) and select New Item.
4. Define the new unit sanitary load in the Editor pane on the right as described in the following steps:
a. Type the unit load in the Unit Load field.
b. Select the load type from the Loading Unit Type drop-down (Area Based, Count Based, Discharge Based, or Population Based).
c. Select the load units from the Sanitary Unit Load Units drop-down. For count-based loads, you can specify any unit you want, such as loading per vehicle or machine.
d. For area-, count-, and discharge-based loads, type the count of adjusted popu-lation per loading unit in the Pop.Equivalent (Capita) field. For area based loads, this is essentially a population density, or population per unit area.
e. For area-, count-, and discharge-based loads, select True from the Report Adjusted Population drop down to report the adjusted population with other populations. Select False if you don’t want to report the adjusted population as part of total population.
5. Click Close. Your new unit sanitary load is now part of the Engineering Libraries and can be re-used any time.
Bentley SewerCAD V8i User’s Guide 7-313

Types of Loads
Unit Sanitary (Dry Weather) Load Dialog Box
This dialog box allows you to create unit sanitary (dry weather) loads. There are two sections: the list pane on the left and the tab section on the right. The list pane lets you create, edit, and delete unit sanitary loads and the tab section contains entry fields for each type of unit sanitary load.
7-314 Bentley SewerCAD V8i User’s Guide

Loading
The following controls are available in the Unit Sanitary (Dry Weather) Load dialog box:
New Creates a new unit sanitary load that uses an automatically created label.
• Area—Adds a new area-based unit sanitary load to the list pane. An area-based unit sanitary load is a function of contributing service area.
• Count—Adds a new count-based unit sanitary load. A count-based unit sani-tary load is a function of a user-defined count. Count-based unit sanitary loads should be used for any load that is not area-, discharge-, or population-based.
• Discharge—Adds a new discharge-based unit sanitary load. A discharge-based unit sanitary load is a function of direct discharge.
• Population—Adds a new population-based unit sanitary load. A population-based unit sanitary load is a function of adjusted contributing population.
Bentley SewerCAD V8i User’s Guide 7-315
Types of Loads
Delete Deletes the currently highlighted unit sanitary load.
Rename Lets you rename the currently highlighted unit sanitary load.
Report Lets you generate a preformatted report that contains the input data associated with the currently highlighted unit sanitary load.
Synchronization Options
Clicking this button opens a submenu containing the following commands:
• Browse Engineering Library—Opens the Engineering Library manager dialog, allowing you to browse the Unit Sanitary (Dry Weather) Load Engineering Libraries.
• Synchronize From Library—Lets you update a set of unit sanitary loads previously imported from a Unit Sani-tary (Dry Weather) Load Engineering Library. The updates reflect changes that have been made to the library since it was imported.
• Synchronize To Library—Lets you update an existing Unit Sanitary (Dry Weather) Load Engineering Library using current unit sanitary loads that were initially imported but have since been modified.
• Import From Library—Lets you import a unit sanitary load from an existing Unit Sanitary (Dry Weather) Load Engineering Library.
• Export To Library—Lets you export the current unit sanitary load to an existing Unit Sanitary (Dry Weather) Load Engineering Library.
7-316 Bentley SewerCAD V8i User’s Guide
Loading
The tab section includes the following controls:
Unit Sanitary Load Tab
Area Unit Lets you specify the base unit used to define the area-based load.
Unit Load Lets you specify the amount of flow contributed per loading unit.
Population Equivalent Lets you specify the count of adjusted population per loading unit. For area based loads, this is essentially a population density, or population per unit area. The Population equivlant field is optional and simply converts area or count into equivalent popultion, based on the Population equivalent value.
Report Adjusted Population
If this option is toggled ON, the adjusted population will be reported with other populations. If the option is OFF, adjusted population will be not be reported as part of the total population.
Count Load Unit Lets you specify the base unit used to define the count-based load. You can specify any unit you want, such as loading per vehicle, machine, or anything else.
Discharge Units Lets you specify the base unit used to define the discharge-based load.
Population Units Lets you specify the base unit used to define the unit load.
Library Tab This tab displays information about the unit sanitary load that is currently highlighted in the list pane. If the load is derived from an engineering library, the synchronization details can be found here. If the load was created manually for this project, the synchronization details will display the message Orphan (local), indicating that the pump was not derived from a library entry.
Bentley SewerCAD V8i User’s Guide 7-317

Composite Hydrographs
Composite HydrographsA composite hydrograph graphs the total flow over time from multiple defined fixed/unit loads, hydrographs, and pattern loads and hydrographs.
You can access the composite hydrograph and its corresponding data table from the Inflow Collection dialog box, which is and the Sanitary (Dry Weather) Flow Collec-tion Editor dialog box, both of which are available from the Property Editor for selected elements. For example, a manhole has properties for Inflow Collection and Sanitary Loading.
This graph is dynamic and is generated automatically each time it is requested.
The time step in a composite hydrograph is determined by going from time 0 to the Total Simulation Time divided by Calculation Time Step. You can define the Total Simulation Time and Calculation Time Step values in the Calculation Options Manager. For more information, see “Calculation Options Manager” on page 8-433.
Composite Hydrograph Window
This window displays the composite hydrograph from multiple fixed/unit loads, hydrographs, and pattern loads defined in either the Inflow Collection dialog box or Sanitary (Dry Weather) Flow Collection Editor dialog box.
This window displays the composite hydrograph from multiple fixed/unit loads and hydrographs, defined in the Inflow Collection dialog box.
You access the Composite Hydrograph window by clicking the Graph button in the Inflow Collection dialog box or Sanitary (Dry Weather) Flow Collection Editor dialog box. If you have only one load or hydrograph defined, the graph displays the data for that single load or hydrograph.
The Composite Hydrograph window contains the following button:
Composite Hydrograph Data Table Window
IDH_CompositeHydrographDataTableWindow 40008
Chart Settings Opens the Chart Options dialog box, allowing you to change graph display settings.
7-318 Bentley SewerCAD V8i User’s Guide
Loading
This window displays a table of all the data points in a composite hydrograph from multiple fixed/unit loads, hydrographs, and pattern loads defined in either the Inflow Collection dialog box or Sanitary (Dry Weather) Flow Collection Editor dialog box.
The data table displays the same data used in the composite hydrograph in numerical form. The table contains two columns: the first column displays the time steps and the second column displays the flows. The values in this table can not be edited.
You access the Data Table window by clicking the Data Table button in the Inflow Collection dialog box or Sanitary (Dry Weather) Flow Collection Editor dialog box. If you have only one load or hydrograph defined, the Data Table displays the data for that single load or hydrograph.
The Composite Hydrograph Data Table window contains the following buttons:
InflowsThe word "inflow" is used in two ways in sewer modeling. It is used first to describe wet weather flows to sewer systems that do not infiltrate through the ground [inflow and infiltration loading] and it is used in Bentley SewerCAD V8i to describe any flow which enters a node element whether it is a fixed inflow, hydrograph or pattern load. The type of load available depends on the element type. The descriptions below, refer to the Bentley SewerCAD V8i definition of inflow.
The following diagrams describe the various types of flow used in Bentley SewerCAD V8i.
Copy Copies the contents of the data table to the Windows clipboard. You can then paste the data into a different application or document.
Paste Pastes the contents of the Windows clipboard into the data table. This is useful if you’ve got the data defined in a different document or application and want to simply copy and paste it into a composite hydrograph.
Report Opens a print preview window containing a report that details the input data for this dialog box.
Bentley SewerCAD V8i User’s Guide 7-319
Inflows
MH-3
Flow (To 5.5
Flow (Lo 0
Flow (To 5.5
Flow (Sy 2.5
Flow (Sy 0
Flow (To 5.5
Flow (Lo 0
Flow (Di 5.5
Flow (Sy 2.25
Table 7-3: Flow Attributes and Definitions
Flow Attribute Definition MH-1 MH-2
tal In) Flow piped In from upstream links 0 18
cally Injected) Flow injected into system at node. 15 4
tal Out) Flow (Total In) + Flow (Locally Injected) or Flow (Non-Diverted Out) + Flow (Diverted Out)
15 22
stem Wet Well Collection) Portion of the Flow (Total Out) derived from Inflow (Wet) Collection
10 10
stem Known) Portion of the Flow (Total Out) derived from Known Flows
0 0
tal Diverted In) Flow (Local Diverted In Same Subnetwork) + Flow (Diverted In Outside Subnetwork)
0 0
cal Diverted In Same Subnetwork) Portion of Flow (Total In) which is diverted in from an element in the same subnetwork.
0 0
verted In Outside Subnetwork) Portion of Flow (Total In) which is diverted in from an element outside the subnetwork.
0 0
stem Sanitary) Portion of Flow (Total Out) which is derived from Sanitary Loads
5 9
7-320 Bentley SewerCAD V8i User’s Guide
Loading
Flow (No 4.5
Flow (Di 0
Infiltratio 0.25
Infiltratio 0.5
Infiltratio 0.75
Flow (Sy 3.25
MH-3
n-Diverted Out) Portion of Flow (Total Out) which exits via physical conduits.
15 16.5
verted Out) Portion of Flow (Total Out) which exits via diversion links
0 5.5
n (System Additional) Portion of Flow (Total Out) derived from Flow (Additional Infiltration) on conduits
0 1
n (System Non-Additional) Portion of Flow (Total Out) derived from computed infiltration on conduits.
0 2
n (System Total) Infiltration (System Additional) + Infiltration (System Non-Additional)
0 3
stem Total Wet Weather) Flow (System Wet Weather Collection) + Infiltration (System Total)
10 13
Table 7-3: Flow Attributes and Definitions
Flow Attribute Definition MH-1 MH-2
Bentley SewerCAD V8i User’s Guide 7-321
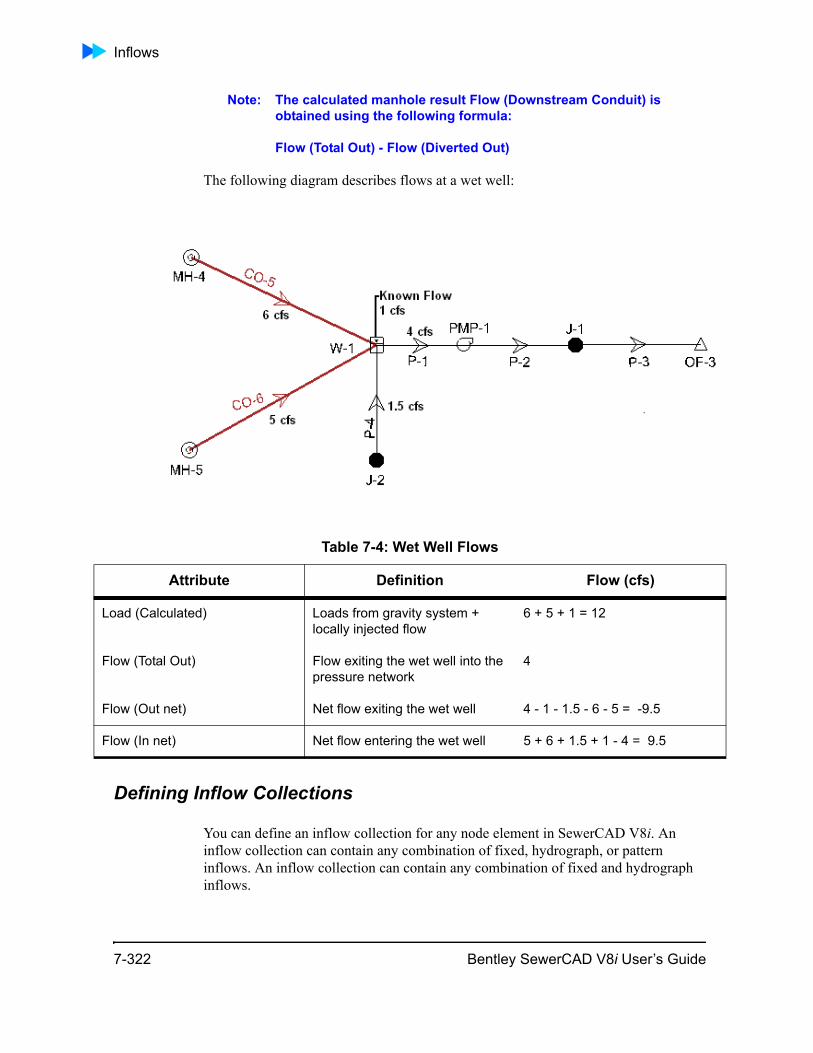
Inflows
Note: The calculated manhole result Flow (Downstream Conduit) is obtained using the following formula:
Flow (Total Out) - Flow (Diverted Out)
The following diagram describes flows at a wet well:
Defining Inflow Collections
You can define an inflow collection for any node element in SewerCAD V8i. An inflow collection can contain any combination of fixed, hydrograph, or pattern inflows. An inflow collection can contain any combination of fixed and hydrograph inflows.
Table 7-4: Wet Well Flows
Attribute Definition Flow (cfs)
Load (Calculated) Loads from gravity system + locally injected flow
6 + 5 + 1 = 12
Flow (Total Out) Flow exiting the wet well into the pressure network
4
Flow (Out net) Net flow exiting the wet well 4 - 1 - 1.5 - 6 - 5 = -9.5
Flow (In net) Net flow entering the wet well 5 + 6 + 1.5 + 1 - 4 = 9.5
7-322 Bentley SewerCAD V8i User’s Guide

Loading
To define an inflow collection:
1. Click a node element in your model to display the Property Editor, or right-click a node element and select Properties from the shortcut menu.
2. In the Inflow Collection section of the Property Editor, click the Ellipses (...) button. The Inflow Collection Editor appears.
3. Click the New button, then select the type of inflow you want to create from the submenu (Fixed Inflow, Hydrograph Inflow, Pattern Inflow).
4. For a Hydrograph Inflow, enter the data points in the hydrograph table. For Fixed and Pattern Inflows, enter the data in the appropriate fields.
Note: For a hydrograph, if the last time in the table is less than the total simulation time, the simulation time and last flow will be appended to the hydrograph table.
5. Repeat steps 3 and 4 for each inflow you want to add to the collection.
6. Click the Composite Hydrograph button to see a graph of the composite hydrograph.
7. Click the Composite Hydrograph Data Table button to see a tabular view of all the data points in the composite hydrograph.
8. Click OK to close the dialog box and add the collection data to the Property Editor.
Inflow Collection Editor
This dialog box lets you define fixed loads, hydrograph loads, and pattern inflows for any node element. A node may have any combination of fixed loads, hydrograph loads, and pattern inflows.
The dialog box contains an Inflow list pane and the following controls:
Bentley SewerCAD V8i User’s Guide 7-323
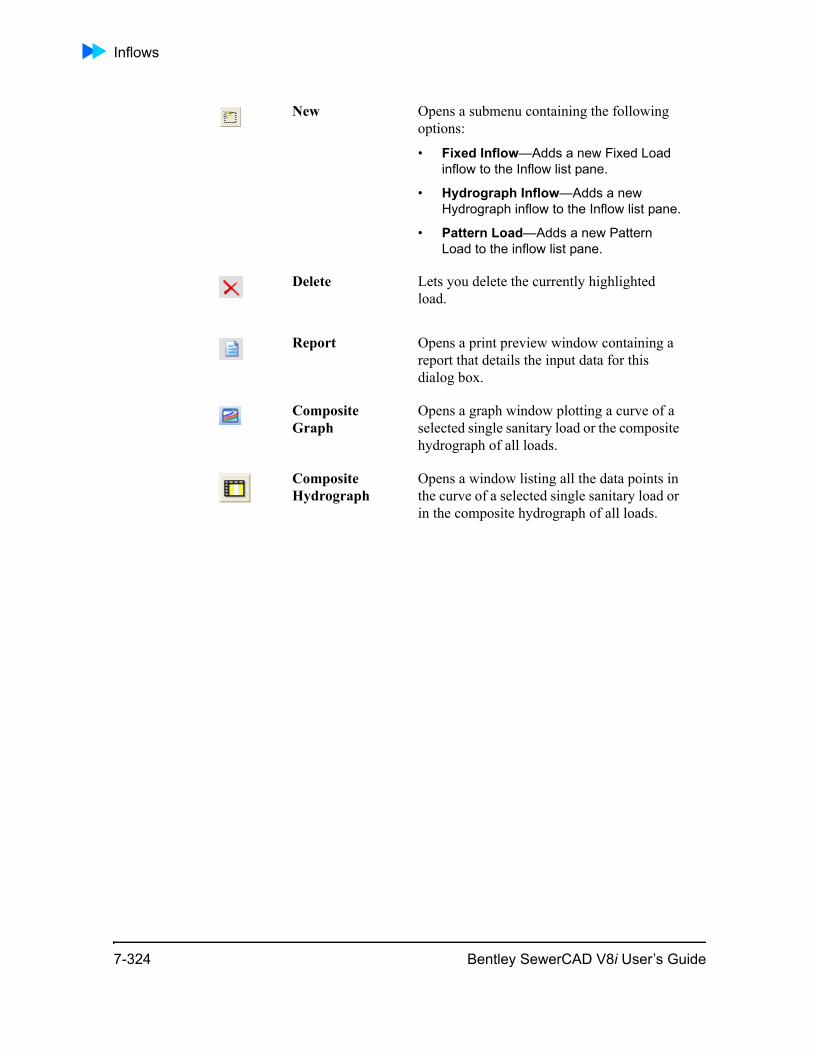
Inflows
New Opens a submenu containing the following options:
• Fixed Inflow—Adds a new Fixed Load inflow to the Inflow list pane.
• Hydrograph Inflow—Adds a new Hydrograph inflow to the Inflow list pane.
• Pattern Load—Adds a new Pattern Load to the inflow list pane.
Delete Lets you delete the currently highlighted load.
Report Opens a print preview window containing a report that details the input data for this dialog box.
Composite Graph
Opens a graph window plotting a curve of a selected single sanitary load or the composite hydrograph of all loads.
Composite Hydrograph
Opens a window listing all the data points in the curve of a selected single sanitary load or in the composite hydrograph of all loads.
7-324 Bentley SewerCAD V8i User’s Guide
Loading
The Inflow Collection Editor also contains the following controls:
Inflow Control Center
The Inflow Control Center is an editor for manipulating all the inflows in your model. Using the Inflow Control Center, you can add new inflows, delete existing inflows, or modify the values for existing inflows using standard SQL select and update queries.
The Inflow Control Center provides demand editing capabilities which can:
• open on all inflow nodes, or subset of inflow nodes,
• sort and filter based on inflow criteria,
Hydrograph Table Lets you define the hydrograph by entering Time vs. Flow points. This table is available only when a Hydrograph Load inflow is highlighted in the Inflow list pane. If the last time in the table is less than the total simulation time, the simulation time and last flow will be appended to the hydrograph table.
Fixed Load Lets you define a fixed load value. This field is available only when a Fixed Load inflow is highlighted in the Inflow list pane. Set the fixed flow that affects the manhole.
Base Inflow Lets you enter the average inflow over the duration of the simulation.
Inflow Pattern Lets you select the pattern for the selected pattern inflow. Patterns are selected, edited, and created in the Pattern Manager, which you access by clicking the ellipsis (...) button next to this field.
Bentley SewerCAD V8i User’s Guide 7-325
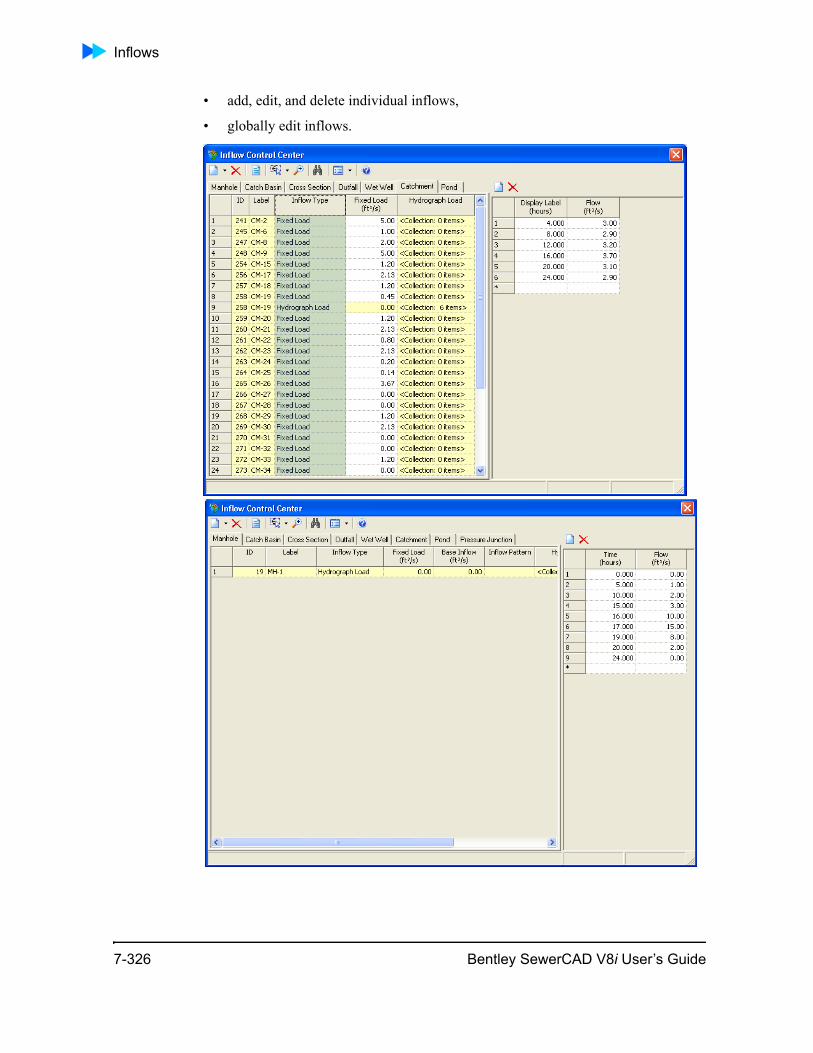
Inflows
• add, edit, and delete individual inflows,
• globally edit inflows.
7-326 Bentley SewerCAD V8i User’s Guide

Loading
The Inflow Control Center consists of a pane consisting of tabs for each element type that list all of the inflows for all of the elements in the model and a pane that displays Hydrograph Load collections for the currently highlighted element.
It also contains the following controls:
Bentley SewerCAD V8i User’s Guide 7-327
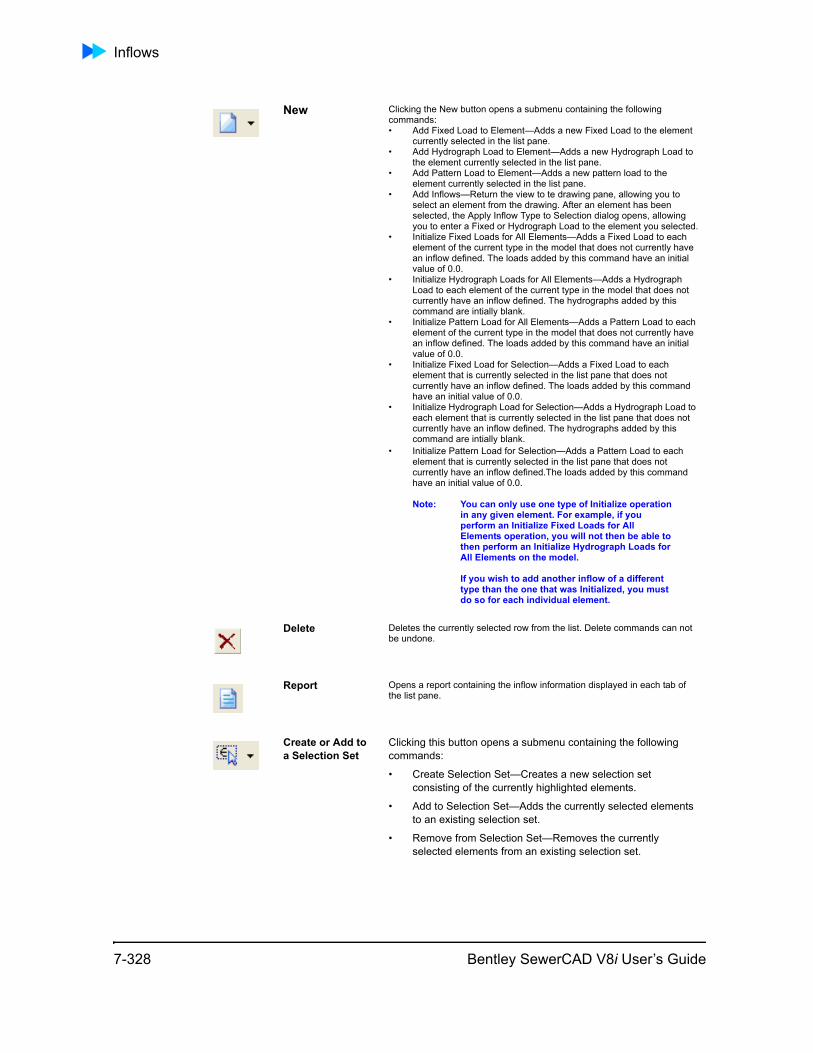
Inflows
New Clicking the New button opens a submenu containing the following commands:• Add Fixed Load to Element—Adds a new Fixed Load to the element
currently selected in the list pane.• Add Hydrograph Load to Element—Adds a new Hydrograph Load to
the element currently selected in the list pane.• Add Pattern Load to Element—Adds a new pattern load to the
element currently selected in the list pane.• Add Inflows—Return the view to te drawing pane, allowing you to
select an element from the drawing. After an element has been selected, the Apply Inflow Type to Selection dialog opens, allowing you to enter a Fixed or Hydrograph Load to the element you selected.
• Initialize Fixed Loads for All Elements—Adds a Fixed Load to each element of the current type in the model that does not currently have an inflow defined. The loads added by this command have an initial value of 0.0.
• Initialize Hydrograph Loads for All Elements—Adds a Hydrograph Load to each element of the current type in the model that does not currently have an inflow defined. The hydrographs added by this command are intially blank.
• Initialize Pattern Load for All Elements—Adds a Pattern Load to each element of the current type in the model that does not currently have an inflow defined. The loads added by this command have an initial value of 0.0.
• Initialize Fixed Load for Selection—Adds a Fixed Load to each element that is currently selected in the list pane that does not currently have an inflow defined. The loads added by this command have an initial value of 0.0.
• Initialize Hydrograph Load for Selection—Adds a Hydrograph Load to each element that is currently selected in the list pane that does not currently have an inflow defined. The hydrographs added by this command are intially blank.
• Initialize Pattern Load for Selection—Adds a Pattern Load to each element that is currently selected in the list pane that does not currently have an inflow defined.The loads added by this command have an initial value of 0.0.
Note: You can only use one type of Initialize operation in any given element. For example, if you perform an Initialize Fixed Loads for All Elements operation, you will not then be able to then perform an Initialize Hydrograph Loads for All Elements on the model.
If you wish to add another inflow of a different type than the one that was Initialized, you must do so for each individual element.
Delete Deletes the currently selected row from the list. Delete commands can not be undone.
Report Opens a report containing the inflow information displayed in each tab of the list pane.
Create or Add to a Selection Set
Clicking this button opens a submenu containing the following commands:
• Create Selection Set—Creates a new selection set consisting of the currently highlighted elements.
• Add to Selection Set—Adds the currently selected elements to an existing selection set.
• Remove from Selection Set—Removes the currently selected elements from an existing selection set.
7-328 Bentley SewerCAD V8i User’s Guide
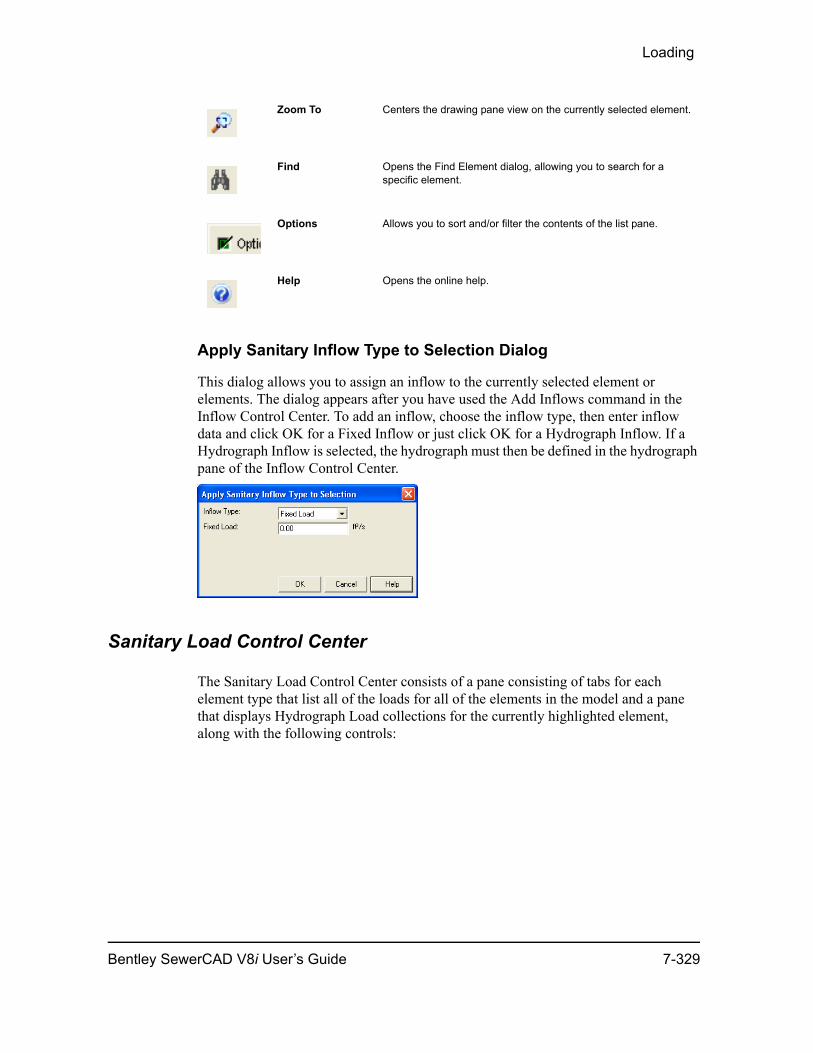
Loading
Apply Sanitary Inflow Type to Selection Dialog
This dialog allows you to assign an inflow to the currently selected element or elements. The dialog appears after you have used the Add Inflows command in the Inflow Control Center. To add an inflow, choose the inflow type, then enter inflow data and click OK for a Fixed Inflow or just click OK for a Hydrograph Inflow. If a Hydrograph Inflow is selected, the hydrograph must then be defined in the hydrograph pane of the Inflow Control Center.
Sanitary Load Control Center
The Sanitary Load Control Center consists of a pane consisting of tabs for each element type that list all of the loads for all of the elements in the model and a pane that displays Hydrograph Load collections for the currently highlighted element, along with the following controls:
Zoom To Centers the drawing pane view on the currently selected element.
Find Opens the Find Element dialog, allowing you to search for a specific element.
Options Allows you to sort and/or filter the contents of the list pane.
Help Opens the online help.
Bentley SewerCAD V8i User’s Guide 7-329

Inflows
7-330 Bentley SewerCAD V8i User’s Guide
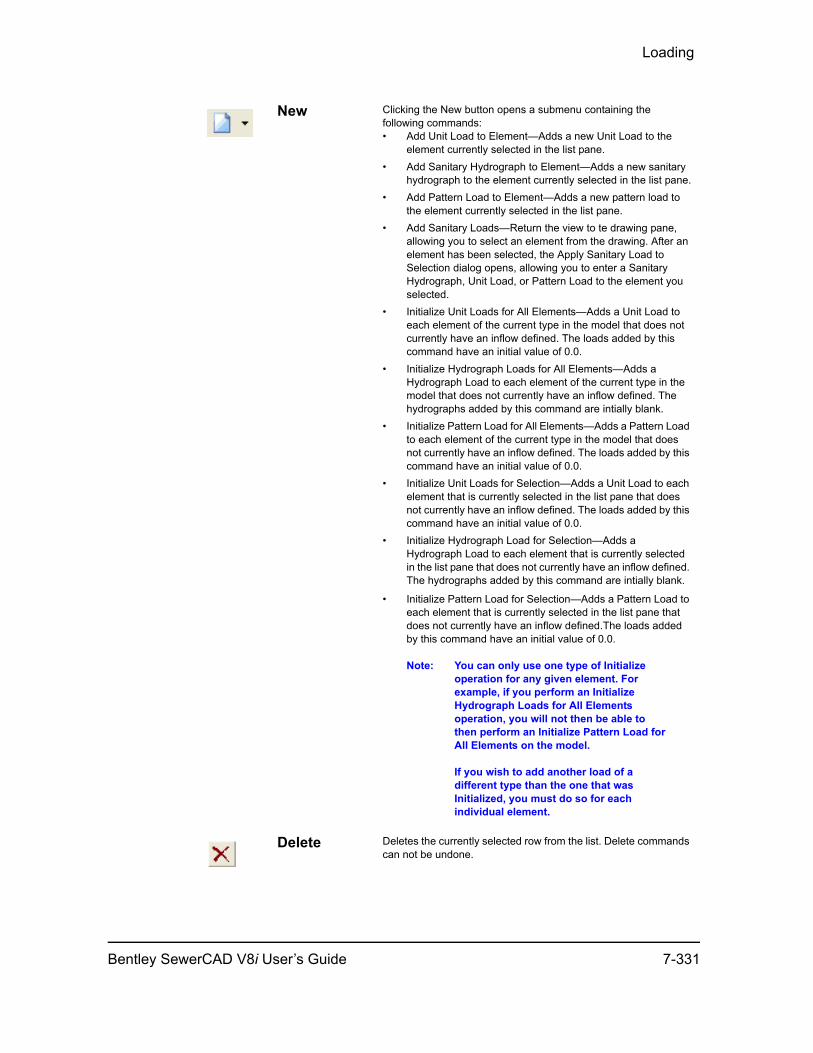
Loading
New Clicking the New button opens a submenu containing the following commands:• Add Unit Load to Element—Adds a new Unit Load to the
element currently selected in the list pane.• Add Sanitary Hydrograph to Element—Adds a new sanitary
hydrograph to the element currently selected in the list pane.• Add Pattern Load to Element—Adds a new pattern load to
the element currently selected in the list pane.• Add Sanitary Loads—Return the view to te drawing pane,
allowing you to select an element from the drawing. After an element has been selected, the Apply Sanitary Load to Selection dialog opens, allowing you to enter a Sanitary Hydrograph, Unit Load, or Pattern Load to the element you selected.
• Initialize Unit Loads for All Elements—Adds a Unit Load to each element of the current type in the model that does not currently have an inflow defined. The loads added by this command have an initial value of 0.0.
• Initialize Hydrograph Loads for All Elements—Adds a Hydrograph Load to each element of the current type in the model that does not currently have an inflow defined. The hydrographs added by this command are intially blank.
• Initialize Pattern Load for All Elements—Adds a Pattern Load to each element of the current type in the model that does not currently have an inflow defined. The loads added by this command have an initial value of 0.0.
• Initialize Unit Loads for Selection—Adds a Unit Load to each element that is currently selected in the list pane that does not currently have an inflow defined. The loads added by this command have an initial value of 0.0.
• Initialize Hydrograph Load for Selection—Adds a Hydrograph Load to each element that is currently selected in the list pane that does not currently have an inflow defined. The hydrographs added by this command are intially blank.
• Initialize Pattern Load for Selection—Adds a Pattern Load to each element that is currently selected in the list pane that does not currently have an inflow defined.The loads added by this command have an initial value of 0.0.
Note: You can only use one type of Initialize operation for any given element. For example, if you perform an Initialize Hydrograph Loads for All Elements operation, you will not then be able to then perform an Initialize Pattern Load for All Elements on the model.
If you wish to add another load of a different type than the one that was Initialized, you must do so for each individual element.
Delete Deletes the currently selected row from the list. Delete commands can not be undone.
Bentley SewerCAD V8i User’s Guide 7-331
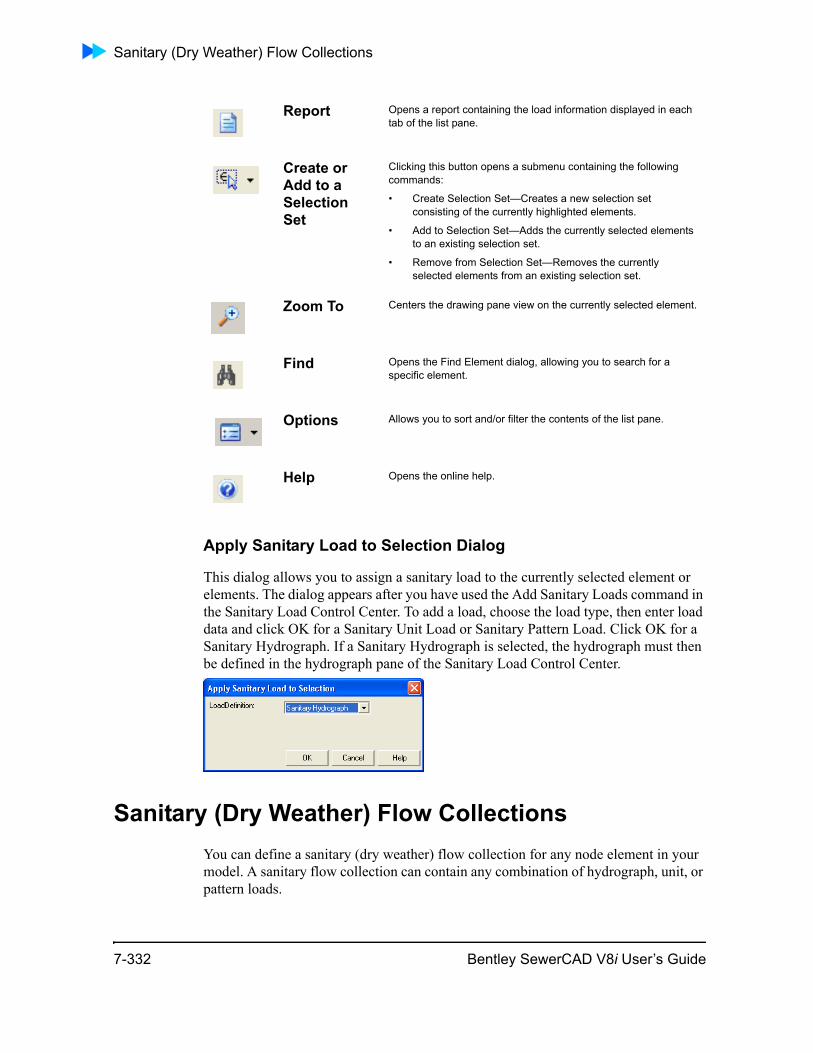
Sanitary (Dry Weather) Flow Collections
Apply Sanitary Load to Selection Dialog
This dialog allows you to assign a sanitary load to the currently selected element or elements. The dialog appears after you have used the Add Sanitary Loads command in the Sanitary Load Control Center. To add a load, choose the load type, then enter load data and click OK for a Sanitary Unit Load or Sanitary Pattern Load. Click OK for a Sanitary Hydrograph. If a Sanitary Hydrograph is selected, the hydrograph must then be defined in the hydrograph pane of the Sanitary Load Control Center.
Sanitary (Dry Weather) Flow CollectionsYou can define a sanitary (dry weather) flow collection for any node element in your model. A sanitary flow collection can contain any combination of hydrograph, unit, or pattern loads.
Report Opens a report containing the load information displayed in each tab of the list pane.
Create or Add to a Selection Set
Clicking this button opens a submenu containing the following commands:
• Create Selection Set—Creates a new selection set consisting of the currently highlighted elements.
• Add to Selection Set—Adds the currently selected elements to an existing selection set.
• Remove from Selection Set—Removes the currently selected elements from an existing selection set.
Zoom To Centers the drawing pane view on the currently selected element.
Find Opens the Find Element dialog, allowing you to search for a specific element.
Options Allows you to sort and/or filter the contents of the list pane.
Help Opens the online help.
7-332 Bentley SewerCAD V8i User’s Guide
Loading
To define a sanitary (dry weather) flow collection:
1. Click an element in your model to display the Property Editor, or right-click an element and select Properties from the shortcut menu.
2. In the Sanitary Loads section of the Property Editor, click the Ellipses (...) button. The Sanitary (Dry Weather) Flow Collection Editor appears.
3. Click the New button, then select the type of sanitary load you want to create from the submenu (Hydrograph - Flow vs. Time, Unit Load - Unit Type and Count, or Pattern Load - Base Flow and Pattern).
4. For a Hydrograph, enter the data points in the hydrograph table. For Unit and Pattern Loads, enter the data in the appropriate fields.
Note: For a hydrograph, if the last time in the table is less than the total simulation time, the simulation time and last flow will be appended to the hydrograph table.
5. Repeat steps 3 and 4 for each load you want to add to the collection.
6. Click the Composite Hydrograph button to see a graph of the composite hydrograph.
7. Click the Composite Hydrograph Data Table button to see a tabular view of all the data points in the composite hydrograph.
8. Click OK to close the dialog box and add the collection data to the Property Editor.
Sanitary (Dry Weather) Flow Collection Editor
This dialog box lets you define collections of sanitary (dry weather) loads for the selected element in your model. Sanitary loads correspond to loads produced by resi-dential, commercial, recreational, and industrial activity. A sanitary load represents the base load to the sewer system.
Bentley SewerCAD V8i User’s Guide 7-333
Sanitary (Dry Weather) Flow Collections
The dialog box contains a list pane and the following controls:
Depending on the type of sanitary load you select in the list pane, the following controls appear:
New Opens a submenu containing the following options:
• Hydrograph - Flow vs. Time—Adds a new hydrograph load to the list pane. This is a flow vs. time distribution.
• Unit Load - Unit Type and Count—Adds a new unit load to the list pane. Unit Type refers to the type of Unit Load and Count refers to the number of units associated with the unit load. For example, 5000 passengers at an airport.
• Pattern Load - Base Flow and Pattern—Adds a new pattern load to the list pane. A pattern load is a direct, known sanitary load with a set pattern.
Delete Lets you delete the currently highlighted load.
Report Opens a print preview window containing a report that details the input data for this dialog box.
Composite Hydrograph
Opens a graph window plotting a curve of a selected single sanitary load or the composite hydrograph of all loads.
Composite Hydrograph Data Table
Opens a window listing all the data points in the curve of a selected single sanitary load or in the composite hydrograph of all loads.
Hydrograph Table Lets you define the hydrograph by entering Time From Start vs. Sanitary Flow points. This table is available only when a hydrograph load is highlighted in the list pane. If the last time in the table is less than the total simulation time, the simulation time and last flow will be appended to the hydrograph table.
7-334 Bentley SewerCAD V8i User’s Guide
Loading
Using LoadBuilder to Assign Loading DataLoadBuilder is a tool used to assign flows to elements in Bentley SewerCAD V8i. If you already know what flows to assign to an element, then you should use the other methods such as inflow, sanitary loads, or stormwater loading. The power of Load-Builder is that it can take loading information from a variety of Loadbuilder based sources such as customer meter data, system flow meter or polygons with known population or land use and assign those flows to elements. LoadBuilder is oriented to the types of data available to describe dry weather flows and other methods in Bentley SewerCAD V8i are more amenable to wet weather flows.
The consumption of water is the driving force behind the hydraulic dynamics occur-ring in water distribution systems. When simulating these dynamics in your water distribution model, an accurate representation of system demands is as critical as precisely modeling the physical components of the model.
To realize the full potential of the model as a master planning and decision support tool, you must accurately allocate demands while anticipating future demands. Collecting the necessary data and translating it to model loading data must be performed regularly to account for changes to the network conditions. Due to the diffi-culties involved in manually loading the model, automated techniques have been developed to assist the modeler with this task.
Spatial allocation of demands is the most common approach to loading a water distri-bution model. The spatial analysis capabilities of Loadbuilder make these applications a logical tool for the automation of the demand allocation process.
Unit Sanitary Load Lets you select the type of the load (for example Apartment or Airport). Unit sanitary loads are selected, edited, and created in the Unit Sanitary (Dry Weather) Load dialog box, which you access by clicking the ellipsis (…) button next to this field.
Loading Unit Count Lets you enter the local count of loading units for the selected unit sanitary load.
Base Flow Lets you enter the average inflow over the duration of the simulation.
Pattern Lets you select the pattern for the selected pattern load. Pattern loads are selected, edited, and created in the Pattern Manager, which you access by clicking the ellipsis (...) button next to this field.
Bentley SewerCAD V8i User’s Guide 7-335
Using LoadBuilder to Assign Loading Data
LoadBuilder leverages the spatial analysis abilities of your Loadbuilder software to distribute demands according to geocoded meter data, demand density information, and coverage polygon intersections.
LoadBuilder greatly facilitates the tasks of demand allocation and projection. Every step of the loading process is enhanced, from the initial gathering and analysis of data from disparate sources and formats to the employment of various allocation strategies.
The following are descriptions of the types of allocation strategies that can be applied using LoadBuilder.
Allocation
This uses the spatial analysis capabilities of Loadbuilder to assign geocoded (possessing coordinate data based on physical location, such as an x-y coordinate) customer meters to the nearest demand node or pipe. Assigning metered demands to nodes is a point-to-point demand allocation technique, meaning that known point demands (customer meters) are assigned to network demand points (demand nodes). Assigning metered demands to pipes is also a point-to-point assignment technique, since demands must still be assigned to node elements, but there is an additional step involved. When using the Nearest Pipe meter assignment strategy, the demands at a
7-336 Bentley SewerCAD V8i User’s Guide
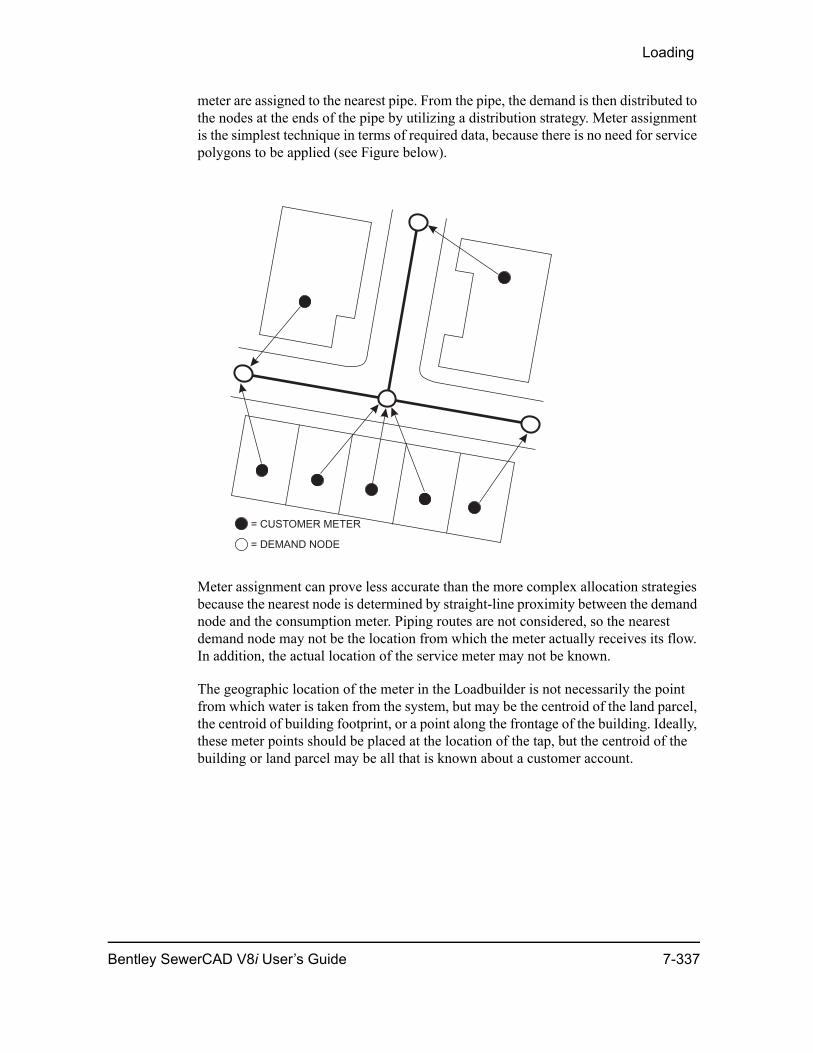
Loading
meter are assigned to the nearest pipe. From the pipe, the demand is then distributed to the nodes at the ends of the pipe by utilizing a distribution strategy. Meter assignment is the simplest technique in terms of required data, because there is no need for service polygons to be applied (see Figure below).
Meter assignment can prove less accurate than the more complex allocation strategies because the nearest node is determined by straight-line proximity between the demand node and the consumption meter. Piping routes are not considered, so the nearest demand node may not be the location from which the meter actually receives its flow. In addition, the actual location of the service meter may not be known.
The geographic location of the meter in the Loadbuilder is not necessarily the point from which water is taken from the system, but may be the centroid of the land parcel, the centroid of building footprint, or a point along the frontage of the building. Ideally, these meter points should be placed at the location of the tap, but the centroid of the building or land parcel may be all that is known about a customer account.
Bentley SewerCAD V8i User’s Guide 7-337
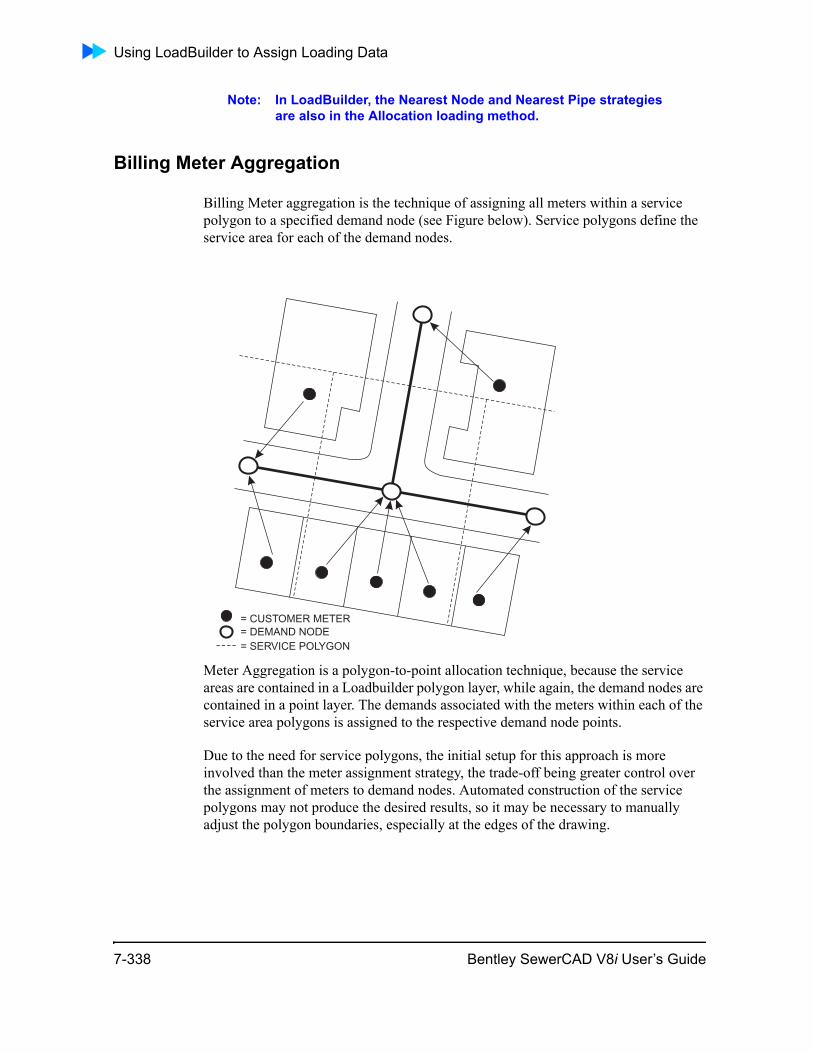
Using LoadBuilder to Assign Loading Data
Note: In LoadBuilder, the Nearest Node and Nearest Pipe strategies are also in the Allocation loading method.
Billing Meter Aggregation
Billing Meter aggregation is the technique of assigning all meters within a service polygon to a specified demand node (see Figure below). Service polygons define the service area for each of the demand nodes.
Meter Aggregation is a polygon-to-point allocation technique, because the service areas are contained in a Loadbuilder polygon layer, while again, the demand nodes are contained in a point layer. The demands associated with the meters within each of the service area polygons is assigned to the respective demand node points.
Due to the need for service polygons, the initial setup for this approach is more involved than the meter assignment strategy, the trade-off being greater control over the assignment of meters to demand nodes. Automated construction of the service polygons may not produce the desired results, so it may be necessary to manually adjust the polygon boundaries, especially at the edges of the drawing.
7-338 Bentley SewerCAD V8i User’s Guide
Loading
Note: In LoadBuilder, the Billing Meter Aggregation strategy falls into the meter aggregation category of loading methods.
Distribution
This strategy involves distributing lump-sum area water use data among a number of service polygons (service areas) and, by extension, their associated demand nodes. The lump-sum area is a polygon for which the total (lump-sum) water use of all of the service areas (and their demand nodes) within it is known (metered), but the distribu-tion of the total water use among the individual nodes is not. The water use data for these lump-sum areas can be based on system meter data from pump stations, treat-ment plants or flow control valves, meter routes, pressure zones, and traffic analysis zones (TAZ). The lump sum area for which a flow is known must be a Loadbuilder polygon. There is one flow rate per polygon, and there can be no overlap of or open space between the polygons.
The known flow within the lump-sum area is generally divided among the service polygons within the area using one of two techniques: equal distribution or propor-tional distribution:
• The equal flow distribution option simply divides the known flow evenly between the demand nodes. The equal flow distribution strategy is illustrated in the diagram below. The lump-sum area in this case is a polygon layer that repre-sents meter route areas. For each of these meter route polygons, the total flow is known. The total flow is then equally divided among the demand nodes within each of the meter route polygons (See Figure).
• The proportional distribution option (by area or by population) divides the lump-sum flow among the service polygons based upon one of two attributes of the service polygons-the area or the population. The greater the percentage of the lump-sum area or population that a service polygon contains, the greater the percentage of total flow that will be assigned to that service polygon.
Note: In addition to the distribution options listed above, LoadBuilder allows Nearest node and Farthest node strategies as well.
Each service polygon has an associated demand node, and the flow that is calculated for each service polygon is assigned to this demand node. For example, if a service polygon consists of 50 percent of the lump-sum polygon’s area, then 50 percent of the flow associated with the lump-sum polygon will be assigned to the demand node asso-ciated with that service polygon. This strategy requires the definition of lump-sum area or population polygons in the Loadbuilder, service polygons in the model, and their related demand nodes. Sometimes the flow distribution technique must be used
Bentley SewerCAD V8i User’s Guide 7-339
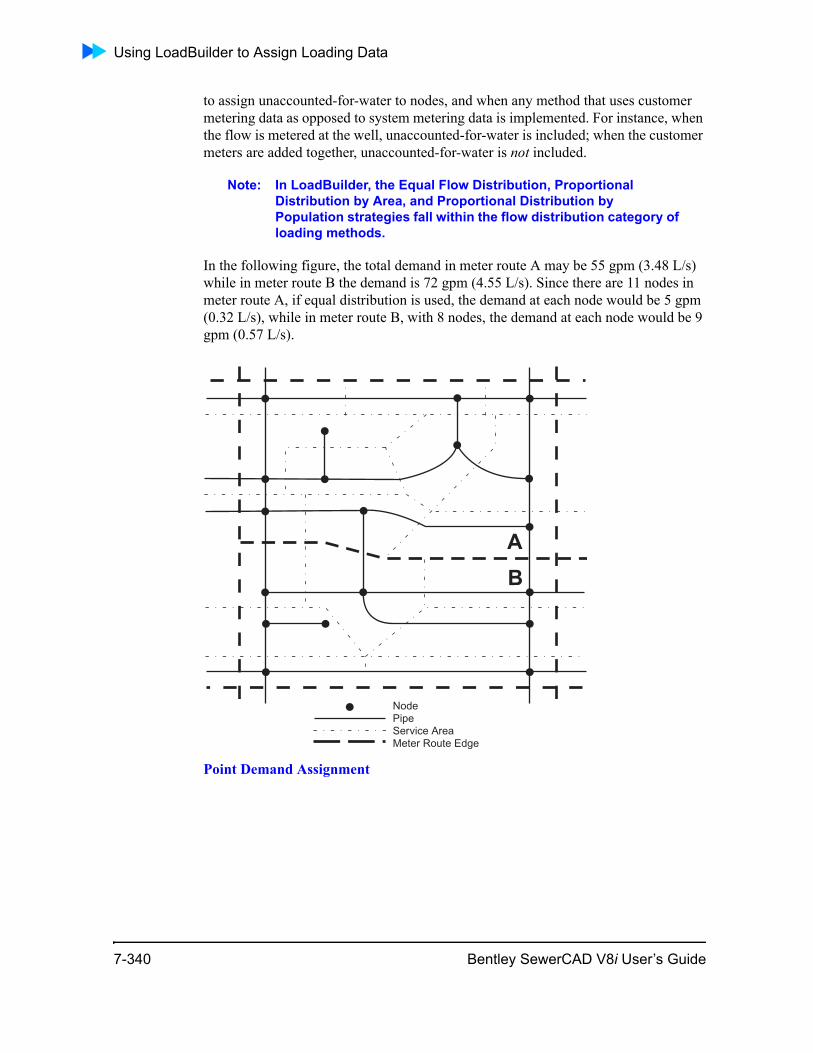
Using LoadBuilder to Assign Loading Data
to assign unaccounted-for-water to nodes, and when any method that uses customer metering data as opposed to system metering data is implemented. For instance, when the flow is metered at the well, unaccounted-for-water is included; when the customer meters are added together, unaccounted-for-water is not included.
Note: In LoadBuilder, the Equal Flow Distribution, Proportional Distribution by Area, and Proportional Distribution by Population strategies fall within the flow distribution category of loading methods.
In the following figure, the total demand in meter route A may be 55 gpm (3.48 L/s) while in meter route B the demand is 72 gpm (4.55 L/s). Since there are 11 nodes in meter route A, if equal distribution is used, the demand at each node would be 5 gpm (0.32 L/s), while in meter route B, with 8 nodes, the demand at each node would be 9 gpm (0.57 L/s).
Point Demand Assignment
7-340 Bentley SewerCAD V8i User’s Guide
Loading
A point demand assignment technique is used to directly assign a demand to a demand node. This strategy is primarily a manual operation, and is used to assign large (gener-ally industrial or commercial) water users to the demand node that serves the consumer in question. This technique is unnecessary if all demands are accounted for using one of the other allocation strategies.
Projection
Automated techniques have also been developed to assist in the estimation of demands using land use and population density data. These are similar to the Flow Distribution allocation methods except that the type of base layer that is used to inter-sect with the service layer may contain information other than flow, such as land use or population.
This type of demand estimation can be used in the projection of future demands; in this case, the demand allocation relies on a polygon layer that contains data regarding expected future conditions. A variety of data types can be used with this technique, including future land use, projected population, or demand density (in polygon form), with the polygons based upon traffic analysis zones, census tracts, planning districts, or another classification. Note that these data sources can also be used to assign current demands; the difference between the two being the data that is contained within the source. If the data relates to projected values, it can be used for demand projections.
Many of these data types do not include demand information, so further data conver-sion is required to translate the information contained in the future condition polygons into projected demand values. This entails translating the data contained within your data source to flow, which can then be applied using LoadBuilder.
After an appropriate conversion method is in place, the service layer containing the service areas and demand nodes is overlaid with the future condition polygon layer(s). A projected demand for each of the service areas can then be determined and assigned to the demand nodes associated with each service polygon. The conversion that is required will depend on the source data that is being used. It could be a matter of translating the data contained within the source, such as population, land area, etc. to flow, which can then be used by LoadBuilder to assign demands.
Depending on how the layers intersect, service areas may contain multiple demand types (land uses) that are added and applied to the demand node for that service polygon.
Bentley SewerCAD V8i User’s Guide 7-341
Using LoadBuilder to Assign Loading Data
Using LoadBuilder to Assign Loading DataLoadBuilder simplifies and expedites the process of assigning loading data to your model, using a variety of source data types.
Note: The loading output data generated by LoadBuilder is a Base Flow, i.e., a single value that remains constant over time.
After running LoadBuilder and exporting the results, you may need to modify your data to reflect changes over time by applying patterns to the base flow values.
LoadBuilder Manager
The LoadBuilder manager provides a central location for the creation, storage, and management of Load Build templates.
Go to Tools > Loadbuilder or click .
7-342 Bentley SewerCAD V8i User’s Guide
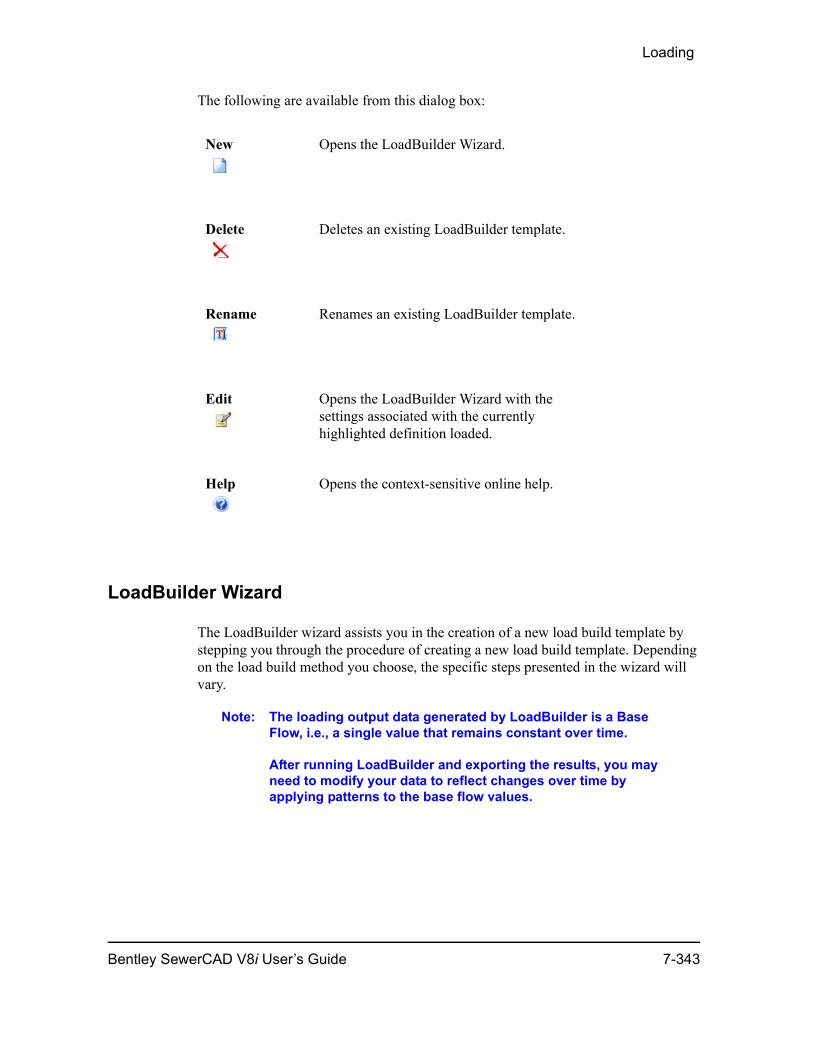
Loading
The following are available from this dialog box:
LoadBuilder Wizard
The LoadBuilder wizard assists you in the creation of a new load build template by stepping you through the procedure of creating a new load build template. Depending on the load build method you choose, the specific steps presented in the wizard will vary.
Note: The loading output data generated by LoadBuilder is a Base Flow, i.e., a single value that remains constant over time.
After running LoadBuilder and exporting the results, you may need to modify your data to reflect changes over time by applying patterns to the base flow values.
New Opens the LoadBuilder Wizard.
Delete Deletes an existing LoadBuilder template.
Rename Renames an existing LoadBuilder template.
Edit Opens the LoadBuilder Wizard with the settings associated with the currently highlighted definition loaded.
Help Opens the context-sensitive online help.
Bentley SewerCAD V8i User’s Guide 7-343
Using LoadBuilder to Assign Loading Data
Step 1: Available LoadBuilder Methods
In this step, the Load Method to be used is specified. The next steps will vary according to the load method that is chosen. The load methods are divided into three categories; the desired category is selected by clicking the corresponding button. Then the method is chosen from the Load Demand types pane.
The available load methods are as follows:
Allocation
• Billing Meter Aggregation—This loading method assigns all meters within a service polygon to the specified demand node for that service polygon.
• Nearest Node—This loading method assigns customer meter demands to the closest demand junction.
7-344 Bentley SewerCAD V8i User’s Guide
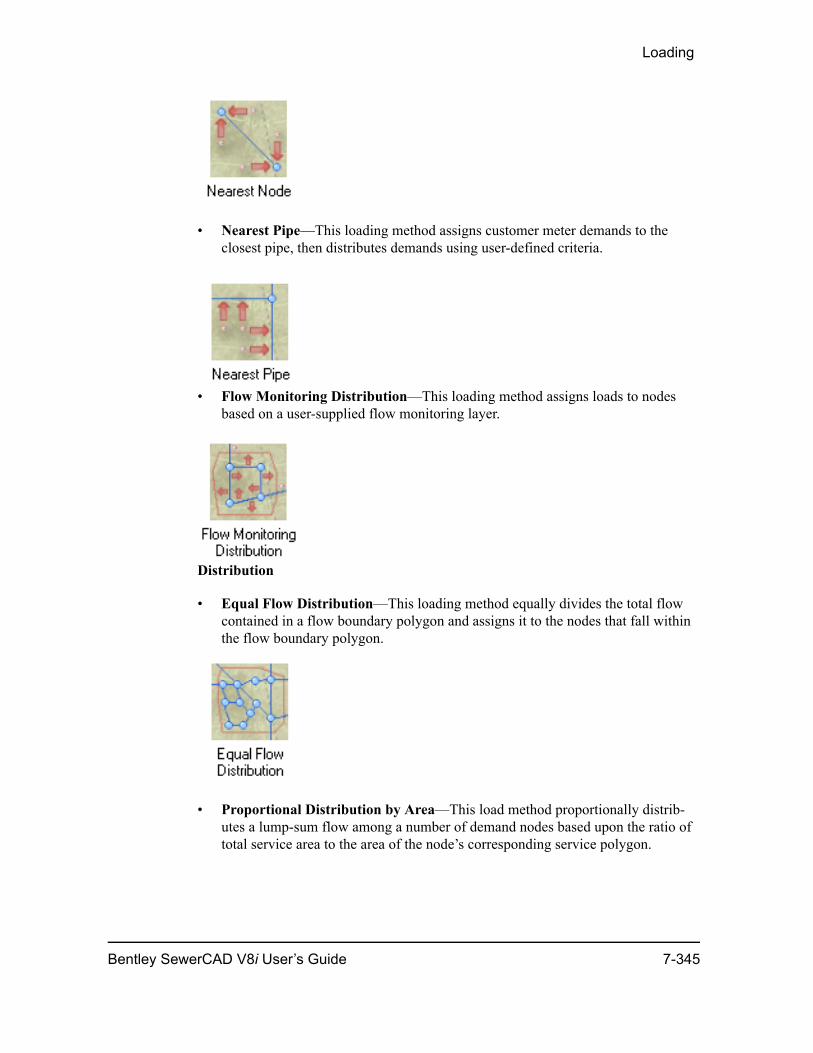
Loading
• Nearest Pipe—This loading method assigns customer meter demands to the closest pipe, then distributes demands using user-defined criteria.
• Flow Monitoring Distribution—This loading method assigns loads to nodes based on a user-supplied flow monitoring layer.
Distribution
• Equal Flow Distribution—This loading method equally divides the total flow contained in a flow boundary polygon and assigns it to the nodes that fall within the flow boundary polygon.
• Proportional Distribution by Area—This load method proportionally distrib-utes a lump-sum flow among a number of demand nodes based upon the ratio of total service area to the area of the node’s corresponding service polygon.
Bentley SewerCAD V8i User’s Guide 7-345
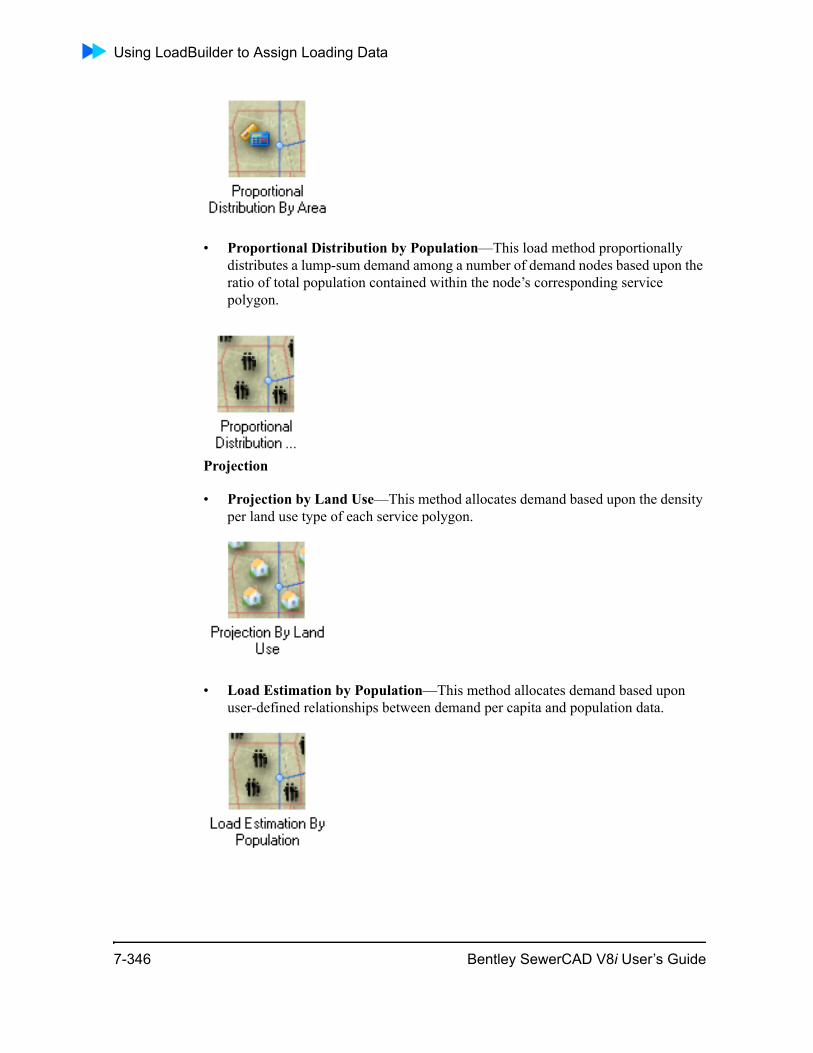
Using LoadBuilder to Assign Loading Data
• Proportional Distribution by Population—This load method proportionally distributes a lump-sum demand among a number of demand nodes based upon the ratio of total population contained within the node’s corresponding service polygon.
Projection
• Projection by Land Use—This method allocates demand based upon the density per land use type of each service polygon.
• Load Estimation by Population—This method allocates demand based upon user-defined relationships between demand per capita and population data.
7-346 Bentley SewerCAD V8i User’s Guide
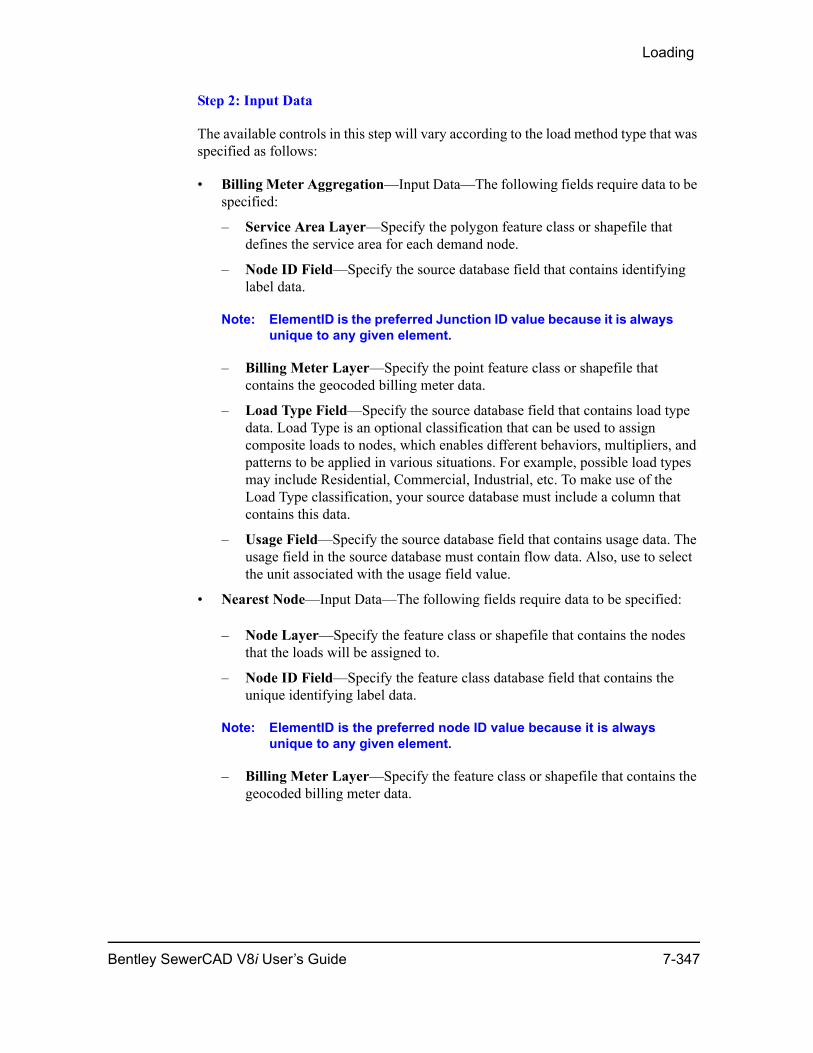
Loading
Step 2: Input Data
The available controls in this step will vary according to the load method type that was specified as follows:
• Billing Meter Aggregation—Input Data—The following fields require data to be specified:
– Service Area Layer—Specify the polygon feature class or shapefile that defines the service area for each demand node.
– Node ID Field—Specify the source database field that contains identifying label data.
Note: ElementID is the preferred Junction ID value because it is always unique to any given element.
– Billing Meter Layer—Specify the point feature class or shapefile that contains the geocoded billing meter data.
– Load Type Field—Specify the source database field that contains load type data. Load Type is an optional classification that can be used to assign composite loads to nodes, which enables different behaviors, multipliers, and patterns to be applied in various situations. For example, possible load types may include Residential, Commercial, Industrial, etc. To make use of the Load Type classification, your source database must include a column that contains this data.
– Usage Field—Specify the source database field that contains usage data. The usage field in the source database must contain flow data. Also, use to select the unit associated with the usage field value.
• Nearest Node—Input Data—The following fields require data to be specified:
– Node Layer—Specify the feature class or shapefile that contains the nodes that the loads will be assigned to.
– Node ID Field—Specify the feature class database field that contains the unique identifying label data.
Note: ElementID is the preferred node ID value because it is always unique to any given element.
– Billing Meter Layer—Specify the feature class or shapefile that contains the geocoded billing meter data.
Bentley SewerCAD V8i User’s Guide 7-347

Using LoadBuilder to Assign Loading Data
– Load Type Field—Specify the source database field that contains load type data. Load Type is an optional classification that can be used to assign composite loads to nodes, which enables different behaviors, multipliers, and patterns to be applied in various situations. For example, possible load types may include Residential, Commercial, Industrial, etc. To make use of the Load Type classification, your source database must include a column that contains this data.
– Usage Field—Specify the source database field that contains usage data. The usage field in the source database must contain flow data. Also, use to select the unit associated with the usage field value.
– Use Previous Run—LoadBuilder’s most time-consuming calculations when using the Nearest Node strategy are the spatial calculations that are performed to determine proximity between the meter elements and the node elements. When this box is checked, the proximity calculations that were generated from a previous run are used, thereby increasing the overall calculation performance.
• Nearest Pipe—Input Data—The following fields require data to be specified:
– Pipe Layer—Specify the line feature class or shapefile that contains the pipes that will be used to determine meter-to-pipe proximity. Note that the pipes in this layer must connect to the nodes contained in the Node Layer.
– Pipe ID Field—Specify the source database field that contains the unique identifying label data.
Note: ElementID is the preferred Pipe ID value because it is always unique to any given element.
– Load Assignment—Specify the method that will be used to distribute the metered loads that are assigned to the nearest pipe to the end nodes of said pipe. Options include:
- Equal Distribution—This method assigns an equal portion of the total load assigned to a pipe to each of the pipe’s end nodes.
- Distance Weighted—This method assigns a portion of the total load assigned to a pipe based on the distance between the meter(s) and the nodes at the pipe ends. The closer a meter is to the node at the end of the pipe, the more load will be assigned to it.
- Closest Node—This method assigns the entire total load assigned to the pipe end node that is closest to the meter.
- Farthest Node—This method assigns the entire total load assigned to the pipe end node that is farthest from the meter.
– Node Layer—Specify the point feature class or shapefile that contains the nodes that will be used to determine node-to-pipe proximity. Note that the nodes in this layer must connect to the pipes contained in the Pipes Layer.
7-348 Bentley SewerCAD V8i User’s Guide
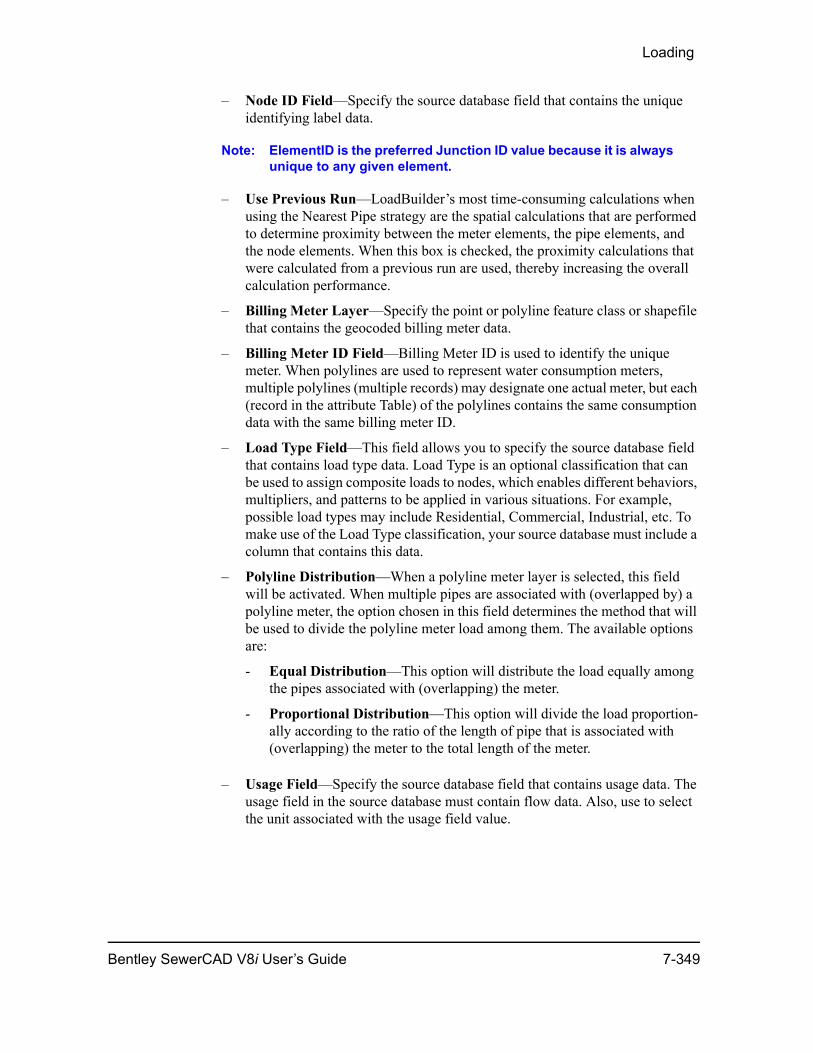
Loading
– Node ID Field—Specify the source database field that contains the unique identifying label data.
Note: ElementID is the preferred Junction ID value because it is always unique to any given element.
– Use Previous Run—LoadBuilder’s most time-consuming calculations when using the Nearest Pipe strategy are the spatial calculations that are performed to determine proximity between the meter elements, the pipe elements, and the node elements. When this box is checked, the proximity calculations that were calculated from a previous run are used, thereby increasing the overall calculation performance.
– Billing Meter Layer—Specify the point or polyline feature class or shapefile that contains the geocoded billing meter data.
– Billing Meter ID Field—Billing Meter ID is used to identify the unique meter. When polylines are used to represent water consumption meters, multiple polylines (multiple records) may designate one actual meter, but each (record in the attribute Table) of the polylines contains the same consumption data with the same billing meter ID.
– Load Type Field—This field allows you to specify the source database field that contains load type data. Load Type is an optional classification that can be used to assign composite loads to nodes, which enables different behaviors, multipliers, and patterns to be applied in various situations. For example, possible load types may include Residential, Commercial, Industrial, etc. To make use of the Load Type classification, your source database must include a column that contains this data.
– Polyline Distribution—When a polyline meter layer is selected, this field will be activated. When multiple pipes are associated with (overlapped by) a polyline meter, the option chosen in this field determines the method that will be used to divide the polyline meter load among them. The available options are:
- Equal Distribution—This option will distribute the load equally among the pipes associated with (overlapping) the meter.
- Proportional Distribution—This option will divide the load proportion-ally according to the ratio of the length of pipe that is associated with (overlapping) the meter to the total length of the meter.
– Usage Field—Specify the source database field that contains usage data. The usage field in the source database must contain flow data. Also, use to select the unit associated with the usage field value.
Bentley SewerCAD V8i User’s Guide 7-349
Using LoadBuilder to Assign Loading Data
• Equal Flow Distribution—Input Data—The following fields require data to be specified:
– Node Layer—Specify the point feature class or shapefile that contains the nodes that the flow will be assigned to.
– Node ID Field—Specify the source database field that contains identifying label data.
Note: ElementID is the preferred Node ID value because it is always unique to any given element.
– Flow Boundary Layer—Specify the polygon feature class that contains the flow monitoring meter data.
– Flow Field—Specify the source database field that contains usage data. The usage field in the source database must contain flow data. Also, use to select the unit associated with the usage field value.
• Proportional Distribution by Area—Input Data—The following fields require data to be specified:
– Service Area Layer—Specify the polygon feature class or shapefile that defines the service area for each node.
– Node ID Field—Specify the source database field that contains the unique identifying label data.
Note: ElementID is the preferred Junction ID value because it is always unique to any given element.
– Flow Boundary Layer—Specify the polygon feature class or shapefile that contains the flow boundary data.
– Boundary Field—Specify the source database field that contains the boundary label.
– Flow Field—Specify the source database field that contains usage data. The usage field in the source database must contain flow data. Also, use to select the unit associated with the usage field value.
• Proportional Distribution by Population—Input Data—The following fields require data to be specified:
– Service Area Layer—Specify the polygon feature class or shapefile that defines the service area for each node.
– Node ID Field—Specify the source database field that contains the unique identifying label data.
7-350 Bentley SewerCAD V8i User’s Guide
Loading
Note: ElementID is the preferred Junction ID value because it is always unique to any given element.
– Flow Boundary Layer—Specify the polygon feature class or shapefile that contains the flow boundary data.
– Boundary Field—Specify the source database field that contains the boundary label.
– Flow Field—Specify the source database field that contains usage data. The usage field in the source database must contain flow data. Also, use to select the unit associated with the usage field value.
– Population Layer—Specify the polygon feature class or shapefile that contains population data.
– Population Count Field—Specify the source database field that contains population data.
– Land Type Field—Specify the source database field that contains land use type.
• Projection by Land Use—Input Data—The following fields require data to be specified:
– Service Area Layer—Specify the polygon feature class or shapefile that defines the service area for each node.
– Node ID Field—Specify the source database field that contains the unique identifying label data.
Note: ElementID is the preferred Junction ID value because it is always unique to any given element.
– Land Use Layer—Specify the polygon feature class or shapefile that contains the land use data.
– Land Type Field—Specify the source database field that contains land use type.
– Load Type and Load Density—Use this table to assign load density values to the various load types contained within your land use layer.
• Load Estimation by Population—Input Data—The following fields require data to be specified:
– Service Area Layer—Specify the polygon feature class or shapefile that defines the service area for each node.
– Node ID Field—Specify the source database field that contains identifying label data.
Bentley SewerCAD V8i User’s Guide 7-351
Using LoadBuilder to Assign Loading Data
Note: ElementID is the preferred Junction ID value because it is always unique to any given element.
– Population Layer—Specify the polygon feature class or shapefile that contains the population data.
– Population Density Type Field—Specify the source database field that contains the population density type data.
– Population Density Field—Specify the source database field that contains population density data.
– Load Type and Load Density—Use this table to assign load density values to the various load types contained within your population density layer.
Step 3: Calculation Summary
This step displays the Results Summary pane, which displays the total load, load multiplier, and hydraulic pattern associated with each load type in a tabular format. The number of entries listed will depend on the load build method and data types selected in Step 1.
Note: Different types of shapefiles may need to be created based on the loadbuilder method selected.
The Results Summary pane contains the following columns:
• Load Type—This column contains an entry for each load type contained within the database column specified in step one. (Examples include Residential, Commercial, Industrial, etc.)
• Consumption—This column displays the total load associated with each load type entry.
• Multiplier—This column displays the multiplier that is applied to each load type entry. Multipliers can be used to account for peak loads, expected future loads, or to reflect unaccounted-for-loads. This field can be edited.
• Pattern—This column displays the hydraulic pattern associated with each demand type entry. A different pattern can be specified using the menu contained within each cell of this column. New patterns cannot be created from this dialog box; see the Pattern manager help topic for more information regarding the creation of new patterns.
In addition to the functionality provided by the tabular summary pane, the following controls are also available in this step:
7-352 Bentley SewerCAD V8i User’s Guide
Loading
• Global Multiplier—This field allows you to apply a multiplier to all of the entries contained within the Results Summary Pane. Any changes are automati-cally reflected in the Total Load text field. Multipliers can be used to account for peak loads, expected future loads, or to reflect unaccounted-for-loads. The Global Multiplier should be used when the conditions relating to these considerations are identical for all usage types and elements.
• Total Load—This field displays an updated total of all of the entries contained within the Results Summary Pane, as modified by the local and global multipliers that are in effect.
Step 4: Results Preview
This step displays the calculated results in a tabular format. The table consists of the following information:
• Node ID—The unique identifying label assigned to all geodatabase elements by the Loadbuilder.
• Label—The unique identifying label assigned by Bentley SewerCAD V8i Modeler.
• Load Type—An optional classification that can be used to assign different behav-iors, multipliers, and patterns in various situations. For example, possible load types may include Residential, Commercial, Industrial, etc. To make use of the Load Type classification, your source database must include a column that contains this data.
• Pattern—The type of pattern assigned to the node. The source database must include a column that contains this data.
Bentley SewerCAD V8i User’s Guide 7-353

Generating Thiessen Polygons
Step 5: Completing the LoadBuilder Wizard
In this step, the load build template is given a label and the results are exported to an existing or new load alternative. This step contains the following controls:
• Label—This field allows a unique label to be assigned to the load build template.
• Override an Existing Alternative—Choosing this option will cause the calcu-lated loads to overwrite the loads contained within the existing load alternative that is selected.
• Append to an Existing Alternative—Choosing this option will cause the calcu-lated loads to be appended to the loads contained within the existing load alterna-tive that is selected. Loads within the existing alternative that are assigned to a specific node will not be overwritten by newly generated loads assigned to the same node; the new loads will be added to them.
• New Alternative—Choosing this option will cause the calculated loads to be applied to a new load alternative. Enter your text into this field. The Parent Alter-native field will only be active when this option is selected.
LoadBuilder Run Summary
The LoadBuilder Run Summary dialog box details important statistics about the results of a completed LoadBuilder run, including the number of successfully added loads, file information, and informational and/or warning messages.
Generating Thiessen PolygonsA Thiessen polygon is a Voronoi Diagram that is also referred to as the Dirichlet Tessellation. Given a set of points, it defines a region around each point. A Thiessen polygon divides a plane such that each point is enclosed within a polygon and assigns the area to a point in the point set. Any location within a particular Thiessen polygon is nearer to that polygon’s point than to any other point. Mathematically, a Thiessen is constructed by intersecting perpendicular bisector lines between all points.
Thiessen polygon has many applications in different location-related disciplines such as business planning, community services, transportation and hydraulic/hydrological modeling. For water distribution modeling, the Thiessen Polygon Creator was devel-oped to quickly and easily define the service areas of demand nodes. Since each customer within a Thiessen polygon for a junction is nearer to that node than any others, it is assumed that the customers within a particular Thiessen polygon are supplied by the same demand node.
7-354 Bentley SewerCAD V8i User’s Guide
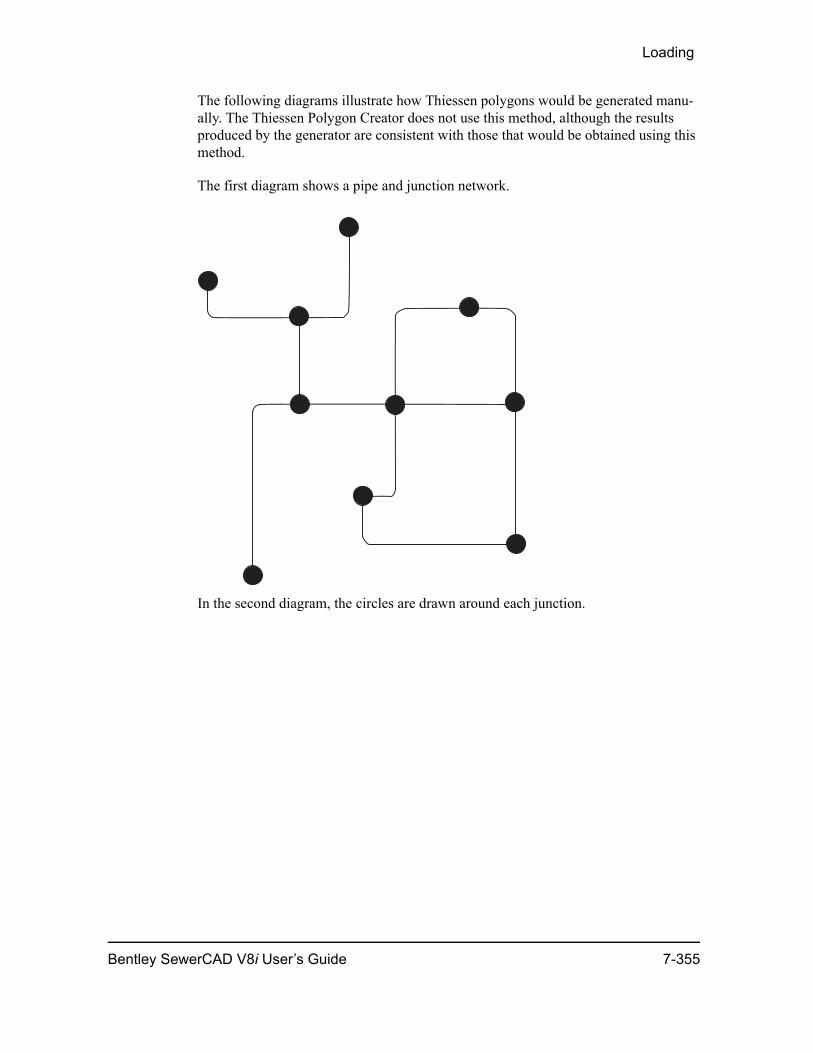
Loading
The following diagrams illustrate how Thiessen polygons would be generated manu-ally. The Thiessen Polygon Creator does not use this method, although the results produced by the generator are consistent with those that would be obtained using this method.
The first diagram shows a pipe and junction network.
In the second diagram, the circles are drawn around each junction.
Bentley SewerCAD V8i User’s Guide 7-355
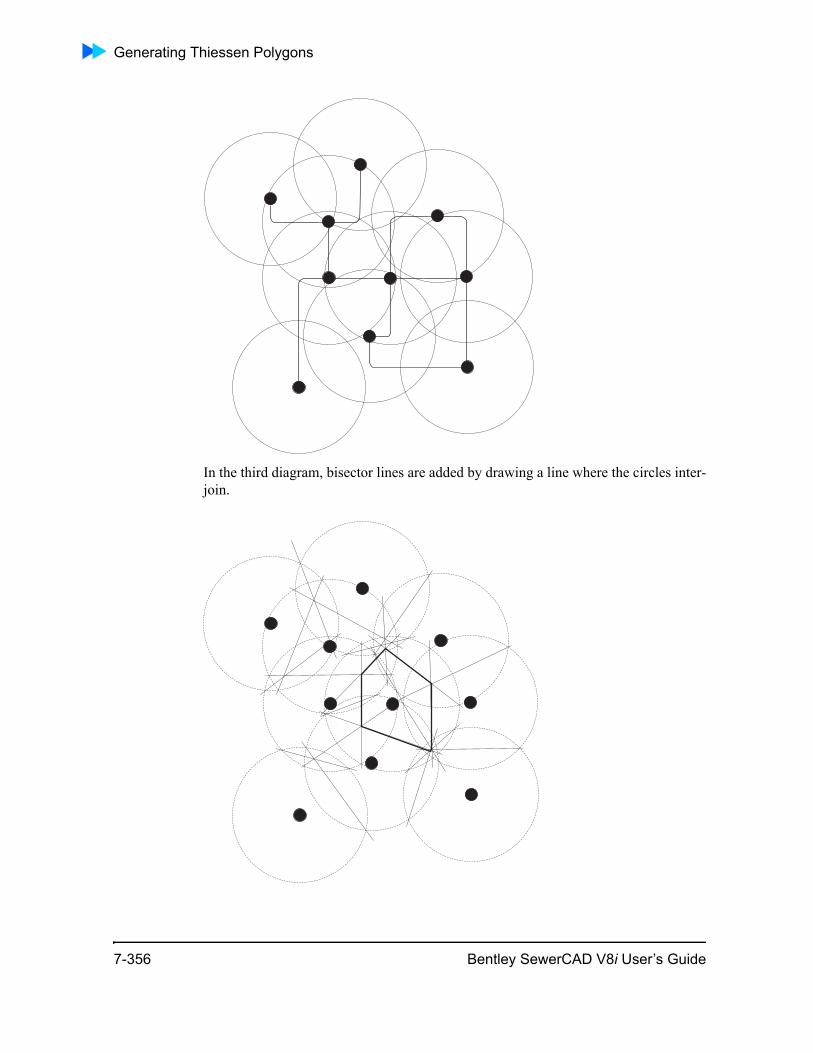
Generating Thiessen Polygons
In the third diagram, bisector lines are added by drawing a line where the circles inter-join.
7-356 Bentley SewerCAD V8i User’s Guide
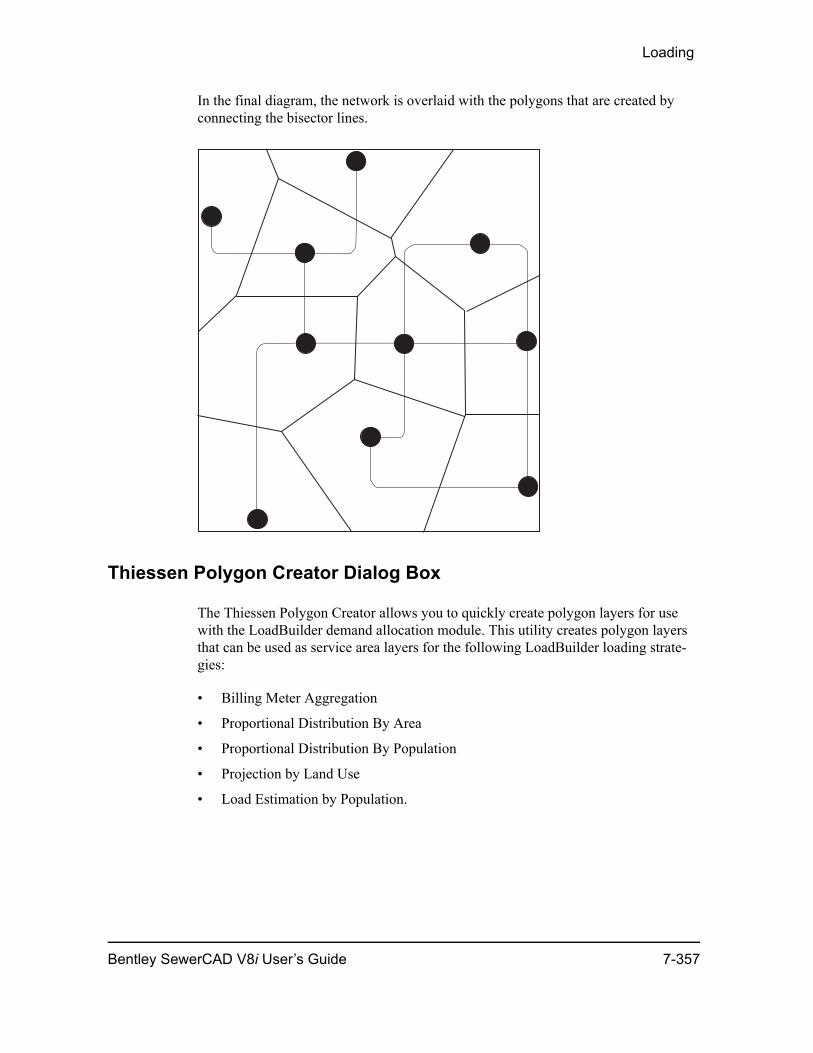
Loading
In the final diagram, the network is overlaid with the polygons that are created by connecting the bisector lines.
Thiessen Polygon Creator Dialog Box
The Thiessen Polygon Creator allows you to quickly create polygon layers for use with the LoadBuilder demand allocation module. This utility creates polygon layers that can be used as service area layers for the following LoadBuilder loading strate-gies:
• Billing Meter Aggregation
• Proportional Distribution By Area
• Proportional Distribution By Population
• Projection by Land Use
• Load Estimation by Population.
Bentley SewerCAD V8i User’s Guide 7-357
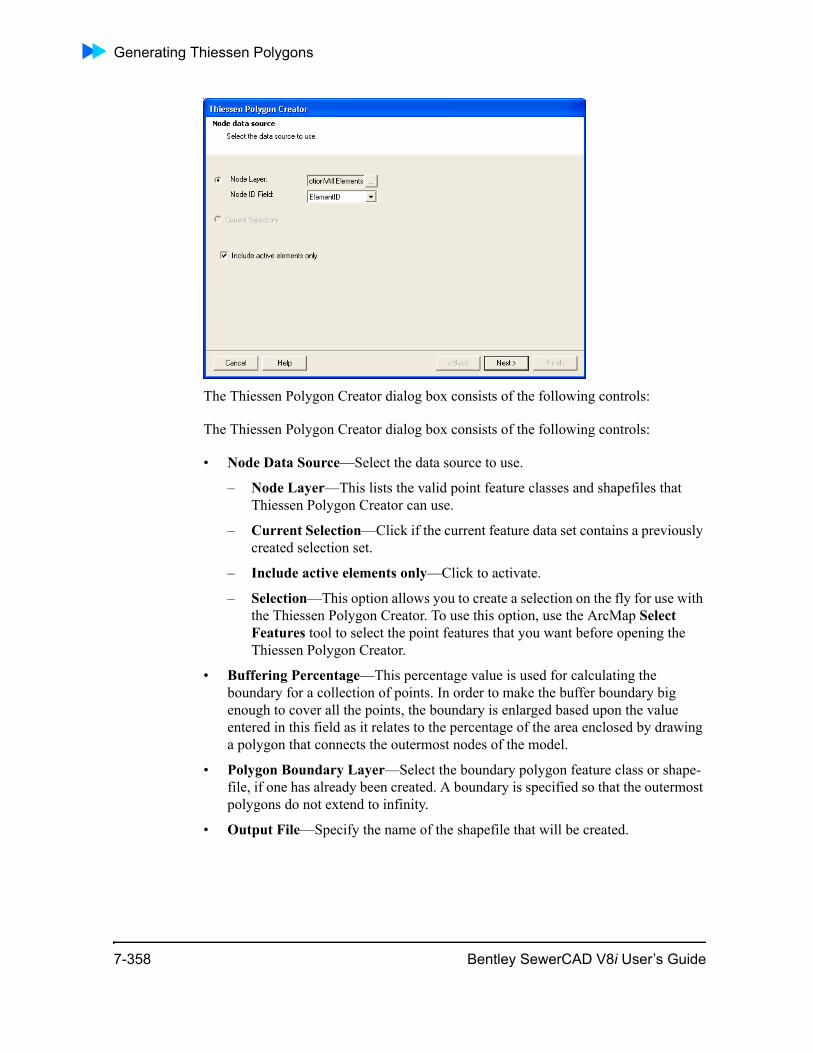
Generating Thiessen Polygons
The Thiessen Polygon Creator dialog box consists of the following controls:
The Thiessen Polygon Creator dialog box consists of the following controls:
• Node Data Source—Select the data source to use.
– Node Layer—This lists the valid point feature classes and shapefiles that Thiessen Polygon Creator can use.
– Current Selection—Click if the current feature data set contains a previously created selection set.
– Include active elements only—Click to activate.
– Selection—This option allows you to create a selection on the fly for use with the Thiessen Polygon Creator. To use this option, use the ArcMap Select Features tool to select the point features that you want before opening the Thiessen Polygon Creator.
• Buffering Percentage—This percentage value is used for calculating the boundary for a collection of points. In order to make the buffer boundary big enough to cover all the points, the boundary is enlarged based upon the value entered in this field as it relates to the percentage of the area enclosed by drawing a polygon that connects the outermost nodes of the model.
• Polygon Boundary Layer—Select the boundary polygon feature class or shape-file, if one has already been created. A boundary is specified so that the outermost polygons do not extend to infinity.
• Output File—Specify the name of the shapefile that will be created.
7-358 Bentley SewerCAD V8i User’s Guide

Loading
Note: The Thiessen Polygon Creator is flexible enough to generate Thiessen polygons for unusual boundary shapes, such as borders with cutouts or holes that Thiessen polygons should not be created inside. To accomplish this, the boundary polygon must be created as one complex (multi-part) polygon. For more information about creating boundary polygon feature classes, see your ArcGIS documentation.
Creating Boundary Polygon Feature Classes
The Thiessen Polygon Creator requires a boundary to be specified around the area in which Thiessen Polygons will be created. This is to prevent the outside edge of the polygons along the perimeter of this area from extending to infinity. The generator can automatically create a boundary using the Buffering Percentage value, or it can use a previously created polygon feature class as the boundary.
A border polygon feature class can be created in ArcCatalog and edited in ArcMap.
To create a border feature class, you will need a Bentley SewerCAD V8i model that has had at least one scenario published as an ESRI feature data set. Then, follow these steps:
1. In the directory structure pane of ArcCatalog, right-click the Bentley SewerCAD V8i feature data set and select New > Feature Class.
2. A dialog box will open, prompting you to name the new feature class. Enter a name and click Next.
3. In the second step, you are prompted to select the database storage configuration. Do so, and click Next.
4. In the third step, click the Shape cell under the Field Name column, and ensure that the Geometry Type is Polygon. Click Finish.
5. In ArcMap, click the Add Data button and select your Bentley SewerCAD V8i feature dataset.
6. Click the Editor button and select Start Editing. Ensure that the border feature class is selected in the Target drop-down list.
7. Draw a polygon around the point features (generally junctions) that you wish to be used to generate the polygons. When you are finished drawing the polygon, click Editor...Stop Editing. Choose Yes when prompted to save your edits.
The polygon feature class you just created can now be used as the boundary during Thiessen polygon generation. For more information about creating and editing feature classes, see your ArcGIS documentation.
Bentley SewerCAD V8i User’s Guide 7-359
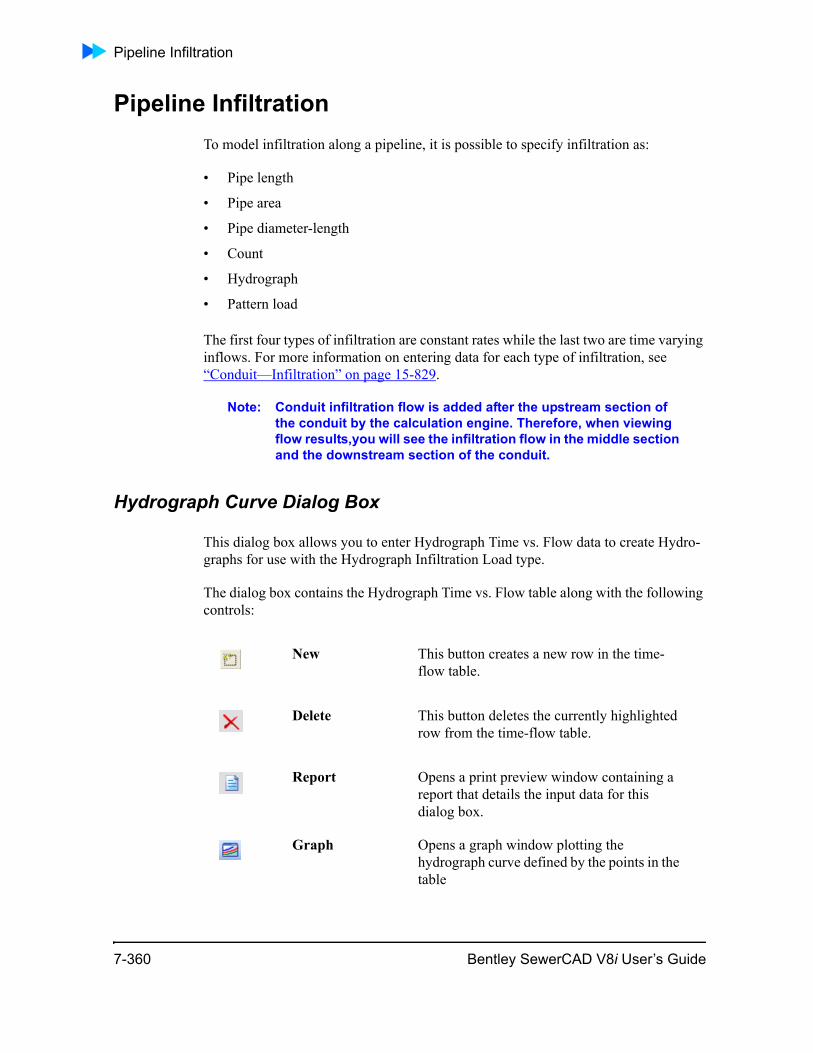
Pipeline Infiltration
Pipeline InfiltrationTo model infiltration along a pipeline, it is possible to specify infiltration as:
• Pipe length
• Pipe area
• Pipe diameter-length
• Count
• Hydrograph
• Pattern load
The first four types of infiltration are constant rates while the last two are time varying inflows. For more information on entering data for each type of infiltration, see “Conduit—Infiltration” on page 15-829.
Note: Conduit infiltration flow is added after the upstream section of the conduit by the calculation engine. Therefore, when viewing flow results,you will see the infiltration flow in the middle section and the downstream section of the conduit.
Hydrograph Curve Dialog Box
This dialog box allows you to enter Hydrograph Time vs. Flow data to create Hydro-graphs for use with the Hydrograph Infiltration Load type.
The dialog box contains the Hydrograph Time vs. Flow table along with the following controls:
New This button creates a new row in the time-flow table.
Delete This button deletes the currently highlighted row from the time-flow table.
Report Opens a print preview window containing a report that details the input data for this dialog box.
Graph Opens a graph window plotting the hydrograph curve defined by the points in the table
7-360 Bentley SewerCAD V8i User’s Guide
Loading
The table contains the following columns:
Extreme FlowsExtreme flow factors are generally used for computing peak discharges, and therefore are typically referred to as peaking factors or peaking equations. However, since they can also be used to compute minimum discharges, the term extreme flow factor is more accurate and will be used throughout the program and documentation.
SewerCAD defines tabular and equation extreme flow factor methods in the editable Engineering Libraries, thus allowing you to edit predefined methods and insert new ones. The extreme flow factor can be user-defined with either of the following:
• Equation extreme flow factor method
• Table extreme flow factor method
In both cases, the extreme flow factor method can be a function of either of the following:
• Contributing population
• Base Load
Discharge based extreme flow methods can be used with any unit dry load. Population based extreme flow methods can be used only with population-based unit sanitary and non-population based unit sanitary loads that have population equivalents specified.
Note: For tabular extreme flow factors, values above the maximum specified value and below the minimum specified value are linearly extrapolated by the software.
Extreme Flows Dialog
This dialog box allows you to create, edit, and view extreme flow factors.The dialog box contains a toolbar, an Extreme Flows list pane, and two tabs. The toolbar contains the following buttons:
Column Description
Hydrograph Time This field allows you to define time of the hydrograph curve point.
Flow This field allows you to define flow at the specified time for the hydrograph curve point.
Bentley SewerCAD V8i User’s Guide 7-361

Extreme Flows
New Creates a new entry in the Extreme Flows List Pane.
Duplicate Creates a copy of the currently highlighted entry in the Extreme Flows List Pane.
7-362 Bentley SewerCAD V8i User’s Guide
Loading
The following table describes the rest of the controls in the Extreme Flows dialog box.
Delete Deletes the entry that is currently highlighted in the Extreme Flows List Pane.
Rename Lets you rename the entry that is currently highlighted in the Extreme Flows List Pane.
Report Lets you generate a preformatted report that contains the input data associated with the entry that is currently highlighted in the Extreme Flows List Pane.
Synchronize Clicking this button opens a submenu containing the following commands:• Browse Engineering Library—This
command opens the Engineering Library manager dialog, allowing you to browse the Extreme Flow Factor Methods Library.
• Synchronize From Library—This command allows you to update a Extreme Flow Factor Method that was previously imported from a Extreme Flow Factor Methods Engineering Library to reflect changes that have been made to the library since it was imported.
• Synchronize To Library—This command allows you to update an existing Extreme Flow Factor Methods Engineering Library using current Extreme Flow Factor Method entries that were initially imported but have since been modified.
• Import From Library—This command allows you to import catalog entries from an existing Extreme Flow Factor Methods Engineering Library.
• Export To Library—This command allows you to export the current catalog entries to an existing Extreme Flow Factor Methods Engineering Library.
Bentley SewerCAD V8i User’s Guide 7-363
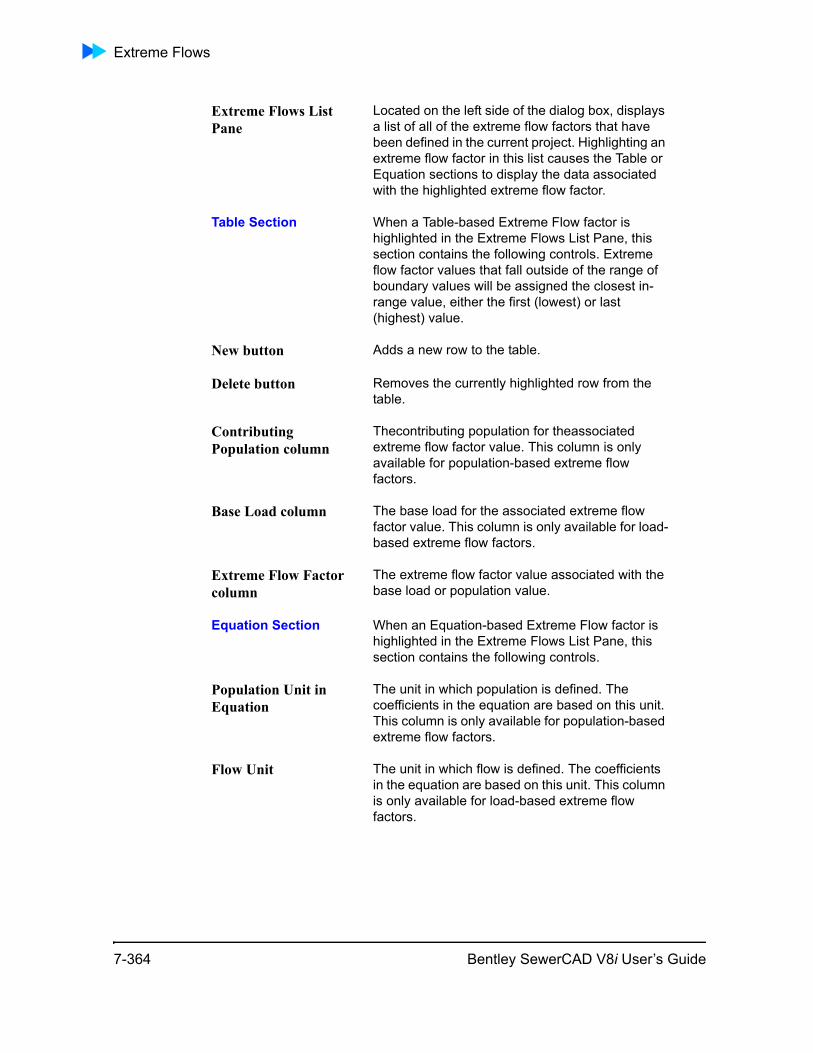
Extreme Flows
Extreme Flows List Pane
Located on the left side of the dialog box, displays a list of all of the extreme flow factors that have been defined in the current project. Highlighting an extreme flow factor in this list causes the Table or Equation sections to display the data associated with the highlighted extreme flow factor.
Table Section When a Table-based Extreme Flow factor is highlighted in the Extreme Flows List Pane, this section contains the following controls. Extreme flow factor values that fall outside of the range of boundary values will be assigned the closest in-range value, either the first (lowest) or last (highest) value.
New button Adds a new row to the table.
Delete button Removes the currently highlighted row from the table.
Contributing Population column
Thecontributing population for theassociated extreme flow factor value. This column is only available for population-based extreme flow factors.
Base Load column The base load for the associated extreme flow factor value. This column is only available for load-based extreme flow factors.
Extreme Flow Factor column
The extreme flow factor value associated with the base load or population value.
Equation Section When an Equation-based Extreme Flow factor is highlighted in the Extreme Flows List Pane, this section contains the following controls.
Population Unit in Equation
The unit in which population is defined. The coefficients in the equation are based on this unit. This column is only available for population-based extreme flow factors.
Flow Unit The unit in which flow is defined. The coefficients in the equation are based on this unit. This column is only available for load-based extreme flow factors.
7-364 Bentley SewerCAD V8i User’s Guide
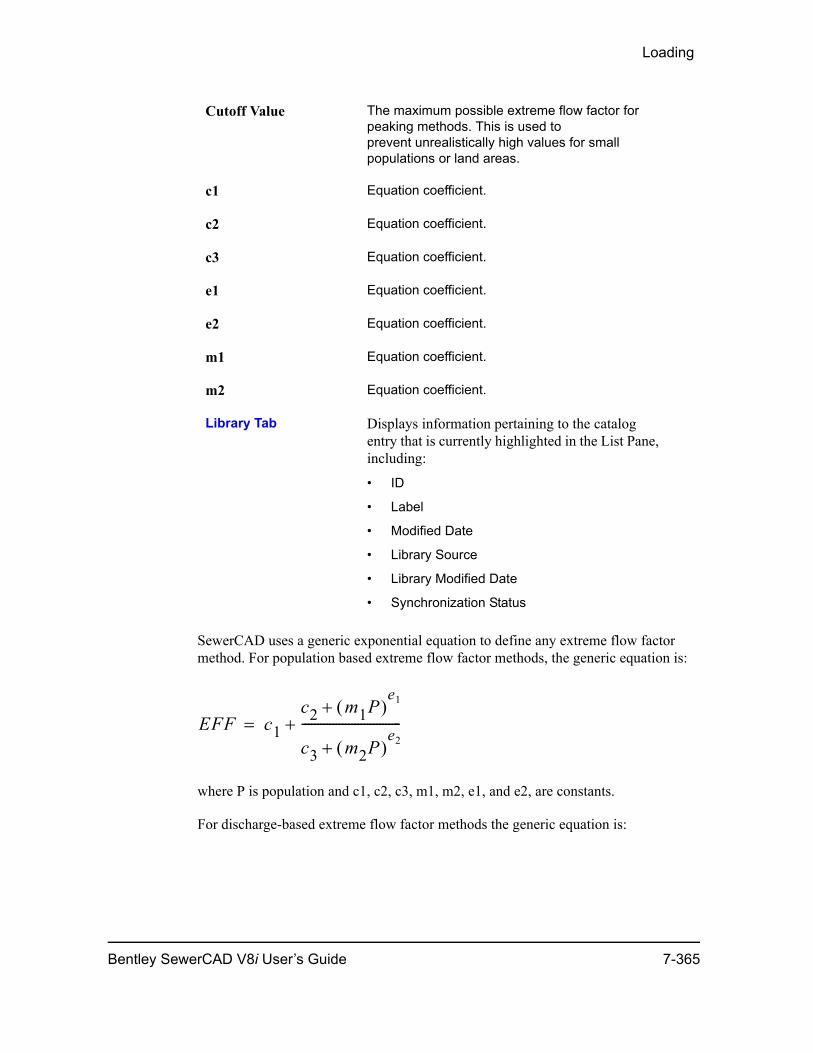
Loading
SewerCAD uses a generic exponential equation to define any extreme flow factor method. For population based extreme flow factor methods, the generic equation is:
where P is population and c1, c2, c3, m1, m2, e1, and e2, are constants.
For discharge-based extreme flow factor methods the generic equation is:
Cutoff Value The maximum possible extreme flow factor for peaking methods. This is used toprevent unrealistically high values for small populations or land areas.
c1 Equation coefficient.
c2 Equation coefficient.
c3 Equation coefficient.
e1 Equation coefficient.
e2 Equation coefficient.
m1 Equation coefficient.
m2 Equation coefficient.
Library Tab Displays information pertaining to the catalog entry that is currently highlighted in the List Pane, including:
• ID
• Label
• Modified Date
• Library Source
• Library Modified Date
• Synchronization Status
EFF c1c2 m1P( )
e1+
c3 m2P( )e2+
--------------------------------+=
Bentley SewerCAD V8i User’s Guide 7-365
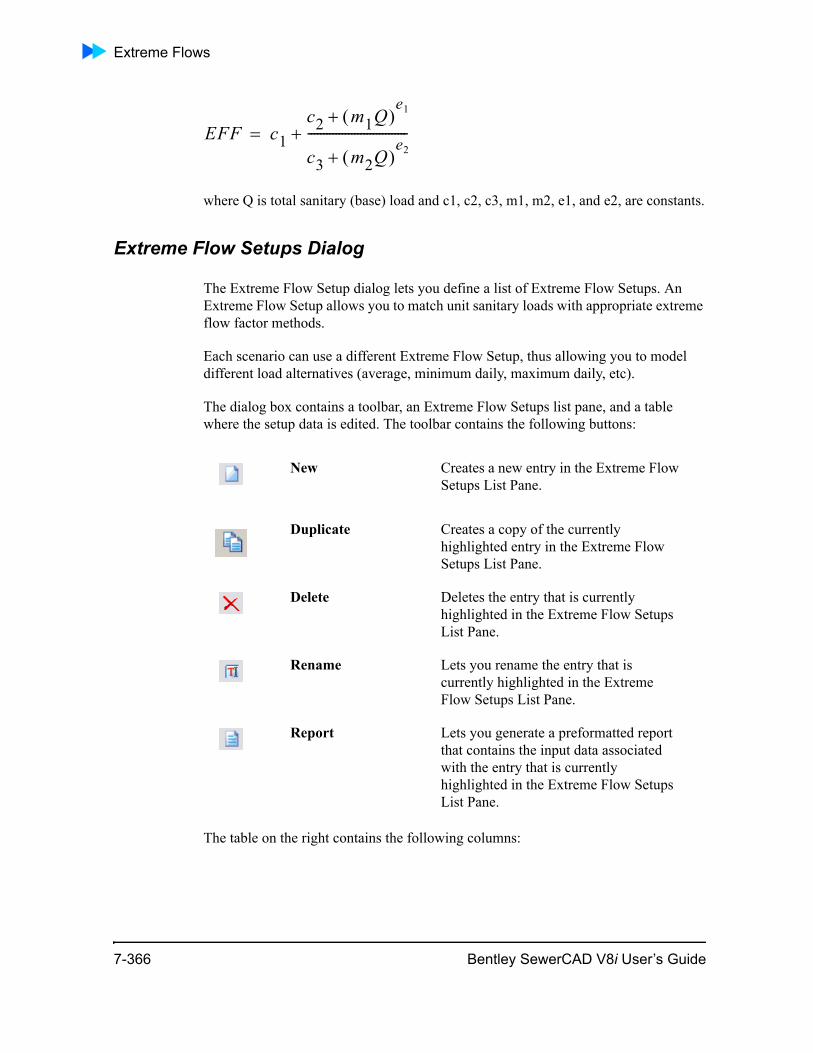
Extreme Flows
where Q is total sanitary (base) load and c1, c2, c3, m1, m2, e1, and e2, are constants.
Extreme Flow Setups Dialog
The Extreme Flow Setup dialog lets you define a list of Extreme Flow Setups. An Extreme Flow Setup allows you to match unit sanitary loads with appropriate extreme flow factor methods.
Each scenario can use a different Extreme Flow Setup, thus allowing you to model different load alternatives (average, minimum daily, maximum daily, etc).
The dialog box contains a toolbar, an Extreme Flow Setups list pane, and a table where the setup data is edited. The toolbar contains the following buttons:
The table on the right contains the following columns:
EFF c1c2 m1Q( )
e1+
c3 m2Q( )e2+
--------------------------------+=
New Creates a new entry in the Extreme Flow Setups List Pane.
Duplicate Creates a copy of the currently highlighted entry in the Extreme Flow Setups List Pane.
Delete Deletes the entry that is currently highlighted in the Extreme Flow Setups List Pane.
Rename Lets you rename the entry that is currently highlighted in the Extreme Flow Setups List Pane.
Report Lets you generate a preformatted report that contains the input data associated with the entry that is currently highlighted in the Extreme Flow Setups List Pane.
7-366 Bentley SewerCAD V8i User’s Guide
Loading
Use When the box is checked the associated unit sanitary loads will be used during calculations. If the box is not checked the associated loads will be ignored.
Unit Load The sanitary load to be associated with an Extreme Flow Method.
Extreme Flow Method Lists the currently defined Extreme Flow factors. Click the ellipsis button to open the Extreme Flows dialog. You can also select a Constant method, in which the unit load is multiplied by the user-defined Constant value.
Constant Available only for the Constant Extreme Flow Method, it simply multiplies the unit loadby that constant.
Adjustment Multiplier Used to adjust an existing Extreme Flow Method. The following formula is used:EFF (new) = EFF (original) x AMThe Adjustment Multiplier does not change the Extreme Flow Method, but changes the extreme flow factor for the selected unit sanitary load. None and Constant Extreme Flow Methods cannot be adjusted.
Bentley SewerCAD V8i User’s Guide 7-367

Extreme Flows
7-368 Bentley SewerCAD V8i User’s Guide
8
ChapterCalculating Your Model
Steady State/Extended Period SimulationBentley SewerCAD V8i gives the choice between performing a steady-state analysis of the system or performing an extended-period simulation over any time period.
Steady State Simulation
Steady-state analyses determine the operating behavior of the system at a specific point in time or under steady-state conditions (flow rates and hydraulic grades remain constant over time). This type of analysis can be useful for determining pressures and flow rates under minimum, average, and peak flows.
For this type of analysis, the network equations are determined and solved with wet wells being treated as fixed grade boundaries. The results that are obtained from this type of analysis are instantaneous values and may or may not be representative of the values of the system a few hours, or even a few minutes, later in time.
Extended Period Simulation
When the variation of the system attributes over time is important, an extended period simulation is appropriate. This type of analysis allows you to model wet wells filling and draining, regulating valves opening and closing, and pressures and flow rates changing throughout the system in response to varying load conditions and automatic control strategies formulated by the SewerCAD V8i.
While a steady-state model may tell whether the system has the capability to route calculated loads, an extended period simulation indicates whether the system has the ability to provide acceptable levels of service over a period of minutes, hours, or days.
Data requirements for extended period simulations are greater than for steady-state runs. In addition to the information required by a steady-state model, you also need to determine load patterns and operational rules for pumps and valves.
Bentley SewerCAD V8i User’s Guide 8-369
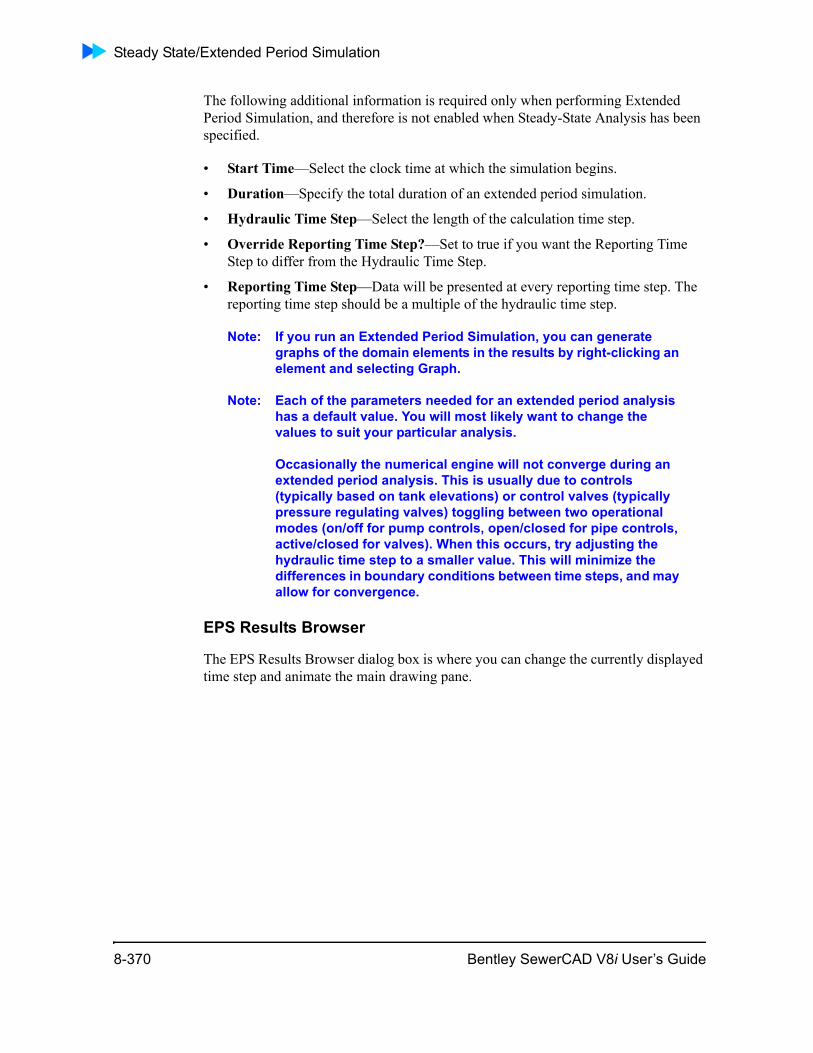
Steady State/Extended Period Simulation
The following additional information is required only when performing Extended Period Simulation, and therefore is not enabled when Steady-State Analysis has been specified.
• Start Time—Select the clock time at which the simulation begins.
• Duration—Specify the total duration of an extended period simulation.
• Hydraulic Time Step—Select the length of the calculation time step.
• Override Reporting Time Step?—Set to true if you want the Reporting Time Step to differ from the Hydraulic Time Step.
• Reporting Time Step—Data will be presented at every reporting time step. The reporting time step should be a multiple of the hydraulic time step.
Note: If you run an Extended Period Simulation, you can generate graphs of the domain elements in the results by right-clicking an element and selecting Graph.
Note: Each of the parameters needed for an extended period analysis has a default value. You will most likely want to change the values to suit your particular analysis.
Occasionally the numerical engine will not converge during an extended period analysis. This is usually due to controls (typically based on tank elevations) or control valves (typically pressure regulating valves) toggling between two operational modes (on/off for pump controls, open/closed for pipe controls, active/closed for valves). When this occurs, try adjusting the hydraulic time step to a smaller value. This will minimize the differences in boundary conditions between time steps, and may allow for convergence.
EPS Results Browser
The EPS Results Browser dialog box is where you can change the currently displayed time step and animate the main drawing pane.
8-370 Bentley SewerCAD V8i User’s Guide
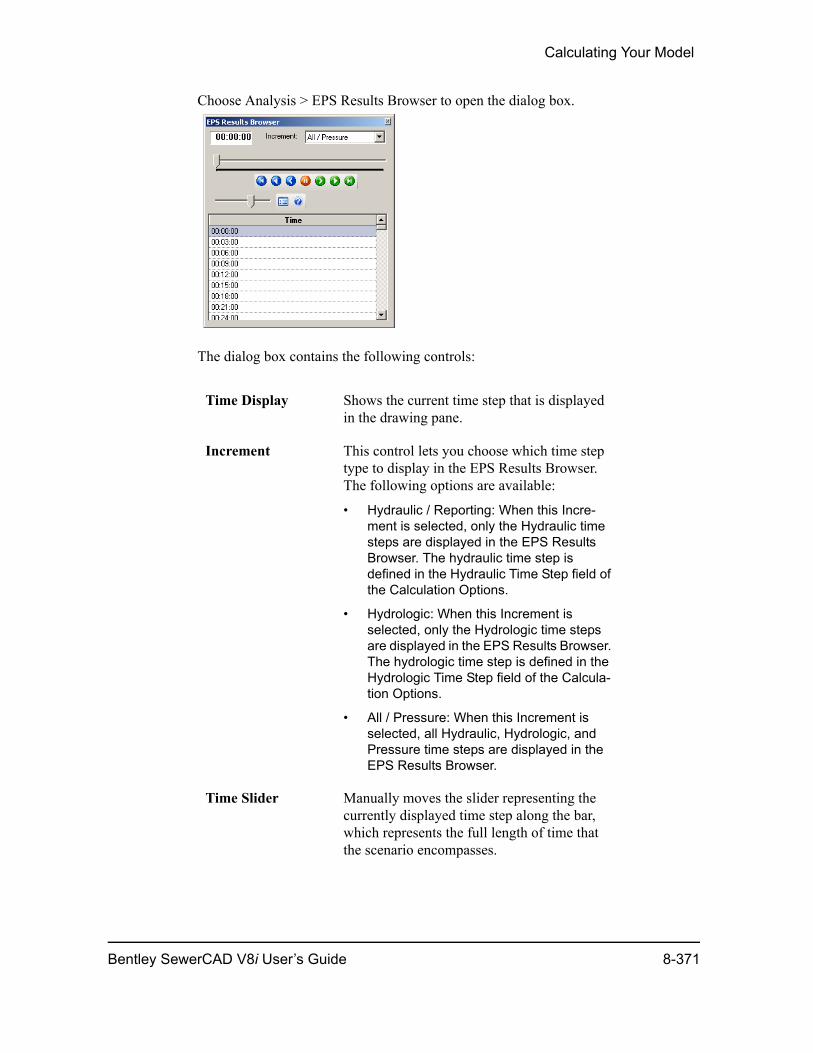
Calculating Your Model
Choose Analysis > EPS Results Browser to open the dialog box.
The dialog box contains the following controls:
Time Display Shows the current time step that is displayed in the drawing pane.
Increment This control lets you choose which time step type to display in the EPS Results Browser. The following options are available:
• Hydraulic / Reporting: When this Incre-ment is selected, only the Hydraulic time steps are displayed in the EPS Results Browser. The hydraulic time step is defined in the Hydraulic Time Step field of the Calculation Options.
• Hydrologic: When this Increment is selected, only the Hydrologic time steps are displayed in the EPS Results Browser. The hydrologic time step is defined in the Hydrologic Time Step field of the Calcula-tion Options.
• All / Pressure: When this Increment is selected, all Hydraulic, Hydrologic, and Pressure time steps are displayed in the EPS Results Browser.
Time Slider Manually moves the slider representing the currently displayed time step along the bar, which represents the full length of time that the scenario encompasses.
Bentley SewerCAD V8i User’s Guide 8-371
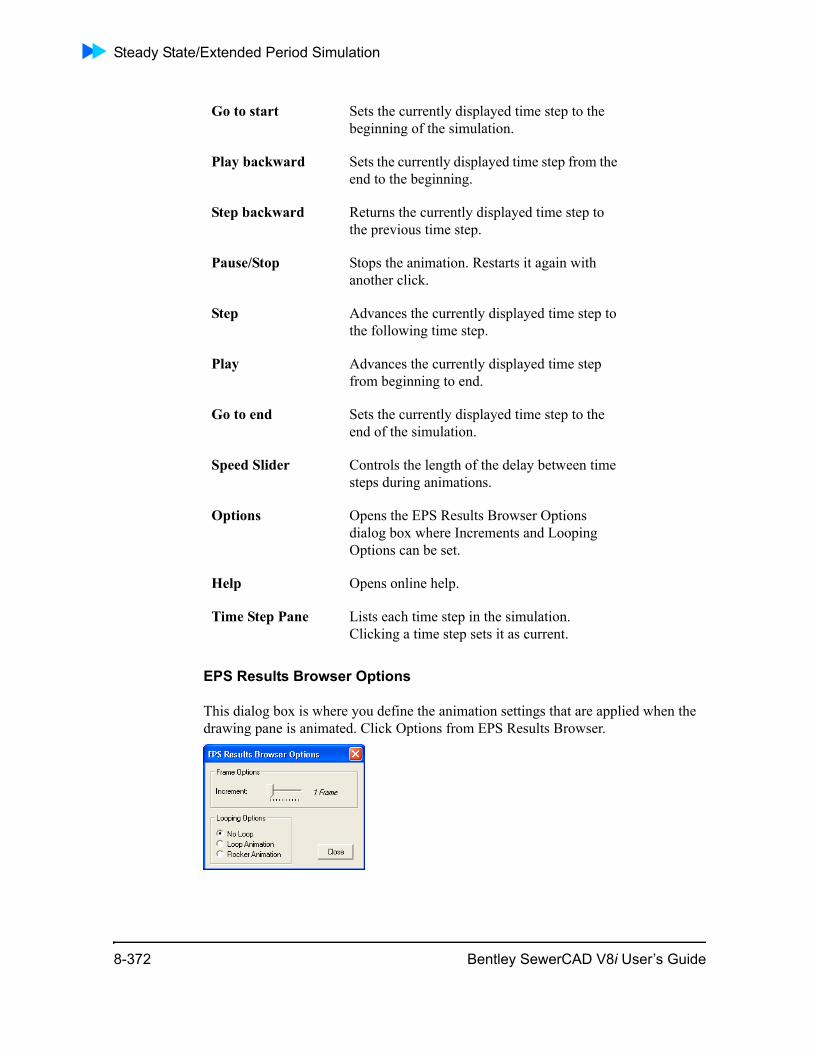
Steady State/Extended Period Simulation
EPS Results Browser Options
This dialog box is where you define the animation settings that are applied when the drawing pane is animated. Click Options from EPS Results Browser.
Go to start Sets the currently displayed time step to the beginning of the simulation.
Play backward Sets the currently displayed time step from the end to the beginning.
Step backward Returns the currently displayed time step to the previous time step.
Pause/Stop Stops the animation. Restarts it again with another click.
Step Advances the currently displayed time step to the following time step.
Play Advances the currently displayed time step from beginning to end.
Go to end Sets the currently displayed time step to the end of the simulation.
Speed Slider Controls the length of the delay between time steps during animations.
Options Opens the EPS Results Browser Options dialog box where Increments and Looping Options can be set.
Help Opens online help.
Time Step Pane Lists each time step in the simulation. Clicking a time step sets it as current.
8-372 Bentley SewerCAD V8i User’s Guide
Calculating Your Model
It contains the following controls:
Calculation Options ManagerYou create calculation profiles in the Calculation Options Manager. The Calculation Options Manager consists of a list pane that displays all of the calculation profiles associated with the current project, and a toolbar that contains some common commands.
To display the Calculation Options Manager, select View > Calculation Options.
The Calculation Options manager allows you to create option profiles that contain various calculation settings. The dialog box contains a list pane that displays all of the option profiles currently contained in the project, along with a toolbar.
Frame Options
Increment Controls the smoothness of the animation. Each time step in a scenario counts as one animation frame. Use this slider to specify the number of frames that are skipped for each step in the animation. For example, if there are time steps every 3 minutes in the scenario and the slider is set at 3 frames, each step in the animation represents 9 minutes of scenario time when you click the Play button.
Looping Options
No Loop Stops the animation at the end of the simulation, if selected.
Loop Animation Restarts the animation automatically, if selected. When this option is selected, the animation reaches the end of the simulation and then restarts from the beginning.
Rocker Animation Restarts the animation automatically in reverse. When this option is selected, the animation reaches the end of the simulation and then plays the simulation in reverse. When the beginning of the simulation is reached, the animation advances towards the end again and will do so continually.
Bentley SewerCAD V8i User’s Guide 8-373
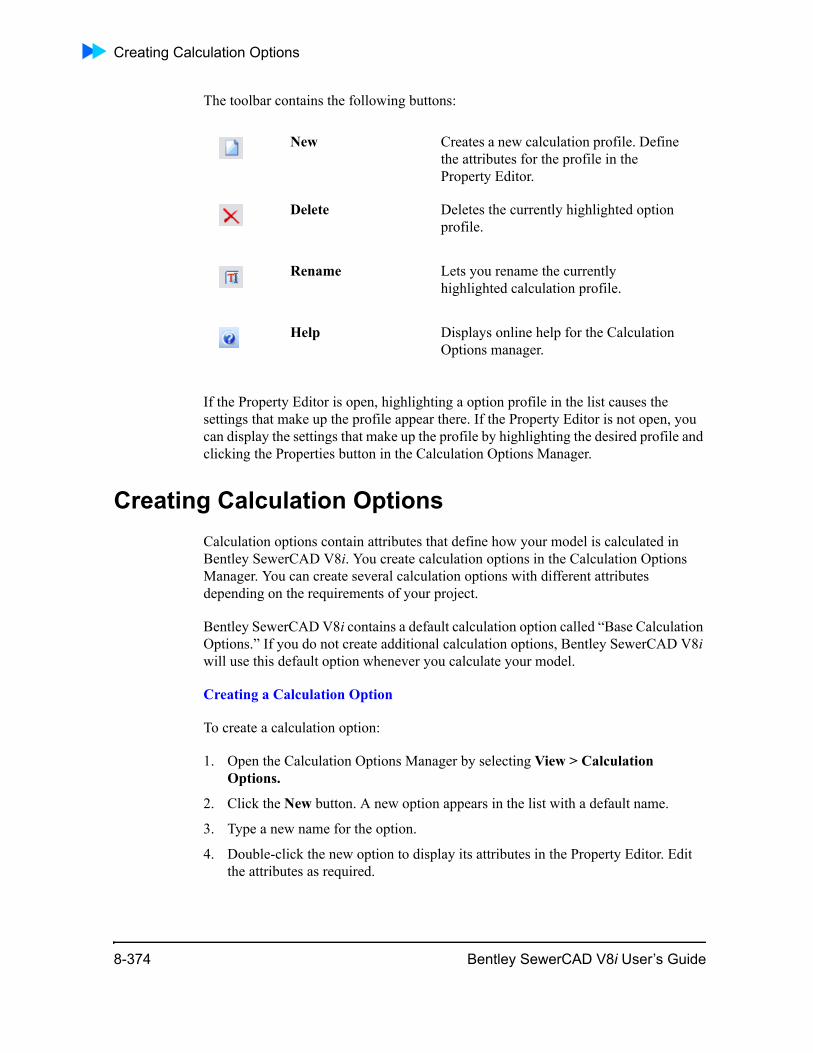
Creating Calculation Options
The toolbar contains the following buttons:
If the Property Editor is open, highlighting a option profile in the list causes the settings that make up the profile appear there. If the Property Editor is not open, you can display the settings that make up the profile by highlighting the desired profile and clicking the Properties button in the Calculation Options Manager.
Creating Calculation OptionsCalculation options contain attributes that define how your model is calculated in Bentley SewerCAD V8i. You create calculation options in the Calculation Options Manager. You can create several calculation options with different attributes depending on the requirements of your project.
Bentley SewerCAD V8i contains a default calculation option called “Base Calculation Options.” If you do not create additional calculation options, Bentley SewerCAD V8i will use this default option whenever you calculate your model.
Creating a Calculation Option
To create a calculation option:
1. Open the Calculation Options Manager by selecting View > Calculation Options.
2. Click the New button. A new option appears in the list with a default name.
3. Type a new name for the option.
4. Double-click the new option to display its attributes in the Property Editor. Edit the attributes as required.
New Creates a new calculation profile. Define the attributes for the profile in the Property Editor.
Delete Deletes the currently highlighted option profile.
Rename Lets you rename the currently highlighted calculation profile.
Help Displays online help for the Calculation Options manager.
8-374 Bentley SewerCAD V8i User’s Guide
Calculating Your Model
Editing a Calculation Option
You edit the attributes of a calculation option in the Property Editor.
If you select a calculation option while the Property Editor is open, the attributes for that option appear there. If the Property Editor is not open, you can display the attributes of the calculation option by double-clicking the option in the Calculation Options Manager.
Deleting a Calculation Option
To delete a calculation option:
1. Open the Calculation Options Manager by selecting View > Calculation Options.
2. Select the option you want to delete.
3. Press the Delete key, click the Delete button in the Calculation Options Manager, or right-click the option and select Delete from the shortcut menu.
Bentley SewerCAD V8i User’s Guide 8-375
Creating Calculation Options
Renaming a Calculation Option
To rename a calculation option:
1. Open the Calculation Options Manager by selecting View > Calculation Options.
2. Select the option you want to rename.
3. Click the Rename button or right-click and select Rename from the shortcut menu.
4. Type a new name for the option, then press Enter.
Calculation Option Attributes
A Calculation Option contains the information described in the following table.
Table 8-1: Calculation Option Attributes
Attribute Description
General
Label Lets you specify a name for the options option.
Notes Lets you enter descriptive text to be associated with the current calculation option.
Time Analysis Type Select whether the analysis is extended period or steady-state.
Calculation Type Select whether to perform an analysis of the current model or to perform an automatic design calculation. This field is only available when the EPS Time Analysis Type is chosen.
Start Time Displays the clock time at which the simulation begins. This field is not editable. This field is only displayed when the EPS Time Analysis Type is chosen.
Base Date Select the calendar date on which the simulation begins. This field is only available when the EPS Time Analysis Type is chosen.
Duration Lets you specify the duration of the simulation. This field is only available when the EPS Time Analysis Type is chosen.
8-376 Bentley SewerCAD V8i User’s Guide
Calculating Your Model
Hydraulic Time Step
Lets you specify the computational time step in hydraulic calculations. This field is only available when the EPS Time Analysis Type is chosen.
Hydrologic Time Step
Lets you specify the computational time step in hydrology runoff calculations. This field is only available when the EPS State Time Analysis Type is chosen.
Reporting Time Step
Output data will be presented at every reporting time step. This field is only available when the EPS Time Analysis Type is chosen.
Reporting Time Steps
Edit this collection to specify a custom definition for results ouput, including periods where you want all time steps saved (<All>), a constant reporting period (Constant), or no results at all (None). This field is only available when the Reporting Time Step value is set to Variable.
Tractive Stress (Global Minimum)
The global minimum allowable tractive stress in a conduit.
Report Hydrologic Time Step?
If True, hydrographs will be reported in the hydrologic increment.
Convex Routing
Peak Flow Ratio Used when selecting a representative flow rate from the hydrograph to be routed when calculating the C parameter used to perform the routing calculations.
Gravity Hydraulics
Maximum Network Transversals
This is the maximum number of iterations that will be performed to achieve the closest approximation of the desired network results.
Flow Convergence Test
This value is taken as the maximum relative change in discharge occurring at the system outlet between two successive network solutions. In rational hydrology, system discharge is a function of travel time and hydraulics through the system. Therefore, it is necessary to iterate until the system balances, or a maximum number of trials has occurred.
Table 8-1: Calculation Option Attributes
Attribute Description
Bentley SewerCAD V8i User’s Guide 8-377
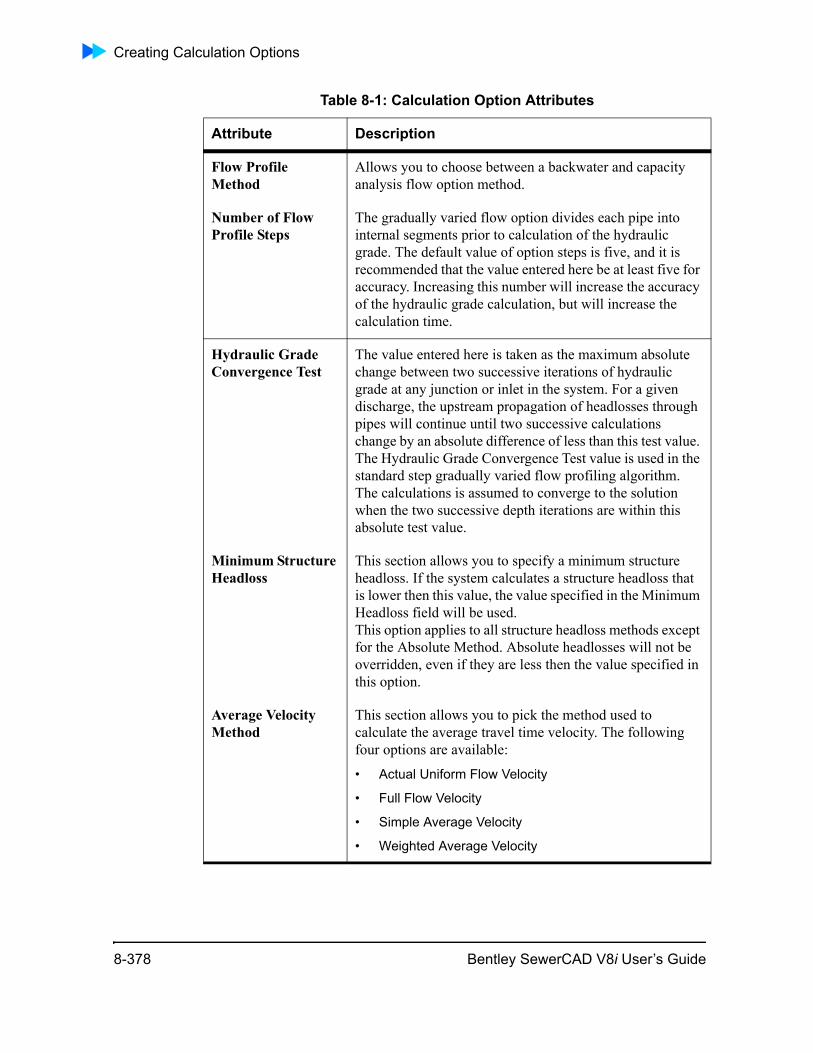
Creating Calculation Options
Flow Profile Method
Allows you to choose between a backwater and capacity analysis flow option method.
Number of Flow Profile Steps
The gradually varied flow option divides each pipe into internal segments prior to calculation of the hydraulic grade. The default value of option steps is five, and it is recommended that the value entered here be at least five for accuracy. Increasing this number will increase the accuracy of the hydraulic grade calculation, but will increase the calculation time.
Hydraulic Grade Convergence Test
The value entered here is taken as the maximum absolute change between two successive iterations of hydraulic grade at any junction or inlet in the system. For a given discharge, the upstream propagation of headlosses through pipes will continue until two successive calculations change by an absolute difference of less than this test value. The Hydraulic Grade Convergence Test value is used in the standard step gradually varied flow profiling algorithm. The calculations is assumed to converge to the solution when the two successive depth iterations are within this absolute test value.
Minimum Structure Headloss
This section allows you to specify a minimum structure headloss. If the system calculates a structure headloss that is lower then this value, the value specified in the Minimum Headloss field will be used. This option applies to all structure headloss methods except for the Absolute Method. Absolute headlosses will not be overridden, even if they are less then the value specified in this option.
Average Velocity Method
This section allows you to pick the method used to calculate the average travel time velocity. The following four options are available:
• Actual Uniform Flow Velocity
• Full Flow Velocity
• Simple Average Velocity
• Weighted Average Velocity
Table 8-1: Calculation Option Attributes
Attribute Description
8-378 Bentley SewerCAD V8i User’s Guide
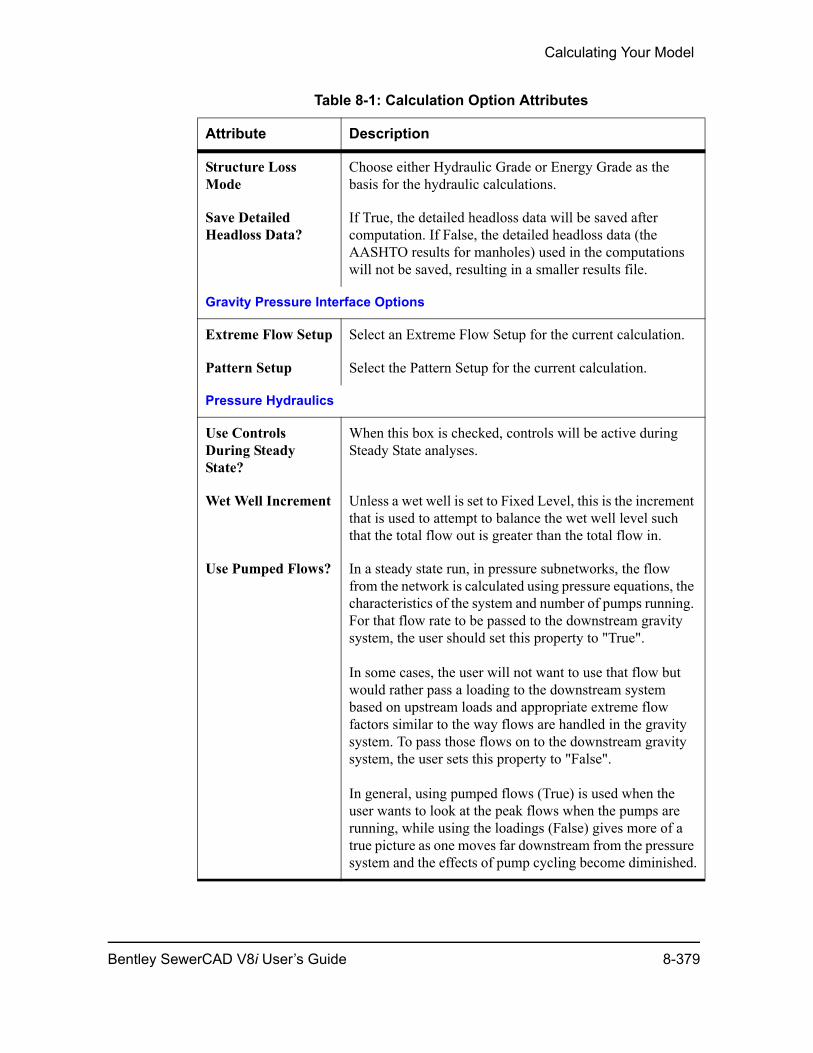
Calculating Your Model
Structure Loss Mode
Choose either Hydraulic Grade or Energy Grade as the basis for the hydraulic calculations.
Save Detailed Headloss Data?
If True, the detailed headloss data will be saved after computation. If False, the detailed headloss data (the AASHTO results for manholes) used in the computations will not be saved, resulting in a smaller results file.
Gravity Pressure Interface Options
Extreme Flow Setup Select an Extreme Flow Setup for the current calculation.
Pattern Setup Select the Pattern Setup for the current calculation.
Pressure Hydraulics
Use Controls During Steady State?
When this box is checked, controls will be active during Steady State analyses.
Wet Well Increment Unless a wet well is set to Fixed Level, this is the increment that is used to attempt to balance the wet well level such that the total flow out is greater than the total flow in.
Use Pumped Flows? In a steady state run, in pressure subnetworks, the flow from the network is calculated using pressure equations, the characteristics of the system and number of pumps running. For that flow rate to be passed to the downstream gravity system, the user should set this property to "True".
In some cases, the user will not want to use that flow but would rather pass a loading to the downstream system based on upstream loads and appropriate extreme flow factors similar to the way flows are handled in the gravity system. To pass those flows on to the downstream gravity system, the user sets this property to "False".
In general, using pumped flows (True) is used when the user wants to look at the peak flows when the pumps are running, while using the loadings (False) gives more of a true picture as one moves far downstream from the pressure system and the effects of pump cycling become diminished.
Table 8-1: Calculation Option Attributes
Attribute Description
Bentley SewerCAD V8i User’s Guide 8-379
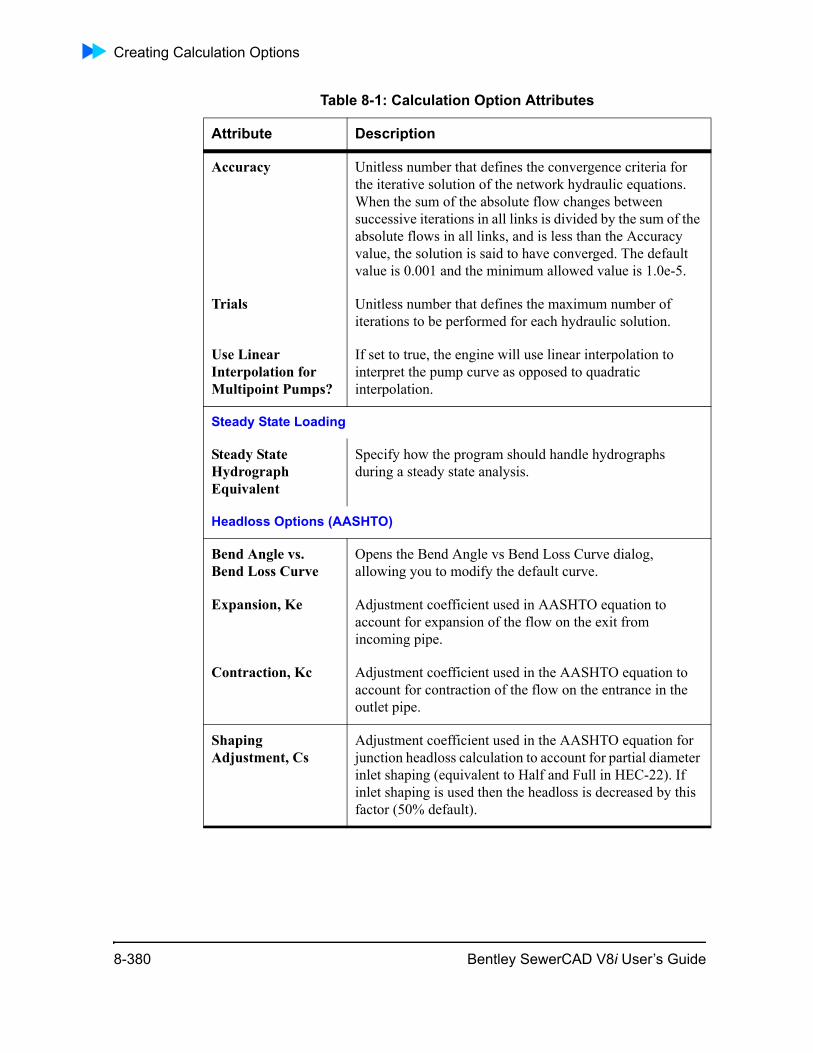
Creating Calculation Options
Accuracy Unitless number that defines the convergence criteria for the iterative solution of the network hydraulic equations. When the sum of the absolute flow changes between successive iterations in all links is divided by the sum of the absolute flows in all links, and is less than the Accuracy value, the solution is said to have converged. The default value is 0.001 and the minimum allowed value is 1.0e-5.
Trials Unitless number that defines the maximum number of iterations to be performed for each hydraulic solution.
Use Linear Interpolation for Multipoint Pumps?
If set to true, the engine will use linear interpolation to interpret the pump curve as opposed to quadratic interpolation.
Steady State Loading
Steady State Hydrograph Equivalent
Specify how the program should handle hydrographs during a steady state analysis.
Headloss Options (AASHTO)
Bend Angle vs. Bend Loss Curve
Opens the Bend Angle vs Bend Loss Curve dialog, allowing you to modify the default curve.
Expansion, Ke Adjustment coefficient used in AASHTO equation to account for expansion of the flow on the exit from incoming pipe.
Contraction, Kc Adjustment coefficient used in the AASHTO equation to account for contraction of the flow on the entrance in the outlet pipe.
Shaping Adjustment, Cs
Adjustment coefficient used in the AASHTO equation for junction headloss calculation to account for partial diameter inlet shaping (equivalent to Half and Full in HEC-22). If inlet shaping is used then the headloss is decreased by this factor (50% default).
Table 8-1: Calculation Option Attributes
Attribute Description
8-380 Bentley SewerCAD V8i User’s Guide
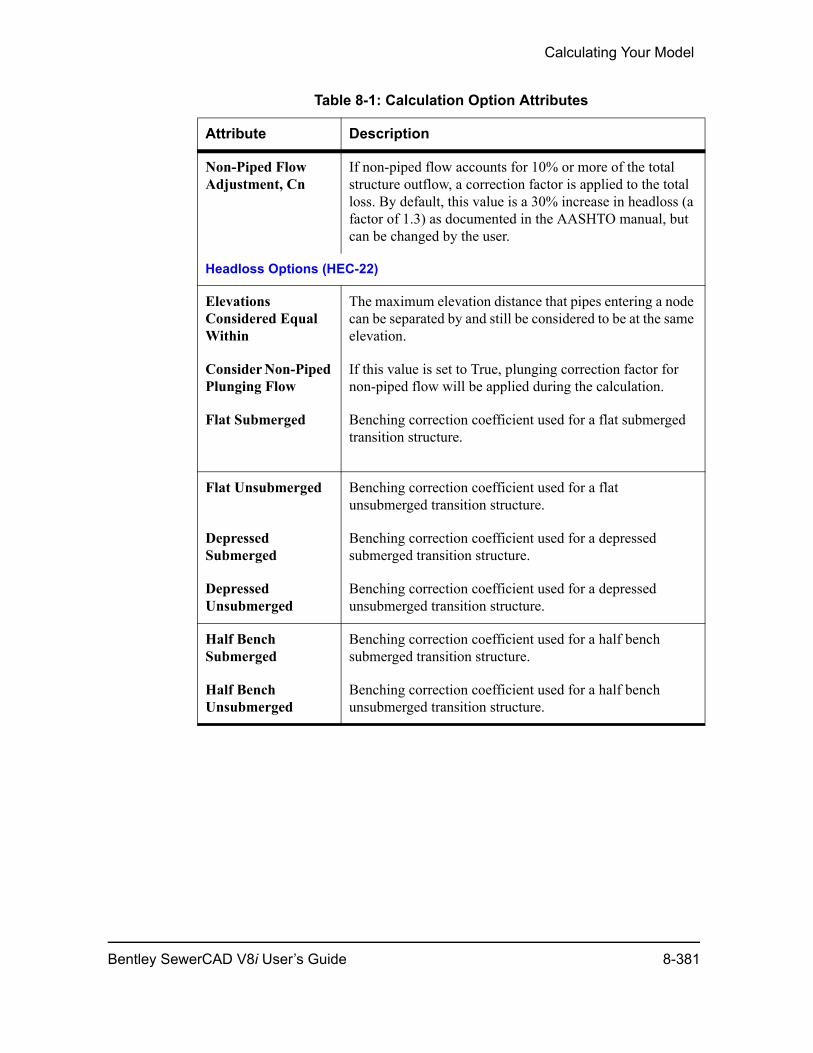
Calculating Your Model
Non-Piped Flow Adjustment, Cn
If non-piped flow accounts for 10% or more of the total structure outflow, a correction factor is applied to the total loss. By default, this value is a 30% increase in headloss (a factor of 1.3) as documented in the AASHTO manual, but can be changed by the user.
Headloss Options (HEC-22)
Elevations Considered Equal Within
The maximum elevation distance that pipes entering a node can be separated by and still be considered to be at the same elevation.
Consider Non-Piped Plunging Flow
If this value is set to True, plunging correction factor for non-piped flow will be applied during the calculation.
Flat Submerged Benching correction coefficient used for a flat submerged transition structure.
Flat Unsubmerged Benching correction coefficient used for a flat unsubmerged transition structure.
Depressed Submerged
Benching correction coefficient used for a depressed submerged transition structure.
Depressed Unsubmerged
Benching correction coefficient used for a depressed unsubmerged transition structure.
Half Bench Submerged
Benching correction coefficient used for a half bench submerged transition structure.
Half Bench Unsubmerged
Benching correction coefficient used for a half bench unsubmerged transition structure.
Table 8-1: Calculation Option Attributes
Attribute Description
Bentley SewerCAD V8i User’s Guide 8-381
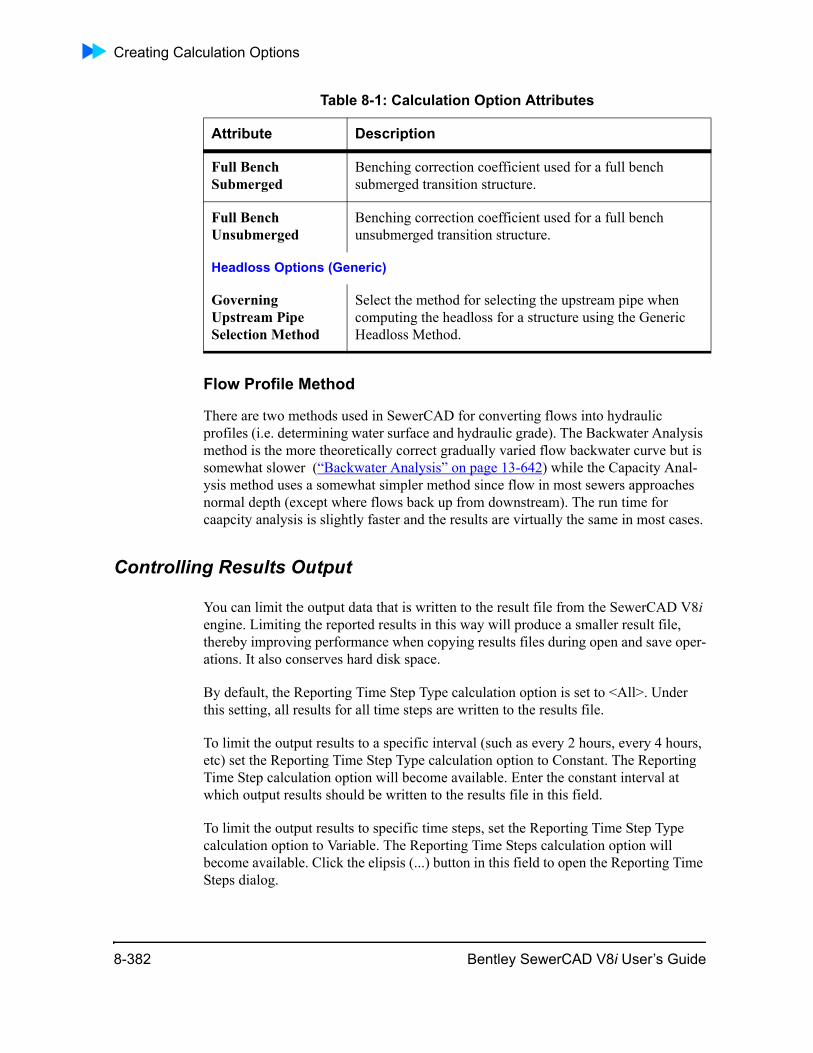
Creating Calculation Options
Flow Profile Method
There are two methods used in SewerCAD for converting flows into hydraulic profiles (i.e. determining water surface and hydraulic grade). The Backwater Analysis method is the more theoretically correct gradually varied flow backwater curve but is somewhat slower (“Backwater Analysis” on page 13-642) while the Capacity Anal-ysis method uses a somewhat simpler method since flow in most sewers approaches normal depth (except where flows back up from downstream). The run time for caapcity analysis is slightly faster and the results are virtually the same in most cases.
Controlling Results Output
You can limit the output data that is written to the result file from the SewerCAD V8i engine. Limiting the reported results in this way will produce a smaller result file, thereby improving performance when copying results files during open and save oper-ations. It also conserves hard disk space.
By default, the Reporting Time Step Type calculation option is set to <All>. Under this setting, all results for all time steps are written to the results file.
To limit the output results to a specific interval (such as every 2 hours, every 4 hours, etc) set the Reporting Time Step Type calculation option to Constant. The Reporting Time Step calculation option will become available. Enter the constant interval at which output results should be written to the results file in this field.
To limit the output results to specific time steps, set the Reporting Time Step Type calculation option to Variable. The Reporting Time Steps calculation option will become available. Click the elipsis (...) button in this field to open the Reporting Time Steps dialog.
Full Bench Submerged
Benching correction coefficient used for a full bench submerged transition structure.
Full Bench Unsubmerged
Benching correction coefficient used for a full bench unsubmerged transition structure.
Headloss Options (Generic)
Governing Upstream Pipe Selection Method
Select the method for selecting the upstream pipe when computing the headloss for a structure using the Generic Headloss Method.
Table 8-1: Calculation Option Attributes
Attribute Description
8-382 Bentley SewerCAD V8i User’s Guide
Calculating Your Model
Reporting Time Steps Dialog Box
This dialog allows you to specify whether the output results for different time steps during an extended period simulaton will or will not be written to the results file.
You do this by specifying ranges of time during which:
All of the time steps are reported on and written to the results file.
None of the time steps are reported on and written to the results file.
Time steps that fall within the specificed constant interval are reported on and written to the results file.
The first row in this dialog will always be 0.00 hours, which is the beginning of the first time range. To specify the first range of time, enter the end time step in the second row, for example 24 hours. Specify the type in the first row, for example <All>. In this example, all time steps between hour 0 (the start of the simulation) and hour 24 will be written to the results file. To specify further ranges of time, add new rows with the New button. Remove rows with the Delete button. The last range in the dialog will start at the time specified in the last row and end at the end of the simulation.
Check Data/ ValidateThis feature allows you to validate your model against typical data entry errors, hard to detect topology problems, and modeling problems. When the Validate box is checked, the model validation is automatically run prior to calculations. It can also be
run at any time by clicking Validate . The process will produce either a dialog box stating No Problems Found or a Status Log with a list of messages.
The validation process will generate two types of messages. A warning message means that a particular part of the model (i.e., a pipe’s roughness) does not conform to the expected value or is not within the expected range of values. This type of warning is useful but not fatal. Therefore, no corrective action is required to proceed with a calculation. Warning messages are often generated as a result of a topographical or data entry error and should be corrected. An error message, on the other hand, is a fatal error, and the calculation cannot proceed before it is corrected. Typically, error messages are related to problems in the network topology, such as a pump or valve not being connected on both its intake and discharge sides.
Bentley SewerCAD V8i User’s Guide 8-383
Detailed Calculation Summary Dialog Box
Note: In earlier versions of the software, it was possible to create a topological situation that was problematic but was not checked for in the network topology validation. The situation could be created by morphing a node element such as a junction, tank, or reservoir into a pump or valve. This situation is now detected and corrected automatically, but it is strongly recommended that you verify the flow direction of the pump or valve in question. If you have further questions or comments related to this, please contact Bentley Support.
Warning messages related to the value of a particular attribute being outside the accepted range can often be corrected by adjusting the allowable range for that attribute.
The check data algorithm performs the following validations:
• Network Topology—Checks that the network contains at least one boundary node, one pipe, and one junction. These are the minimum network requirements. It also checks for fully connected pumps and valves and that every node is reach-able from a boundary node through open links.
• Element Validation—Checks that every element in the network is valid for the calculation. For example, this validation ensures that all pipes have a non-zero length, a non-zero diameter, a roughness value that is within the expected range, etc.
Detailed Calculation Summary Dialog BoxThe Detailed Calculation Summary dialog box provides a detailed reports of the calculations performed on your model. You can see this report by clicking Analysis > Calculation Summary.
Click the tabs in the Detailed Calculation Summary dialog box to review the details of the report:
• “Executive Summary Tab” on page 8-384
• “Calculation Options Tab” on page 8-385
• “Pressure Summary Tab” on page 8-391
• “Pipe Report Tab” on page 8-392
• “Node Report Tab” on page 8-392
Executive Summary Tab
The Executive Summary tab displays the following information:
8-384 Bentley SewerCAD V8i User’s Guide
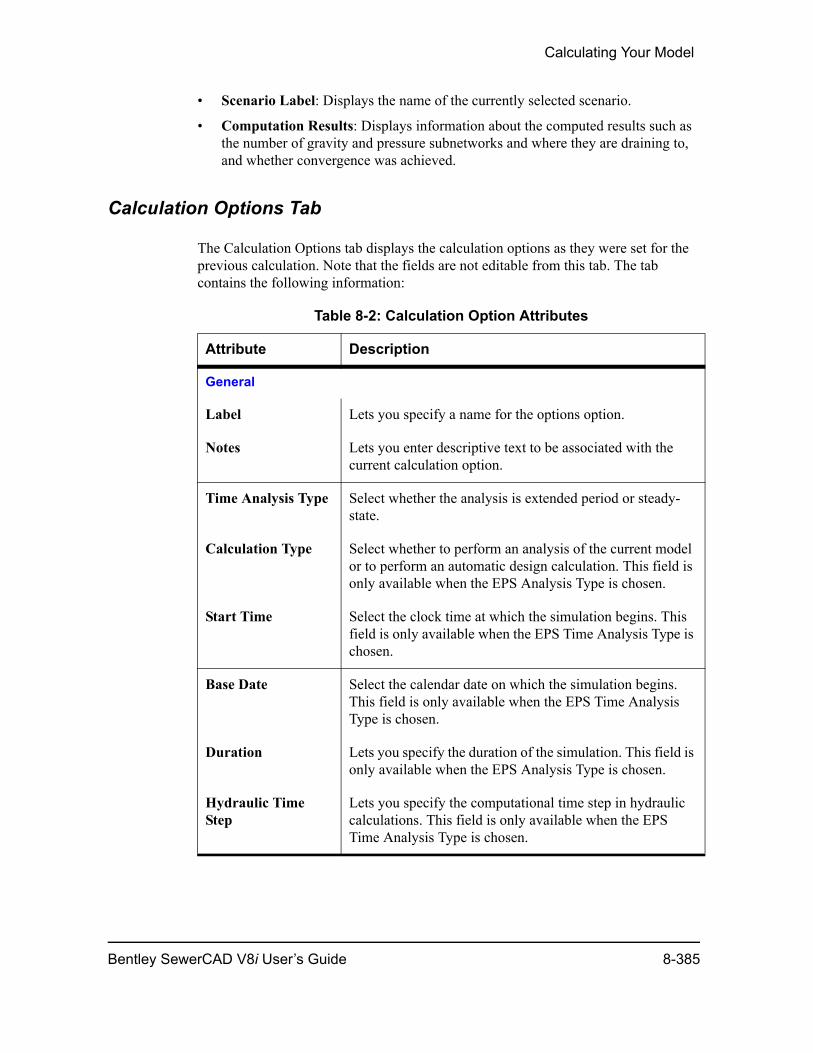
Calculating Your Model
• Scenario Label: Displays the name of the currently selected scenario.
• Computation Results: Displays information about the computed results such as the number of gravity and pressure subnetworks and where they are draining to, and whether convergence was achieved.
Calculation Options Tab
The Calculation Options tab displays the calculation options as they were set for the previous calculation. Note that the fields are not editable from this tab. The tab contains the following information:
Table 8-2: Calculation Option Attributes
Attribute Description
General
Label Lets you specify a name for the options option.
Notes Lets you enter descriptive text to be associated with the current calculation option.
Time Analysis Type Select whether the analysis is extended period or steady-state.
Calculation Type Select whether to perform an analysis of the current model or to perform an automatic design calculation. This field is only available when the EPS Analysis Type is chosen.
Start Time Select the clock time at which the simulation begins. This field is only available when the EPS Time Analysis Type is chosen.
Base Date Select the calendar date on which the simulation begins. This field is only available when the EPS Time Analysis Type is chosen.
Duration Lets you specify the duration of the simulation. This field is only available when the EPS Analysis Type is chosen.
Hydraulic Time Step
Lets you specify the computational time step in hydraulic calculations. This field is only available when the EPS Time Analysis Type is chosen.
Bentley SewerCAD V8i User’s Guide 8-385
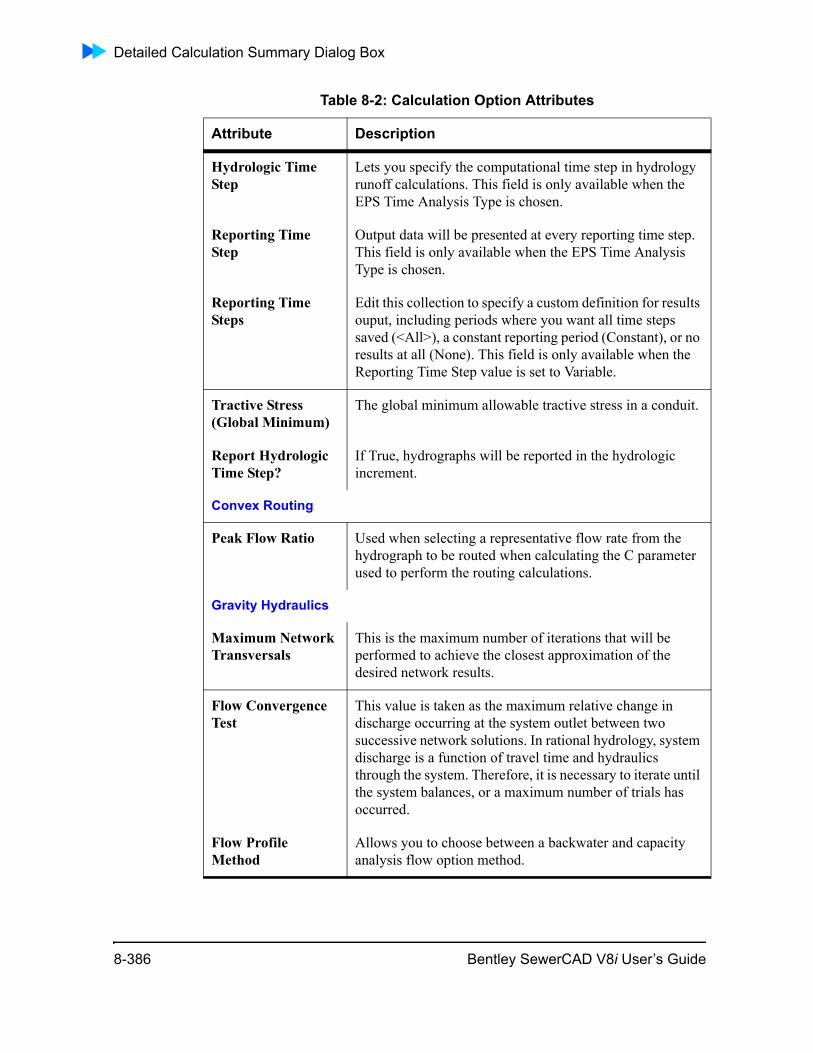
Detailed Calculation Summary Dialog Box
Hydrologic Time Step
Lets you specify the computational time step in hydrology runoff calculations. This field is only available when the EPS Time Analysis Type is chosen.
Reporting Time Step
Output data will be presented at every reporting time step. This field is only available when the EPS Time Analysis Type is chosen.
Reporting Time Steps
Edit this collection to specify a custom definition for results ouput, including periods where you want all time steps saved (<All>), a constant reporting period (Constant), or no results at all (None). This field is only available when the Reporting Time Step value is set to Variable.
Tractive Stress (Global Minimum)
The global minimum allowable tractive stress in a conduit.
Report Hydrologic Time Step?
If True, hydrographs will be reported in the hydrologic increment.
Convex Routing
Peak Flow Ratio Used when selecting a representative flow rate from the hydrograph to be routed when calculating the C parameter used to perform the routing calculations.
Gravity Hydraulics
Maximum Network Transversals
This is the maximum number of iterations that will be performed to achieve the closest approximation of the desired network results.
Flow Convergence Test
This value is taken as the maximum relative change in discharge occurring at the system outlet between two successive network solutions. In rational hydrology, system discharge is a function of travel time and hydraulics through the system. Therefore, it is necessary to iterate until the system balances, or a maximum number of trials has occurred.
Flow Profile Method
Allows you to choose between a backwater and capacity analysis flow option method.
Table 8-2: Calculation Option Attributes
Attribute Description
8-386 Bentley SewerCAD V8i User’s Guide
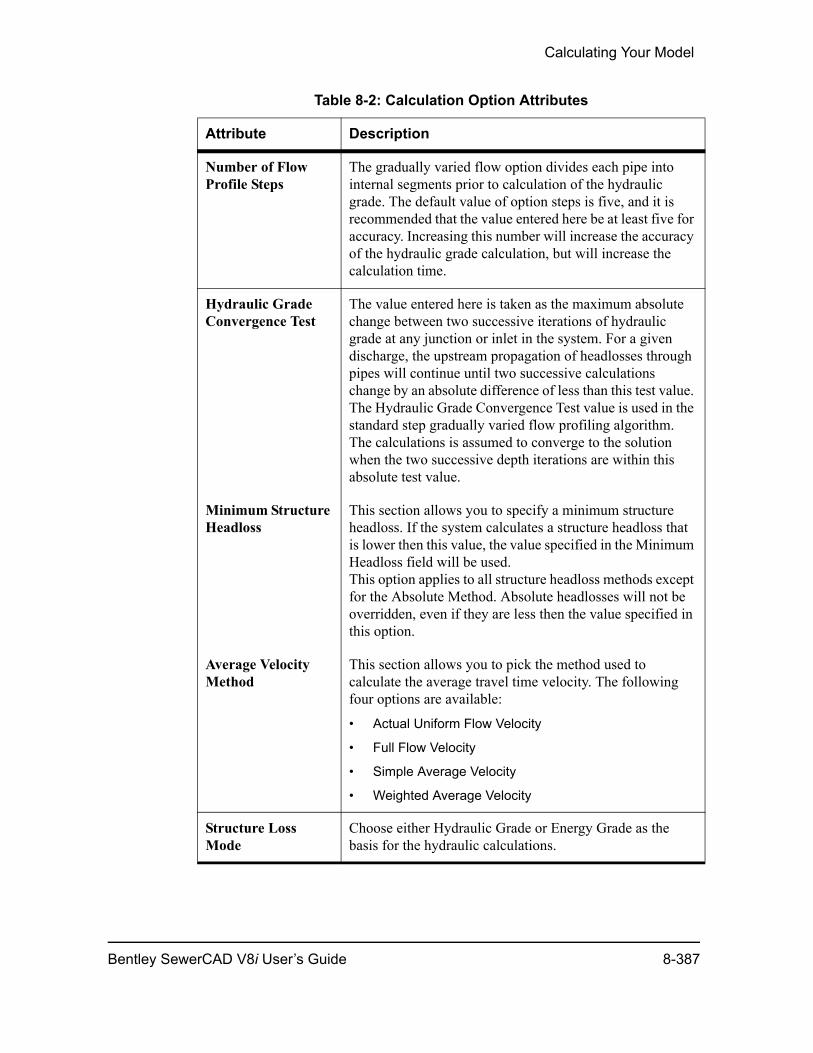
Calculating Your Model
Number of Flow Profile Steps
The gradually varied flow option divides each pipe into internal segments prior to calculation of the hydraulic grade. The default value of option steps is five, and it is recommended that the value entered here be at least five for accuracy. Increasing this number will increase the accuracy of the hydraulic grade calculation, but will increase the calculation time.
Hydraulic Grade Convergence Test
The value entered here is taken as the maximum absolute change between two successive iterations of hydraulic grade at any junction or inlet in the system. For a given discharge, the upstream propagation of headlosses through pipes will continue until two successive calculations change by an absolute difference of less than this test value. The Hydraulic Grade Convergence Test value is used in the standard step gradually varied flow profiling algorithm. The calculations is assumed to converge to the solution when the two successive depth iterations are within this absolute test value.
Minimum Structure Headloss
This section allows you to specify a minimum structure headloss. If the system calculates a structure headloss that is lower then this value, the value specified in the Minimum Headloss field will be used. This option applies to all structure headloss methods except for the Absolute Method. Absolute headlosses will not be overridden, even if they are less then the value specified in this option.
Average Velocity Method
This section allows you to pick the method used to calculate the average travel time velocity. The following four options are available:
• Actual Uniform Flow Velocity
• Full Flow Velocity
• Simple Average Velocity
• Weighted Average Velocity
Structure Loss Mode
Choose either Hydraulic Grade or Energy Grade as the basis for the hydraulic calculations.
Table 8-2: Calculation Option Attributes
Attribute Description
Bentley SewerCAD V8i User’s Guide 8-387
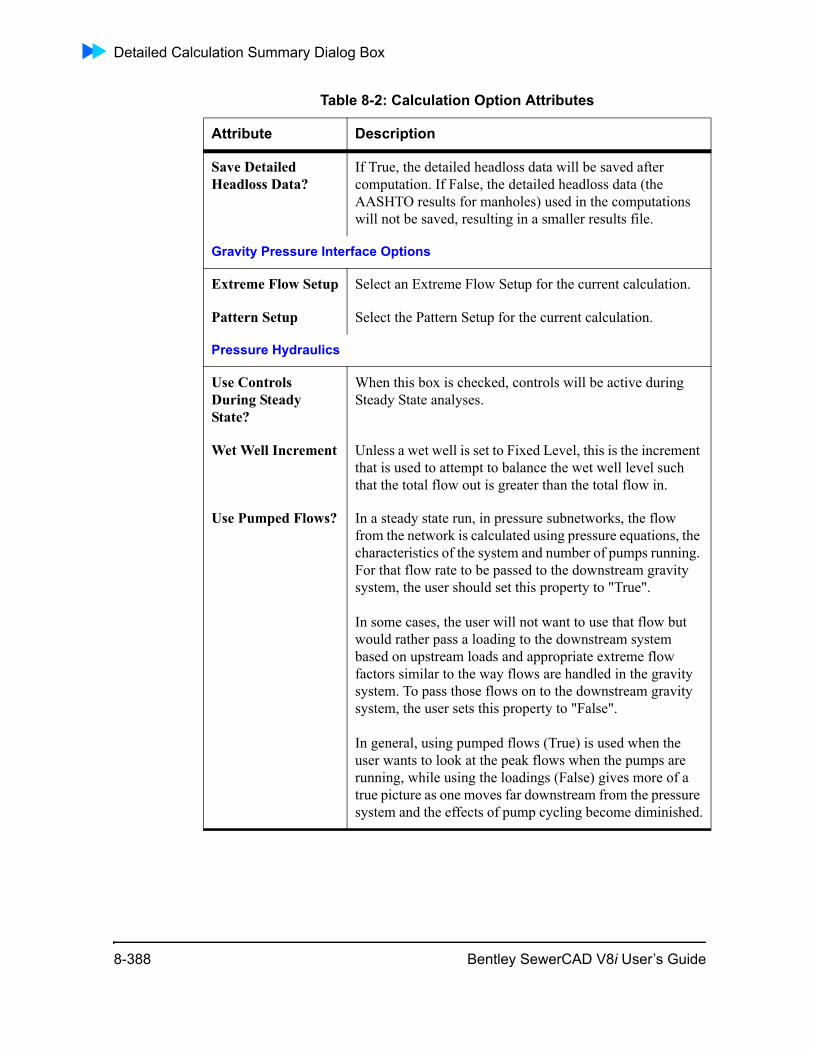
Detailed Calculation Summary Dialog Box
Save Detailed Headloss Data?
If True, the detailed headloss data will be saved after computation. If False, the detailed headloss data (the AASHTO results for manholes) used in the computations will not be saved, resulting in a smaller results file.
Gravity Pressure Interface Options
Extreme Flow Setup Select an Extreme Flow Setup for the current calculation.
Pattern Setup Select the Pattern Setup for the current calculation.
Pressure Hydraulics
Use Controls During Steady State?
When this box is checked, controls will be active during Steady State analyses.
Wet Well Increment Unless a wet well is set to Fixed Level, this is the increment that is used to attempt to balance the wet well level such that the total flow out is greater than the total flow in.
Use Pumped Flows? In a steady state run, in pressure subnetworks, the flow from the network is calculated using pressure equations, the characteristics of the system and number of pumps running. For that flow rate to be passed to the downstream gravity system, the user should set this property to "True".
In some cases, the user will not want to use that flow but would rather pass a loading to the downstream system based on upstream loads and appropriate extreme flow factors similar to the way flows are handled in the gravity system. To pass those flows on to the downstream gravity system, the user sets this property to "False".
In general, using pumped flows (True) is used when the user wants to look at the peak flows when the pumps are running, while using the loadings (False) gives more of a true picture as one moves far downstream from the pressure system and the effects of pump cycling become diminished.
Table 8-2: Calculation Option Attributes
Attribute Description
8-388 Bentley SewerCAD V8i User’s Guide
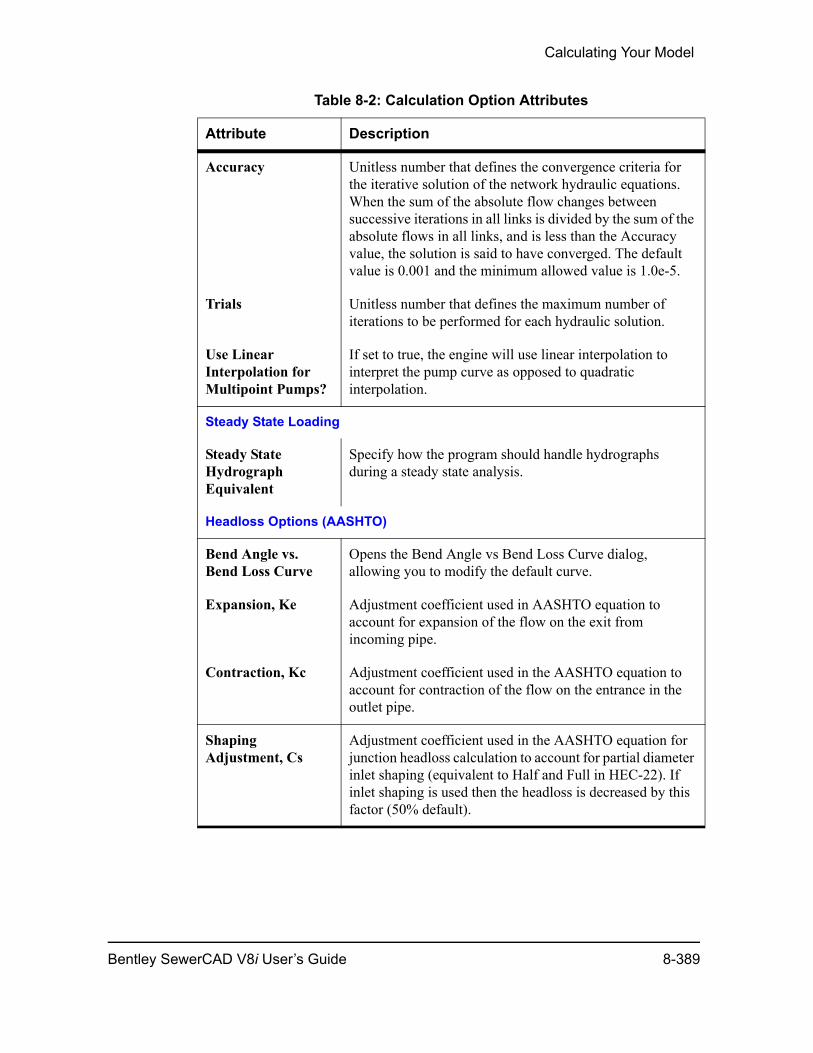
Calculating Your Model
Accuracy Unitless number that defines the convergence criteria for the iterative solution of the network hydraulic equations. When the sum of the absolute flow changes between successive iterations in all links is divided by the sum of the absolute flows in all links, and is less than the Accuracy value, the solution is said to have converged. The default value is 0.001 and the minimum allowed value is 1.0e-5.
Trials Unitless number that defines the maximum number of iterations to be performed for each hydraulic solution.
Use Linear Interpolation for Multipoint Pumps?
If set to true, the engine will use linear interpolation to interpret the pump curve as opposed to quadratic interpolation.
Steady State Loading
Steady State Hydrograph Equivalent
Specify how the program should handle hydrographs during a steady state analysis.
Headloss Options (AASHTO)
Bend Angle vs. Bend Loss Curve
Opens the Bend Angle vs Bend Loss Curve dialog, allowing you to modify the default curve.
Expansion, Ke Adjustment coefficient used in AASHTO equation to account for expansion of the flow on the exit from incoming pipe.
Contraction, Kc Adjustment coefficient used in the AASHTO equation to account for contraction of the flow on the entrance in the outlet pipe.
Shaping Adjustment, Cs
Adjustment coefficient used in the AASHTO equation for junction headloss calculation to account for partial diameter inlet shaping (equivalent to Half and Full in HEC-22). If inlet shaping is used then the headloss is decreased by this factor (50% default).
Table 8-2: Calculation Option Attributes
Attribute Description
Bentley SewerCAD V8i User’s Guide 8-389
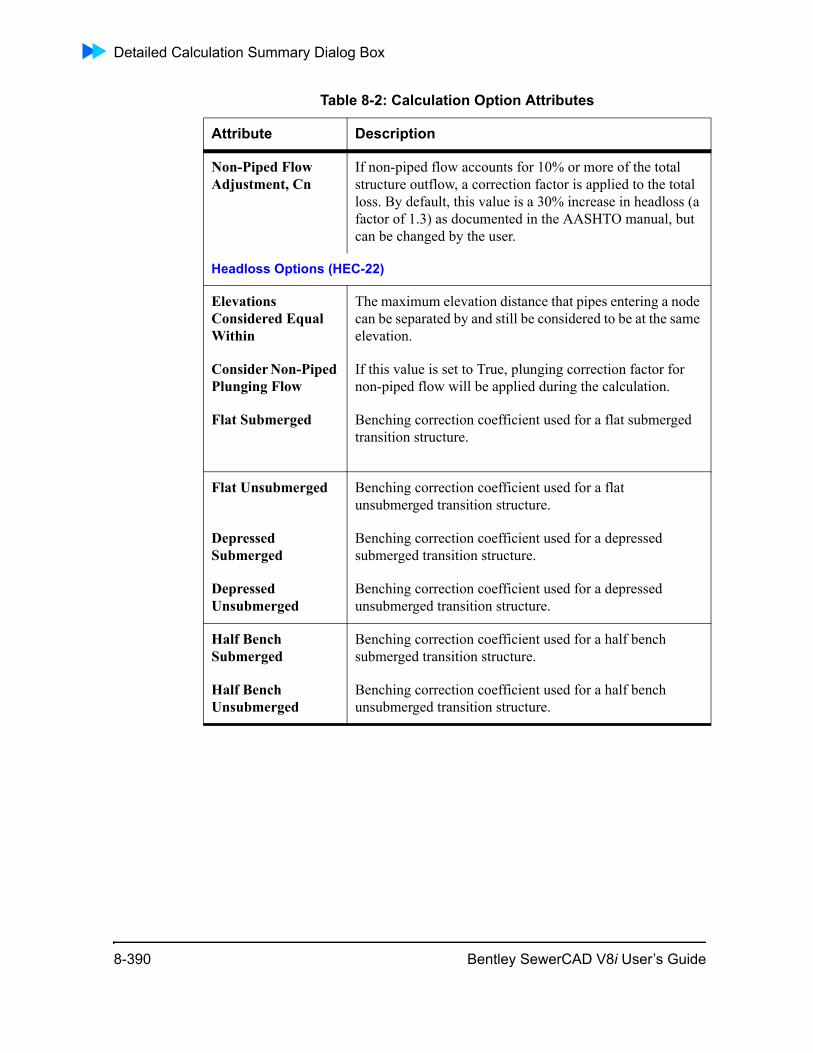
Detailed Calculation Summary Dialog Box
Non-Piped Flow Adjustment, Cn
If non-piped flow accounts for 10% or more of the total structure outflow, a correction factor is applied to the total loss. By default, this value is a 30% increase in headloss (a factor of 1.3) as documented in the AASHTO manual, but can be changed by the user.
Headloss Options (HEC-22)
Elevations Considered Equal Within
The maximum elevation distance that pipes entering a node can be separated by and still be considered to be at the same elevation.
Consider Non-Piped Plunging Flow
If this value is set to True, plunging correction factor for non-piped flow will be applied during the calculation.
Flat Submerged Benching correction coefficient used for a flat submerged transition structure.
Flat Unsubmerged Benching correction coefficient used for a flat unsubmerged transition structure.
Depressed Submerged
Benching correction coefficient used for a depressed submerged transition structure.
Depressed Unsubmerged
Benching correction coefficient used for a depressed unsubmerged transition structure.
Half Bench Submerged
Benching correction coefficient used for a half bench submerged transition structure.
Half Bench Unsubmerged
Benching correction coefficient used for a half bench unsubmerged transition structure.
Table 8-2: Calculation Option Attributes
Attribute Description
8-390 Bentley SewerCAD V8i User’s Guide
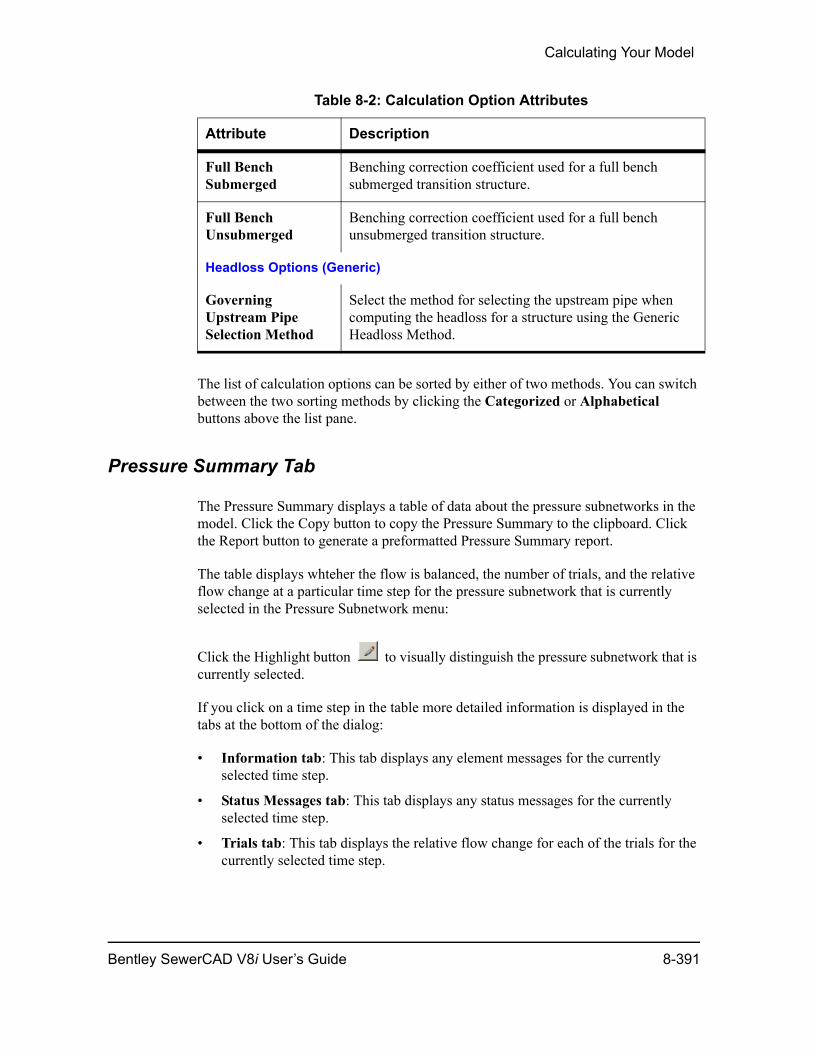
Calculating Your Model
The list of calculation options can be sorted by either of two methods. You can switch between the two sorting methods by clicking the Categorized or Alphabetical buttons above the list pane.
Pressure Summary Tab
The Pressure Summary displays a table of data about the pressure subnetworks in the model. Click the Copy button to copy the Pressure Summary to the clipboard. Click the Report button to generate a preformatted Pressure Summary report.
The table displays whteher the flow is balanced, the number of trials, and the relative flow change at a particular time step for the pressure subnetwork that is currently selected in the Pressure Subnetwork menu:
Click the Highlight button to visually distinguish the pressure subnetwork that is currently selected.
If you click on a time step in the table more detailed information is displayed in the tabs at the bottom of the dialog:
• Information tab: This tab displays any element messages for the currently selected time step.
• Status Messages tab: This tab displays any status messages for the currently selected time step.
• Trials tab: This tab displays the relative flow change for each of the trials for the currently selected time step.
Full Bench Submerged
Benching correction coefficient used for a full bench submerged transition structure.
Full Bench Unsubmerged
Benching correction coefficient used for a full bench unsubmerged transition structure.
Headloss Options (Generic)
Governing Upstream Pipe Selection Method
Select the method for selecting the upstream pipe when computing the headloss for a structure using the Generic Headloss Method.
Table 8-2: Calculation Option Attributes
Attribute Description
Bentley SewerCAD V8i User’s Guide 8-391
Detailed Calculation Summary Dialog Box
Pipe Report Tab
The Pipe Report displays information about selected calculated results of the pipes in the various subnetworks in the model in a tabular format. The table contains the following columns:
• Label: The label of the associated pipe.
• Time (Maximum Flow): The time (measured from the start of the simulation) when the maximum flow occurs in the associated pipe.
• Flow (Maximum): The maximum flow that occurs in the associated pipe over the course of the simulation.
• Velocity (Maximum Calculated): The maximum velocity that occurs in the asso-ciated pipe over the course of the simulation.
• Depth (Average End) / Rise (Maximum): The maximum ratio of depth to rise that occurs in the associated pipe over the course of the simulation.
The pipes listed in the column are categorized according to the subnetwork they are part of. To change the currently displayed subnetwork, choose another subnetwork from the Subnetwork pulldown menu.
Node Report Tab
The Node Report displays information about selected calculated results of the nodes in the various subnetworks in the model in a tabular format. The table contains the following columns:
• Label: The label of the associated node.
• Time (Maximum Hydraulic Grade Line): The time (measured from the start of the simulation) when the maximum hydraulic grade line occurs in the associated node.
• Hydraulic Grade Line (Maximum): The maximum hydraulic grade that occurs in the associated node over the course of the simulation.
• Depth (Maximum): The maximum outgoing depth that occurs in the associated node over the course of the simulation.
• Pressure (Maximum): The maximum pressure that occurs in the associated node over the course of the simulation.
The nodes listed in the column are categorized according to the subnetwork they are part of. To change the currently displayed subnetwork, choose another subnetwork from the Subnetwork pulldown menu.
8-392 Bentley SewerCAD V8i User’s Guide

Calculating Your Model
User NotificationsUser notifications are messages about your model. These messages can warn you about potential issues with your model, such as slopes that might be too steep or elements that slope in the wrong direction. These messages also point you to errors in your model that prevent Bentley SewerCAD V8i from solving your model.
To see user notifications:
1. Compute your model.
2. If needed, open the User Notification manager by clicking View > User Notifications (F8).
3. Or, if the calculation fails to compute because of an input error, when your model is finished computing, Bentley SewerCAD V8i prompts you to view user notifica-tions to validate the input data.
You must fix any errors identified by red circles before Bentley SewerCAD V8i can compute a result.
Errors identified by orange circles are warnings that do not prevent the computa-tion of the model.
4. In the User Notifications manager, if a notification pertains to a particular element, you can double-click the notification to magnify and display the element in the center of the drawing pane.
5. As needed, use the element label to identify the element that generates the error and use the user notification message to edit the element’s properties to resolve the error.
User Notifications Manager
The User Notifications Manager displays warnings and error messages that are turned up by Bentley SewerCAD V8i’s validation routines. If the notification references a particular element, you can zoom straight to that element by either double-clicking the notification, or right-clicking it and selecting the Zoom To command.
• Informational messages are denoted by a blue icon and do not prevent the model from calculating successfully.
• Warnings are denoted by a yellow icon and do not prevent the model from calculating successfully.
• Errors are denoted by a red icon, and the model will not successfully calcu-late if errors are found.
The User Notifications Manager consists of a toolbar and a tabular view containing a list of warnings and error messages. The toolbar consists of the following buttons:
Bentley SewerCAD V8i User’s Guide 8-393
User Notifications
The User Notification Manager displays warnings and error messages in a tabular view. The table includes the following columns:
Details Displays the User Notification Details dialog box, which includes information about any warning or error messages. For more information, see “User Notification Details Dialog Box” on page 8-395.
Save Saves the user notifications as a comma-delimited .csv file. You can open the .csv file in Microsoft Excel or Notepad.
Report Displays a User Notification Report.
Copy Copies the currently highlighted warning or error message to the Windows clipboard.
Zoom To If the warning or error message is related to a specific element in your model, click this button to center the element in question in the drawing pane.
Help Displays online help for the User Notification Manager.
Message ID This column displays the message ID associated with the corresponding message.
Scenario ID This column displays the scenario associated with the corresponding message. This column will display “Base” unless you ran a different scenario.
Element Type This column displays the element type associated with the corresponding message.
Element ID This column displays the element ID associated with the corresponding message.
Label If the notification is caused by a specific element, this column displays the label of the element associated with the corresponding message.
8-394 Bentley SewerCAD V8i User’s Guide
Calculating Your Model
User Notification Details Dialog Box
This dialog lists the elements that are referred to by a time-sensitive user notification message. In the User Notification dialog, there is a time column that displays the time-step during which time-sensitive messages occur. These messages will say “during this time-step” or “for this time-step”, and do not display information about the refer-enced element or elements. Double-clicking one of these messages in the User Notifi-cations dialog opens the User Notification Details dialog, which does provide information about the referenced element(s).
You can double-click messages in the User Notification Details dialog to zoom the drawing pane view to the referenced element.
Message This column displays the description associated with the corresponding message.
Time If the user notification occurred during a specific time step, this column displays the time step. Otherwise, this column is left blank.
Source This column displays the validation routine that triggered the corresponding message.
Bentley SewerCAD V8i User’s Guide 8-395

8-396 Bentley SewerCAD V8i User’s Guide
9
ChapterUsing Scenarios andAlternatives
Scenarios and alternatives let you create, analyze, and recall an unlimited number of variations of your model. In Bentley SewerCAD V8i powerful two-level design, scenarios contain alternatives to give you precise control over changes to the model.
Click one of the following links to learn more about using scenarios and alternatives:
• “Understanding Scenarios and Alternatives” on page 9-397
• “Scenario Example - Simple Water Distribution System” on page 9-407
• “Scenarios” on page 9-412
• “Running Multiple Scenarios at Once (Batch Runs)” on page 9-414
• “Alternatives” on page 9-417
• “Calculation Options” on page 9-452
Understanding Scenarios and AlternativesScenario management in Bentley SewerCAD V8i can dramatically increase your productivity in the "What If?" areas of modeling, including calibration, operations analysis, and planning.
If you’ve never used scenarios and alternatives before, we recommend reading all of the topics in this section to gain a complete understanding of how they work. By investing a little time now to understand management, you can avoid unnecessary editing and data duplication. Take advantage of scenario management to get a lot more out of your model, with much less work and expense.
Topics in this section include:
• “Advantages of Automated Scenario Management” on page 9-398
• “A History of What-If Analyses” on page 9-398
• “The Scenario Cycle” on page 9-400
• “Scenario Attributes and Alternatives” on page 9-402
Bentley SewerCAD V8i User’s Guide 9-397

Understanding Scenarios and Alternatives
• “A Familiar Parallel” on page 9-402
• “Inheritance” on page 9-403
• “Local and Inherited Values” on page 9-405
• “Minimizing Effort through Attribute Inheritance” on page 9-405
• “Minimizing Effort through Scenario Inheritance” on page 9-406
Advantages of Automated Scenario Management
In contrast to the old methods of scenario management (editing or copying data), auto-mated scenario management using inheritance gives you significant advantages:
• A single project file makes it possible to generate an unlimited number of "What If?" conditions without becoming overwhelmed with numerous modeling files and separate results.
• Because the software maintains the data for all the scenarios in a single project, it can provide you with powerful automated tools for directly comparing scenario results. Any set of results is immediately available at any time.
• The Scenario / Alternative relationship empowers you to mix and match groups of data from existing scenarios without having to re-declare any data.
• With inheritance, you do not have to re-enter data if it remains unchanged in a new alternative or scenario, avoiding redundant copies of the same data. Inherit-ance also enables you to correct a data input error in a parent scenario and auto-matically update the corrected attribute in all child scenarios.
These advantages, while obvious, may not seem compelling for small projects. It is as projects grow to hundreds or thousands of network elements that the advantages of true scenario inheritance become clear. On a large project, being able to maintain a collection of base and modified alternatives accurately and efficiently can be the difference between evaluating optional improvements and being forced to ignore them.
A History of What-If Analyses
The history of what-if analyses can be divided into two periods:
• “Before Haestad Methods - Distributed Scenarios” on page 9-398
• “With Haestad Methods: Self-Contained Scenarios” on page 9-400
Before Haestad Methods - Distributed Scenarios
Traditionally, there have only been two possible ways of analyzing the effects of change on a software model:
9-398 Bentley SewerCAD V8i User’s Guide
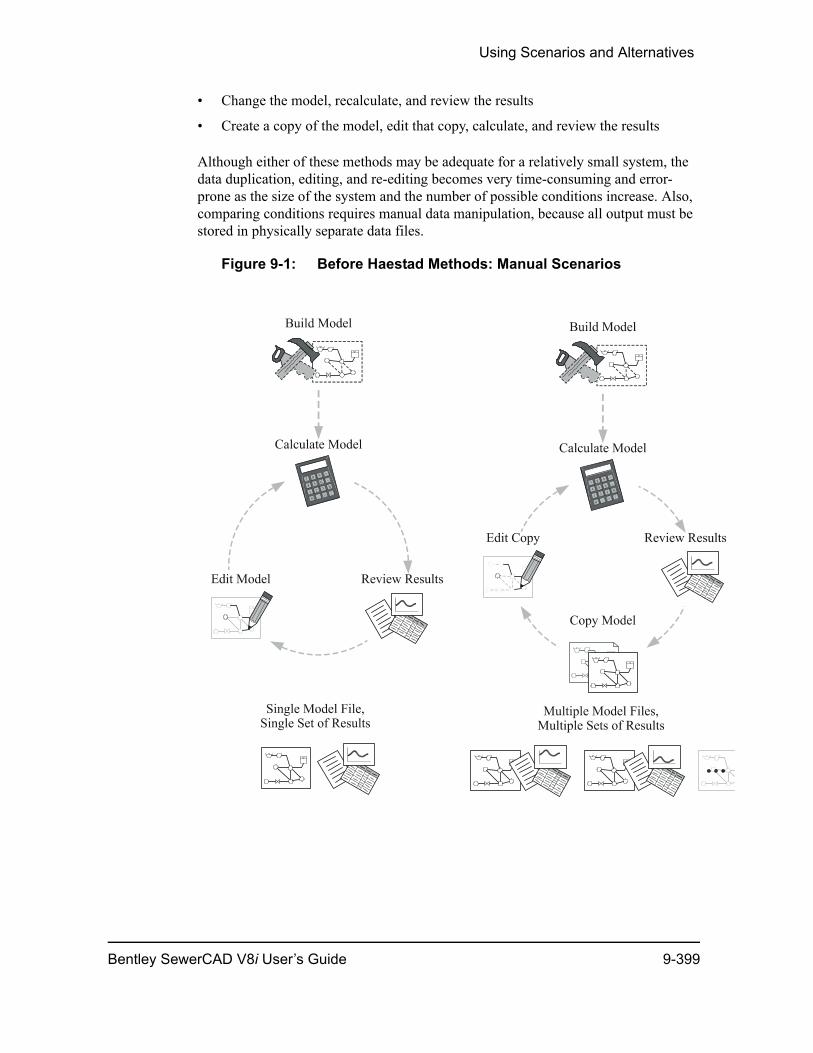
Using Scenarios and Alternatives
• Change the model, recalculate, and review the results
• Create a copy of the model, edit that copy, calculate, and review the results
Although either of these methods may be adequate for a relatively small system, the data duplication, editing, and re-editing becomes very time-consuming and error-prone as the size of the system and the number of possible conditions increase. Also, comparing conditions requires manual data manipulation, because all output must be stored in physically separate data files.
Figure 9-1: Before Haestad Methods: Manual Scenarios
Bentley SewerCAD V8i User’s Guide 9-399

Understanding Scenarios and Alternatives
With Haestad Methods: Self-Contained Scenarios
Effective scenario management tools need to meet these objectives:
• Minimize the number of project files the modeler needs to maintain (one, ideally).
• Maximize the usefulness of scenarios through easy access to things such as input and output data, and direct comparisons.
• Maximize the number of scenarios you can simulate by mixing and matching data from existing scenarios (data reuse)
• Minimize the amount of data that needs to be duplicated to consider conditions that have a lot in common
The scenario management feature in Bentley SewerCAD V8i successfully meets all of these objectives. A single project file enables you to generate an unlimited number of What If? conditions, edit only the data that needs to be changed, and quickly generate direct comparisons of input and results for desired scenarios.
The Scenario Cycle
The process of working with scenarios is similar to the process of manually copying and editing data, but without the disadvantages of data duplication and troublesome file management. This process lets you cycle through any number of changes to the model, without fear of overwriting critical data or duplicating important information. Of course, it is possible to directly change data for any scenario, but an audit trail of scenarios can be useful for retracing the steps of a calibration series or for under-standing a group of master plan updates.
Figure 9-2: Before Haestad Methods: Manual Scenarios
9-400 Bentley SewerCAD V8i User’s Guide
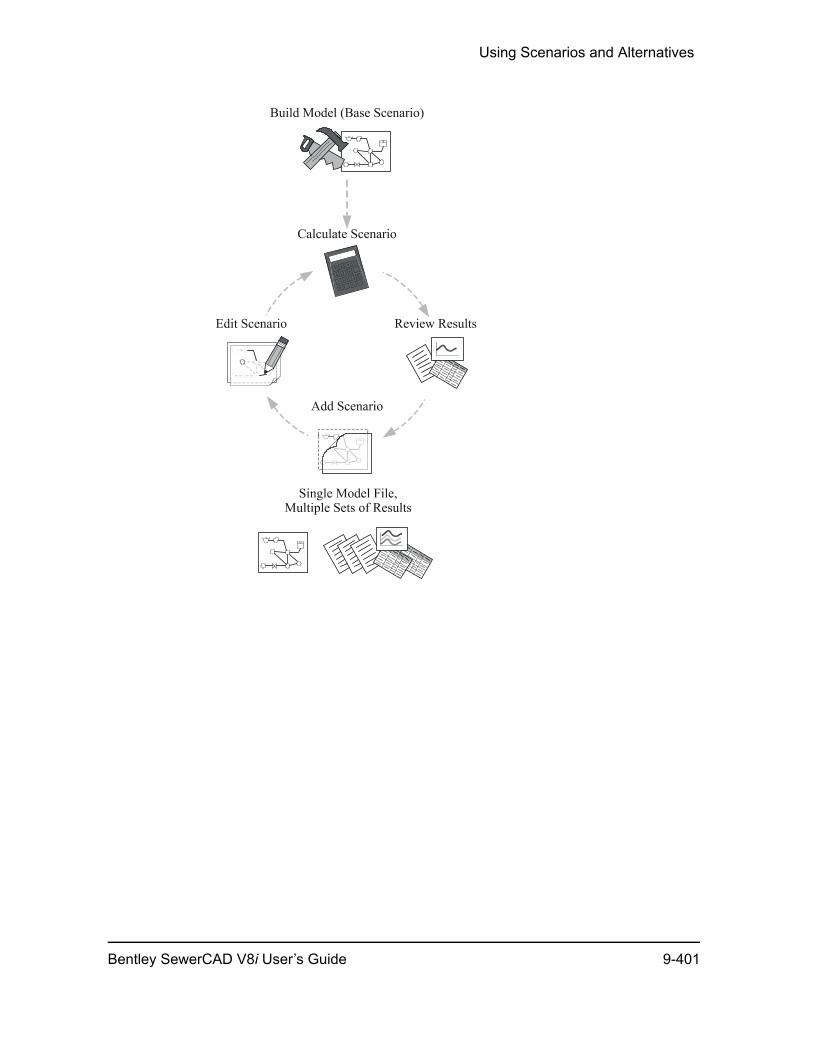
Using Scenarios and Alternatives
Bentley SewerCAD V8i User’s Guide 9-401
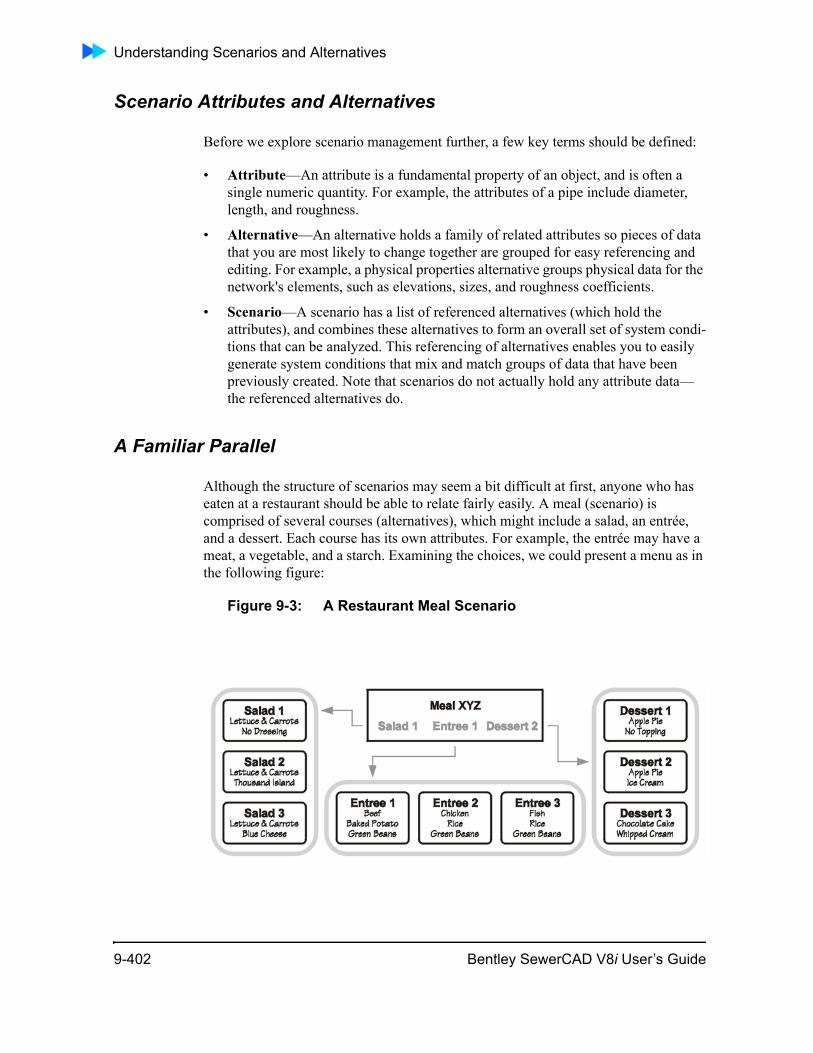
Understanding Scenarios and Alternatives
Scenario Attributes and Alternatives
Before we explore scenario management further, a few key terms should be defined:
• Attribute—An attribute is a fundamental property of an object, and is often a single numeric quantity. For example, the attributes of a pipe include diameter, length, and roughness.
• Alternative—An alternative holds a family of related attributes so pieces of data that you are most likely to change together are grouped for easy referencing and editing. For example, a physical properties alternative groups physical data for the network's elements, such as elevations, sizes, and roughness coefficients.
• Scenario—A scenario has a list of referenced alternatives (which hold the attributes), and combines these alternatives to form an overall set of system condi-tions that can be analyzed. This referencing of alternatives enables you to easily generate system conditions that mix and match groups of data that have been previously created. Note that scenarios do not actually hold any attribute data—the referenced alternatives do.
A Familiar Parallel
Although the structure of scenarios may seem a bit difficult at first, anyone who has eaten at a restaurant should be able to relate fairly easily. A meal (scenario) is comprised of several courses (alternatives), which might include a salad, an entrée, and a dessert. Each course has its own attributes. For example, the entrée may have a meat, a vegetable, and a starch. Examining the choices, we could present a menu as in the following figure:
Figure 9-3: A Restaurant Meal Scenario
9-402 Bentley SewerCAD V8i User’s Guide
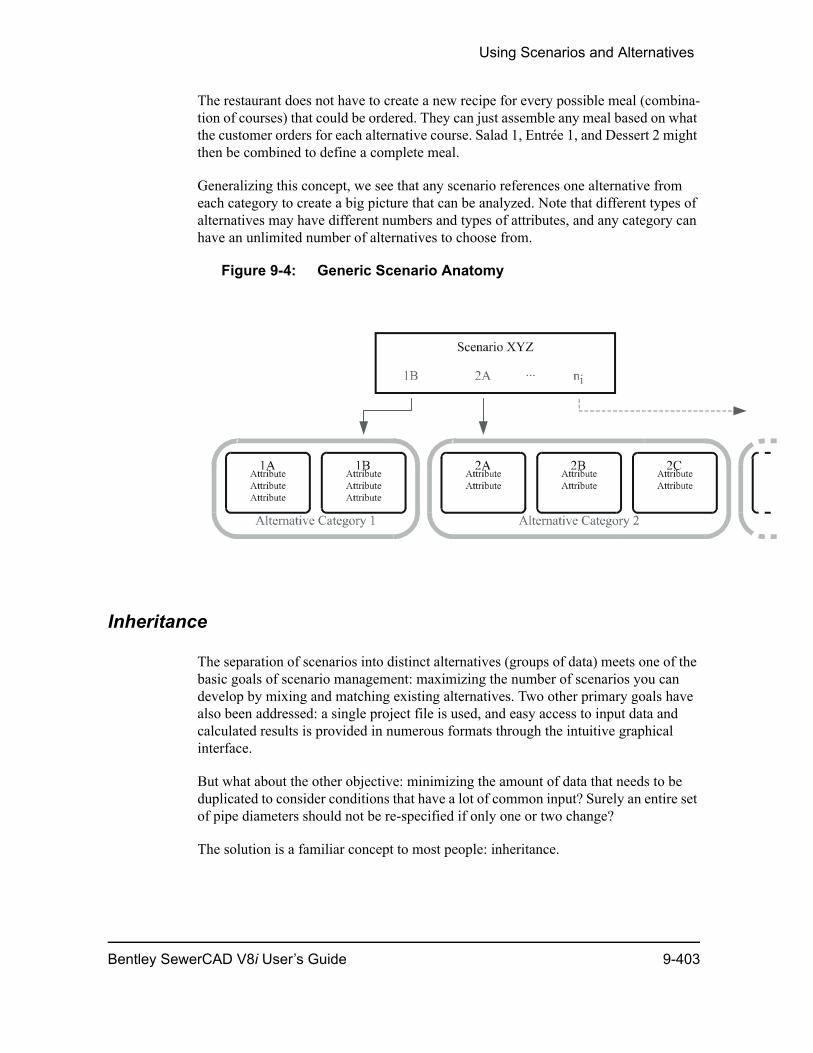
Using Scenarios and Alternatives
The restaurant does not have to create a new recipe for every possible meal (combina-tion of courses) that could be ordered. They can just assemble any meal based on what the customer orders for each alternative course. Salad 1, Entrée 1, and Dessert 2 might then be combined to define a complete meal.
Generalizing this concept, we see that any scenario references one alternative from each category to create a big picture that can be analyzed. Note that different types of alternatives may have different numbers and types of attributes, and any category can have an unlimited number of alternatives to choose from.
Figure 9-4: Generic Scenario Anatomy
Inheritance
The separation of scenarios into distinct alternatives (groups of data) meets one of the basic goals of scenario management: maximizing the number of scenarios you can develop by mixing and matching existing alternatives. Two other primary goals have also been addressed: a single project file is used, and easy access to input data and calculated results is provided in numerous formats through the intuitive graphical interface.
But what about the other objective: minimizing the amount of data that needs to be duplicated to consider conditions that have a lot of common input? Surely an entire set of pipe diameters should not be re-specified if only one or two change?
The solution is a familiar concept to most people: inheritance.
Bentley SewerCAD V8i User’s Guide 9-403
Understanding Scenarios and Alternatives
In the natural world, a child inherits characteristics from a parent. This may include such traits as eye-color, hair color, and bone structure. There are two significant differ-ences between the genetic inheritance that most of us know and the way inheritance is implemented in software:
• “Overriding Inheritance” on page 9-404
• “Dynamic Inheritance” on page 9-404
Overriding Inheritance
Overriding inheritance is the software equivalent of cosmetics. A child can override inherited characteristics at any time by specifying a new value for that characteristic. These overriding values do not affect the parent, and are therefore considered local to the child. Local values can also be removed at any time, reverting the characteristic to its inherited state. The child has no choice in the value of his inherited attributes, only in local attributes.
For example, suppose a child has inherited the attribute of blue eyes from his parent. Now the child puts on a pair of green- tinted contact lenses to hide his natural eye color. When the contact lenses are on, we say his natural eye color is overridden locally, and his eye color is green. When the child removes the tinted lenses, his eye color instantly reverts to blue, as inherited from his parent.
Dynamic Inheritance
Dynamic inheritance does not have a parallel in the genetic world. When a parent's characteristic is changed, existing children also reflect the change. Using the eye-color example, this would be the equivalent of the parent changing eye color from blue to brown, and the children's eyes instantly inheriting the brown color also. Of course, if the child has already overridden a characteristic locally, as with the green lenses, his eyes will remain green until the lenses are removed. At this point, his eye color will revert to the inherited color, now brown.
This dynamic inheritance has remarkable benefits for applying wide-scale changes to a model, fixing an error, and so on. If rippling changes are not desired, the child can override all of the parent's values, or a copy of the parent can be made instead of a child.
9-404 Bentley SewerCAD V8i User’s Guide
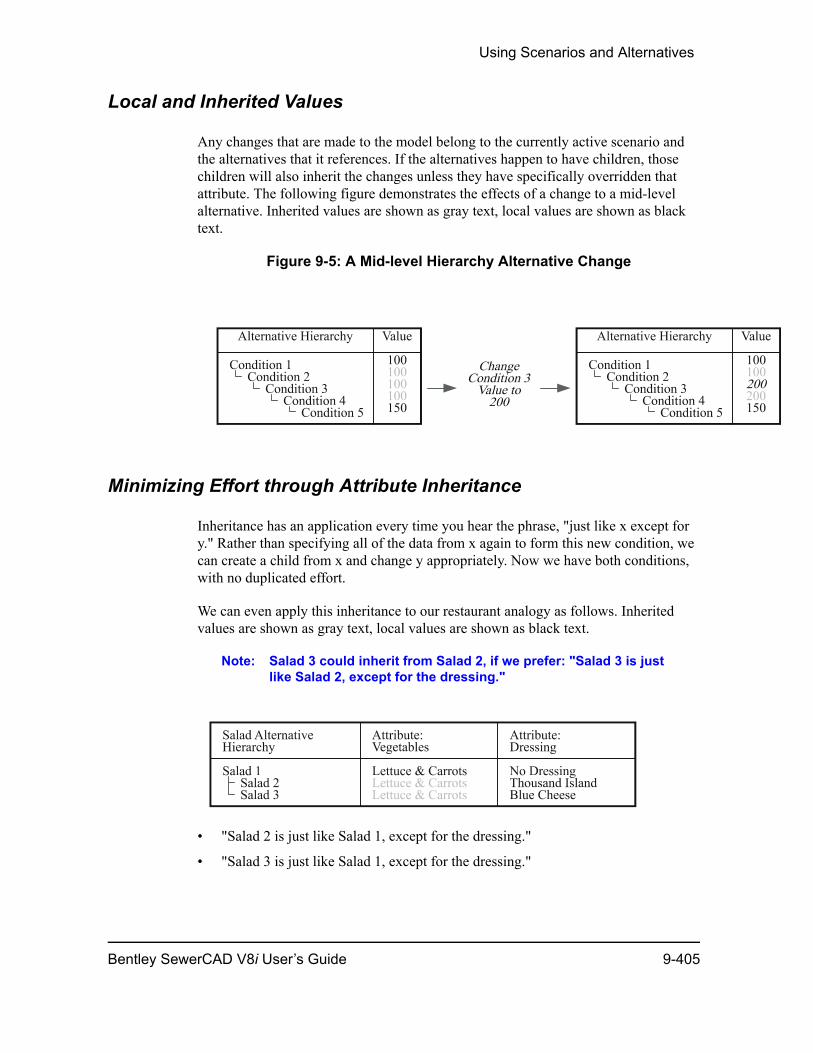
Using Scenarios and Alternatives
Local and Inherited Values
Any changes that are made to the model belong to the currently active scenario and the alternatives that it references. If the alternatives happen to have children, those children will also inherit the changes unless they have specifically overridden that attribute. The following figure demonstrates the effects of a change to a mid-level alternative. Inherited values are shown as gray text, local values are shown as black text.
Figure 9-5: A Mid-level Hierarchy Alternative Change
Minimizing Effort through Attribute Inheritance
Inheritance has an application every time you hear the phrase, "just like x except for y." Rather than specifying all of the data from x again to form this new condition, we can create a child from x and change y appropriately. Now we have both conditions, with no duplicated effort.
We can even apply this inheritance to our restaurant analogy as follows. Inherited values are shown as gray text, local values are shown as black text.
Note: Salad 3 could inherit from Salad 2, if we prefer: "Salad 3 is just like Salad 2, except for the dressing."
• "Salad 2 is just like Salad 1, except for the dressing."
• "Salad 3 is just like Salad 1, except for the dressing."
Bentley SewerCAD V8i User’s Guide 9-405
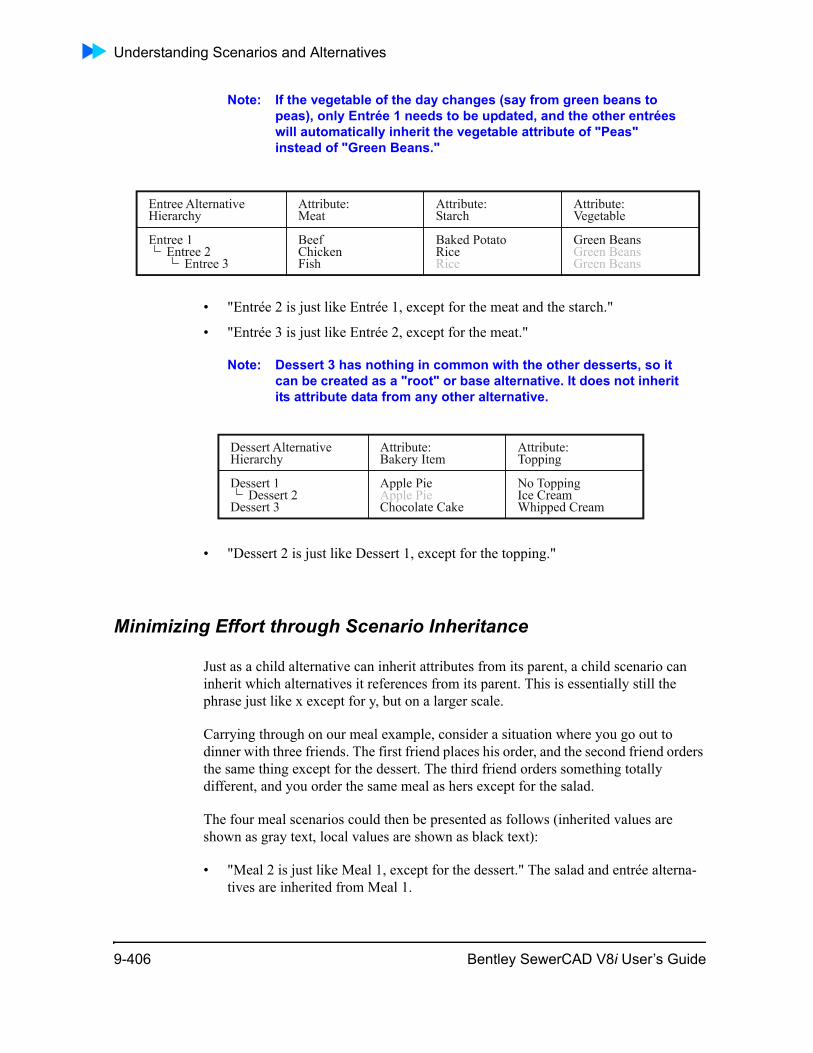
Understanding Scenarios and Alternatives
Note: If the vegetable of the day changes (say from green beans to peas), only Entrée 1 needs to be updated, and the other entrées will automatically inherit the vegetable attribute of "Peas" instead of "Green Beans."
• "Entrée 2 is just like Entrée 1, except for the meat and the starch."
• "Entrée 3 is just like Entrée 2, except for the meat."
Note: Dessert 3 has nothing in common with the other desserts, so it can be created as a "root" or base alternative. It does not inherit its attribute data from any other alternative.
• "Dessert 2 is just like Dessert 1, except for the topping."
Minimizing Effort through Scenario Inheritance
Just as a child alternative can inherit attributes from its parent, a child scenario can inherit which alternatives it references from its parent. This is essentially still the phrase just like x except for y, but on a larger scale.
Carrying through on our meal example, consider a situation where you go out to dinner with three friends. The first friend places his order, and the second friend orders the same thing except for the dessert. The third friend orders something totally different, and you order the same meal as hers except for the salad.
The four meal scenarios could then be presented as follows (inherited values are shown as gray text, local values are shown as black text):
• "Meal 2 is just like Meal 1, except for the dessert." The salad and entrée alterna-tives are inherited from Meal 1.
9-406 Bentley SewerCAD V8i User’s Guide
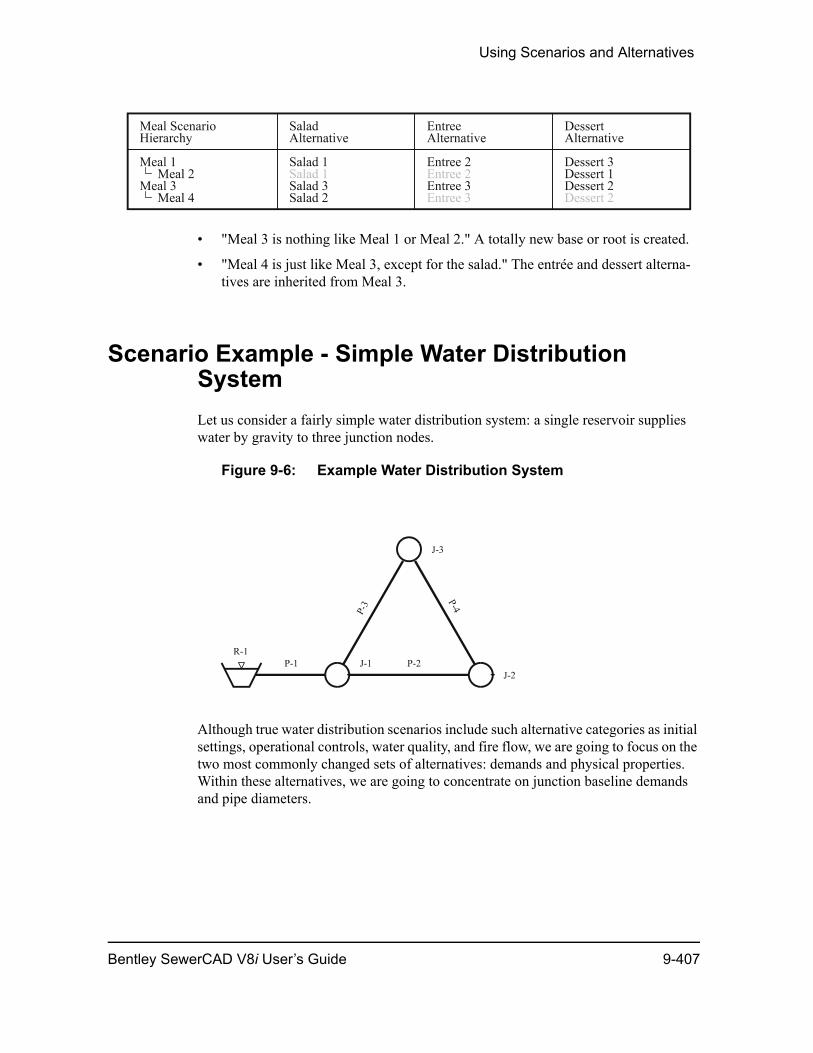
Using Scenarios and Alternatives
• "Meal 3 is nothing like Meal 1 or Meal 2." A totally new base or root is created.
• "Meal 4 is just like Meal 3, except for the salad." The entrée and dessert alterna-tives are inherited from Meal 3.
Scenario Example - Simple Water Distribution SystemLet us consider a fairly simple water distribution system: a single reservoir supplies water by gravity to three junction nodes.
Figure 9-6: Example Water Distribution System
Although true water distribution scenarios include such alternative categories as initial settings, operational controls, water quality, and fire flow, we are going to focus on the two most commonly changed sets of alternatives: demands and physical properties. Within these alternatives, we are going to concentrate on junction baseline demands and pipe diameters.
Bentley SewerCAD V8i User’s Guide 9-407
Scenario Example - Simple Water Distribution System
Building the Model (Average Day Conditions)
During model construction, probably only one alternative from each category is going to be considered. This model is built with average demand calculations and prelimi-nary pipe diameter estimates. At this point we can name our scenario and alternatives, and the hierarchies look like the following (showing only the items of interest):
Analyzing Different Demands (Maximum Day Conditions)
In our example, the local planning board also requires analysis of maximum day demands, so a new demand alternative is required. No variation in demand is expected at J-2, which is an industrial site. As a result, the new demand alternative can inherit J-2’s demand from Average Day while the other two demands are overridden.
Now we can create a child scenario from Average Day that inherits the physical alter-native, but overrides the selected demand alternative. As a result, we get the following scenario hierarchy:
9-408 Bentley SewerCAD V8i User’s Guide
Using Scenarios and Alternatives
Since no physical data (pipe diameters) have been changed, the physical alternative hierarchy remains the same as before.
Another Set of Demands (Peak Hour Conditions)
Based on pressure requirements, the system is adequate to supply maximum day demands. Another local regulation requires analysis of peak hour demands, with slightly lower allowable pressures. Since the peak hour demands also share the indus-trial load from the Average Day condition, Peak Hour can be inherited from Average Day. In this instance, Peak Hour could inherit just as easily from Maximum Day.
Another scenario is also created to reference these new demands, as shown below:
Note again that we did not change any physical data, so the physical alternatives remain the same.
Correcting an Error
This analysis results in acceptable pressures, until it is discovered that the industrial demand is not actually 500 gpm—it is 1,500 gpm. Because of the inheritance within the demand alternatives, however, only the Average Day demand for J-2 needs to be updated. The changes ripple through to the children. After the single change is made, the demand hierarchy is as follows:
Notice that no changes need to be made to the scenarios to reflect these corrections. The three scenarios can now be calculated as a batch to update the results.
Bentley SewerCAD V8i User’s Guide 9-409
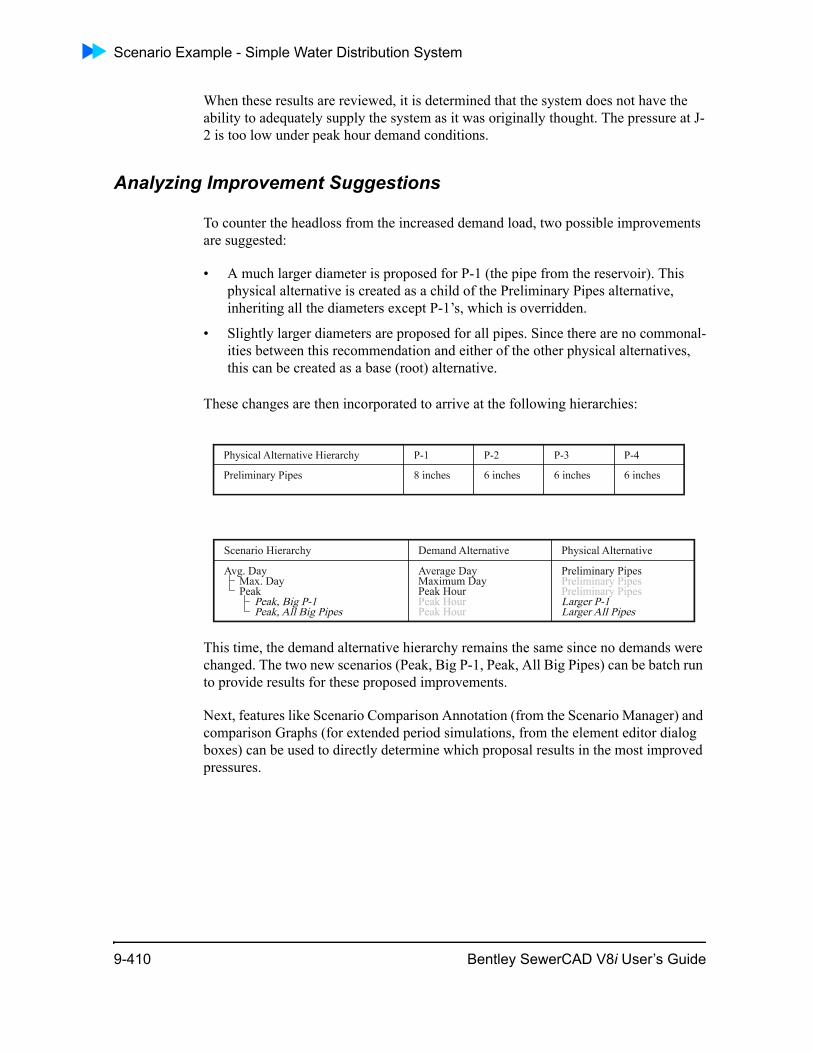
Scenario Example - Simple Water Distribution System
When these results are reviewed, it is determined that the system does not have the ability to adequately supply the system as it was originally thought. The pressure at J-2 is too low under peak hour demand conditions.
Analyzing Improvement Suggestions
To counter the headloss from the increased demand load, two possible improvements are suggested:
• A much larger diameter is proposed for P-1 (the pipe from the reservoir). This physical alternative is created as a child of the Preliminary Pipes alternative, inheriting all the diameters except P-1’s, which is overridden.
• Slightly larger diameters are proposed for all pipes. Since there are no commonal-ities between this recommendation and either of the other physical alternatives, this can be created as a base (root) alternative.
These changes are then incorporated to arrive at the following hierarchies:
This time, the demand alternative hierarchy remains the same since no demands were changed. The two new scenarios (Peak, Big P-1, Peak, All Big Pipes) can be batch run to provide results for these proposed improvements.
Next, features like Scenario Comparison Annotation (from the Scenario Manager) and comparison Graphs (for extended period simulations, from the element editor dialog boxes) can be used to directly determine which proposal results in the most improved pressures.
9-410 Bentley SewerCAD V8i User’s Guide
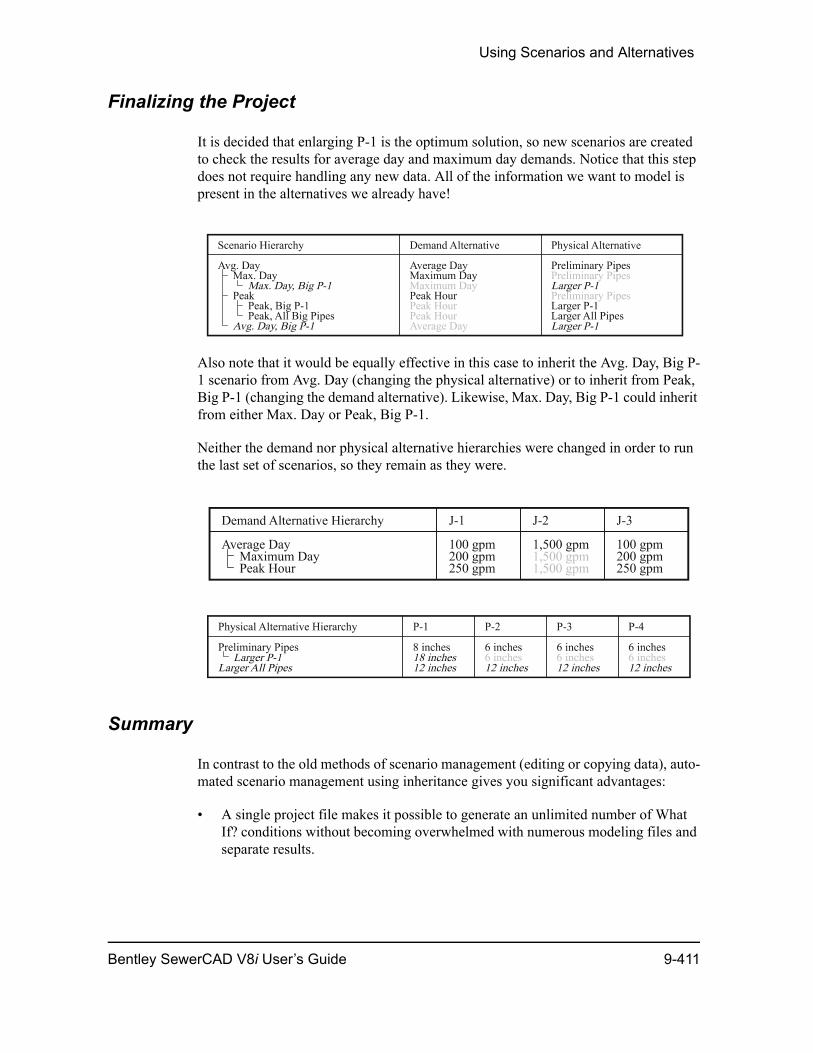
Using Scenarios and Alternatives
Finalizing the Project
It is decided that enlarging P-1 is the optimum solution, so new scenarios are created to check the results for average day and maximum day demands. Notice that this step does not require handling any new data. All of the information we want to model is present in the alternatives we already have!
Also note that it would be equally effective in this case to inherit the Avg. Day, Big P-1 scenario from Avg. Day (changing the physical alternative) or to inherit from Peak, Big P-1 (changing the demand alternative). Likewise, Max. Day, Big P-1 could inherit from either Max. Day or Peak, Big P-1.
Neither the demand nor physical alternative hierarchies were changed in order to run the last set of scenarios, so they remain as they were.
Summary
In contrast to the old methods of scenario management (editing or copying data), auto-mated scenario management using inheritance gives you significant advantages:
• A single project file makes it possible to generate an unlimited number of What If? conditions without becoming overwhelmed with numerous modeling files and separate results.
Bentley SewerCAD V8i User’s Guide 9-411
Scenarios
• Because the software maintains the data for all the scenarios in a single project, it can provide you with powerful automated tools for directly comparing scenario results. Any set of results is immediately available at any time.
• The Scenario / Alternative relationship empowers you to mix and match groups of data from existing scenarios without having to re-declare any data.
• With inheritance, you do not have to re-enter data if it remains unchanged in a new alternative or scenario, avoiding redundant copies of the same data. Inherit-ance also enables you to correct a data input error in a parent scenario and auto-matically update the corrected attribute in all child scenarios.
These advantages, while obvious, may not seem compelling for small projects. It is as projects grow to hundreds or thousands of network elements that the advantages of true scenario inheritance become clear. On a large project, being able to maintain a collection of base and modified alternatives accurately and efficiently can be the difference between evaluating optional improvements and being forced to ignore them.
To learn more about actually using scenario management in our software, start by running the scenario management tutorial from the Help menu or from within the scenario manager itself. Then load one of the SAMPLE projects and explore the scenarios defined there. For context-sensitive help, press F1 or the Help button any time there is a screen or field that puzzles you.
ScenariosA Scenario contains all the input data (in the form of Alternatives), calculation options, results, and notes associated with a set of calculations. Scenarios let you set up an unlimited number of “What If?” situations for your model, and then modify, compute, and review your system under those conditions.
You can create scenarios that reuse or share data in existing alternatives, submit multiple scenarios for calculation in a batch run, switch between scenarios, and compare scenario results—all with a few mouse clicks. There is no limit to the number of scenarios that you can create.
Click one of the following links to learn more about creating scenarios:
• “Base and Child Scenarios” on page 9-413
• “Creating Scenarios” on page 9-413
• “Editing Scenarios” on page 9-413
• “Scenario Manager” on page 9-415
9-412 Bentley SewerCAD V8i User’s Guide
Using Scenarios and Alternatives
Base and Child Scenarios
Note: The calculation options are not inherited between scenarios, but are duplicated when the scenario is first created. The alternatives and data records, however, are inherited. There is a permanent, dynamic link from a child back to its parent.
There are two types of scenarios:
• Base Scenarios—Contain all of your working data. When you start a new project, you begin with a default base scenario. As you enter data and calculate your model, you are working with this default base scenario and the alternatives it references.
• Child Scenarios—Inherit data from a base scenario, or other child scenarios. Child scenarios allow you to freely change data for one or more elements in your system. Child scenarios can reflect some or all of the values contained in their parent. This is a very powerful concept, giving you the ability to make changes in a parent scenario that will trickle down through child scenarios, while also giving you the ability to override values for some or all of the elements in child scenarios.
Creating Scenarios
You create new scenarios in the Scenario Manager. A new scenario can be a Base scenario or a Child scenario. For information about the differences between the two types of scenarios, see “Base and Child Scenarios” on page 9-413.
To create a new scenario:
1. Select View > Scenarios to open the Scenario Manager, or click the Scenario Manager tab.
2. Click the New button and select whether you want to create a Base scenario or a Child Scenario. When creating a Child scenario, you must first highlight the scenario from which the child is derived in the Scenario Manager tree view.
By default, a new scenario comprises the Base Alternatives associated with each alternative type.
3. Double-click the new scenario to edit its properties in the Property Editor.
Editing Scenarios
You edit scenarios in two places in Bentley SewerCAD V8i:
Bentley SewerCAD V8i User’s Guide 9-413
Scenarios
• The Scenario Manager lists all of the project’s scenarios in a hierarchical tree format, and displays the Base/Child relationship between them.
• The Property Editor displays the alternatives that make up the scenario that is currently highlighted in the Scenario Manager, along with the scenario label, any notes associated with the scenario, and the calculation options profile that is used when the scenario is calculated.
To edit a scenario:
1. Select View > Scenarios to open the Scenario Manager, or click the Scenario Manager tab.
2. Double-click the scenario you want to edit to display its properties in the Property Editor.
3. Edit any of the following properties as desired:
– Scenario label - This is the same operation as renaming the scenario in the Scenario Manager.
– Notes - Add any notes or comments in the Notes field
– Alternatives
– Calculation Options
Running Multiple Scenarios at Once (Batch Runs)
Performing a batch run lets you set up and run calculations for multiple scenarios at once. This is helpful if you want to queue a large number of calculations, or manage a group of smaller calculations as a set. The list of selected scenarios for the batch run remain with your project until you change it.
To perform a batch run:
1. Selecting View > Scenarios to open the Scenario Manager, or click the Scenario Manager tab.
2. Click the Compute Current Scenario button, then select Batch Run from the shortcut menu.
The Batch Run Editor dialog box appears.
3. Check the scenarios you want to run, then click the Batch button. Each scenario is calculated. You can cancel the batch run between any scenario calculation. The selected scenarios run consecutively.
9-414 Bentley SewerCAD V8i User’s Guide
Using Scenarios and Alternatives
When the batch run is completed, the scenario that was current stays current, even if it was not calculated.
4. Select a calculated scenario from the Scenario toolbar drop-down list to see the results throughout the program.
Batch Run Editor Dialog Box
The Batch Run Editor dialog box contains the following controls:
Scenario Manager
The Scenario Manager lets you create, edit, and manage scenarios. There is one built-in default scenario—the Base scenario. If you wish, you only have to use this one scenario. However, you can save yourself time by creating additional scenarios that reference the alternatives needed to perform and recall the results of each of your calculations. There is no limit to the number of scenarios that you can create.
Note: When you delete a scenario, you are not losing data records because scenarios never actually hold calculation data records (alternatives do). The alternatives and data records referenced by that scenario exist until you explicitly delete them. By accessing the Alternative Manager, you can delete the referenced alternatives and data records.
The Scenario Manager consists of a hierarchical tree view and a toolbar.
Scenario List Displays a list of all current scenarios. Click the check box next to the scenarios you want to run in batch mode.
Batch Starts the batch run of the selected scenarios.
Select Displays a drop-down menu containing the following commands:
• Select All - Selects all scenarios listed.
• Clear Selection - Clears all selected scenarios.
Close Closes the Batch Run Editor dialog box.
Help Displays context-sensitive help for the Batch Run Editor dialog box.
Bentley SewerCAD V8i User’s Guide 9-415
Scenarios
The tree view displays all of the scenarios in the project. If the Property Editor is open, highlighting a scenario in the list causes the alternatives that make up the scenario appear there. If the Property Editor is not open, you can display the alternatives and scenario information by highlighting the desired scenario and clicking the Properties button in the Scenario Manager.
The toolbar contains the following controls:
New Scenario Opens a submenu containing the following commands:
• Child Scenario—Lets you create a new Child scenario from the currently highlighted Base scenario.
• Base Scenario—Lets you create a new Base scenario.
Delete Removes the currently selected scenario.
Rename Lets you rename the currently selected scenario.
Go Opens a submenu containing the following commands:
• Scenario—Lets you calculate the currently highlighted scenario.
• Hierarchy—Lets you calculate the entire currently highlighted branch—the Base scenario and all Child scenarios currently associated with it.
• Children—Lets you calculate all of the Child scenarios associated with the currently highlighted scenario.
• Batch Run—Lets you run a user-defined group of scenarios at once.
Make Current Causes the currently selected scenario to become the active one, and to be displayed in the drawing pane.
Help Displays online help for the Alternative Manager.
9-416 Bentley SewerCAD V8i User’s Guide
Using Scenarios and Alternatives
AlternativesAlternatives are the building blocks behind scenarios (for more information, see “Scenarios” on page 9-412). They are categorized data sets that create scenarios when placed together. Alternatives hold the input data in the form of records. A record holds the data for a particular element in your system.
Scenarios are composed of alternatives, as well as other calculation options (see “Calculation Options Manager” on page 8-373), allowing you to compute and compare the results of various changes to your system. Alternatives can vary indepen-dently within scenarios, and can be shared between scenarios.
Scenarios allow you to specify the alternatives you wish to analyze. In combination with scenarios, you can perform calculations on your system to see what effect each alternative has. Once you have determined an alternative that works best for your system, you can permanently merge changes from the preferred alternative to the base alternative if you wish.
When you first set up your system, the data that you enter is stored in the various base alternative types. If you wish to see how your system behaves, for example, by increasing the diameter of a few select pipes, you can create a child alternative to accomplish that. You can make another child alternative with even larger diameters, and another with smaller diameters. There is no limit to the number of alternatives that you can create.
Click one of the following links to learn more about creating and editing alternatives:
• “Base and Child Alternatives” on page 9-418
• “Creating Alternatives” on page 9-418
• “Editing Alternatives” on page 9-419
• “Alternative Manager” on page 9-419
Types of Alternatives
The exact properties of each alternative are discussed in their respective sections. By breaking up alternatives into these different types, we give you the ability to mix different alternatives any way that you want within any given scenario.
Bentley SewerCAD V8i includes these types of alternatives:
• “Active Topology Alternative” on page 9-421
• “Physical Alternatives” on page 9-424
• “Design Alternative” on page 9-440
Bentley SewerCAD V8i User’s Guide 9-417
Alternatives
• “Headloss Alternative” on page 9-443
• “Boundary Condition Alternatives” on page 9-444
• “Initial Settings Alternative” on page 9-445
• “Sanitary Loading Alternative” on page 9-447
• “Infiltration and Inflow Alternatives” on page 9-449
• “System Flows Alternative” on page 9-451
• “Operational Alternative” on page 9-452
• “User Data Extensions Alternative” on page 9-452
Base and Child Alternatives
There are two kinds of alternatives: Base alternatives and Child alternatives. Base alternatives contain local data for all elements in your system. Child alternatives inherit data from base alternatives, or even other child alternatives, and contain data for one or more elements in your system. The data within an alternative consists of data inherited from its parent, and the data altered specifically by you (local data).
Remember that all data inherited from the base alternative are changed when the base alternative changes. Only local data specific to a child alternative remain unchanged.
Creating Alternatives
New alternatives are created in the Alternative Manager dialog box. A new alternative can be a Base scenario or a Child scenario. Each alternative type contains a Base alter-native in the Alternative Manager tree view.
Note: For information regarding the differences between the two types of alternatives, see “Base and Child Alternatives” on page 9-418.
To create a new Alternative:
1. Select View > Alternatives to open the Alternative Manager, or click the Alterna-tive Manager tab.
2. To create a new Base alternative, highlight the type of alternative you want to create, then click the New button.
3. To create a new Child alternative, right-click the Base alternative from which the child will be derived, then select New > Child Alternative from the submenu.
4. Double-click the new alternative to edit its properties in the Alternative Editor.
9-418 Bentley SewerCAD V8i User’s Guide
Using Scenarios and Alternatives
Editing Alternatives
You edit the properties of an alternative in its own alternative editor. The first column in an alternative editor contains check boxes, which indicate the records that have been changed in this alternative.
• If the box is checked, the record on that line has been modified and the data is local, or specific, to this alternative.
• If the box is not checked, it means that the record on that line is inherited from its higher-level parent alternative. Inherited records are dynamic. If the record is changed in the parent, the change is reflected in the child. The records on these rows reflect the corresponding values in the alternative’s parent.
To edit an existing alternative, you can use one of two methods:
• Double-click the alternative to be edited in the Alternative Manager.
or
• Highlight the alternative to be edited in the Alternative Manager and click the Properties button.
In either case, the Alternative Editor dialog box for the specified alternative appears, allowing you to view and define settings as desired.
Alternative Manager
The Alternative Manager lets you create, view, and edit the alternatives that make up the project scenarios. The dialog box consists of a pane that displays folders for each of the alternative types which can be expanded to display all of the alternatives for that type, and a toolbar.
The toolbar consists of the following buttons:
Bentley SewerCAD V8i User’s Guide 9-419
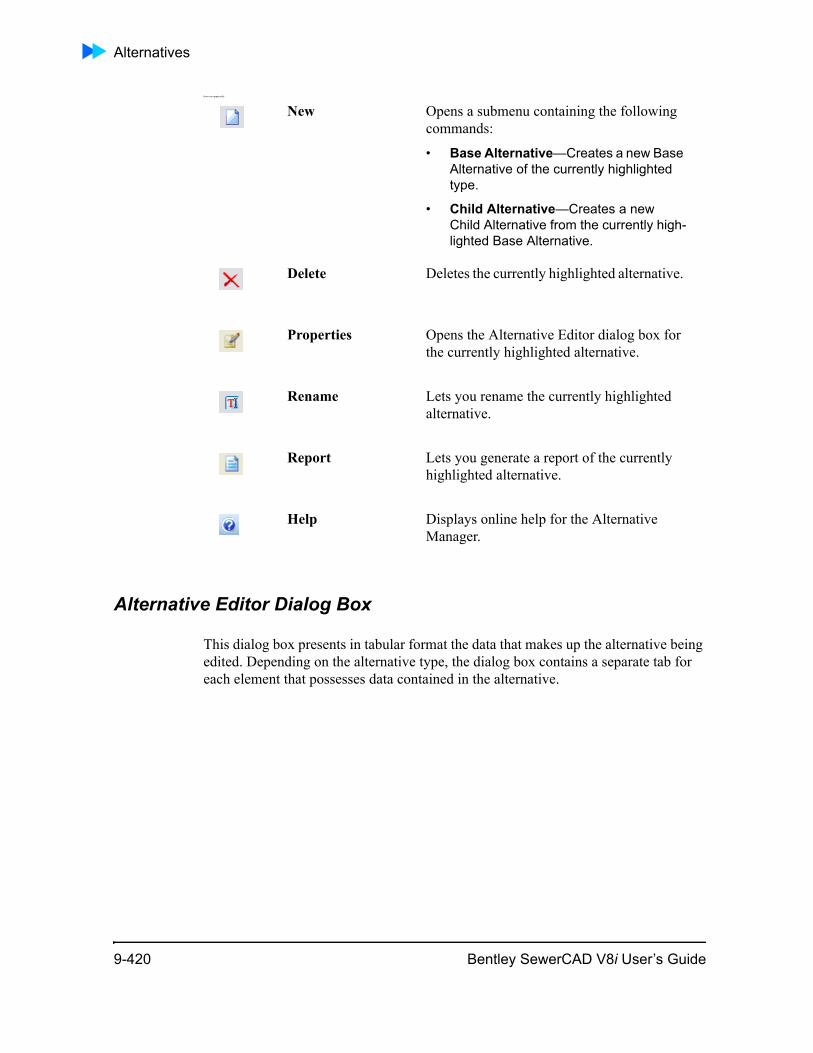
Alternatives
from ion apparently
Alternative Editor Dialog Box
This dialog box presents in tabular format the data that makes up the alternative being edited. Depending on the alternative type, the dialog box contains a separate tab for each element that possesses data contained in the alternative.
New Opens a submenu containing the following commands:
• Base Alternative—Creates a new Base Alternative of the currently highlighted type.
• Child Alternative—Creates a new Child Alternative from the currently high-lighted Base Alternative.
Delete Deletes the currently highlighted alternative.
Properties Opens the Alternative Editor dialog box for the currently highlighted alternative.
Rename Lets you rename the currently highlighted alternative.
Report Lets you generate a report of the currently highlighted alternative.
Help Displays online help for the Alternative Manager.
9-420 Bentley SewerCAD V8i User’s Guide
Using Scenarios and Alternatives
Note: Note: As you make changes to records, the check box automatically becomes checked. If you want to reset a record to its parent's values, clear the corresponding check box.
Many columns support Global Editing (see Globally Editing Data), allowing you to change all values in a single column. Right-click a column header to access the Global Edit option.
The check box column is disabled when you edit a base alternative.
The Alternative Editor displays all of the records held by a single alternative. These records contain the values that are active when a scenario referencing this alternative is active. They allow you to view all of the changes that you have made for a single alternative. They also allow you to eliminate changes that you no longer need.
There is one editor for each alternative type. Each type of editor works similarly and allows you to make changes to a different aspect of your system. The first column contains check boxes, which indicate the records that have been changed in this alter-native.
If the check box is selected, the record on that line has been modified and the data is local, or specific, to this alternative.
If the check box is cleared, it means that the record on that line is inherited from its higher-level parent alternative. Inherited records are dynamic. If the record is changed in the parent, the change is reflected in the child. The records on these rows reflect the corresponding values in the alternative's parent.
Active Topology Alternative
The Active Topology Alternative lets you temporarily remove areas of the network from the current analysis. This is useful for comparing the effect of proposed construction and to gauge the effectiveness of redundancy that may be present in the system.
The Active Topology dialog box is divided into tabs for each element type:
• Conduit
• Manhole
• Transition
• Wet Well
• Outfall
• Pressure Pipe
Bentley SewerCAD V8i User’s Guide 9-421
Alternatives
• Pressure Junction
• Pump
• Variable Speed Pump Battery
• Air Valve
For each tab, the same setup applies—the tables are divided into three columns. The first column displays whether the data is Base or Inherited, the second column is the element Label, and the third column allows you to choose whether or not the corre-sponding element is Active in the current alternative.
To make an element Inactive in the current alternative, clear the check box in the Is Active? field that corresponds to that element’s Label.
Creating an Active Topology Child Alternative
When creating an active topology child alternative, you may notice that the elements added to the child scenario also appear in your model when the base scenario is the current scenario.
To create an active topology alternative so that the elements added to the child scenario do not show up as part of the base scenario:
1. Create a new project.
2. Open the Property Editor.
3. Open the Scenario Manager and make sure the Base scenario is current (active).
4. Create your model by adding elements in the drawing pane.
5. Create a new child scenario and a new child active topology alternative as described in the following steps:
a. In the Scenario Manager, click the New button and select Child Scenario from the submenu.
b. In the Property Editor, which should now display the properties for the newly created scenario, select <New...> in the Active Topology field.
c. In the Create New Alternative dialog box, type the name of the new child active topology alternative name then click OK.
6. In the Scenario Manager, select the new child scenario then click the Make Current button to make the child scenario the current (active) scenario.
7. Add new elements to your model. These elements will be active only in the new child alternative.
9-422 Bentley SewerCAD V8i User’s Guide
Using Scenarios and Alternatives
8. To verify that this worked as expected:
a. In the Scenario Manager, select the base scenario then click the Make Current button to make the base scenario the current (active) scenario. The new elements are shown as inactive (they appear grayed out in the drawing pane).
b. In the Scenario Manager, select the new child scenario then click the Make Current button to make the child scenario the current (active) scenario. The new elements are shown as active.
Note: If you add new elements in the base scenario, they will show up in the child scenario. This is normal.
Active Topology Selection Dialog Box
While it is possible to make elements active or inactive by:
1. Checking or unchecking the "Is active?" box in the alternative manager under the Active Topology Manager,
2. Unchecking the "Is active?" box in a FlexTable, or
3. Picking True of False in property grid next to "Is active?" for individual elements,
another way of making elements active or inactive is the Active Topology Selection Tool, which is accessed through Tools>Active Topology Selection.
When the user starts Active Topology Selection, a Select tool opens. Clicking elements in the drawing view while the selection tool is enabled can make them active or inactive according to the commands below.
Making an element "inactive" means that the element remains in the data file but it is not included in any hydraulic analysis calculations. Inactive elements will appear in FlexTables but calculated values will be set to NA.
Changing the active status using this tool only affects the Active Topology Alternative of the current scenario.
The Select tool consists of the following controls:
• Done: Select Done when you are finished selecting elements. This brings the user back to the drawing pane.
• Add: When this button is selected, seelcting elements highlights the elements and makes them Inactive. Clicking on an element that is already inactive causes the tool to give a beep and the element remains inactive.
• Remove: While in this mode, selecting elements that are inactive deselects them, making them Active. Clicking on active elements has no effect.
Bentley SewerCAD V8i User’s Guide 9-423
Alternatives
• Select By Polygon: This tool allows you to draw a polygon around one or more elements. Right-click and select Done when you are finished drawing the polygon. The elements inside the polygon will be added to or removed from the selection depending on whether you have the Add or Remove button toggled on. A node must be fully within the polygon to be affected by this tool; links will be affected if their adjacent node(s) are contained within the polygon.
• Select by Query: This tool allows you to select elements by previously created selection sets or by using either custom or predefined queries. To create a custom query, select Custom Queries and then the element type. To use one of the predefined queries, choose one of the categories and then select the desired query.
• Find: Find an element in your model by typing the element label or ID in the Element menu then clicking the Find button or pressing Enter. The drawing pane centers around the highlighted element.
Find all elements of a certain type by using an asterisk (*) as a wild-card char-acter. For example, if you want to find all of the conduits in your model, you type co* (this is not case-sensitive) then click the Find button. The drawing pane centers around and highlights the first instance of a conduit in your model, and lists all conduits in your model in the Element menu.
• Clear: Clicking on this button causes all elements to become active in the current scenario.
Right clicking while the Selection tool is open (i.e. opening the right click context menu) brings up a list which enables the user to switch between Add, Remove or Done.
Note: Selecting a node element to become Inactive will also select all adjacent pipes to become Inactive. This is because all pipes must end at a node.
In AutoCAD mode, you cannot use the right-click context menu command Repeat to re-open the Active Topology Selection dialog box.
Physical Alternatives
Each type of network element has a specific set of physical properties that are stored in a physical properties alternative, as listed below:
Physical Alternative for Conduits
The physical alternative editor for conduits is used to create various data sets for the physical characteristics of conduits. The following columns are available:
9-424 Bentley SewerCAD V8i User’s Guide
Using Scenarios and Alternatives
Column Description
ID Displays the unique identifier for each element in the alternative.
Label Displays the label for each element in the alternative.
Tractive Stress (Local Minimum)
This field is only available when Use Local Minimum Tractive Stress? is set to True. The value defined here will override the Tractive Stress (Global Minimum) value defined in the Calculation Options.
Use Local Minimum Tractive Stress?
If set to True the value defined in the Tractive Stress (Local Minimum) field overrides the Tractive Stress (Global Minimum) value defined in the Calculation Options.
Has User Defined Length?
Lets you specify whether the conduit has a user-defined or schematic length.
Length (User Defined) Lets you define the length of each channel in the alternative that has a user—defined length.
Material Lets you enter the name of the material used. Alternatively, clicking the Ellipsis (...) button opens the Material Engineering Library, allowing you to select a pre-defined material. If a pre-defined material is chosen, the roughness value will change accordingly.
Manning’s n Lets you define the Manning's roughness value for the associated conduits. This attribute is only available when Manning's is chosen as the Hydraulic Analysis Friction Method on the Project tab of the project Options (Tools > Options).
Darcy-Weisbach e Lets you define the Darcy-Wesibach roughness value of each conduit in the alternative. This attribute is only available when Darcy-Wesibach is chosen as the Hydraulic Analysis Friction Method on the Project tab of the project Options (Tools > Options).
Bentley SewerCAD V8i User’s Guide 9-425
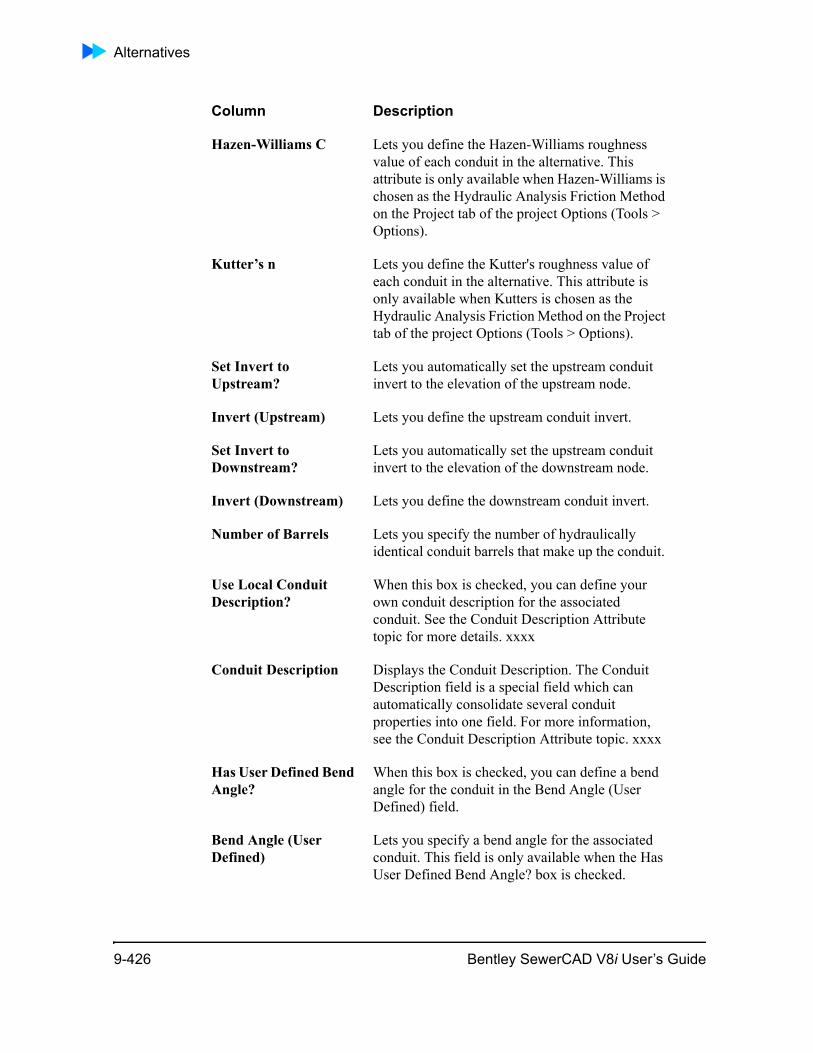
Alternatives
Hazen-Williams C Lets you define the Hazen-Williams roughness value of each conduit in the alternative. This attribute is only available when Hazen-Williams is chosen as the Hydraulic Analysis Friction Method on the Project tab of the project Options (Tools > Options).
Kutter’s n Lets you define the Kutter's roughness value of each conduit in the alternative. This attribute is only available when Kutters is chosen as the Hydraulic Analysis Friction Method on the Project tab of the project Options (Tools > Options).
Set Invert to Upstream?
Lets you automatically set the upstream conduit invert to the elevation of the upstream node.
Invert (Upstream) Lets you define the upstream conduit invert.
Set Invert to Downstream?
Lets you automatically set the upstream conduit invert to the elevation of the downstream node.
Invert (Downstream) Lets you define the downstream conduit invert.
Number of Barrels Lets you specify the number of hydraulically identical conduit barrels that make up the conduit.
Use Local Conduit Description?
When this box is checked, you can define your own conduit description for the associated conduit. See the Conduit Description Attribute topic for more details. xxxx
Conduit Description Displays the Conduit Description. The Conduit Description field is a special field which can automatically consolidate several conduit properties into one field. For more information, see the Conduit Description Attribute topic. xxxx
Has User Defined Bend Angle?
When this box is checked, you can define a bend angle for the conduit in the Bend Angle (User Defined) field.
Bend Angle (User Defined)
Lets you specify a bend angle for the associated conduit. This field is only available when the Has User Defined Bend Angle? box is checked.
Column Description
9-426 Bentley SewerCAD V8i User’s Guide
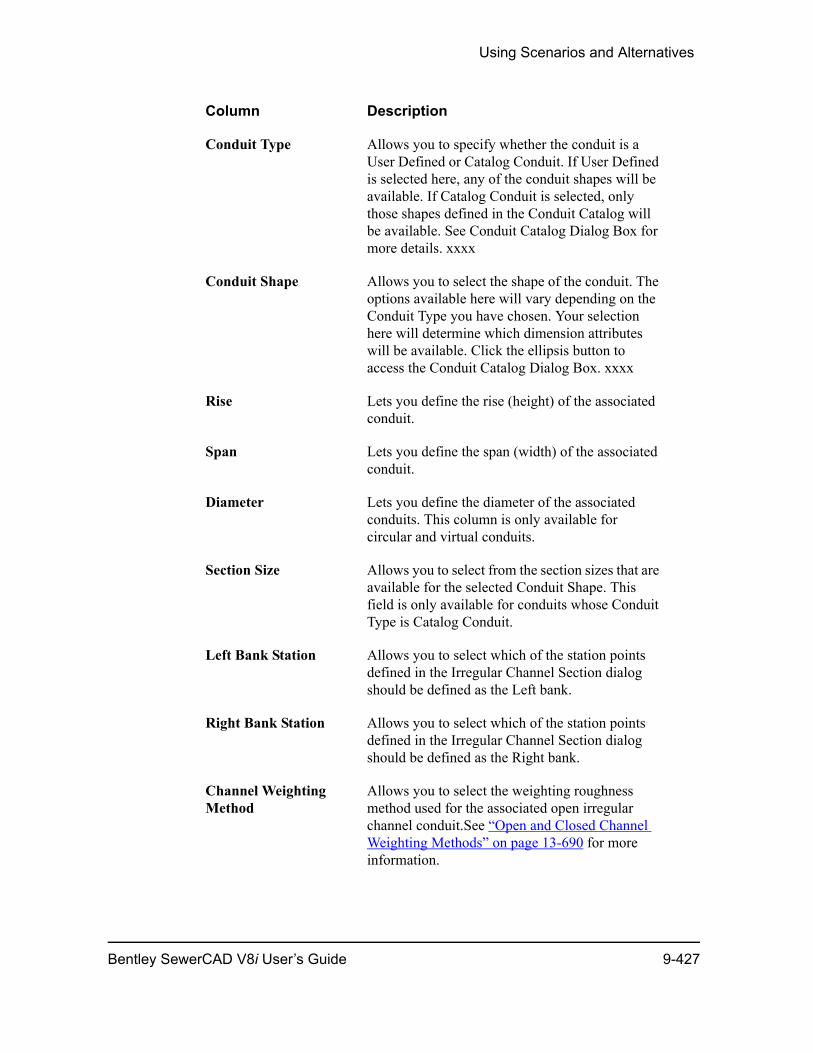
Using Scenarios and Alternatives
Conduit Type Allows you to specify whether the conduit is a User Defined or Catalog Conduit. If User Defined is selected here, any of the conduit shapes will be available. If Catalog Conduit is selected, only those shapes defined in the Conduit Catalog will be available. See Conduit Catalog Dialog Box for more details. xxxx
Conduit Shape Allows you to select the shape of the conduit. The options available here will vary depending on the Conduit Type you have chosen. Your selection here will determine which dimension attributes will be available. Click the ellipsis button to access the Conduit Catalog Dialog Box. xxxx
Rise Lets you define the rise (height) of the associated conduit.
Span Lets you define the span (width) of the associated conduit.
Diameter Lets you define the diameter of the associated conduits. This column is only available for circular and virtual conduits.
Section Size Allows you to select from the section sizes that are available for the selected Conduit Shape. This field is only available for conduits whose Conduit Type is Catalog Conduit.
Left Bank Station Allows you to select which of the station points defined in the Irregular Channel Section dialog should be defined as the Left bank.
Right Bank Station Allows you to select which of the station points defined in the Irregular Channel Section dialog should be defined as the Right bank.
Channel Weighting Method
Allows you to select the weighting roughness method used for the associated open irregular channel conduit.See “Open and Closed Channel Weighting Methods” on page 13-690 for more information.
Column Description
Bentley SewerCAD V8i User’s Guide 9-427
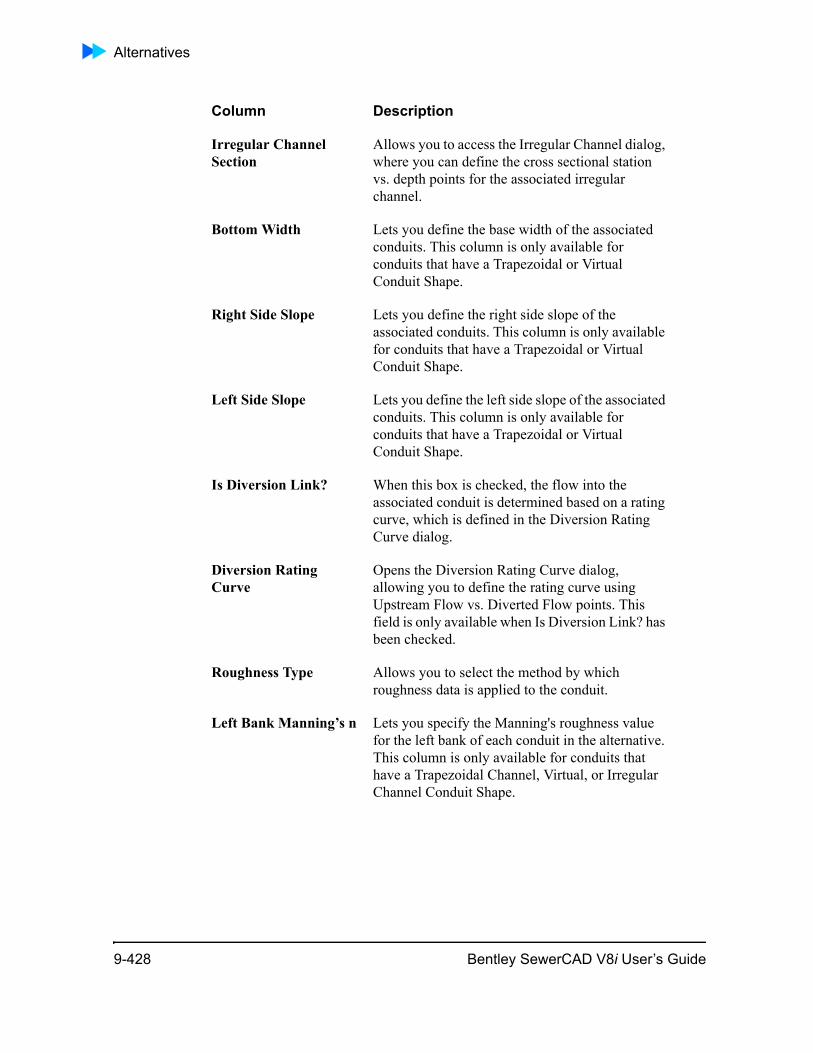
Alternatives
Irregular Channel Section
Allows you to access the Irregular Channel dialog, where you can define the cross sectional station vs. depth points for the associated irregular channel.
Bottom Width Lets you define the base width of the associated conduits. This column is only available for conduits that have a Trapezoidal or Virtual Conduit Shape.
Right Side Slope Lets you define the right side slope of the associated conduits. This column is only available for conduits that have a Trapezoidal or Virtual Conduit Shape.
Left Side Slope Lets you define the left side slope of the associated conduits. This column is only available for conduits that have a Trapezoidal or Virtual Conduit Shape.
Is Diversion Link? When this box is checked, the flow into the associated conduit is determined based on a rating curve, which is defined in the Diversion Rating Curve dialog.
Diversion Rating Curve
Opens the Diversion Rating Curve dialog, allowing you to define the rating curve using Upstream Flow vs. Diverted Flow points. This field is only available when Is Diversion Link? has been checked.
Roughness Type Allows you to select the method by which roughness data is applied to the conduit.
Left Bank Manning’s n Lets you specify the Manning's roughness value for the left bank of each conduit in the alternative. This column is only available for conduits that have a Trapezoidal Channel, Virtual, or Irregular Channel Conduit Shape.
Column Description
9-428 Bentley SewerCAD V8i User’s Guide
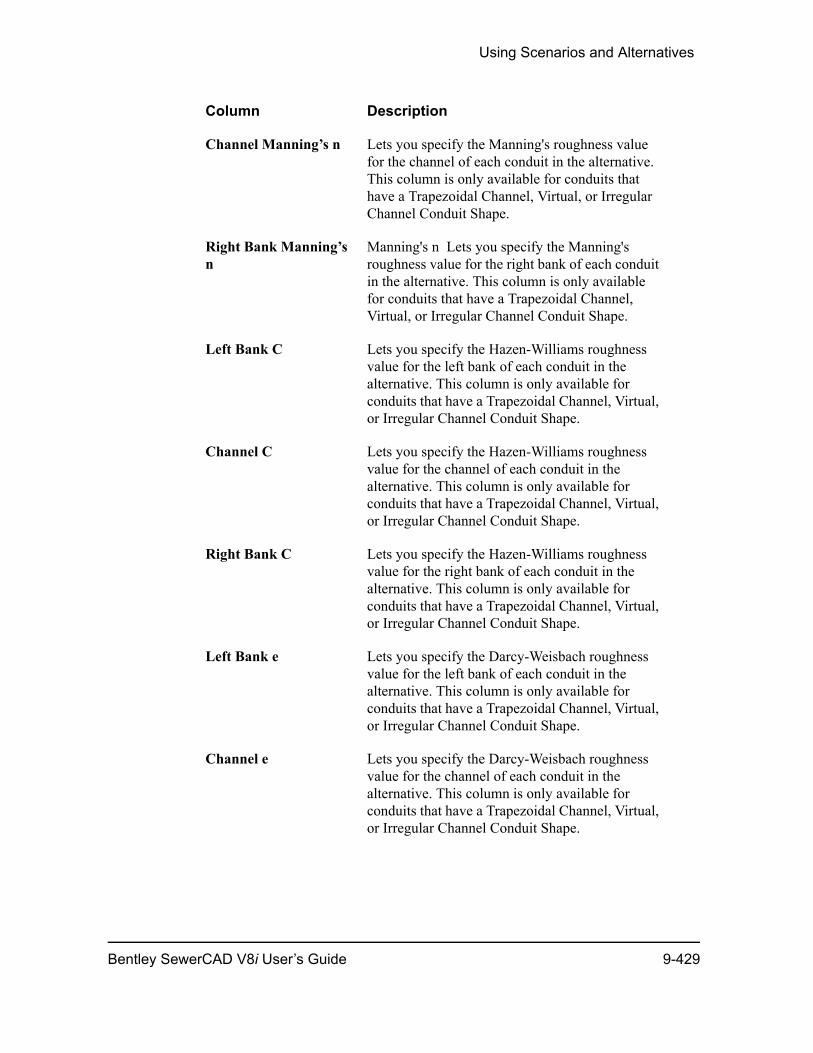
Using Scenarios and Alternatives
Channel Manning’s n Lets you specify the Manning's roughness value for the channel of each conduit in the alternative. This column is only available for conduits that have a Trapezoidal Channel, Virtual, or Irregular Channel Conduit Shape.
Right Bank Manning’s n
Manning's n Lets you specify the Manning's roughness value for the right bank of each conduit in the alternative. This column is only available for conduits that have a Trapezoidal Channel, Virtual, or Irregular Channel Conduit Shape.
Left Bank C Lets you specify the Hazen-Williams roughness value for the left bank of each conduit in the alternative. This column is only available for conduits that have a Trapezoidal Channel, Virtual, or Irregular Channel Conduit Shape.
Channel C Lets you specify the Hazen-Williams roughness value for the channel of each conduit in the alternative. This column is only available for conduits that have a Trapezoidal Channel, Virtual, or Irregular Channel Conduit Shape.
Right Bank C Lets you specify the Hazen-Williams roughness value for the right bank of each conduit in the alternative. This column is only available for conduits that have a Trapezoidal Channel, Virtual, or Irregular Channel Conduit Shape.
Left Bank e Lets you specify the Darcy-Weisbach roughness value for the left bank of each conduit in the alternative. This column is only available for conduits that have a Trapezoidal Channel, Virtual, or Irregular Channel Conduit Shape.
Channel e Lets you specify the Darcy-Weisbach roughness value for the channel of each conduit in the alternative. This column is only available for conduits that have a Trapezoidal Channel, Virtual, or Irregular Channel Conduit Shape.
Column Description
Bentley SewerCAD V8i User’s Guide 9-429
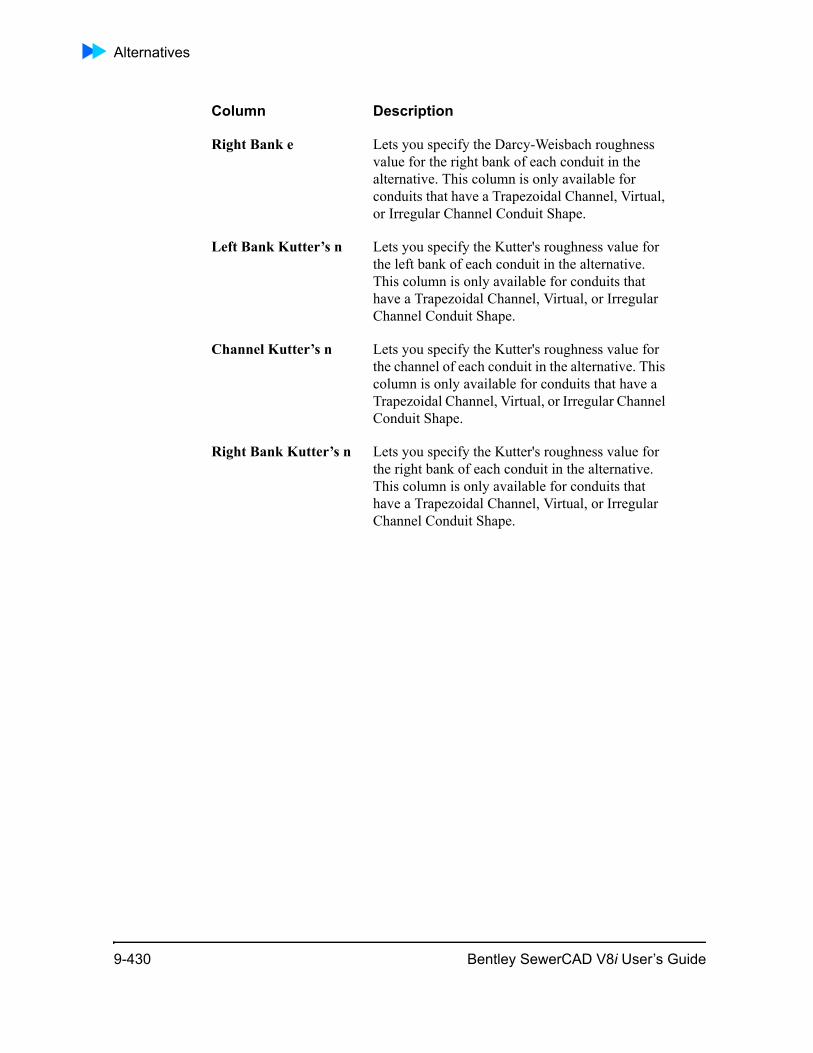
Alternatives
Right Bank e Lets you specify the Darcy-Weisbach roughness value for the right bank of each conduit in the alternative. This column is only available for conduits that have a Trapezoidal Channel, Virtual, or Irregular Channel Conduit Shape.
Left Bank Kutter’s n Lets you specify the Kutter's roughness value for the left bank of each conduit in the alternative. This column is only available for conduits that have a Trapezoidal Channel, Virtual, or Irregular Channel Conduit Shape.
Channel Kutter’s n Lets you specify the Kutter's roughness value for the channel of each conduit in the alternative. This column is only available for conduits that have a Trapezoidal Channel, Virtual, or Irregular Channel Conduit Shape.
Right Bank Kutter’s n Lets you specify the Kutter's roughness value for the right bank of each conduit in the alternative. This column is only available for conduits that have a Trapezoidal Channel, Virtual, or Irregular Channel Conduit Shape.
Column Description
9-430 Bentley SewerCAD V8i User’s Guide
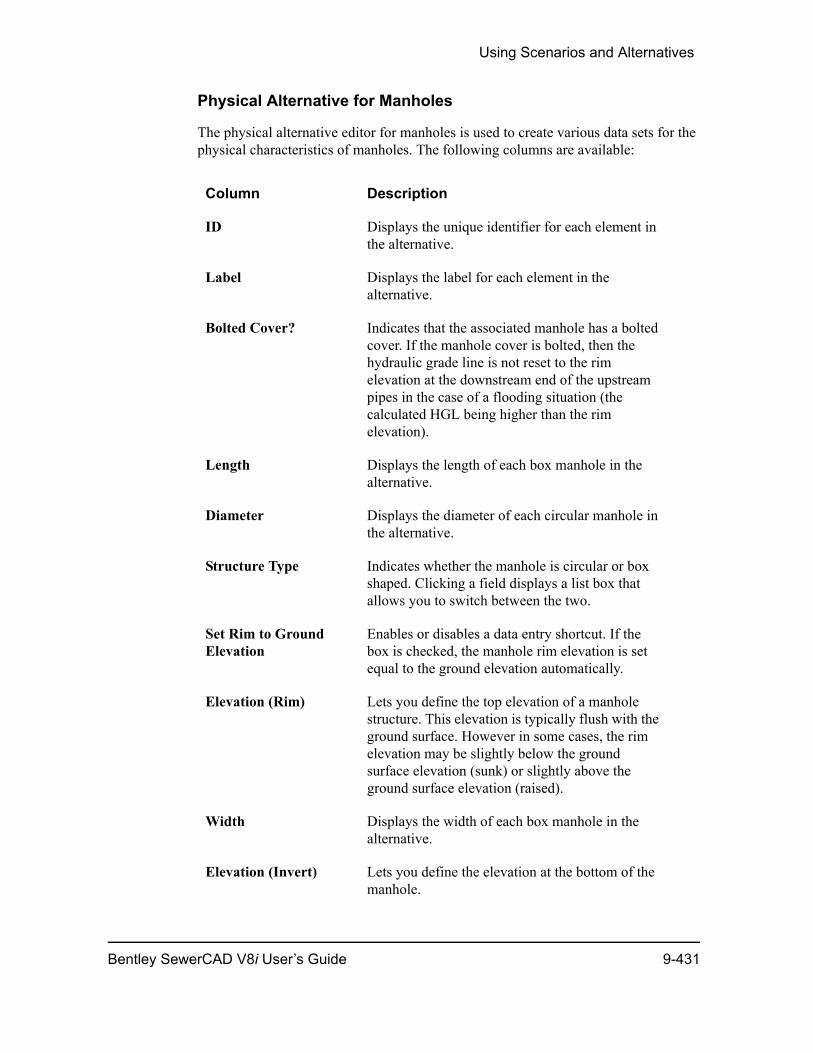
Using Scenarios and Alternatives
Physical Alternative for Manholes
The physical alternative editor for manholes is used to create various data sets for the physical characteristics of manholes. The following columns are available:
Column Description
ID Displays the unique identifier for each element in the alternative.
Label Displays the label for each element in the alternative.
Bolted Cover? Indicates that the associated manhole has a bolted cover. If the manhole cover is bolted, then the hydraulic grade line is not reset to the rim elevation at the downstream end of the upstream pipes in the case of a flooding situation (the calculated HGL being higher than the rim elevation).
Length Displays the length of each box manhole in the alternative.
Diameter Displays the diameter of each circular manhole in the alternative.
Structure Type Indicates whether the manhole is circular or box shaped. Clicking a field displays a list box that allows you to switch between the two.
Set Rim to Ground Elevation
Enables or disables a data entry shortcut. If the box is checked, the manhole rim elevation is set equal to the ground elevation automatically.
Elevation (Rim) Lets you define the top elevation of a manhole structure. This elevation is typically flush with the ground surface. However in some cases, the rim elevation may be slightly below the ground surface elevation (sunk) or slightly above the ground surface elevation (raised).
Width Displays the width of each box manhole in the alternative.
Elevation (Invert) Lets you define the elevation at the bottom of the manhole.
Bentley SewerCAD V8i User’s Guide 9-431
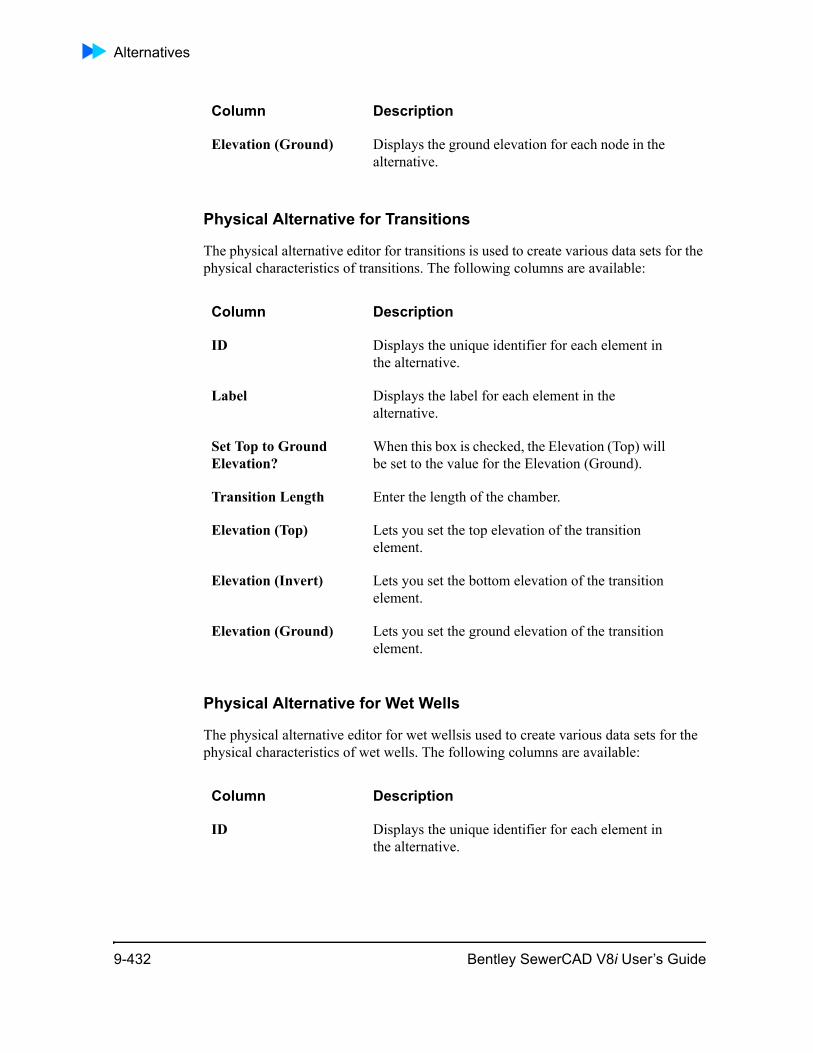
Alternatives
Physical Alternative for Transitions
The physical alternative editor for transitions is used to create various data sets for the physical characteristics of transitions. The following columns are available:
Physical Alternative for Wet Wells
The physical alternative editor for wet wellsis used to create various data sets for the physical characteristics of wet wells. The following columns are available:
Elevation (Ground) Displays the ground elevation for each node in the alternative.
Column Description
Column Description
ID Displays the unique identifier for each element in the alternative.
Label Displays the label for each element in the alternative.
Set Top to Ground Elevation?
When this box is checked, the Elevation (Top) will be set to the value for the Elevation (Ground).
Transition Length Enter the length of the chamber.
Elevation (Top) Lets you set the top elevation of the transition element.
Elevation (Invert) Lets you set the bottom elevation of the transition element.
Elevation (Ground) Lets you set the ground elevation of the transition element.
Column Description
ID Displays the unique identifier for each element in the alternative.
9-432 Bentley SewerCAD V8i User’s Guide
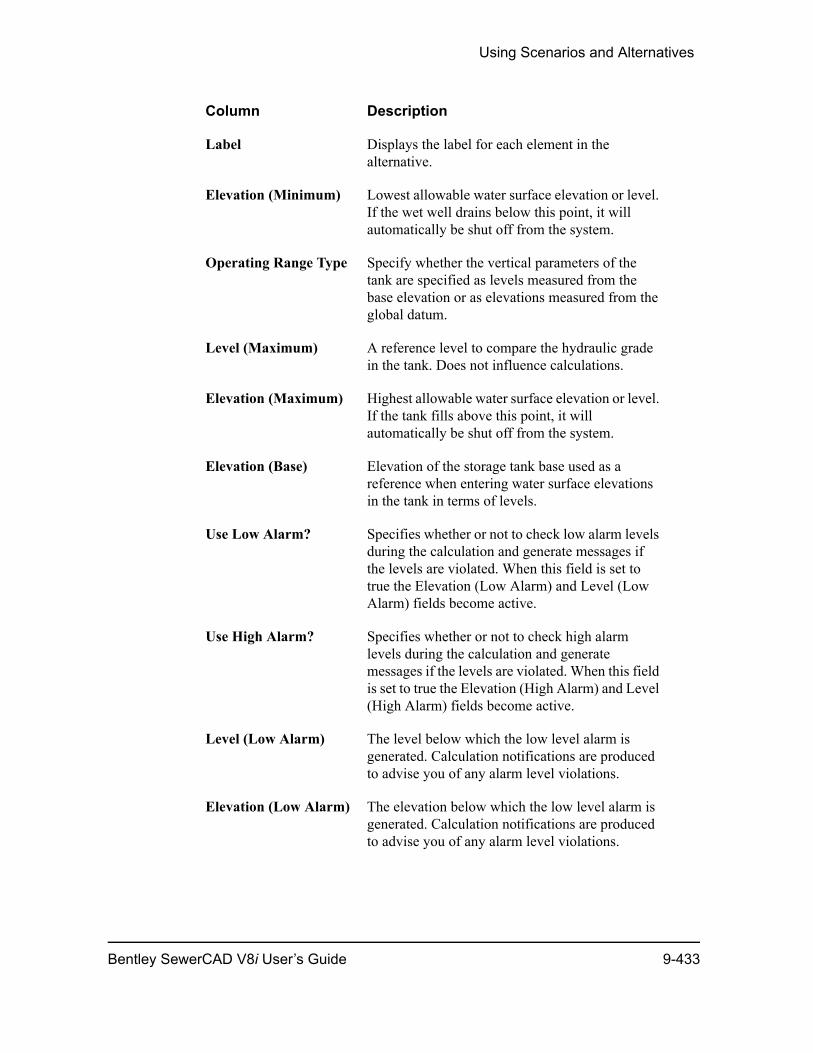
Using Scenarios and Alternatives
Label Displays the label for each element in the alternative.
Elevation (Minimum) Lowest allowable water surface elevation or level. If the wet well drains below this point, it will automatically be shut off from the system.
Operating Range Type Specify whether the vertical parameters of the tank are specified as levels measured from the base elevation or as elevations measured from the global datum.
Level (Maximum) A reference level to compare the hydraulic grade in the tank. Does not influence calculations.
Elevation (Maximum) Highest allowable water surface elevation or level. If the tank fills above this point, it will automatically be shut off from the system.
Elevation (Base) Elevation of the storage tank base used as a reference when entering water surface elevations in the tank in terms of levels.
Use Low Alarm? Specifies whether or not to check low alarm levels during the calculation and generate messages if the levels are violated. When this field is set to true the Elevation (Low Alarm) and Level (Low Alarm) fields become active.
Use High Alarm? Specifies whether or not to check high alarm levels during the calculation and generate messages if the levels are violated. When this field is set to true the Elevation (High Alarm) and Level (High Alarm) fields become active.
Level (Low Alarm) The level below which the low level alarm is generated. Calculation notifications are produced to advise you of any alarm level violations.
Elevation (Low Alarm) The elevation below which the low level alarm is generated. Calculation notifications are produced to advise you of any alarm level violations.
Column Description
Bentley SewerCAD V8i User’s Guide 9-433
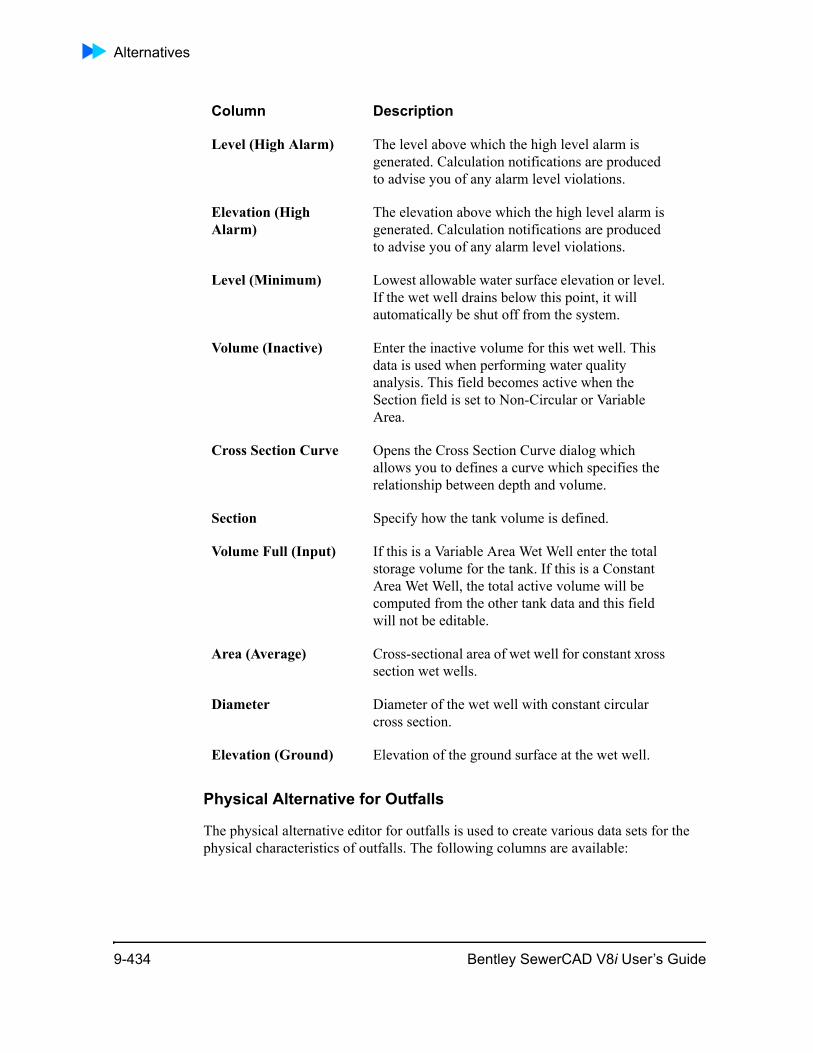
Alternatives
Physical Alternative for Outfalls
The physical alternative editor for outfalls is used to create various data sets for the physical characteristics of outfalls. The following columns are available:
Level (High Alarm) The level above which the high level alarm is generated. Calculation notifications are produced to advise you of any alarm level violations.
Elevation (High Alarm)
The elevation above which the high level alarm is generated. Calculation notifications are produced to advise you of any alarm level violations.
Level (Minimum) Lowest allowable water surface elevation or level. If the wet well drains below this point, it will automatically be shut off from the system.
Volume (Inactive) Enter the inactive volume for this wet well. This data is used when performing water quality analysis. This field becomes active when the Section field is set to Non-Circular or Variable Area.
Cross Section Curve Opens the Cross Section Curve dialog which allows you to defines a curve which specifies the relationship between depth and volume.
Section Specify how the tank volume is defined.
Volume Full (Input) If this is a Variable Area Wet Well enter the total storage volume for the tank. If this is a Constant Area Wet Well, the total active volume will be computed from the other tank data and this field will not be editable.
Area (Average) Cross-sectional area of wet well for constant xross section wet wells.
Diameter Diameter of the wet well with constant circular cross section.
Elevation (Ground) Elevation of the ground surface at the wet well.
Column Description
9-434 Bentley SewerCAD V8i User’s Guide
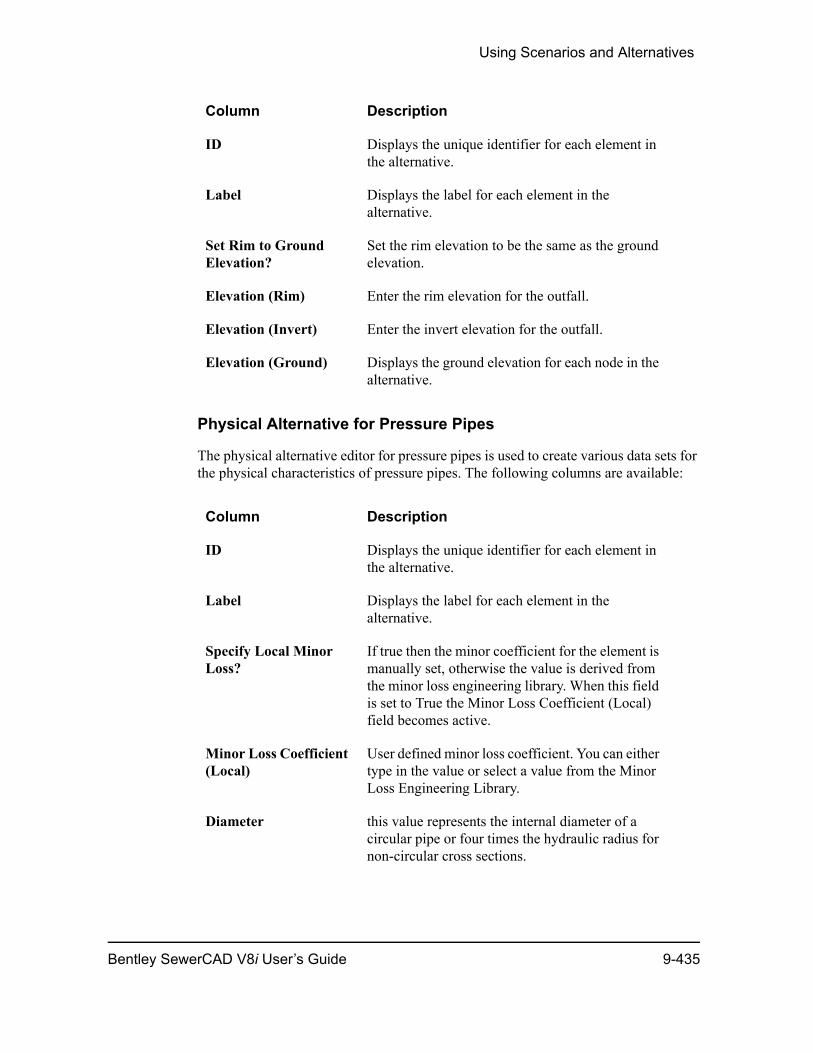
Using Scenarios and Alternatives
Physical Alternative for Pressure Pipes
The physical alternative editor for pressure pipes is used to create various data sets for the physical characteristics of pressure pipes. The following columns are available:
Column Description
ID Displays the unique identifier for each element in the alternative.
Label Displays the label for each element in the alternative.
Set Rim to Ground Elevation?
Set the rim elevation to be the same as the ground elevation.
Elevation (Rim) Enter the rim elevation for the outfall.
Elevation (Invert) Enter the invert elevation for the outfall.
Elevation (Ground) Displays the ground elevation for each node in the alternative.
Column Description
ID Displays the unique identifier for each element in the alternative.
Label Displays the label for each element in the alternative.
Specify Local Minor Loss?
If true then the minor coefficient for the element is manually set, otherwise the value is derived from the minor loss engineering library. When this field is set to True the Minor Loss Coefficient (Local) field becomes active.
Minor Loss Coefficient (Local)
User defined minor loss coefficient. You can either type in the value or select a value from the Minor Loss Engineering Library.
Diameter this value represents the internal diameter of a circular pipe or four times the hydraulic radius for non-circular cross sections.
Bentley SewerCAD V8i User’s Guide 9-435
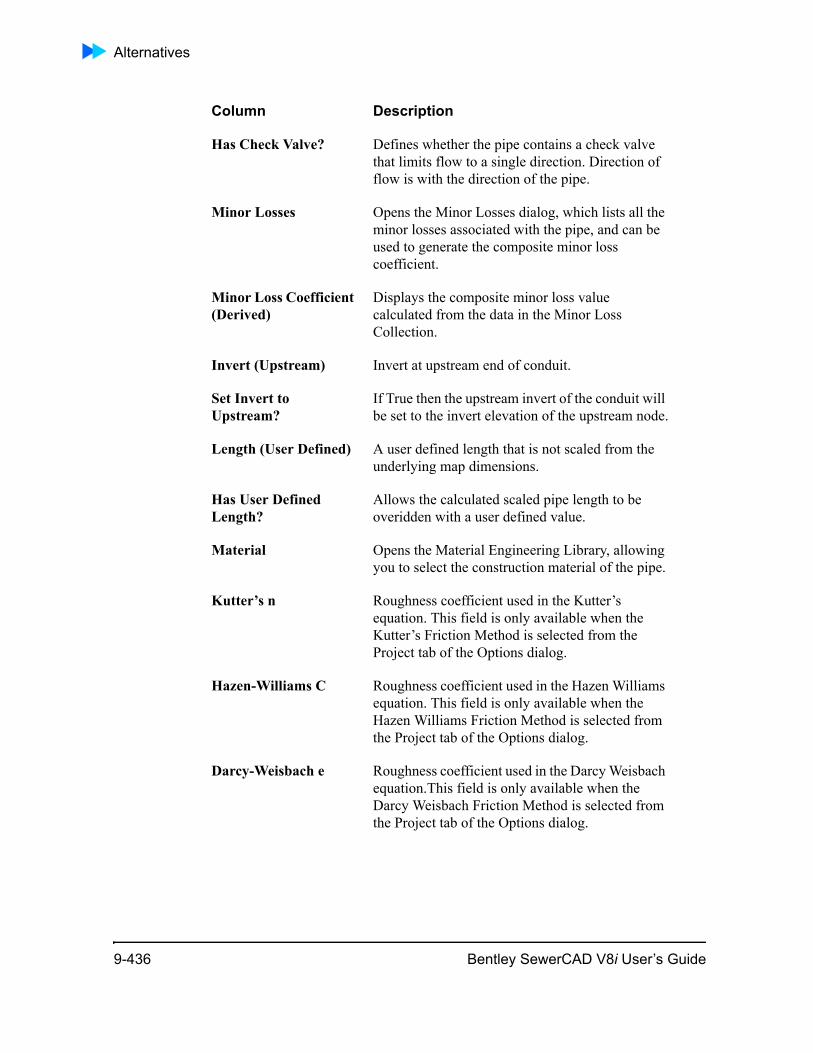
Alternatives
Has Check Valve? Defines whether the pipe contains a check valve that limits flow to a single direction. Direction of flow is with the direction of the pipe.
Minor Losses Opens the Minor Losses dialog, which lists all the minor losses associated with the pipe, and can be used to generate the composite minor loss coefficient.
Minor Loss Coefficient (Derived)
Displays the composite minor loss value calculated from the data in the Minor Loss Collection.
Invert (Upstream) Invert at upstream end of conduit.
Set Invert to Upstream?
If True then the upstream invert of the conduit will be set to the invert elevation of the upstream node.
Length (User Defined) A user defined length that is not scaled from the underlying map dimensions.
Has User Defined Length?
Allows the calculated scaled pipe length to be overidden with a user defined value.
Material Opens the Material Engineering Library, allowing you to select the construction material of the pipe.
Kutter’s n Roughness coefficient used in the Kutter’s equation. This field is only available when the Kutter’s Friction Method is selected from the Project tab of the Options dialog.
Hazen-Williams C Roughness coefficient used in the Hazen Williams equation. This field is only available when the Hazen Williams Friction Method is selected from the Project tab of the Options dialog.
Darcy-Weisbach e Roughness coefficient used in the Darcy Weisbach equation.This field is only available when the Darcy Weisbach Friction Method is selected from the Project tab of the Options dialog.
Column Description
9-436 Bentley SewerCAD V8i User’s Guide
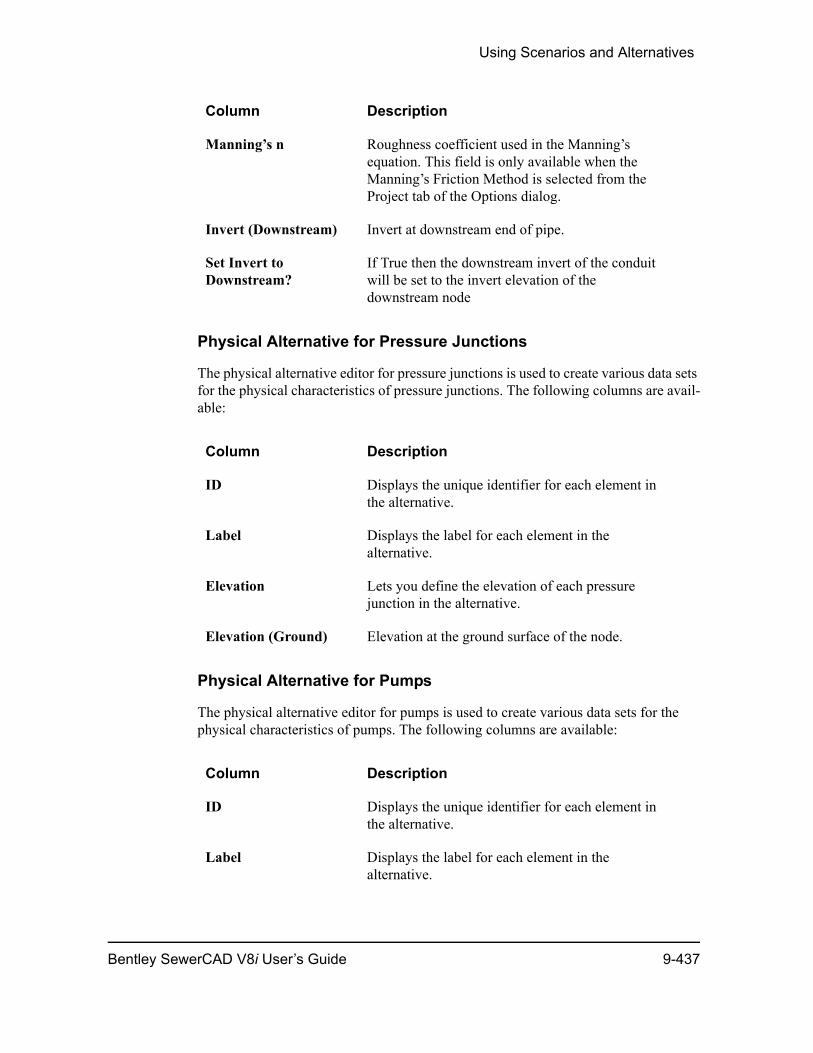
Using Scenarios and Alternatives
Physical Alternative for Pressure Junctions
The physical alternative editor for pressure junctions is used to create various data sets for the physical characteristics of pressure junctions. The following columns are avail-able:
Physical Alternative for Pumps
The physical alternative editor for pumps is used to create various data sets for the physical characteristics of pumps. The following columns are available:
Manning’s n Roughness coefficient used in the Manning’s equation. This field is only available when the Manning’s Friction Method is selected from the Project tab of the Options dialog.
Invert (Downstream) Invert at downstream end of pipe.
Set Invert to Downstream?
If True then the downstream invert of the conduit will be set to the invert elevation of the downstream node
Column Description
Column Description
ID Displays the unique identifier for each element in the alternative.
Label Displays the label for each element in the alternative.
Elevation Lets you define the elevation of each pressure junction in the alternative.
Elevation (Ground) Elevation at the ground surface of the node.
Column Description
ID Displays the unique identifier for each element in the alternative.
Label Displays the label for each element in the alternative.
Bentley SewerCAD V8i User’s Guide 9-437
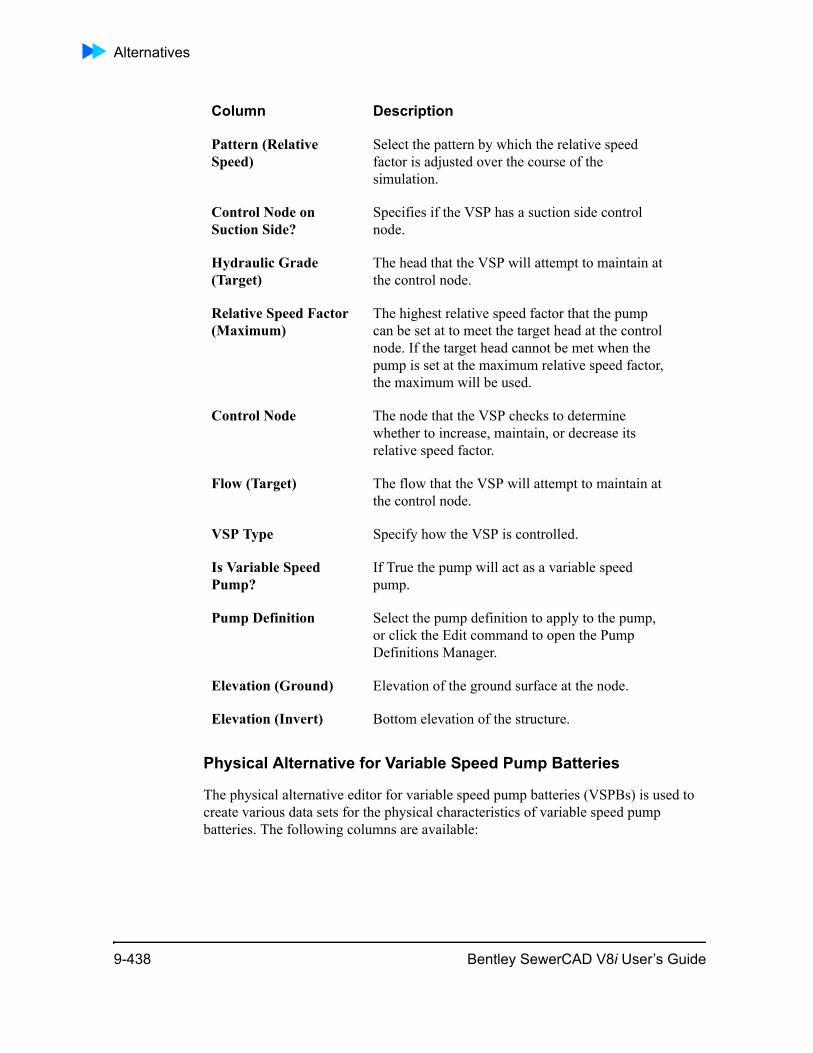
Alternatives
Physical Alternative for Variable Speed Pump Batteries
The physical alternative editor for variable speed pump batteries (VSPBs) is used to create various data sets for the physical characteristics of variable speed pump batteries. The following columns are available:
Pattern (Relative Speed)
Select the pattern by which the relative speed factor is adjusted over the course of the simulation.
Control Node on Suction Side?
Specifies if the VSP has a suction side control node.
Hydraulic Grade (Target)
The head that the VSP will attempt to maintain at the control node.
Relative Speed Factor (Maximum)
The highest relative speed factor that the pump can be set at to meet the target head at the control node. If the target head cannot be met when the pump is set at the maximum relative speed factor, the maximum will be used.
Control Node The node that the VSP checks to determine whether to increase, maintain, or decrease its relative speed factor.
Flow (Target) The flow that the VSP will attempt to maintain at the control node.
VSP Type Specify how the VSP is controlled.
Is Variable Speed Pump?
If True the pump will act as a variable speed pump.
Pump Definition Select the pump definition to apply to the pump, or click the Edit command to open the Pump Definitions Manager.
Elevation (Ground) Elevation of the ground surface at the node.
Elevation (Invert) Bottom elevation of the structure.
Column Description
9-438 Bentley SewerCAD V8i User’s Guide
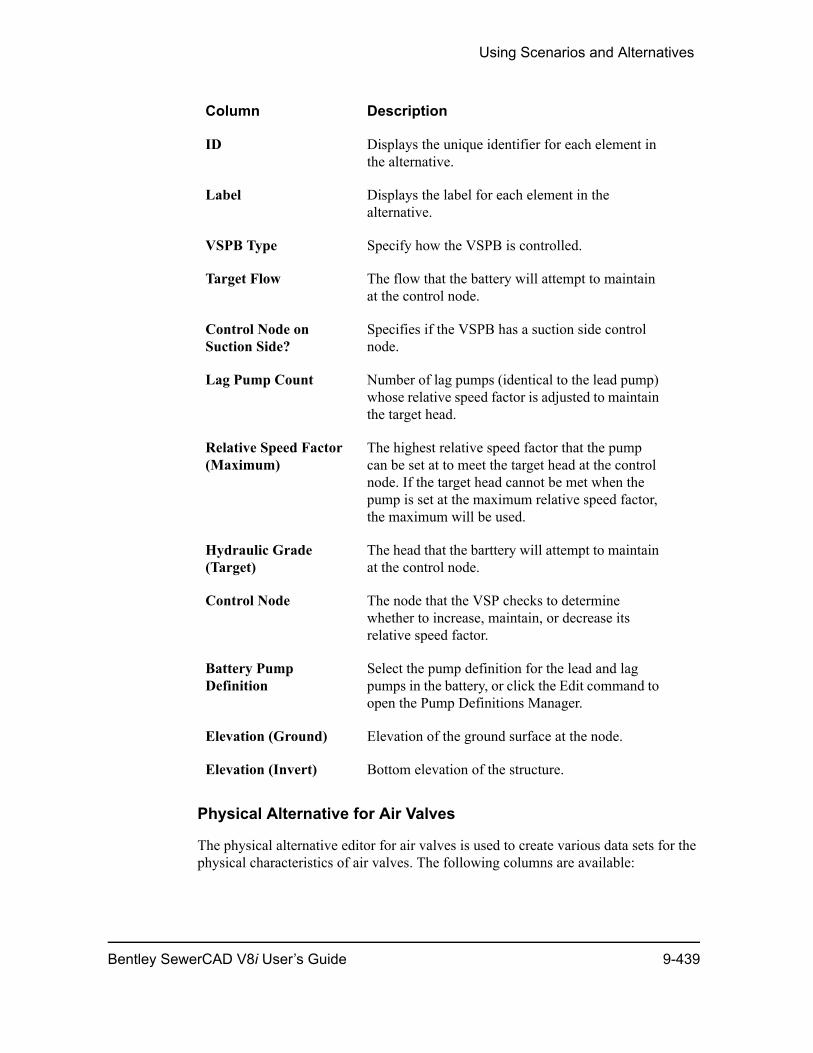
Using Scenarios and Alternatives
Physical Alternative for Air Valves
The physical alternative editor for air valves is used to create various data sets for the physical characteristics of air valves. The following columns are available:
Column Description
ID Displays the unique identifier for each element in the alternative.
Label Displays the label for each element in the alternative.
VSPB Type Specify how the VSPB is controlled.
Target Flow The flow that the battery will attempt to maintain at the control node.
Control Node on Suction Side?
Specifies if the VSPB has a suction side control node.
Lag Pump Count Number of lag pumps (identical to the lead pump) whose relative speed factor is adjusted to maintain the target head.
Relative Speed Factor (Maximum)
The highest relative speed factor that the pump can be set at to meet the target head at the control node. If the target head cannot be met when the pump is set at the maximum relative speed factor, the maximum will be used.
Hydraulic Grade (Target)
The head that the barttery will attempt to maintain at the control node.
Control Node The node that the VSP checks to determine whether to increase, maintain, or decrease its relative speed factor.
Battery Pump Definition
Select the pump definition for the lead and lag pumps in the battery, or click the Edit command to open the Pump Definitions Manager.
Elevation (Ground) Elevation of the ground surface at the node.
Elevation (Invert) Bottom elevation of the structure.
Bentley SewerCAD V8i User’s Guide 9-439
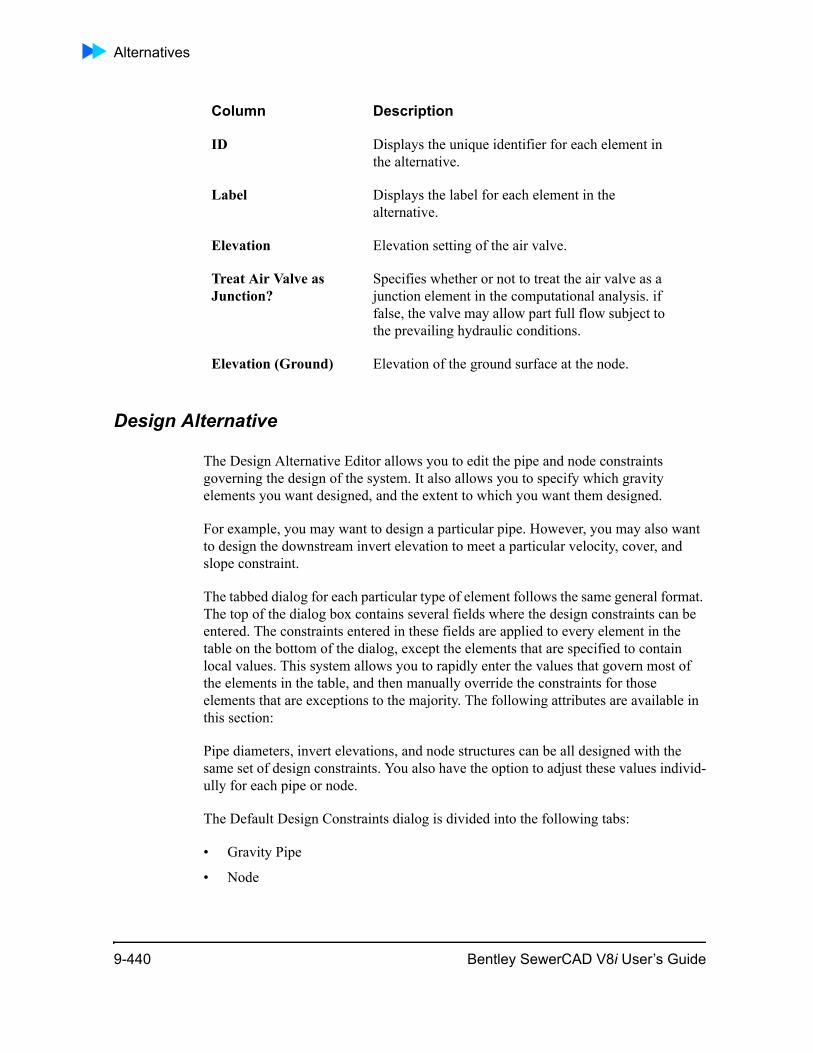
Alternatives
Design Alternative
The Design Alternative Editor allows you to edit the pipe and node constraints governing the design of the system. It also allows you to specify which gravity elements you want designed, and the extent to which you want them designed.
For example, you may want to design a particular pipe. However, you may also want to design the downstream invert elevation to meet a particular velocity, cover, and slope constraint.
The tabbed dialog for each particular type of element follows the same general format. The top of the dialog box contains several fields where the design constraints can be entered. The constraints entered in these fields are applied to every element in the table on the bottom of the dialog, except the elements that are specified to contain local values. This system allows you to rapidly enter the values that govern most of the elements in the table, and then manually override the constraints for those elements that are exceptions to the majority. The following attributes are available in this section:
Pipe diameters, invert elevations, and node structures can be all designed with the same set of design constraints. You also have the option to adjust these values individ-ully for each pipe or node.
The Default Design Constraints dialog is divided into the following tabs:
• Gravity Pipe
• Node
Column Description
ID Displays the unique identifier for each element in the alternative.
Label Displays the label for each element in the alternative.
Elevation Elevation setting of the air valve.
Treat Air Valve as Junction?
Specifies whether or not to treat the air valve as a junction element in the computational analysis. if false, the valve may allow part full flow subject to the prevailing hydraulic conditions.
Elevation (Ground) Elevation of the ground surface at the node.
9-440 Bentley SewerCAD V8i User’s Guide
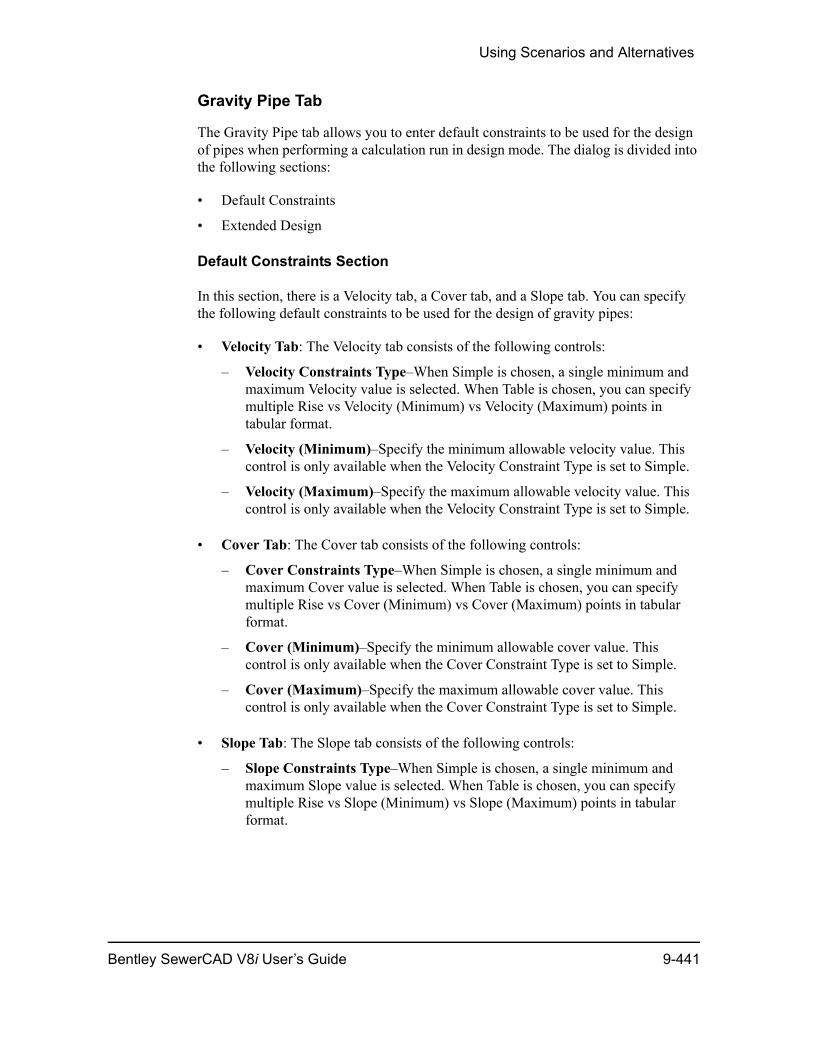
Using Scenarios and Alternatives
Gravity Pipe Tab
The Gravity Pipe tab allows you to enter default constraints to be used for the design of pipes when performing a calculation run in design mode. The dialog is divided into the following sections:
• Default Constraints
• Extended Design
Default Constraints Section
In this section, there is a Velocity tab, a Cover tab, and a Slope tab. You can specify the following default constraints to be used for the design of gravity pipes:
• Velocity Tab: The Velocity tab consists of the following controls:
– Velocity Constraints Type–When Simple is chosen, a single minimum and maximum Velocity value is selected. When Table is chosen, you can specify multiple Rise vs Velocity (Minimum) vs Velocity (Maximum) points in tabular format.
– Velocity (Minimum)–Specify the minimum allowable velocity value. This control is only available when the Velocity Constraint Type is set to Simple.
– Velocity (Maximum)–Specify the maximum allowable velocity value. This control is only available when the Velocity Constraint Type is set to Simple.
• Cover Tab: The Cover tab consists of the following controls:
– Cover Constraints Type–When Simple is chosen, a single minimum and maximum Cover value is selected. When Table is chosen, you can specify multiple Rise vs Cover (Minimum) vs Cover (Maximum) points in tabular format.
– Cover (Minimum)–Specify the minimum allowable cover value. This control is only available when the Cover Constraint Type is set to Simple.
– Cover (Maximum)–Specify the maximum allowable cover value. This control is only available when the Cover Constraint Type is set to Simple.
• Slope Tab: The Slope tab consists of the following controls:
– Slope Constraints Type–When Simple is chosen, a single minimum and maximum Slope value is selected. When Table is chosen, you can specify multiple Rise vs Slope (Minimum) vs Slope (Maximum) points in tabular format.
Bentley SewerCAD V8i User’s Guide 9-441

Alternatives
– Slope (Minimum)–Specify the minimum allowable slope value. This control is only available when the Slope Constraint Type is set to Simple.
– Slope (Maximum)–Specify the maximum allowable slope value. This control is only available when the Slope Constraint Type is set to Simple.
Extended Design Section
This section lets you specify if the following design parameters are to be used. If they are to be used, you can also specify the associated default value. The Extended Design section is split into three tabs:
• Part Full Design Tab: The Part Full Design tab consists of the following controls:
– Is Part Full Design?–When checked, allows you to specify the Percent Full target to be used by the design algorithm.
– Percent Full Constraint Type–Allows you to specify how the Percent Full constraints are defined. When Simple is chosen, a single Percentage Full value is selected. When Table is chosen, you can specify multiple Rise vs Percent Full points in tabular format.
– Percentage Full–Specify the Percent Full value to be used when the Is Part Full Design? box is checked. This control is only availble when the Percent Full Constraint Type is set to Simple.
• Number of Barrels Tab: The Number of Barrels tab consists of the following controls:
– Allow Multiple Barrels?–When checked, allows the design algorithm to use more than one identical section in parallel, up to the specified Maximum Number of Barrels.
– Maximum Number of Barrels–The maximum number of identical sections allowed to be used in parallel when the Allow Multiple Barrels? box is checked.
• Section Size Tab: The Section Size tab consists of the following controls:
– Limit Section Size?–When checked, limits the pipe section height to the specified Maximum Rise value during the design process.
– Maximum Rise–The maximum rise a section height is allowed to be used in the design when the Limit Section Size? box is checked.
9-442 Bentley SewerCAD V8i User’s Guide
Using Scenarios and Alternatives
Node Tab
This tab lets you specify the design constraints to be used by default for all gravity structures when performing calculations in design mode. During an automatic design, the program will adjust the elevations of the pipes adjacent to the structure according to the structure's matching constraints. The two choices for matching are Inverts and Crowns. Additionally, the downstream pipe can be offset from the upstream pipe(s) by a specified amount. This value is called the Matchline Offset. Optionally, the program supports the design of drop structures. In some situations, drop structures can mini-mize pipe cover depths while maintaining adequate hydraulic performance.
Headloss Alternative
The headloss alternative editor allows you to define headloss properties for manhole and transition elements. The following columns are available for both element types:
ID: Displays the unique identifier for each element in the alternative.
Label: Displays the label for each element in the alternative.
Headloss Coefficient (Standard): Enter the headloss coefficient for the structure. The headloss across the structure will be equal to this number multiplied by the exit conduit velocity head. This field is only used when the Headloss Method is set to Standard.
Headloss Coefficient (Upstream): This field is only used when the Headloss Method is set to Generic. The Generic method computes the structure headloss by multiplying the velocity head of the exit pipe by the user-defined Headloss (Downstream) value and then subtracting the velocity head of the governing upstream pipe multiplied by thevalue entered in this field.
Headloss Coefficient (Downstream): This field is only used when the Headloss Method is set to Generic. The Generic method computes the structure headloss by multiplying the velocity head of the exit pipe by the value entered in this field and then subtracting the velocity head of the governing upstream pipe multiplied by the user-defined Headloss Coefficient (Upstream) value.
HEC-22 Benching Method: Select which correction factor for benching will be used. This field is only used when the Headloss Method is set to HEC-22 Energy.
Absolute Headloss: Enter the desired value for headloss at the structure. This method ensures that the headloss across the structure will be equal to the value entered here regardless of the actual flows or geometry of the structure. This field is only used when the Headloss Method is set to Absolute.
Bentley SewerCAD V8i User’s Guide 9-443
Alternatives
Headloss Method: Select the method to be used to calculate the headlosses through the associated structure. The option chosen here determines which of the parameter fields will become available.
Flow-Headloss Curve: Specify the previously defined Flow-Headloss curve to be applied to the node, or create a new one by choosing the <Select...> option to access the Flow-Headloss Curves dialog.
AASHTO Shaping Method: Select the correction factor for shaping used in the calculation of headloss using the AASHTO method. This field is only used when the Headloss Method is set to AASHTO.
Boundary Condition Alternatives
The boundary condition alternative allows you to define boundary condition settings for outfall elements. The following columns are available:
Column Description
ID Displays the unique identifier for each element in the alternative.
Label Displays the label for each element in the alternative.
Elevation-Flow Curve Displays the label of the Elevation-Flow Curve that has been assigned to an outfall that is using the Elevation-Flow curve Boundary Condition Type.
Elevation (Tailwater) Lets you enter the user defined tailwater value. This column is only available for elements that use the User Defined Tailwater Boundary Condition Type.
9-444 Bentley SewerCAD V8i User’s Guide
Using Scenarios and Alternatives
Initial Settings Alternative
The Initial Settings Alternative contains the data that set the conditions of certain types of network elements at the beginning of the simulation. For example, a pipe can start in an open or closed position and a pump can start in an on or off condition.
Wet Well Tab
The initial settings tab for wet wells allows you to define the initial settings for wet wells. The following conditions are available:
Boundary Condition Type
Lets you specify the type of boundary condition to be used at the associated outfall element. The following choices are available:
• Free Outfall—For a free outfall control, it is assumed that the downstream discharge condi-tions do not directly affect the hydraulic response of the structure. This is equivalent to assuming that the downstream TW elevation never rises above the controlling structure outfall invert of the struc-ture.
• User Defined Tailwater—This type of boundary condition allows you to directly enter a tailwater value.
• Elevation Flow Curve—For this type of boundary condition, an elevation-flow table is specified to simulate a situation where flow rate varies over time.
• Crown—This condition should be used when the pipe discharges to an outlet where the water surface elevation is equal to the elevation of the top of the pipe.
Column Description
Column Description
ID Displays the unique identifier for each element in the alternative.
Label Displays the label for each element in the alternative.
Bentley SewerCAD V8i User’s Guide 9-445
Alternatives
Pressure Pipe Tab
The initial settings tab for pressure pipes allows you to define the initial settings for pressure pipes. The following conditions are available:
Pump Tab
The initial settings tab for pumps allows you to define the initial settings for pumps. The following conditions are available:
Is Fixed Level In Steady State?
If False in a steady state run, and if a pump cannot keep up with inflow the wet well level will be increased (by the amount set by "increment" in the calculation options) until the flow keeps up with the inflow or the level reaches a maximum. If the level reaches maximum and the inflowing pipe is a pressure pipe, that pipe will be closed. This can lead to disconnected systems or subnetworks with no flow in some cases.
If True, the initial wet well level will be maintained.
Level (Initial) The wet well level for a steady run or the level at time zero for an EPS run.
Elevation (Initial) Lets you define the initial water surface elevation for each wet well in the alternative that uses the User Defined Initial Elevation Initial Elevation Type.
Column Description
Column Description
ID Displays the unique identifier for each element in the alternative.
Label Displays the label for each element in the alternative.
Status (Initial) Whether the pipe is Open or Closed at time zero for an EPS run.
9-446 Bentley SewerCAD V8i User’s Guide
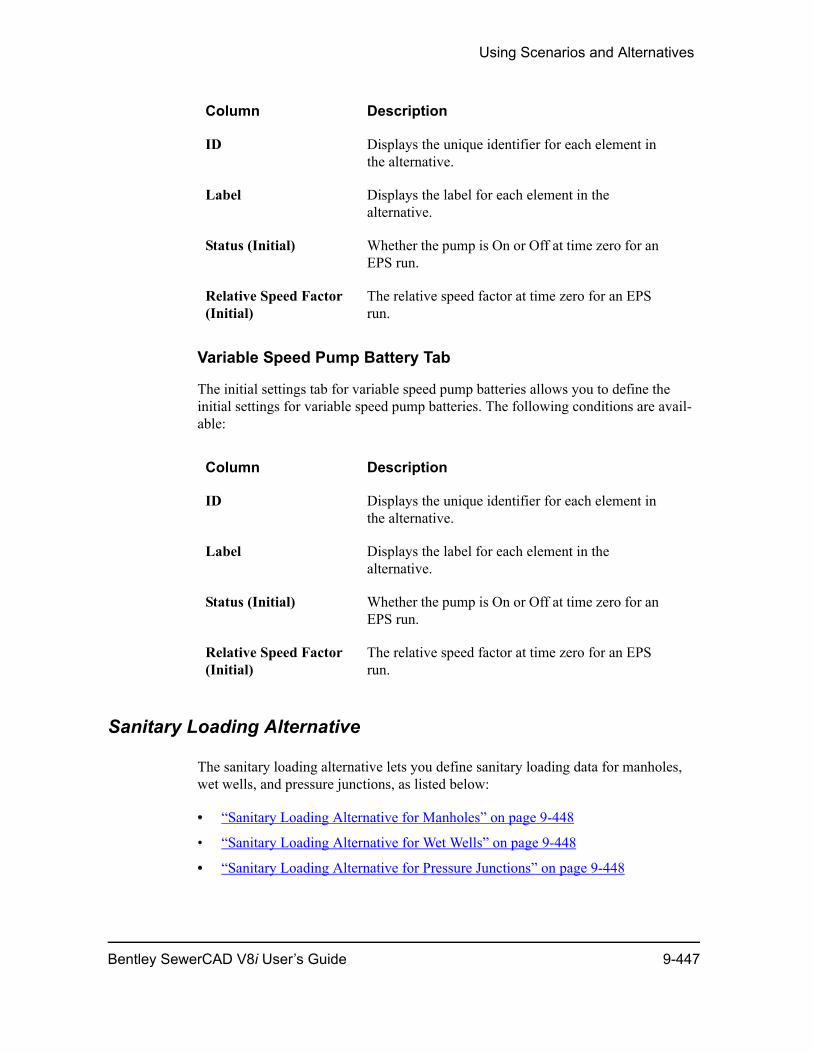
Using Scenarios and Alternatives
Variable Speed Pump Battery Tab
The initial settings tab for variable speed pump batteries allows you to define the initial settings for variable speed pump batteries. The following conditions are avail-able:
Sanitary Loading Alternative
The sanitary loading alternative lets you define sanitary loading data for manholes, wet wells, and pressure junctions, as listed below:
• “Sanitary Loading Alternative for Manholes” on page 9-448
• “Sanitary Loading Alternative for Wet Wells” on page 9-448
• “Sanitary Loading Alternative for Pressure Junctions” on page 9-448
Column Description
ID Displays the unique identifier for each element in the alternative.
Label Displays the label for each element in the alternative.
Status (Initial) Whether the pump is On or Off at time zero for an EPS run.
Relative Speed Factor (Initial)
The relative speed factor at time zero for an EPS run.
Bentley SewerCAD V8i User’s Guide 9-447
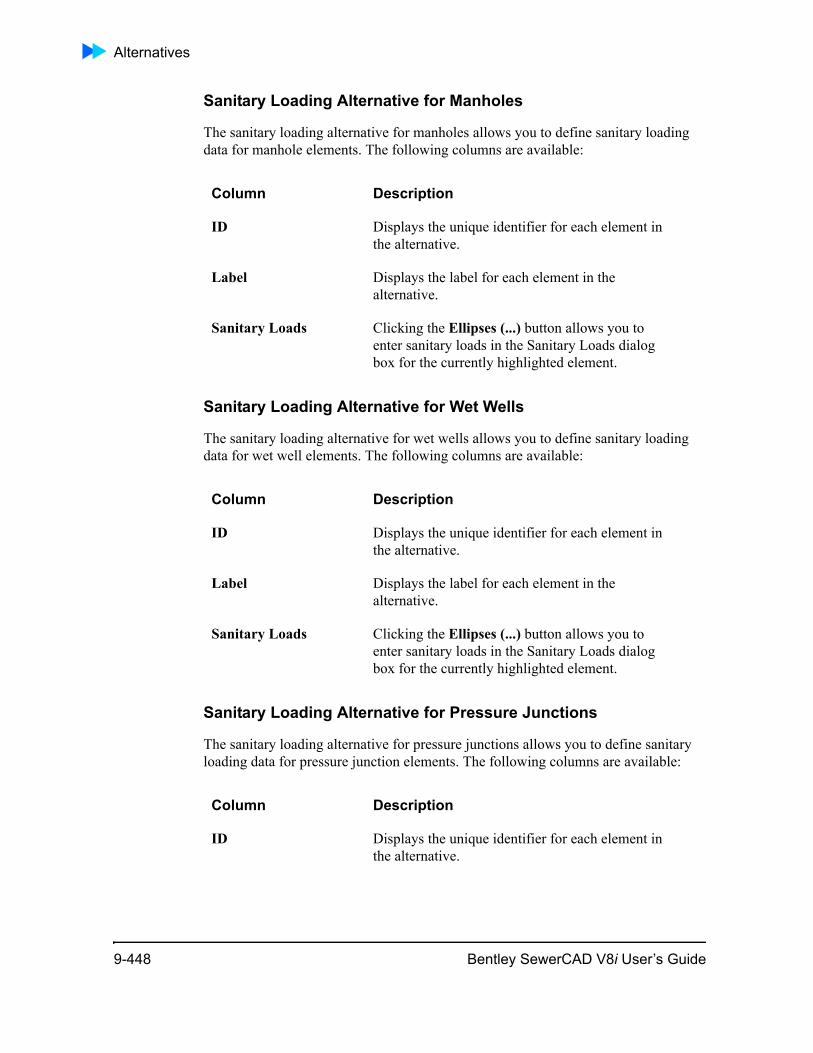
Alternatives
Sanitary Loading Alternative for Manholes
The sanitary loading alternative for manholes allows you to define sanitary loading data for manhole elements. The following columns are available:
Sanitary Loading Alternative for Wet Wells
The sanitary loading alternative for wet wells allows you to define sanitary loading data for wet well elements. The following columns are available:
Sanitary Loading Alternative for Pressure Junctions
The sanitary loading alternative for pressure junctions allows you to define sanitary loading data for pressure junction elements. The following columns are available:
Column Description
ID Displays the unique identifier for each element in the alternative.
Label Displays the label for each element in the alternative.
Sanitary Loads Clicking the Ellipses (...) button allows you to enter sanitary loads in the Sanitary Loads dialog box for the currently highlighted element.
Column Description
ID Displays the unique identifier for each element in the alternative.
9-448 Bentley SewerCAD V8i User’s Guide
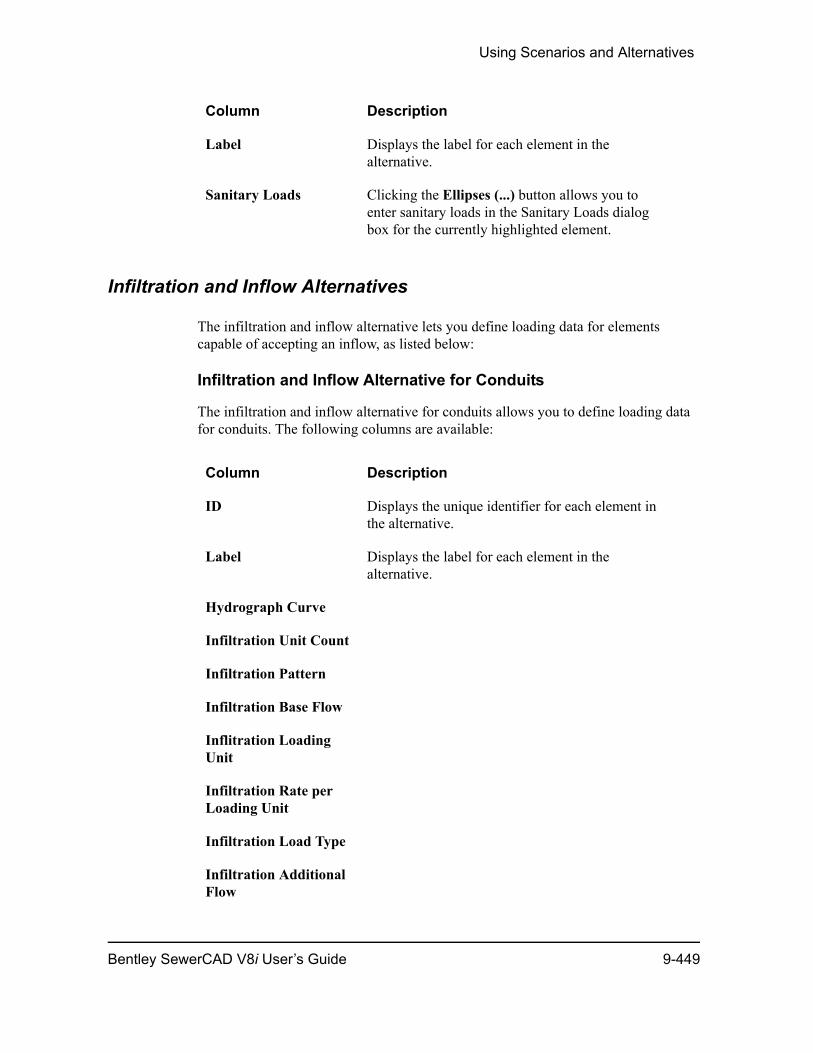
Using Scenarios and Alternatives
Infiltration and Inflow Alternatives
The infiltration and inflow alternative lets you define loading data for elements capable of accepting an inflow, as listed below:
Infiltration and Inflow Alternative for Conduits
The infiltration and inflow alternative for conduits allows you to define loading data for conduits. The following columns are available:
Label Displays the label for each element in the alternative.
Sanitary Loads Clicking the Ellipses (...) button allows you to enter sanitary loads in the Sanitary Loads dialog box for the currently highlighted element.
Column Description
Column Description
ID Displays the unique identifier for each element in the alternative.
Label Displays the label for each element in the alternative.
Hydrograph Curve
Infiltration Unit Count
Infiltration Pattern
Infiltration Base Flow
Inflitration Loading Unit
Infiltration Rate per Loading Unit
Infiltration Load Type
Infiltration Additional Flow
Bentley SewerCAD V8i User’s Guide 9-449
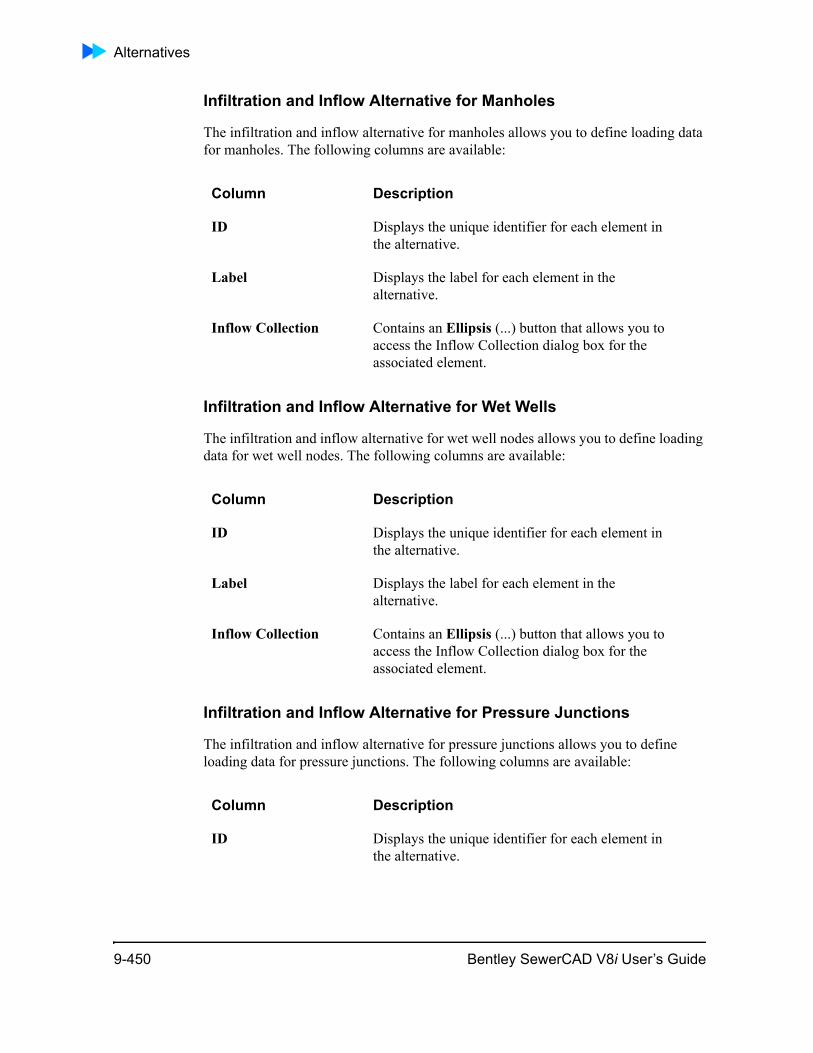
Alternatives
Infiltration and Inflow Alternative for Manholes
The infiltration and inflow alternative for manholes allows you to define loading data for manholes. The following columns are available:
Infiltration and Inflow Alternative for Wet Wells
The infiltration and inflow alternative for wet well nodes allows you to define loading data for wet well nodes. The following columns are available:
Infiltration and Inflow Alternative for Pressure Junctions
The infiltration and inflow alternative for pressure junctions allows you to define loading data for pressure junctions. The following columns are available:
Column Description
ID Displays the unique identifier for each element in the alternative.
Label Displays the label for each element in the alternative.
Inflow Collection Contains an Ellipsis (...) button that allows you to access the Inflow Collection dialog box for the associated element.
Column Description
ID Displays the unique identifier for each element in the alternative.
Label Displays the label for each element in the alternative.
Inflow Collection Contains an Ellipsis (...) button that allows you to access the Inflow Collection dialog box for the associated element.
Column Description
ID Displays the unique identifier for each element in the alternative.
9-450 Bentley SewerCAD V8i User’s Guide
Using Scenarios and Alternatives
System Flows Alternative
The system flows alternative allows you to specify additional and known flow, along with other contributing sources of water that are not part of the model. System flows indicate a final combined result.
System Flow Alternative for Manholes
The system flow alternative for manholes allows you to define known flow loading data for manholes. The following columns are available:
System Flow Alternative for Wet Wells
The system flow alternative for wet wells allows you to define known flow loading data for wet wells. The following columns are available:
Label Displays the label for each element in the alternative.
Inflow Collection Contains an Ellipsis (...) button that allows you to access the Inflow Collection dialog box for the associated element.
Column Description
Column Description
ID Displays the unique identifier for each element in the alternative.
Label Displays the label for each element in the alternative.
Flow (Known)
Column Description
ID Displays the unique identifier for each element in the alternative.
Label Displays the label for each element in the alternative.
Bentley SewerCAD V8i User’s Guide 9-451
Calculation Options
Operational Alternative
The Operational Alternative is where you can specify controls on pressure pipes, pumps, as well as valves. The Controlled field contains a Boolean (true or false) state-ment that indicates whether the network element is controlled. Clicking in this field activates a button that allows you to access the Controls dialog box and edit the controls for this element.
The Operational Controls alternative allows you to create, modify and manage both logical controls and logical control sets.
User Data Extensions Alternative
The User Data Alternative allows you to edit the data defined in the User Data Exten-sion command for each of the network element types. The User Data Alternative editor contains a tab for each type of network element.
Calculation OptionsEach scenario is associated with a set of calculation options. Calculation options are stored in a discrete Calculation Options Profile. Calculation Options Profiles are discussed in the chapter “Creating Your Model.”
For more information on Calculation Options Profiles, see “Creating Calculation Profiles” on page 8-434 and “Calculation Profile Attributes” on page 8-435.
Flow (Known)
Column Description
9-452 Bentley SewerCAD V8i User’s Guide
10
ChapterPresenting YourResults
Bentley SewerCAD V8i gives you several ways to present your network and results computed by the software.
Click one of the following links to learn how to present your network and results computed by Bentley SewerCAD V8i:
• “Using Background Layers” on page 10-453
• “Annotating Your Model” on page 10-462
• “Color Coding Your Model” on page 10-470
• “Using Profiles” on page 10-474
• “Viewing and Editing Data in FlexTables” on page 10-488
• “Reporting” on page 10-507
• “Graphing” on page 10-509
• “Chart Options Dialog Box” on page 10-520
• “Print Preview Window” on page 10-587
Using Background LayersUse background layers to display pictures behind your network. For example, you might want to display a picture of a neighborhood behind your network, so you can relate elements in your network to structures and roads depicted in the picture. You can add, delete, edit and rename background layers in the Background Layers Manager.
You can add multiple pictures to your project for use as background layers, and turn off the ones you don't want to show and turn on those you do. Additionally, you can create groups of pictures in folders, so you can hide or show an entire folder or group of pictures at once.
To add or delete background layers, open the Background Layers manager: click View > Background Layers (Ctrl+2).
Bentley SewerCAD V8i User’s Guide 10-453
Using Background Layers
You can use shapefiles, AutoCAD DXF files, and raster (also called bitmap) pictures as background images for your model. These raster image formats are supported: bmp, jpg, jpeg, jpe, jfif, gif, tif, tiff, png, and sid.
Click one of the following links to learn more about using background layers:
• “Background Layer Manager” on page 10-454
• “Working with Background Layer Folders” on page 10-456
• “Adding Background Layers” on page 10-457
• “Deleting Background Layers” on page 10-457
• “Editing Background Layers” on page 10-458
• “Renaming Background Layers” on page 10-458
• “Turning Background Layers On and Off” on page 10-458
• “Working with Background Layer Folders” on page 10-456
• “Shapefile Properties Dialog Box” on page 10-460
• “DXF Properties Dialog Box” on page 10-461
• “Performing ProjectWise Operations” on page 4-159
Background Layer Manager
Note: When multiple background layers are overlaid, priority is given to the one that appears highest in the list. In other words, a layer in the first list position is drawn “on top of” all other layers, since they are all below it on the list.
The Background Layer manager lets you add, edit, and remove and manage the back-ground layers that are associated with the project. The dialog box contains a list pane that displays each of the layers currently contained within the project, along with a number of button controls.
When a background layer is added, it appears in the Background Layers list pane, along with an associated check box that is used to control that layer’s visibility. Selecting the check box next to a layer causes that layer to become visible in the main drawing pane; clearing it causes it to become invisible. If the layers in the list pane are contained within one or more folders, clearing the check box next to a folder causes all of the layers within that folder to become invisible.
The toolbar consists of the following buttons:
10-454 Bentley SewerCAD V8i User’s Guide
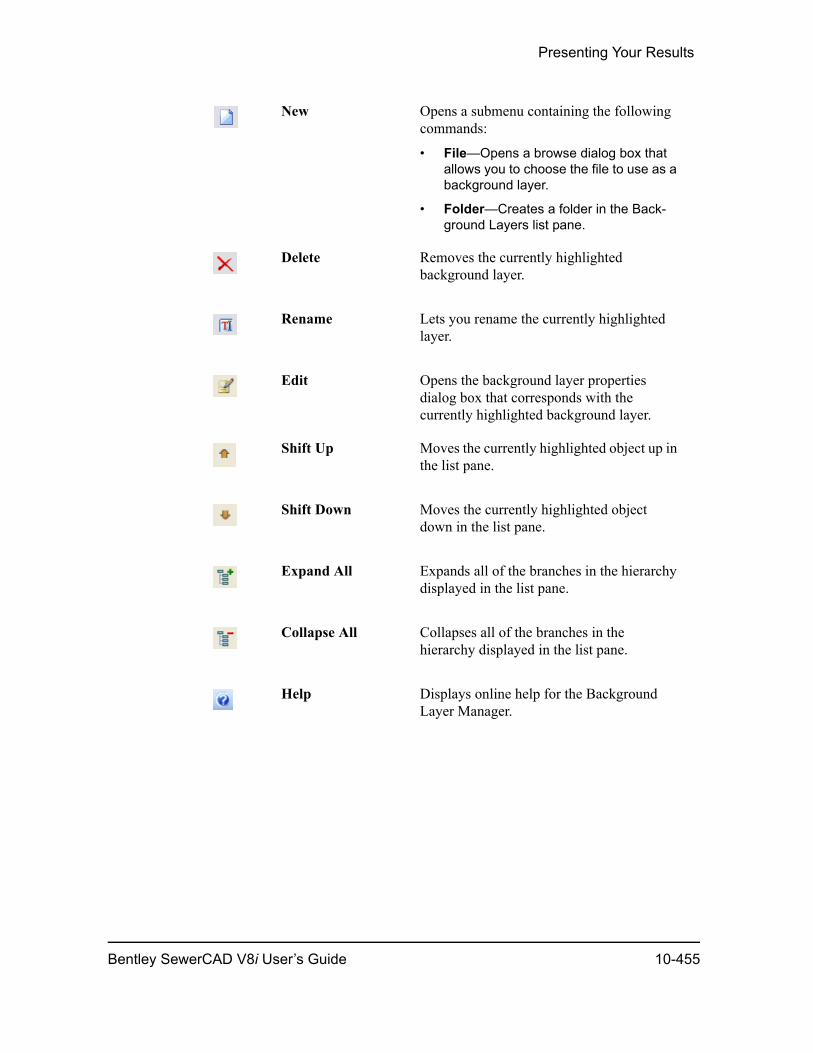
Presenting Your Results
New Opens a submenu containing the following commands:
• File—Opens a browse dialog box that allows you to choose the file to use as a background layer.
• Folder—Creates a folder in the Back-ground Layers list pane.
Delete Removes the currently highlighted background layer.
Rename Lets you rename the currently highlighted layer.
Edit Opens the background layer properties dialog box that corresponds with the currently highlighted background layer.
Shift Up Moves the currently highlighted object up in the list pane.
Shift Down Moves the currently highlighted object down in the list pane.
Expand All Expands all of the branches in the hierarchy displayed in the list pane.
Collapse All Collapses all of the branches in the hierarchy displayed in the list pane.
Help Displays online help for the Background Layer Manager.
Bentley SewerCAD V8i User’s Guide 10-455
Using Background Layers
Working with Background Layer Folders
You can create folders in the Background Layers Manager to organize your back-ground layers and create a group of background layers that can be turned off as one entity. You can also create folders within folders. When you start a new project, Bentley SewerCAD V8i displays an empty folder in the Background Layers Manager called Background Layers. New background layer files and folders are added to the Background Layers folder by default.
To add a background layer folder:
1. Click View > Background Layers to open the Background Layers Manager.
2. In the Background Layers Manager, click the New button, then click New Folder from the shortcut menu.
Or select the default Background Layers folder, then right-click and select New > Folder from the shortcut menu.
– If you are creating a new folder within an existing folder, select the folder, then click New > New Folder. Or right-click, then select New > Folder from the shortcut menu.
3. Right-click the new folder and select Rename from the shortcut menu.
4. Type the name of the folder, then press Enter.
To delete a background layer folder:
1. Click View > Background Layers to open the Background Layers Manager.
2. In the Background Layers Managers, select the folder you want to delete, then click the Delete button.
– You can also right-click a folder to delete, then select Delete from the shortcut menu.
To rename a background layer folder:
1. Click View > Background Layers to open the Background Layers Manager.
2. In the Background Layers Managers, select the folder you want to rename, then click the Rename button.
– You can also right-click a folder to rename, then select Rename from the shortcut menu.
3. Type the new name of the folder, then press Enter.
– You can also rename a background layer folder by selecting the folder, then modifying its label in the Properties Editor.
10-456 Bentley SewerCAD V8i User’s Guide
Presenting Your Results
Adding Background Layers
You add background layers to your project using the Background Layers Manager. When you start a new project, Bentley SewerCAD V8i displays an empty folder in the Background Layers Manager called Background Layers. New background layer files and folders are added to the Background Layers folder by default.
To add a background layer:
1. Click View > Background Layers to open the Background Layers Manager.
2. In the Background Layers Managers, click the New button, then click New File from the shortcut menu.
Or right-click on the default Background Layers folder and select New > File from the shortcut menu.
– To add a new background layer file to an existing folder in the Background Layer Manager, select the folder, then click New > New File. Or right-click, then select New > File from the shortcut menu.
3. Navigate to the file you want to add as a background layer and select it.
– If you select a .dxf file, the DXF Properties dialog box opens. For more infor-mation, see “DXF Properties Dialog Box”.
– If you select a .shp the ShapeFile Properties dialog box opens. For more infor-mation, see “Shapefile Properties Dialog Box”.
– If you select a .bmp, .jpg, .jpeg, .jpe, .jfif, .gif, .tif, .tiff, .png, or .sid file, the Image Properties dialog box opens. For more information, see “Image Proper-ties Dialog Box”.
4. After you add the background layer, you might have to use the Pan button to move the layer within the drawing area; Zoom Extents does not center a background image.
Deleting Background Layers
To delete a background layer:
Select the background layer you want to delete, then click the Delete button.
Or, right-click the background layer, then select Delete from the shortcut menu.
Bentley SewerCAD V8i User’s Guide 10-457
Using Background Layers
Editing Background Layers
You can edit a background layer in two ways: you can edit its properties or its position in a list of background layers displayed in the Background Layers Manager.
To edit the properties of a background layer:
1. Select the background layer you want to edit.
2. Click the Edit button. A Properties dialog box opens.
– You can also right-click the background layer, then select Edit from the shortcut menu.
To change the position of a background layer in the list of background layers:
The order of a background layer determines its Z level and what displays if you use more than one background layer. Background layers at the top of the list display on top of the other background layers in the drawing pane; so, background layers that are lower than the top one in the list might be hidden or partially hidden by layers above them in the list.
Select the background layer whose position you want to change in the list of Back-ground Layers Manager, then click the Shift Up or Shift Down buttons to move the selected background layer up or down in the list.
Renaming Background Layers
To rename a background layer:
Select the background layer you want to rename, then click the Rename button.
Or, right-click the background layer that you want to rename, then select Rename from the shortcut menu.
Turning Background Layers On and Off
You can choose to turn your background layers off by clearing the check box next to the background layer file or folder than contains it in the Background Layers Manager.
Image Properties Dialog Box
This dialog box opens when you are adding or editing a background-layer image other than a .dxf or .shp. Use the following controls to define the properties of the back-ground layer:
10-458 Bentley SewerCAD V8i User’s Guide
Presenting Your Results
Image Filter Lets you more clearly display background images that you resize. Set this to Point, Bilinear, or Trilinear. These are methods of displaying your image on-screen.
• Point works well when you are not changing the size of the image in the display, for example, when you are displaying a 500 x 500 pixel image at 100% using 500 x 500 pixels on-screen.
• Bilinear and Trilinear work well when you display your image on-screen using more or fewer pixels than your image contains, such as displaying a 500 x 500 pixel image at by stretching it to 800 x 800 pixels on-screen. Trilinear gives you smoother transitions when you zoom in and out of the image.
Transparency Lets you set the transparency level of the background layer. Bentley SewerCAD V8i lets you add transparency to any image type you use as a background. Bentley SewerCAD V8i ignores any transparency that exists in the image before you use it as a background.
Resolution Lets you select the clarity for MrSID® images that you use as background images. Because using a higher level of clarity or resolution increases the time it takes to display a MrSID image, you can select the resolution that best meets your needs. For formats other than MrSID, this drop-down list contains only one selection.
Bentley SewerCAD V8i User’s Guide 10-459
Using Background Layers
You can also use BMP and JPG image files. For more information, see “How Do I Enter the Scale of a Background Image If it is a File Type without an Inherent Scale?” on page 16-919.
Shapefile Properties Dialog Box
The Shapefile Properties dialog box lets you define a shapefile background layer. Use the following controls to define the properties of the background layer:
Use Compression This checkbox lets you compress the image in memory so that it takes up less RAM while it is being loaded. When you check this option, you may see slight color distortion in the image.
Note: The way the image is compressed depends on your computer’s video card. Not all video cards support this feature. If you check this option but your computer’s video card does not support image compression, the request for compression will simply be ignored and the image will be loaded uncompressed.
Image Position Table Lets you position the background layer with respect to your drawing.
• X/Y Image displays the size of the image you are using for a background and sets its posi-tion with respect to the origin of your drawing. You cannot change this data.
• X/Y Drawing displays where the corners of the image your are using will be positioned rela-tive to your drawing. By default, no scaling is used. However, you can scale the image you are using by setting different locations for the corners of the image you are importing. The locations you set are relative to the origin of your Bentley SewerCAD V8i drawing.
Filename Lists the path and filename of the shapefile to use as a background layer.
10-460 Bentley SewerCAD V8i User’s Guide
Presenting Your Results
To access the Shapefile Properties dialog box, click New File in the Background Layers manager, then select an .shp file.
DXF Properties Dialog Box
The DXF Properties dialog box lets you define a .dxf file as the background layer. Use the following controls to define the properties of the background layer:
Browse Opens a browse dialog box, letting you select the file to be used as a background layer.
Label Identifies the background layer.
Unit Lets you select the unit associated with the spatial data within the shapefile. For example, if the X and Y coordinates of the shapefile represent feet, choose ft. from the drop-down list.
Transparency Lets you specify the transparency level of the background layer, where 0 has the least transparency and 100 has the most.
Line Color Sets the color of the layer elements. Click the Ellipsis (...) button to open a Color palette containing more color choices.
Line Thickness Sets the thickness of the outline of the layer elements. Use values beginning at 0, where 0 is the minimum thickness and larger values are thicker.
Fill Color Sets the fill color of the layer elements. Click the Ellipsis (...) button to open a Color palette containing more color choices.
Fill Figure Lets you show or hide the selected fill color for the layer elements. Select this check box to display the selected background color; clear it to turn off the background color and only the outline displays.
Filename Lists the path and filename of the .dxf file to use as a background layer.
Bentley SewerCAD V8i User’s Guide 10-461
Annotating Your Model
To access the .dxf properties, click New File In the Background Layers manager, then select a .dxf file.
Annotating Your ModelYou can annotate any of the element types in Bentley SewerCAD V8i.
To work with annotations, open the Element Symbology manager: click View > Element Symbology (Ctrl+1).
Click one of the following links to learn more about annotating your model:
• “Element Symbology Manager” on page 10-463
• “Using Folders in the Element Symbology Manager” on page 10-465
Browse Opens a browse dialog box, letting you select the file to be used as a background layer.
Label Identifies the background layer.
Unit Lets you select the unit associated with the spatial data within the shapefile. For example, if the X and Y coordinates of the shapefile represent feet, choose ft. from the drop-down list.
Transparency Lets you specify the transparency level of the background layer, where 0 has the least transparency and 100 has the most.
Line Color Sets the color of the layer elements. Click the Ellipsis (...) button to open a Color palette containing more color choices.
Default Color Lets you use the line color included in the .dxf file or lets you use a custom color that you select in the Line Color field. Select this check box to use the default color included in the .dxf file. cleared this check box if you want to choose a custom color from the Line Color field.
Symbol Lets you choose the symbol that is displayed for each point element in the .dxf.
Size Sets the size of the symbol for each point element in the .dxf.
10-462 Bentley SewerCAD V8i User’s Guide
Presenting Your Results
• “Adding Annotations” on page 10-466
• “Deleting Annotations” on page 10-467
• “Editing Annotations” on page 10-467
• “Renaming Annotations” on page 10-467
• “Annotation Properties Dialog Box” on page 10-468
Element Symbology Manager
The Element Symbology manager allows you to control the way that elements and their associated labels are displayed. The dialog box contains a pane that lists each element type along with the following buttons:
The toolbar consists of the following buttons:
Bentley SewerCAD V8i User’s Guide 10-463
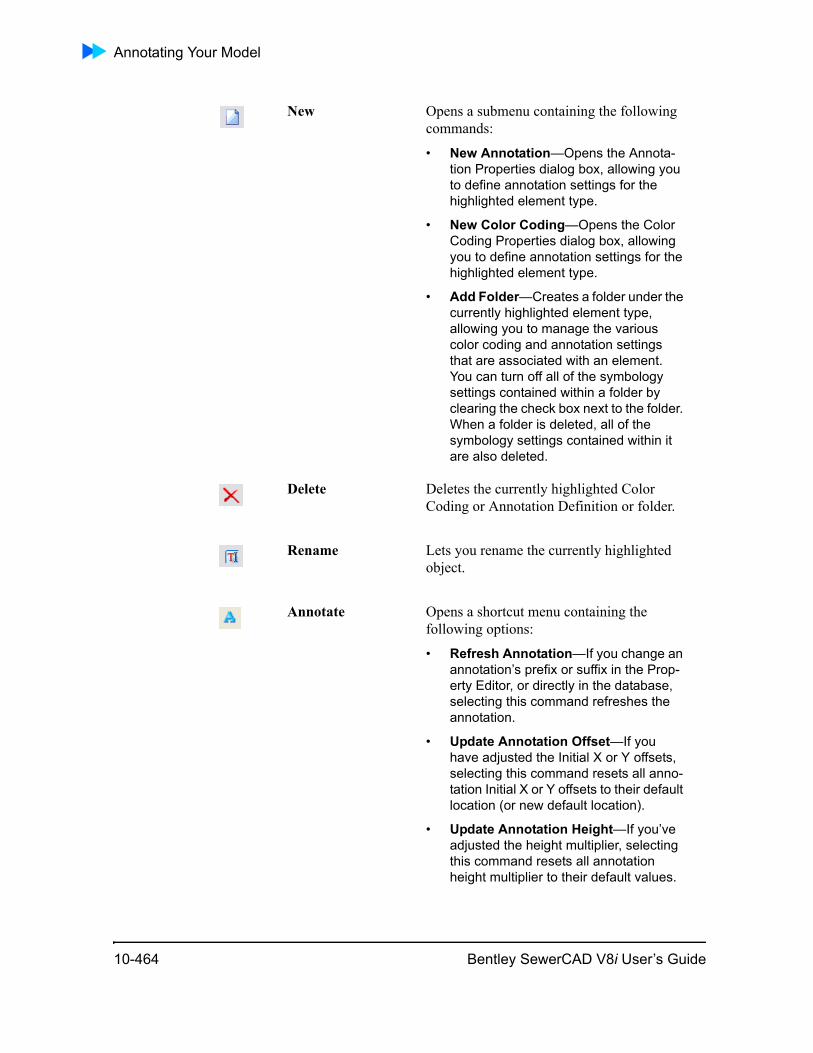
Annotating Your Model
New Opens a submenu containing the following commands:
• New Annotation—Opens the Annota-tion Properties dialog box, allowing you to define annotation settings for the highlighted element type.
• New Color Coding—Opens the Color Coding Properties dialog box, allowing you to define annotation settings for the highlighted element type.
• Add Folder—Creates a folder under the currently highlighted element type, allowing you to manage the various color coding and annotation settings that are associated with an element. You can turn off all of the symbology settings contained within a folder by clearing the check box next to the folder. When a folder is deleted, all of the symbology settings contained within it are also deleted.
Delete Deletes the currently highlighted Color Coding or Annotation Definition or folder.
Rename Lets you rename the currently highlighted object.
Annotate Opens a shortcut menu containing the following options:
• Refresh Annotation—If you change an annotation’s prefix or suffix in the Prop-erty Editor, or directly in the database, selecting this command refreshes the annotation.
• Update Annotation Offset—If you have adjusted the Initial X or Y offsets, selecting this command resets all anno-tation Initial X or Y offsets to their default location (or new default location).
• Update Annotation Height—If you’ve adjusted the height multiplier, selecting this command resets all annotation height multiplier to their default values.
10-464 Bentley SewerCAD V8i User’s Guide
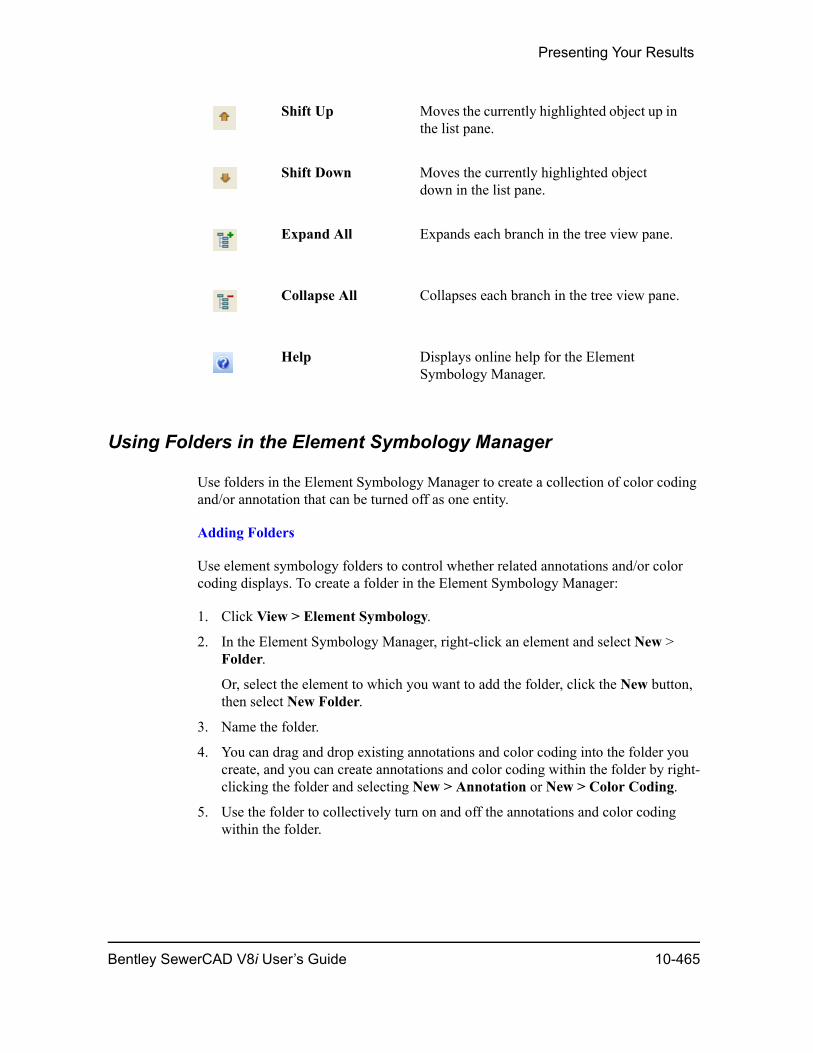
Presenting Your Results
Using Folders in the Element Symbology Manager
Use folders in the Element Symbology Manager to create a collection of color coding and/or annotation that can be turned off as one entity.
Adding Folders
Use element symbology folders to control whether related annotations and/or color coding displays. To create a folder in the Element Symbology Manager:
1. Click View > Element Symbology.
2. In the Element Symbology Manager, right-click an element and select New > Folder.
Or, select the element to which you want to add the folder, click the New button, then select New Folder.
3. Name the folder.
4. You can drag and drop existing annotations and color coding into the folder you create, and you can create annotations and color coding within the folder by right-clicking the folder and selecting New > Annotation or New > Color Coding.
5. Use the folder to collectively turn on and off the annotations and color coding within the folder.
Shift Up Moves the currently highlighted object up in the list pane.
Shift Down Moves the currently highlighted object down in the list pane.
Expand All Expands each branch in the tree view pane.
Collapse All Collapses each branch in the tree view pane.
Help Displays online help for the Element Symbology Manager.
Bentley SewerCAD V8i User’s Guide 10-465
Annotating Your Model
Note: You can refresh the display of all color-codings/annotations within a folder by right-clicking the folder and selecting the Refresh Group command.
In the Microstation version, the Refresh Group command will override any local modifications made to color or weight settings applied to individual elements using Microstation commands. These elements will revert to the SewerCAD V8i symbology settings after a Refresh Group command is initiated.
Deleting Folders
Click View > Element Symbology. In the Element Symbology Manager, right-click the theme folder you want to delete, then select Delete.
Or, select the folder you want to delete, then click the Delete button.
Renaming Folders
Click View > Element Symbology. In the Element Symbology Manager, right-click the theme folder you want to rename, then select Rename.
Or, select the folder you want to rename, then click the Rename button.
Adding Annotations
To add an annotation:
1. Click View > Element Symbology.
2. In the Element Symbology Manager, right-click an element and select New > Annotation.
Or, select the element to which you want to add the annotation, click the New button, and select New Annotation.
3. The Annotation Properties dialog box opens. Select the annotation you want in the Field drop-down list.
If you don’t find the Field you want to use immediately, look carefully through the list of available field selections from top to bottom to make sure you didn’t miss the field you want.
4. If needed, set a Prefix or Suffix. Anything you type as a prefix is added directly to the beginning of the label, and anything you type as a suffix is added to the end (so, you may want to include spaces as part of your prefix and suffix).
10-466 Bentley SewerCAD V8i User’s Guide
Presenting Your Results
Note: If you add an annotation that uses units, you can type “%u” in the prefix or suffix field to display the units in the drawing pane.
5. Select the initial X- and Y- offset for the annotation. Offset is measured from the center of the node or polygon or midpoint of the polyline.
6. If needed, set an initial height multiplier. Use a number greater than 1 to make the annotation larger, and a number between 0 and 1 to make the annotation smaller. If you use a negative number, the annotation is flipped (rotated 180 degrees).
7. If you have created selection sets, you can apply your annotation only to a partic-ular selection set by selecting that set from the Selection Set drop-down list. If you have not created any selection sets, then the annotation is applied to all elements of the type you are using.
8. After you finish defining your annotation, click OK to close the Annotation Prop-erties dialog box and create your annotation, or Cancel to close the dialog box without creating an annotation.
Deleting Annotations
Click View > Element Symbology. In the Element Symbology Manager, right-click an annotation you want to delete, then select Delete.
Or, select the annotation you want to delete, then click the Delete button.
Editing Annotations
Click View > Element Symbology. In the Element Symbology Manager, right-click the annotation you want to edit, then select Edit.
Or, select the annotation you want to edit, then click the Edit button.
Note: Changes to annotation settings may not be visible in the drawing pane immediately. To refresh the drawing view to reflect any changes that have been made, you can right-click the annotation that was edited in the Element Symbology Manager and select the Re-Apply Annotation command from the submenu that appears.
Renaming Annotations
Click View > Element Symbology. In the Element Symbology Manager, right-click the annotation you want to rename, then select Rename.
Or, select the annotation you want to rename, then click the Rename button.
Bentley SewerCAD V8i User’s Guide 10-467
Annotating Your Model
Annotation Properties Dialog Box
The Annotation Properties dialog box allows you to define annotation settings for each element type.
This dialog box allows you to define annotation settings for each element type. The dialog box consists of a list pane on the left and a control section on the right. The control section in the right side of the dialog allow you to edit the settings for the annotation that is currently highlighted in the list pane.
The dialog box consists of the following buttons:
and the following controls:
New Creates a new annotation in the list pane.
Delete Deletes the annotation that is currently highlighted in the list pane.
Rename Lets you rename the annotation that is currently highlighted in the list pane.
List Pane
Label Displays the name of the current annotation definition.
Initial X Offset Displays the initial X-axis offset of the annotation in feet.
Initial Y Offset Displays the initial Y-axis offset of the annotation in feet.
Selected Annotation
Field Name Lets you specify the attribute that is displayed by the annotation definition.
Free Form This field is only available when <Free Form Annotation> is selected in the Field Name list. Click the ellipsis button to open the Free Form Annotation dialog box.
10-468 Bentley SewerCAD V8i User’s Guide
Presenting Your Results
Free Form Annotation Dialog Box
The Free Form Annotation dialog box allows you to type custom annotations for an element type.
Prefix Lets you specify a prefix that is displayed before the attribute value annotation for each element to which the definition applies.
Suffix Lets you specify a suffix that is displayed after the attribute value annotation for each element to which the definition applies.
Note: If you add an annotation that uses units, you can type “%u” in the prefix or suffix field to display the units in the drawing pane.
Selection Set Lets you specify a selection set to which the annotation settings will apply. If the annotation is to be applied to all elements, select the <All Elements> option in this field. <All Elements> is the default setting.
Initial Offset If checked, the values in the X and Y fields will be applied to all annotations (that are associated with the current annotation definition) in the drawing when the Apply button is clicked.
X Sets the initial horizontal offset for an annotation. Set this at the time you create the annotation.
Y Sets the initial vertical offset for an annotation. Set this at the time you create the annotation.
Initial Multiplier If checked, the value in the Height Multiplier field will be applied to all annotations (that are associated with the current annotation definition) in the drawing when the Apply button is clicked.
Initial Height Multiplier Sets the initial size of the annotation text. Set this at the time you create the annotation.
Bentley SewerCAD V8i User’s Guide 10-469
Color Coding Your Model
To create an annotation, type the text as you want it to appear in the drawing. You can add element attributes to the text string by clicking the Append button and selecting the attribute from the categorized list.
Zoom Dependent Visibility
Available through the Properties dialog box of each layer in the Element Symbology manager, this feature can be used to cause elements, decorations, and annotations to only appear in the drawing pane when the view is within the zoom range specified by the Minimum and Maximum Zoom values.
• Enabled: Set to true to enable and set to false to disable Zoom Dependent Visi-bility.
• Minimum Zoom (%): The lowest zoom level at which the element will appear in the drawing pane.
• Maximum Zoom (%) : The highest zoom level at which the element will appear in the drawing pane.
• Apply to Element: Set to true to apply the zoom minimums and maximums to the symbols in the drawing.
• Apply to Decorations: Set to true to apply the zoom minimums and maximums to flow arrows, check valves, and constituent sources in the drawing.
• Apply to Annotations: Set to true to apply the zoom minimums and maximums to labels in the drawing.
Color Coding Your ModelUse color coding to help you quickly see what's going on in your Bentley SewerCAD V8i model. Use color coding to change the color and/or size of elements based on the value of data that you select, such as flow or element size.
To work with color coding, open the Element Symbology manager: click View > Element Symbology (Ctrl+1).
Click one of the following links to learn more about color coding your model:
• “Element Symbology Manager” on page 10-463
• “Using Folders in the Element Symbology Manager” on page 10-465
• “Adding Color-Coding” on page 10-471
• “Deleting Color-Coding” on page 10-471
• “Editing Color-Coding” on page 10-472
10-470 Bentley SewerCAD V8i User’s Guide

Presenting Your Results
• “Renaming Color-Coding” on page 10-472
• “Adding Color-Coding” on page 10-471
Adding Color-Coding
To add color coding, including element sizing:
1. Click View > Element Symbology.
2. In the Element Symbology Manager, right-click an element and select New > Color Coding.
Or, select the element to which you want to add the color coding, click the New button, and select New Color Coding.
3. The Color Coding Properties dialog box opens. Select the properties for which you want to color code from the Field and Selection Set drop-down lists.
4. In the Options drop-down list, select whether you want to apply color and/or size to the elements you are coding.
a. Click Calculate Range. This automatically sets the maximum and minimum values for your coding. If you want, you can set these values manually.
b. Click Initialize. This automatically creates values and colors in the Color Map. If you want, you can set these values manually.
5. After you finish defining your color coding, click OK to close the Color Coding Properties dialog box and create your color coding, or Cancel to close the dialog box without creating a color coding.
6. Click Compute to compute your network.
7. To see the network color coding and/or sizing change over time:
a. Click View > EPS Results Browser, if needed, to open the EPS Results Browser dialog box.
b. Click Play to use the EPS Results Browser to review your color coding over time.
Deleting Color-Coding
Click View > Element Symbology. In the Element Symbology Manager, right-click the color coding you want to delete, then select Delete.
Or, select the color coding you want to delete, then click the Delete button.
Bentley SewerCAD V8i User’s Guide 10-471

Color Coding Your Model
Editing Color-Coding
Click View > Element Symbology. In the Element Symbology Manager, right-click the color coding you want to edit, then select Edit.
Or, select the color coding you want to edit, then click the Edit button.
Note: Changes to color coding settings may not be visible in the drawing pane immediately. To refresh the drawing view to reflect any changes that have been made, you can right-click the annotation that was edited in the Element Symbology Manager and select the Refresh Color Coding command from the submenu that appears.
Renaming Color-Coding
Click View > Element Symbology. In the Element Symbology manager, right-click the color coding you want to rename, then select Rename.
Or, select the color coding you want to rename, then click the Rename button.
Color-Coding Properties Dialog Box
This dialog box allows you to define color coding for each element type. The dialog box consists of the following controls:
Properties
Field Name Lets you select the attribute by which the color coding is applied.
Selection Set Lets you apply a color coding to a previously defined selection set.
10-472 Bentley SewerCAD V8i User’s Guide
Presenting Your Results
Calculate Range Automatically finds the minimum and maximum values for the selected attribute and enters them in the appropriate Min. and Max fields.When you click this button a submenu appears, allowing you to choose between the following options:
• Full Range: This option gets all values across all time steps for a particular element type.
• Quick Range: This option only takes values from a percentage of the time steps (for example, if there’s 100 time steps, Quick Range will sample only one in ten). For a large model with a large number of time steps this option can significantly increase the perfor-mance of the color coding tool.
Min Lets you define the minimum value of the attribute to be color coded.
Max Lets you define the maximum value of the attribute to be color coded.
Steps Lets you specify how many rows are created in the color maps table when you click Initialize. When you click Initialize, a number of values equal to the number of Steps are created in the color maps table. The low and high values are set by the Min and Max values you set.
Color Map
Options Lets you select whether you want to use color coding, sizing, or both to code and display your elements.
Bentley SewerCAD V8i User’s Guide 10-473
Using Profiles
Using ProfilesA profile is a graph that plots a particular attribute across a distance, such as ground elevation along a section of piping. As well as these side or sectional views of the ground elevation, profiles can be used to show other characteristics, such as hydraulic grade or pressure.
You define profiles by selecting a series of adjacent elements. Continous reaches of conduits, prismatic channels, pressure pipes, as well as their connecting nodes can be plotted in a profile. The profile you create displays the structures you selected, plus the relative ground and water elevations.
Color Maps Table Lets you map colors to value ranges for the attribute being color coded. The following buttons are found along the top of the table:
• New—Creates a new row in the Color Maps table.
• Delete—Deletes the currently high-lighted row from the Color Maps table.
• Initialize—Finds the range of values for the specified attribute, divides it into equal ranges based on the number of Steps you have set, and assigns a color to each range.
• Ramp—Generates a gradient range between two colors that you specify. Pick the color for the first and last values in the list, then Bentley SewerCAD V8i automatically sets intermediate colors for the other values. For example, picking red as the first color and blue as the last color produces varying shades of purple for the other values.
Above Range Color Displays the color that is applied to elements whose value for the specified attribute fall outside the range defined in the color maps table. This selection is available if you choose Color or Color and Size from the Options list.
Above Range Size Displays the size that is applied to elements whose value for the specified attribute fall outside the range defined in the color maps table. This selection is available if you choose Size or Color and Size from the Options list.
10-474 Bentley SewerCAD V8i User’s Guide
Presenting Your Results
The Profiles manager is a dockable window that lets you add, delete, rename, edit, and view profiles.
Click one of the following links to learn more about how to use profiles:
• “Profiles Manager” on page 10-475
• “Viewing Profiles” on page 10-476
• “Creating a New Profile” on page 10-477
• “Editing Profiles” on page 10-478
• “Deleting Profiles” on page 10-478
• “Renaming Profiles” on page 10-478
• “Profile Setup Dialog Box” on page 10-479
• “Profile Viewer Dialog Box” on page 10-480
Profiles Manager
The Profiles Manager allows you to create, view, and edit profile views of elements in the network. The dialog box contains a list pane that displays all of the profiles currently contained within the project, along with a toolbar.
The toolbar contains the following buttons:
New Opens the Profile Setup dialog box, allowing you to create a new profile.
Delete Deletes the currently highlighted profile.
Bentley SewerCAD V8i User’s Guide 10-475
Using Profiles
Viewing Profiles
To view a profile:
1. Click Compute to calculate flows.
2. Click View > Profiles to open the Profile manager.
3. In the Profile Manager:
a. Double-click the profile you want to view to open the Profile Viewer;
b. Select the profile you want to view, click the drop-down menu on the View Profile button, and select Profile to open the profile view;
c. Or select the profile you want to view, click the drop-down menu on the View Profile button, and select Engineering Profile to open the engineering profile view.
Note: You can edit your list of profile elements at any time and compute your network with the Profile Viewer dialog box open, but you must click Refresh to update the display of that dialog box if you do make changes.
4. If necessary, you can click Chart Settings to change the look of the profile, and use Print Preview and Print to print the profile.
Rename Lets you rename the currently highlighted profile.
Edit Opens the Profile Setup dialog box, allowing you to modify the settings of the currently highlighted profile.
View Opens a submenu containing the following commands:
• Profile: Opens the Profile Viewer, allowing you to view the currently high-lighted profile.
• Engineering Profile: Opens the Engi-neering Profile Viewer, allowing you to view the currently highlighted profile as an engineering profile.
Help Displays online help for the Profile Manager.
10-476 Bentley SewerCAD V8i User’s Guide
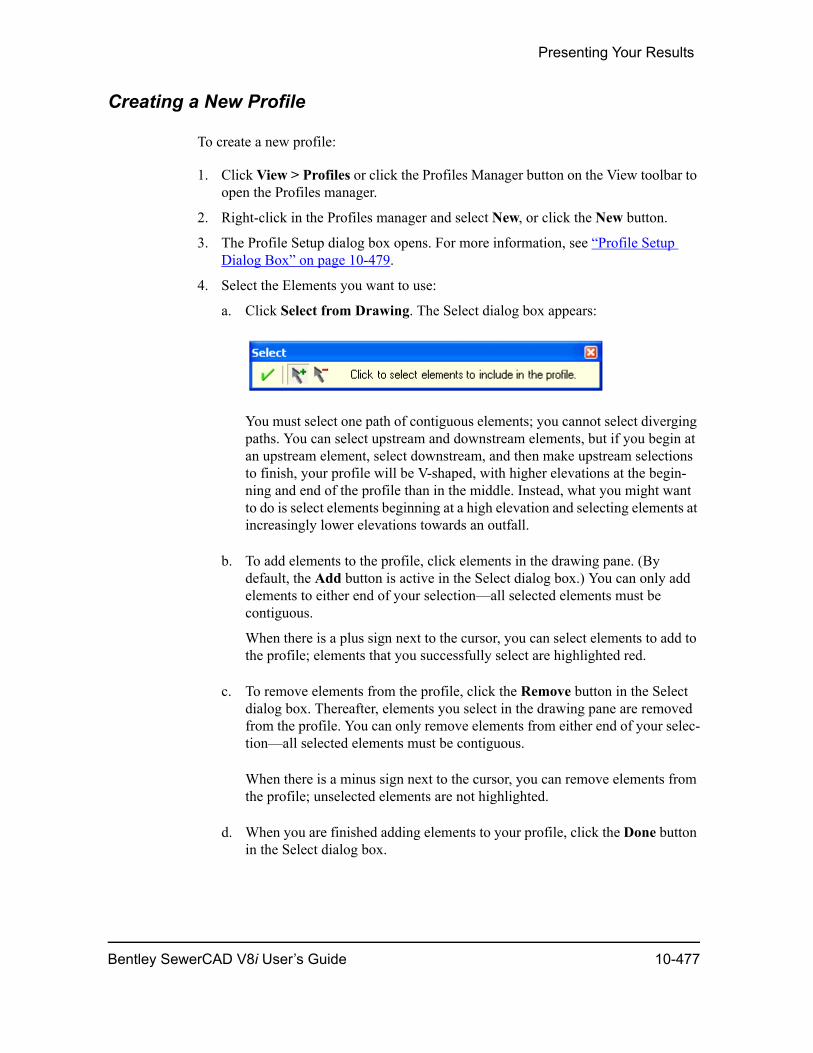
Presenting Your Results
Creating a New Profile
To create a new profile:
1. Click View > Profiles or click the Profiles Manager button on the View toolbar to open the Profiles manager.
2. Right-click in the Profiles manager and select New, or click the New button.
3. The Profile Setup dialog box opens. For more information, see “Profile Setup Dialog Box” on page 10-479.
4. Select the Elements you want to use:
a. Click Select from Drawing. The Select dialog box appears:
You must select one path of contiguous elements; you cannot select diverging paths. You can select upstream and downstream elements, but if you begin at an upstream element, select downstream, and then make upstream selections to finish, your profile will be V-shaped, with higher elevations at the begin-ning and end of the profile than in the middle. Instead, what you might want to do is select elements beginning at a high elevation and selecting elements at increasingly lower elevations towards an outfall.
b. To add elements to the profile, click elements in the drawing pane. (By default, the Add button is active in the Select dialog box.) You can only add elements to either end of your selection—all selected elements must be contiguous.
When there is a plus sign next to the cursor, you can select elements to add to the profile; elements that you successfully select are highlighted red.
c. To remove elements from the profile, click the Remove button in the Select dialog box. Thereafter, elements you select in the drawing pane are removed from the profile. You can only remove elements from either end of your selec-tion—all selected elements must be contiguous.
When there is a minus sign next to the cursor, you can remove elements from the profile; unselected elements are not highlighted.
d. When you are finished adding elements to your profile, click the Done button in the Select dialog box.
Bentley SewerCAD V8i User’s Guide 10-477
Using Profiles
5. The Profile Setup dialog box opens and displays a list of the elements you selected. If necessary, use the Reverse button to reverse the order of these elements, and the Select from Drawing or Remove buttons to add or remove elements from the list.
Note: You can edit your list of profile elements at any time and compute your network with the Profile Viewer dialog box open, but you must click Refresh to update the display of that dialog box if you do make changes.
6. Click Close and Open Profile to close the Profile Setup dialog box and open the Profile Viewer dialog box.
Editing Profiles
You can edit a profile to change the elements that it uses or the order in which those elements are used. To edit a profile:
1. Click View > Profiles to open the Profiles manager.
2. In the Profiles manager, right-click the profile you want to edit, then select Edit.
Or, select the profile you want to edit, then click the Edit button.
3. The Profile Setup dialog box opens. Modify the profile as needed and click OK to save your changes or Cancel to exit without saving your changes.
Deleting Profiles
Click View > Profiles to open the Profiles manager. In the Profiles manager, right-click the profile you want to delete, then select Delete.
Or, select the profile you want to delete, then click the Delete button.
Renaming Profiles
Click View > Profiles to open the Profiles manager. In the Profiles manager, right-click the profile you want to rename, then select Rename.
Or, select the profile you want to rename, then click the Rename button.
10-478 Bentley SewerCAD V8i User’s Guide
Presenting Your Results
Profile Setup Dialog Box
Setting up a profile is a matter of selecting the adjacent elements on which the profile is based. The Profile Setup dialog box includes the following options:
After everything is set up to your satisfaction, click OK to generate the plot of the profile.
Label Displays the list of elements that define the profile.
User Defined Station Check a box to enter a user defiined station.
Station This field displays the distance along the alignment of pipes. The field is automatically calculated unless you check the corresponding User Defined Station box; if the box is checked you can define the station.
Select From Drawing Lets you select and clear elements for the profile. You can select channels, conduits, and ponds for inclusion in your profile.
Note: In AutoCAD mode, you cannot use the shortcut menu, you must re-open the Profile Setup dialog box.
Reverse Lets you reverse the profile, so the first node in the list becomes the last, and the last node becomes the first.
Remove All Removes all elements from the profile.
Remove All Previous Removes all elements that appear before the selected element in the list. If the selected element is a pipe, the associated node is not removed.
Remove All Following Removes all elements that appear after the selected element in the list. If the selected element is a pipe, the associated node is not removed.
Open Engineering Profile
Closes the Profile Setup dialog and opens the Engineering Profile Viewer dialog box.
Open Profile Closes the Profile Setup dialog box and opens the Profile Viewer dialog box.
Bentley SewerCAD V8i User’s Guide 10-479

Using Profiles
Note: Results for gravity elements are available only for hydraulic time steps. Therefore some results will not be displayed in the profile view for gravity elements, such as HGL.
Profile Viewer Dialog Box
This dialog box displays the profile view of the profile run that is plotted from the Profile Manager. It consists of the profile display pane and the following controls:
Zoom Window Lets you magnify or reduce the display of a section of the graph. To zoom or magnify an area, select the Zoom Window tool, click to the left of the area you want to magnify, then drag the mouse to the right, across the area you want to magnify, so that the area you want to magnify is contained within the marquee that the Zoom Window tool draws. After you have selected the area you want to magnify, release the mouse button to stop dragging.To zoom out, or reduce the magnification, drag the mouse from right to left across the magnified image.
Zoom Extents Magnifies the profile so that the entire graph is displayed.
10-480 Bentley SewerCAD V8i User’s Guide
Presenting Your Results
Chart Settings Opens a submenu containing the following commands:• Display Annotation Labels: Lets you display or
hide labels for the elements in your profile plot.
• Profile Annotation Table: Lets you display or hide the profile element annotation table.
• HGL: Lets you display or hide the line repre-senting hydraulic grade line in the profile plot.
• EGL: Lets you display or hide the line repre-senting energy grade line in the profile plot.
• Legend: Lets you display or hide the profile plot legend.
• Axis Options: Opens the Axis Options dialog.
• Chart Options: Opens the Chart Options dialog box, letting you view and modify the display settings for the current profile plot. For more information, see “Chart Options Dialog Box” on page 10-520.
Warning! Never delete or rename any of the series entries on the Series Tab of the Chart Options dialog box. These series were specifically designed to enable the display of the Profile Plots.
• Export to DXF: Exports the profile view as a dxf file.
Print Prints the current view of the profile to your default printer. If you want to use a printer other than your default, use Print Preview to change the printer and print the profile.
Print Preview Opens a print preview window containing the current view of the profile. You can use the Print Preview dialog box to select a printer and preview the output before you print it.
Note: Do not change the print preview to grayscale, as doing so might hide some elements of the display.
Bentley SewerCAD V8i User’s Guide 10-481
Using Profiles
Copy Copies the contents of the Profile Viewer dialog box as an image to the Windows clipboard, from where you can paste it into another application, such as Microsoft® Word® or Adobe® Photoshop®.
Zoom Extents Magnifies the profile so that the entire graph is displayed.
Zoom Lets you magnify or reduce the display of a section of the graph. To zoom or magnify an area, select the Zoom Window tool, click to the left of the area you want to magnify, then drag the mouse to the right, across the area you want to magnify, so that the area you want to magnify is contained within the marquee that the Zoom Window tool draws. After you have selected the area you want to magnify, release the mouse button to stop dragging. To zoom out, or reduce the magnification, drag the mouse from right to left across the magnified image.
EPS Results Browsers The following EPS Results Browsers are found to the right of the Refresh button:
• Rewind (Full)—Sets the currently displayed time step to the beginning of the simulation.
• Pause—Stops the animation. Restarts it again with another click.
• Play—Advances the currently displayed time step from beginning to end.
• Time Display—Shows the current time step that is displayed in the drawing pane.
• Time Slider—Lets you manually move the slider representing the currently displayed time step along the bar, which represents the full length of time that the scenario encom-passes
10-482 Bentley SewerCAD V8i User’s Guide
Presenting Your Results
Note: Results for gravity elements are available only for hydraulic time steps. Therefore some results will not be displayed in the profile view for gravity elements, such as HGL.
Axis Options Dialog Box
This dialog allows you to define the scale of the profile plot. Specify a unit, enter a value for the Horizontal and vertical axes, and specify whether the direction is measured from Left to Right or Right to Left.
Engineering Profile Viewer Dialog Box
This dialog box displays the profile view of the profile run that is plotted from the Profile Manager. It consists of the profile display pane and the following controls:
Zoom Window Lets you magnify or reduce the display of a section of the graph. To zoom or magnify an area, select the Zoom Window tool, click to the left of the area you want to magnify, then drag the mouse to the right, across the area you want to magnify, so that the area you want to magnify is contained within the marquee that the Zoom Window tool draws. After you have selected the area you want to magnify, release the mouse button to stop dragging.To zoom out, or reduce the magnification, drag the mouse from right to left across the magnified image.
Zoom Extents Magnifies the profile so that the entire graph is displayed.
Bentley SewerCAD V8i User’s Guide 10-483
Using Profiles
Chart Settings Opens a submenu containing the following commands:• Display Annotation Labels: Lets you display or
hide labels for the elements in your profile plot.
• Profile Annotation Table: Lets you display or hide the profile element annotation table.
• HGL: Lets you display or hide the line repre-senting hydraulic grade line in the profile plot.
• EGL: Lets you display or hide the line repre-senting energy grade line in the profile plot.
• Legend: Lets you display or hide the profile plot legend.
• Axis Options: Opens the Axis Options dialog.
• Chart Options: Opens the Chart Options dialog box, letting you view and modify the display settings for the current profile plot. For more information, see “Chart Options Dialog Box” on page 10-520.
Warning! Never delete or rename any of the series entries on the Series Tab of the Chart Options dialog box. These series were specifically designed to enable the display of the Profile Plots.
• Export to DXF: Exports the profile view as a dxf file.
Print Prints the current view of the profile to your default printer. If you want to use a printer other than your default, use Print Preview to change the printer and print the profile.
Print Preview Opens a print preview window containing the current view of the profile. You can use the Print Preview dialog box to select a printer and preview the output before you print it.
Note: Do not change the print preview to grayscale, as doing so might hide some elements of the display.
10-484 Bentley SewerCAD V8i User’s Guide

Presenting Your Results
Engineering Profile Options
This dialog allows you to change various display options for engineering profiles. It is divided into the following tabs:
Copy Copies the contents of the Profile Viewer dialog box as an image to the Windows clipboard, from where you can paste it into another application, such as Microsoft® Word® or Adobe® Photoshop®.
Zoom Extents Magnifies the profile so that the entire graph is displayed.
Zoom Lets you magnify or reduce the display of a section of the graph. To zoom or magnify an area, select the Zoom Window tool, click to the left of the area you want to magnify, then drag the mouse to the right, across the area you want to magnify, so that the area you want to magnify is contained within the marquee that the Zoom Window tool draws. After you have selected the area you want to magnify, release the mouse button to stop dragging. To zoom out, or reduce the magnification, drag the mouse from right to left across the magnified image.
EPS Results Browsers The following EPS Results Browsers are found to the right of the Refresh button:
• Rewind (Full)—Sets the currently displayed time step to the beginning of the simulation.
• Pause—Stops the animation. Restarts it again with another click.
• Play—Advances the currently displayed time step from beginning to end.
• Time Display—Shows the current time step that is displayed in the drawing pane.
• Time Slider—Lets you manually move the slider representing the currently displayed time step along the bar, which represents the full length of time that the scenario encom-passes
Bentley SewerCAD V8i User’s Guide 10-485
Using Profiles
Axis Tab
This tab contains the following controls:
• Scale: Allows you to define the horizontal and vertical scale of the engineering profile view.
• Direction: Allows you to choose the direction in which elements are displayed in the engineering profile view.
• Axis Labeling: Allows you to choose where to place the labels along the axis of the engineering profile view.
• Automatic Scaling: When this box is checked the scaling is handled automati-cally and the Minimum and Maximum fields are not editable. When this box is not checked you can define the Minimum and Maximum fields.
• Minimum: The left-most station. When Automatic Scaling is checked this field is not editable.
• Maximum: The right-most station. When Automatic Scaling is checked this field is not editable.
• Increment: The length between intermediate values.
Drawing Tab
This tab contains the following controls:
• Text Height Multiplier: Increases or decreases the size of the text by the factor indicated.
• Ground Elevation Line Width: This field allows you to define the width of the ground elevation line in the engineering profile view.
• Structure Line Width: This field allows you to define the width of structure lines in the engineering profile view.
• HGL Line Width: This field allows you to define the width of the hydraulic grade line in the engineering profile view.
• EGL Line Width: This field allows you to define the width of the energy grade line in the engineering profile view.
Layers Tab
This tab allows you to select the color and/or change the visibility of the various elements of the profile view. Uncheck the Is Visible box to turn the corresponding element off in the engineering profile view. Click the Layer Color to access the color menu to change the color of the corresponding element in the engineering profile view.
10-486 Bentley SewerCAD V8i User’s Guide
Presenting Your Results
Ground Profile Options
This dialog allows you to define the line representing ground elevation in the engi-neering profile view.
By default, the Elevation Data Type is set to Automatic. If you change it to Ground Elevation/Depth Curve, you can use the Station vs. Elevation table to define the ground elevation. Click the New button to add a row to the table or Delete to remove the currently highlighted row. Click the Import button to import ground elevation data from a Tab-delimited text file.
Annotation Properties Dialog Box
This dialog allows you to modify the settings of the profile annotation for nodes. The following controls are available:
• Horizontal Justification: This control allows you to select the horizontal (left-to-right) placement of the annotation over the annotated element.
• Vertical Justification: This control allows you to select the vertical (up-and-down) placement of the annotation over the annotated element.
• Rotation: This control allows you to enter the angle of rotation of the annotation over an annotated element.
• Show Leader Line: When this box is checked, a line is drawn between the anno-tation and the associated element.
• Show Leader Arrow: When this box is checked, an arrow is drawn pointing to the associated element.
Link Annotation Properties Dialog Box
This dialog allows you to modify the settings of the profile annotation for links. The following controls are available:
• Align Text With Pipes: When this box is checked the annotation will align with the angle of the corresponding pipe.
• Horizontal Justification: This control allows you to select the horizontal (left-to-right) placement of the annotation over the annotated element.
• Vertical Justification: This control allows you to select the vertical (up-and-down) placement of the annotation over the annotated element.
• Rotation: This control allows you to enter the angle of rotation of the annotation over an annotated element.
Bentley SewerCAD V8i User’s Guide 10-487
Viewing and Editing Data in FlexTables
• Show Leader Line: When this box is checked, a line is drawn between the anno-tation and the associated element.
• Show Leader Arrow: When this box is checked, an arrow is drawn pointing to the associated element.
Text Properties
This dialog allows you to modify the settings of the profile annotation for the axis labels. The following controls are available:
• Text: This field displays the text of the label. This field is not editable.
• Horizontal Justification: This control allows you to select the horizontal (left-to-right) placement of the label annotation.
• Vertical Justification: This control allows you to select the vertical (up-and-down) placement of the label annotation.
• Rotation: This control allows you to enter the angle of rotation of the label anno-tation .
Viewing and Editing Data in FlexTablesFlexTables lets you view input data and results for all elements of a specific type in a tabular format. You can use the standard set of FlexTables or create customized FlexTables to compare data and create reports.
FlexTables lets you view all elements in the project, all elements of a specific type, or any subset of elements. Additionally, to ease data input and present output data for specific elements, FlexTables can be:
• Filtered (see “Sorting and Filtering FlexTable Data” on page 10-498)
• Globally edited (see “Globally Editing Data” on page 10-497)
• Sorted (see “Sorting and Filtering FlexTable Data” on page 10-498)
If you need to edit a set of properties for all elements of a certain type in your network, you might consider creating a FlexTable and making your changes there, rather than editing each element one at a time, in sequence.
FlexTables can also be used to create results reports that you can print, save as a file, or copy to the Windows clipboard for copying into word processing or spreadsheet software.
To work with FlexTables, select the FlexTables manager or use View > FlexTables (Ctrl+7) to open the FlexTables manager if it is closed.
10-488 Bentley SewerCAD V8i User’s Guide
Presenting Your Results
Click one of the following links to learn more about using FlexTables:
• “FlexTables Manager” on page 10-489
• “Working with FlexTable Folders” on page 10-491
• “Opening FlexTables” on page 10-494
• “Creating a New FlexTable” on page 10-495
• “Deleting FlexTables” on page 10-495
• “Naming and Renaming FlexTables” on page 10-495
• “Editing FlexTables” on page 10-496
• “Sorting and Filtering FlexTable Data” on page 10-498
• “Customizing Your FlexTable” on page 10-501
• “FlexTable Setup Dialog Box” on page 10-502
• “Copying, Exporting, and Printing FlexTable Data” on page 10-505
• “Using Predefined Tables” on page 10-507
FlexTables Manager
The FlexTables Manager allows you to create, manage, and delete custom tabular reports. The dialog box contains a list pane that displays all of the custom FlexTables currently contained within the project, along with a toolbar.
The toolbar contains the following buttons:
Bentley SewerCAD V8i User’s Guide 10-489
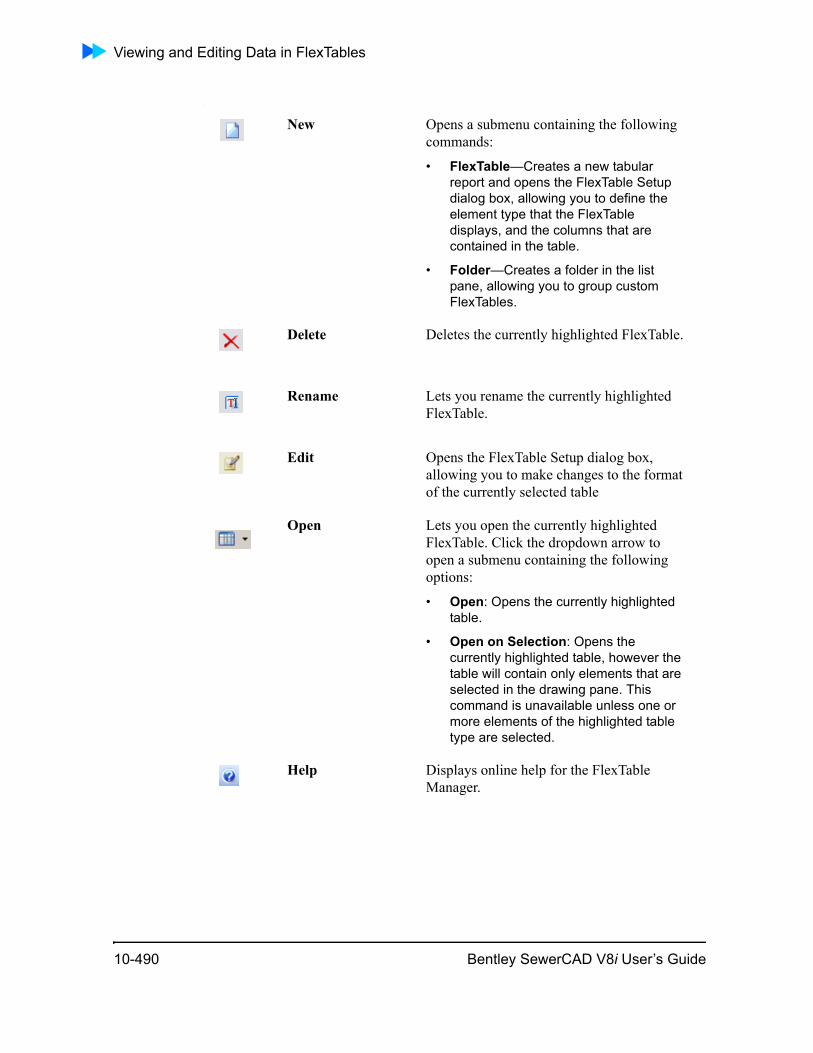
Viewing and Editing Data in FlexTables
:
New Opens a submenu containing the following commands:
• FlexTable—Creates a new tabular report and opens the FlexTable Setup dialog box, allowing you to define the element type that the FlexTable displays, and the columns that are contained in the table.
• Folder—Creates a folder in the list pane, allowing you to group custom FlexTables.
Delete Deletes the currently highlighted FlexTable.
Rename Lets you rename the currently highlighted FlexTable.
Edit Opens the FlexTable Setup dialog box, allowing you to make changes to the format of the currently selected table
Open Lets you open the currently highlighted FlexTable. Click the dropdown arrow to open a submenu containing the following options:
• Open: Opens the currently highlighted table.
• Open on Selection: Opens the currently highlighted table, however the table will contain only elements that are selected in the drawing pane. This command is unavailable unless one or more elements of the highlighted table type are selected.
Help Displays online help for the FlexTable Manager.
10-490 Bentley SewerCAD V8i User’s Guide
Presenting Your Results
Working with FlexTable Folders
You can add, delete, and rename folders in the FlexTable Manager to organize your FlexTables into groups of that can be turned off as one entity. You can also create folders within folders. When you start a new project, Bentley SewerCAD V8i displays two items in the FlexTable Manager: Tables - Project (for project-level FlexTables) and Tables - Shared (for FlexTables shared by more than one Bentley SewerCAD V8i project). You can add new FlexTables and FlexTable folders to either item or to existing folders.
To add a FlexTable folder:
1. Click View > FlexTables to open the FlexTables Manager.
2. In the FlexTable Manager, select either Tables - Project or Tables - Shared, then click the New button.
– If you are creating a new folder within an existing folder, select the folder, then click the New button.
3. Click New Folder from the shortcut menu.
4. Right-click the new folder and select Rename from the shortcut menu.
5. Type the name of the folder, then press Enter.
To delete a FlexTable folder:
1. Click View > FlexTables to open the FlexTables Manager.
2. In the FlexTables Manager, select the folder you want to delete, then click the Delete button.
– You can also right-click a folder to delete, then select Delete from the shortcut menu.
To rename a FlexTable folder:
1. Click View > FlexTables to open the FlexTables Manager.
2. In the FlexTables Manager, select the folder you want to rename, then click the Rename button.
– You can also right-click a folder to rename, then select Rename from the shortcut menu.
3. Type the new name of the folder, then press Enter.
– You can also rename a FlexTable folder by selecting the folder, then modi-fying its label in the Properties Editor.
Bentley SewerCAD V8i User’s Guide 10-491
Viewing and Editing Data in FlexTables
FlexTable Dialog Box
FlexTables are displayed in the FlexTable dialog box. The dialog box contains a toolbar, the rows and columns of data in the FlexTable, and a status bar.
The toolbar contains the following buttons:
Export to File Export to a Shapefile .shp, a Tab Delimited file .txt, or a Comma Delimited File .csv.
Copy Lets you copy the contents of the selected table cell, rows, and/or columns for the purpose of pasting into a different row or column or into a text editing program such as Notepad.
Paste Lets you paste the contents of the Windows clipboard into the selected table cell, row, or column. Use this with the Copy button.
Edit Opens the FlexTable Setup dialog box, allowing you to make changes to the format of the currently selected table
10-492 Bentley SewerCAD V8i User’s Guide
Presenting Your Results
The status bar at the bottom of the FlexTable dialog box contains the following items:
• x of x elements displayed—Number of elements displayed in the FlexTable of the total possible number of that type of element.
Zoom To Lets you zoom into and center the drawing pane on the currently selected element in the FlexTable.
Report Lets you create and view a report of your FlexTable for either the current time step or all time steps.
Options Opens a submenu containing the following commands:
• Create Selection Set—Lets you create a new static selection set ( a selection set based on selection) containing the currently selected elements in the FlexTable.
• Add to Selection Set—Lets you add the currently selected elements in the FlexTable to an existing selection set.
• Remove from Selection Set—Removes the currently selected elements from an existing selection set.
• Relabel—Opens an Element Relabeling box where you can Replace, Append, or Renumber
Select In Drawing Opens a submenu containing the following commands:
• Select In Drawing—Selects the currently highlighted element(s) in the drawing pane.
• Add to Selection—Adds the currently highlighted element(s) to the group that is currently highlighted in the drawing pane.
• Remove From Selection—Removes the currently highlighted element(s) from the group that is currently highlighted in the drawing pane.
Bentley SewerCAD V8i User’s Guide 10-493
Viewing and Editing Data in FlexTables
• FILTERED—If you have applied a filter to the FlexTable, this appears in the status bar. Hold the mouse cursor over this panel to display a tool tip, which lists a summary of active filters.
• SORTED—If you have sorted the order of any items in the FlexTable, this appears in the status bar. Hold the mouse cursor over this panel to display a tool tip, which lists a summary of active sorting.
Statistics Dialog Box
The Statistics dialog box displays statistics for the elements in a FlexTable. You can right-click any unitized input or output column and choose the Statistics command to view the count, maximum value, mean value, minimum value, standard deviation, and sum for that column.
Opening FlexTables
You open FlexTables from within the FlexTable Manager.
To open FlexTables:
1. Click View > FlexTables or click the FlexTables button on the View toolbar to open the FlexTables Manager.
2. Perform one of the following steps:
– Right-click the FlexTable you want to open, then select Open.
– Select the FlexTable you want to open, then click the Open button.
– Double-click the FlexTable you want to open.
10-494 Bentley SewerCAD V8i User’s Guide
Presenting Your Results
Creating a New FlexTable
You can create project-level or shared FlexTables.
• Project-level FlexTables are available only for the project in which you create them.
• Shared tables are available in all Bentley SewerCAD V8i projects.
To create a new FlexTable:
Project-level and shared FlexTables are created the same way:
1. Click View > FlexTables or click the FlexTables button on the View toolbar to open the FlexTables Manager.
2. In the FlexTables Manager, right-click Tables - Project or Tables - Shared, then select New > FlexTable.
Or, select Tables - Project or Tables - Shared, click the New button, then select FlexTable.
3. The Table Setup dialog box opens.
4. Select the Table Type you want to create. This lets you filter your table by element type.
5. Select the items you want in the FlexTable by moving them to the Selected Columns pane.
6. Click OK.
7. The table displays in the FlexTables Manager; you can type to rename the table or accept the default name.
Deleting FlexTables
Click View > FlexTables to open the FlexTables Manager. In the FlexTables manager, right-click the FlexTable you want to delete, then select Delete.
Or, select the FlexTable you want to delete, then click the Delete button. You cannot delete predefined FlexTables.
Note: You cannot delete predefined FlexTables.
Naming and Renaming FlexTables
You name and rename FlexTables in the FlexTable Manager.
Bentley SewerCAD V8i User’s Guide 10-495
Viewing and Editing Data in FlexTables
To rename FlexTables:
1. Click View > FlexTables or click the FlexTables button on the View toolbar to open the FlexTables Manager.
2. Perform one of the following steps:
– Right-click the FlexTable you want to rename, then select Rename.
– Select the FlexTable you want to rename, then click the Rename button.
– Click the FlexTable you want to rename, to select it, then click the name of the FlexTable.
Note: You cannot rename predefined FlexTables.
Editing FlexTables
You can edit a FlexTable to change the columns of data it contains or the values in some of those columns.
Editable columns: Columns that contain data you can edit are displayed with a white background. You can change these columns directly in the FlexTable and your changes are applied to your model when you click OK.
The content in the FlexTable columns can be changed in other areas of Bentley SewerCAD V8i, such as in a Property Editor or managers; but, it might be more efficient to make changes to numerous elements in a FlexTable rather than the Property Editor or a manager.
If you make a change that affects a FlexTable outside the FlexTable, the FlexTable is updated automatically to reflect the change.
Non-editable columns: Columns that contain data you cannot edit are displayed with a yellow background, and correspond to model results calculated by the program and composite values.
The content in these columns can be changed in other areas of Bentley SewerCAD V8i, such as in a Property Editor and by running a computation.
If you make a change that affects a FlexTable outside the FlexTable, the FlexTable is updated automatically to reflect the change.
10-496 Bentley SewerCAD V8i User’s Guide
Presenting Your Results
To edit a FlexTable:
1. Click View > FlexTables to open the FlexTables Manager, then you can:
– Right-click the FlexTable, then select Edit.
– Double-click the FlexTable to open it, then click Edit.
– Click the FlexTable, to select it, then click the Edit button.
2. The Table dialog box opens. .
3. Use the Table dialog box to include and exclude columns and change the order in which the columns appear in the table.
4. Click OK after you finish making changes, to save your changes and close the dialog box; or, click Cancel to close the dialog box without making changes.
Editing Column-Heading Text
To change the text of a column heading:
1. Click View > FlexTables to open the FlexTables Manager.
2. In the FlexTables manager, open the FlexTable you want to edit.
3. Right-click the column heading and select Edit Column Label.
4. Type the new name for the label and click OK to save those changes and close the dialog box or Cancel to exit without making any changes.
Changing Units, Format, and Precision in FlexTables
To change the units, format, or precision in a column of a FlexTable:
1. Click View > FlexTables to open the FlexTables Manager.
1. In the FlexTables manager, open the FlexTable you want to edit.
2. Right-click the column heading and select Units.
3. Make the changes you want and click OK to save those changes or Cancel to exit without making any changes.
Navigating in Tables
The arrow keys, Ctrl+Home, Ctrl+End, PgUp, PgDn, and Ctrl+arrow keys navigate to different cells in a table.
Globally Editing Data
Bentley SewerCAD V8i User’s Guide 10-497
Viewing and Editing Data in FlexTables
Using FlexTables, you can globally edit all of the values in an entire editable column. Globally editing a FlexTable column can be more efficient for editing properties of an element than using the Properties Editor or managers to edit each element in your model individually.
To globally edit the values in a FlexTable column:
1. Click View > FlexTables to open the FlexTables Manager.
2. In the FlexTables manager, open the FlexTable you want to edit and find the column of data you want to change.
If necessary, you might need to first create a FlexTable or edit an existing one to make sure it contains the column you want to change.
3. Right-click the column heading and select Global Edit.
4. In the Operation field, select what you want to do to data in the column: Add, Divide, Multiply, Set, or Subtract.
Note: The Operation field is only available for numeric data.
5. In the Global Edit field, type or select the value you want—for numeric data, you typically type a new value, for other data you might select from a drop-down list or select a check box.
Sorting and Filtering FlexTable Data
You can sort and filter your FlexTables to focus on specific data or present your data in one of the following ways:
To sort the order of columns in a FlexTable:
You can sort the order of columns in a FlexTable in two ways:
• Edit the FlexTable (see “Editing FlexTables”), to open the Table dialog box and change the order of the selected tables using the up and down arrow buttons.
The top-most item in the Selected Columns pane appears furthest to the left in the resulting FlexTable.
• Open the FlexTable, click the heading of the column you want to move, then click again and drag the column to the new position. You can only move one column at a time.
To sort the contents of a FlexTable:
1. Open the FlexTable you want to edit
2. Right-click a column heading to rank the contents of the column.
10-498 Bentley SewerCAD V8i User’s Guide
Presenting Your Results
3. Select Sort Ascending Sort Descending, or Custom.
– Sort Ascending—Sorts alphabetically from A to Z, from top to bottom. Sorts numerically from negative to positive, from top to bottom. Sorts selected check boxes to the top and cleared ones to the bottom.
– Sort Descending—Sorts alphabetically from Z to A, from top to bottom. Sorts numerically from positive to negative, from top to bottom. Sorts cleared check boxes to the top and selected ones to the bottom.
– Custom—Opens the Custom Sort dialog box, which allows you to choose an attribute to sort by in ascending or descending order.
To filter a FlexTable by creating a query:
1. Open the FlexTable you want to filter.
2. Right-click the column heading you want to filter, and select Filter > Custom.
The Query Builder dialog box opens.
3. All input and results fields for the selected element type appear in the Fields list pane, available SQL operators and keywords are represented by buttons, and available values for the selected field are listed in the Unique Values list pane. Perform the following steps to construct your query:
a. Double-click the field you wish to include in your query. The database column name of the selected field appears in the preview pane.
b. Click the desired operator or keyword button. The SQL operator or keyword is added to the SQL expression in the preview pane.
c. Click the Refresh button above the Unique Values list pane to see a list of unique values available for the selected field. The Refresh button is becomes disabled after you use it for a particular field.
d. Double-click the unique value you want to add to the query. The value is added to the SQL expression in the preview pane.
e. Click the Validate button above the preview pane to validate your SQL expression. If the expression is valid, the word “VALIDATED” is displayed in the lower right corner of the dialog box.
f. Click the Apply button above the preview pane to execute the query. If you didn’t validate the expression, the Apply button validates it before executing it.
g. Click OK.
Bentley SewerCAD V8i User’s Guide 10-499
Viewing and Editing Data in FlexTables
The FlexTable displays columns of data for all elements returned by the query and the word “FILTERED” is displayed in the FlexTable status bar.
To filter a FlexTable by using an existing query:
1. Open the FlexTable you want to filter.
2. Right-click the column heading you want to filter, and select Filter > By Query.
3. In the Queries - Select a Query dialog that appears, choose the Query Type, then choose the Selected Query.
4. Click OK.
Preview pane
Validate button
Apply button
Click the desired operator or keyword button to add it to the SQL expression in the preview pane
Double-click the desired field to add it to the preview pane
Double-click the desired unique value to add it to the SQL expression in the preview pane
Click the Refresh button to display the list of available unique values
10-500 Bentley SewerCAD V8i User’s Guide
Presenting Your Results
Note: The query you select should be for the same type of element as the FlexTable.
To reset a filter:
1. Right-click the column heading you want to filter.
2. Select Filter.
3. Click Reset.
The status pane at the bottom of the Table window always shows the number of rows displayed and the total number of rows available (e.g., 10 of 20 elements displayed). When a filter is active, this message is highlighted.
Note: Table filtering lets you perform global editing (see “Editing FlexTables”) on any subset of elements. Only the elements that appear in the filtered table can be edited.
Custom Sort Dialog Box
This dialog box allows you to choose an attribute to sort by, and whether to sort in asending or descending order. You can choose multiple attributes to sort by. When multiple sort attributes are specified, the first attribute specified will take precedence, then the second, and so on.
Customizing Your FlexTable
There are several ways to customize tables to meet a variety of output requirements:
• Changing the Report Title—When you print a table, the table name is used as the title for the printed report. You can change the title that appears on your printed report by renaming the table. For more information, see “Naming and Renaming FlexTables” on page 10-495.
Bentley SewerCAD V8i User’s Guide 10-501
Viewing and Editing Data in FlexTables
• Adding/Removing Columns—You can add, remove, and change the order of columns from the Table Setup dialog box. For more information, see “Editing FlexTables” on page 10-496 and “Sorting and Filtering FlexTable Data” on page 10-498.
• Drag/Drop Column Placement—With the Table window open, select the column heading of the column that you would like to move and drag the column to its new location. For more information, see “Sorting and Filtering FlexTable Data” on page 10-498.
• Resizing Columns—With the Table open, click the vertical separator line between column headings. Notice that the cursor changes shape to indicate that you can resize the column. Drag the column separator to the left or right to stretch the column to its new size.
• Changing Column Headings—With the Table window open, right-click the column heading that you wish to change and select Edit Column Label.
FlexTable Setup Dialog Box
The Table Setup dialog box allows you to customize any table through the following options:
Table Type Lets you specify the type of elements that appear in the table. It also provides a filter for the attributes that appear in the Available Columns list. When you choose a table type, the available list only contains attributes that can be used for that table type. For example, only manhole attributes are available for a manhole table.
Available Columns Contains all the attributes that are available for your table design. The Available Columns list is located on the left side of the Table Setup dialog box. This list contains all of the attributes that are available for the type of table you are creating. The attributes displayed in yellow represent non-editable attributes, while those displayed in white represent editable attributes.
10-502 Bentley SewerCAD V8i User’s Guide

Presenting Your Results
Selected Columns Contains attributes that appear in your custom designed FlexTable. When you open the table, the selected attributes appear as columns in the table in the same order that they appear in the list. You can drag and drop or use the up and down buttons to change the order of the attributes in the table.The Selected Columns list is located on the right-hand side of the Table Setup dialog box. To add columns to the Selected Columns list, select one or more attributes in the Available Columns list, then click the Add button [>] or drag and drop the highlighted attributes to the Selected Columns list.
Column Manipulation Buttons
Lets you select or clear columns to be used in the table, as well as to arrange the order in which the columns appear.The Add and Remove buttons are located in the center of the Table Setup dialog box.
• [ > ] Adds the selected items from the Avail-able Columns list to the Selected Columns list.
• [ >> ] Adds all of the items in the Available Columns list to the Selected Columns list.
• [ < ] Removes the selected items from the Selected Columns list.
• [ << ] Removes all items from the Selected Columns list.
To rearrange the order of the attributes in the Selected Columns list, highlight the item to be moved, then move it up or down in the list by dragging or clicking the up or down button located below the Selected Columns list.
Bentley SewerCAD V8i User’s Guide 10-503
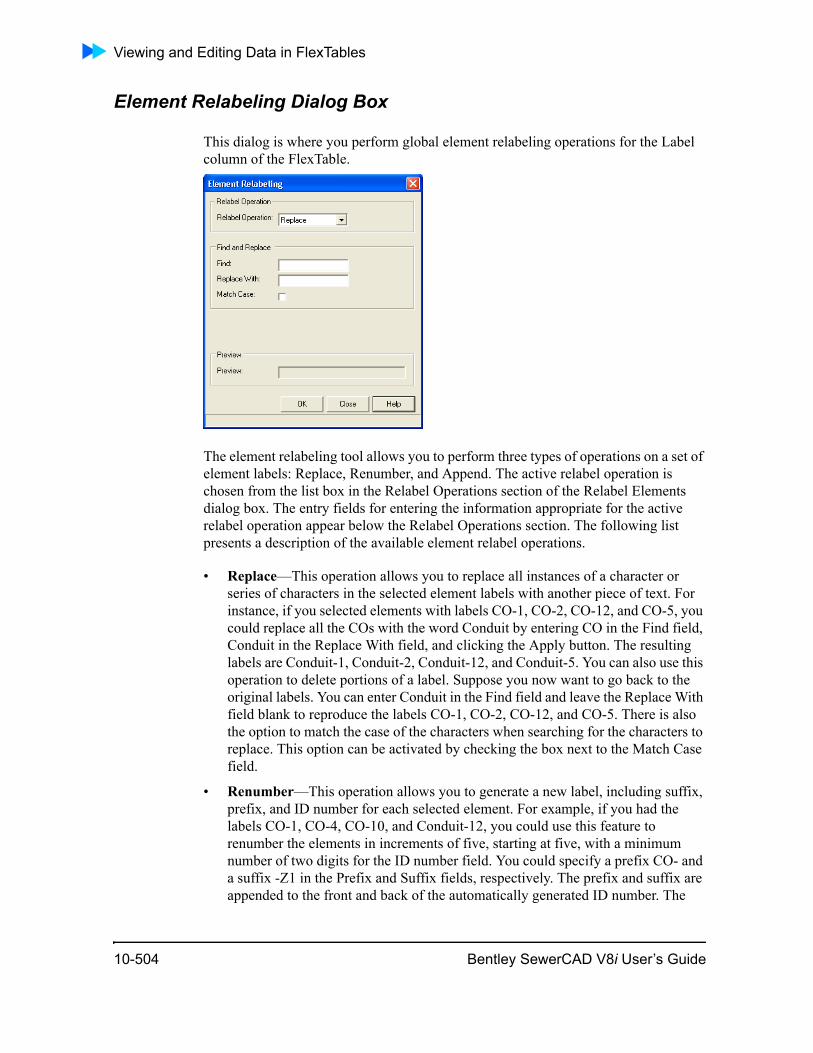
Viewing and Editing Data in FlexTables
Element Relabeling Dialog Box
This dialog is where you perform global element relabeling operations for the Label column of the FlexTable.
The element relabeling tool allows you to perform three types of operations on a set of element labels: Replace, Renumber, and Append. The active relabel operation is chosen from the list box in the Relabel Operations section of the Relabel Elements dialog box. The entry fields for entering the information appropriate for the active relabel operation appear below the Relabel Operations section. The following list presents a description of the available element relabel operations.
• Replace—This operation allows you to replace all instances of a character or series of characters in the selected element labels with another piece of text. For instance, if you selected elements with labels CO-1, CO-2, CO-12, and CO-5, you could replace all the COs with the word Conduit by entering CO in the Find field, Conduit in the Replace With field, and clicking the Apply button. The resulting labels are Conduit-1, Conduit-2, Conduit-12, and Conduit-5. You can also use this operation to delete portions of a label. Suppose you now want to go back to the original labels. You can enter Conduit in the Find field and leave the Replace With field blank to reproduce the labels CO-1, CO-2, CO-12, and CO-5. There is also the option to match the case of the characters when searching for the characters to replace. This option can be activated by checking the box next to the Match Case field.
• Renumber—This operation allows you to generate a new label, including suffix, prefix, and ID number for each selected element. For example, if you had the labels CO-1, CO-4, CO-10, and Conduit-12, you could use this feature to renumber the elements in increments of five, starting at five, with a minimum number of two digits for the ID number field. You could specify a prefix CO- and a suffix -Z1 in the Prefix and Suffix fields, respectively. The prefix and suffix are appended to the front and back of the automatically generated ID number. The
10-504 Bentley SewerCAD V8i User’s Guide
Presenting Your Results
value of the new ID for the first element to be relabeled, 5, is entered in the Next field. The value by which the numeric base of each consecutive element is in increments, 5, is entered in the Increment field. The minimum number of digits in the ID number, 2, is entered in the Digits field. If the number of digits in the ID number is less then this value, zeros are placed in front of it. Click the Apply button to produce the following labels: CO-05-Z1, CO-10-Z1, CO-15-Z1, and CO-20-Z1.
• Append—This operation allows you to append a prefix, suffix, or both to the selected element labels. Suppose that you have selected the labels 5, 10, 15, and 20, and you wish to signify that these elements are actually conduits in Zone 1 of your system. You can use the append operation to add an appropriate prefix and suffix, such as CO- and -Z1, by specifying these values in the Prefix and Suffix fields and clicking the Apply button. Performing this operation yields the labels CO-5-Z1, CO-10-Z1, CO-15-Z1 and CO-20-Z1. You can append only a prefix or suffix by leaving the other entry field empty. However, for the operation to be valid, one of the entry fields must be filled in.
The Preview field displays an example of the new label using the currently defined settings.
Copying, Exporting, and Printing FlexTable Data
You can output your FlexTable several ways:
• Copy FlexTable data via the clipboard
• Export FlexTable data as a text file
• Create a FlexTable report
To copy FlexTable data via the clipboard:
You can copy your FlexTable data via the clipboard and paste it into another Windows application, such as a word-processing application as tab-delimited text.
1. Click View > FlexTables to open the FlexTables manager.
2. In the FlexTables manager, open the FlexTable you want to use.
3. Click Copy. The contents of the FlexTable are copied to the Windows clipboard.
Bentley SewerCAD V8i User’s Guide 10-505
Viewing and Editing Data in FlexTables
Caution: Make sure you paste the data you copied before you copy anything else to the Windows clipboard. If you copy something else to the clipboard before you paste your FlexTable data, your FlexTable data will be lost from the clipboard.
4. Paste (Ctrl+v) the data into other Windows software, such as your word-processing application.
To export FlexTable data as a text file:
You can export the data in a FlexTable as tab- or comma-delimited ASCII text, for use in other applications, such as Notepad, spreadsheet, or word processing software.
1. Click View > FlexTables to open the FlexTables manager.
2. In the FlexTables manager, open the FlexTable you want to use.
3. Click File > Export data.
4. Select either Tab Delimited or Comma Delimited.
5. When prompted, set the path and name of the .txt file you want to create.
To create a FlexTable report:
Create a FlexTable Report if you want to print a copy of your FlexTable and its values.
1. Click View > FlexTables to open the FlexTables manager.
2. In the FlexTables manager, open the FlexTable you want to use.
Note: Instead of Print Preview, you can click Print to print the report without previewing it.
3. Click Report. A print preview of the report displays to show what your report will look like if printed using your default printer.
Note: You cannot edit the format of the report.
4. Click Print to open the Print dialog box and print the report to a printer that you select.
• “Using Predefined Tables” on page 10-507
10-506 Bentley SewerCAD V8i User’s Guide
Presenting Your Results
Using Predefined Tables
Element tables are read-only, predefined FlexTables. There is one predefined table for every element available in Bentley SewerCAD V8i. You can access the element tables by clicking Report > Element Tables or from the FlexTable manager. Use these tables to review data about the elements in your model.
ReportingUse reporting to create printable content based on some aspect of your model, such as element properties or results.
You need to compute your model before you can create reports about results, such as the movement of water in your network. But, you can create reports about input data without computing your model, such as conduit diameters. (To compute your model, after you set up your elements and their properties, click the Compute button.)
You can access reports by:
• Clicking the Report menu
• Right-clicking any element, then selecting Report
Reporting includes:
• “Using Standard Reports” on page 10-507
• “Reporting on Element Data” on page 10-508
Using Standard Reports
There are several standard reports available. To access the standard reports, click the Report menu, then select the report you want.
You can use these standard reports:
• “Creating a Project Inventory Report” on page 10-507
• “Creating a Scenario Summary Report” on page 10-508
• “Creating a Conduit and Pressure Pipe Inventory” on page 10-508
Creating a Project Inventory Report
To create a report that provides an overview of your network, click Report > Project Inventory. The report dialog box opens and displays your report. You cannot format the report, but you can print it by clicking the Print button.
Bentley SewerCAD V8i User’s Guide 10-507
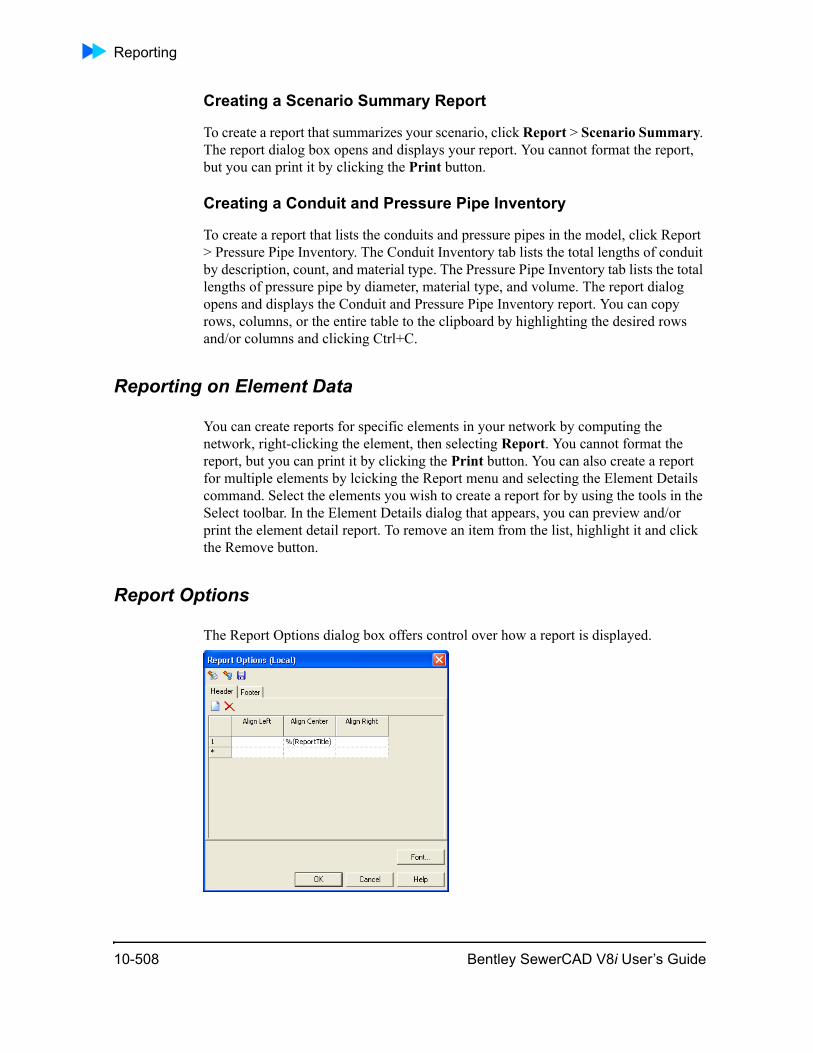
Reporting
Creating a Scenario Summary Report
To create a report that summarizes your scenario, click Report > Scenario Summary. The report dialog box opens and displays your report. You cannot format the report, but you can print it by clicking the Print button.
Creating a Conduit and Pressure Pipe Inventory
To create a report that lists the conduits and pressure pipes in the model, click Report > Pressure Pipe Inventory. The Conduit Inventory tab lists the total lengths of conduit by description, count, and material type. The Pressure Pipe Inventory tab lists the total lengths of pressure pipe by diameter, material type, and volume. The report dialog opens and displays the Conduit and Pressure Pipe Inventory report. You can copy rows, columns, or the entire table to the clipboard by highlighting the desired rows and/or columns and clicking Ctrl+C.
Reporting on Element Data
You can create reports for specific elements in your network by computing the network, right-clicking the element, then selecting Report. You cannot format the report, but you can print it by clicking the Print button. You can also create a report for multiple elements by lcicking the Report menu and selecting the Element Details command. Select the elements you wish to create a report for by using the tools in the Select toolbar. In the Element Details dialog that appears, you can preview and/or print the element detail report. To remove an item from the list, highlight it and click the Remove button.
Report Options
The Report Options dialog box offers control over how a report is displayed.
10-508 Bentley SewerCAD V8i User’s Guide
Presenting Your Results
The header and footer can be fully customized and you can edit text to be displayed in the cells or select a pre-defined dynamic variable from the cell's menu.
• %(Company) - The name specified in the project properties.
• % (DateTime) - The current system date and time.
• % (BentleyInfo) - The standard Bentley company information.
• % (BentleyName) - The standard Bentley company name information.
• % (Pagination) - The report page out of the maximum pages.
• % (ProductInfo) - The current product and its build number.
• % (ProjDirectory) - The directory path where the project file is stored.
• % (ProjEngineer) - The engineer specified in the project properties.
• % (ProjFileName) - The full file path of the current project.
• % (ProjStoreFileName) - The full file path of the project.
• % (ProjTitle) - The name of the project specified in the project properties.
• % (ReportTitle) - The name of the report.
• % (Image) - Opens up the Select Image file window.
You can also select fonts, text sizes, and customize spacing.
GraphingUse graphing to visualize some aspect of your model, such as element properties or results. You need to compute your model before you can create graphs. To compute your model, after you set up your elements and their properties, click the Compute button.
Load factory default settings to current view
Changes the display settings used by the current repor to the factory default.
Load global settings to current view
Changes the display settings used by the current report to the previously saved global settings.
Save current view settings to global settings
Saves the display settings used by the current report as the new global settings.
Bentley SewerCAD V8i User’s Guide 10-509

Graphing
Click one of the following links to learn more about using graphs in Bentley SewerCAD V8i:
• “Graph Manager” on page 10-510
• “Creating a Graph” on page 10-511
• “Printing a Graph” on page 10-512
• “Working with Graph Data: Viewing and Copying” on page 10-512
• “Graph Dialog Box” on page 10-512
• “Chart Options Dialog Box” on page 10-520
Graph Manager
The Graph Manager lets you recall a graph you have created and saved in the current session or in a previous session of Bentley SewerCAD V8i. Graphs listed in the Graph Manager retain any customizations you have applied.
To use the Graph Manager:
1. Compute your model and resolve any errors. (Press F9 or click Analysis > Compute.)
2. Open the Graph Manager, click View > Graphs.
3. Create your graph. (For more information, see “Creating a Graph” on page 10-511.)
4. After you create a graph, it is available in the Graph Manager. You can select it by double-clicking it. Also, you can right-click a graph listed in Graph Manager to:
– Delete it
– Rename the graph’s label
– Open it, by selecting Properties
Graphs are not saved in Graph Manager after you close Bentley SewerCAD V8i.
Graph Manager
The Graph Manager contains a toolbar with the following buttons:
10-510 Bentley SewerCAD V8i User’s Guide
Presenting Your Results
Creating a Graph
You can graph computed values, such as flow and velocity. To create a graph:
1. Compute your Bentley SewerCAD V8i network.
2. If necessary, use Shift+click to select multiple elements.
3. Right-click an element and select Graph. The Graph dialog box opens (see “Graph Dialog Box” on page 10-512).
4. If needed, use the Scenarios drop-down list (for more information, see “Scenario Manager” on page 9-471) to select check boxes to include different or multiple scenarios in the graph. Click Refresh after you make any changes, so the graph displays your changes.
5. If needed, use the Elements drop-down list to select check boxes to include different or multiple element properties in the graph. Click Refresh after you make any changes, so the graph displays your changes.
Note: Bentley SewerCAD V8i assumes initial flow—flow at time 0—in all networks to be 0; thus, graphs of flow begin at 0 for time 0.
6. If needed, click Chart Settings to change the display of the graph. For more information, see “Graph Manager” on page 10-510.
New Inserts a new graph of the currently selected elements in your model. If no elements are selected, you are prompted to select one or more elements to graph.
Delete Deletes the currently highlighted graph.
Rename Lets you rename the currently highlighted graph.
View Opens the Graph dialog box, allowing you to view the currently highlighted graph.
Help Displays online help for the Graph Manager.
Bentley SewerCAD V8i User’s Guide 10-511
Graphing
Tip: If you want your graph to display over more time (for example, it displays a 24-hour time period and you want to display a 72-hour period), click View > Calculation Options and change Total Simulation Time in the Property Editor (for more information, see “Editing Attributes in the Property Editor” on page 15-823).
Printing a Graph
To print a graph, click the Print button to open the print dialog box or click the Print Preview button to see what your graph looks like before clicking Print.
Working with Graph Data: Viewing and Copying
Bentley SewerCAD V8i lets you view the data that your graphs are based on. To view your data, create a graph, then, after the Graph dialog box opens, click the Data tab.
You can copy this data to the Windows clipboard for use in other applications, such as word-processing software. To copy this data:
1. Click in the top-most cell of the left-most column to select the entire table, click a column heading to select an entire column, or click a row heading to select an entire row.
2. Press Ctrl+C to copy the selected data to the clipboard.
3. As needed, press Ctrl+V to paste the data as tab-delimited text into other soft-ware.
Tip: To print out the data for a graph, copy and paste it into another application, such as word-processing software or Notepad, and print the pasted content.
Graph Dialog Box
The Graph dialog box allows you to view graphs and modify graph settings as desired. After you create a graph, you view it in the Graph dialog box.
The following controls are available:
10-512 Bentley SewerCAD V8i User’s Guide
Presenting Your Results
Graph Tab
Add to Graph Manager Lets you save the Graph to the graph manager. When you click this button, the graph options (i.e., attributes to graph for a specific scenario) and the graph settings (i.e., line color, font size) are saved with the graph. If you want to view a different set of data (for example, a different scenario), you must change the scenario in the Graph Series Options dialog box. Simply switching the active scenario will not change the graph. Graphs that you add to the Graph manager are saved when you save your model, so that you can use the graph after you close and reopen Bentley SewerCAD V8i.
Graph Series Options Lets you control what your graph displays. For more information, see “Graph Series Options Dialog Box” on page 10-517.
Chart Settings Opens the Chart Options dialog box, allowing you to change graph display settings.
Print Prints the current view in the graph display pane.
Print Preview Opens the “Print Preview Window”, displaying the graph exactly as it will be printed.
Copy Copies the current view in the graph display pane to the Windows Clipboard.
Zoom Extents Zooms out so that the entire graph is displayed
Bentley SewerCAD V8i User’s Guide 10-513

Graphing
Zoom Window Zooms in on a section of the graph. When the tool is toggled on, you can zoom in on any area of the graph by clicking on the chart to the left of the area to be zoomed, holding the mouse button, then dragging the mouse to the right (or, the opposite extent of the area to be magnified) and releasing the mouse button when the area to be zoomed has been defined.To zoom back out, click and hold the mouse button, drag the mouse in the opposite direction (right to left), and release the mouse button.
10-514 Bentley SewerCAD V8i User’s Guide
Presenting Your Results
Time (VCR) Controls Lets you evaluate plots over time.
• If you click Restart, the Time resets to zero and the vertical line that marks time resets to the left edge of the Graph display.
• If you click Pause, the vertical line that moves across the graph to mark time pauses, as does the Time field.
• If you click Play, a vertical line moves across the graph and the Time field increments.
The following controls are also available:
• Time—Displays the time loca-tion of the vertical black bar in the graph display. This is a read-only field, to set a specific time, use the slider button.
• Slider—Lets you set a specific time for the graph. A vertical line moves in the graph display and intersects your plots to show the value of the plot at a specific time. Use the slider to set a specific time value.
Graph Display Pane Displays the graph.
Data Tab
Bentley SewerCAD V8i User’s Guide 10-515
Graphing
The Data tab is shown below.
Data Table 850_GraphDialog_002.bmp
The Data tab displays the data that comprise your graphs. If there is more than one item plotted, the data for each plot is provided.You can copy and paste the data from this tab to the clipboard for use in other applications, such as Microsoft Excel. To select an entire column or row, click the column or row heading. To select the entire contents of the Data tab, click the heading cell in the top-left corner of the tab. Use Ctrl+C and Ctrl+V to paste your data. The column and row headings are not copied.
10-516 Bentley SewerCAD V8i User’s Guide
Presenting Your Results
Graph Series Options Dialog Box
Click the Graph Series Options button in the Graph dialog box (“Graph Dialog Box” on page 10-512) to use the Graph Series Options dialog box to customize your graph.
This dialog box lets you choose which scenarios, elements, and fields you want to plot (this affects both the Graph and Data tabs). Click to select the check boxes next to those items you want to plot and clear the check boxes for those items you do not want to plot. Click Close after you have made your selections and the graph is updated to display the items you chose.
Filter Dialog Box
The Filter dialog box lets you specify your filtering criteria. Each filter criterion is made up of three items:
• Attribute—The attribute to filter.
• Operator—The operator to use when comparing the filter value against the data in the specific column (operators include: =, >, >=, <, <=, < >).
• Value—The comparison value.
Any number of criteria can be added to a filter. Multiple filter criteria are implicitly joined with a logical AND statement. When multiple filter criteria are defined, only rows that meet all of the specified criteria will be displayed. A filter will remain active for the associated table until the filter is reset.
The status pane at the bottom of the Table window always shows the number of rows displayed and the total number of rows available (e.g., 10 of 20 elements displayed). When a filter is active, this message will be highlighted.
Observed Data Dialog Box
Use this feature to display user-supplied time variant data values alongside calculated results in the graph display dialog. Model competency can sometimes be determined by a quick side by side visual comparison of calculated results with those observed and collection in the field.
• Get familiar with your data - If you obtained your observed data from an outside source, you should take the time to get acquainted with it. Be sure to identify units of time and measurement for the data. Be sure to identify what the data points represent in the model; this helps in naming your line or bar series as it will appear in the graph.
• Preparing your data - Typically, observed data can be organized as a collection of points in a table. In this case, the time series data can simply be copied to the clipboard directly from the source and pasted right into the observed data input table. Ensure that your collection of data points is complete. That is, every value
Bentley SewerCAD V8i User’s Guide 10-517
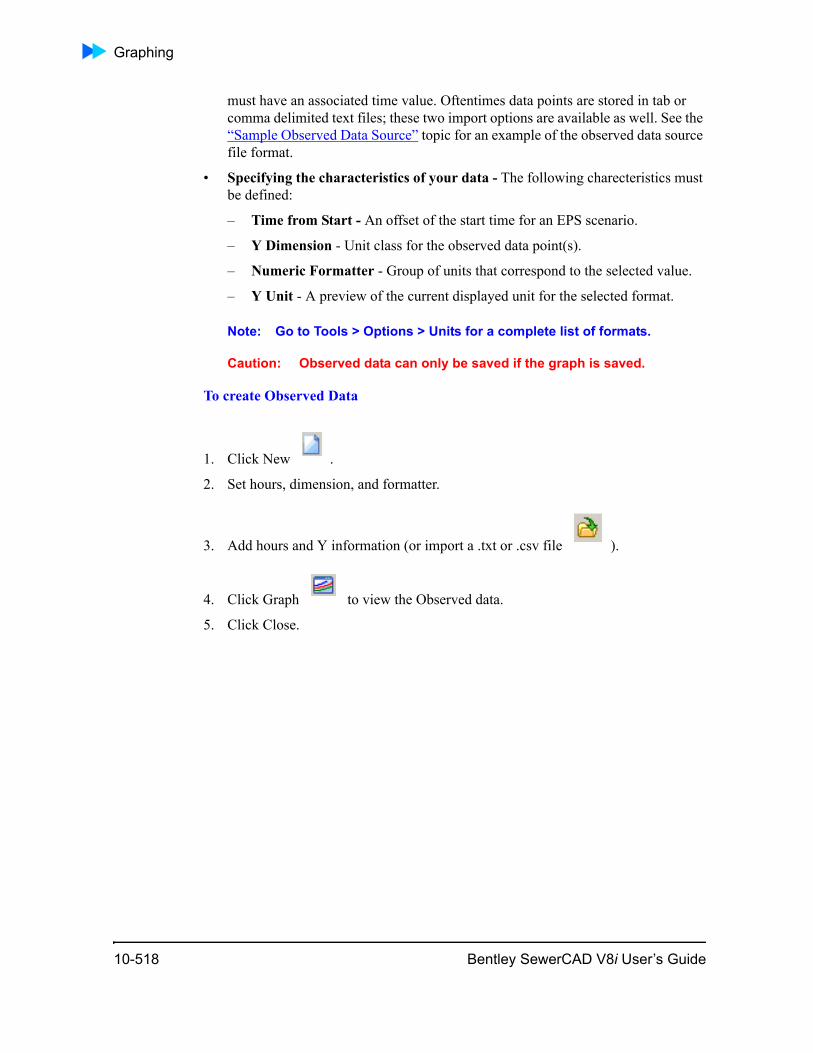
Graphing
must have an associated time value. Oftentimes data points are stored in tab or comma delimited text files; these two import options are available as well. See the “Sample Observed Data Source” topic for an example of the observed data source file format.
• Specifying the characteristics of your data - The following charecteristics must be defined:
– Time from Start - An offset of the start time for an EPS scenario.
– Y Dimension - Unit class for the observed data point(s).
– Numeric Formatter - Group of units that correspond to the selected value.
– Y Unit - A preview of the current displayed unit for the selected format.
Note: Go to Tools > Options > Units for a complete list of formats.
Caution: Observed data can only be saved if the graph is saved.
To create Observed Data
1. Click New .
2. Set hours, dimension, and formatter.
3. Add hours and Y information (or import a .txt or .csv file ).
4. Click Graph to view the Observed data.
5. Click Close.
10-518 Bentley SewerCAD V8i User’s Guide
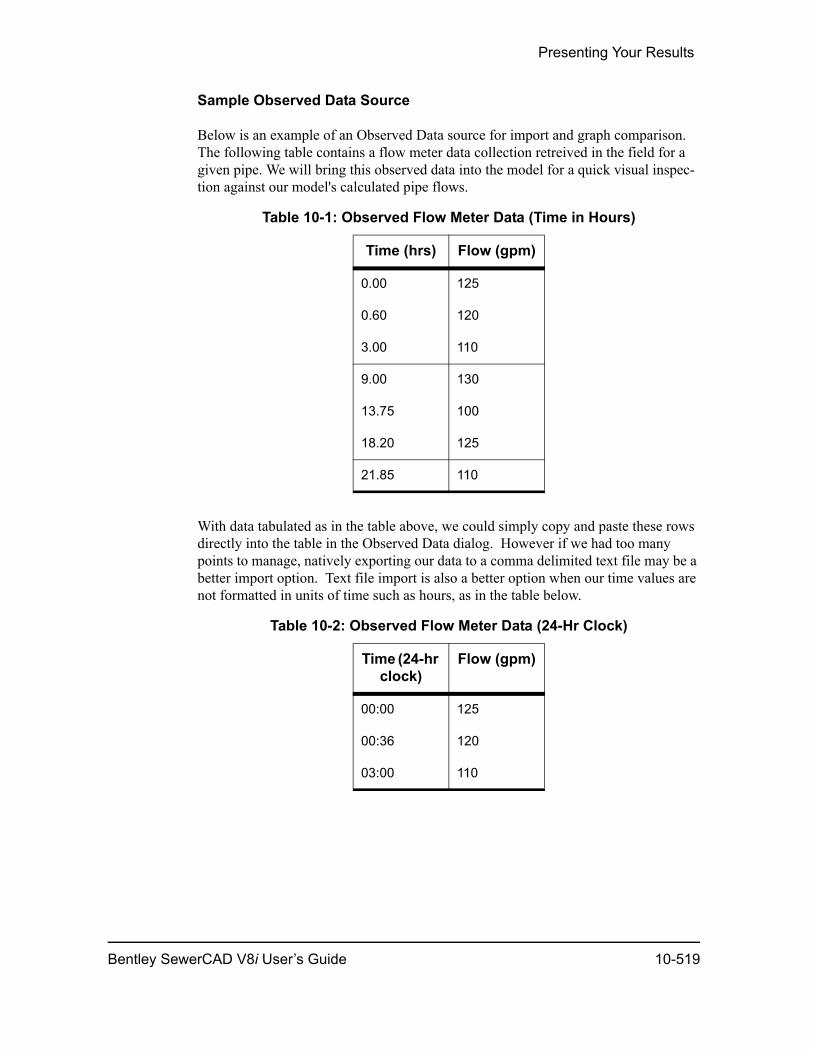
Presenting Your Results
Sample Observed Data Source
Below is an example of an Observed Data source for import and graph comparison. The following table contains a flow meter data collection retreived in the field for a given pipe. We will bring this observed data into the model for a quick visual inspec-tion against our model's calculated pipe flows.
With data tabulated as in the table above, we could simply copy and paste these rows directly into the table in the Observed Data dialog. However if we had too many points to manage, natively exporting our data to a comma delimited text file may be a better import option. Text file import is also a better option when our time values are not formatted in units of time such as hours, as in the table below.
Table 10-1: Observed Flow Meter Data (Time in Hours)
Time (hrs) Flow (gpm)
0.00 125
0.60 120
3.00 110
9.00 130
13.75 100
18.20 125
21.85 110
Table 10-2: Observed Flow Meter Data (24-Hr Clock)
Time (24-hr clock)
Flow (gpm)
00:00 125
00:36 120
03:00 110
Bentley SewerCAD V8i User’s Guide 10-519
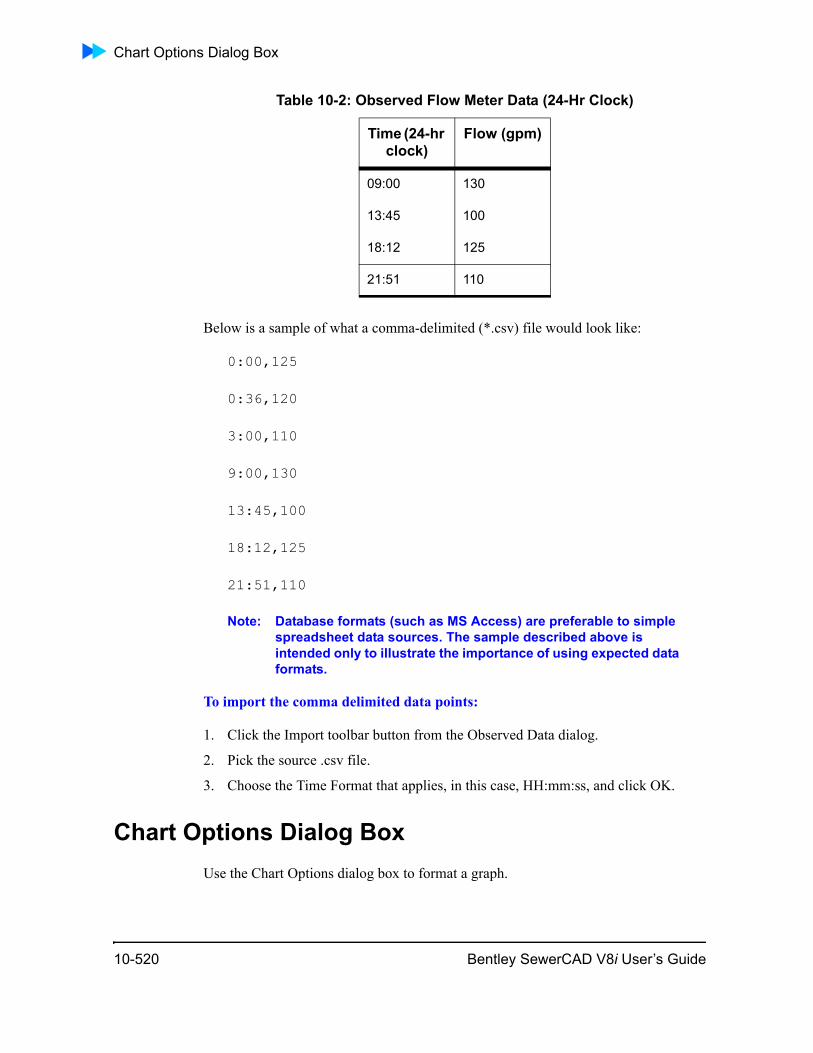
Chart Options Dialog Box
Below is a sample of what a comma-delimited (*.csv) file would look like:
0:00,125
0:36,120
3:00,110
9:00,130
13:45,100
18:12,125
21:51,110
Note: Database formats (such as MS Access) are preferable to simple spreadsheet data sources. The sample described above is intended only to illustrate the importance of using expected data formats.
To import the comma delimited data points:
1. Click the Import toolbar button from the Observed Data dialog.
2. Pick the source .csv file.
3. Choose the Time Format that applies, in this case, HH:mm:ss, and click OK.
Chart Options Dialog BoxUse the Chart Options dialog box to format a graph.
09:00 130
13:45 100
18:12 125
21:51 110
Table 10-2: Observed Flow Meter Data (24-Hr Clock)
Time (24-hr clock)
Flow (gpm)
10-520 Bentley SewerCAD V8i User’s Guide
Presenting Your Results
Note: Changes you make to graph settings are not retained for use with other graphs.
To open Chart Options dialog box:
1. Open your project and click Compute.
2. Select one or more elements, right-click, then select Graph.
3. Click the Chart Settings button.
Click one of the following links to learn more about Chart Options dialog box:
• “Chart Options Dialog Box - Chart Tab” on page 10-521
• “Chart Options Dialog Box - Series Tab” on page 10-547
• “Chart Options Dialog Box - Tools Tab” on page 10-555
• “Chart Options Dialog Box - Export Tab” on page 10-556
• “Chart Options Dialog Box - Print Tab” on page 10-558
• “Border Editor Dialog Box” on page 10-559
• “Gradient Editor Dialog Box” on page 10-560
• “Color Editor Dialog Box” on page 10-561
• “Color Dialog Box” on page 10-561
• “Hatch Brush Editor Dialog Box” on page 10-562
• “Pointer Dialog Box” on page 10-565
• “Change Series Title Dialog Box” on page 10-566
• “Chart Tools Gallery Dialog Box” on page 10-566
• “TeeChart Gallery Dialog Box” on page 10-578
Chart Options Dialog Box - Chart Tab
The Chart tab lets you define overall chart display parameters. This tab is subdivided into second-level sub-tabs:
• “Series Tab”
• “Panel Tab”
• “Axes Tab”
• “General Tab”
• “Titles Tab”
Bentley SewerCAD V8i User’s Guide 10-521
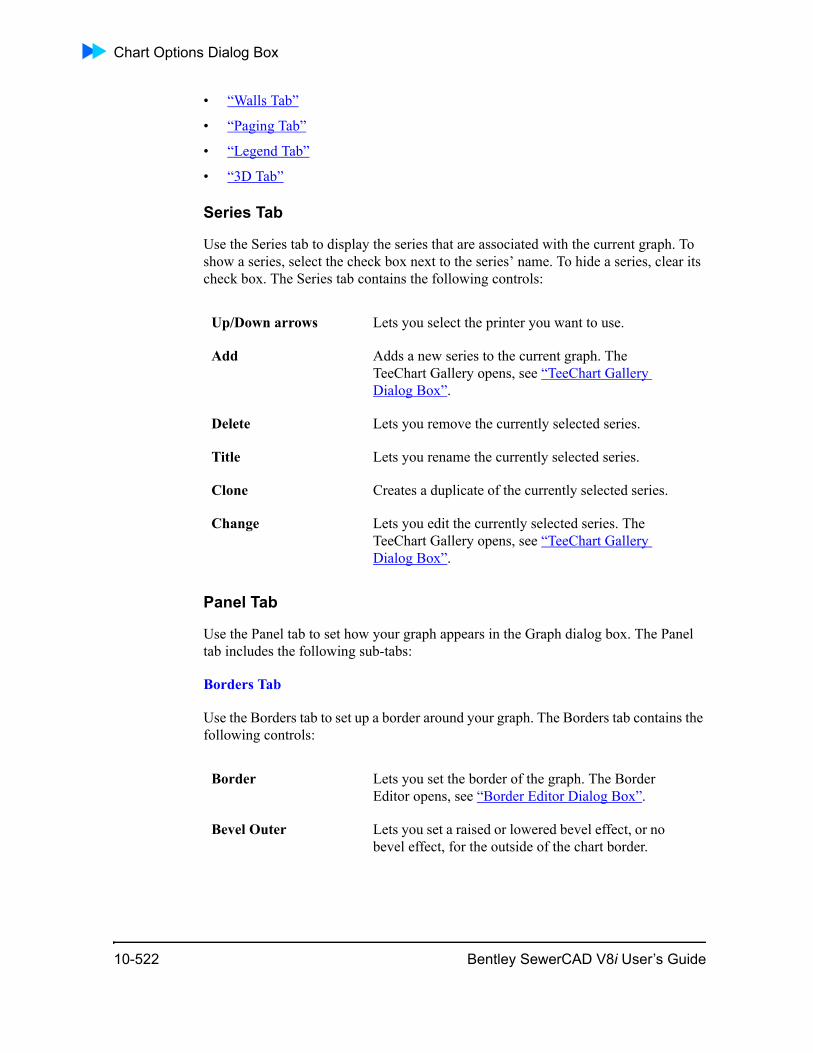
Chart Options Dialog Box
• “Walls Tab”
• “Paging Tab”
• “Legend Tab”
• “3D Tab”
Series Tab
Use the Series tab to display the series that are associated with the current graph. To show a series, select the check box next to the series’ name. To hide a series, clear its check box. The Series tab contains the following controls:
Panel Tab
Use the Panel tab to set how your graph appears in the Graph dialog box. The Panel tab includes the following sub-tabs:
Borders Tab
Use the Borders tab to set up a border around your graph. The Borders tab contains the following controls:
Up/Down arrows Lets you select the printer you want to use.
Add Adds a new series to the current graph. The TeeChart Gallery opens, see “TeeChart Gallery Dialog Box”.
Delete Lets you remove the currently selected series.
Title Lets you rename the currently selected series.
Clone Creates a duplicate of the currently selected series.
Change Lets you edit the currently selected series. The TeeChart Gallery opens, see “TeeChart Gallery Dialog Box”.
Border Lets you set the border of the graph. The Border Editor opens, see “Border Editor Dialog Box”.
Bevel Outer Lets you set a raised or lowered bevel effect, or no bevel effect, for the outside of the chart border.
10-522 Bentley SewerCAD V8i User’s Guide
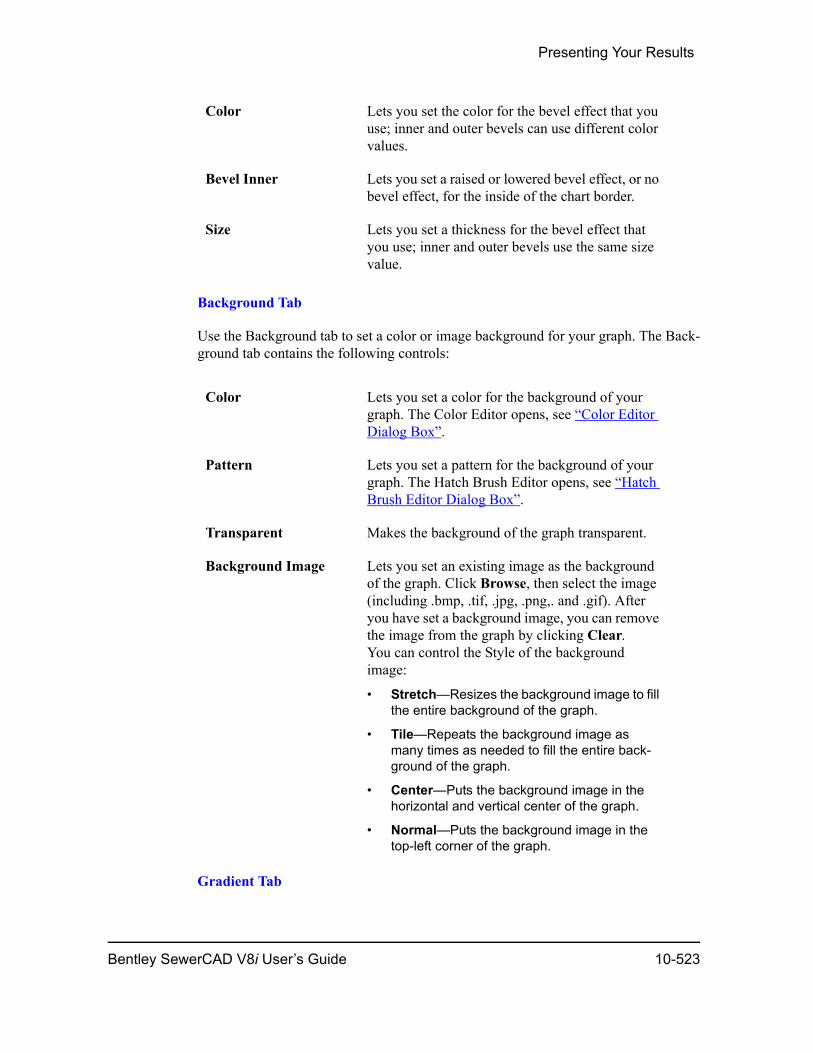
Presenting Your Results
Background Tab
Use the Background tab to set a color or image background for your graph. The Back-ground tab contains the following controls:
Gradient Tab
Color Lets you set the color for the bevel effect that you use; inner and outer bevels can use different color values.
Bevel Inner Lets you set a raised or lowered bevel effect, or no bevel effect, for the inside of the chart border.
Size Lets you set a thickness for the bevel effect that you use; inner and outer bevels use the same size value.
Color Lets you set a color for the background of your graph. The Color Editor opens, see “Color Editor Dialog Box”.
Pattern Lets you set a pattern for the background of your graph. The Hatch Brush Editor opens, see “Hatch Brush Editor Dialog Box”.
Transparent Makes the background of the graph transparent.
Background Image Lets you set an existing image as the background of the graph. Click Browse, then select the image (including .bmp, .tif, .jpg, .png,. and .gif). After you have set a background image, you can remove the image from the graph by clicking Clear.You can control the Style of the background image:
• Stretch—Resizes the background image to fill the entire background of the graph.
• Tile—Repeats the background image as many times as needed to fill the entire back-ground of the graph.
• Center—Puts the background image in the horizontal and vertical center of the graph.
• Normal—Puts the background image in the top-left corner of the graph.
Bentley SewerCAD V8i User’s Guide 10-523
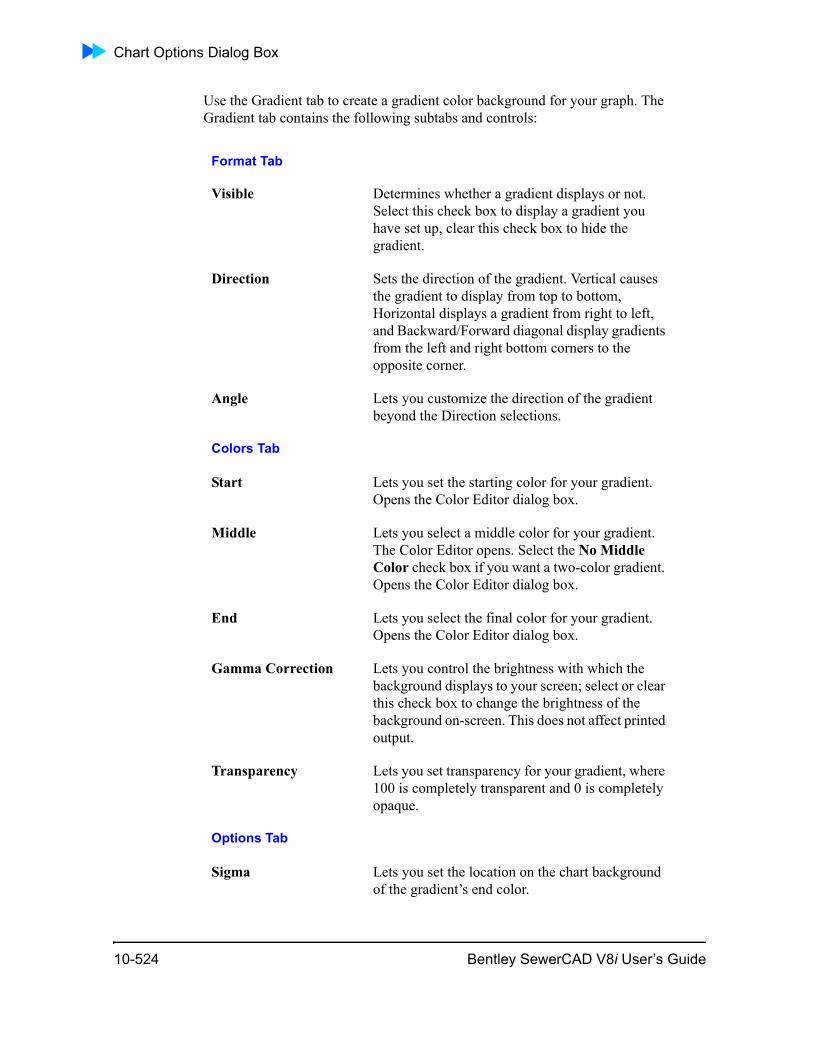
Chart Options Dialog Box
Use the Gradient tab to create a gradient color background for your graph. The Gradient tab contains the following subtabs and controls:
Format Tab
Visible Determines whether a gradient displays or not. Select this check box to display a gradient you have set up, clear this check box to hide the gradient.
Direction Sets the direction of the gradient. Vertical causes the gradient to display from top to bottom, Horizontal displays a gradient from right to left, and Backward/Forward diagonal display gradients from the left and right bottom corners to the opposite corner.
Angle Lets you customize the direction of the gradient beyond the Direction selections.
Colors Tab
Start Lets you set the starting color for your gradient. Opens the Color Editor dialog box.
Middle Lets you select a middle color for your gradient. The Color Editor opens. Select the No Middle Color check box if you want a two-color gradient. Opens the Color Editor dialog box.
End Lets you select the final color for your gradient. Opens the Color Editor dialog box.
Gamma Correction Lets you control the brightness with which the background displays to your screen; select or clear this check box to change the brightness of the background on-screen. This does not affect printed output.
Transparency Lets you set transparency for your gradient, where 100 is completely transparent and 0 is completely opaque.
Options Tab
Sigma Lets you set the location on the chart background of the gradient’s end color.
10-524 Bentley SewerCAD V8i User’s Guide

Presenting Your Results
Shadow Tab
Use the Shadow tab to create a shadow for your graph. The Shadow tab contains the following controls:
Axes Tab
Use the Axes tab set how your axes display. It includes the following controls and subtabs:
Sigma Focus Lets you use the options controls. Select this check box to use the controls in the Options tab.
Sigma Scale Lets you control how much of the gradient’s end color is used by the gradient background.
Visible Lets you display a shadow for your graph. Select this check box to display the shadow, clear this check box to turn off the shadow effect.
Size Set the size of the shadow by increasing or decreasing the numbers for Horizontal and/or Vertical Size.
Color Lets you set a color for the shadow of your graph. You might set this to gray but can set it to any other color.
Pattern Lets you set a pattern for the shadow of your graph. The Hatch Brush Editor opens, see “Hatch Brush Editor Dialog Box”.
Transparency Lets you set transparency for your shadow, where 100 is completely transparent and 0 is completely opaque.
Visible When checked, displays all of your graph’s axes; clear it to hide all of the graph’s axes.
Behind When checked, displays all of your graph’s axes behind the series display; clear it to display the axes in front of the series display.
Bentley SewerCAD V8i User’s Guide 10-525
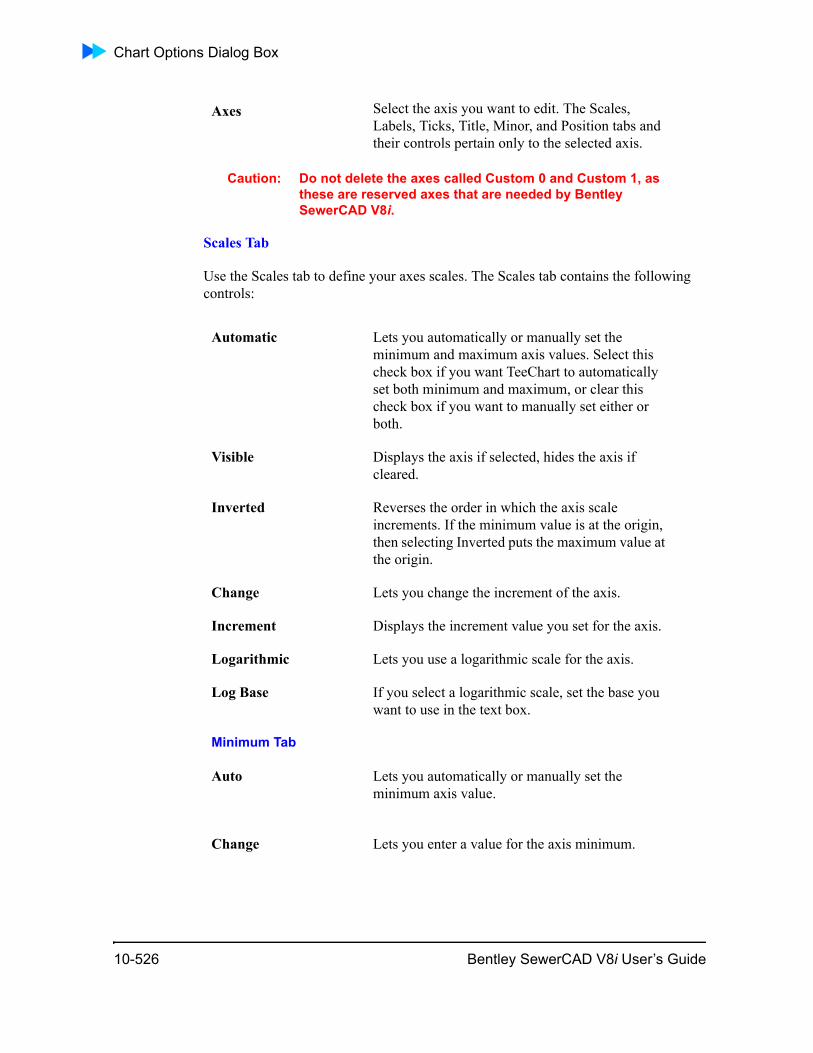
Chart Options Dialog Box
Caution: Do not delete the axes called Custom 0 and Custom 1, as these are reserved axes that are needed by Bentley SewerCAD V8i.
Scales Tab
Use the Scales tab to define your axes scales. The Scales tab contains the following controls:
Axes Select the axis you want to edit. The Scales, Labels, Ticks, Title, Minor, and Position tabs and their controls pertain only to the selected axis.
Automatic Lets you automatically or manually set the minimum and maximum axis values. Select this check box if you want TeeChart to automatically set both minimum and maximum, or clear this check box if you want to manually set either or both.
Visible Displays the axis if selected, hides the axis if cleared.
Inverted Reverses the order in which the axis scale increments. If the minimum value is at the origin, then selecting Inverted puts the maximum value at the origin.
Change Lets you change the increment of the axis.
Increment Displays the increment value you set for the axis.
Logarithmic Lets you use a logarithmic scale for the axis.
Log Base If you select a logarithmic scale, set the base you want to use in the text box.
Minimum Tab
Auto Lets you automatically or manually set the minimum axis value.
Change Lets you enter a value for the axis minimum.
10-526 Bentley SewerCAD V8i User’s Guide
Presenting Your Results
Labels Tab
Use the Labels tab to define your axes text. The Labels tab contains the following subtabs and controls:
Offset Lets you adjust the axis scale to change the location of the minimum or maximum axis value with respect to the origin.
Maximum Tab
Auto Lets you automatically or manually set the maximum axis value.
Change Lets you enter a value for the axis maximum.
Offset Lets you adjust the axis scale to change the location of the minimum or maximum axis value with respect to the origin.
Style Tab
Visible Lets you show or hide the axis text.
Multi-line Lets you split labels or values into more than one line if the text contains a space. Select this check box to enable multi-line text.
Round first Controls whether axis labels are automatically rounded to the nearest magnitude.
Label on axis Controls whether Labels just at Axis Minimum and Maximum positions are shown. This applies only if the maximum value for the axis matches the label for extreme value on the chart.
Size Determines distance between the margin of the graph and the placement of the labels.
Angle Sets the angle of the axis labels. In addition to using the up and down arrows to set the angle in 90° increments, you can type an angle you want to use.
Min. Separation % Sets the minimum distance between axis labels.
Bentley SewerCAD V8i User’s Guide 10-527
Chart Options Dialog Box
Style Lets you set the label style.
• Auto—Lets TeeChart automatically set the label style.
• Value—Sets axis labeling based on minimum and maximum axis values.
• Text—Uses text for labels. Since Bentley SewerCAD V8i uses numeric values, this is not implemented; don’t use it.
• None—Turns off axis labels.
• Mark—Uses SeriesMarks style for labels. Since Bentley SewerCAD V8i uses numeric values, this is not implemented; don’t use it.
Format Tab
Exponential Displays the axis label using an exponent, if appropriate.
Values Format Lets you set the numbering format for the axis labels.
Default Alignment Lets you select and clear the default TeeChart alignment for the right or left axes only.
Text Tab
Font Lets you set the font properties for axis labels. This opens the Windows Font dialog box.
Color Lets you select the color for the axis label font. Double-click the colored square between Font and Fill to open the Color Editor dialog box (see “Color Editor Dialog Box”).
Fill Lets you set a pattern the axis label font. The Hatch Brush Editor opens, see “Hatch Brush Editor Dialog Box”.
10-528 Bentley SewerCAD V8i User’s Guide
Presenting Your Results
Ticks Tab
Use the Ticks tab to define the major ticks and their grid lines. The Ticks tab contains the following controls:
Shadow —Lets you set a shadow for the axis labels.
• Visible—Lets you display a shadow for the axis labels. Select this check box to display the axis label shadow.
• Size—Lets you set the location of the shadow. Use larger numbers to offset the shadow by a large amount.
• Color—Lets you set a color for the shadow. You might set this to gray but can set it to any other color. The Color Editor opens.
• Pattern—Lets you set a pattern for the shadow. The Hatch Brush Editor opens.
• Transparency—Lets you set transparency for your shadow, where 100 is completely trans-parent and 0 is completely opaque.
Axis Lets you set the properties of the selected axis. Opens the Border Editor dialog box.
Grid Lets you set the properties of the graph’s grid lines that intersect the selected axis. Opens the Border Editor dialog box.
Ticks Lets you set the properties of the tick marks that are next to the labels on the label-side of the selected axis. Opens the Border Editor dialog box.
Len Sets the length of the Ticks or Inner ticks.
Inner Lets you set the properties of the tick marks that are next to the labels on the graph-side of the selected axis. Opens the Border Editor dialog box.
Centered Lets you align between the grid labels the graph’s grid lines that intersect the selected axis.
At Labels Only Sets the axis ticks and axis grid to be drawn at labels only. Otherwise, they are drawn at all axis increment positions.
Bentley SewerCAD V8i User’s Guide 10-529
Chart Options Dialog Box
Title Tab
Use the Title tab to set the axis titles. The Title tab contains the following subtabs and controls:
Style Tab
Title Lets you type a new axis title.
Angle Sets the angle of the axis title. In addition to using the up and down arrows to set the angle in 90° increments, you can type an angle you want to use.
Size Determines distance between the margin of the graph and the placement of the labels. xxxx not functional (busted)
Visible Check box that lets you display or hide the axis title.
Text Tab
Font Lets you set the font properties for axis title. This opens the Windows Font dialog box.
Color Lets you select the color for the axis title font. Double-click the colored square between Font and Fill to open the Color Editor dialog box (see “Color Editor Dialog Box”).
Fill Lets you set a pattern the axis title font. The Hatch Brush Editor opens, see “Hatch Brush Editor Dialog Box”
10-530 Bentley SewerCAD V8i User’s Guide
Presenting Your Results
Minor Tab
Use the Minor tab to define those graph ticks that are neither major ticks. The Minor tab contains the following controls and tabs:
Position Tab
Use the Position tab to set the axes position for your graph. The Position tab contains the following controls:
Shadow Lets you set a shadow for the axis title.
• Visible—Lets you display a shadow for the axis title. Select this check box to display the axis label shadow.
• Size—Lets you set the location of the shadow. Use larger numbers to offset the shadow by a large amount.
• Color—Lets you set a color for the shadow. You might set this to gray but can set it to any other color. The Color Editor opens.
• Pattern—Lets you set a pattern for the shadow. The Hatch Brush Editor opens.
• Transparency—Lets you set transparency for your shadow, where 100 is completely trans-parent and 0 is completely opaque.
Ticks Lets you set the properties of the minor tick marks. The Border Editor opens, see “Border Editor Dialog Box”.
Length Sets the length of the minor tick marks.
Grid Lets you set the properties of grid lines that align with the minor ticks. The Border Editor opens, see “Border Editor Dialog Box”.
Count Sets the number of minor tick marks.
Position % Sets the position of the axis on the graph in pixels or as a percentage of the graph’s dimensions.
Bentley SewerCAD V8i User’s Guide 10-531
Chart Options Dialog Box
General Tab
Use the General tab to preview a graph before you print it and set up scrolling and zooming for a graph. It includes the following controls:
Zoom Tab
Start % Sets the start of the axis as percentage of width (horizontal axis) and height (vertical axis) of the graph. The original axis scale is fitted to new axis height/width.
End % Sets the end of the axis as percentage of width (horizontal axis) and height (vertical axis) of the graph. The original axis scale is fitted to new axis height/width.
Units Lets you select pixels or percentage as the unit for the axis position.
Z % Sets the Z dimension as a percentage of the graph’s dimensions. This is unused by Bentley SewerCAD V8i.
Print Preview Lets you see the current view of the document as it will be printed and lets you define the print settings, such as selecting a printer to use. Opens the Print Preview dialog box.
Margins Lets you specify margins for your graph. There are four boxes, each corresponding with the top, bottom, left, and right margins, into which you enter a value that you want to use for a margin.
Units Lets you set pixels or percentage as the units for your margins. Percentage is a percentage of the original graph size.
Cursor Lets you specify what your cursor looks like. Select a cursor type from the drop-down list, then click Close to close the TeeChart editor, and the new cursor style displays when the cursor is over the graph.
10-532 Bentley SewerCAD V8i User’s Guide

Presenting Your Results
Use the Zoom tab to set up zooming on, magnifying, and reducing the display of a graph. The Zoom tab contains the following controls:
Scroll Tab
Use the Scroll tab to set up scrolling and panning across a graph. The Scroll tab contains the following controls:
Titles Tab
The Titles tab lets you define titles to use for your graph. It includes the following controls and tabs:
Allow Lets you magnify the graph by clicking and dragging with the mouse.
Animated Lets you set a stepped series of zooms.
Steps Lets you set the number of steps used for successive zooms if you selected the Animated check box.
Pen Lets you set the thickness of the border for the zoom window that surrounds the magnified area when you click and drag. The Border Editor opens, see “Border Editor Dialog Box”.
Pattern The Hatch Brush Editor opens, see “Hatch Brush Editor Dialog Box”.
Minimum pixels Lets you set the number of pixels that you have to click and drag before the zoom feature is activated.
Direction Lets you zoom in the vertical or horizontal planes only, as well as both planes.
Mouse Button Lets you set the mouse button that you use to click and drag when activating the zoom feature.
Allow Scroll Lets you scroll and pan over the graph. Select this check box to turn on scrolling, clear the check box to turn it off.
Mouse Button Lets you set the mouse button that you click to use the scroll feature.
Bentley SewerCAD V8i User’s Guide 10-533
Chart Options Dialog Box
Style Tab
Use the Style tab to display and create a selected title. Type the text of the title in the text box on the Style tab. The Style tab contains the following controls:
Position Tab
Use the Position tab to set the placement of the selected title. The Position tab contains the following controls:
Format Tab
Use the Format tab to set and format a background shape behind the selected title. The Format tab contains the following controls:
Title Lets you set the location of the titles you want to use. The Titles sub tabs apply to the Title that is currently selected in the Title drop-down list.
Visible Lets you display the selected title.
Adjust Frame Lets you wrap the frame behind the selected title to the size of the title text.Each title can have a frame behind it (see “Format Tab”). By default, this frame is transparent. If you turn off transparency to see the frame, the frame can be sized to the width of the graph or set to snap to the width of the title text.Select the Adjust Frame check box to set the width of the frame to the width of the title text; clear this check box to set the width of the frame to the width of the graph.
Alignment Lets you set the alignment of the selected title.
Custom Lets you set a custom position for the selected title. Select this check box to set a custom position.
Left/Top Lets you set the location of the selected title relative to the left and top of the graph. If you select the Custom check box, use these settings to position the selected title.
10-534 Bentley SewerCAD V8i User’s Guide
Presenting Your Results
Text Tab
Use the Text tab to format the text used in the selected title. The Text tab contains the following controls:
Color Lets you set a color for the fill of the shape you create behind the selected title. The Color Editor opens, see “Color Editor Dialog Box”.
Frame Lets you define the outline of the shape you create behind the selected title. The Border Editor opens, see “Border Editor Dialog Box”.
Pattern Lets you set a pattern for the fill of the shape you create behind the selected title. The Hatch Brush Editor opens, see “Hatch Brush Editor Dialog Box”.
Round Frame Lets you round the corners of the rectangular shape you create behind the selected title. Select this check box to round the corners of the shape.
Transparent Lets you set the fill of the shape you create behind the selected title as transparent. If the shape is completely transparent, you cannot see it, so clear this check box if you cannot see a shape that you expect to see.
Transparency Lets you set transparency for the shape, where 100 is completely transparent and 0 is completely opaque.
Font Lets you set the font properties for the text. This opens the Windows Font dialog box.
Color Lets you select the color for the text. Double-click the colored square between Font and Fill to open the Color Editor dialog box (see “Color Editor Dialog Box”).
Fill Lets you set a pattern for the text. The Hatch Brush Editor opens, see “Hatch Brush Editor Dialog Box”.
Bentley SewerCAD V8i User’s Guide 10-535
Chart Options Dialog Box
Gradient Tab
Note: To use the Gradient tab, clear the Transparent check box in the Chart > Titles > Format tab.
Use the Gradient tab to create a gradient color background for your axis title. The Gradient tab contains the following controls:
Shadow Lets you set a shadow for the text.
• Visible—Lets you display a shadow for the text. Select this check box to display the axis label shadow.
• Size—Lets you set the location of the shadow. Use larger numbers to offset the shadow by a large amount.
• Color—Lets you set a color for the shadow. You might set this to gray but can set it to any other color. The Color Editor opens.
• Pattern—Lets you set a pattern for the shadow. The Hatch Brush Editor opens.
• Transparency—Lets you set transparency for your shadow, where 100 is completely trans-parent and 0 is completely opaque.
Format Tab
Visible Sets whether a gradient displays or not. Select this check box to display a gradient you have set up, clear this check box to hide the gradient.
Direction Sets the direction of the gradient. Vertical causes the gradient to display from top to bottom, Horizontal displays a gradient from right to left, and Backward/Forward diagonal display gradients from the left and right bottom corners to the opposite corner.
Angle Lets you customize the direction of the gradient beyond the Direction selections.
Colors Tab
Start Lets you set the starting color for your gradient.
10-536 Bentley SewerCAD V8i User’s Guide
Presenting Your Results
Shadow Tab
Use the Shadow tab to create a shadow for the background for the selected title. The Shadow tab contains the following controls:
Middle Lets you select a middle color for your gradient. The Color Editor opens. Select the No Middle Color check box if you want a two-color gradient.
End Lets you select the final color for your gradient.
Gamma Correction Lets you control the brightness with which the background displays to your screen; select or clear this check box to change the brightness of the background on-screen. This does not affect printed output.
Transparency Lets you set transparency for your gradient, where 100 is completely transparent and 0 is completely opaque.
Options Tab
Sigma Lets you use the options controls. Select this check box to use the controls in the Options tab.
Sigma Focus Lets you set the location on the chart background of the gradient’s end color.
Sigma Scale Lets you control how much of the gradient’s end color is used by the gradient background.
Visible Lets you display a shadow. Select this check box to display the shadow, clear this check box to turn off the shadow effect.
Size Set the size of the shadow by increasing or decreasing the numbers for Horizontal and/or Vertical Size.
Color Lets you set a color for the shadow. You might set this to gray but can set it to any other color. The Color Editor opens, see “Color Editor Dialog Box”.
Bentley SewerCAD V8i User’s Guide 10-537
Chart Options Dialog Box
Bevels Tab
Note: To use the Gradient tab, clear the Transparent check box in the Chart > Titles > Format tab.
Use the Bevels tab to create rounded effects for the background for the selected title. The Bevels tab contains the following controls:
Walls Tab
Use the Walls tab to set and format the edges of your graph. The Walls tab contains the following subtabs:
Left/Right/Back/Bottom Tabs
Use the Left, Right, Back, and Bottom tabs to select the walls that you want to edit. You might have to turn off the axes lines to see the effects (see “Axes Tab” on page 10-525) for the back wall and turn on 3D display to see the effects for the left, right, and bottom walls (see “3D Tab” on page 10-546).
The Left, Right, Back, and Bottom tabs contain the following controls:
Pattern Lets you set a pattern for the shadow. The Hatch Brush Editor opens, see “Hatch Brush Editor Dialog Box”.
Transparency Lets you set transparency for your shadow, where 100 is completely transparent and 0 is completely opaque.
Bevel Outer Lets you set a raised or lowered bevel effect, or no bevel effect, for the background for the selected title.
Color Lets you set the color for the bevel effect that you use; inner and outer bevels can use different color values.
Bevel Inner Lets you set a raised or lowered bevel effect, or no bevel effect, for the inside of the background for the selected title.
Size Lets you set a thickness for the bevel effect that you use; inner and outer bevels use the same size value.
10-538 Bentley SewerCAD V8i User’s Guide
Presenting Your Results
Paging Tab
Use the Paging tab to display your graph over several pages. The Paging tab contains the following controls:
Color The Color Editor opens, see “Color Editor Dialog Box”.
Border The Border Editor opens, see “Border Editor Dialog Box”.
Pattern The Hatch Brush Editor opens, see “Hatch Brush Editor Dialog Box”.
Gradient Lets you set a color gradient for your walls. The Gradient Editor opens, see “Gradient Editor Dialog Box”.
Visible Lets you display the walls you set up.
Dark 3D Lets you automatically darken the depth dimension for visual effect. Select a Size 3D larger than 0 to enable this check box.
Size 3D Lets you increase the size of the wall in the direction perpendicular to it’s length (the graph resizes automatically as a result).
Transparent Lets you set transparency for your background, where 100 is completely transparent and 0 is completely opaque.
Points per Page Lets you scale the graph to fit on one or many pages. Set the number of points you want to display on a single page of the graph, up to a maximum of 100.
Scale Last Page Scales the end of the graph to fit the last page.
Current Page Legend Shows only the current page items when the chart is divided into multiple pages.
Show Page Number Lets you display the current page number on the graph.
Bentley SewerCAD V8i User’s Guide 10-539
Chart Options Dialog Box
Legend Tab
Use the Legend tab to display and format a legend for your graph. The Legend tab includes the following controls:
Style Tab
Use the Style tab to set up and display a legend for your graph. The Style tab contains the following controls:
Position Tab
Use the Position tab to control the placement of the legend. The Position tab contains the following controls:
Arrows Lets you navigate through a multi-page graph. Click the single arrows to navigate one page at a time. Click the double arrows to navigate directly to the last or first pages of the graph.
Visible Lets you show or hide the legend for your graph.
Inverted Lets you draw legend items in the reverse direction. Legend strings are displayed starting at top for Left and Right Alignment and starting at left for Top and Bottom Legend orientations.
Check boxes Activates/deactivates check boxes associated with each series in the Legend. When these boxes are unchecked in the legend, the associated series are invisible.
Font Series Color Sets text in the legend to the same color as the graph element to which it applies.
Legend Style Lets you select what appears in the legend.
Text Style Lets you select how the text in the legend is aligned and what data it contains.
Vert. Spacing Controls the space between rows in the legend.
Dividing Lines Lets you use and define lines that separate columns in the legend. The Border Editor opens, see “Border Editor Dialog Box”.
10-540 Bentley SewerCAD V8i User’s Guide
Presenting Your Results
Symbols Tab
Use the Symbols tab to add to the legend symbols that represent the series in the graph. The Symbols tab contains the following controls:
Position Lets you place the legend on the left, top, right, or bottom of the chart.
Resize Chart Lets you resize your graph to accommodate the legend. If you do not select this check box, the graph and legend might overlap.
Margin Lets you set the amount of space between the graph and the legend.
Position Offset % Determines the vertical size of the Legend. Lower values place the Legend higher up in the display
Custom Lets you use the Left and Top settings to control the placement of the legend. xxxx seems broken
Left/Top Lets you enter a value for custom placement of the legend.xxxx seems broken
Visible Lets you display the series symbol next to the text in the legend.
Width Lets you resize the symbol that displays in the legend. You must clear Squared to use this control.
Width Units Lets you set the units that are used to size the width of the symbol.
Default border Lets you use the default TeeChart format for the symbol. If you clear this check box, you can set a custom border using the Border button.
Border Lets you set a custom border for the symbols. You must clear Default Border to use this option. The Border Editor opens, see “Border Editor Dialog Box”.
Position Lets you put the symbol to the left or right of its text.
Bentley SewerCAD V8i User’s Guide 10-541
Chart Options Dialog Box
Format Tab
Use the Format tab to set and format the box that contains the legend. The Format tab contains the following controls:
Text Tab
Continuous Lets you attach or detach legend symbols. If you select this check box, the color rectangles of the different items are attached to each other with no vertical spacing. If you clear this check box, the legend symbols are drawn as separate rectangles.
Squared Lets you override the width of the symbol, so you can make the symbol square shaped.
Color Lets you set a color for the fill of the legend’s box. The Color Editor opens, see “Color Editor Dialog Box”.
Frame Lets you define the outline of the legend’s box. The Border Editor opens, see “Border Editor Dialog Box”.
Pattern Lets you set a pattern for the fill of the legend’s box. The Hatch Brush Editor opens, see “Hatch Brush Editor Dialog Box”.
Round Frame Lets you round the corners of the legend’s box. Select this check box to round the corners of the shape.
Transparent Lets you set the fill of the legend’s box as transparent. If the shape is completely transparent, you cannot see it, so clear this check box if you cannot see a shape that you expect to see.
Transparency Lets you set transparency for the legend’s box, where 100 is completely transparent and 0 is completely opaque.
10-542 Bentley SewerCAD V8i User’s Guide
Presenting Your Results
Use the Text tab to format the text used in the legend. The Text tab contains the following controls:
Gradient Tab
Use the Gradient tab to create a gradient color background for your legend. The Gradient tab contains the following controls:
Font Lets you set the font properties for the text. This opens the Windows Font dialog box.
Color Lets you select the color for the text. Double-click the colored square between Font and Fill to open the Color Editor dialog box (see “Color Editor Dialog Box”).
Fill Lets you set a pattern for the text. The Hatch Brush Editor opens, see “Hatch Brush Editor Dialog Box”.
Shadow Lets you set a shadow for the text.
• Visible—Lets you display a shadow for the text. Select this check box to display the axis label shadow.
• Size—Lets you set the location of the shadow. Use larger numbers to offset the shadow by a large amount.
• Color—Lets you set a color for the shadow. You might set this to gray but can set it to any other color. The Color Editor opens.
• Pattern—Lets you set a pattern for the shadow. The Hatch Brush Editor opens.
• Transparency—Lets you set transparency for your shadow, where 100 is completely trans-parent and 0 is completely opaque.
Format Tab
Visible Sets whether a gradient displays or not. Select this check box to display a gradient you have set up, clear this check box to hide the gradient.
Bentley SewerCAD V8i User’s Guide 10-543
Chart Options Dialog Box
Shadow Tab
Direction Sets the direction of the gradient. Vertical causes the gradient to display from top to bottom, Horizontal displays a gradient from right to left, and Backward/Forward diagonal display gradients from the left and right bottom corners to the opposite corner.
Angle Lets you customize the direction of the gradient beyond the Direction selections.
Colors Tab
Start Lets you set the starting color for your gradient.
Middle Lets you select a middle color for your gradient. The Color Editor opens. Select the No Middle Color check box if you want a two-color gradient.
End Lets you select the final color for your gradient.
Gamma Correction Lets you control the brightness with which the background displays to your screen; select or clear this check box to change the brightness of the background on-screen. This does not affect printed output.
Transparency Lets you set transparency for your gradient, where 100 is completely transparent and 0 is completely opaque.
Options Tab
Sigma Lets you use the options controls. Select this check box to use the controls in the Options tab.
Sigma Focus Lets you set the location on the chart background of the gradient’s end color.
Sigma Scale Lets you control how much of the gradient’s end color is used by the gradient background.
10-544 Bentley SewerCAD V8i User’s Guide
Presenting Your Results
Use the Shadow tab to create a shadow for the legend. The Shadow tab contains the following controls:
Bevels Tab
Use the Bevels tab to create a rounded effects for the legend. The Bevels tab contains the following controls:
Visible Lets you display a shadow. Select this check box to display the shadow, clear this check box to turn off the shadow effect.
Size Set the size of the shadow by increasing or decreasing the numbers for Horizontal and/or Vertical Size.
Color Lets you set a color for the shadow. You might set this to gray but can set it to any other color. The Color Editor opens, see “Color Editor Dialog Box”.
Pattern Lets you set a pattern for the shadow. The Hatch Brush Editor opens, see “Hatch Brush Editor Dialog Box”.
Transparency Lets you set transparency for your shadow, where 100 is completely transparent and 0 is completely opaque.
Bevel Outer Lets you set a raised or lowered bevel effect, or no bevel effect, for the background for the selected title.
Color Lets you set the color for the bevel effect that you use; inner and outer bevels can use different color values.
Bevel Inner Lets you set a raised or lowered bevel effect, or no bevel effect, for the inside of the background for the selected title.
Size Lets you set a thickness for the bevel effect that you use; inner and outer bevels use the same size value.
Bentley SewerCAD V8i User’s Guide 10-545
Chart Options Dialog Box
3D Tab
Use the 3D tab to add a three-dimensional effect to your graph. The 3D tab contains the following controls:
3 Dimensions Lets you display the chart in three dimensions. Select this check box to turn on three-dimensional display.
3D % Lets you increase or decrease the three-dimensional effect. Set a larger percentage for more three-dimensional effect, or a smaller percentage for less effect.
Orthogonal Lets you fix the graph in the two-dimensional work plane or, if you clear this check box, lets you use the Rotation and Elevation controls to rotate the graph freely.
Zoom Text Lets you magnify and reduce the size of the text in a graph when using the zoom tool. clear this check box if you want text, such as labels, to remain the same size when you use the zoom tool.
Quality Lets you select how the graph displays as you manipulate and zoom on it.
Clip Points Trims the view of a series to the walls of your graph’s boundaries, to enhance the three-dimensional effect. Turn this on to trim the graph. You only see this effect when the graph is in certain rotated positions.
Zoom Lets you magnify and reduce the display of the graph in the Graph dialog box.
Rotation Lets you rotate the graph. You must clear Orthogonal to use this control.
Elevation Lets you rotate the graph. You must clear Orthogonal to use this control.
Horiz. Offset Lets you adjust the left-right position of the graph.
Vert. Offset Lets you adjust the up-down position of the graph.
10-546 Bentley SewerCAD V8i User’s Guide
Presenting Your Results
Chart Options Dialog Box - Series Tab
Use the Series tab to set up how the series in your graph display. Select the series you want to edit from the drop-down list at the top of the Series tab.
The Series tab is organized into second-level sub-tabs:
• “Format Tab”
• “Point Tab”
• “General Tab”
• “Data Source Tab”
• “Marks Tab”
Format Tab
Use the Format tab to set up how the selected series appears. The Format tab contains the following controls:
Perspective Lets you rotate the graph. You must clear Orthogonal to use this control.
Border Lets you format the graph of the selected series. The Border Editor opens, see “Border Editor Dialog Box”.
Color Lets you set a color for the graph of the selected series. The Color Editor opens, see “Color Editor Dialog Box”.
Pattern Lets you set a pattern for the graph of the selected series. This might only be visible on a three-dimensional graph (see “3D Tab”). The Hatch Brush Editor opens, see “Hatch Brush Editor Dialog Box”.
Dark 3D Lets you automatically darken the depth dimension for visual effect.
Color Each Assigns a different color to each series indicator.
Clickable This is unused by Bentley SewerCAD V8i.
Bentley SewerCAD V8i User’s Guide 10-547
Chart Options Dialog Box
Point Tab
Use the Point tab to set up how the points that make up the selected series appear. The Point tab contains the following controls:
Color Each line Lets you enable or disable the coloring of connecting lines in a series. This is unused by Bentley SewerCAD V8i.
Height 3D Lets you set a thickness for the three-dimensional effect in three-dimensional graphs.
Stack Lets you control how multiple series display in the Graph dialog box.
• None—Draws the series one behind the other.
• Overlap—Arranges multiple series with the same origin using the same space on the graph such that they might overlap several times.
• Stack—Lets you arrange multiple series so that they are additive.
• Stack 100%—Lets you review the area under the graph curves.
Transparency Lets you set transparency for your series, where 100 is completely transparent and 0 is completely opaque.
Stairs Lets you display a step effect between points on your graph.
Inverted Inverts the direction of the stairs effect
Outline Displays an outline around the selected series. The Border Editor opens.
Visible Lets you display the points used to create your graph.
3D Lets you display the points in three dimensions.
Dark 3D Lets you automatically darken the depth dimension for visual effect.
10-548 Bentley SewerCAD V8i User’s Guide
Presenting Your Results
General Tab
Use the General tab to modify basic formatting and relationships with axes for series in a graph. The General tab contains the following controls:
Inflate Margins Adjusts the margins of the points to display points that are close to the edge of the graph. If you clear this option, points near the edge of the graph might only partly display.
Pattern Lets you set a pattern for the points in your series. The Hatch Brush Editor opens, see “Hatch Brush Editor Dialog Box”. You must clear Default to use this option.
Default Lets you select the default format for the points in your series. This overrides any pattern selection.
Color Each Assigns a different color to each series indicator.
Style Lets you select the shape used to represent the points in the selected series.
Width/Height Lets you set a size for the points in the selected series.
Border Lets you set the outline of the shapes that represent the points in the selected series. The Border Editor opens, see “Border Editor Dialog Box”.
Transparency Lets you set transparency for the points in the selected series, where 100 is completely transparent and 0 is completely opaque.
Show in Legend Lets you show the series title in the legend. To use this feature, the legend style has to be Series or LastValues (see “Style Tab”).
Cursor Lets you specify what your cursor looks like. Select a cursor type from the drop-down list, then click Close to close the TeeChart editor, and the new cursor style displays when the cursor is over the graph.
Bentley SewerCAD V8i User’s Guide 10-549
Chart Options Dialog Box
Data Source Tab
Use this tab to connect a TeeChart series to another chart, table, query, dataset, or Delphi database dataset.
This lets you set the number of random points to generate and overrides the points passed by Bentley SewerCAD V8i to the chart control. The Data Source feature can be useful in letting you set its sources as functions and do calculations between the series created by Bentley SewerCAD V8i.
• Random—xxxx not sure
• Number of sample values—xxxx not sure
• Default—xxxx not sure
• Apply—xxxx not sure
Depth Lets you set the depth of the three-dimensional effect (see “3D Tab”).
Auto Lets you automatically size the three-dimensional effect. clear and then select this check box to reset the depth of the three-dimensional effect.
Values Controls the format of the values displayed when marks are on and they contain actual numeric values
Percents Controls the format of the values displayed when marks are on and they contain actual numeric values.
Horizontal Axis Lets you define which axis belongs to a given series, since you can have multiple axes in a chart.
Vertical Axis Lets you define which axis belongs to a given series, since you can have multiple axes in a chart.
Date Time This is unused by Bentley SewerCAD V8i.
Sort Sorts the points in the series using the labels list.
10-550 Bentley SewerCAD V8i User’s Guide
Presenting Your Results
Marks Tab
Use the Marks tab to display labels for points in the selected series. Series-point labels are called marks. The Marks tab contains the following tabs and controls:
Style Tab
Use the Style tab to set how the marks display. The Style tab contains the following controls:
Arrow Tab
Use the Arrow tab to display a leader line on the series graph to indicate where the mark applies. The Arrow tab contains the following controls:
Visible Lets you display marks.
Clipped Lets you display marks outside the graph border. clear this check box to let marks display outside the graph border, or select it to clip the marks to the graph border.
Multi-line Lets you display marks on more than one line. Select this check box to enable multi-line marks.
All Series Visible Lets you display marks for all series.
Style Lets you set the content of the marks.
Draw every Sets the interval of the marks that are displayed. Selecting 2 would display every second mark, and 3 would display every third, etc.
Angle Lets you rotate the marks for the selected series.
Border Lets you set up the leader line. The Border Editor opens, see “Border Editor Dialog Box”.
Pointer Lets you set up the arrow head (if any) used by the leader line. The Pointer dialog box opens, see “Pointer Dialog Box”.
Arrow head Lets you select the kind of arrow head you want to add to the leader line.
Size Lets you set the size of the arrow head.
Bentley SewerCAD V8i User’s Guide 10-551
Chart Options Dialog Box
Format Tab
Use the Format tab to set and format the boxes that contains the marks. The Format tab contains the following controls:
Text Tab
Use the Text tab to format the text used in the marks. The Text tab contains the following controls:
Length Lets you set the size of the leader line and arrow head, or just the leader line if there is no arrow head.
Distance Lets you set the distance between the leader line and the graph of the selected series.
Color Lets you set a color for the fill of the boxes. The Color Editor opens, see “Color Editor Dialog Box”.
Frame Lets you define the outline of the boxes. The Border Editor opens, see “Border Editor Dialog Box”.
Pattern Lets you set a pattern for the fill of the boxes. The Hatch Brush Editor opens, see “Hatch Brush Editor Dialog Box”.
Round Frame Lets you round the corners of the boxes. Select this check box to round the corners of the shape.
Transparent Lets you set the fill of the boxes as transparent. If the shape is completely transparent, you cannot see it, so clear this check box if you cannot see a shape that you expect to see.
Transparency Lets you set transparency for the boxes, where 100 is completely transparent and 0 is completely opaque.
Font Lets you set the font properties for the text. This opens the Windows Font dialog box.
10-552 Bentley SewerCAD V8i User’s Guide
Presenting Your Results
Gradient Tab
Use the Gradient tab to create a gradient color background for your marks. The Gradient tab contains the following subtabs and controls:
Color Lets you select the color for the text. Double-click the colored square between Font and Fill to open the Color Editor dialog box (see “Color Editor Dialog Box”).
Fill Lets you set a pattern for the text. The Hatch Brush Editor opens, see “Hatch Brush Editor Dialog Box”.
Shadow Lets you set a shadow for the text.
• Visible—Lets you display a shadow for the text. Select this check box to display the axis label shadow.
• Size—Lets you set the location of the shadow. Use larger numbers to offset the shadow by a large amount.
• Color—Lets you set a color for the shadow. You might set this to gray but can set it to any other color. The Color Editor opens.
• Pattern—Lets you set a pattern for the shadow. The Hatch Brush Editor opens.
• Transparency—Lets you set transparency for your shadow, where 100 is completely trans-parent and 0 is completely opaque.
Format Tab
Visible Sets whether a gradient displays or not. Select this check box to display a gradient you have set up, clear this check box to hide the gradient.
Direction Sets the direction of the gradient. Vertical causes the gradient to display from top to bottom, Horizontal displays a gradient from right to left, and Backward/Forward diagonal display gradients from the left and right bottom corners to the opposite corner.
Bentley SewerCAD V8i User’s Guide 10-553
Chart Options Dialog Box
Shadow Tab
Use the Shadow tab to create a shadow for the marks. The Shadow tab contains the following controls:
Angle Lets you customize the direction of the gradient beyond the Direction selections.
Colors Tab
Start Lets you set the starting color for your gradient.
Middle Lets you select a middle color for your gradient. The Color Editor opens. Select the No Middle Color check box if you want a two-color gradient.
End Lets you select the final color for your gradient.
Gamma Correction Lets you control the brightness with which the background displays to your screen; select or clear this check box to change the brightness of the background on-screen. This does not affect printed output.
Transparency Lets you set transparency for your gradient, where 100 is completely transparent and 0 is completely opaque.
Options Tab
Sigma Lets you use the options controls. Select this check box to use the controls in the Options tab.
Sigma Focus Lets you set the location on the chart background of the gradient’s end color.
Sigma Scale Lets you control how much of the gradient’s end color is used by the gradient background.
Visible Lets you display a shadow. Select this check box to display the shadow, clear this check box to turn off the shadow effect.
Size Set the size of the shadow by increasing or decreasing the numbers for Horizontal and/or Vertical Size.
10-554 Bentley SewerCAD V8i User’s Guide
Presenting Your Results
Bevels Tab
Use the Bevels tab to create a rounded effects for your marks. The Bevels tab contains the following controls:
Chart Options Dialog Box - Tools Tab
Use the Tools tab to add special figures in order to highlight particular facts on a given chart. For more information, see “Chart Tools Gallery Dialog Box” on page 10-566. The Tools tab contains the following controls:
Color Lets you set a color for the shadow. You might set this to gray but can set it to any other color. The Color Editor opens, see “Color Editor Dialog Box”.
Pattern Lets you set a pattern for the shadow. The Hatch Brush Editor opens, see “Hatch Brush Editor Dialog Box”.
Transparency Lets you set transparency for your shadow, where 100 is completely transparent and 0 is completely opaque.
Bevel Outer Lets you set a raised or lowered bevel effect, or no bevel effect, for the background for the selected title.
Color Lets you set the color for the bevel effect that you use; inner and outer bevels can use different color values.
Bevel Inner Lets you set a raised or lowered bevel effect, or no bevel effect, for the inside of the background for the selected title.
Size Lets you set a thickness for the bevel effect that you use; inner and outer bevels use the same size value.
Add Lets you add a tool from the Chart Tools Gallery. To be usable in the current graph, a tool needs to be added and set to Active.
Bentley SewerCAD V8i User’s Guide 10-555
Chart Options Dialog Box
Note: Each tool has its own parameters, see “Chart Tools Gallery Dialog Box”.
Chart Options Dialog Box - Export Tab
Use the Export tab to save your graph for use in another application. The Export tab contains the following controls:
Picture Tab
Use the Picture tab to save your graph as a raster image or to copy the graph as an image to the clipboard. The Picture tab contains the following controls and subtabs:
Delete Deletes the selected tool from the list of those available in the current graph.
Active Activates a selected tool for the current graph. To be usable in the current graph, a tool needs to be added and set to Active.
Up/Down arrow These are unused by Bentley SewerCAD V8i.
Copy Lets you copy the contents of the graph to the Windows clipboard, so you can paste it into another application. You must consider the type of data you have copied when choosing where to paste it. For example, if you copy a picture, you cannot paste it into a text editor, you must paste it into a photo editor or a word processor that accepts pictures. Similarly, if you copy data, you cannot paste it into an image editor, you must paste it into a text editor or word processor.
Save Lets you create a new file from the contents of the graph.
Format Lets you select the format of the picture you want to save. GIF, PNG, and JPEG are supported by the Worldwide Web, a metafile is a more easily scalable format. A Bitmap is a Microsoft BMP file that is widely supported on Windows operating systems, whereas TIFF pictures are supported on a variety of Microsoft and non-Microsoft operating systems.
10-556 Bentley SewerCAD V8i User’s Guide
Presenting Your Results
Note: Changing the size of a graph using these controls might cause some loss of quality in the image. Instead, try saving the graph as a metafile and resizing the metafile after you paste or insert it into its destination.
Native Tab
The Native tab contains the following controls:
Data Tab
The Data tab contains the following controls:
Options Tab
Colors Lets you use the default colors used by your graph or to convert the picture to use grayscale. This feature is used when you save the picture as a file, not by the copy option.
Size Tab
Width/Height Lets you change the width and height of the picture. These values are measured in pixels and are used by both the Save and Copy options
Keep aspect ratio Lets you keep the relationship between the height and width of the picture the same when you change the image size. If you clear this check box, you can distort the picture by setting height or width sizes that are not proportional to the original graph.
Include Series Data This is unused by Bentley SewerCAD V8i.—xxxx broken
File Size Displays the size of an ASCII file containing the data from the current graph.
Series Lets you select the series from which you copy data.
Format Lets you select a file type to which you can save the data. This is not used by the Copy function.
Bentley SewerCAD V8i User’s Guide 10-557
Chart Options Dialog Box
Chart Options Dialog Box - Print Tab
Use the Print tab to preview and print your graph. The Print tab contains the following controls and subtabs:
Include Select the data you want to copy.
Text separator Lets you specify how you want rows of data separated. This is supported by the Save function and only by the Copy function if you first saved using the text separator you have selected, before you copy.
Printer Lets you select the printer you want to use.
Setup Lets you configure the printer you want to use. For example, if the selected printer supports printing on both sides of a page, you might want to turn on this feature.
Print Prints the displayed graph to the selected printer.
Page Tab
Orientation Lets you set up the horizontal and vertical axes of the graph. Many graphs print better in Landscape orientation because of their width:height ratio.
Zoom Lets you magnify the graph as displayed in the print preview window. Use the scrollbars to inspect the graph if it doesn’t fit within the preview window after you zoom. Changing the zoom does not affect the size of the printed output.
Margins Lets you set up top, bottom, left, and right margins that are used when you print.
Margin Units Lets you set the units used by the Margins controls: percent or hundredths of an inch.
Format Tab
Print Background When checked, prints the background of the graph.
10-558 Bentley SewerCAD V8i User’s Guide
Presenting Your Results
Border Editor Dialog Box
The Border Editor dialog box lets you define border properties for your graph. The Border Editor dialog box contains the following controls:
Quality You do not need to change this setting. The box is cleared by default.
Proportional Lets you change the graph from proportional to non-proportional. When you change this setting, the preview pane is automatically updated to reflect the change. This box is checked by default.
Grayscale Prints the graph in grayscale, converting colors into shades of gray.
Detail Resolution Lets you adjust the detail resolution of the printout. Move the slider to adjust the resolution.
Preview Pane Displays a small preview of the graph printout.
Visible Displays or hides the border. Select this check box to display the border.
Color Lets you select a color for the border. The Color Editor dialog box opens, see “Color Editor Dialog Box”.
Ending Lets you set the ending style of the border.
Dash Lets you select the dash style, if you have a selection other than Solid set for the border style.
Width Lets you set the width of the border.
Style Lets you set the style for the border. Solid is an uninterrupted line.
Transparency Lets you set transparency for your border, where 100 is completely transparent and 0 is completely opaque.
Bentley SewerCAD V8i User’s Guide 10-559
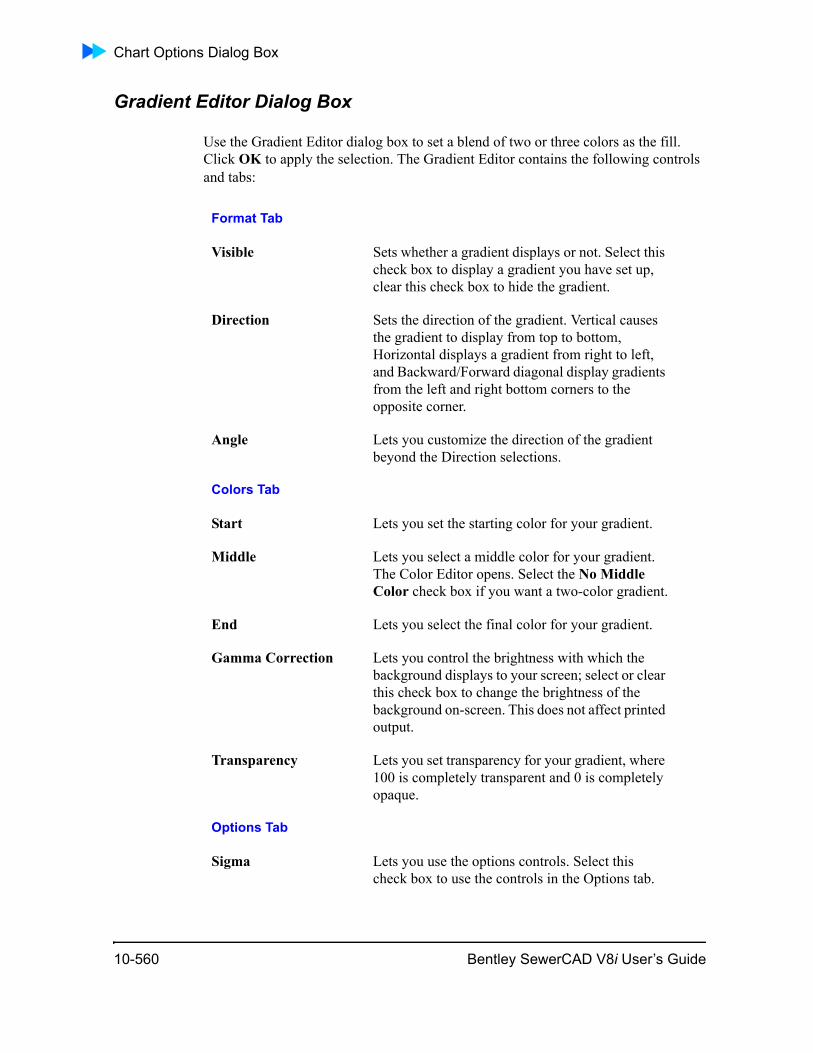
Chart Options Dialog Box
Gradient Editor Dialog Box
Use the Gradient Editor dialog box to set a blend of two or three colors as the fill. Click OK to apply the selection. The Gradient Editor contains the following controls and tabs:
Format Tab
Visible Sets whether a gradient displays or not. Select this check box to display a gradient you have set up, clear this check box to hide the gradient.
Direction Sets the direction of the gradient. Vertical causes the gradient to display from top to bottom, Horizontal displays a gradient from right to left, and Backward/Forward diagonal display gradients from the left and right bottom corners to the opposite corner.
Angle Lets you customize the direction of the gradient beyond the Direction selections.
Colors Tab
Start Lets you set the starting color for your gradient.
Middle Lets you select a middle color for your gradient. The Color Editor opens. Select the No Middle Color check box if you want a two-color gradient.
End Lets you select the final color for your gradient.
Gamma Correction Lets you control the brightness with which the background displays to your screen; select or clear this check box to change the brightness of the background on-screen. This does not affect printed output.
Transparency Lets you set transparency for your gradient, where 100 is completely transparent and 0 is completely opaque.
Options Tab
Sigma Lets you use the options controls. Select this check box to use the controls in the Options tab.
10-560 Bentley SewerCAD V8i User’s Guide
Presenting Your Results
To access the Gradient Editor dialog box, click Chart Settings in the Graph dialog box, then click the Tools tab. Select the Axis tab and Color Band tool, then click the Gradient button.
Color Editor Dialog Box
Use the Color Editor dialog box to select a color. Click the basic color you want to use then click OK to apply the selection. The Color Editor dialog box contains the following controls:
To access the Color Editor dialog box, click a Color button in the Chart Options dialog box.
Color Dialog Box
Use the Color dialog box to select a basic color or to define a custom color. After you select the color you want to use, click OK to apply the selection.
Sigma Focus Lets you set the location on the chart background of the gradient’s end color.
Sigma Scale Lets you control how much of the gradient’s end color is used by the gradient background.
Transparency Lets you set transparency for your color, where 100 is completely transparent and 0 is completely opaque.
Custom Lets you define a custom color to use. The Color dialog box opens, see “Color Dialog Box”.
OK/Cancel Click OK to use the selection. Click Cancel to close the dialog box without making a selection.
Basic colors Lets you click a color to select it.
Custom colors Displays colors you have created and selected for use.
Color matrix Lets you use the mouse to select a color from a range of colors displayed.
Color|Solid Displays the currently defined custom color.
Bentley SewerCAD V8i User’s Guide 10-561
Chart Options Dialog Box
To access the Color dialog box, click the Custom button in the Color Editor dialog box.
Hatch Brush Editor Dialog Box
Use the Hatch Brush Editor dialog box to set a fill. The Hatch Brush Editor dialog box contains the following controls and tabs:
• “Hatch Brush Editor Dialog Box - Solid Tab”
• “Hatch Brush Editor Dialog Box - Hatch Tab”
• “Hatch Brush Editor Dialog Box - Gradient Tab”
• “Hatch Brush Editor Dialog Box - Image Tab”
Hatch Brush Editor Dialog Box - Solid Tab
Use the Solid tab to set a solid color as the fill. The Solid tab contains the following controls:
Hue/Sat/Lum Lets you define a color by entering values for hue, saturation, and luminosity.
Red/Green/Blue Lets you define a color by entering values of red, green, and blue colors.
Add to Custom Colors Adds the current custom color to the Custom colors area.
Visible Displays or hides the pattern. Select this check box to display the selected pattern.
Transparency Lets you set transparency for your color, where 100 is completely transparent and 0 is completely opaque.
Custom Lets you define a custom color to use. The Color dialog box opens, see “Color Dialog Box”.
OK/Cancel Click OK to use the selection. Click Cancel to close the dialog box without making a selection.
10-562 Bentley SewerCAD V8i User’s Guide
Presenting Your Results
Hatch Brush Editor Dialog Box - Hatch Tab
Use the Hatch tab to set a pattern as the fill. Click OK to apply the selection. The Hatch tab contains the following controls:
Hatch Brush Editor Dialog Box - Gradient Tab
Use the Gradient tab to set a blend of two or three colors as the fill. Click OK to apply the selection. The Gradient tab contains the following controls:
Hatch Style Select the pattern you want to use. These display using the currently selected background and foreground colors.
Background/Foreground
Select the color you want to use for the background and foreground of the pattern. This opens the Color Editor, see “Color Editor Dialog Box”.
% Lets you set transparency for your color, where 100 is completely transparent and 0 is completely opaque.
Format Tab
Visible Sets whether a gradient displays or not. Select this check box to display a gradient you have set up, clear this check box to hide the gradient.
Direction Sets the direction of the gradient. Vertical causes the gradient to display from top to bottom, Horizontal displays a gradient from right to left, and Backward/Forward diagonal display gradients from the left and right bottom corners to the opposite corner.
Angle Lets you customize the direction of the gradient beyond the Direction selections.
Colors Tab
Start Lets you set the starting color for your gradient.
Middle Lets you select a middle color for your gradient. The Color Editor opens. Select the No Middle Color check box if you want a two-color gradient.
Bentley SewerCAD V8i User’s Guide 10-563
Chart Options Dialog Box
Hatch Brush Editor Dialog Box - Image Tab
Use the Image tab to select an existing graphic file or picture to use as the fill. Click OK to apply the selection. The Image tab contains the following controls:
End Lets you select the final color for your gradient.
Gamma Correction Lets you control the brightness with which the background displays to your screen; select or clear this check box to change the brightness of the background on-screen. This does not affect printed output.
Transparency Lets you set transparency for your gradient, where 100 is completely transparent and 0 is completely opaque.
Options Tab
Sigma Lets you use the options controls. Select this check box to use the controls in the Options tab.
Sigma Focus Lets you set the location on the chart background of the gradient’s end color.
Sigma Scale Lets you control how much of the gradient’s end color is used by the gradient background.
Browse Lets you navigate to then select the graphic file you want to use. When selected, the graphic displays in the tab.
Style Lets you define how the graphic is used in the fill.
• Stretch—Resizes the image to fill the usable space.
• Tile—Repeats the image to fill the usable space.
• Center—Puts the image in the horizontal and vertical center.
• Normal—Puts the image in the top-left corner
10-564 Bentley SewerCAD V8i User’s Guide
Presenting Your Results
Pointer Dialog Box
Use the Pointer dialog box to set up a pointers for use with leader lines. The Pointer dialog box contains the following controls:
To access the Pointer dialog box, click Chart Settings in the Graph dialog box, then click Series > Marks > Arrow.
Visible Sets whether a pointer displays or not.
3D Lets you display the pointer in three dimensions.
Dark 3D Lets you automatically darken the depth dimension for visual effect.
Inflate Margins Adjusts the margins of the pointers to display pointers that are close to the edge of the graph. If you clear this option, pointers near the edge of the graph might only partly display.
Pattern Lets you set a pattern for the pointers. The Hatch Brush Editor opens, see “Hatch Brush Editor Dialog Box”. You must clear Default to use this option.
Default Lets you select the default format for the pointers. This overrides any pattern selection.
Color Each Assigns a different color to each pointer.
Style Lets you select the shape used to represent the pointers.
Width/Height Lets you set a size for the pointers.
Border Lets you set the outline of the shapes that represent the pointers. The Border Editor opens, see “Border Editor Dialog Box”.
Transparency Lets you set transparency for the pointers, where 100 is completely transparent and 0 is completely opaque.
Bentley SewerCAD V8i User’s Guide 10-565
Chart Options Dialog Box
Change Series Title Dialog Box
Use the Change Series Title dialog box to change the title of a selected series. Type the new series title, then click OK to apply the new name or Cancel to close the dialog box without making a change.
To access the Change Series title dialog box, click Chart Settings in the Graph dialog box, then click the Series tab, then the Title button.
Chart Tools Gallery Dialog Box
Use the Chart Tools Gallery dialog box to add tools to your graph. For more informa-tion, see “Chart Options Dialog Box - Tools Tab” on page 10-555.
Click one of the following links to learn more about the Chart Tools Gallery dialog box:
• “Chart Tools Gallery Dialog Box - Series Tab”
• “Chart Tools Gallery Dialog Box - Axis Tab”
• “Chart Tools Gallery Dialog Box - Other Tab”
Chart Tools Gallery Dialog Box - Series Tab
Use the Series tab to add tools related to the series in your chart. The Series tab contains the following tools:
Cursor
Displays a draggable cursor line on top of the series. After you have added the Cursor tool to your graph, you can modify the following settings:
Series Lets you select the series to which you want to apply the tool.
Style Lets you select a horizontal line, vertical line, or both as the format of the tool.
Snap Causes the cursor tool to adhere to the selected series.
Follow Mouse Causes the cursor tool to follow your movements of the mouse.
10-566 Bentley SewerCAD V8i User’s Guide
Presenting Your Results
Drag Marks
Lets you drag series marks. To use this tool, you must display the marks for a selected series, see “Marks Tab”. After you have added the Drag Marks tool to your graph, you can modify the following settings:
Drag Point
Lets you drag a series point. After you have added the Drag Point tool to your graph, you can modify the following settings:
Draw Line
Lets you draw a line on the graph by dragging. After you have added the Draw Line tool to your graph, you can modify the following settings:
Pen Lets you define the cursor tool. The Border Editor opens, see “Border Editor Dialog Box”.
Series Lets you select the series to which you want to apply the tool.
Reset Positions Moves any marks you have dragged back to their original position.
Series Lets you select the series to which you want to apply the tool.
Style Lets you constrain the movement of the series point to one axis or both (no constraint).
Mouse Button Lets you select the mouse button you click to drag.
Cursor Lets you select the appearance of the cursor when using the tool.
Series Lets you select the series to which you want to apply the tool.
Pen Lets you define the line. The Border Editor opens, see “Border Editor Dialog Box”.
Button Lets you select the mouse button you click to drag.
Bentley SewerCAD V8i User’s Guide 10-567
Chart Options Dialog Box
Gantt Drag
Lets you move and resize Gantt bars by dragging. This is unused by Bentley SewerCAD V8i.
Image
Displays a picture using the selected series axes as boundaries. After you have added the Image tool to your graph, you can modify the following settings:
Enable Draw Enables the Draw Line tool. Select this check box to let you draw lines, clear it to prevent you from drawing lines.
Enable Select Lets you select and move lines that you have drawn. Select this check box, then click and drag the line you want to move. clear this check box if you want to prevent lines from being moved.
Remove All Removes all lines you have drawn.
Series Lets you select the series to which you want to apply the tool.
Browse Lets you navigate to and select the image you want to use. Browse is unavailable when there is a selected image. To select a new image, first clear the existing one.
Clear Lets you remove a selected image. Clear is unavailable when there is no selected image.
Mode Lets you set up the image you select.
• Normal—Puts the background image in the top-left corner of the graph.
• Stretch—Resizes the background image to fill the entire background of the graph. The image you select conforms to the series to which you apply it.
• Center—Puts the background image in the horizontal and vertical center of the graph.
• Tile—Repeats the background image as many times as needed to fill the entire back-ground of the graph.
10-568 Bentley SewerCAD V8i User’s Guide
Presenting Your Results
Mark Tips
Displays data in tooltips when you move the cursor over the graph. After you have added the Mark Tips tool to your graph, you can modify the following settings:
Nearest Point
Lets you define and display an indicator when you are near a point in the selected series. After you have added the Nearest Point tool to your graph, you can modify the following settings:
Pie Slices
Outlines or expands slices of pie charts when you move the cursor or click them. This is unused by Bentley SewerCAD V8i.
Series Lets you select the series to which you want to apply the tool
Style Lets you select what data the tooltips display.
Action Sets when the tooltips display. Select Click if you want the tooltips to display when you click, or select Move if you want the tooltips to display when you move the mouse.
Delay Lets you delay how quickly the tooltip displays.
Series Lets you select the series to which you want to apply the tool.
Fill Lets you set the fill for the nearest-point indicator. The Hatch Brush Editor opens, see “Hatch Brush Editor Dialog Box”.
Border Lets you set the outline of the nearest-point indicator. The Border Editor opens, see “Border Editor Dialog Box”.
Draw Line Creates a line from the tip of the cursor to the series point.
Style Sets the shape for the indicator
Size Sizes the indicator.
Bentley SewerCAD V8i User’s Guide 10-569
Chart Options Dialog Box
Series Animation
Animates series points. After you have added the Series Animation tool to your graph, you can modify the following settings:xxxx seems broken.
Chart Tools Gallery Dialog Box - Axis Tab
Use the Axis tab to add tools related to the axes in your chart. The Axis tab contains the following tools:
Axis Arrows
Lets you add arrows to the axes. The arrows permit you to scroll along the axes. After you have added the Axis Arrows tool to your graph, you can modify the following settings:
Series Lets you select the series to which you want to apply the tool.
Steps Lets you select the steps used in the animation. Set this control towards 100 for smoother animation and away from 100 for quicker, but less smooth animation.
Start at min. value Lets you start the animation at the series’ minimum value. clear this check box to set your own start value.
Start value Sets the value at which the animation starts. To use this control, you must clear Start at min. value.
Execute! Starts the animation.
Axis Select the axis to which you want to add arrows.
Border Lets you set the outline of the arrows. The Border Editor opens, see “Border Editor Dialog Box”.
Fill Lets you set the fill for the arrows. The Hatch Brush Editor opens, see “Hatch Brush Editor Dialog Box”.
Length Lets you set the length of the arrows.
Inverted Scroll Lets you change the direction in which the arrows let you scroll.
10-570 Bentley SewerCAD V8i User’s Guide
Presenting Your Results
Color Band
Lets you apply a color band to your graph for a range of values you select from an axis. After you have added the Color Band tool to your graph, you can modify the following settings:
Scroll Changes the magnitude of the scroll. Set a smaller percentage to reduce the amount of scroll caused by one click of an axis arrow, or set a larger percentage to increase the amount of scroll caused by a click.
Position Lets you set an axis arrow at the start, end, or both positions of the axis.
Axis Select the axis that you want to use to define the range for the color band.
Border Lets you set the outline of the color band. The Border Editor opens, see “Border Editor Dialog Box”.
Pattern Lets you set the fill of the color band. The Hatch Brush Editor opens, see “Hatch Brush Editor Dialog Box”.
Gradient Lets you set a gradient for the color band. A gradient overrides any solid color fill you might have set. The Gradient Editor opens, see “Gradient Editor Dialog Box”.
Color Lets you set a solid color for the color band. The Color Editor opens, see “Color Editor Dialog Box”.
Start Value Sets where the color band begins. Specify a value on the selected axis.
End Value Sets where the color band ends. Specify a vale on the selected axis.
Transparency Lets you set transparency for your color, where 100 is completely transparent and 0 is completely opaque.
Bentley SewerCAD V8i User’s Guide 10-571
Chart Options Dialog Box
Color Line
Lets you apply a color line, or plane in three dimensions, at a point you set at a value on an axis. After you have added the Color Line tool to your graph, you can modify the following settings:
Draw Behind Lets you position the color band behind the graphs. If you clear this check box, the color band appears in front of your graphs and hides them, unless you have transparency set.
Axis Select the axis that you want to use to define the location for the line.
Border Lets you set the outline of the color line. The Border Editor opens, see “Border Editor Dialog Box”.
Value Sets where the color line is. Specify a value on the selected axis.
Allow Drag Lets you drag the line or lock the line in place. Select this check box if you want to permit dragging. clear this check box if you want the line to be fixed in one location.
Drag Repaint Lets you smooth the appearance of the line as you drag it.
No Limit Drag Lets you drag the line beyond the axes of the graph, or constrain the line to boundaries defined by those axes. Select this check box to permit unconstrained dragging.
Draw Behind Lets you position the color line behind the graphs. If you clear this check box, the color band appears in front of your graphs. This is more noticeable in 3D graphs.
Draw 3D Lets you display the line as a 2D image in a 3D chart. If you have a 3D chart (see “3D Tab”), clear this check box to display the line as a line rather than a plane.
10-572 Bentley SewerCAD V8i User’s Guide
Presenting Your Results
Chart Tools Gallery Dialog Box - Other Tab
Use the Other tab to add tools to your chart, including annotations. The Other tab contains the following tools:
3D Grid Transpose
Swaps the X and Z coordinates to rotate the series through 90 degrees. This is unused by Bentley SewerCAD V8i.
Annotation
Lets you add text to the chart. After you have added the Annotation tool to your graph, you can modify the following settings:
Options Tab
Text Lets you enter the text you want for your annotation.
Text alignment Sets the alignment of the text inside the annotation box.
Cursor Lets you set the style of the cursor when you move it over the annotation.
Position Tab
Auto Lets you select a standard annotation position.
Custom Lets you select a custom position for the annotation. Select this check box to override the Auto setting and enable the Left and Top controls.
Left/Top Lets you set a position from the Left and Top edges of the graph tab for the annotation.
Callout Tab
Border Lets you set up the leader line. The Border Editor opens, see “Border Editor Dialog Box”.
Pointer Lets you set up the arrow head (if any) used by the leader line. The Pointer dialog box opens, see “Pointer Dialog Box”.
Position Sets the position of the callout.
Bentley SewerCAD V8i User’s Guide 10-573
Chart Options Dialog Box
Distance Lets you set the distance between the leader line and the graph of the selected series.
Arrow head Lets you select the kind of arrow head you want to add to the leader line.
Size Lets you set the size of the arrow head.
Format Tab
Color Lets you set a color for the fill of the boxes. The Color Editor opens, see “Color Editor Dialog Box”.
Frame Lets you define the outline of the boxes. The Border Editor opens.
Pattern Lets you set a pattern for the fill of the boxes. The Hatch Brush Editor opens, see “Hatch Brush Editor Dialog Box”.
Round Frame Lets you round the corners of the boxes. Select this check box to round the corners of the shape.
Transparent Lets you set the fill of the boxes as transparent. If the shape is completely transparent, you cannot see it, so clear this check box if you cannot see a shape that you expect to see
Transparency Lets you set transparency for the boxes, where 100 is completely transparent and 0 is completely opaque.
Text Tab
Font Lets you set the font properties for text. This opens the Windows Font dialog box.
Color Lets you select the color for the text font. Double-click the colored square between Font and Fill to open the Color Editor dialog box.
Fill Lets you set a pattern for the text font. The Hatch Brush Editor opens.
10-574 Bentley SewerCAD V8i User’s Guide

Presenting Your Results
Shadow Lets you set a shadow for the text.
• Visible—Lets you display a shadow for the text. Select this check box to display the shadow.
• Size—Lets you set the location of the shadow. Use larger numbers to offset the shadow by a large amount.
• Color—Lets you set a color for the shadow. You might set this to gray but can set it to any other color. The Color Editor opens.
• Pattern—Lets you set a pattern for the shadow. The Hatch Brush Editor opens.
• Transparency—Lets you set transparency for your shadow, where 100 is completely trans-parent and 0 is completely opaque.
Gradient Tab
Format Format—Lets you set up the gradient’s properties.
• Visible—Sets whether a gradient displays or not. Select this check box to display a gradient you have set up, clear this check box to hide the gradient.
• Direction—Sets the direction of the gradient. Vertical causes the gradient to display from top to bottom, Horizontal displays a gradient from right to left, and Backward/Forward diag-onal display gradients from the left and right bottom corners to the opposite corner.
• Angle—Lets you customize the direction of the gradient beyond the Direction selections.
Bentley SewerCAD V8i User’s Guide 10-575
Chart Options Dialog Box
Colors Lets you set the colors used for your gradients. The Start, Middle, and End selections open the Color Editor, see “Color Editor Dialog Box”.
• Start—Lets you set the starting color for your gradient.
• Middle—Lets you select a middle color for your gradient. The Color Editor opens. Select the No Middle Color check box if you want a two-color gradient.
• End—Lets you select the final color for your gradient.
• Gamma Correction—Lets you control the brightness with which the background displays to your screen; select or clear this check box to change the brightness of the background on-screen. This does not affect printed output.
• Transparency—Lets you set transparency for your gradient, where 100 is completely trans-parent and 0 is completely opaque.
Options Lets you control the affect of the start and end colors on the gradient, the middle color is not used.
• Sigma—Lets you use the options controls. Select this check box to use the controls in the Options tab.
• Sigma Focus—Lets you set the location on the chart background of the gradient’s end color.
• Sigma Scale—Lets you control how much of the gradient’s end color is used by the gradient background.
Shadow Tab
Visible Lets you display a shadow. Select this check box to display the shadow, clear this check box to turn off the shadow effect.
Size Set the size of the shadow by increasing or decreasing the numbers for Horizontal and/or Vertical Size.
10-576 Bentley SewerCAD V8i User’s Guide
Presenting Your Results
Page Number
Lets you add a page number annotation. For more information, see “Annotation”.
Rotate
Lets you rotate the chart by dragging. After you have added the Rotate tool to your graph, you can modify the following settings:
Color Lets you set a color for the shadow. You might set this to gray but can set it to any other color. The Color Editor opens.
Pattern Lets you set a pattern for the shadow. The Hatch Brush Editor opens.
Transparency Lets you set transparency for your shadow, where 100 is completely transparent and 0 is completely opaque.
Bevels Tab
Bevel Outer Lets you set a raised or lowered bevel effect, or no bevel effect, for the outside of the legend.
Color Lets you set the color for the bevel effect that you use; inner and outer bevels can use different color values.
Bevel Inner Lets you set a raised or lowered bevel effect, or no bevel effect, for the inside of the legend.
Size Lets you set a thickness for the bevel effect that you use; inner and outer bevels use the same size value.
Inverted Reverses the direction of the rotation with respect to the direction you move the mouse.
Style Lets you rotate horizontally, vertically, or both. Rotation is horizontal rotation about a vertical axis, whereas elevation is vertical rotation about a horizontal axis.
Outline Lets you set the outline. The Border Editor opens, see “Border Editor Dialog Box”.
Bentley SewerCAD V8i User’s Guide 10-577
Chart Options Dialog Box
TeeChart Gallery Dialog Box
Use the TeeChart Gallery dialog box to change the appearance of a series.
Series
The available series chart designs include:
• Standard
• Stats
• Financial
• Extended
• 3D
• Other
• View 3D—Lets you view the chart design in two or three dimensions. Select this check box to view the charts in 3D, clear it to view them in 2D.
• Smooth—Smooths the display of the charts. Select this check box to smooth the display, clear it to turn off smoothing.
Functions
The available function chart designs include:
• Standard
• Financial
• Stats
• Extended
• View 3D—Lets you view the chart design in two or three dimensions. Select this check box to view the charts in 3D, clear it to view them in 2D.
• Smooth—Smooths the display of the charts. Select this check box to smooth the display, clear it to turn off smoothing.
Customizing a Graph
• 850_GraphDemo_DecimalPlaces_009.bmp
• 850_GraphDemo_Annotation_012.bmp
• 850_GraphDemo_RainVOutflow_014.bmp
• 850_GraphDemo_RainVOutflow_015.bmp
10-578 Bentley SewerCAD V8i User’s Guide
Presenting Your Results
• 850_GraphDemo_RainVOutflow_016.bmp
To customize a graph:
1. If you do not have your own model, open Sample-1.swc, one of the sample models that is included with Bentley SewerCAD V8i.
2. Create a graph.
a. Click Compute.
b. Close the Calculation Executive Summary.
c. Save your model.
d. Right click an element, in Sample-1.swc, shift+click CO-11, CO-3, and CO-7 to select them, then right-click one of them and select Graph.
e. Click Save in the Graph dialog box, to add the graph to the Graph manager.
3. Move the legend.
a. Click Chart Settings, to open the Chart Options dialog box.
b. Click the Chart button, Legend tab, and Position subtab.
c. Click the Right button in the Position area to set the legend to the right side of the graph. You can use other controls on this subtab to move the legend.
Bentley SewerCAD V8i User’s Guide 10-579
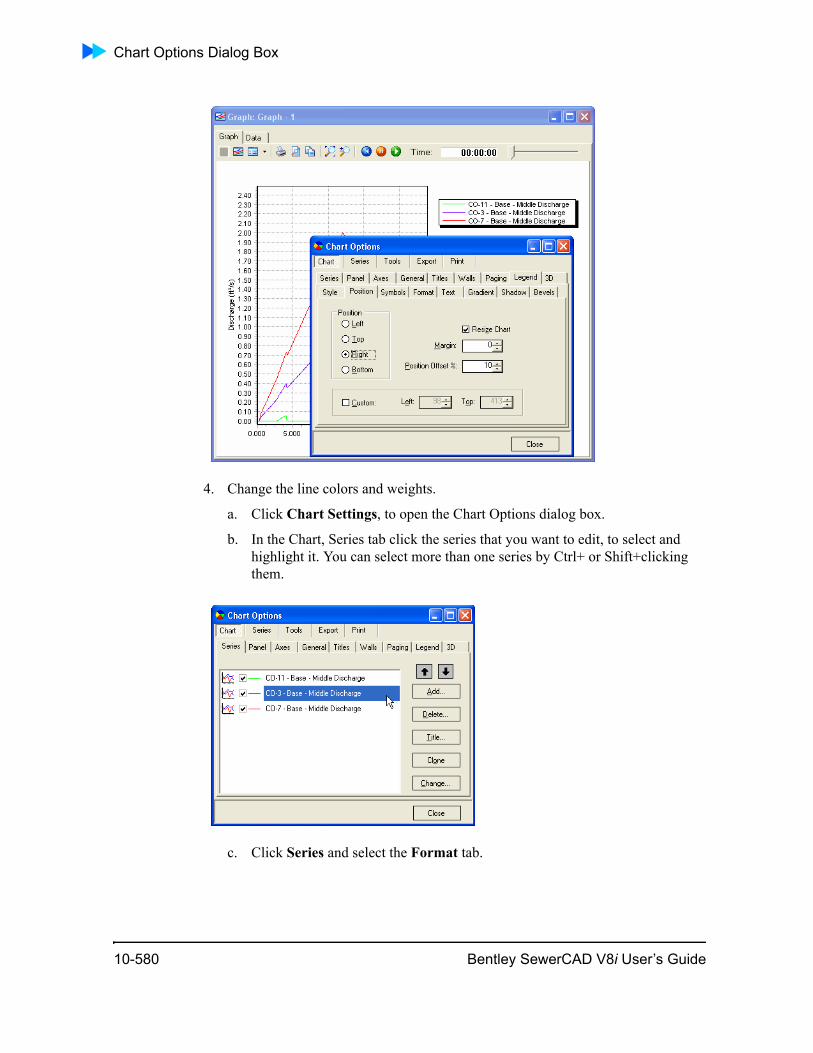
Chart Options Dialog Box
4. Change the line colors and weights.
a. Click Chart Settings, to open the Chart Options dialog box.
b. In the Chart, Series tab click the series that you want to edit, to select and highlight it. You can select more than one series by Ctrl+ or Shift+clicking them.
c. Click Series and select the Format tab.
10-580 Bentley SewerCAD V8i User’s Guide
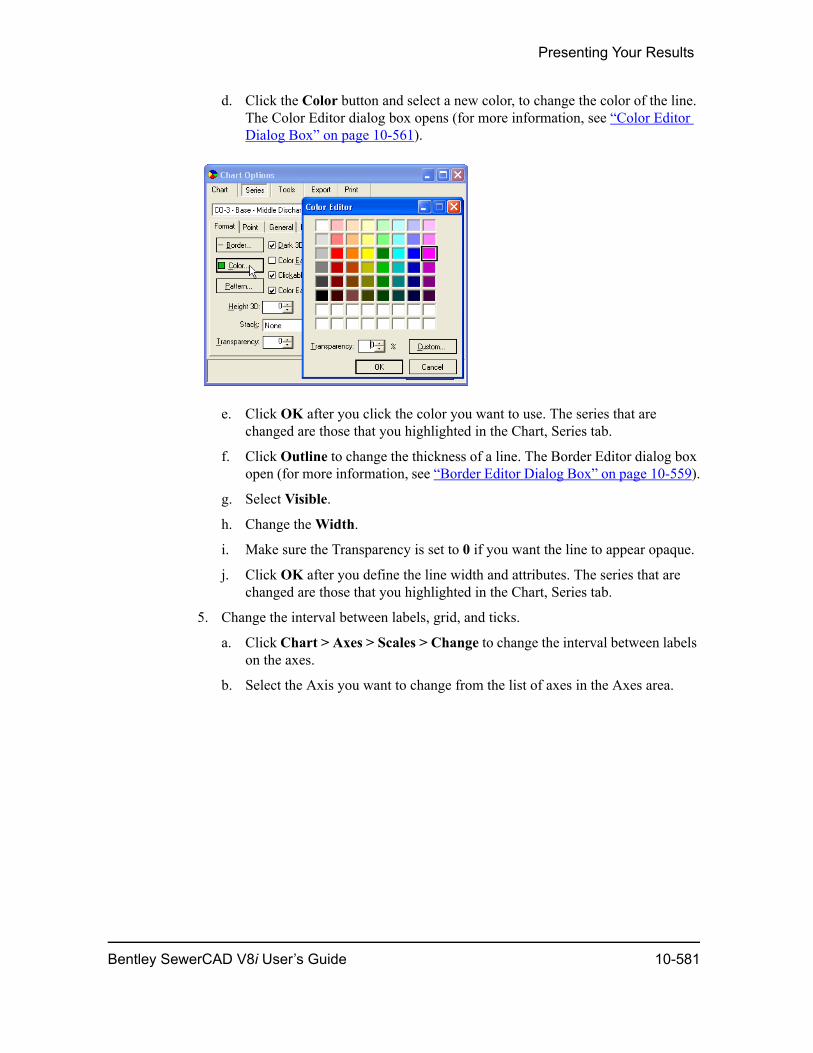
Presenting Your Results
d. Click the Color button and select a new color, to change the color of the line. The Color Editor dialog box opens (for more information, see “Color Editor Dialog Box” on page 10-561).
e. Click OK after you click the color you want to use. The series that are changed are those that you highlighted in the Chart, Series tab.
f. Click Outline to change the thickness of a line. The Border Editor dialog box open (for more information, see “Border Editor Dialog Box” on page 10-559).
g. Select Visible.
h. Change the Width.
i. Make sure the Transparency is set to 0 if you want the line to appear opaque.
j. Click OK after you define the line width and attributes. The series that are changed are those that you highlighted in the Chart, Series tab.
5. Change the interval between labels, grid, and ticks.
a. Click Chart > Axes > Scales > Change to change the interval between labels on the axes.
b. Select the Axis you want to change from the list of axes in the Axes area.
Bentley SewerCAD V8i User’s Guide 10-581
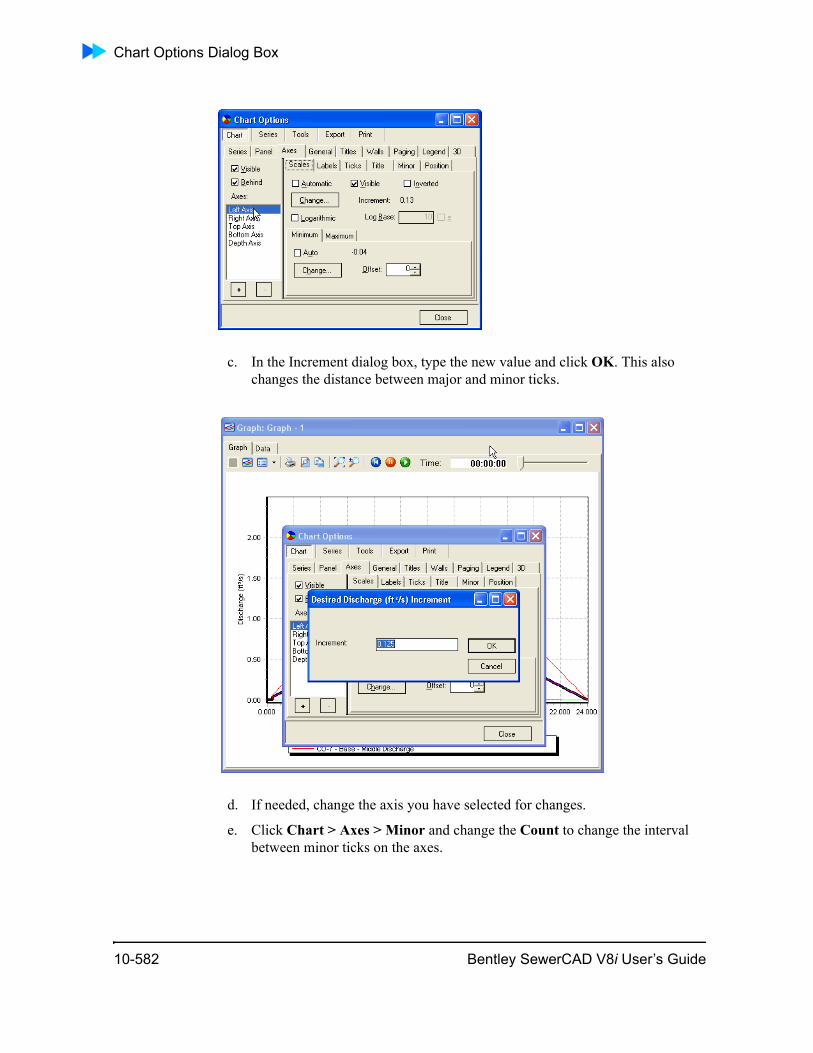
Chart Options Dialog Box
c. In the Increment dialog box, type the new value and click OK. This also changes the distance between major and minor ticks.
d. If needed, change the axis you have selected for changes.
e. Click Chart > Axes > Minor and change the Count to change the interval between minor ticks on the axes.
10-582 Bentley SewerCAD V8i User’s Guide
Presenting Your Results
6. You can show and hide a grid associated with the major ticks.
a. Click Chart > Axes > Ticks and click Grid.
b. Select the axis on which you want to change the grid.
c. In the Border Editor dialog box, select or clear Visible to show or hide the grid. (For more information, see “Border Editor Dialog Box” on page 10-559.)
7. You can show and hide a grid associated with the minor ticks.
a. Click Chart > Axes > Minor and click Grid.
b. Select the axis on which you want to change the grid.
c. In the Border Editor dialog box, select or clear Visible to show or hide the grid.
8. You can set the minimum and maximum range for an axis.
a. Click Chart > Axes > and select Scales.
b. Select the axis on which you want to change the grid.
c. Use the Minimum tab to change the minimum value for an axis. Clear the Auto check box.
d. Click Change.
e. Set the minimum value for the axis.
f. Use the Maximum tab to change the maximum value for an axis. Clear the Auto check box.
g. Click Change.
h. Set the maximum value for the axis.
Bentley SewerCAD V8i User’s Guide 10-583
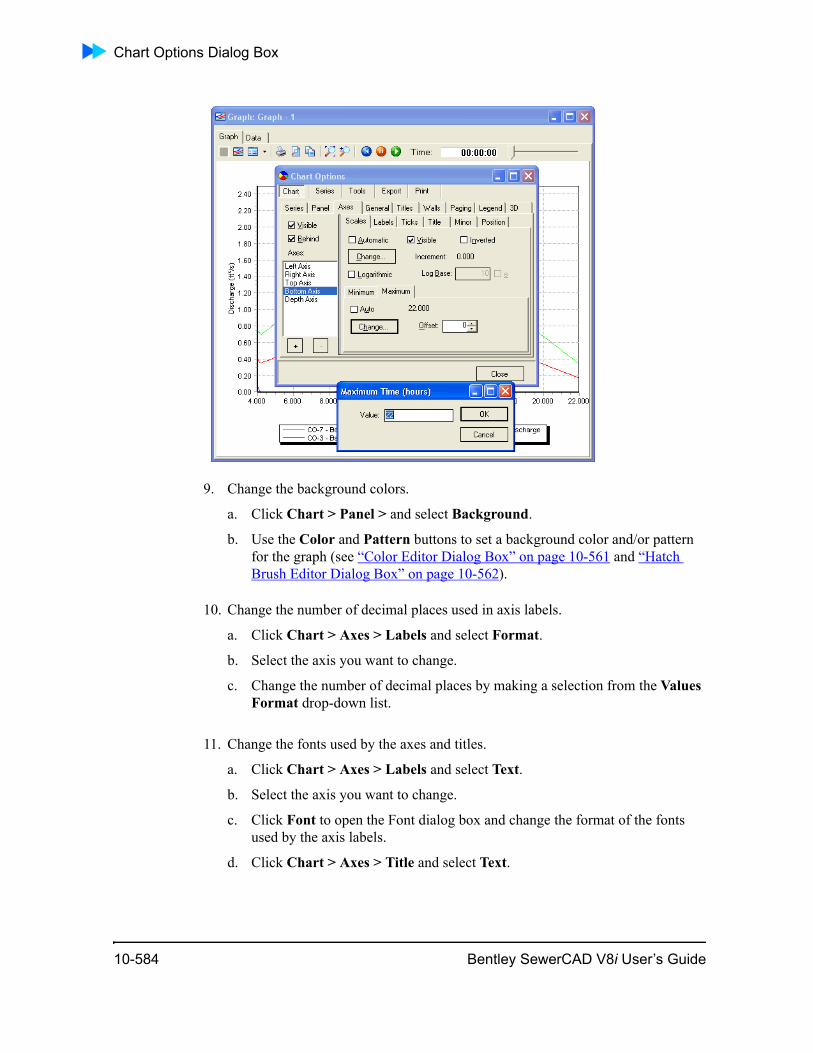
Chart Options Dialog Box
9. Change the background colors.
a. Click Chart > Panel > and select Background.
b. Use the Color and Pattern buttons to set a background color and/or pattern for the graph (see “Color Editor Dialog Box” on page 10-561 and “Hatch Brush Editor Dialog Box” on page 10-562).
10. Change the number of decimal places used in axis labels.
a. Click Chart > Axes > Labels and select Format.
b. Select the axis you want to change.
c. Change the number of decimal places by making a selection from the Values Format drop-down list.
11. Change the fonts used by the axes and titles.
a. Click Chart > Axes > Labels and select Text.
b. Select the axis you want to change.
c. Click Font to open the Font dialog box and change the format of the fonts used by the axis labels.
d. Click Chart > Axes > Title and select Text.
10-584 Bentley SewerCAD V8i User’s Guide
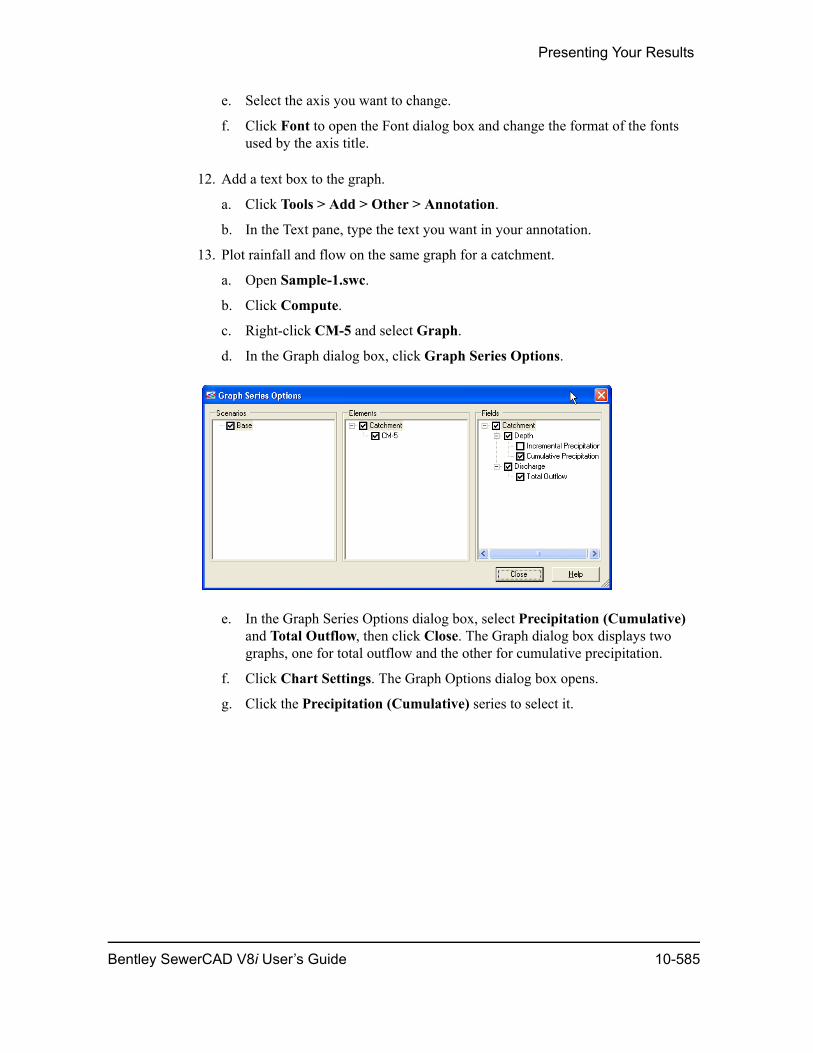
Presenting Your Results
e. Select the axis you want to change.
f. Click Font to open the Font dialog box and change the format of the fonts used by the axis title.
12. Add a text box to the graph.
a. Click Tools > Add > Other > Annotation.
b. In the Text pane, type the text you want in your annotation.
13. Plot rainfall and flow on the same graph for a catchment.
a. Open Sample-1.swc.
b. Click Compute.
c. Right-click CM-5 and select Graph.
d. In the Graph dialog box, click Graph Series Options.
e. In the Graph Series Options dialog box, select Precipitation (Cumulative) and Total Outflow, then click Close. The Graph dialog box displays two graphs, one for total outflow and the other for cumulative precipitation.
f. Click Chart Settings. The Graph Options dialog box opens.
g. Click the Precipitation (Cumulative) series to select it.
Bentley SewerCAD V8i User’s Guide 10-585
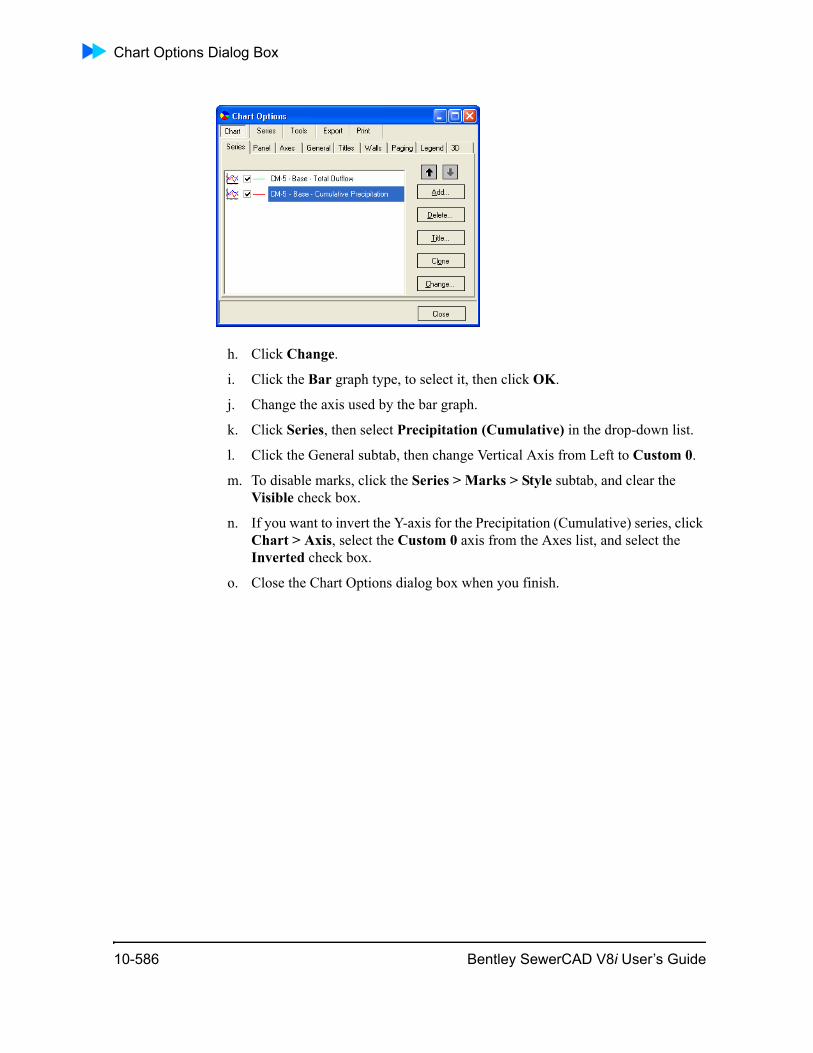
Chart Options Dialog Box
h. Click Change.
i. Click the Bar graph type, to select it, then click OK.
j. Change the axis used by the bar graph.
k. Click Series, then select Precipitation (Cumulative) in the drop-down list.
l. Click the General subtab, then change Vertical Axis from Left to Custom 0.
m. To disable marks, click the Series > Marks > Style subtab, and clear the Visible check box.
n. If you want to invert the Y-axis for the Precipitation (Cumulative) series, click Chart > Axis, select the Custom 0 axis from the Axes list, and select the Inverted check box.
o. Close the Chart Options dialog box when you finish.
10-586 Bentley SewerCAD V8i User’s Guide
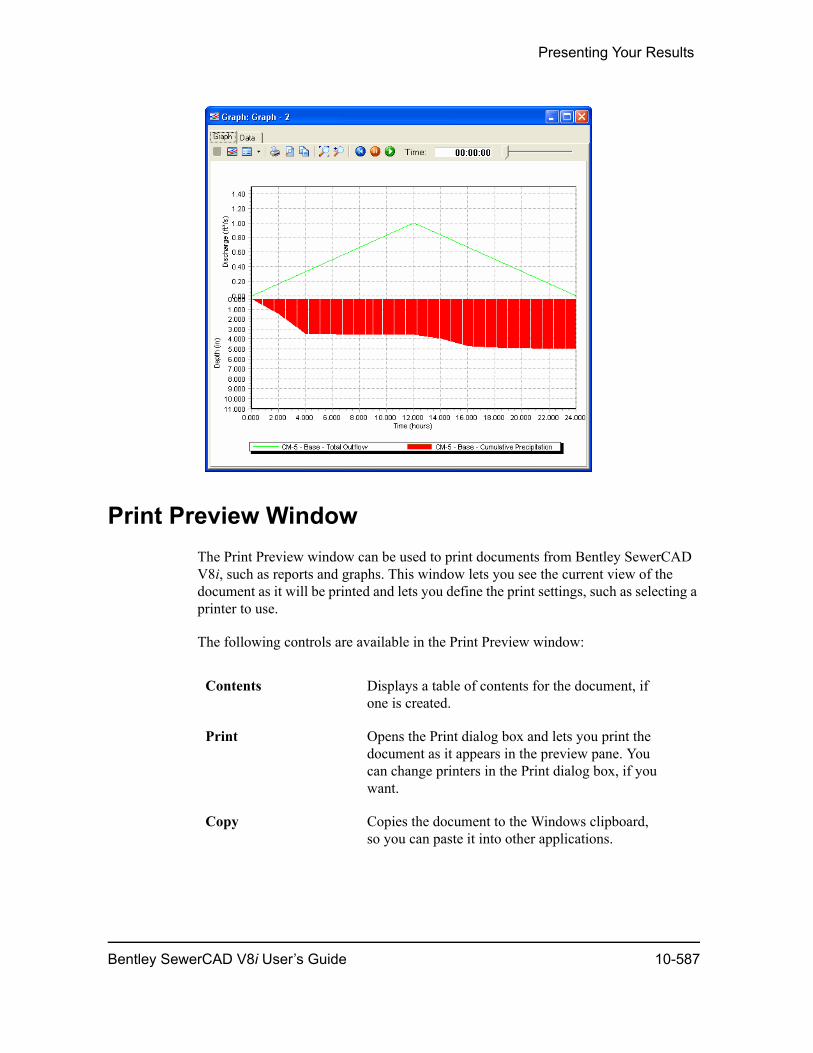
Presenting Your Results
Print Preview WindowThe Print Preview window can be used to print documents from Bentley SewerCAD V8i, such as reports and graphs. This window lets you see the current view of the document as it will be printed and lets you define the print settings, such as selecting a printer to use.
The following controls are available in the Print Preview window:
Contents Displays a table of contents for the document, if one is created.
Print Opens the Print dialog box and lets you print the document as it appears in the preview pane. You can change printers in the Print dialog box, if you want.
Copy Copies the document to the Windows clipboard, so you can paste it into other applications.
Bentley SewerCAD V8i User’s Guide 10-587
Contours
ContoursUsing SewerCAD V8i you can visually display calculated results for many attributes using contour plots.
The Contours dialog box is where all of the contour definitions associated with a project are stored. Choose View > Contours to open the Contours dialog box.
Find Lets you search for words in the document. To find a word, click Find, in the Find dialog box, type the word you want to find, then click Find Next. Words that are found are highlighted in the print preview; click Find Next to continue searching the document.
Single/Multiple Page View
Displays the document as a single page or multiple pages in the preview pane.
Zoom In/Out Enlarges or reduces the display of the document in the print preview.
Note: Changing the zoom only affects how the document displays on-screen, it does not affect how the document prints.
Zoom Combo Lets you select or type the amount of zoom used to display the document, where 100% is full size.
Previous Page Displays to the previous page in the document.
Next Page Displays the next page in the document.
Page Displays the current page number and the total pages in the current chart. You can type the page number you want to display, and press Enter to display it.
Backward/Forward Displays the page that was previously displayed. Backward and Forward are based on your navigation in the document and not on the page order of the document. For example, if you navigated from page 2 directly to page 6, clicking Backward would display page 2 again; if you then clicked Forward, page 6 would display again.
10-588 Bentley SewerCAD V8i User’s Guide
Presenting Your Results
The dialog box contains a list pane that displays all of the contours currently contained within the project, along with a toolbar.
New Opens the Contour Definition dialog box, allowing you to create a new contour.
Delete Deletes the currently selected contour.
Rename Renames the currently selected contour.
Edit Opens the Contour Definition dialog box, where you can modify the settings of the currently selected contour.
Export Clicking this button opens a submenu containing the following commands:• Export to Shapefile - Exports the
contour to a shapefile, opening the Export to File Manager to select the shapefile.
• Export to DXF - Exports the contour as a .dxf drawing.
• Export to Native Format - Opens the Shapefile Properties dialog box, allowing you to add it to the Background Layers Manager.
View Contour Browser
Opens the Contour Browser dialog, allowing you to display detailed contour results for points in the drawing view.
Refresh Regenerates the contour.
Shift Up Moves the currently selected contour up in the list pane.
Shift Down
Moves the currently selected contour down in the list pane.
Help Displays online help for the Contours.
Bentley SewerCAD V8i User’s Guide 10-589
Contours
Contour Definition
The Contour Definition dialog box contains the information required to generate contours for a calculated network.
Contour
Field Select the attribute to apply the contour.
Selection Set Apply an attribute to a previously defined selection set or to one of the following predefined options:• All Elements - Calculates the contour based
on all elements in the model, including spot elevations.
• All Elements Without Spots - Calculates the contour based on all elements in the model, except for spot elevations.
Minimum Lowest value to be included in the contour map. It may be desirable to use a minimum that is above the absolute minimum value in the system to avoid creating excessive lines near a pump or other high-differential portions of the system.
Maximum Highest value for which contours will be generated.
Increment Step by which the contours increase. The contours created will be evenly divisible by the increment and are not directly related to the minimum and maximum values. For example, a contour set with 10 minimum, 20 maximum, and an increment of 3 would result in the following set: [ 12, 15, 18 ] not [ 10, 13, 16, 19 ].
Index Increment Value for which contours will be highlighted and labeled. The index increment should be an even multiple of the standard increment.
Smooth Contours The Contour Smoothing option displays the results of a contour map specification as smooth, curved contours.
10-590 Bentley SewerCAD V8i User’s Guide
Presenting Your Results
Contour Plot
The Contour Plot window displays the results of a contour map specification as accu-rate, straight-line contours.
View the changes in the mapped attribute over time by using the animation feature. Choose Analysis > EPS Results Browser and click the Play button to automatically advance through the time step increments selected in the Increment bar.
The plot can be printed or exported as a .DXF file. Choose File > Export > DXF to export the plot.
Line Weight The thickness of contour lines in the drawing view.
Color by Range Contours are colored based on attribute ranges. Use the Initialize button to create five evenly spaced ranges and associated colors.
Initialize—This button, located to the right of the Contour section, will initialize the Minimum, Maximum, Increment, and Index Increment values based on the actual values observed for the elements in the selection set.
Tip: Initialization can be accomplished by clicking the Initialize button to automatically generate values for the minimum, maximum, increment, and index increment to create an evenly spaced contour set.
Ramp—Automatically generate a gradient range between two colors that you specify. Pick the color for the first and last values in the list and the program will select colors for the other values.
Color by Index The standard contours and index contours have separately controlled colors that you can make the contours more apparent.
Bentley SewerCAD V8i User’s Guide 10-591
Using Named Views
Tip: Although the straight-line contours generated by this program are accurate, smooth contours are often more desirable for presentation purposes. You can smooth the contours by clicking Options and selecting Smooth Contours.
Note: Contour line index labels can be manually repositioned in this view before sending the plot to the printer. The Contour Plot Status pane displays the Z coordinate at the mouse cursor.
Contour Browser Dialog Box
The Contour Browser dialog box displays the X and Y coordinates and the calculated value for the contour attribute at the location of the mouse cursor in the drawing view.
Enhanced Pressure Contours
Normal contouring routines only include model nodes, such as junctions, tanks and reservoirs. When spot elevations are added to the drawing, however, you can create more detailed elevation contours and enhanced pressure contours.
These enhanced contours include not only the model nodes but also the interpolated and calculated results for the spot elevations. Enhanced pressure contours can help the modeler to understand the behavior of the system even in areas that have not been included directly in the model.
Using Named ViewsThe Named View dialog box is where you can store the current views X and Y coordi-nates. When you set a view in the drawing pane and add a named view, the current view is saved as the named view. You can then center the drawing pane on the named view with the Go To View command.
Choose View > Named Views to open the Named View dialog box.
10-592 Bentley SewerCAD V8i User’s Guide
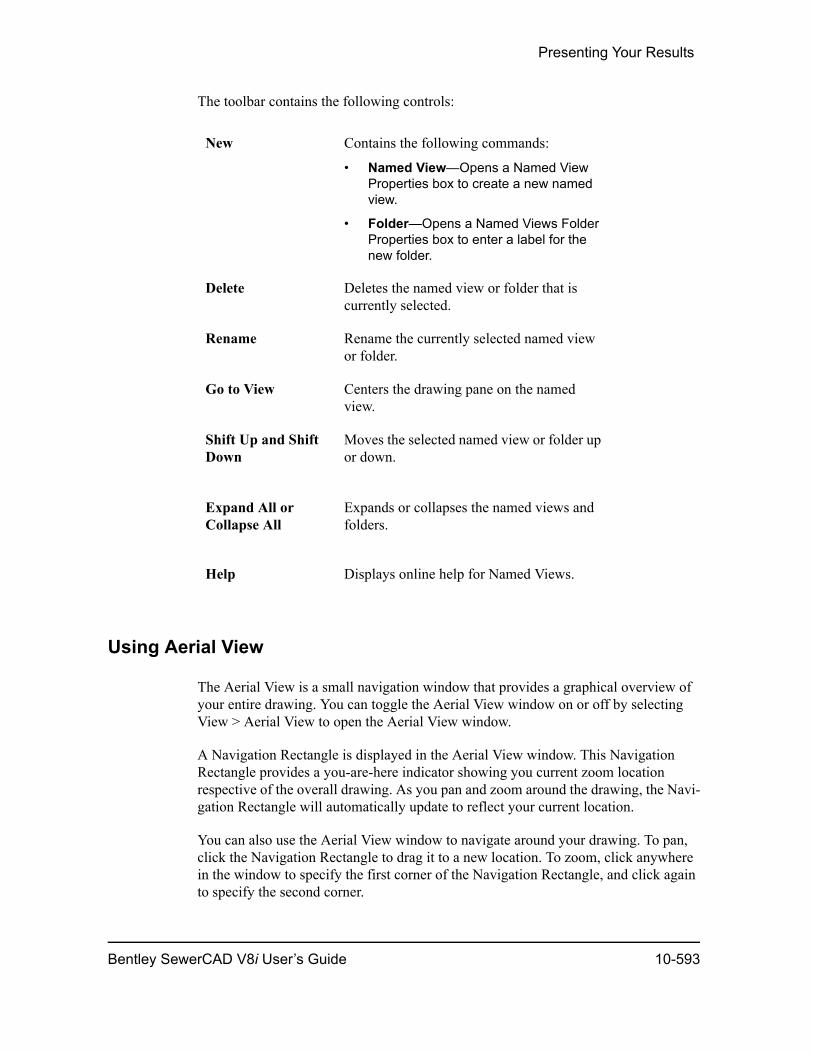
Presenting Your Results
The toolbar contains the following controls:
Using Aerial View
The Aerial View is a small navigation window that provides a graphical overview of your entire drawing. You can toggle the Aerial View window on or off by selecting View > Aerial View to open the Aerial View window.
A Navigation Rectangle is displayed in the Aerial View window. This Navigation Rectangle provides a you-are-here indicator showing you current zoom location respective of the overall drawing. As you pan and zoom around the drawing, the Navi-gation Rectangle will automatically update to reflect your current location.
You can also use the Aerial View window to navigate around your drawing. To pan, click the Navigation Rectangle to drag it to a new location. To zoom, click anywhere in the window to specify the first corner of the Navigation Rectangle, and click again to specify the second corner.
New Contains the following commands:
• Named View—Opens a Named View Properties box to create a new named view.
• Folder—Opens a Named Views Folder Properties box to enter a label for the new folder.
Delete Deletes the named view or folder that is currently selected.
Rename Rename the currently selected named view or folder.
Go to View Centers the drawing pane on the named view.
Shift Up and Shift Down
Moves the selected named view or folder up or down.
Expand All or Collapse All
Expands or collapses the named views and folders.
Help Displays online help for Named Views.
Bentley SewerCAD V8i User’s Guide 10-593
Time Series Field Data
In AutoCAD mode, see the AutoCAD online help for a detailed explanation.
In Stand-Alone mode, with Aerial View window enabled (by selecting the View > Aerial View), click and drag to draw a rectangular view box in the aerial view. The area inside this view box is displayed in the main drawing window. Alternately, any zooming or panning action performed directly in the main window updates the size and location of the view box in the Aerial View window.
The Aerial View window contains the following buttons:
Zoom Extents—Display the entire drawing in the Aerial View window.
Zoom In—Decrease the area displayed in the Aerial View window.
Zoom Out—Increase the area displayed in the Aerial View window.
Help—Opens the online help.
To resize the view box directly from the Aerial View window, click to define the new rectangular view box. To change the location of the view box, hover the mouse cursor over the current view rectangle and click to drag the view box frame to a new location.
Time Series Field DataThe Time Series Field Data dialog allows you to enter your observed field data and compare it to the calculated results from the model in graph format. This is especially useful in comparing time series data for model calibration.
10-594 Bentley SewerCAD V8i User’s Guide
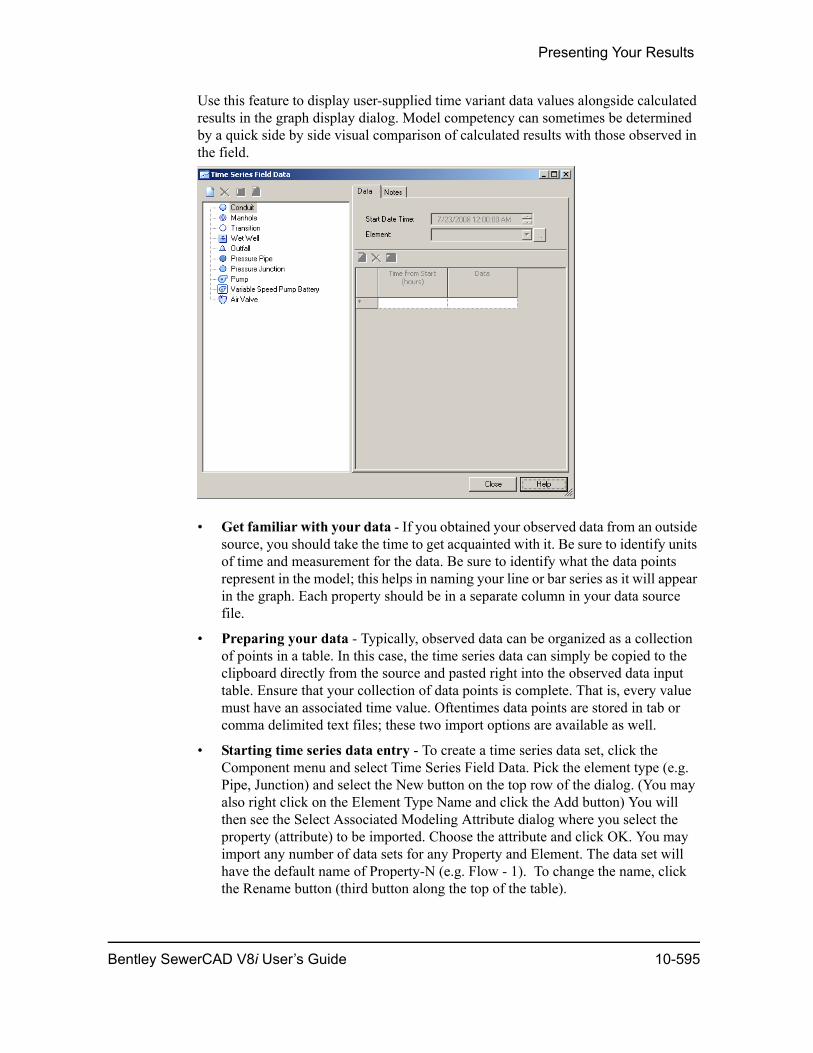
Presenting Your Results
Use this feature to display user-supplied time variant data values alongside calculated results in the graph display dialog. Model competency can sometimes be determined by a quick side by side visual comparison of calculated results with those observed in the field.
• Get familiar with your data - If you obtained your observed data from an outside source, you should take the time to get acquainted with it. Be sure to identify units of time and measurement for the data. Be sure to identify what the data points represent in the model; this helps in naming your line or bar series as it will appear in the graph. Each property should be in a separate column in your data source file.
• Preparing your data - Typically, observed data can be organized as a collection of points in a table. In this case, the time series data can simply be copied to the clipboard directly from the source and pasted right into the observed data input table. Ensure that your collection of data points is complete. That is, every value must have an associated time value. Oftentimes data points are stored in tab or comma delimited text files; these two import options are available as well.
• Starting time series data entry - To create a time series data set, click the Component menu and select Time Series Field Data. Pick the element type (e.g. Pipe, Junction) and select the New button on the top row of the dialog. (You may also right click on the Element Type Name and click the Add button) You will then see the Select Associated Modeling Attribute dialog where you select the property (attribute) to be imported. Choose the attribute and click OK. You may import any number of data sets for any Property and Element. The data set will have the default name of Property-N (e.g. Flow - 1). To change the name, click the Rename button (third button along the top of the table).
Bentley SewerCAD V8i User’s Guide 10-595
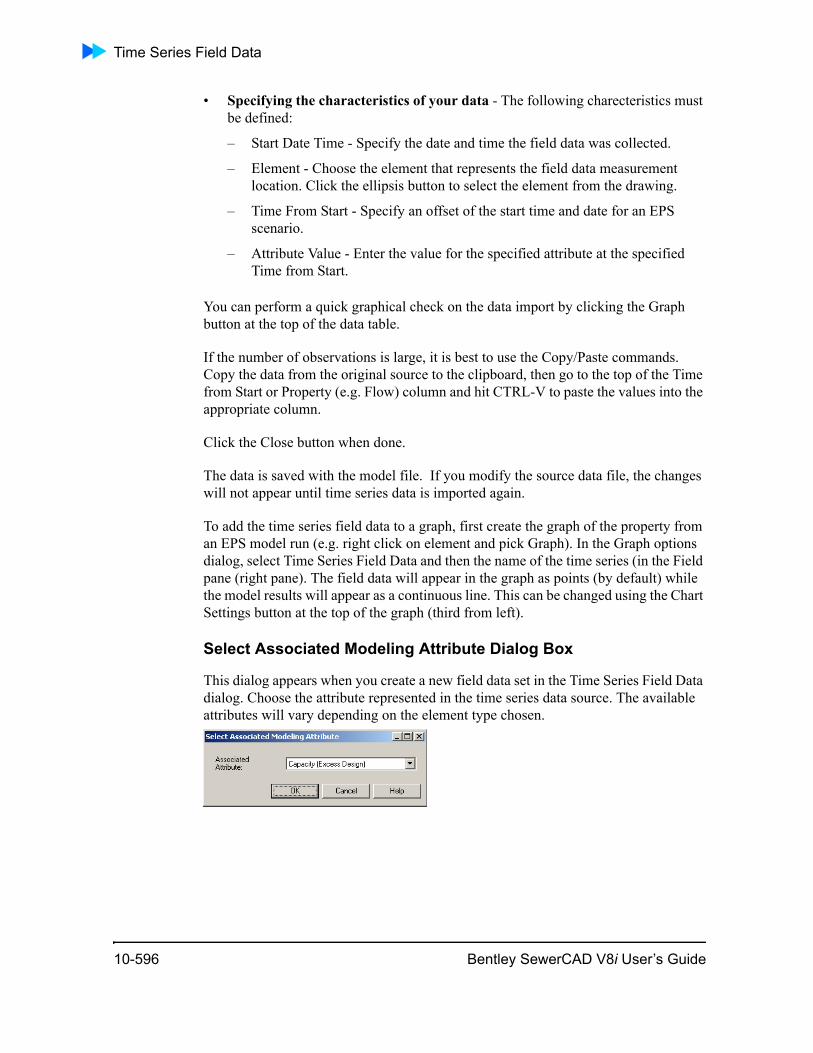
Time Series Field Data
• Specifying the characteristics of your data - The following charecteristics must be defined:
– Start Date Time - Specify the date and time the field data was collected.
– Element - Choose the element that represents the field data measurement location. Click the ellipsis button to select the element from the drawing.
– Time From Start - Specify an offset of the start time and date for an EPS scenario.
– Attribute Value - Enter the value for the specified attribute at the specified Time from Start.
You can perform a quick graphical check on the data import by clicking the Graph button at the top of the data table.
If the number of observations is large, it is best to use the Copy/Paste commands. Copy the data from the original source to the clipboard, then go to the top of the Time from Start or Property (e.g. Flow) column and hit CTRL-V to paste the values into the appropriate column.
Click the Close button when done.
The data is saved with the model file. If you modify the source data file, the changes will not appear until time series data is imported again.
To add the time series field data to a graph, first create the graph of the property from an EPS model run (e.g. right click on element and pick Graph). In the Graph options dialog, select Time Series Field Data and then the name of the time series (in the Field pane (right pane). The field data will appear in the graph as points (by default) while the model results will appear as a continuous line. This can be changed using the Chart Settings button at the top of the graph (third from left).
Select Associated Modeling Attribute Dialog Box
This dialog appears when you create a new field data set in the Time Series Field Data dialog. Choose the attribute represented in the time series data source. The available attributes will vary depending on the element type chosen.
10-596 Bentley SewerCAD V8i User’s Guide
11
ChapterFeatures of theMicroStation Version
Bentley SewerCAD V8i features support for MicroStation integration. You run Bentley SewerCAD V8i in both MicroStation and stand-alone mode.
The MicroStation functionality has been implemented in a way that is the same as the Bentley SewerCAD V8i base product. Once you become familiar with the stand-alone mode, you will not have any difficulty using the product in MicroStation mode.
In MicroStation mode, you will have access to the full range of functionality available in the MicroStation design and drafting environment. The standard environment is extended and enhanced by using MicroStation’s MDL (MicroStation Development Language) client layer that lets you create, view, and edit the native Bentley SewerCAD V8i network model while in MicroStation.
MDL is a complete development environment that lets applications take full advan-tage of the power of MicroStation and MicroStation-based vertical applications. MDL can be used to develop simple utilities, customized commands or sophisticated commercial applications for vertical markets.
Some of the advantages of working in MicroStation mode include:
• Lay out network links and structures in fully-scaled mode in the same design and drafting environment that you use to develop your engineering plans.
• You will have access to any other third party applications that you currently use, along with any custom MDL applications.
• Use native MicroStation insertion snaps to precisely position Bentley SewerCAD V8i elements with respect to other entities in the MicroStation drawing.
• Use native MicroStation commands on Bentley SewerCAD V8i model entities with automatic update and synchronization with the model database.
• Control destination levels for model elements and associated label text and anno-tation, giving you control over styles, line types, and visibility of model elements.
Note: Bentley SewerCAD V8i supports MicroStation version 8.11 only.
Additional features of the MicroStation version includes:
Bentley SewerCAD V8i User’s Guide 11-597
MicroStation Environment
• “MicroStation Environment” on page 11-598
• “MicroStation Project Files” on page 11-599
• “Bentley SewerCAD V8i Element Properties” on page 11-599
• “Working with Elements” on page 11-601
• “MicroStation Commands” on page 11-603
• “Undo/Redo” on page 11-604
• “Special Considerations” on page 11-605
MicroStation EnvironmentThe MicroStation environment includes:
• “MicroStation Mode Graphical Layout” on page 11-598
MicroStation Mode Graphical Layout
In MicroStation mode, our products provide a set of extended options and function-ality beyond those available in stand-alone mode. This additional functionality provides enhanced control over general application settings and options and extends the command set, giving you control over the display of model elements within MicroStation.
Key differences between MicroStation and stand-alone mode include:
• Full element symbol editing functionality is available through the use of custom cells. All elements and graphical decorations (flow arrows, control indicators, etc.) are contained within a SewerCAD V8i .cel file.
You can control the appearance and destination of all model elements using the Element Levels command under the View menu. For example, you can assign a specific level for all outlets, as well as assign the label and annotation text style to be applied.
11-598 Bentley SewerCAD V8i User’s Guide

Features of the MicroStation Version
Note: Any Microstation tool that deletes the target element (such as Trim and IntelliTrim) will also remove the connection of that element to SewerCAD V8i. After the SewerCAD V8i connection is removed, the element is no longer a valid link and will not show properties on the property grid.
MicroStation Project FilesWhen using Bentley SewerCAD V8i in MicroStation mode, there are three files that fundamentally define a Bentley SewerCAD V8i model project:
• Drawing File (.DGN)—The MicroStation drawing file contains the elements that define the model, in addition to the planimetric base drawing information that serves as the model background.
• Model File (.swc)—The model file contains model data specific to SewerCAD V8i, including project option settings, color-coding and annotation settings, etc. Note that the MicroStation .dgn that is associated with a particular model may not bave the same filename as the model’s .swc file.
• Database File (.MDB)—The model database file that contains all of the input and output data for the model. Note that the MicroStation .dgn that is associated with a particular model may not bave the same filename as the model’s .mdb file.
To send the model to another user, all three files are required.
It is important to understand that archiving the drawing file is not sufficient to repro-duce the model. You must also preserve the associated .swc and .MDB files.
Bentley SewerCAD V8i Element PropertiesBentley SewerCAD V8i element properties includes:
• “Element Properties” on page 11-600
• “Levels” on page 11-600
• “Text Styles” on page 11-601
Bentley SewerCAD V8i User’s Guide 11-599
Bentley SewerCAD V8i Element Properties
Element Properties
When working in the MicroStation mode, this feature will display a dialog box containing fields for the currently selected element’s associated properties. To modify an attribute, click each associated grid cell.
You can also review or modify MicroStation drawing information about an element(s), such as its type, attributes, and geometry, by using the Element Informa-tion dialog. To access the Element Information dialog, click the Element Information button or click the Element menu and select the Information command.
RELATED TOPICS
• See “Levels” on page 600.
• See “Text Styles” on page 601.
Levels
To control display of elements in the selected levels, use the Level Display dialog box. To access the Level Display dialog, click the Settings menu and select the Level > Display command.
If you want to freeze elements in levels, select Global Freeze from the View Display menu in the Level Display dialog.
You can create new Levels in the Level Manager. To access the Level Manager, click the Settings menu and select the Level > Manager command.
To control the display of levels, use level filters. Within MicroStation, you can also create, edit, and save layer filters to DWG files in the Level Manager. To access the Level Manager, click the Settings menu and select the Level > Manager command. Layer filters are loaded when a DWG file is opened, and changes are written back when the file is saved. To create and edit Level Filters,
RELATED TOPICS
• See “Bentley SewerCAD V8i Element Properties” on page 599.
11-600 Bentley SewerCAD V8i User’s Guide
Features of the MicroStation Version
Element Levels Dialog
This dialog allows you to assign newly created elements and their associated annota-tions to specific MicroStation levels.
To assign a level, use the pulldown menu next to an element type (under the Element Level column heading) to choose the desired level for that element. You can choose a seperate level for each element and for each element’s associated annotation.
You cannot create new levels from this dialog; to create new levels use the MicroSta-tion Level Manager. To access the Level Manager, click the Settings menu and select the Level > Manager command.
Text Styles
You can view, edit, and create Text Style settings in MicroStation mode by clicking the Element menu and selecting the Text Styles command to open the Text Styles dialog.
RELATED TOPICS
• See “Bentley SewerCAD V8i Element Properties” on page 599.
Working with ElementsWorking with elements includes:
• “Edit Elements” on page 11-602
• “Deleting Elements” on page 11-602
• “Modifying Elements” on page 11-602
Edit Elements
Elements can be edited in one of two ways in MicroStation mode:
Element Properties Dialog: To access the Element Properties dialog, click the SewerCAD V8i View menu and select the Properties command.
FlexTables: To access the FlexTables dialog, click the SewerCAD V8i View menu and select the FlexTables command.
Bentley SewerCAD V8i User’s Guide 11-601
Working with Elements
Deleting Elements
In MicroStation mode, you can delete elements by clicking on them using the Delete Element tool, or by highlighting the element to be deleted and clicking your keyboard’s Delete key.
Note: Any Microstation tool that deletes the target element (such as Trim and IntelliTrim) will also remove the connection of that element to SewerCAD V8i. After the SewerCAD V8i connection is removed, the element is no longer a valid swc link and will not show properties on the property grid. Storm.
Modifying Elements
In MicroStation mode, these commands are selected from the shift-right-click shortcut menu (hold down the Shift key while right-clicking). They are used for scaling and rotating model entities.
Change Pipe Widths
In MicroStation mode, you can change the line width through the Element Informa-tion dialog. To access the Element Information dialog, click the Element menu and select the Information command. To change the width of a pipe, select it and open the Element Information dialog. Then change the value in the Weight pulldown menu
RELATED TOPICS
• See “Edit Elements” on page 602.
Edit Elements
In MicroStation mode, this menu command is used to open a spreadsheet FlexTable editor or a selection of one or more network figures. You are prompted to select figures on which to build a table.
RELATED TOPICS
• See “Change Pipe Widths” on page 602.
Working with Elements Using MicroStation Commands
Working with elements using MicroStation commands includes:
“Bentley SewerCAD V8i Custom MicroStation Entities” on page 11-603
11-602 Bentley SewerCAD V8i User’s Guide

Features of the MicroStation Version
“MicroStation Commands” on page 11-603
“Moving Elements” on page 11-603
“Moving Element Labels” on page 11-604
“Snap Menu” on page 11-604
Bentley SewerCAD V8i Custom MicroStation Entities
The primary MicroStation-based Bentley SewerCAD V8i element entities are all implemented using native MicroStation elements. These elements have feature link-ages to define them as SewerCAD V8i objects.
This means that you can perform standard MicroStation commands (see “MicroSta-tion Commands” on page 11-603) as you normally would, and the model database will be updated automatically to reflect these changes.
It also means that the model will enforce the integrity of the network topological state. Therefore, if you delete a nodal element such as a junction, its connecting pipes will also be deleted since their connecting nodes topologically define model pipes.
Using MDL technology ensures the database will be adjusted and maintained during Undo and Redo transactions.
See “MicroStation Mode Graphical Layout” on page 598.
MicroStation Commands
When running in MicroStation mode, Bentley Systems products make use of all the advantages that MicroStation has, such as plotting capabilities and snap features. Additionally, MicroStation commands can be used as you would with any design project. For example, our products’ elements and annotation can be manipulated using common MicroStation commands.
Moving Elements
When using MicroStation mode, the MicroStation commands Move, Scale, Rotate, Mirror, and Array can be used to move elements.
To move a node, execute the MicroStation command by either typing it at the command prompt or selecting it. Follow the MicroStation prompts, and the node and its associated label will move together. The connecting pipes will shrink or stretch depending on the new location of the node.
RELATED TOPICS
• See “MicroStation Commands” on page 603.
Bentley SewerCAD V8i User’s Guide 11-603
Undo/Redo
Moving Element Labels
When using MicroStation mode, the MicroStation commands Move, Scale, Rotate, Mirror, and Array can be used to move element text labels.
To move an element text label separately from the element, click the element label you wish to move. The grips will appear for the label. Execute the MicroStation command either by typing it at the command prompt, by selecting it from the tool palette, or by selecting it from the right-click menu. Follow the MicroStation prompt, and the label will be moved without the element.
RELATED TOPICS
• See “MicroStation Commands” on page 603.
Snap Menu
When using MicroStation mode, you can enable the Snaps button bar by clicking the Settings menu and selecting the Snaps > Button Bar command. See the MicroStation documentation for more information about using snaps.
Undo/RedoIf you use the native MicroStation undo, you are limited to a single redo level.
If you undo using the MicroStation undo/redo and you restore Bentley SewerCAD V8i elements that have been previously deleted, some model state attributes such as diameters or elevations may be lost, even though the locational and topological state is fully consistent. This will only happen in situations where the Bentley SewerCAD V8i command history has been deleted. In such cases, you will be warned to check your data carefully.
In MicroStation mode, you have two types of undo/redo available to you. From the Edit menu, you have access to Bentley SewerCAD V8i undo and redo. Alternatively, you can perform the native MicroStation undo and redo by typing at the MicroStation command line. The implementations of the two different operation types are quite distinct.
The menu-based undo and redo commands operate exclusively on Bentley SewerCAD V8i elements by invoking the commands directly on the model server. The main advantage of using the specialized command is that you will have unlimited undo and redo levels. This is an important difference, since in layout or editing it is quite useful to be able to safely undo and redo an arbitrary number of transactions.
11-604 Bentley SewerCAD V8i User’s Guide
Features of the MicroStation Version
Whenever you use a native MicroStation undo, the server model will be notified when any Bentley SewerCAD V8i entities are affected by the operation. Bentley SewerCAD V8i will then synchronize the model to the drawing state. Wherever possible, the model will seek to map the undo/redo onto the model server’s managed command history. If the drawing’s state is not consistent with any pending undo or redo transactions held by the server, Bentley SewerCAD V8i will delete the command history. In this case, the model will synchronize the drawing and server models.
Special ConsiderationsSpecial considerations include:
• “Import Bentley SewerCAD V8i” on page 11-605
• “Annotation Display” on page 11-605
• “Use SewerCAD V8i Z Order Command” on page 11-605
Import Bentley SewerCAD V8i
When running SewerCAD V8i in MicroStation mode, this command imports a selected SewerCAD V8i data (.swc) file for use in the current drawing. The new project file will now correspond to the drawing name, such as, CurrentDrawing-Name.swc. Whenever you save changes to the network model through SewerCAD V8i, the associated .swc data file is updated and can be loaded into SewerCAD V8i 4.0 or higher.
Warning! A SewerCAD V8i Project can only be imported to a new, empty MicroStation design model.
Annotation Display
Some fonts do not correctly display the full range of characters used by SewerCAD V8i’s annotation feature because of a limited character set. If you are having problems with certain characters displaying improperly or not at all, try using another font.
Use SewerCAD V8i Z Order Command
When this control is toggled on, SewerCAD V8i will parse the elements when the screen is redrawn. It takes significant time to do this parsing, so for larger models performance can be improved by toggling this control off
Bentley SewerCAD V8i User’s Guide 11-605

Special Considerations
11-606 Bentley SewerCAD V8i User’s Guide
12
ChapterWorking in AutoCADMode
Caution: If you previously installed Bentley ProjectWise and turned on AutoCAD integration, you must add the following key to your system registry using the Windows Registry Editor. Before you edit the registry, make a backup copy.
HKEY_LOCAL_MACHINE\SOFTWARE\Bentley\ProjectWise iDesktop Integration\XX.XX\Configuration\AutoCAD"
String value name: DoNotChangeCommands
Value: 'On'
To access the Registry Editor, click Start > Run, then type regedit. Using the Registry Editor incorrectly can cause serious, system-wide problems that may require you to re-install Windows to correct them. Always make a backup copy of the system registry before modifying it.
SewerCAD V8i features support for AutoCAD integration.
The AutoCAD functionality has been implemented in a way that is the same as the SewerCAD V8i base product. Once you become familiar with the stand-alone mode, you will not have any difficulty using the product in AutoCAD mode.
Some of the advantages of working in AutoCAD mode include:
• Layout network links and structures in fully-scaled mode in the same design and drafting environment that you use to develop your engineering plans. You will have access to any other third party applications that you currently use, along with any custom LISP, ARX, or VBA applications that you have developed.
• Use native AutoCAD insertion snaps to precisely position Bentley SewerCAD V8i elements with respect to other entities in the AutoCAD drawing.
Bentley SewerCAD V8i User’s Guide 12-607

The AutoCAD Workspace
• Use native AutoCAD commands such as ERASE, MOVE, and ROTATE on Bentley SewerCAD V8i model entities with automatic update and synchroniza-tion with the model database.
• Control destination layers for model elements and associated label text and anno-tation, giving you control over styles, line types, and visibility of model elements.
Note: Bentley SewerCAD V8i supports AutoCAD 2009 only.
• “Working with Elements Using AutoCAD Commands” on page 12-613
• “Undo/Redo” on page 12-615
• “Special Considerations” on page 12-616
The AutoCAD WorkspaceIn AutoCAD mode, you will have access to the full range of functionality available in the AutoCAD design and drafting environment. The standard environment is extended and enhanced by an AutoCAD ObjectARX Bentley SewerCAD V8i client layer that lets you create, view, and edit the native Bentley SewerCAD V8i network model while in AutoCAD.
Click one of the following links to learn more about Bentley SewerCAD V8i AutoCAD environment:
• “AutoCAD Integration with SewerCAD V8i” on page 12-608
• “AutoCAD Mode Graphical Layout” on page 12-609
• “Menus” on page 12-609
• “Toolbars” on page 12-609
• “Drawing Setup” on page 12-610
• “Symbol Visibility” on page 12-610
AutoCAD Integration with SewerCAD V8i
When you install SewerCAD V8i after you install AutoCAD, integration between the two is automatically configured.
If you install AutoCAD after you install SewerCAD V8i, you must manually integrate the two by selecting Start > All Programs > Bentley >SewerCAD V8i > Integrate SewerCAD V8i with AutoCAD-ArcGIS. The integration utility runs automatically. You can then run SewerCAD V8i in AutoCAD mode.
12-608 Bentley SewerCAD V8i User’s Guide

Working in AutoCAD Mode
The Integrate SewerCAD V8i with AutoCAD-ArcGIS command can also be used to fix problems with the AutoCAD configuration file. For example, if you have SewerCAD V8i installed on the same system as Bentley SewerCAD V8i and you uninstall or reinstall SewerCAD V8i, the AutoCAD configuration file becomes unus-able. To fix this problem, you can delete the configuration file then run the Integrate SewerCAD V8i with AutoCAD-ArcGIS command.
AutoCAD Mode Graphical Layout
In AutoCAD mode, our products provide a set of extended options and functionality beyond those available in stand-alone mode. This additional functionality provides enhanced control over general application settings and options and extends the command set, giving you control over the display of model elements within AutoCAD.
Note: In AutoCAD, you must hold down the mouse button to keep the submenu open while selecting an element from the layout toolbar. Alternate layout methods include using the right-click menu to select elements or using the command line.
Menus
In AutoCAD mode, all of the SewerCAD commands are contained within a single SewerCAD menu.
The Bentley SewerCAD V8i menu commands work the same way in AutoCAD and the Stand-Alone Editor. For complete descriptions of Bentley SewerCAD V8i menu commands, see “Menus” on page 2-11.
Toolbars
In AutoCAD mode, in addition to AutoCAD’s toolbars, the following Bentley SewerCAD V8i toolbars are available:
• Layout
• View
• Compute
• Scenarios
• Analysis
• Links
Bentley SewerCAD V8i User’s Guide 12-609
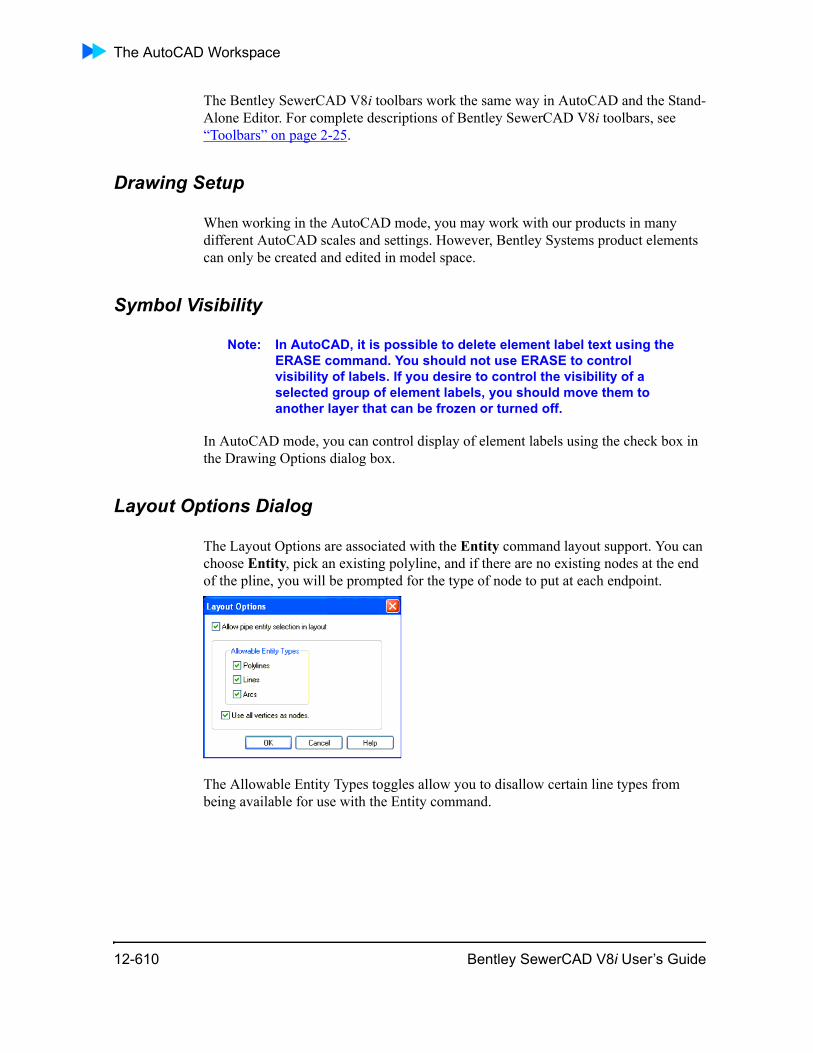
The AutoCAD Workspace
The Bentley SewerCAD V8i toolbars work the same way in AutoCAD and the Stand-Alone Editor. For complete descriptions of Bentley SewerCAD V8i toolbars, see “Toolbars” on page 2-25.
Drawing Setup
When working in the AutoCAD mode, you may work with our products in many different AutoCAD scales and settings. However, Bentley Systems product elements can only be created and edited in model space.
Symbol Visibility
Note: In AutoCAD, it is possible to delete element label text using the ERASE command. You should not use ERASE to control visibility of labels. If you desire to control the visibility of a selected group of element labels, you should move them to another layer that can be frozen or turned off.
In AutoCAD mode, you can control display of element labels using the check box in the Drawing Options dialog box.
Layout Options Dialog
The Layout Options are associated with the Entity command layout support. You can choose Entity, pick an existing polyline, and if there are no existing nodes at the end of the pline, you will be prompted for the type of node to put at each endpoint.
The Allowable Entity Types toggles allow you to disallow certain line types from being available for use with the Entity command.
12-610 Bentley SewerCAD V8i User’s Guide

Working in AutoCAD Mode
AutoCAD Project FilesWhen using Bentley SewerCAD V8i in AutoCAD mode, there are three files that fundamentally define a Bentley SewerCAD V8i model project:
• Drawing File (.dwg)—The AutoCAD drawing file contains the custom entities that define the model, in addition to the planimetric base drawing information that serves as the model background.
• Model File (.swc)—The native Bentley SewerCAD V8i model database file that contains all the element properties, along with other important project data. Bentley SewerCAD V8i .swc files can be loaded and run using the Stand-Alone Editor. These files may be copied and sent to other Bentley SewerCAD V8i users who are interested in running your project. This is the most important file for the Bentley SewerCAD V8i model.
• SewerCAD Exchange Database (.swc.mdb)—This file contains the model data.
The three files have the same base name. It is important to understand that archiving the drawing file is not sufficient to reproduce the model. You must also preserve the associated .swc and swc.mdb file.
Since the .swc file can be run and modified separately from the .dwg file using the Stand-Alone Editor, it is quite possible for the two files to get out of sync. Should you ever modify the model in the Stand-Alone Editor and then later load the AutoCAD .dwg file, the Bentley SewerCAD V8i program compares file dates, and automatically use the built-in AutoCAD synchronization routine.
Click one of the following links to learn more about AutoCAD project files and Bentley SewerCAD V8i:
• “Drawing Synchronization” on page 12-612
AutoCAD Project FilesWhen using SewerCAD V8i in AutoCAD mode, there are three files that fundamen-tally define a SewerCAD V8i model project:
• Drawing File (.DWG)—The AutoCAD drawing file contains the custom entities that define the model, in addition to the planimetric base drawing information that serves as the model background.
• Model File (.SWC)—The model file contains model data specific to SewerCAD V8i, including project option settings, color-coding and annotation settings, etc.
• Database File (.MDB)—The model database file that contains all of the input and output data for the model.
Bentley SewerCAD V8i User’s Guide 12-611
AutoCAD Project Files
To send the model to another user, all three files are required.
The two files will have the same base name. It is important to understand that archiving the drawing file is not sufficient to reproduce the model. You must also preserve the associated .SWC and .MDB files.
Since the .SWC file can be run and modified separately from the .DWG file using Stand-Alone Editor, it is quite possible for the two files to get out of sync. Should you ever modify the model in Stand-Alone Editor mode and then later load the AutoCAD .DWG file, the SewerCAD V8i program will compare file dates, and automatically use the built-in AutoCAD synchronization routine.
Click one of the following links to learn more about AutoCAD project files and SewerCAD V8i:
• “Drawing Synchronization” on page 12-612
Drawing Synchronization
Whenever you open a Bentley SewerCAD V8i-based drawing file in AutoCAD, the Bentley SewerCAD V8i model server will start. The first thing that the application will do is load the associated Bentley SewerCAD V8i model (.swc) file. If the time stamps of the drawing and model file are different, Bentley SewerCAD V8i will auto-matically perform a synchronization. This protects against corruption that might otherwise occur from separately editing the Bentley SewerCAD V8i model file in stand-alone mode, or editing proxy elements at an AutoCAD station where the Bentley SewerCAD V8i application is not loaded.
The synchronization check will occur in two stages:
• First, Bentley SewerCAD V8i will compare the drawing model elements with those in the server model. Any differences will be listed. Bentley SewerCAD V8i enforces network topological consistency between the server and the drawing state. If model elements have been deleted or added in the .swc file during a SewerCAD V8i session, or if proxy elements have been deleted, Bentley SewerCAD V8i will force the drawing to be consistent with the native database by restoring or removing any missing or excess drawing custom entities.
• After network topology has been synchronized, Bentley SewerCAD V8i will compare other model and drawing states such as location, labels, and flow direc-tions.
You can run the Synchronization check at any time using the following command:
swcCSYNCHRONIZE
swcWSYNCSERVER
12-612 Bentley SewerCAD V8i User’s Guide

Working in AutoCAD Mode
Or by selecting Tools > Database Utilities > Synchronize Drawing.
Working with Elements Using AutoCAD CommandsThis section describes how to work with elements using AutoCAD commands, including:
• SewerCAD V8i custom AutoCAD entities
• SewerCAD V8i custom AutoCAD entities
• AutoCAD commands
• Explode entities
• Move entities
• Move element labels
• Use the Snap menu
This section includes the following topics about working with elements using AutoCAD commands:
• “AutoCAD Commands” on page 12-614
• “Explode Elements” on page 12-614
• “Moving Elements” on page 12-615
• “Moving Element Labels” on page 12-615
• “Snap Menu” on page 12-615
SewerCAD V8i Custom AutoCAD Entities
The primary AutoCAD-based SewerCAD V8i element entities are all implemented using ObjectARX custom objects. Thus, they are vested with a specialized model awareness that ensures that any editing actions you perform will result in an appro-priate update of the model database.
This means that you can perform standard AutoCAD commands (see “AutoCAD Commands” on page 12-614) as you normally would, and the model database will be updated automatically to reflect these changes.
It also means that the model will enforce the integrity of the network topological state. Therefore, if you delete a nodal element such as a manhole, its connecting pipes will also be deleted since their connecting nodes topologically define model pipes.
Using ObjectARX technology ensures the database will be adjusted and maintained during Undo and Redo transactions.
Bentley SewerCAD V8i User’s Guide 12-613

Working with Elements Using AutoCAD Commands
SewerCAD V8i Custom AutoCAD Entities
The primary AutoCAD-based SewerCAD V8i element entities—pipes, channels, gutter links, manholes, catch basins, outfalls, pond outlet structures, and cross section nodes—are all implemented using ObjectARX custom objects. Thus, they are vested with a specialized model awareness that ensures that any editing actions you perform will result in an appropriate update of the model database.
This means that you can perform standard AutoCAD commands (see “AutoCAD Commands” on page 12-614) as you normally would, and the model database will be updated automatically to reflect these changes.
It also means that the model will enforce the integrity of the network topological state. Therefore, if you delete a nodal element such as a junction, its connecting pipes will also be deleted since their connecting nodes topologically define model pipes.
Using ObjectARX technology ensures the database will be adjusted and maintained during Undo and Redo transactions.
AutoCAD Commands
When running in AutoCAD mode, Bentley Systems products make use of all the advantages that AutoCAD has, such as plotting capabilities and snap features. Addi-tionally, AutoCAD commands can be used as you would with any design project. For example, our products’ elements and annotation can be manipulated using common AutoCAD commands.
Explode Elements
In AutoCAD mode, running the AutoCAD Explode command will transform all custom entities into equivalent AutoCAD native entities. When a custom entity is exploded, all associated database information is lost. Be certain to save the exploded drawing under a separate filename.
Use Explode to render a drawing for finalizing exhibits and publishing maps of the model network. You can also deliver exploded drawings to clients or other individuals who do not own a Bentley Systems Product license, since a fully exploded drawing will not be comprised of any ObjectARX proxy objects. For more information, see “Working with Proxies” on page 12-617.
12-614 Bentley SewerCAD V8i User’s Guide
Working in AutoCAD Mode
Moving Elements
When using AutoCAD mode, the AutoCAD commands Move, Scale, Rotate, Mirror, and Array can be used to move elements.
To move a node, execute the AutoCAD command by either typing it at the command prompt or selecting it. Follow the AutoCAD prompts, and the node and its associated label will move together. The connecting pipes will shrink or stretch depending on the new location of the node.
Moving Element Labels
When using AutoCAD mode, the AutoCAD commands Move, Scale, Rotate, Mirror, and Array can be used to move element text labels.
To move an element text label separately from the element, click the element label you wish to move. The grips will appear for the label. Execute the AutoCAD command either by typing it at the command prompt, by selecting it from the tool palette, or by selecting it from the right-click menu. Follow the AutoCAD prompt, and the label will be moved without the element.
Snap Menu
When using AutoCAD mode, the Snap menu is a standard AutoCAD menu that provides options for picking an exact location of an object. See the Autodesk AutoCAD documentation for more information.
Undo/RedoNote: If you use the native AutoCAD undo, you are limited to a single
redo level. The Bentley SewerCAD V8i undo/redo is faster than the native AutoCAD undo/redo. If you are rolling back Bentley SewerCAD V8i model edits, it is recommended that you use the menu-based Bentley SewerCAD V8i undo/redo.
If you undo using the AutoCAD undo/redo and you restore Bentley SewerCAD V8i elements that have been previously deleted, morphed, or split, some model state attributes such as diameters or elevations may be lost, even though the locational
Bentley SewerCAD V8i User’s Guide 12-615
Special Considerations
and topological state is fully consistent. This will only happen in situations where the Bentley SewerCAD V8i command history has been deleted. In such cases, you will be warned to check your data carefully.
In AutoCAD mode, you have two types of undo/redo available to you. From the Edit menu, you have access to Bentley SewerCAD V8i undo and redo. Alternatively, you can perform the native AutoCAD undo and redo by typing at the AutoCAD command line. The implementations of the two different operation types are quite distinct.
The menu-based undo and redo commands operate exclusively on Bentley SewerCAD V8i elements by invoking the commands directly on the model server. The main advantage of using the specialized command is that you will have unlimited undo and redo levels. This is an important difference, since in layout or editing it is quite useful to be able to safely undo and redo an arbitrary number of transactions.
Whenever you use a native AutoCAD undo, the server model will be notified when any Bentley SewerCAD V8i entities are affected by the operation. Bentley SewerCAD V8i will then synchronize the model to the drawing state. Wherever possible, the model will seek to map the undo/redo onto the model server’s managed command history. If the drawing’s state is not consistent with any pending undo or redo transactions held by the server, Bentley SewerCAD V8i will delete the command history. In this case, the model will synchronize the drawing and server models.
Special ConsiderationsThere are special considerations to remember when you perform the following tasks in AutoCAD mode:
• “Importing SewerCAD V8i Data” on page 12-617
• “Importing SewerCAD V8i Data” on page 12-617
• “Working with Proxies” on page 12-617
12-616 Bentley SewerCAD V8i User’s Guide
Working in AutoCAD Mode
Importing SewerCAD V8i Data
When running SewerCAD V8i AutoCAD mode, this command imports a selected SewerCAD V8i data (.swc) file for use in the current drawing. The new project file will now correspond to the drawing name, such as, CurrentDrawingName.swc. When-ever you save changes to the network model through SewerCAD V8i, the associated .swc data file is updated and can be loaded into SewerCAD V8i.
Warning! A SewerCAD V8i Project can only be imported to a new, empty AutoCAD drawing.
Importing SewerCAD V8i Data
When running SewerCAD V8i in AutoCAD mode, this command imports a selected SewerCAD V8i data (.swc) file for use in the current drawing. The new project file will now correspond to the drawing name, such as, CurrentDrawingName.swc. When-ever you save changes to the network model through SewerCAD V8i, the associated .swc data file is updated and can be loaded into SewerCAD V8i 4.0 or higher.
Warning! A SewerCAD V8i Project can only be imported to a new, empty AutoCAD drawing.
Working with Proxies
If you open a Bentley SewerCAD V8i drawing file on an AutoCAD workstation that does not have the Bentley SewerCAD V8i application installed, you will get an AutoCAD Proxy Information message box. This is because the executable logic for managing the AutoCAD entities is not available, and the Bentley SewerCAD V8i modeling elements are not associated with the Bentley SewerCAD V8i native data-base.
Bentley SewerCAD V8i proxy objects can be moved and erased. However, doing so will put the drawing state out of sync with the model database if the drawing is saved with its original name. If this happens, and you later reload the drawing on an AutoCAD station that is running a Bentley SewerCAD V8i application, the applica-tion will automatically load and will attempt to reconcile any differences it finds by automatically loading its Database Synchronization routine. (For more information, see “Drawing Synchronization” on page 12-612).
Bentley SewerCAD V8i User’s Guide 12-617

Special Considerations
12-618 Bentley SewerCAD V8i User’s Guide
13
ChapterTheory
This appendix provides an overview of the methods that SewerCAD uses to compute flows and hydraulic grades throughout the system, including both gravity and pressure computations.
Some of the basic concepts underlying the calculations are as follows:
• SewerCAD can run both Steady State and Extended Period Analyses. Steady State Analyses model a single instant in time and are generally used to model a network under peak loading conditions. Extended Period Simulations model a network over a specified duration of time and can be used to model hydrograph loading, wet well capacities, and automated pump behavior.
• Loads are the sources of flow in the sanitary sewer system, and are categorized as sanitary (dry weather) loads, wet weather loads, and known loads. The total load at any given point may be a combination of these basic load types.
• Loads can be adjusted through the use of fixed or variable peaking factors during a Steady State analysis in order to analyze the system under a variety of condi-tions, such as daily average, minimum, and maximum scenarios. Common pre-defined variable peaking methods are included, but you may also specify your own as tables or equations.
• Loads can also be varied over time using loading patterns and hydrographs during an Extended Period Simulation.
• Gravity pipe headlosses are computed based on gradually varied flow profiles or approximate profiles. Either of these profile methods allows for free-surface (open channel) flow, full flow (as for a pipe that is submerged), and mixed condi-tions. Pressure pipe headlosses are based strictly on full-flow hydraulics.
• Gravity structure losses may be based on several common methodologies. Where appropriate, these calculations may account for pipe bend angles, structure benching, and other influential factors.
Bentley SewerCAD V8i User’s Guide 13-619
Loading
• During an Extended Period Simulation hydrographs are routed through the gravity pipes to account for translation and other effects.
• All or portions of gravity systems may be selected for automatic design. This preliminary design can be used to set pipe and structure elevations, as well as to size the pipes.
LoadingSewerCAD classifies loads as sanitary (dry weather) loads, wet weather loads, and known loads.
Sanitary loads correspond to loads that result from human activity, and are not weather-dependent. Common sources of sanitary loads are various residential, commercial, recreational, and industrial usage. Wet weather loads are related to rain-fall activity, such as groundwater infiltration (water leaking into a pipe through cracks, joints, and other defects) and structure inflow (surface water entering a structure through the cover).
Known loads are typically used to model flows that have already been gathered from some other source, such as external calculations or field measurements.
Common Load Types
There are two different loading types that can be applied as both wet weather and sani-tary loads. The behavior of each loading type is the same regardless of how it is applied. The two common loads are:
• Hydrographs
• Pattern Loads
Hydrographs
In SewerCAD you can enter time vs. flow data directly as a load. The hydrographs will then be directly added to any other loads coming to that point and then routed downstream
During a Steady State analysis a hydrograph loaded can be converted into a single load, based on one of the following selected Steady State Loading options.
• Peak - The peak of the hydrograph will be used as the Steady State load.
• Average - The average of the hydrograph flows will be used as the Steady State load.
13-620 Bentley SewerCAD V8i User’s Guide
Theory
• Minimum - The minimum flow of the hydrograph will be used as the Steady State load.
• Zero - The hydrograph is disregarded during the Steady State run.
Note: When the length of the hydrograph is shorter than the duration of an EPS run, The final flow value of the hydrograph will remain constant for the duration of the simulation.
Pattern Loads
A pattern load is comprised of a base load and an associated loading pattern. The pattern is a series of multipliers, which describes how the base load varies over time.
During a Steady State Analysis the entered base load is used as the load regardless of the applied loading pattern.
Extreme Flow Factors are not applied to entered base loads.
Hydrographs vs. Pattern Loads
Hydrographs and Pattern loads are two distinct ways to describe how flow varies over time. Ultimately, you can attain the same results using either method but there are some behavioral and semantic differences that should be noted.
Pattern loads consists of a single average base load and a series of dimensionless multipliers used to delineate how the load varies over time. A hydrograph, simply, is a time-discharge series.
Hydrographs are usually applied as wet weather loads, and are generated using hydro-logic methods, while patterns are more typically applied to sanitary loads. Patterns are developed based on predetermined variations in loading over the course of a day. The patterns are then assumed to represent templates for how the loads of a similar type vary over time. These statements represent typical usage of both loading types; they do not represent hard and fast rules.
During an Extended Period Simulation if the duration of the simulation exceeds the duration of a pattern then the pattern will repeat itself. If the duration of the simula-tion exceeds the duration of a hydrograph the last point of the hydrograph will remain constant for the extent of the remaining time.
Sanitary (Dry Weather) Loading
The total sanitary load may be comprised of an unlimited number of individual sani-tary loads. For example, the local load for a given manhole may be a combination of loads from an apartment building, a gas station, and a film development store, each with different loading characteristics. They can either be entered as:
Bentley SewerCAD V8i User’s Guide 13-621

Loading
• Unit Sanitary Loads
• Pattern Loads
• Hydrographs
Unit sanitary loads and pattern loads are calculated or entered as a base load, which represent the average loading on the system at that point. During a Steady State anal-ysis the unit sanitary loads can be adjusted to represent peak or minimum loads using the Extreme Flow Factor methods. During an Extended Period Simulation a loading pattern can be applied to both the unit sanitary loads and pattern loads to described how the base load varies over time.
Hydrographs can also be applied as sanitary loads. They are meant to represent actual measured flow or hydrographs generated from other programs, and SewerCAD does not apply peaking factors or patterns to them.
Unit Sanitary (Dry Weather) Loads
Unit sanitary (dry weather) loads are entered based on a number of contributing units, with a specified average load per unit, such as X-amount of flow per apartment resi-dent. With each load type, you can then associate a peaking factor method or a loading pattern, allowing you to account for the knowledge that peaking factors and patterns are most likely different for residential and commercial areas.
Peaking factors are applied only during the Steady State analyses. During Extended Period Simulations loading patterns can be applied to the base loads generated from the unit sanitary loads to account for variations in sanitary inflow over time.
Extreme Flow Factor
Sewer design and analysis generally considers a variety of loading conditions, such as minimum, average, and peak conditions. Base (average) sanitary loads are trans-formed into minimum or peak loads using an Extreme Flow Factor.
The most common type of Extreme Flow Factor (EFF) is the Variable Peaking Factor (PF).
Qpeaked = Qbase * EFF
Where:
• Qpeaked = Transformed flow (l/s, gpm)
• Qbase = Base flow (l/s, gpm)
• EFF = Extreme Flow Factor (unitless)
13-622 Bentley SewerCAD V8i User’s Guide
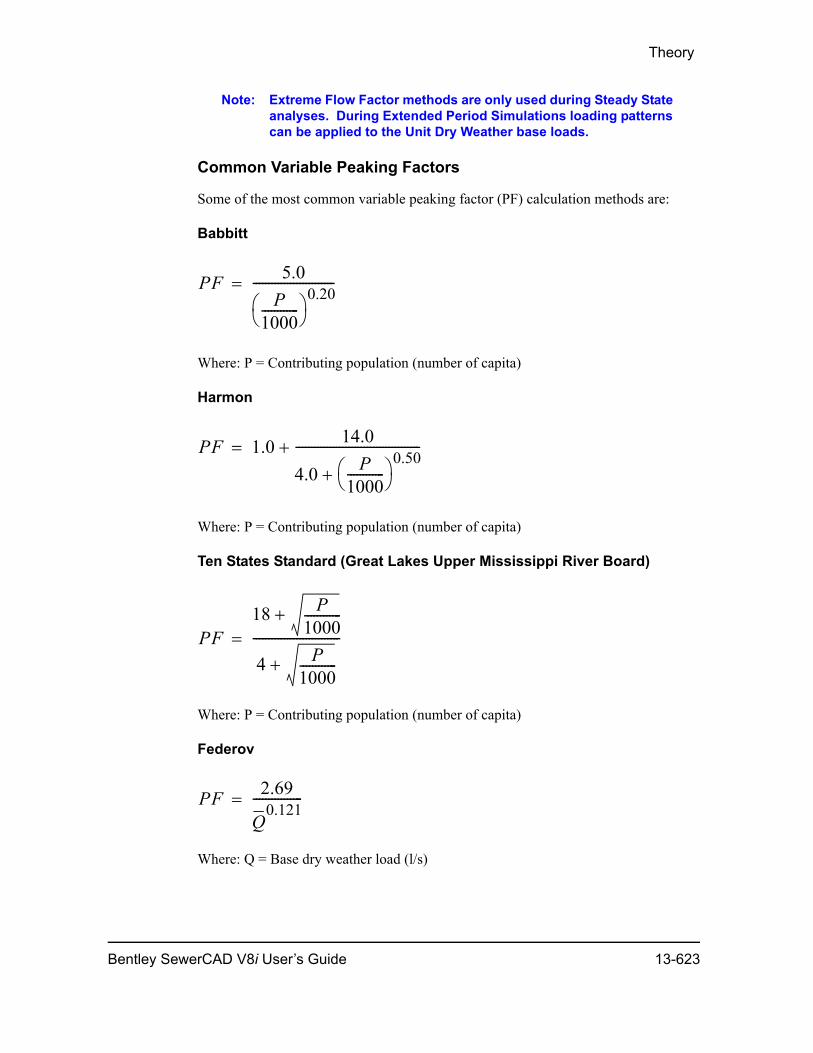
Theory
Note: Extreme Flow Factor methods are only used during Steady State analyses. During Extended Period Simulations loading patterns can be applied to the Unit Dry Weather base loads.
Common Variable Peaking Factors
Some of the most common variable peaking factor (PF) calculation methods are:
Babbitt
Where: P = Contributing population (number of capita)
Harmon
Where: P = Contributing population (number of capita)
Ten States Standard (Great Lakes Upper Mississippi River Board)
Where: P = Contributing population (number of capita)
Federov
Where: Q = Base dry weather load (l/s)
PF 5.0P
1000------------⎝ ⎠⎛ ⎞ 0.20--------------------------=
PF 1.0 14.0
4.0 P1000------------⎝ ⎠⎛ ⎞ 0.50
+
----------------------------------------+=
PF18 P
1000------------+
4 P1000------------+
----------------------------=
PF 2.69
Q0.121
----------------=
Bentley SewerCAD V8i User’s Guide 13-623
Loading
Note: The Babbit peaking method does not converge to 1. For populations larger than 3,125,000 the peaking factor will become smaller than 1.
Wet Weather Loading
The Wet Weather Load represents the intrusion of rainfall water into the sewer system. Wet weather loads consist of groundwater infiltration, rainfall inflow, and illegal invert pump connections. Groundwater infiltration occurs in gravity pipes, while inflow occurs at manholes, pressure junctions, and wet wells. Infiltration loads refer to wet weather loads entering pipes, where water leaks into the system through joints, cracks, and other defects. Inflow loads refer to wet weather loads entering structures, typically surface water entering through a structure's cover.
Infiltration
Infiltration resulting from the presence of groundwater can be modeled for gravity pipes. Infiltration enters the system at conduit elements. It is combined with the loads at the upstream end of the pipe to determine the pipe's Flow.
There are several common methods of determining infiltration based on pipe charac-teristics, which is why
SewerCAD allows infiltration to be defined with any of the following methods:
• Proportional to Pipe Length - The infiltration is specified as an Infiltration Rate per Unit of Pipe Length.
• Proportional to Pipe Diameter-Length - The infiltration is specified by an Infil-tration Rate per Unit of Pipe Diameter times Pipe Length. The amount of infiltra-tion is proportional to the pipe length and to the pipe diameter.
• Proportional to Pipe Surface Area - The infiltration is specified by an Infiltra-tion Rate per Unit of Pipe Surface Area, where the pipe's surface area is calculated as its length multiplied by its full perimeter. The amount of infiltration is propor-tional to the pipe length and the pipe diameter.
• Proportional to Count - The infiltration is specified by count value, which may be the number of defects in the pipe, and the Infiltration Rate per Unit of Count.
• Additional Infiltration - Fixed amount of infiltration that is added to the total wet weather load. This value is constant regardless of the pipe's characteristics.
• Hydrographs - The infiltration is specified as a table of flow vs. time.
• Pattern Loads - The infiltration is specified as an average base load and a loading pattern.
13-624 Bentley SewerCAD V8i User’s Guide
Theory
During an Extended Period Simulation the five non-time-based methods will generate a single straight-line hydrograph producing a constant load for the duration of the simulation.
Inflow
Inflow loads refer to wet weather loads entering structures, which are typically from surface water entering through a structure's cover, or pumped illegally into a force main system. Inflows can be entered as the following loading types:
• Hydrographs
• Pattern Loads
During Steady State analysis these loads can be modeled, and are combined with upstream wet weather loads to determine the Total Wet Weather Flow.
During Extended Period Simulations the loads are not classified once they enter the system they are added to together as a single lump hydrograph.
Inflows can be applied to manholes, wet wells, and pressure junctions.
Known Flow
Known flows are a special type of fixed flow. As with other fixed flows, known flows remain constant as they progress downstream and combine directly as a simple sum.
The special behavior of known flows occurs during a Steady State Analysis when another known flow is specified at a downstream location. While most fixed flows combine directly under any circumstances, a non-zero known flow at any location replaces all upstream known flows. Known flows do not override hydrograph or pattern loads from upstream. Therefore it is not advisable to mix known flows with these other types of node.
For this reason, known flows may be desirable for modeling flows that originate from external calculations or field measured data (flows that do not require SewerCAD to generate or sum them in any way).
During Extended Period Simulations, Known Flows are modeled as a single constant flow hydrograph over the duration of the simulation. They are added directly to the existing flows coming from upstream sources and are all lumped together as a single hydrograph for routing. The Known Flows are additive and do not replace each other during Extended Period Simulations, much like a fixed pattern load.
Bentley SewerCAD V8i User’s Guide 13-625

Gravity Pipe Hydraulics
Gravity Pipe HydraulicsThis documentation is intended to familiarize you with some of the methods used in this program's calculations. However, there is not a great deal of time spent on common hydraulic terms and equations, such as determination of wetted perimeter, hydraulic radius, hydraulic depth, and Reynolds number.
The Energy Principle
The first law of thermodynamics states that for any given system, the change in energy is equal to the difference between the heat transferred to the system and the work done by the system on its surroundings during a given time interval.
The energy referred to in this principle represents the total energy of the system minus the sum of the potential, kinetic, and internal (molecular) forms of energy, such as electrical and chemical energy. The internal energy changes are commonly disre-garded in water distribution analysis because of their relatively small magnitude.
In hydraulic applications, energy is often represented as energy per unit weight, resulting in units of length. Using these length equivalents gives engineers a better feel for the resulting behavior of the system. When using these length equivalents, the state of the system is expressed in terms of head. The energy at any point within a hydraulic system is often represented in three parts:
These quantities can be used to express the headloss or head gain between two loca-tions using the energy equation (for more information, see “The Energy Equation” on page 13-627).
Pressure Head: p/γ
Elevation Head: z
Velocity Head: V2/2g
Where: p = Pressure (N/m2, lb./ft.2)
γ = Specific weight (N/m3, lb./ft.3)
z = Elevation (m, ft.)
V = Velocity (m/s, ft./sec.)
g = Gravitational acceleration constant (m/s2, ft./sec.2)
13-626 Bentley SewerCAD V8i User’s Guide
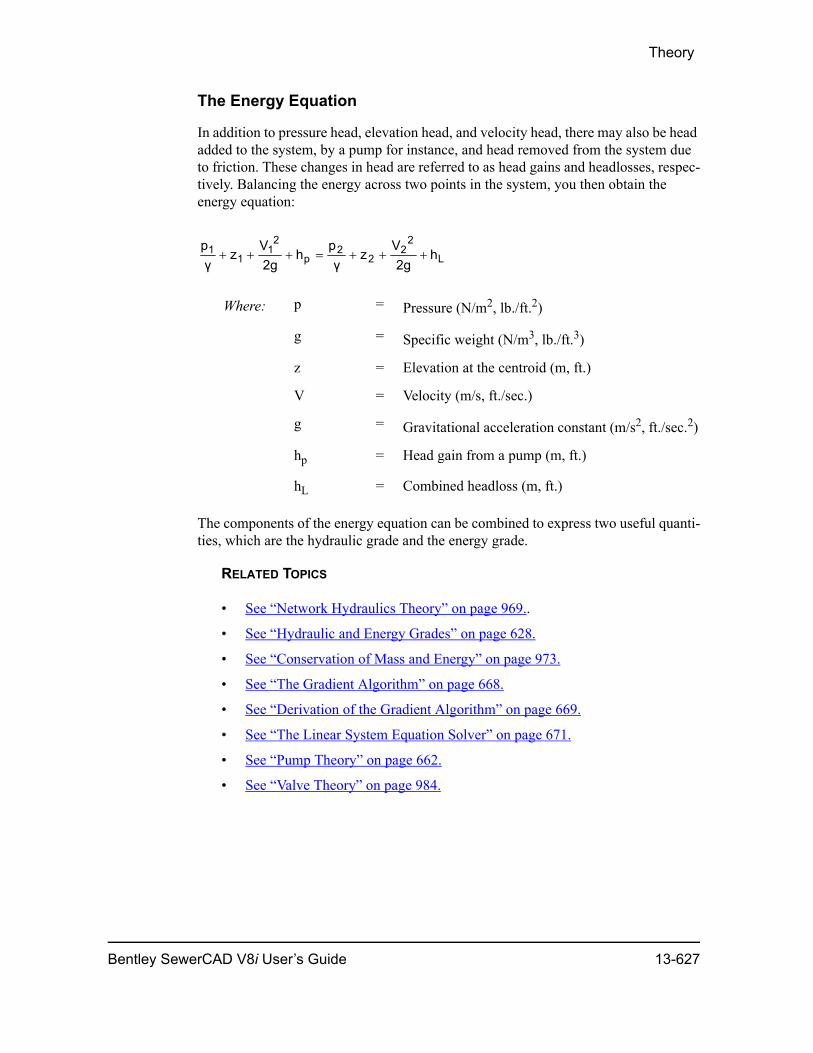
Theory
The Energy Equation
In addition to pressure head, elevation head, and velocity head, there may also be head added to the system, by a pump for instance, and head removed from the system due to friction. These changes in head are referred to as head gains and headlosses, respec-tively. Balancing the energy across two points in the system, you then obtain the energy equation:
The components of the energy equation can be combined to express two useful quanti-ties, which are the hydraulic grade and the energy grade.
RELATED TOPICS
• See “Network Hydraulics Theory” on page 969..
• See “Hydraulic and Energy Grades” on page 628.
• See “Conservation of Mass and Energy” on page 973.
• See “The Gradient Algorithm” on page 668.
• See “Derivation of the Gradient Algorithm” on page 669.
• See “The Linear System Equation Solver” on page 671.
• See “Pump Theory” on page 662.
• See “Valve Theory” on page 984.
Where: p = Pressure (N/m2, lb./ft.2)
g = Specific weight (N/m3, lb./ft.3)
z = Elevation at the centroid (m, ft.)
V = Velocity (m/s, ft./sec.)
g = Gravitational acceleration constant (m/s2, ft./sec.2)
hp = Head gain from a pump (m, ft.)
hL = Combined headloss (m, ft.)
L
22
22
p
21
11 h
2gV
zγ
ph
2gV
zγ
p+++=+++
Bentley SewerCAD V8i User’s Guide 13-627
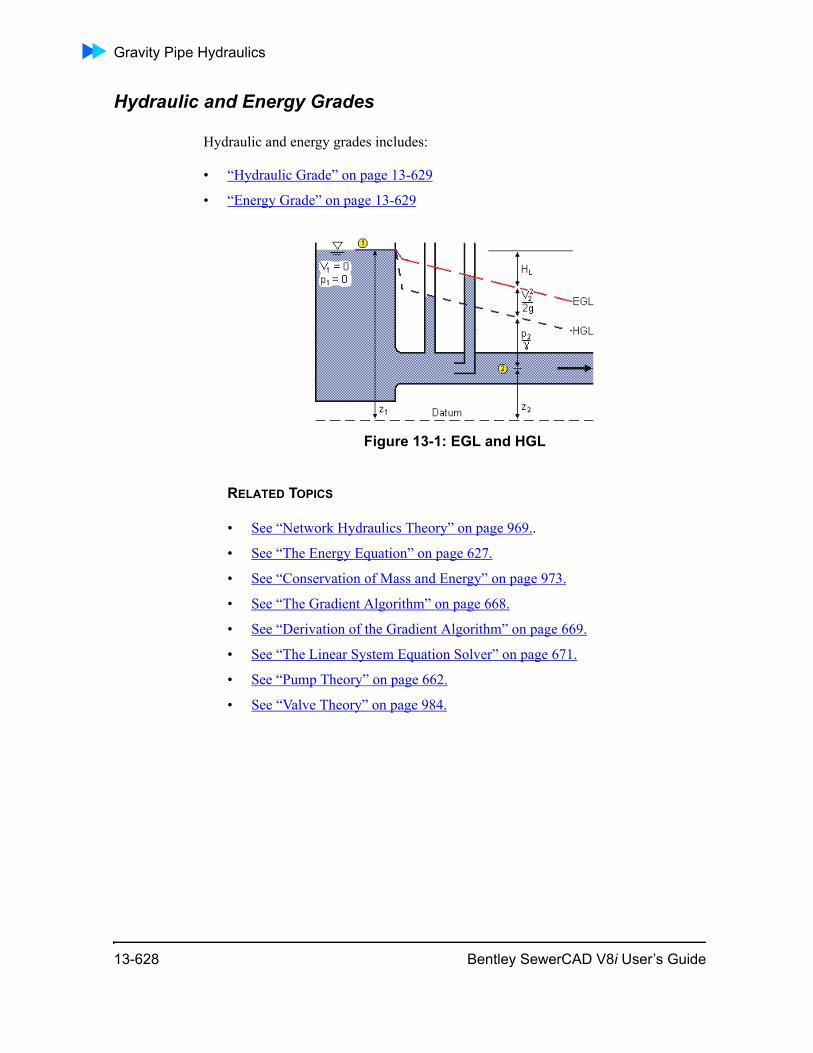
Gravity Pipe Hydraulics
Hydraulic and Energy Grades
Hydraulic and energy grades includes:
• “Hydraulic Grade” on page 13-629
• “Energy Grade” on page 13-629
Figure 13-1: EGL and HGL
RELATED TOPICS
• See “Network Hydraulics Theory” on page 969..
• See “The Energy Equation” on page 627.
• See “Conservation of Mass and Energy” on page 973.
• See “The Gradient Algorithm” on page 668.
• See “Derivation of the Gradient Algorithm” on page 669.
• See “The Linear System Equation Solver” on page 671.
• See “Pump Theory” on page 662.
• See “Valve Theory” on page 984.
13-628 Bentley SewerCAD V8i User’s Guide
Theory
Hydraulic Grade
The hydraulic grade is the sum of the pressure head (p/g) and elevation head (z). The hydraulic head represents the height to which a water column would rise in a piezom-eter. The plot of the hydraulic grade in a profile is often referred to as the hydraulic grade line, or HGL.
Energy Grade
The energy grade is the sum of the hydraulic grade and the velocity head (V2/2g). This is the height to which a column of water would rise in a pitot tube. The plot of the hydraulic grade in a profile is often referred to as the energy grade line, or EGL. At a lake or reservoir, where the velocity is essentially zero, the EGL is equal to the HGL, as can be seen in the following figure.
Friction Loss Methods
Friction loss methods include:
• “Chezy’s Equation” on page 13-629
• “Colebrook-White Equation” on page 13-630
• “Hazen-Williams Equation” on page 13-631
• “Darcy-Weisbach Equation” on page 13-631
• “Manning’s Equation” on page 13-633
Chezy’s Equation
Chezy’s equation is rarely used directly, but it is the basis for several other methods, including Manning’s equation. Chezy’s equation is:
Where: Q = Discharge in the section (m3/s, cfs)
C = Chezy’s roughness coefficient (m1/2/s, ft.1/2/sec.)
A = Flow area (m2, ft.2)
R = Hydraulic radius (m, ft.)
S = Friction slope (m/m, ft./ft.)
SRACQ ⋅⋅⋅=
Bentley SewerCAD V8i User’s Guide 13-629
Gravity Pipe Hydraulics
RELATED TOPICS
• See “Hazen-Williams Equation” on page 631.
• See “Darcy-Weisbach Equation” on page 631.
• See “Manning’s Equation” on page 633.
• See “Colebrook-White Equation” on page 630.
Colebrook-White Equation
The Colebrook-White equation is used to iteratively calculate for the Darcy-Weisbach friction factor:
Free Surface:
Full Flow (Closed Conduit):
RELATED TOPICS
• See “Hazen-Williams Equation” on page 631.
• See “Darcy-Weisbach Equation” on page 631.
• See “Manning’s Equation” on page 633.
• See “Chezy’s Equation” on page 629.
Where: f = Friction factor (unitless)
k = Darcy-Weisbach roughness height (m, ft.)
Re = Reynolds Number (unitless)
R = Hydraulic radius (m, ft.)
D = Pipe diameter (m, ft.)
12
12 0
2 51
f
k
R R fe
= - +Ł ł
log.
.
12
3 7
2 51
f
k
D R fe
= - +Ł ł
log.
.
13-630 Bentley SewerCAD V8i User’s Guide
Theory
Hazen-Williams Equation
The Hazen-Williams Formula is frequently used in the analysis of pressure pipe systems (such as water distribution networks and sewer force mains). The formula is as follows:
RELATED TOPICS
• See “Roughness Values—Hazen-Williams Equation” on page 1009.
• See “Darcy-Weisbach Equation” on page 631.
• See “Manning’s Equation” on page 633.
• See “Colebrook-White Equation” on page 630.
• See “Chezy’s Equation” on page 629.
Darcy-Weisbach Equation
Because of non-empirical origins, the Darcy-Weisbach equation is viewed by many engineers as the most accurate method for modeling friction losses. It most commonly takes the following form:
Where: Q = Discharge in the section (m3/s, cfs)
C = Hazen-Williams roughness coefficient (unitless)
A = Flow area (m2, ft.2)
R = Hydraulic radius (m, ft.)
S = Friction slope (m/m, ft./ft.)
k = Constant (0.85 for SI units, 1.32 for US units).
54.063.0 SRACkQ ⋅⋅⋅⋅=
Where: hL = Headloss (m, ft.)
f = Darcy-Weisbach friction factor (unitless)
h fL
D
V
gL =2
2
Bentley SewerCAD V8i User’s Guide 13-631
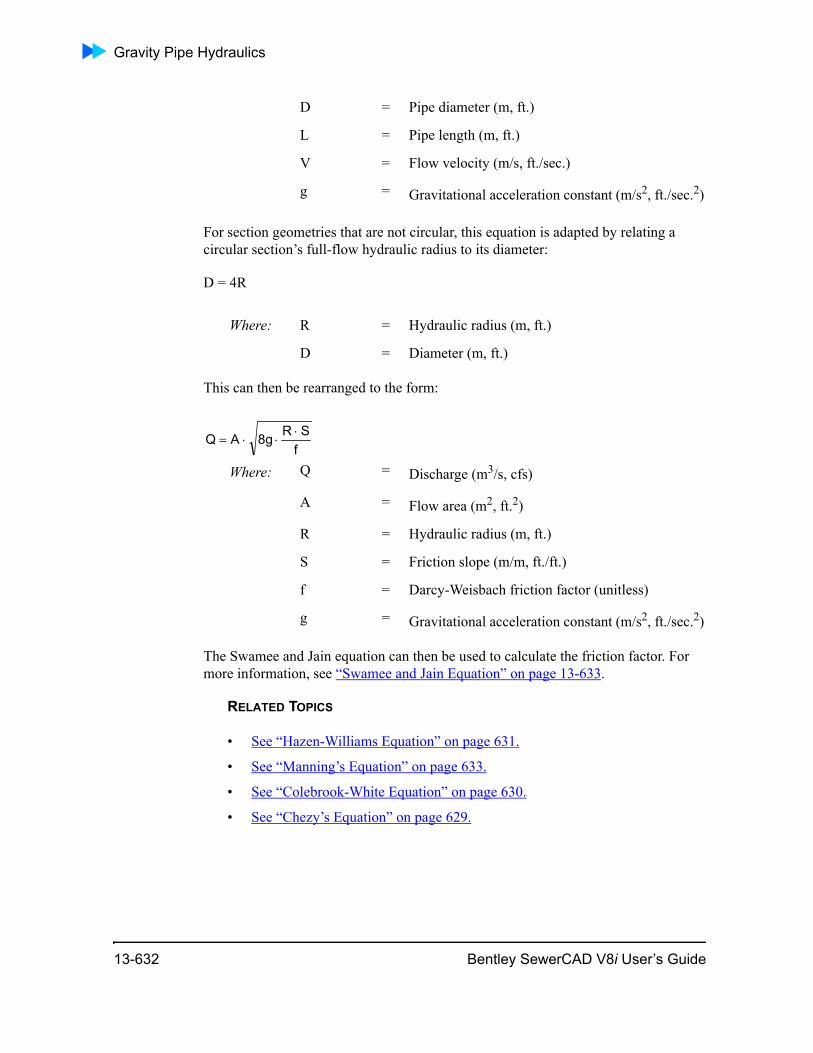
Gravity Pipe Hydraulics
For section geometries that are not circular, this equation is adapted by relating a circular section’s full-flow hydraulic radius to its diameter:
D = 4R
This can then be rearranged to the form:
The Swamee and Jain equation can then be used to calculate the friction factor. For more information, see “Swamee and Jain Equation” on page 13-633.
RELATED TOPICS
• See “Hazen-Williams Equation” on page 631.
• See “Manning’s Equation” on page 633.
• See “Colebrook-White Equation” on page 630.
• See “Chezy’s Equation” on page 629.
D = Pipe diameter (m, ft.)
L = Pipe length (m, ft.)
V = Flow velocity (m/s, ft./sec.)
g = Gravitational acceleration constant (m/s2, ft./sec.2)
Where: R = Hydraulic radius (m, ft.)
D = Diameter (m, ft.)
Where: Q = Discharge (m3/s, cfs)
A = Flow area (m2, ft.2)
R = Hydraulic radius (m, ft.)
S = Friction slope (m/m, ft./ft.)
f = Darcy-Weisbach friction factor (unitless)
g = Gravitational acceleration constant (m/s2, ft./sec.2)
fSRg8AQ ⋅
⋅⋅=
13-632 Bentley SewerCAD V8i User’s Guide
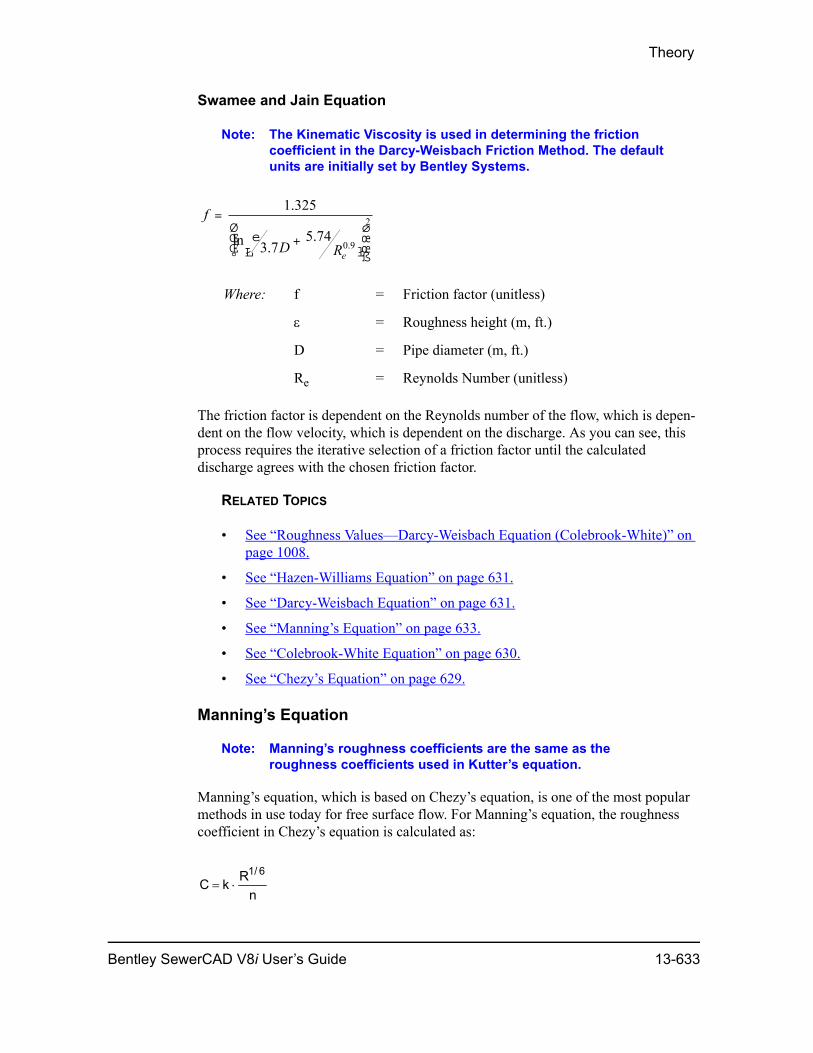
Theory
Swamee and Jain Equation
Note: The Kinematic Viscosity is used in determining the friction coefficient in the Darcy-Weisbach Friction Method. The default units are initially set by Bentley Systems.
The friction factor is dependent on the Reynolds number of the flow, which is depen-dent on the flow velocity, which is dependent on the discharge. As you can see, this process requires the iterative selection of a friction factor until the calculated discharge agrees with the chosen friction factor.
RELATED TOPICS
• See “Roughness Values—Darcy-Weisbach Equation (Colebrook-White)” on page 1008.
• See “Hazen-Williams Equation” on page 631.
• See “Darcy-Weisbach Equation” on page 631.
• See “Manning’s Equation” on page 633.
• See “Colebrook-White Equation” on page 630.
• See “Chezy’s Equation” on page 629.
Manning’s Equation
Note: Manning’s roughness coefficients are the same as the roughness coefficients used in Kutter’s equation.
Manning’s equation, which is based on Chezy’s equation, is one of the most popular methods in use today for free surface flow. For Manning’s equation, the roughness coefficient in Chezy’s equation is calculated as:
Where: f = Friction factor (unitless)
ε = Roughness height (m, ft.)
D = Pipe diameter (m, ft.)
Re = Reynolds Number (unitless)
f
D Re
=
+Ł ł
Ø
ºŒŒ
ø
ßœœ
1 325
3 75 74
0 9
2
.
ln ..
.e
nRkC
6/1⋅=
Bentley SewerCAD V8i User’s Guide 13-633
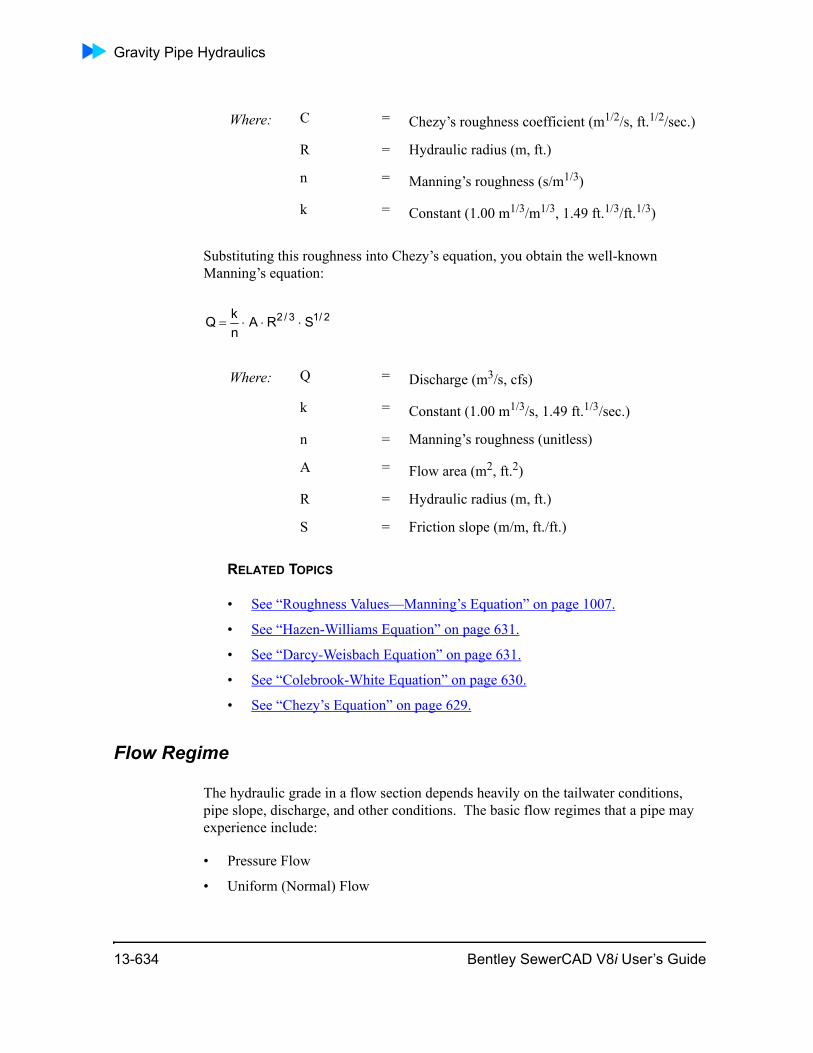
Gravity Pipe Hydraulics
Substituting this roughness into Chezy’s equation, you obtain the well-known Manning’s equation:
RELATED TOPICS
• See “Roughness Values—Manning’s Equation” on page 1007.
• See “Hazen-Williams Equation” on page 631.
• See “Darcy-Weisbach Equation” on page 631.
• See “Colebrook-White Equation” on page 630.
• See “Chezy’s Equation” on page 629.
Flow Regime
The hydraulic grade in a flow section depends heavily on the tailwater conditions, pipe slope, discharge, and other conditions. The basic flow regimes that a pipe may experience include:
• Pressure Flow
• Uniform (Normal) Flow
Where: C = Chezy’s roughness coefficient (m1/2/s, ft.1/2/sec.)
R = Hydraulic radius (m, ft.)
n = Manning’s roughness (s/m1/3)
k = Constant (1.00 m1/3/m1/3, 1.49 ft.1/3/ft.1/3)
Where: Q = Discharge (m3/s, cfs)
k = Constant (1.00 m1/3/s, 1.49 ft.1/3/sec.)
n = Manning’s roughness (unitless)
A = Flow area (m2, ft.2)
R = Hydraulic radius (m, ft.)
S = Friction slope (m/m, ft./ft.)
2/13/2 SRAnkQ ⋅⋅⋅=
13-634 Bentley SewerCAD V8i User’s Guide
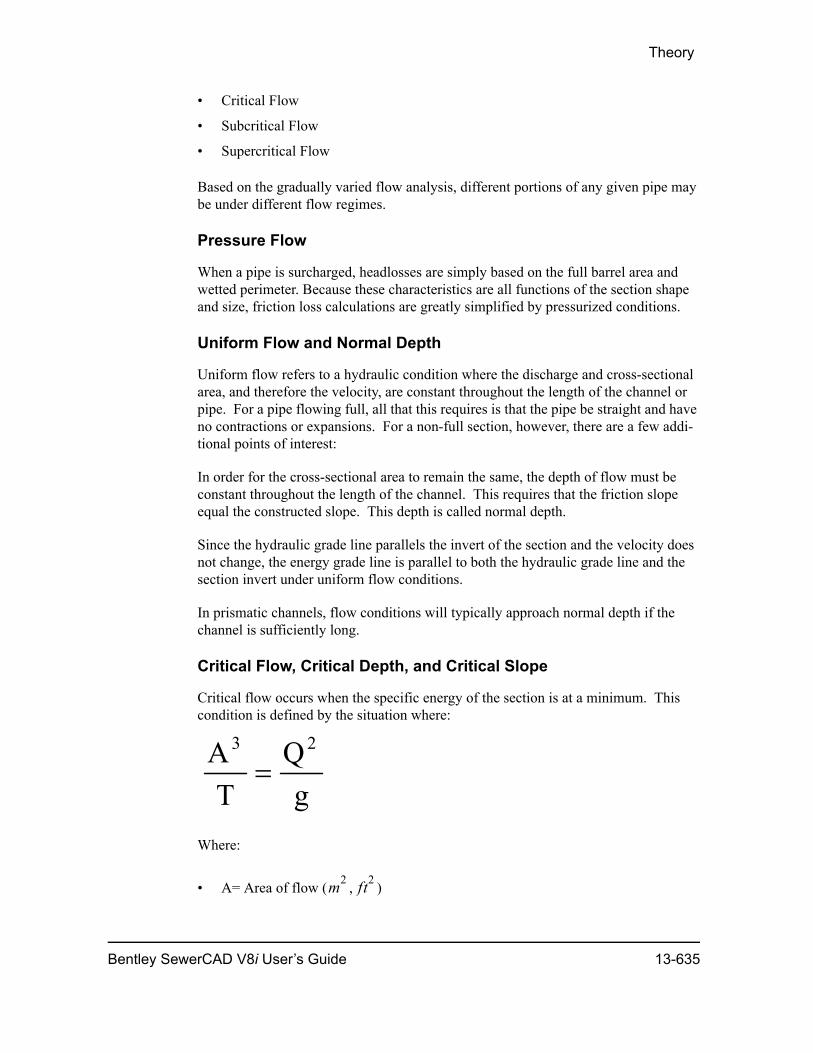
Theory
• Critical Flow
• Subcritical Flow
• Supercritical Flow
Based on the gradually varied flow analysis, different portions of any given pipe may be under different flow regimes.
Pressure Flow
When a pipe is surcharged, headlosses are simply based on the full barrel area and wetted perimeter. Because these characteristics are all functions of the section shape and size, friction loss calculations are greatly simplified by pressurized conditions.
Uniform Flow and Normal Depth
Uniform flow refers to a hydraulic condition where the discharge and cross-sectional area, and therefore the velocity, are constant throughout the length of the channel or pipe. For a pipe flowing full, all that this requires is that the pipe be straight and have no contractions or expansions. For a non-full section, however, there are a few addi-tional points of interest:
In order for the cross-sectional area to remain the same, the depth of flow must be constant throughout the length of the channel. This requires that the friction slope equal the constructed slope. This depth is called normal depth.
Since the hydraulic grade line parallels the invert of the section and the velocity does not change, the energy grade line is parallel to both the hydraulic grade line and the section invert under uniform flow conditions.
In prismatic channels, flow conditions will typically approach normal depth if the channel is sufficiently long.
Critical Flow, Critical Depth, and Critical Slope
Critical flow occurs when the specific energy of the section is at a minimum. This condition is defined by the situation where:
Where:
• A= Area of flow ( , )
gQ
TA 23
=
m2 ft2
Bentley SewerCAD V8i User’s Guide 13-635
Gravity Pipe Hydraulics
• T = Top width of flow (m, ft)
• Q = Section Discharge ( , )
• g = Gravitational acceleration ( , )
This is a relatively simple computation for simple geometric shapes, but can require iterative calculation for more complex shapes (such as arches). Some sections may even have several valid critical depths, making numerical convergence more difficult.
Critical depth refers to the depth of water in a channel for which the specific energy is at its minimum. Critical slope refers to the slope at which the critical depth of a pipe would be equal to the normal depth.
Subcritical Flow
Subcritical flow refers to any flow condition where the Froude number is less than 1.0. For this condition, the depth is above critical depth, and the velocity is below the crit-ical depth velocity.
Supercritical Flow
Supercritical flow refers to any condition where the Froude number, or the ratio of internal forces to gravity forces, is greater than 1.0. For this condition, the depth is below critical depth, and the velocity is above the critical depth velocity.
Gradually Varied Flow Analysis
For free surface flow, depth rarely remains the same throughout the length of a channel or pipe. Starting from a boundary control depth, the depth changes gradually, increasing or decreasing until normal depth is achieved (if the conduit is sufficiently long). The determination of a boundary control depth depends on both the tailwater condition and the hydraulic characteristics of the conduit. The areas of classification for gradually varied flow analysis are:
• Slope Classification
• Zone Classification
• Profile Classification
Slope Classification
The constructed slope of a conduit is a very important factor in determining the type of gradually varied flow profile that exists. Slopes fall into one of five types, all of which are handled by the program:
• Adverse Slope
m3 s⁄ ft3 s⁄
m s2⁄ ft s2⁄
13-636 Bentley SewerCAD V8i User’s Guide
Theory
• Horizontal Slope
• Hydraulically Mild Slope
• Critical Slope
• Hydraulically Steep Slope
Any pipe can qualify as only one of these slope types for a given discharge. For differing flows, though, a pipe may change between qualifying as a mild, critical, and steep slope. These slopes do not relate to just the constructed slope, but to the constructed slope relative to the critical slope for the given discharge.
Adverse Slope
Adverse slope occurs when the upstream invert elevation of a pipe is actually below the downstream invert elevation. Normal depth is undefined for adverse slopes, since no amount of positive flow would result in a rising friction slope. Most flow condi-tions for adverse sloping pipes are subcritical.
Pipes are typically not designed to be adverse, so most situations with adverse slopes are due to construction errors or other unusual circumstances. Adverse pipes may cause some concern beyond the hydraulic capacity of the system, because stagnant water, excessive clogging, and other non-desirable conditions may result.
Horizontal Slope
As the name suggests, a horizontal slope results when a pipe's upstream and down-stream invert elevations are the same. Normal depth for a horizontal pipe is theoreti-cally infinite, although critical depth may still be computed. Like adverse slopes, most flow conditions for horizontal pipes are subcritical.
Hydraulically Mild Slope
A hydraulically mild slope is a condition where the constructed slope is less than the critical slope. For this condition, the section's normal depth is above critical depth, and the flow regime is usually subcritical.
Critical Slope
A pipe or channel may have exactly the same slope as the critical slope for the discharge it carries. This is a very uncommon occurrence, but it is possible and the program does calculate it appropriately. Critical depth is an inherently unstable surface, so flow is most likely to be subcritical for these slopes.
Bentley SewerCAD V8i User’s Guide 13-637
Gravity Pipe Hydraulics
Hydraulically Steep Slope
A hydraulically steep slope is a condition where the constructed slope is greater than the critical slope. For this condition, the section's normal depth is below critical depth, and the flow regime is usually supercritical. However, high tailwater conditions may cause flow to be subcritical.
Zone Classification
There are three zones that are typically used to classify gradually varied flow:
Zone 1 is where actual flow depth is above both normal depth and critical depth.
Zone 2 is where actual flow depth is between normal depth and critical depth.
Zone 3 is where actual flow depth is below both normal depth and critical depth.
13-638 Bentley SewerCAD V8i User’s Guide
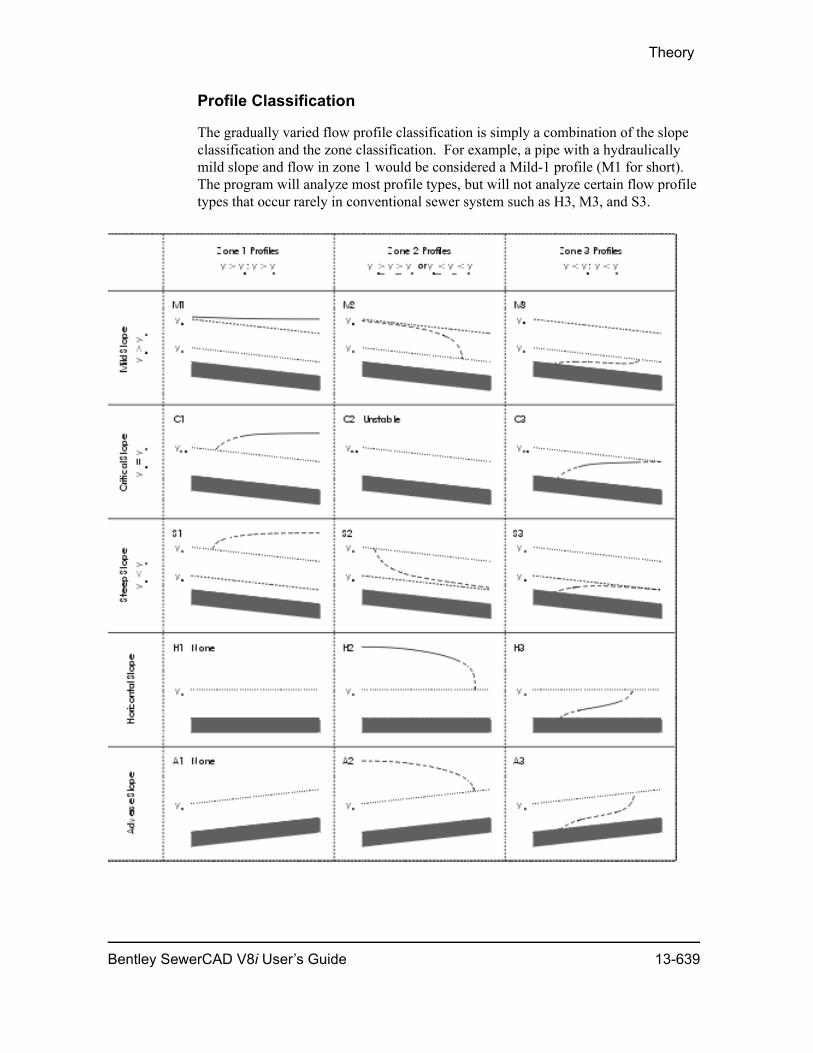
Theory
Profile Classification
The gradually varied flow profile classification is simply a combination of the slope classification and the zone classification. For example, a pipe with a hydraulically mild slope and flow in zone 1 would be considered a Mild-1 profile (M1 for short). The program will analyze most profile types, but will not analyze certain flow profile types that occur rarely in conventional sewer system such as H3, M3, and S3.
Bentley SewerCAD V8i User’s Guide 13-639
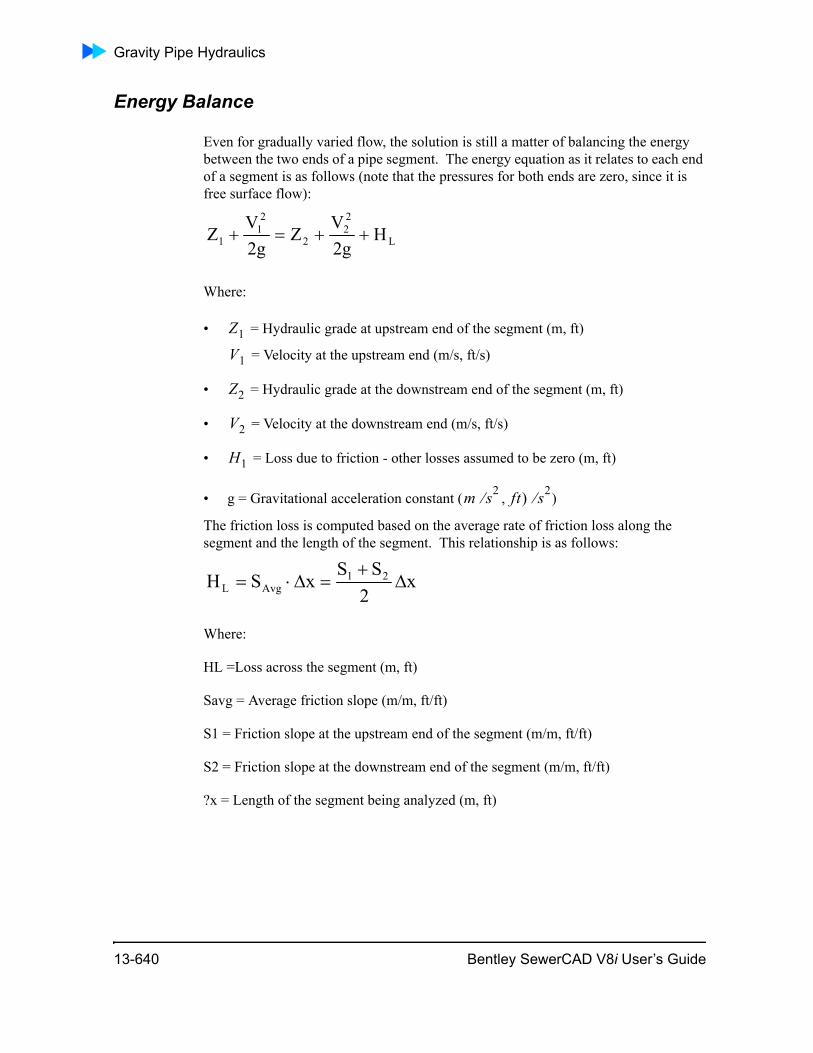
Gravity Pipe Hydraulics
Energy Balance
Even for gradually varied flow, the solution is still a matter of balancing the energy between the two ends of a pipe segment. The energy equation as it relates to each end of a segment is as follows (note that the pressures for both ends are zero, since it is free surface flow):
Where:
• = Hydraulic grade at upstream end of the segment (m, ft)
= Velocity at the upstream end (m/s, ft/s)
• = Hydraulic grade at the downstream end of the segment (m, ft)
• = Velocity at the downstream end (m/s, ft/s)
• = Loss due to friction - other losses assumed to be zero (m, ft)
• g = Gravitational acceleration constant ( , )
The friction loss is computed based on the average rate of friction loss along the segment and the length of the segment. This relationship is as follows:
Where:
HL =Loss across the segment (m, ft)
Savg = Average friction slope (m/m, ft/ft)
S1 = Friction slope at the upstream end of the segment (m/m, ft/ft)
S2 = Friction slope at the downstream end of the segment (m/m, ft/ft)
?x = Length of the segment being analyzed (m, ft)
L
22
2
21
1 Hg2
VZ
g2V
Z ++=+
Z1
V1
Z2
V2
H1
m s2⁄ ft) s2⁄
x2
SSxSH 21
AvgL ∆+
=∆⋅=
13-640 Bentley SewerCAD V8i User’s Guide
Theory
The conditions at one end of the segment are known through asinverttion or from a previous calculation step. Since the friction slope is a function of velocity, which is a function of depth, the depth at the other end of the segment can be found through iter-ation. There are two primary methods for this iterative solution, the Standard Step method and the Direct Step method.
Note: Because it generates better resolution within the changing part of the profile, the gravity flow algorithm of StormCAD and SewerCAD primarily use the direct step method to compute gradually varied flow profiles.
Standard Step Method
The standard step method of gradually varied flow energy balance involves dividing the channel into segments of known length and solving for the unknown depth at one end of the segment, starting with a known or assumed depth at the other end. The standard step method is the most popular method of determining the flow profile because it can be applied to any channel, not just prismatic channels.
Note: Because it generates better resolution within the changing part of the profile, the gravity flow algorithm of StormCAD and SewerCAD primarily use the direct step method to compute gradually varied flow profiles.
Direct Step Method
The direct step method is based on the same basic energy principles as the standard step method, but takes a slightly different approach towards the solution. Instead of assuming a segment length and solving for the depth at the end of the segment, the direct step method assumes a depth and then solves for the segment length.
Note: Because it generates better resolution within the changing part of the profile, the gravity flow algorithm of StormCAD and SewerCAD use the direct step method to compute gradually varied flow profiles.
Mixed Flow Profiles
Although the hydraulic slope of a pipe will be the same throughout its length, a pipe may contain several different profile types. The transitions that may be encountered include:
• Sealing (Surcharging) Conditions
• Rapidly Varied Flow (Hydraulic Jumps)
Bentley SewerCAD V8i User’s Guide 13-641
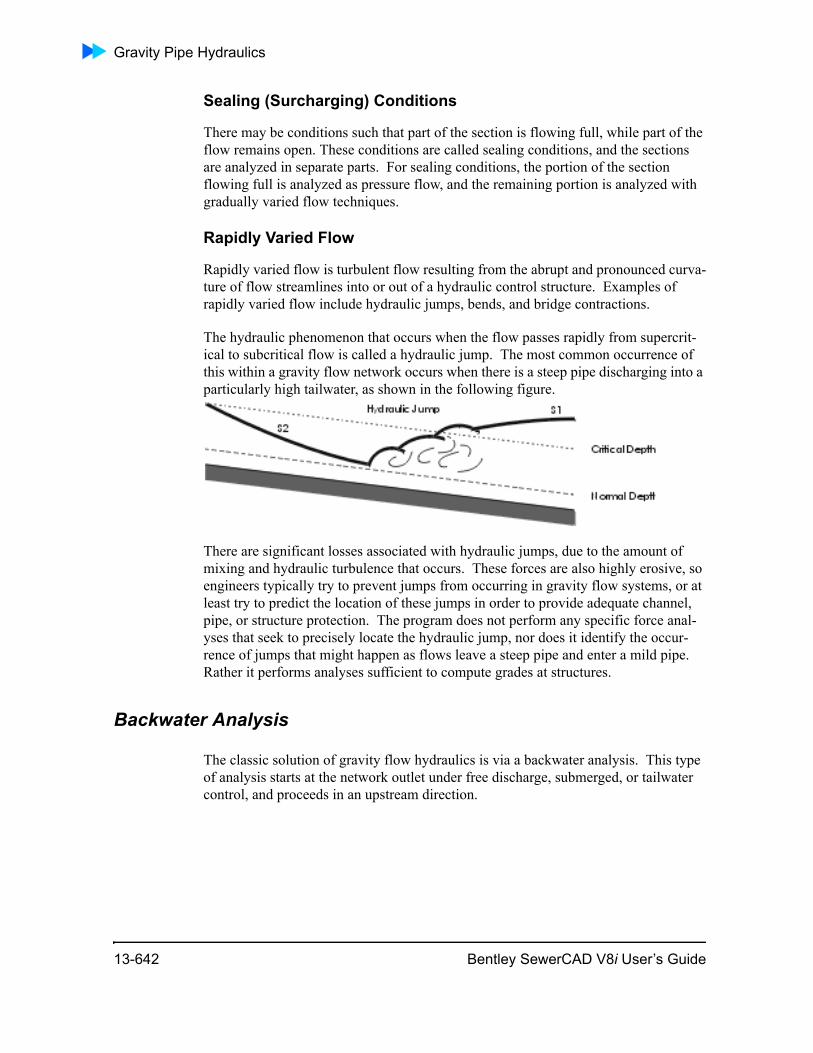
Gravity Pipe Hydraulics
Sealing (Surcharging) Conditions
There may be conditions such that part of the section is flowing full, while part of the flow remains open. These conditions are called sealing conditions, and the sections are analyzed in separate parts. For sealing conditions, the portion of the section flowing full is analyzed as pressure flow, and the remaining portion is analyzed with gradually varied flow techniques.
Rapidly Varied Flow
Rapidly varied flow is turbulent flow resulting from the abrupt and pronounced curva-ture of flow streamlines into or out of a hydraulic control structure. Examples of rapidly varied flow include hydraulic jumps, bends, and bridge contractions.
The hydraulic phenomenon that occurs when the flow passes rapidly from supercrit-ical to subcritical flow is called a hydraulic jump. The most common occurrence of this within a gravity flow network occurs when there is a steep pipe discharging into a particularly high tailwater, as shown in the following figure.
There are significant losses associated with hydraulic jumps, due to the amount of mixing and hydraulic turbulence that occurs. These forces are also highly erosive, so engineers typically try to prevent jumps from occurring in gravity flow systems, or at least try to predict the location of these jumps in order to provide adequate channel, pipe, or structure protection. The program does not perform any specific force anal-yses that seek to precisely locate the hydraulic jump, nor does it identify the occur-rence of jumps that might happen as flows leave a steep pipe and enter a mild pipe. Rather it performs analyses sufficient to compute grades at structures.
Backwater Analysis
The classic solution of gravity flow hydraulics is via a backwater analysis. This type of analysis starts at the network outlet under free discharge, submerged, or tailwater control, and proceeds in an upstream direction.
13-642 Bentley SewerCAD V8i User’s Guide
Theory
Steep pipes tend to "interrupt" the backwater analysis, and reset the hydraulic control to critical depth at the upstream end of the steep pipe. A frontwater analysis may be needed for a steep profile (such as an S2), with the backwater analysis recommencing from the upstream structure.
Free Outfall
This program lets you define the tailwater condition at the outlet as either Free Outfall, Crown Elevation or User-Specified.
For a pipe with a hydraulically steep slope, the Free Outfall condition will yield a starting depth equal to normal depth in the pipe. For a pipe with a hydraulically mild slope, the Free Outfall condition will yield a starting depth equal to critical depth. When an outlet has multiple incoming pipes, the Free Outfall condition yields a starting elevation equal to the lowest of the individual computed elevations.
The Crown condition should be used when the pipe discharges to an outlet where the water surface elevation is equal to the elevation of the top of the pipe.
Structure Flooding
Flooding at manholes in SewerCAD and inlets in StormCAD occurs whenever the elevation of water is above the structure rim elevation. When this occurs, the back-water analysis will continue by resetting the hydraulic grade to the structure rim eleva-tion or ground elevation, whichever is higher. However, if a structure is defined with a bolted cover, the hydraulic grade is not reset to the rim elevation.
In actual flooding situations, flows may be diverted away from the junction structure and out of the system, or attenuated due to surcharged storage. In this program, even though the governing downstream boundary for the next conduit is artificially lowered to prevent the propagation of an incorrect backwater, the peak discharges at the struc-ture are conserved and are not reduced by the occurrence of flooding at a junction.
Frontwater Analysis
The program will perform a frontwater analysis in a steep pipe operating under super-critical flow, since these pipes are typically entrance controlled. The hydraulic control is at the upstream end of the conduit, and the gradually varied flow analysis will proceed in a downstream direction until either the normal depth is achieved, a hydraulic jump occurs, or the end of the pipe is encountered.
The program's algorithm is fundamentally based on backwater analysis. As a result, a continuous frontwater analysis is not performed through two or more consecutive steep pipes.
Bentley SewerCAD V8i User’s Guide 13-643
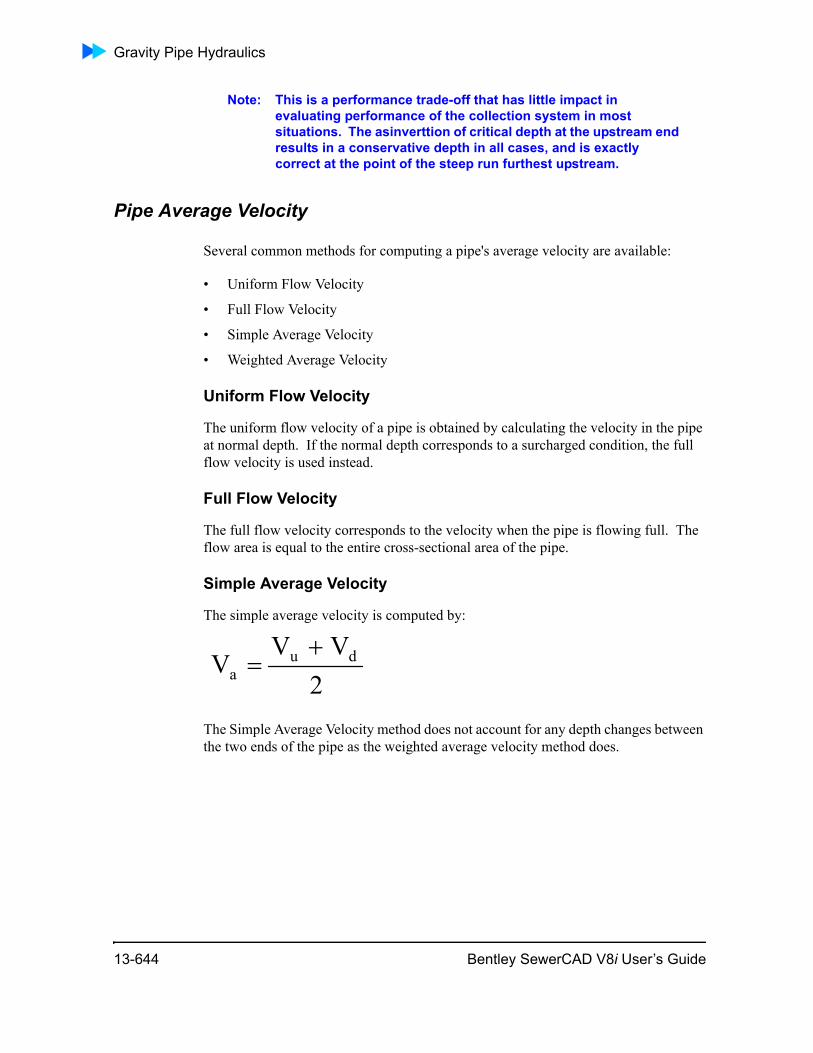
Gravity Pipe Hydraulics
Note: This is a performance trade-off that has little impact in evaluating performance of the collection system in most situations. The asinverttion of critical depth at the upstream end results in a conservative depth in all cases, and is exactly correct at the point of the steep run furthest upstream.
Pipe Average Velocity
Several common methods for computing a pipe's average velocity are available:
• Uniform Flow Velocity
• Full Flow Velocity
• Simple Average Velocity
• Weighted Average Velocity
Uniform Flow Velocity
The uniform flow velocity of a pipe is obtained by calculating the velocity in the pipe at normal depth. If the normal depth corresponds to a surcharged condition, the full flow velocity is used instead.
Full Flow Velocity
The full flow velocity corresponds to the velocity when the pipe is flowing full. The flow area is equal to the entire cross-sectional area of the pipe.
Simple Average Velocity
The simple average velocity is computed by:
The Simple Average Velocity method does not account for any depth changes between the two ends of the pipe as the weighted average velocity method does.
2VV
V dua
+=
13-644 Bentley SewerCAD V8i User’s Guide
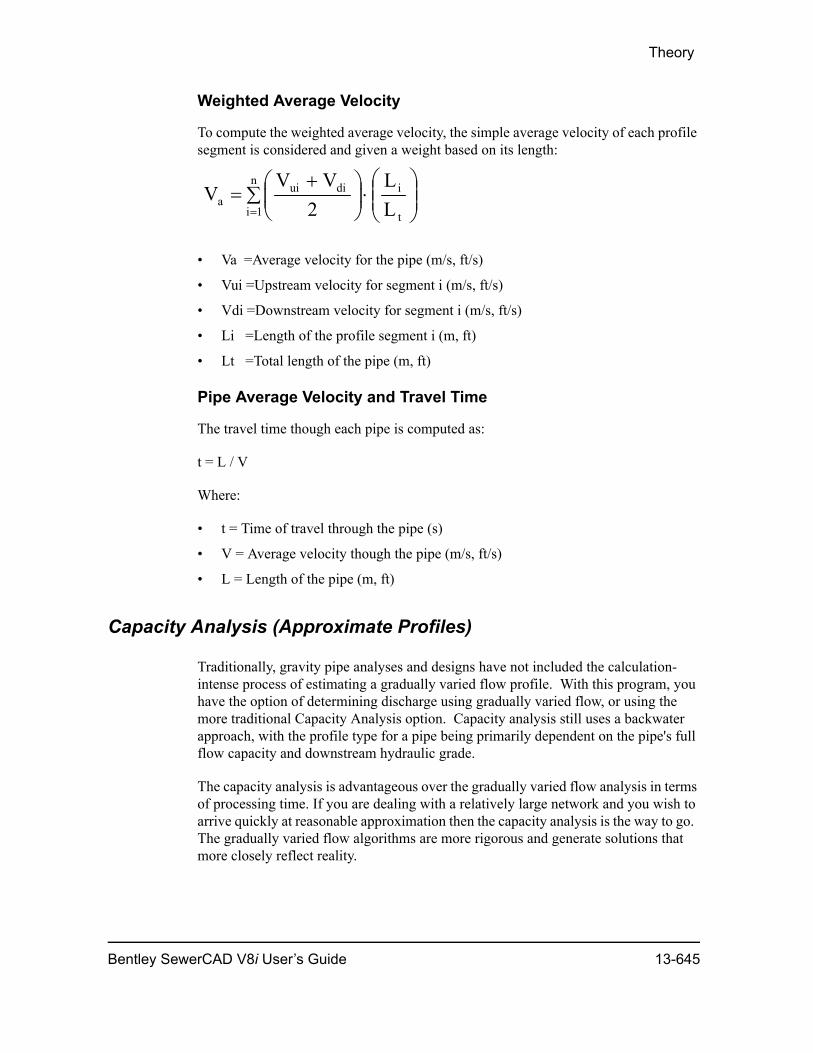
Theory
Weighted Average Velocity
To compute the weighted average velocity, the simple average velocity of each profile segment is considered and given a weight based on its length:
• Va =Average velocity for the pipe (m/s, ft/s)
• Vui =Upstream velocity for segment i (m/s, ft/s)
• Vdi =Downstream velocity for segment i (m/s, ft/s)
• Li =Length of the profile segment i (m, ft)
• Lt =Total length of the pipe (m, ft)
Pipe Average Velocity and Travel Time
The travel time though each pipe is computed as:
t = L / V
Where:
• t = Time of travel through the pipe (s)
• V = Average velocity though the pipe (m/s, ft/s)
• L = Length of the pipe (m, ft)
Capacity Analysis (Approximate Profiles)
Traditionally, gravity pipe analyses and designs have not included the calculation-intense process of estimating a gradually varied flow profile. With this program, you have the option of determining discharge using gradually varied flow, or using the more traditional Capacity Analysis option. Capacity analysis still uses a backwater approach, with the profile type for a pipe being primarily dependent on the pipe's full flow capacity and downstream hydraulic grade.
The capacity analysis is advantageous over the gradually varied flow analysis in terms of processing time. If you are dealing with a relatively large network and you wish to arrive quickly at reasonable approximation then the capacity analysis is the way to go. The gradually varied flow algorithms are more rigorous and generate solutions that more closely reflect reality.
∑ ⎟⎟⎠
⎞⎜⎜⎝
⎛⋅⎟⎟
⎠
⎞⎜⎜⎝
⎛ +=
=
n
1i t
idiuia L
L2
VVV
Bentley SewerCAD V8i User’s Guide 13-645
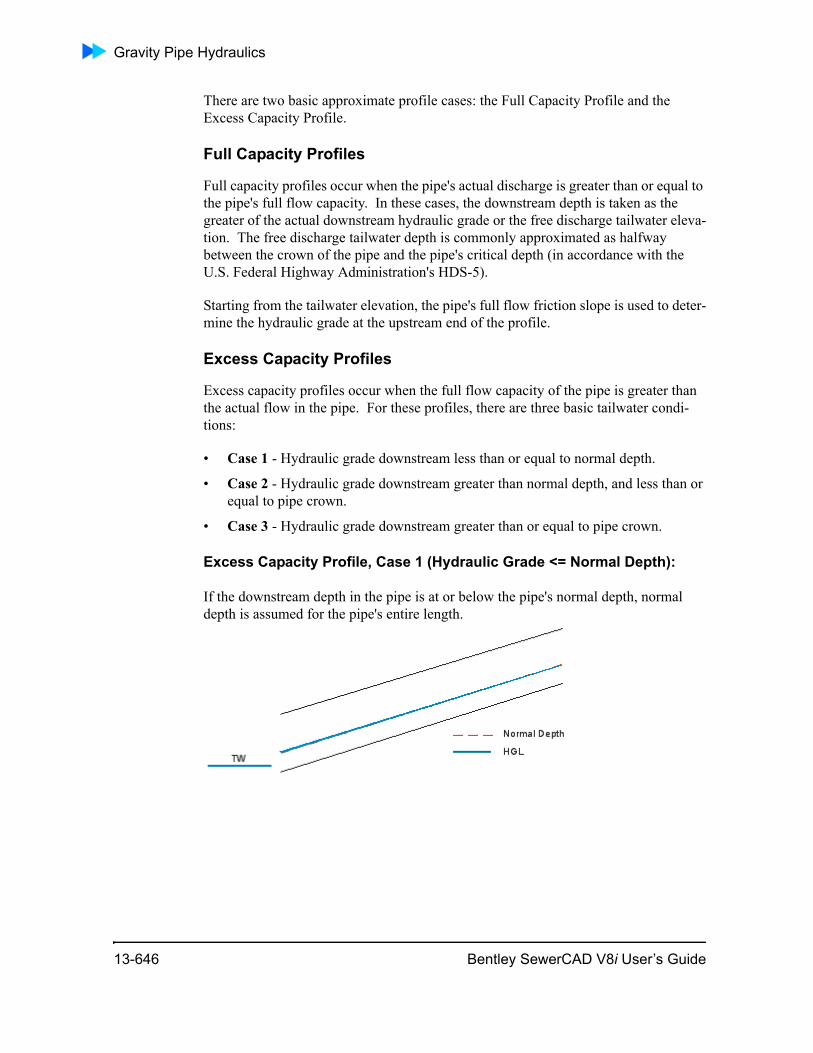
Gravity Pipe Hydraulics
There are two basic approximate profile cases: the Full Capacity Profile and the Excess Capacity Profile.
Full Capacity Profiles
Full capacity profiles occur when the pipe's actual discharge is greater than or equal to the pipe's full flow capacity. In these cases, the downstream depth is taken as the greater of the actual downstream hydraulic grade or the free discharge tailwater eleva-tion. The free discharge tailwater depth is commonly approximated as halfway between the crown of the pipe and the pipe's critical depth (in accordance with the U.S. Federal Highway Administration's HDS-5).
Starting from the tailwater elevation, the pipe's full flow friction slope is used to deter-mine the hydraulic grade at the upstream end of the profile.
Excess Capacity Profiles
Excess capacity profiles occur when the full flow capacity of the pipe is greater than the actual flow in the pipe. For these profiles, there are three basic tailwater condi-tions:
• Case 1 - Hydraulic grade downstream less than or equal to normal depth.
• Case 2 - Hydraulic grade downstream greater than normal depth, and less than or equal to pipe crown.
• Case 3 - Hydraulic grade downstream greater than or equal to pipe crown.
Excess Capacity Profile, Case 1 (Hydraulic Grade <= Normal Depth):
If the downstream depth in the pipe is at or below the pipe's normal depth, normal depth is assumed for the pipe's entire length.
13-646 Bentley SewerCAD V8i User’s Guide
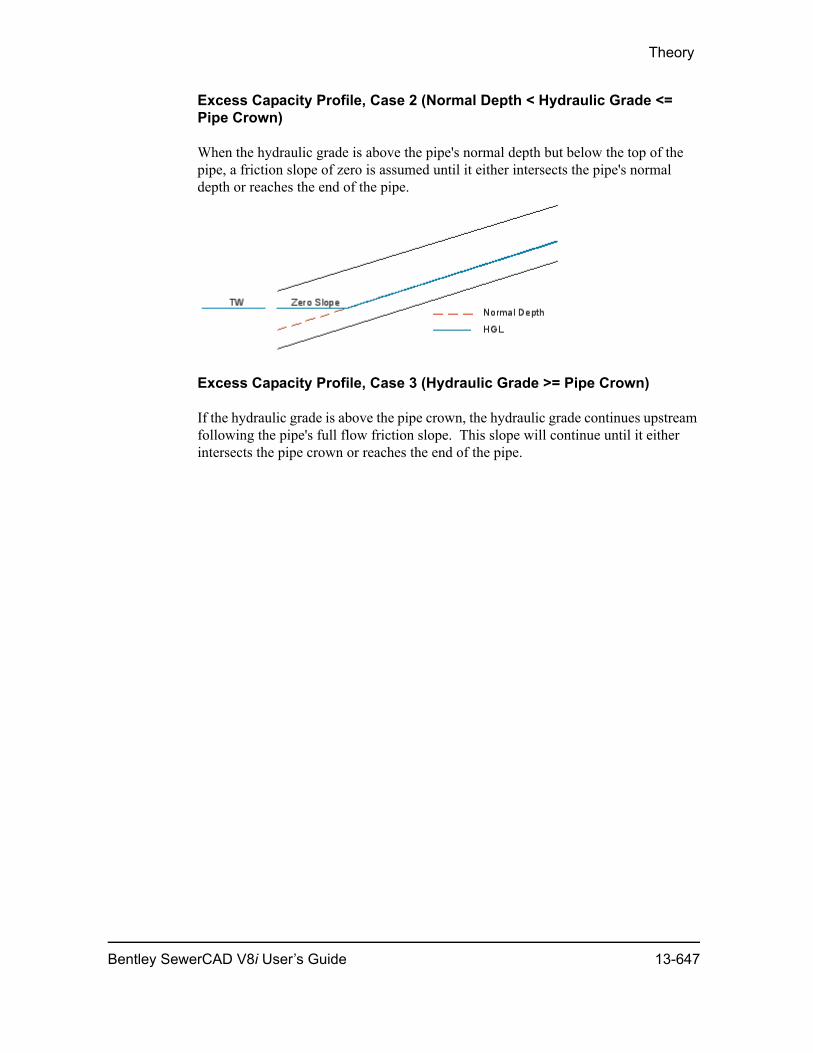
Theory
Excess Capacity Profile, Case 2 (Normal Depth < Hydraulic Grade <= Pipe Crown)
When the hydraulic grade is above the pipe's normal depth but below the top of the pipe, a friction slope of zero is assumed until it either intersects the pipe's normal depth or reaches the end of the pipe.
Excess Capacity Profile, Case 3 (Hydraulic Grade >= Pipe Crown)
If the hydraulic grade is above the pipe crown, the hydraulic grade continues upstream following the pipe's full flow friction slope. This slope will continue until it either intersects the pipe crown or reaches the end of the pipe.
Bentley SewerCAD V8i User’s Guide 13-647

Junction Headlosses and Minor Losses
Note: If the full friction slope intersects the crown of the pipe, the profile will continue with a Case 2 profile analysis.
Composite Excess Capacity Profiles
An excess capacity profile may actually be a composite of two more simple profiles. Consider the case below, where the tailwater is above the crown of the pipe. In this case, the profile begins as a Case 3 profile. Where the full flow friction slope inter-sects the crown of the pipe, the profile changes to a Case 2 profile, following a flat slope until it reaches normal depth. Where normal depth is intersected, a Case 1 profile begins, extending all the way to the upstream end of the pipe.
Junction Headlosses and Minor LossesJunction headlosses and minor losses are discussed in the following topics:
“Manhole Head Loss Equations (AASHTO/HEC-2 Overview)” on page 13-649“Junc-tion Headlosses” on page 13-649
“Junction Headlosses” on page 13-649
“Minor Losses” on page 13-660
13-648 Bentley SewerCAD V8i User’s Guide

Theory
Manhole Head Loss Equations (AASHTO/HEC-2 Overview)
The ‘HEC-22’ headloss method used in SewerCAD is based on the FHWA’s Urban Drainage Design Manual, Hydraulic Engineering Circular No. 22 (HEC-22) energy-loss methodology. This method computes an adjusted headloss coefficient by multi-plying the initial headloss coefficient by correction factors for diameter, flow depth, relative flow, plunging flow and benching (“Headloss-HEC-22 Energy Method” on page 13-651). This adjusted headloss coefficient is then multiplied by the velocity head in the outlet pipe to determine the total junction headloss. This is the method outlined in the current edition of the HEC-22 document (HEC-22, Second Edition, August 2001).
The ‘AASHTO’ headloss method used in SewerCAD was originally implemented based on the 1991 version of the AASHTO Model Drainage Manual. This method determines the total junction headloss by adding the contraction, bend and expansion losses at a junction, then applying correction factors for non-piped flow and shaping if applicable (“Headloss - AASHTO Method” on page 13-656). More recently, the AASHTO Model Drainage Manual has dropped this method in favor of the method described in HEC-22, Second Edition (August 2001). However for compatibility with earlier versions of SewerCAD, and also with the various state and regional drainage authorities who continue to use the original AASHTO headloss method, the ‘AASHTO’ headloss method in SewerCAD is still based on the 1991 version of the AASHTO Model Drainage Manual.
Junction Headlosses
Junction headlosses includes the following:
“Structure Headloss” on page 13-649
“Special Assumptions” on page 13-652
Structure Headloss
When water flows through a junction structure, there are headlosses associated with mixing, change of direction, and so forth. This section deals with the computation of these losses based on the following popular methods:
• Absolute
• Standard
• HEC-22 Energy
• Generic
• Flow-Headloss Curve
Bentley SewerCAD V8i User’s Guide 13-649
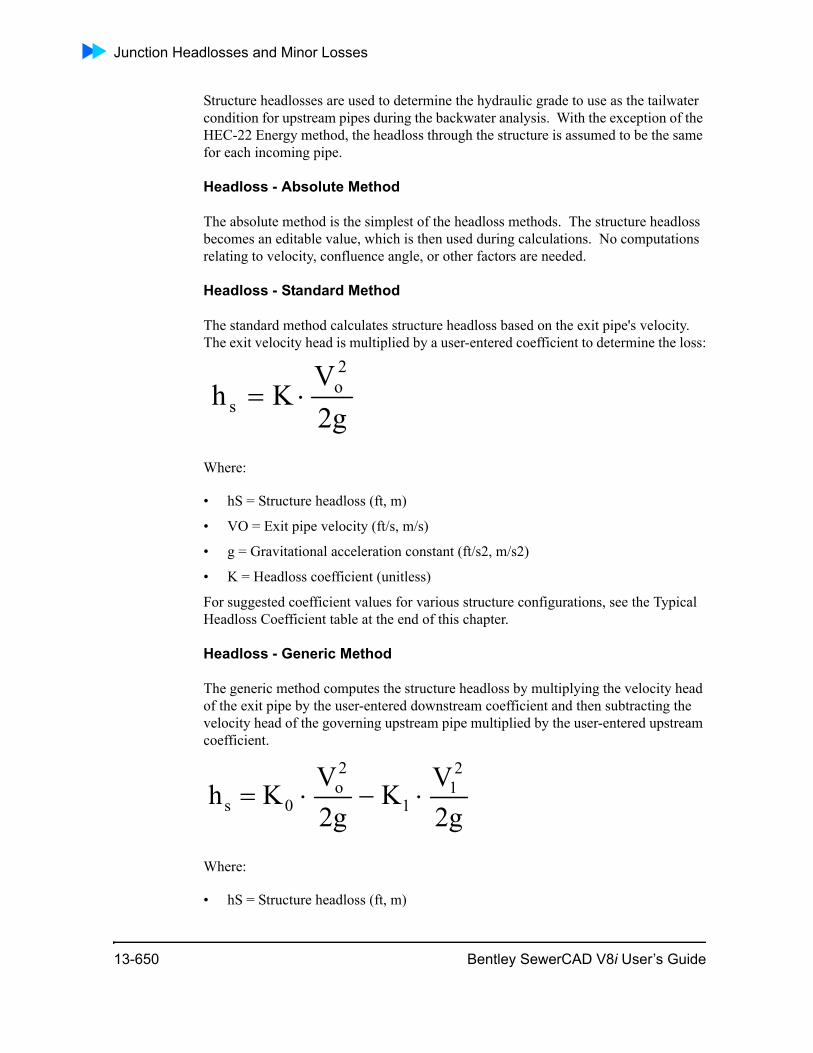
Junction Headlosses and Minor Losses
Structure headlosses are used to determine the hydraulic grade to use as the tailwater condition for upstream pipes during the backwater analysis. With the exception of the HEC-22 Energy method, the headloss through the structure is assumed to be the same for each incoming pipe.
Headloss - Absolute Method
The absolute method is the simplest of the headloss methods. The structure headloss becomes an editable value, which is then used during calculations. No computations relating to velocity, confluence angle, or other factors are needed.
Headloss - Standard Method
The standard method calculates structure headloss based on the exit pipe's velocity. The exit velocity head is multiplied by a user-entered coefficient to determine the loss:
Where:
• hS = Structure headloss (ft, m)
• VO = Exit pipe velocity (ft/s, m/s)
• g = Gravitational acceleration constant (ft/s2, m/s2)
• K = Headloss coefficient (unitless)
For suggested coefficient values for various structure configurations, see the Typical Headloss Coefficient table at the end of this chapter.
Headloss - Generic Method
The generic method computes the structure headloss by multiplying the velocity head of the exit pipe by the user-entered downstream coefficient and then subtracting the velocity head of the governing upstream pipe multiplied by the user-entered upstream coefficient.
Where:
• hS = Structure headloss (ft, m)
g2V
Kh2o
s ⋅=
g2VK
g2VKh
21
1
2o
0s ⋅−⋅=
13-650 Bentley SewerCAD V8i User’s Guide
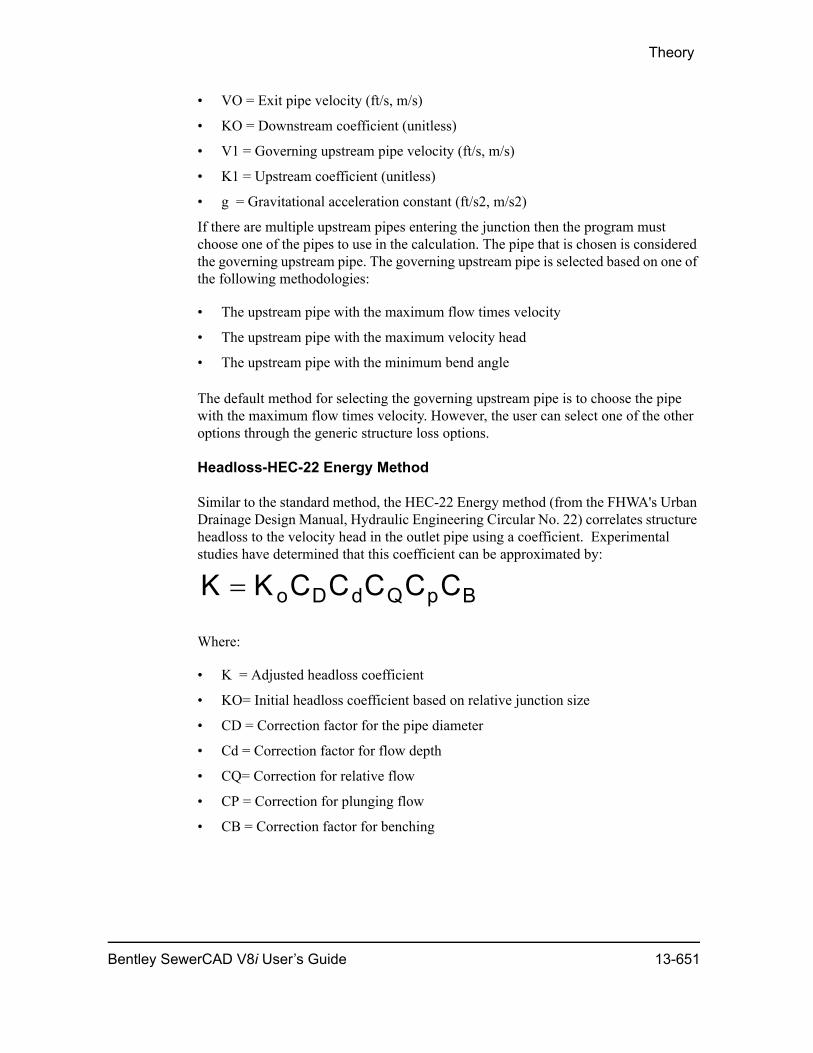
Theory
• VO = Exit pipe velocity (ft/s, m/s)
• KO = Downstream coefficient (unitless)
• V1 = Governing upstream pipe velocity (ft/s, m/s)
• K1 = Upstream coefficient (unitless)
• g = Gravitational acceleration constant (ft/s2, m/s2)
If there are multiple upstream pipes entering the junction then the program must choose one of the pipes to use in the calculation. The pipe that is chosen is considered the governing upstream pipe. The governing upstream pipe is selected based on one of the following methodologies:
• The upstream pipe with the maximum flow times velocity
• The upstream pipe with the maximum velocity head
• The upstream pipe with the minimum bend angle
The default method for selecting the governing upstream pipe is to choose the pipe with the maximum flow times velocity. However, the user can select one of the other options through the generic structure loss options.
Headloss-HEC-22 Energy Method
Similar to the standard method, the HEC-22 Energy method (from the FHWA's Urban Drainage Design Manual, Hydraulic Engineering Circular No. 22) correlates structure headloss to the velocity head in the outlet pipe using a coefficient. Experimental studies have determined that this coefficient can be approximated by:
Where:
• K = Adjusted headloss coefficient
• KO= Initial headloss coefficient based on relative junction size
• CD = Correction factor for the pipe diameter
• Cd = Correction factor for flow depth
• CQ= Correction for relative flow
• CP = Correction for plunging flow
• CB = Correction factor for benching
BpQdDo CCCCCKK =
Bentley SewerCAD V8i User’s Guide 13-651
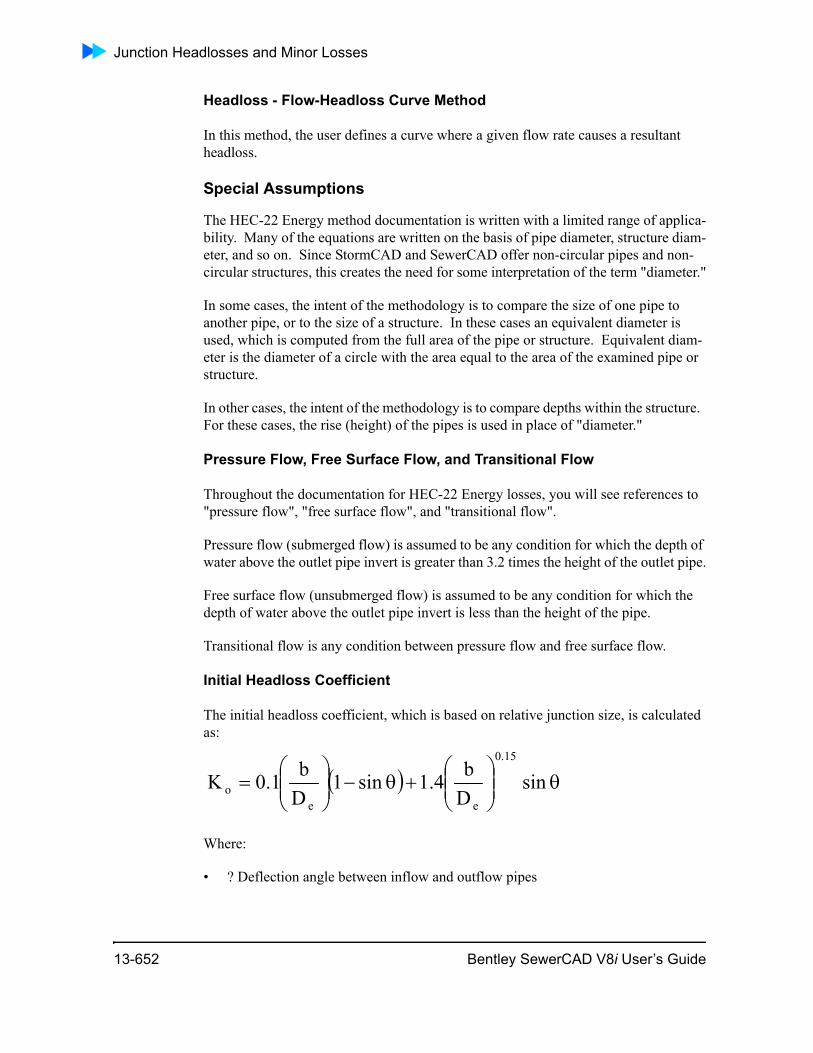
Junction Headlosses and Minor Losses
Headloss - Flow-Headloss Curve Method
In this method, the user defines a curve where a given flow rate causes a resultant headloss.
Special Assumptions
The HEC-22 Energy method documentation is written with a limited range of applica-bility. Many of the equations are written on the basis of pipe diameter, structure diam-eter, and so on. Since StormCAD and SewerCAD offer non-circular pipes and non-circular structures, this creates the need for some interpretation of the term "diameter."
In some cases, the intent of the methodology is to compare the size of one pipe to another pipe, or to the size of a structure. In these cases an equivalent diameter is used, which is computed from the full area of the pipe or structure. Equivalent diam-eter is the diameter of a circle with the area equal to the area of the examined pipe or structure.
In other cases, the intent of the methodology is to compare depths within the structure. For these cases, the rise (height) of the pipes is used in place of "diameter."
Pressure Flow, Free Surface Flow, and Transitional Flow
Throughout the documentation for HEC-22 Energy losses, you will see references to "pressure flow", "free surface flow", and "transitional flow".
Pressure flow (submerged flow) is assumed to be any condition for which the depth of water above the outlet pipe invert is greater than 3.2 times the height of the outlet pipe.
Free surface flow (unsubmerged flow) is assumed to be any condition for which the depth of water above the outlet pipe invert is less than the height of the pipe.
Transitional flow is any condition between pressure flow and free surface flow.
Initial Headloss Coefficient
The initial headloss coefficient, which is based on relative junction size, is calculated as:
Where:
• ? Deflection angle between inflow and outflow pipes
( ) θ⎟⎟⎠
⎞⎜⎜⎝
⎛+θ−⎟⎟
⎠
⎞⎜⎜⎝
⎛= sin
Db4.1sin1
Db1.0K
15.0
eeo
13-652 Bentley SewerCAD V8i User’s Guide
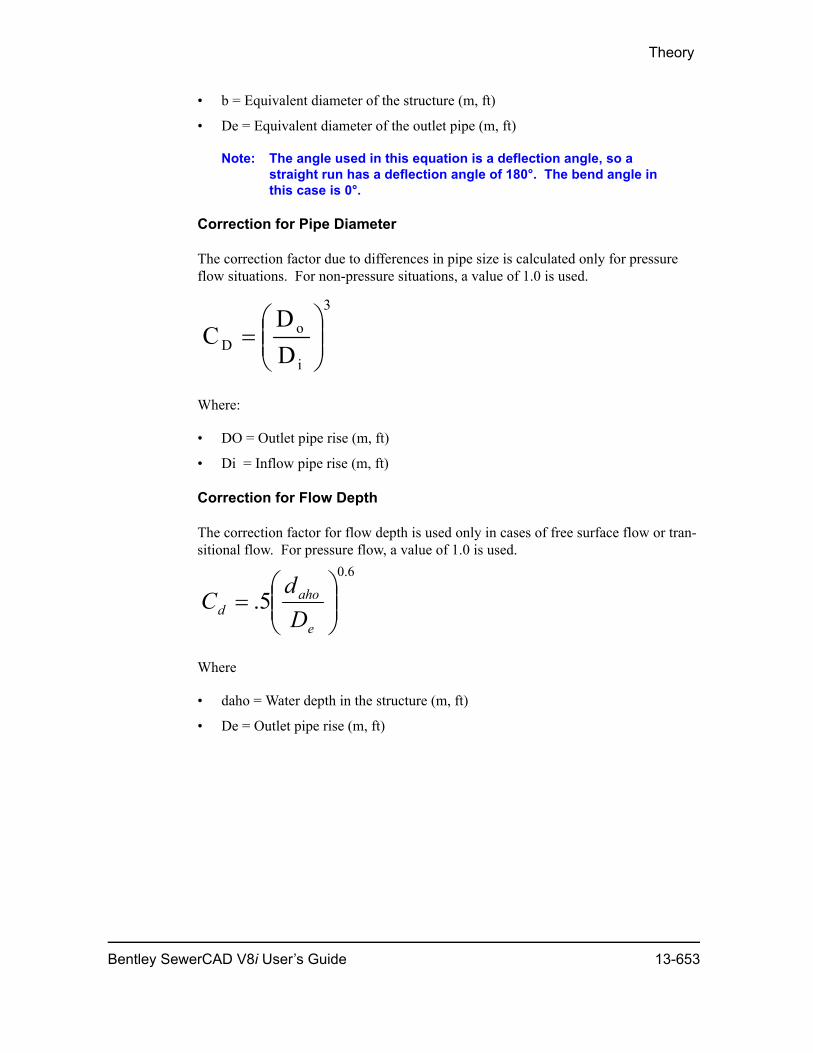
Theory
• b = Equivalent diameter of the structure (m, ft)
• De = Equivalent diameter of the outlet pipe (m, ft)
Note: The angle used in this equation is a deflection angle, so a straight run has a deflection angle of 180°. The bend angle in this case is 0°.
Correction for Pipe Diameter
The correction factor due to differences in pipe size is calculated only for pressure flow situations. For non-pressure situations, a value of 1.0 is used.
Where:
• DO = Outlet pipe rise (m, ft)
• Di = Inflow pipe rise (m, ft)
Correction for Flow Depth
The correction factor for flow depth is used only in cases of free surface flow or tran-sitional flow. For pressure flow, a value of 1.0 is used.
Where
• daho = Water depth in the structure (m, ft)
• De = Outlet pipe rise (m, ft)
3
i
oD D
DC ⎟⎟
⎠
⎞⎜⎜⎝
⎛=
6.0
5. ⎟⎟⎠
⎞⎜⎜⎝
⎛=
e
ahod D
dC
Bentley SewerCAD V8i User’s Guide 13-653
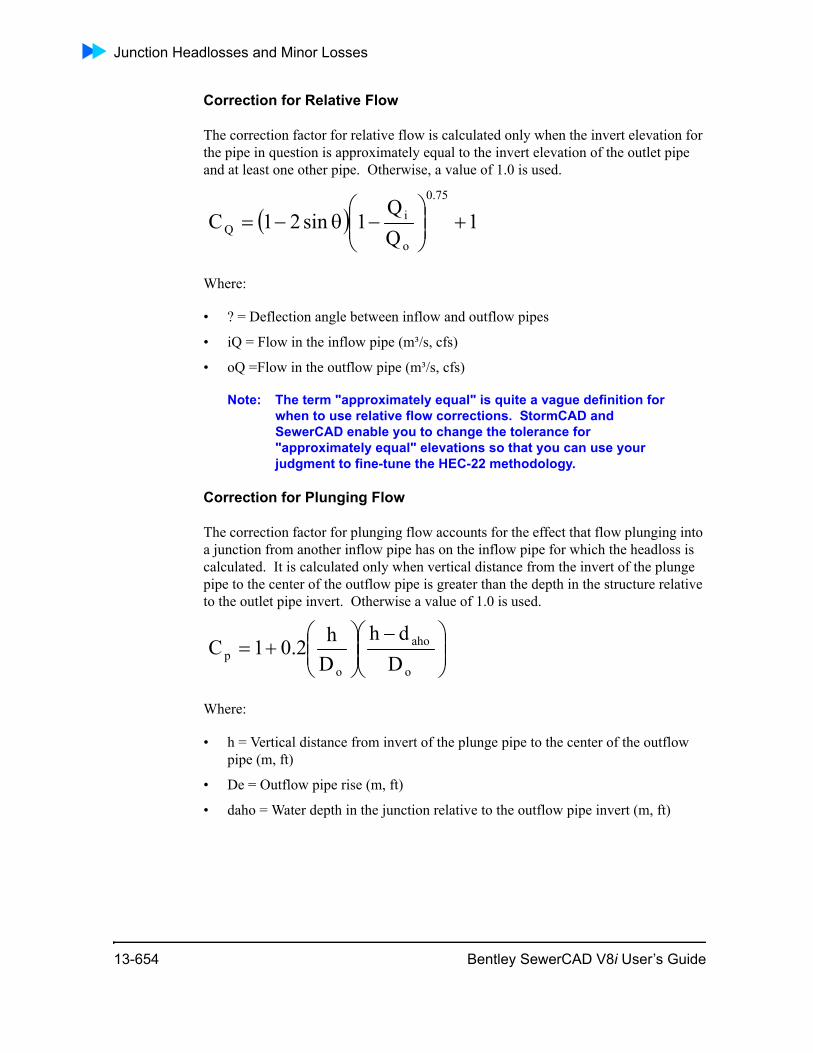
Junction Headlosses and Minor Losses
Correction for Relative Flow
The correction factor for relative flow is calculated only when the invert elevation for the pipe in question is approximately equal to the invert elevation of the outlet pipe and at least one other pipe. Otherwise, a value of 1.0 is used.
Where:
• ? = Deflection angle between inflow and outflow pipes
• iQ = Flow in the inflow pipe (m³/s, cfs)
• oQ =Flow in the outflow pipe (m³/s, cfs)
Note: The term "approximately equal" is quite a vague definition for when to use relative flow corrections. StormCAD and SewerCAD enable you to change the tolerance for "approximately equal" elevations so that you can use your judgment to fine-tune the HEC-22 methodology.
Correction for Plunging Flow
The correction factor for plunging flow accounts for the effect that flow plunging into a junction from another inflow pipe has on the inflow pipe for which the headloss is calculated. It is calculated only when vertical distance from the invert of the plunge pipe to the center of the outflow pipe is greater than the depth in the structure relative to the outlet pipe invert. Otherwise a value of 1.0 is used.
Where:
• h = Vertical distance from invert of the plunge pipe to the center of the outflow pipe (m, ft)
• De = Outflow pipe rise (m, ft)
• daho = Water depth in the junction relative to the outflow pipe invert (m, ft)
( ) 1QQ
1sin21C75.0
o
iQ +⎟⎟
⎠
⎞⎜⎜⎝
⎛−θ−=
⎟⎟⎠
⎞⎜⎜⎝
⎛ −⎟⎟⎠
⎞⎜⎜⎝
⎛+=
o
aho
op D
dhDh2.01C
13-654 Bentley SewerCAD V8i User’s Guide
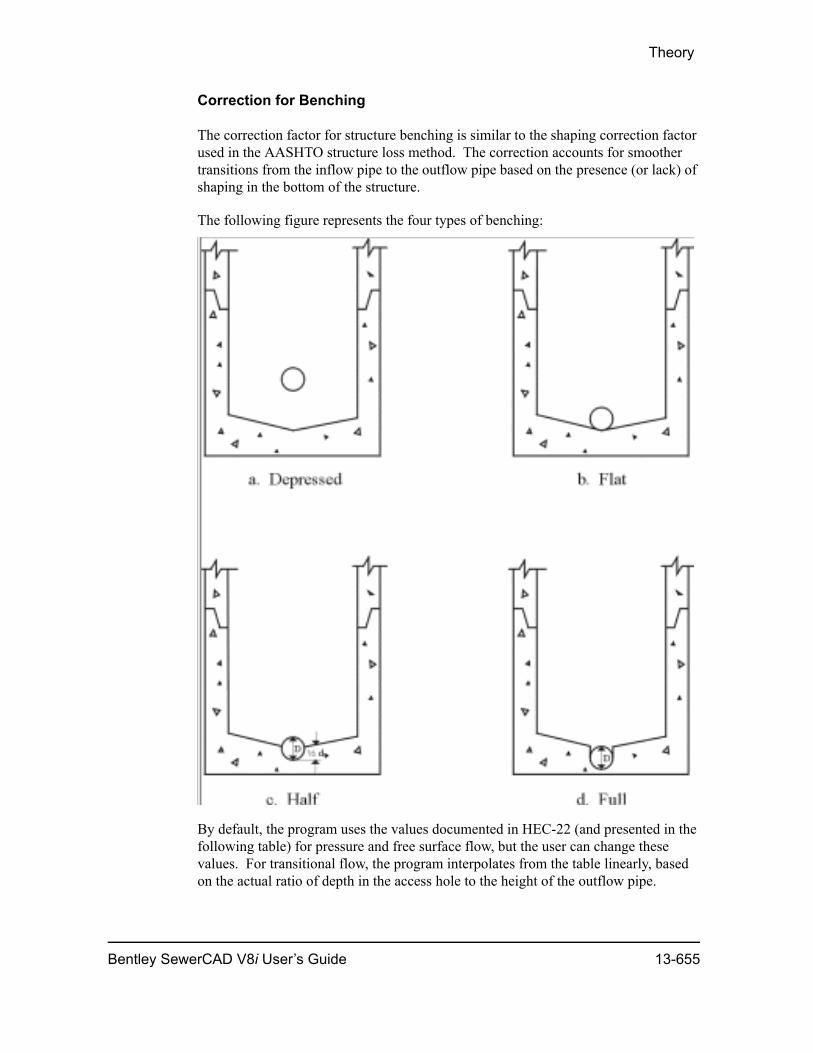
Theory
Correction for Benching
The correction factor for structure benching is similar to the shaping correction factor used in the AASHTO structure loss method. The correction accounts for smoother transitions from the inflow pipe to the outflow pipe based on the presence (or lack) of shaping in the bottom of the structure.
The following figure represents the four types of benching:
By default, the program uses the values documented in HEC-22 (and presented in the following table) for pressure and free surface flow, but the user can change these values. For transitional flow, the program interpolates from the table linearly, based on the actual ratio of depth in the access hole to the height of the outflow pipe.
Bentley SewerCAD V8i User’s Guide 13-655
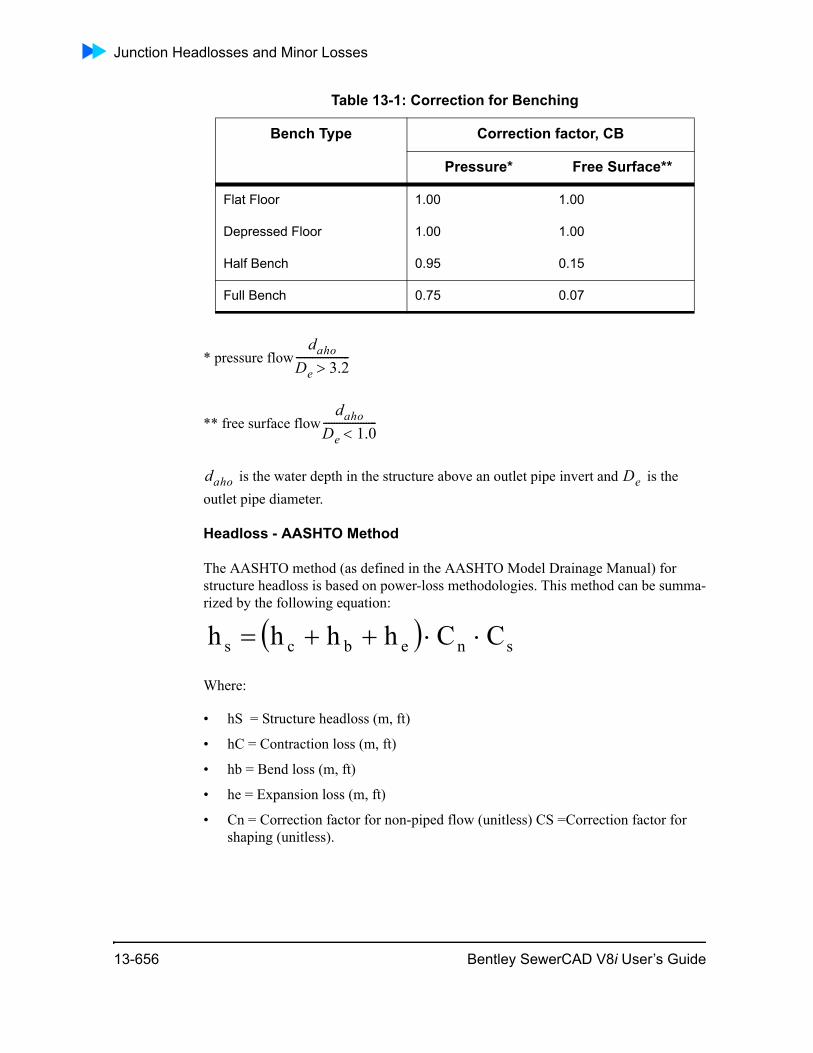
Junction Headlosses and Minor Losses
* pressure flow
** free surface flow
is the water depth in the structure above an outlet pipe invert and is the outlet pipe diameter.
Headloss - AASHTO Method
The AASHTO method (as defined in the AASHTO Model Drainage Manual) for structure headloss is based on power-loss methodologies. This method can be summa-rized by the following equation:
Where:
• hS = Structure headloss (m, ft)
• hC = Contraction loss (m, ft)
• hb = Bend loss (m, ft)
• he = Expansion loss (m, ft)
• Cn = Correction factor for non-piped flow (unitless) CS =Correction factor for shaping (unitless).
Table 13-1: Correction for Benching
Bench Type Correction factor, CB
Pressure* Free Surface**
Flat Floor 1.00 1.00
Depressed Floor 1.00 1.00
Half Bench 0.95 0.15
Full Bench 0.75 0.07
dahoDe 3.2>--------------------
dahoDe 1.0<--------------------
daho De
( ) snebcs CChhhh ⋅⋅++=
13-656 Bentley SewerCAD V8i User’s Guide
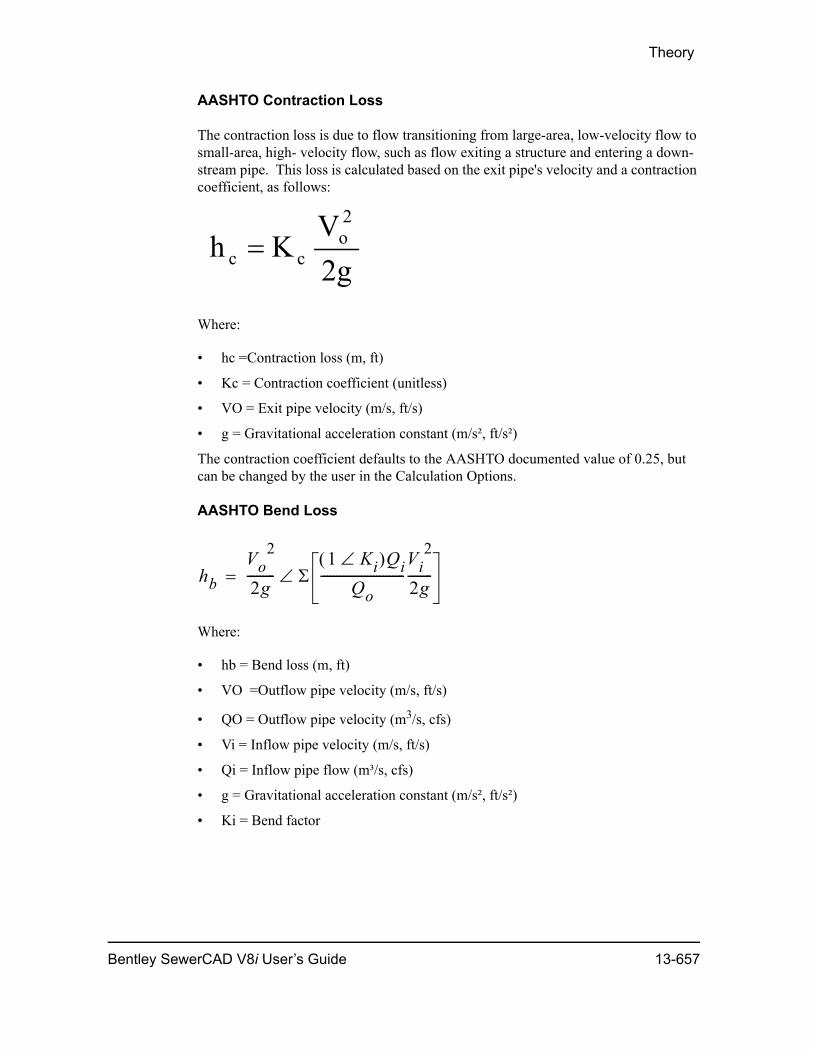
Theory
AASHTO Contraction Loss
The contraction loss is due to flow transitioning from large-area, low-velocity flow to small-area, high- velocity flow, such as flow exiting a structure and entering a down-stream pipe. This loss is calculated based on the exit pipe's velocity and a contraction coefficient, as follows:
Where:
• hc =Contraction loss (m, ft)
• Kc = Contraction coefficient (unitless)
• VO = Exit pipe velocity (m/s, ft/s)
• g = Gravitational acceleration constant (m/s², ft/s²)
The contraction coefficient defaults to the AASHTO documented value of 0.25, but can be changed by the user in the Calculation Options.
AASHTO Bend Loss
Where:
• hb = Bend loss (m, ft)
• VO =Outflow pipe velocity (m/s, ft/s)
• QO = Outflow pipe velocity (m3/s, cfs)
• Vi = Inflow pipe velocity (m/s, ft/s)
• Qi = Inflow pipe flow (m³/s, cfs)
• g = Gravitational acceleration constant (m/s², ft/s²)
• Ki = Bend factor
g2V
Kh2o
cc =
hbVo
2
2g--------- Σ
1 Ki∠( )QiQo
---------------------------Vi
2
2g--------∠=
Bentley SewerCAD V8i User’s Guide 13-657
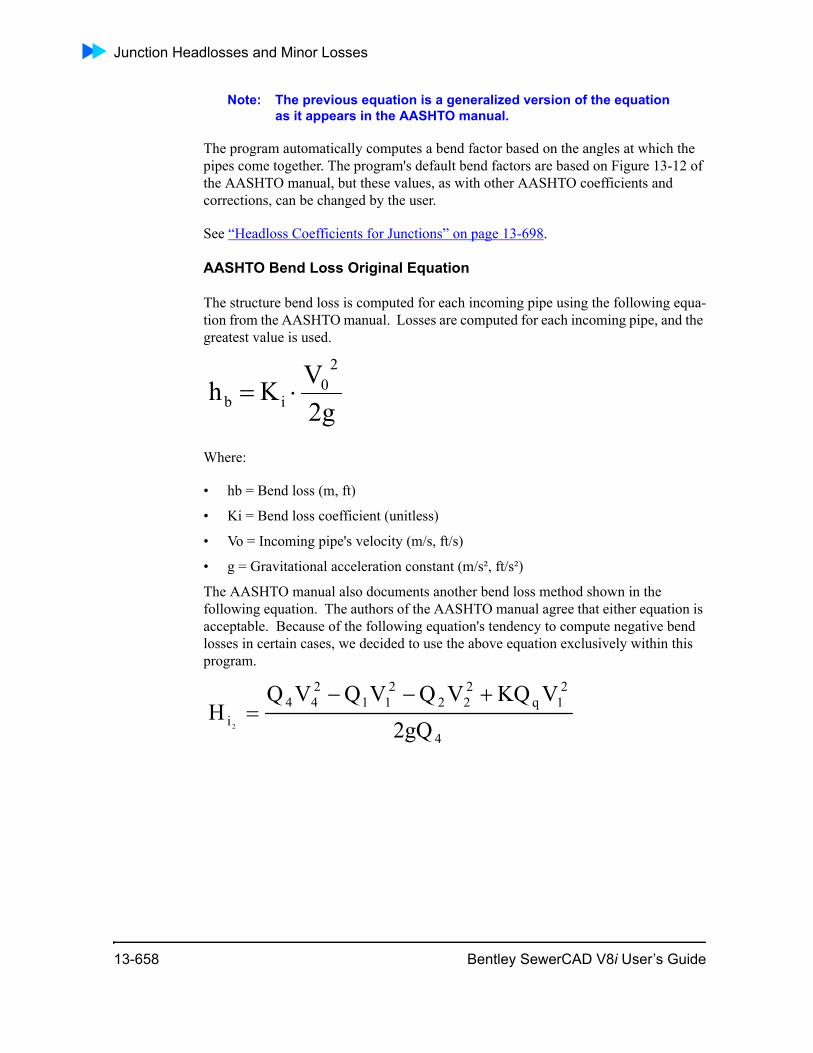
Junction Headlosses and Minor Losses
Note: The previous equation is a generalized version of the equation as it appears in the AASHTO manual.
The program automatically computes a bend factor based on the angles at which the pipes come together. The program's default bend factors are based on Figure 13-12 of the AASHTO manual, but these values, as with other AASHTO coefficients and corrections, can be changed by the user.
See “Headloss Coefficients for Junctions” on page 13-698.
AASHTO Bend Loss Original Equation
The structure bend loss is computed for each incoming pipe using the following equa-tion from the AASHTO manual. Losses are computed for each incoming pipe, and the greatest value is used.
Where:
• hb = Bend loss (m, ft)
• Ki = Bend loss coefficient (unitless)
• Vo = Incoming pipe's velocity (m/s, ft/s)
• g = Gravitational acceleration constant (m/s², ft/s²)
The AASHTO manual also documents another bend loss method shown in the following equation. The authors of the AASHTO manual agree that either equation is acceptable. Because of the following equation's tendency to compute negative bend losses in certain cases, we decided to use the above equation exclusively within this program.
g2VK h
20
ib ⋅=
4
21q
222
211
244
i gQ2VKQVQVQVQ
H2
+−−=
13-658 Bentley SewerCAD V8i User’s Guide
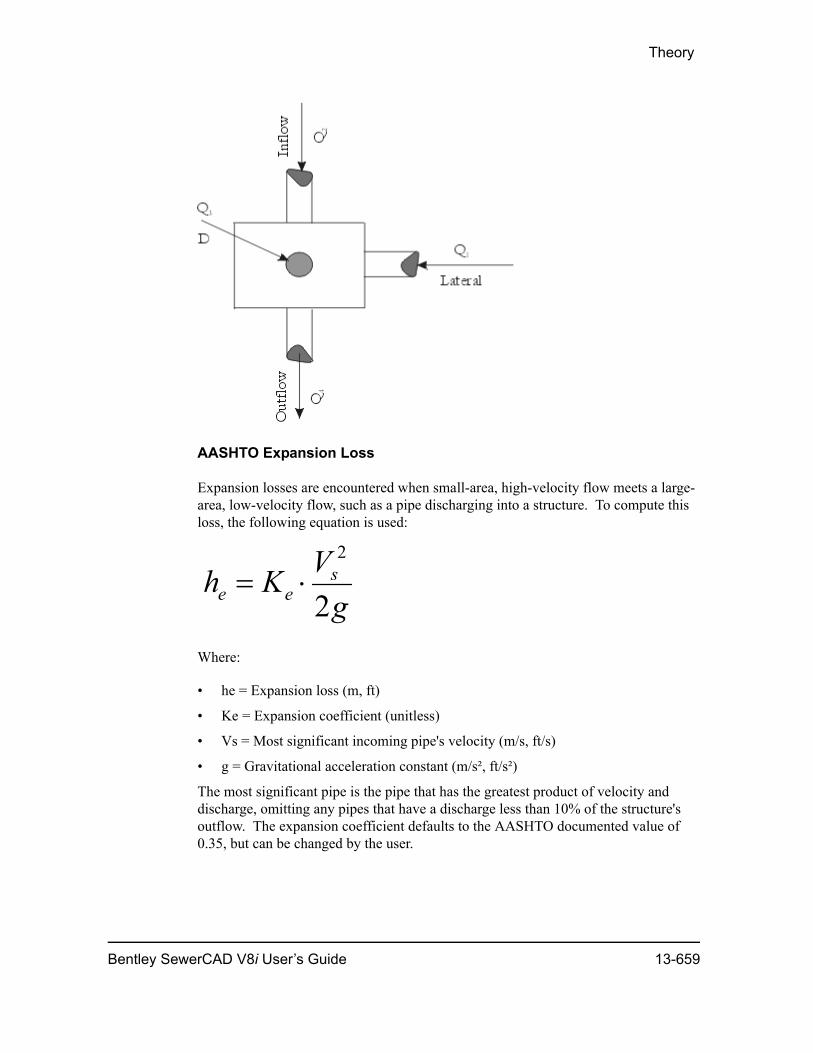
Theory
AASHTO Expansion Loss
Expansion losses are encountered when small-area, high-velocity flow meets a large-area, low-velocity flow, such as a pipe discharging into a structure. To compute this loss, the following equation is used:
Where:
• he = Expansion loss (m, ft)
• Ke = Expansion coefficient (unitless)
• Vs = Most significant incoming pipe's velocity (m/s, ft/s)
• g = Gravitational acceleration constant (m/s², ft/s²)
The most significant pipe is the pipe that has the greatest product of velocity and discharge, omitting any pipes that have a discharge less than 10% of the structure's outflow. The expansion coefficient defaults to the AASHTO documented value of 0.35, but can be changed by the user.
gVKh s
ee 2
2
⋅=
Bentley SewerCAD V8i User’s Guide 13-659
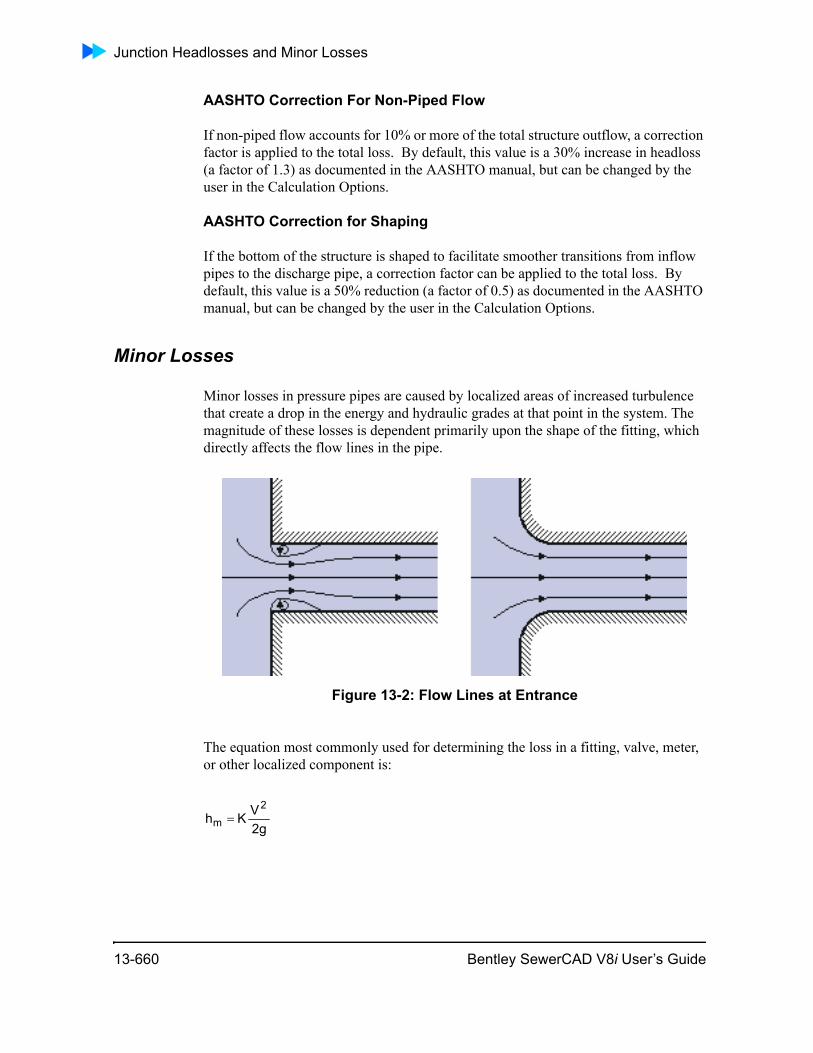
Junction Headlosses and Minor Losses
AASHTO Correction For Non-Piped Flow
If non-piped flow accounts for 10% or more of the total structure outflow, a correction factor is applied to the total loss. By default, this value is a 30% increase in headloss (a factor of 1.3) as documented in the AASHTO manual, but can be changed by the user in the Calculation Options.
AASHTO Correction for Shaping
If the bottom of the structure is shaped to facilitate smoother transitions from inflow pipes to the discharge pipe, a correction factor can be applied to the total loss. By default, this value is a 50% reduction (a factor of 0.5) as documented in the AASHTO manual, but can be changed by the user in the Calculation Options.
Minor Losses
Minor losses in pressure pipes are caused by localized areas of increased turbulence that create a drop in the energy and hydraulic grades at that point in the system. The magnitude of these losses is dependent primarily upon the shape of the fitting, which directly affects the flow lines in the pipe.
Figure 13-2: Flow Lines at Entrance
The equation most commonly used for determining the loss in a fitting, valve, meter, or other localized component is:
2gVKh
2m =
13-660 Bentley SewerCAD V8i User’s Guide
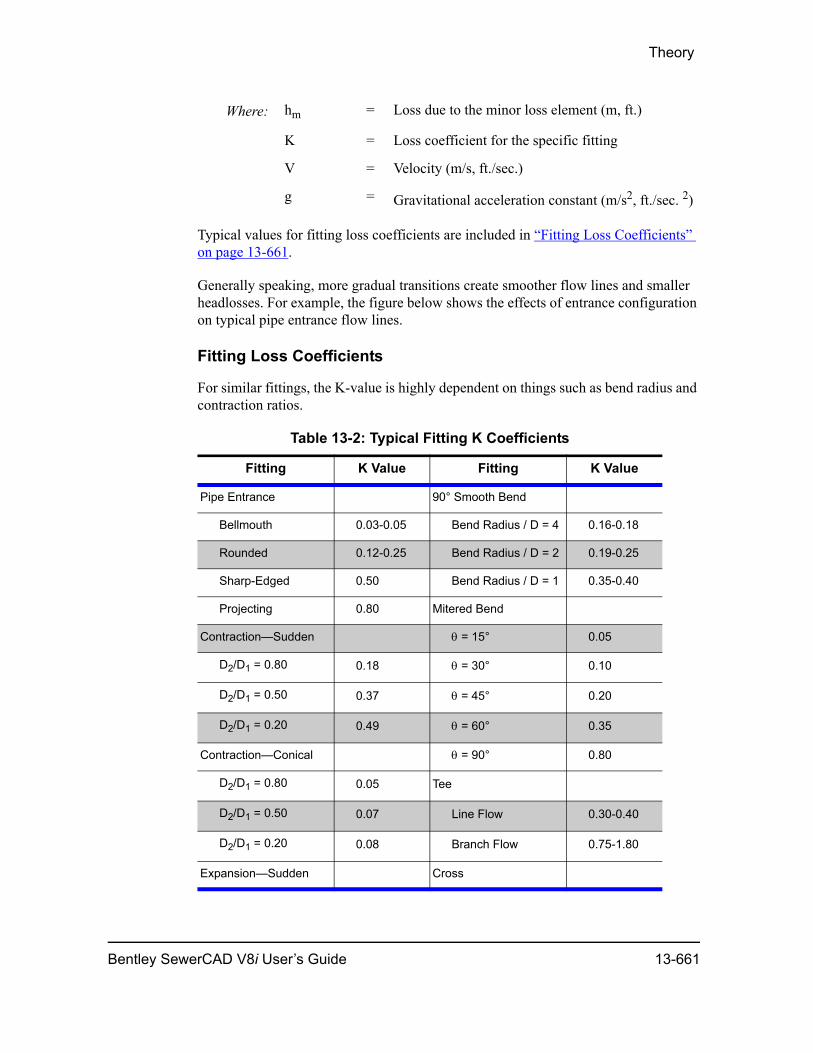
Theory
Typical values for fitting loss coefficients are included in “Fitting Loss Coefficients” on page 13-661.
Generally speaking, more gradual transitions create smoother flow lines and smaller headlosses. For example, the figure below shows the effects of entrance configuration on typical pipe entrance flow lines.
Fitting Loss Coefficients
For similar fittings, the K-value is highly dependent on things such as bend radius and contraction ratios.
Where: hm = Loss due to the minor loss element (m, ft.)
K = Loss coefficient for the specific fitting
V = Velocity (m/s, ft./sec.)
g = Gravitational acceleration constant (m/s2, ft./sec. 2)
Table 13-2: Typical Fitting K Coefficients
Fitting K Value Fitting K Value
Pipe Entrance 90° Smooth Bend
Bellmouth 0.03-0.05 Bend Radius / D = 4 0.16-0.18
Rounded 0.12-0.25 Bend Radius / D = 2 0.19-0.25
Sharp-Edged 0.50 Bend Radius / D = 1 0.35-0.40
Projecting 0.80 Mitered Bend
Contraction—Sudden θ = 15° 0.05
D2/D1 = 0.80 0.18 θ = 30° 0.10
D2/D1 = 0.50 0.37 θ = 45° 0.20
D2/D1 = 0.20 0.49 θ = 60° 0.35
Contraction—Conical θ = 90° 0.80
D2/D1 = 0.80 0.05 Tee
D2/D1 = 0.50 0.07 Line Flow 0.30-0.40
D2/D1 = 0.20 0.08 Branch Flow 0.75-1.80
Expansion—Sudden Cross
Bentley SewerCAD V8i User’s Guide 13-661
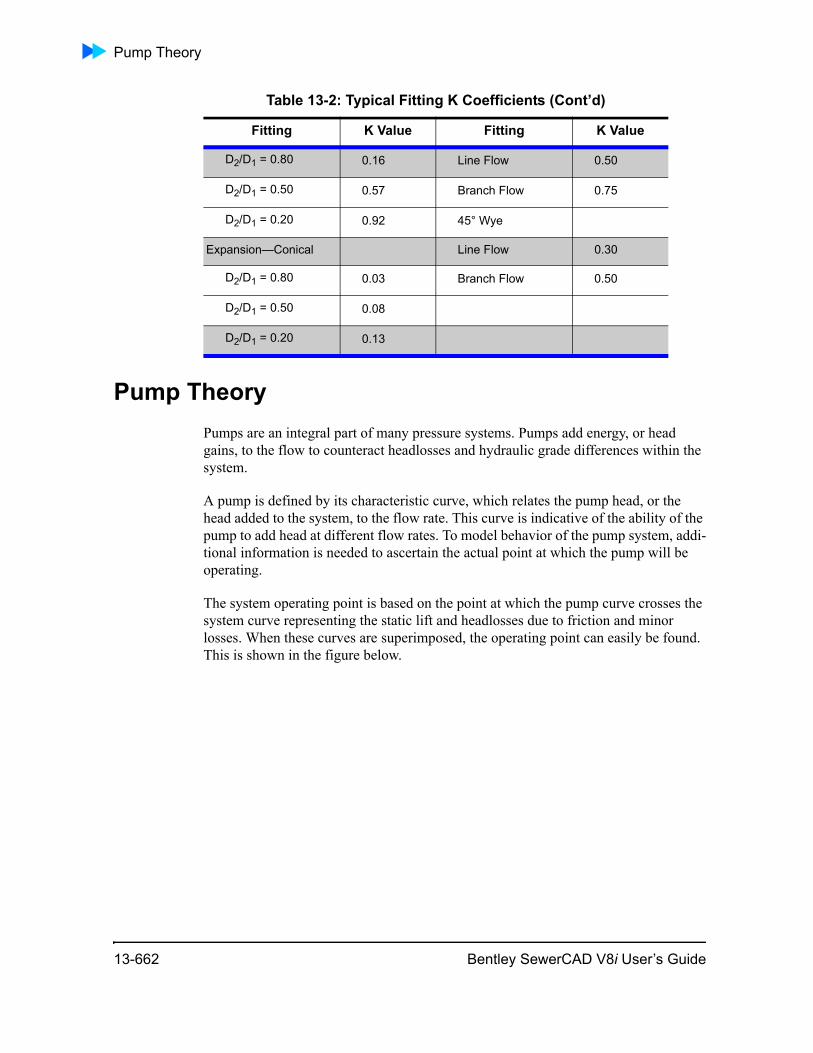
Pump Theory
Pump TheoryPumps are an integral part of many pressure systems. Pumps add energy, or head gains, to the flow to counteract headlosses and hydraulic grade differences within the system.
A pump is defined by its characteristic curve, which relates the pump head, or the head added to the system, to the flow rate. This curve is indicative of the ability of the pump to add head at different flow rates. To model behavior of the pump system, addi-tional information is needed to ascertain the actual point at which the pump will be operating.
The system operating point is based on the point at which the pump curve crosses the system curve representing the static lift and headlosses due to friction and minor losses. When these curves are superimposed, the operating point can easily be found. This is shown in the figure below.
D2/D1 = 0.80 0.16 Line Flow 0.50
D2/D1 = 0.50 0.57 Branch Flow 0.75
D2/D1 = 0.20 0.92 45° Wye
Expansion—Conical Line Flow 0.30
D2/D1 = 0.80 0.03 Branch Flow 0.50
D2/D1 = 0.50 0.08
D2/D1 = 0.20 0.13
Table 13-2: Typical Fitting K Coefficients (Cont’d)
Fitting K Value Fitting K Value
13-662 Bentley SewerCAD V8i User’s Guide
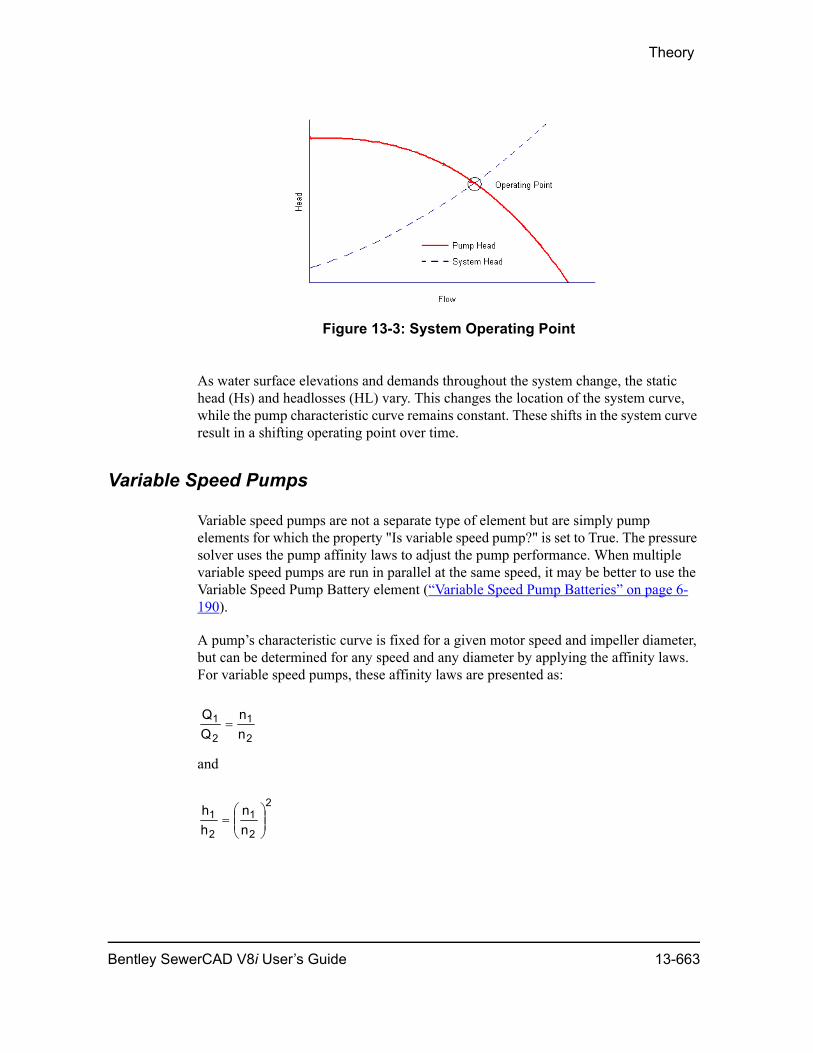
Theory
Figure 13-3: System Operating Point
As water surface elevations and demands throughout the system change, the static head (Hs) and headlosses (HL) vary. This changes the location of the system curve, while the pump characteristic curve remains constant. These shifts in the system curve result in a shifting operating point over time.
Variable Speed Pumps
Variable speed pumps are not a separate type of element but are simply pump elements for which the property "Is variable speed pump?" is set to True. The pressure solver uses the pump affinity laws to adjust the pump performance. When multiple variable speed pumps are run in parallel at the same speed, it may be better to use the Variable Speed Pump Battery element (“Variable Speed Pump Batteries” on page 6-190).
A pump’s characteristic curve is fixed for a given motor speed and impeller diameter, but can be determined for any speed and any diameter by applying the affinity laws. For variable speed pumps, these affinity laws are presented as:
and
2
1
2
1nn
=
2
2
1
2
1nn
hh
⎟⎟⎠
⎞⎜⎜⎝
⎛=
Bentley SewerCAD V8i User’s Guide 13-663
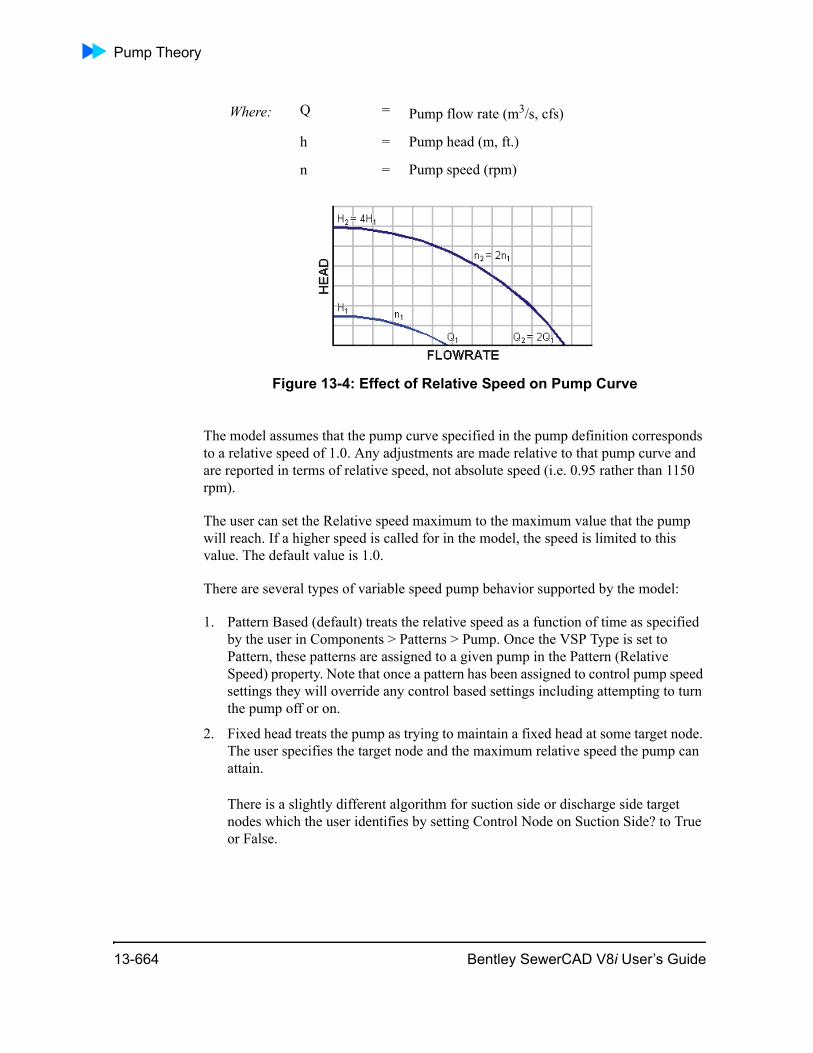
Pump Theory
Figure 13-4: Effect of Relative Speed on Pump Curve
The model assumes that the pump curve specified in the pump definition corresponds to a relative speed of 1.0. Any adjustments are made relative to that pump curve and are reported in terms of relative speed, not absolute speed (i.e. 0.95 rather than 1150 rpm).
The user can set the Relative speed maximum to the maximum value that the pump will reach. If a higher speed is called for in the model, the speed is limited to this value. The default value is 1.0.
There are several types of variable speed pump behavior supported by the model:
1. Pattern Based (default) treats the relative speed as a function of time as specified by the user in Components > Patterns > Pump. Once the VSP Type is set to Pattern, these patterns are assigned to a given pump in the Pattern (Relative Speed) property. Note that once a pattern has been assigned to control pump speed settings they will override any control based settings including attempting to turn the pump off or on.
2. Fixed head treats the pump as trying to maintain a fixed head at some target node. The user specifies the target node and the maximum relative speed the pump can attain.
There is a slightly different algorithm for suction side or discharge side target nodes which the user identifies by setting Control Node on Suction Side? to True or False.
Where: Q = Pump flow rate (m3/s, cfs)
h = Pump head (m, ft.)
n = Pump speed (rpm)
13-664 Bentley SewerCAD V8i User’s Guide
Theory
When the user selects a junction as a control node they must also specify the target head that the pump is trying to maintain by increasing or decreasing speed, however, when the user selects a storage node as a control node the target head is the initial level of the storage node.
In general, wastewater pumps are controlled on the suction side while water distri-bution pumps are controlled on the discharge side.
Control statements can be used to turn variable speed pumps on and off but pump speeds specified in control statements cannot override speeds determined by the model. While the pumps are on or off, the hydraulic grade at the target node may deviate from the target grade. If that node is a tank/wet well, the variable speed pump algorithm keeps track of the volume that must be pumped to bring the level back to the target. For nodes with no storage, the grade instantly reaches the target when the pump comes back on.
The variable speed pump continues to operate in the model even when the target tank reaches min or max level. Warning messages are issued to identify this condi-tion.
3. Fixed Flow treats the pump output as a constant and adjusts the speed to produce that flow as long as the speed does not exceed the maximum. Note that fixed flow pumps do not support being controlled with simple or logical controls and they do not turn on automatically at any time after being closed by the hydraulic engine (e.g., if a water source becomes unavailable).
4. The speed of a variable speed pump can also be adjusted using a series of control statements. This requires more work on data entry but can be used to handle complex controls. If you want the variable speed pump to be controlled by a set of control statements, the pump should be a Pattern type variable speed pump with a pattern of <None>. That is: Is variable speed? = True, VSP Type = Pattern Based, Pattern = <None>. Then the controls specified in the Operational alternative will be used.
Because of its discrete nature, this type of control can display oscillations in speed. For example with the controls below:
IF (Level <5 and Level =>3) Speed = 0.8
IF (Level <7 and Level =>5) Speed = 0.7
when the level is very close to 5, the speed can oscillate between 0.7 and 0.8 rather than ramp smoothly between the two settings.
Bentley SewerCAD V8i User’s Guide 13-665

Pump Theory
Constant Horsepower Pumps
During preliminary studies, the exact characteristics of the constant horsepower pump may not be known. In these cases, the asinverttion is often made that the pump is adding energy to the water at a constant rate. Based on power-head-flow rate relation-ships for pumps, the operating point of the pump can then be determined. Although this asinverttion is useful for some applications, a constant horsepower pump should only be used for preliminary studies.
This software currently models six different types of pumps:
Tip: Whenever possible, avoid using constant power or design point pumps. They are often enticing because they require less work on behalf of the engineer, but they are much less accurate than a pump curve based on several representative points.
• Constant Power—These pumps may be useful for preliminary designs and esti-mating pump size, but should not be used for any analysis for which more accu-rate results are desired.
• Design Point (One-Point)—A pump can be defined by a single design point (Hd @ Qd). From this point, the curve’s interception with the head and discharge axes is computed as Ho = 1.33•Hd and Qo = 2.00•Qd. This type of pump is useful for preliminary designs, but should not be used for final analysis.
• Standard (Three-Point)—This pump curve is defined by three points—the shutoff head (pump head at zero discharge), the design point (as with the single-point pump), and the maximum operating point (the highest discharge at which the pump performs predictably).
• Standard Extended—The same as the standard three-point pump, but with an extended point at the zero pump head point. This is automatically calculated by the program.
• Custom Extended—The custom extended pump is similar to the standard extended pump, but allows you to enter the discharge at zero pump head.
• Multiple Point—This option allows you to define a custom rating curve for a pump. The pump curve is defined by entering points for discharge rates at various heads. Since the general pump equation, shown below, is used to simulate the pump during the network computations, the user-defined pump curve points are used to solve for coefficients in the general pump equation:
)QB(AY C×−=
13-666 Bentley SewerCAD V8i User’s Guide

Theory
The Levenberg-Marquardt Method is used to solve for A, B and C based on the given multiple-point rating curve.
Conservation of Mass and Energy
Conservation of Mass
At any node in a system containing incompressible fluid, the total volumetric or mass flows in must equal the flows out, less the change in storage. Separating these into flows from connecting pipes, demands, and storage, you obtain:
Where: Y = Head (m, ft.)
Q = Discharge (m3/s, cfs)
A,B,C = Pump curve coefficients
Where: QIN = Total flow into the node (m3/s, cfs)
QOUT = Total demand at the node (m3/s, cfs)
∆VS = Change in storage volume (m3, ft.3)
∆t = Change in time (s)
SOUTIN VtQtQ ∆+∆=∆∑ ∑
Bentley SewerCAD V8i User’s Guide 13-667
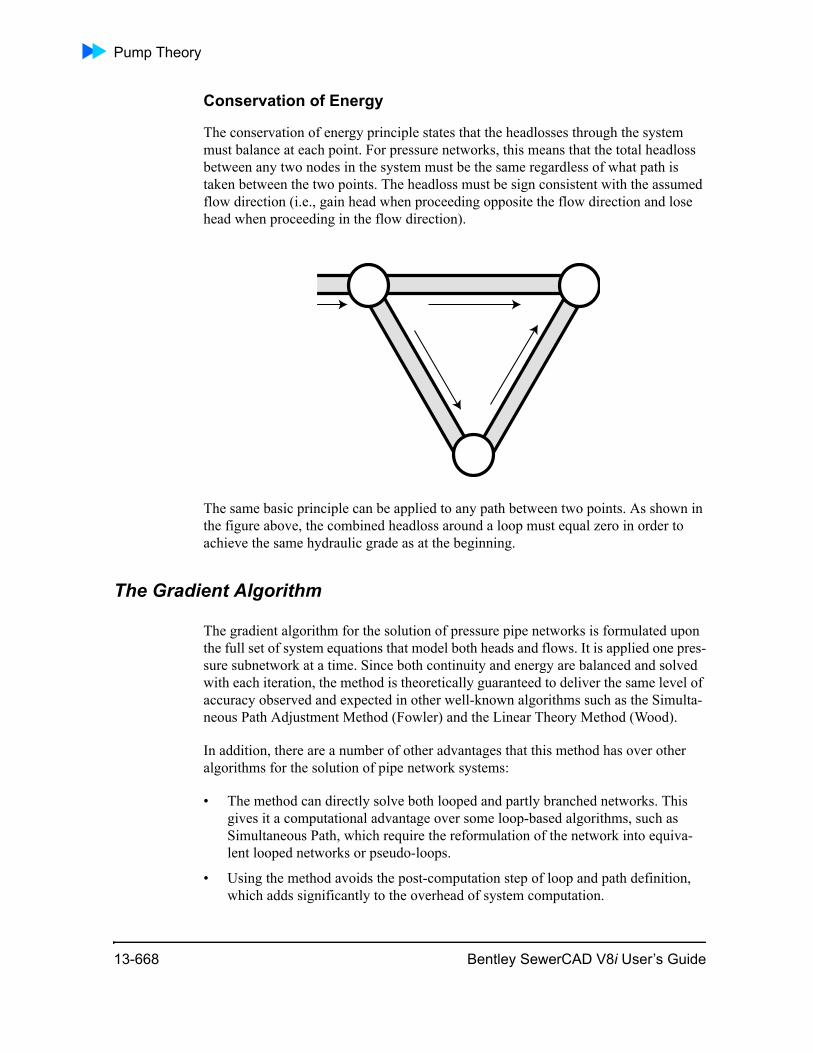
Pump Theory
Conservation of Energy
The conservation of energy principle states that the headlosses through the system must balance at each point. For pressure networks, this means that the total headloss between any two nodes in the system must be the same regardless of what path is taken between the two points. The headloss must be sign consistent with the assumed flow direction (i.e., gain head when proceeding opposite the flow direction and lose head when proceeding in the flow direction).
The same basic principle can be applied to any path between two points. As shown in the figure above, the combined headloss around a loop must equal zero in order to achieve the same hydraulic grade as at the beginning.
The Gradient Algorithm
The gradient algorithm for the solution of pressure pipe networks is formulated upon the full set of system equations that model both heads and flows. It is applied one pres-sure subnetwork at a time. Since both continuity and energy are balanced and solved with each iteration, the method is theoretically guaranteed to deliver the same level of accuracy observed and expected in other well-known algorithms such as the Simulta-neous Path Adjustment Method (Fowler) and the Linear Theory Method (Wood).
In addition, there are a number of other advantages that this method has over other algorithms for the solution of pipe network systems:
• The method can directly solve both looped and partly branched networks. This gives it a computational advantage over some loop-based algorithms, such as Simultaneous Path, which require the reformulation of the network into equiva-lent looped networks or pseudo-loops.
• Using the method avoids the post-computation step of loop and path definition, which adds significantly to the overhead of system computation.
13-668 Bentley SewerCAD V8i User’s Guide
Theory
• The method is numerically stable when the system becomes disconnected by check valves, pressure regulating valves, or modeler’s error. The loop and path methods fail in these situations.
• The structure of the generated system of equations allows the use of extremely fast and reliable sparse matrix solvers.
The derivation of the Gradient Algorithm starts with two matrices and ends as a working system of equations (for more information, see “Derivation of the Gradient Algorithm” on page 13-669).
Derivation of the Gradient Algorithm
Given a network defined by N unknown head nodes, P links of unknown flow, and B boundary or fixed head nodes, the network topology can be expressed in two inci-dence matrices:
and
The following convention is used to assign matrix values:
Assigned nodal demands are given by:
Assigned boundary nodal heads are given by:
The headloss or gain transform is expressed in the matrix:
A12 = A21T (P x N) Unknown head nodes incidence matrix
A10 = A01T (P x B) Fixed head nodes incidence matrix
A12(i,j) = 1, 0, or -1 (PxN) Unknown head nodes incidence matrix
qT = [q1, q2,…, qN] (1 x N) Nodal demand vector
HfT = [Hf1, Hf2,…, HfB ] (1 x B) Fixed nodal head vector
Bentley SewerCAD V8i User’s Guide 13-669
Pump Theory
These matrix elements that define known or iterative network state can be used to compute the final steady-state network represented by the matrix quantities for unknown flow and unknown nodal head.
Unknown link flow quantities are defined by:
Unknown nodal heads are defined by:
These topologic and quantity matrices can be formulated into the generalized matrix expression using the laws of energy and mass conservation:
A second diagonal matrix that implements the vectorized head change coefficients is introduced. It is generalized for Hazen-Williams friction losses in this case:
This yields the full expression of the network response in matrix form:
FT(Q) = [f1, f2…, fp ] (1 x P) Non-linear laws expressing headlosses in links
QT = [Q1,Q2…, Qp ] (1 x P) Unknown link flow rate vector
HT = [H1, H2 …, HN ] (1 x N) Unknown nodal head vector
)(Qff iii =
f1012 HAF(Q)HA −=+
qQA12 =
⎥⎥⎥⎥⎥⎥⎥
⎦
⎤
⎢⎢⎢⎢⎢⎢⎢
⎣
⎡
=
−
−
−
1nPP
1n22
1n11
11
P
2
1
QR...
...QR
QR
A
⎥⎦
⎤⎢⎣
⎡−=⎥
⎦
⎤⎢⎣
⎡⎥⎦
⎤⎢⎣
⎡q
HAHQ
0AAA f10
21
1211
13-670 Bentley SewerCAD V8i User’s Guide
Theory
To solve the system of non-linear equations, the Newton-Raphson iterative scheme can be obtained by differentiating both sides of the equation with respect to Q and H to get:
with
The final recursive form of the Newton-Raphson algorithm can now be derived after matrix inversion and various algebraic manipulations and substitutions (not presented here). The working system of equations for each solution iteration, k, is given by:
The solution for each unknown nodal head for each time iteration is computationally intensive. This high-speed solution utilizes a highly optimized sparse matrix solver (see “The Linear System Equation Solver” on page 13-671) that is specifically tailored to the structure of this matrix system of equations.
Sources:
Todini, E. and S. Pilati, “A gradient Algorithm for the Analysis of Pipe Networks,” Computer Applications in Water Supply, Vol. 1—Systems Analysis and Simulation, ed. By Bryan Callback and Chin-Hour Or, Research Studies Press LTD, Watchword, Hertfordshire, England.
The Linear System Equation Solver
The Conjugate Gradient method (see “The Gradient Algorithm” on page 13-668) is one method that, in theory, converges to an exact solution in a limited number of steps. The Gradient working equation can be expressed for the pressure network system of equations as:
where:
⎥⎦
⎤⎢⎣
⎡−=⎥
⎦
⎤⎢⎣
⎡⎥⎦
⎤⎢⎣
⎡dqdE
dHdQ
0AANA
21
1211
⎥⎥⎥⎥
⎦
⎤
⎢⎢⎢⎢
⎣
⎡
=
P
2
1
n...
nn
N
{ })QA(q)HAA(QNA)AAN(AH k21f10
111
k121
112
111
121
1k −++−= −−−−−+
)HAH(AAN)QN(1Q f101k
121
111k11k +−−= +−−−+
bAx =
Bentley SewerCAD V8i User’s Guide 13-671
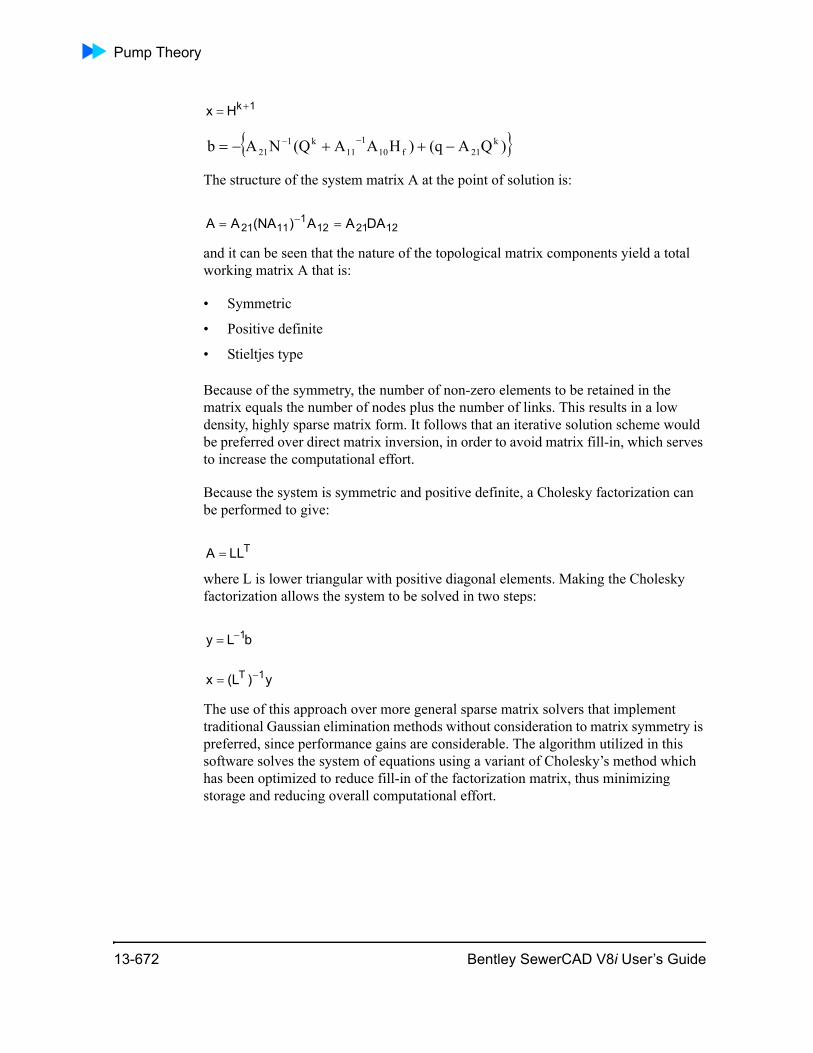
Pump Theory
The structure of the system matrix A at the point of solution is:
and it can be seen that the nature of the topological matrix components yield a total working matrix A that is:
• Symmetric
• Positive definite
• Stieltjes type
Because of the symmetry, the number of non-zero elements to be retained in the matrix equals the number of nodes plus the number of links. This results in a low density, highly sparse matrix form. It follows that an iterative solution scheme would be preferred over direct matrix inversion, in order to avoid matrix fill-in, which serves to increase the computational effort.
Because the system is symmetric and positive definite, a Cholesky factorization can be performed to give:
where L is lower triangular with positive diagonal elements. Making the Cholesky factorization allows the system to be solved in two steps:
The use of this approach over more general sparse matrix solvers that implement traditional Gaussian elimination methods without consideration to matrix symmetry is preferred, since performance gains are considerable. The algorithm utilized in this software solves the system of equations using a variant of Cholesky’s method which has been optimized to reduce fill-in of the factorization matrix, thus minimizing storage and reducing overall computational effort.
1kHx +=
{ })QA(q)HAA(QNAb k21f10
111
k121 −++−= −−
1221121
1121 DAAA)(NAAA == −
TLLA =
bLy 1−=
y)(Lx 1T −=
13-672 Bentley SewerCAD V8i User’s Guide
Theory
Extended Period Simulations
Extended Period Simulations Overview
The Extended Period Simulation (EPS) models how a sewer network will behave over time. This type of analysis allows the user to model wet wells filling and draining, how pumps toggle on and off, and how pressures, hydraulic grades, and flow rates change throughout the system in response to varying loading conditions and in response to automatic control strategies formulated by the modeler. In SewerCAD the algorithm proceeds in a general downstream direction proceeding towards the outfall and occurs in the following steps:
The analysis begins in the gravity portion of the network. All hydrographs are gener-ated entering into the gravity system and successively routed and summed as the flows approach the bounding wet well. Ultimately, the total inflow hydrograph to the wet well is determined.
Knowing the inflow to the wet well, the pressure calculations for the force main system bounded by the wet well are performed. In addition to flow velocities and pressures, the levels in the wet well are determined over time.
SewerCAD then returns to the gravity portion of the network discussed in step 1. The hydraulics and HGL profiles are calculated throughout the gravity system for each time step using the known level of the wet well as the boundary condition for the backwater analysis.
The process then repeats, continuing to the systems downstream of the pressure network until an outlet is reached.
Routing Overview
As a hydrograph flows through a conduit it undergoes changes in shape and temporal distribution caused by translation and storage effects.
SewerCAD uses two methods to determine the shape and distribution of a hydrograph routed through a gravity pipe.
• Convex Routing
• Weighted Translation Routing
Bentley SewerCAD V8i User’s Guide 13-673
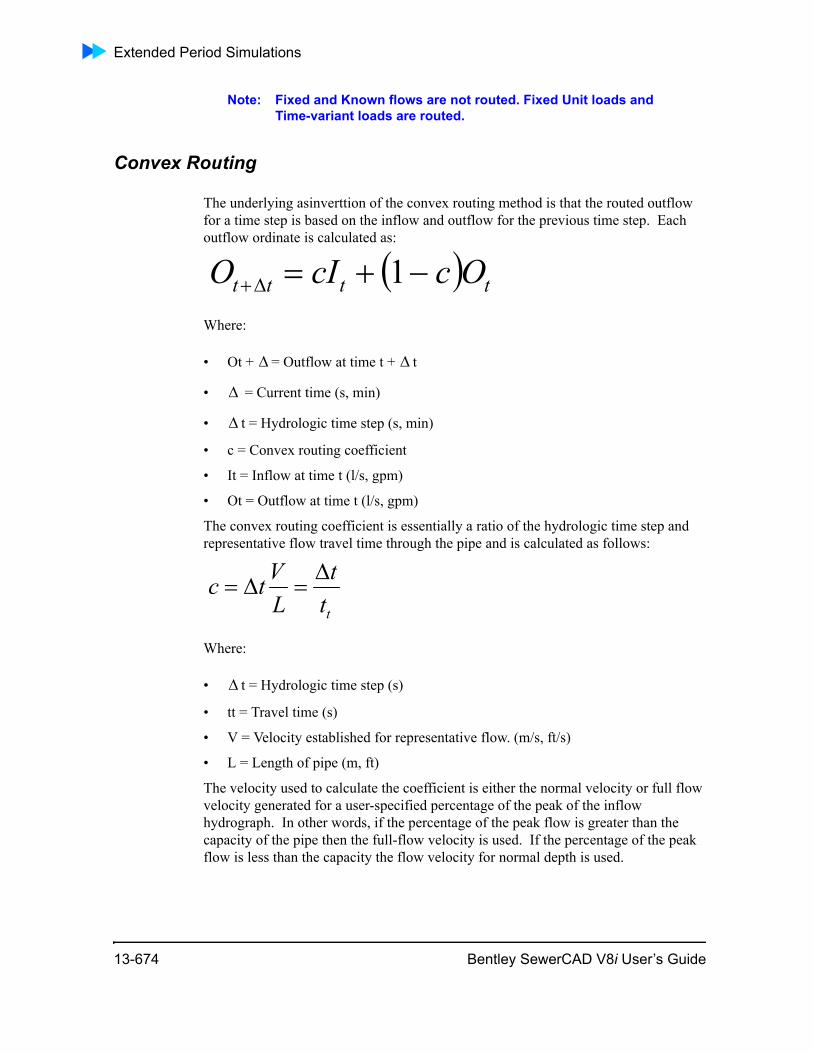
Extended Period Simulations
Note: Fixed and Known flows are not routed. Fixed Unit loads and Time-variant loads are routed.
Convex Routing
The underlying asinverttion of the convex routing method is that the routed outflow for a time step is based on the inflow and outflow for the previous time step. Each outflow ordinate is calculated as:
Where:
• Ot + = Outflow at time t + t
• = Current time (s, min)
• t = Hydrologic time step (s, min)
• c = Convex routing coefficient
• It = Inflow at time t (l/s, gpm)
• Ot = Outflow at time t (l/s, gpm)
The convex routing coefficient is essentially a ratio of the hydrologic time step and representative flow travel time through the pipe and is calculated as follows:
Where:
• t = Hydrologic time step (s)
• tt = Travel time (s)
• V = Velocity established for representative flow. (m/s, ft/s)
• L = Length of pipe (m, ft)
The velocity used to calculate the coefficient is either the normal velocity or full flow velocity generated for a user-specified percentage of the peak of the inflow hydrograph. In other words, if the percentage of the peak flow is greater than the capacity of the pipe then the full-flow velocity is used. If the percentage of the peak flow is less than the capacity the flow velocity for normal depth is used.
( ) tttt OccIO −+=∆+ 1
∆ ∆
∆
∆
ttt
LVtc ∆=∆=
∆
13-674 Bentley SewerCAD V8i User’s Guide
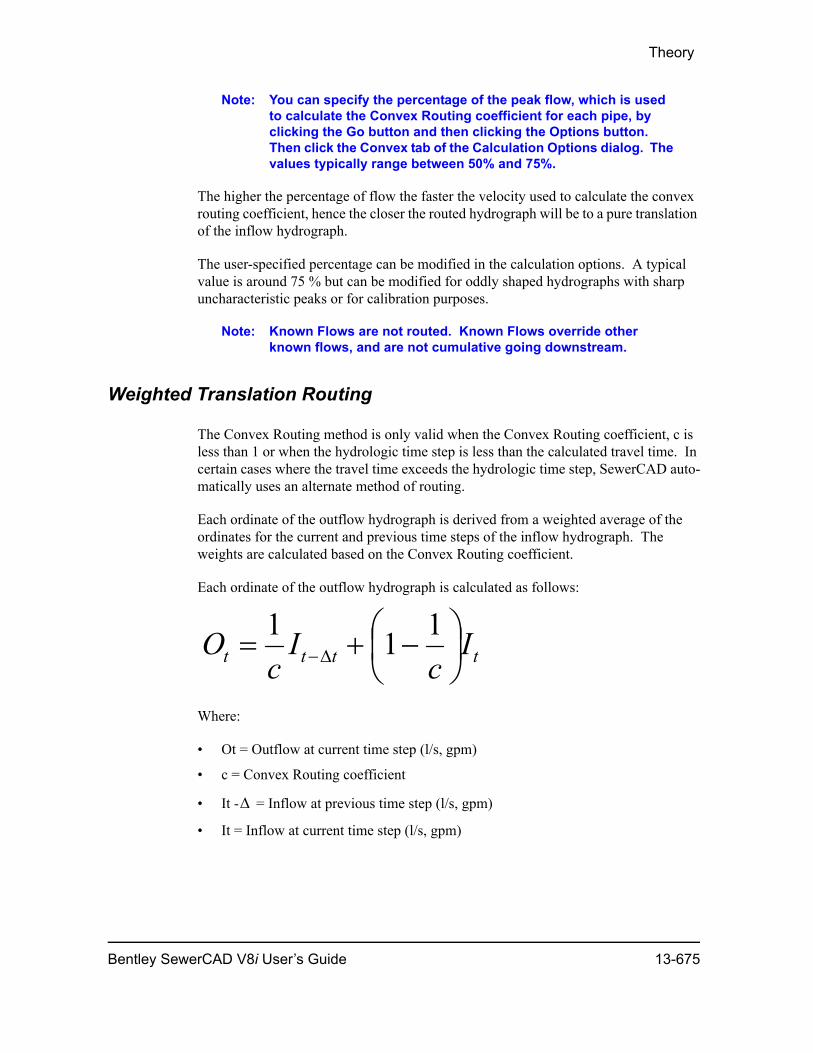
Theory
Note: You can specify the percentage of the peak flow, which is used to calculate the Convex Routing coefficient for each pipe, by clicking the Go button and then clicking the Options button. Then click the Convex tab of the Calculation Options dialog. The values typically range between 50% and 75%.
The higher the percentage of flow the faster the velocity used to calculate the convex routing coefficient, hence the closer the routed hydrograph will be to a pure translation of the inflow hydrograph.
The user-specified percentage can be modified in the calculation options. A typical value is around 75 % but can be modified for oddly shaped hydrographs with sharp uncharacteristic peaks or for calibration purposes.
Note: Known Flows are not routed. Known Flows override other known flows, and are not cumulative going downstream.
Weighted Translation Routing
The Convex Routing method is only valid when the Convex Routing coefficient, c is less than 1 or when the hydrologic time step is less than the calculated travel time. In certain cases where the travel time exceeds the hydrologic time step, SewerCAD auto-matically uses an alternate method of routing.
Each ordinate of the outflow hydrograph is derived from a weighted average of the ordinates for the current and previous time steps of the inflow hydrograph. The weights are calculated based on the Convex Routing coefficient.
Each ordinate of the outflow hydrograph is calculated as follows:
Where:
• Ot = Outflow at current time step (l/s, gpm)
• c = Convex Routing coefficient
• It - = Inflow at previous time step (l/s, gpm)
• It = Inflow at current time step (l/s, gpm)
tttt Ic
Ic
O ⎟⎠⎞
⎜⎝⎛ −+= ∆−
111
∆
Bentley SewerCAD V8i User’s Guide 13-675
Transitioning Between Gravity and Pressure Networks
Hydrologic and Hydraulic Time Steps
SewerCAD uses two distinct time steps when running an Extended Period Simulation.
• Hydrologic Time Step - This time step is used to calculate the routed hydrographs and represents the time increment of all hydrographs generated during the anal-ysis. The hydrologic time step is also used as the calculation increment for the pressure calculations.
• Hydraulic Time Step - This time step represents how often the hydraulic calcula-tions are performed. Flows are interpolated off the previously generated hydro-graphs using the hydraulic time step and are used to perform the gradually varied flow analyses for that time step.
The hydrologic time step should be less than or equal to the hydraulic time step. The hydraulic time step should be a multiple of the hydrologic time step.
Note: The Hydrologic and Hydraulic Time Steps can be modified in the Calculation Options.
Transitioning Between Gravity and Pressure NetworksThis section describes the major distinctions between gravity pipes and force mains in SewerCAD. It also describes how flow and the hydraulic grade transition between force mains and gravity pipes and vice versa.
Identifying Gravity Pipes and Force Mains
By default, SewerCAD depicts a pressure pipe as a single black line, and a gravity pipe as a thicker red line, although this symbology may be changed by the user.
Gravity pipes are referred to as "conduits" and force mains are referred to as "pressure pipes" in SewerCAD. Pressure pipes also refer to pipes in a pressure sewer (grinder pump) system.
Gravity pipes hydraulics are solved using gradually varied flow equations and can become surcharged. Pressure pipes are pipes solved with the Bentley pressure engine (similar to WaterCAD/GEMS) and are generally assumed to be flowing full, with the exception of a pipe immediately downstream of an open air valve. Pipes which regu-larly transition between full and partly full flow are generally better treated as conduits.
13-676 Bentley SewerCAD V8i User’s Guide

Theory
The difference can also be recognized by the pipe's context in the network. The pipes in a gravity system must all converge on a single termination point in a classic tree structure. Multiple pipes can enter into a single gravity node, but only one may exit. The gravity subnetwork can either terminate on a wet well, or an outlet.
The force mains can be much more complex with loops and multiple outlet points. The pressure subnetwork can terminate on an outlet or a manhole.
See “Subnetworks” on page 13-682 for more information.
Direction of Flow in Gravity and Pressure Systems
In gravity pipes flow will always travel towards the termination point of the gravity network.
The terminology Start and Stop nodes for a link refer to the direction which the element was entered into SewerCAD. These may be reversed by the user. The termi-nology Upstream/Downstream is determined by the program based on the direction of flow to the outlet
Pressure systems are usually designed such that flow will travel from the wet well to an outfall point at either an outlet or a gravity system. If the elevation is too high at that point, SewerCAD will allow flow to travel backwards from the gravity system to the pressure network. There are no programmatic limitations as to the direction of flow in the force main system.
Transitioning From Gravity Pipes to Force Mains
The only way to transition between a gravity pipe and a force main in SewerCAD is through an intermediate wet well. This establishes a boundary condition for both the connecting systems. During a Steady State analysis the wet well level can be calcu-lated based on generating the required HGL for the outflow to either match or exceed the inflow, or the wet well level can be fixed to a user-specified level. During an Extended Period Simulation the wet well level is determined for a time step by calcu-lating the change in storage over time.
The inflow into the wet well is determined by summing all loads flowing to that wet well.
Hydraulic (HGL) Transition from Gravity to Pressure Network
Gravity hydraulic calculations upstream of a wet well are based on the wet well hydraulic grade, just as they are for standard calculations within gravity systems.
Bentley SewerCAD V8i User’s Guide 13-677
Transitioning Between Gravity and Pressure Networks
During a Steady State analysis there is a difference, however, in determining the hydraulic grade within the wet well itself. The wet well level may be set by the user to either be fixed or not fixed.
Fixed Wet Well Level during Steady State Analysis
If the wet well level is fixed, the wet well's starting hydraulic grade is used for pres-sure calculations. No adjustments are made, and this grade is used as the tailwater grade for the upstream gravity systems.
Non-Fixed Wet Well Level during Steady State Analysis
If the wet well level is not fixed, the pressure calculations will attempt to balance the wet well level such that the total flow out of the wet well is equal to or greater than the total flow into the wet well.
The wet well's starting grade is used for the first iteration. If the calculated flows out of each wet well are greater than or equal to each wet well's incoming flow, the itera-tions stop there. If not, the wet well levels are increased by the increment specified in the calculation options, and the pressure subnetwork is recalculated. When the wet well level is increased, it changes the static heads and increases the discharge for connected pumps, and may also trigger additional pumps to turn on.
This process continues until the level in each non-fixed wet well either meets the flow criteria, or is prevented by rising to the maximum elevation of the wet well.
Wet Well Level During Extended Period Simulations
During an Extended Period Simulation the fixed wet well level options are not avail-able. The wet well level for a time step is actually determined by the change in storage due to inflows and outflows over a single time step.
Hydrologic (Flow) Transition from Gravity to Pressure Network
The hydrologic transition from a gravity system into a pressure system is quite simple. Gravity loads upstream from the wet well are accumulated and combined with the wet well's local load to determine the total load entering the pressure system at that loca-tion. This can be imagined as the total load "dumping into" the wet well.
Transitioning From Force Mains to Gravity Elements
Force mains can empty directly into the gravity system via a manhole, or a junction chamber, or they can terminate at an outlet. During a Steady State analysis the flow entering the gravity system can either be only the specified sanitary and wet weather loads, or the load generated based on the pumps, the wet well level and the hydraulic characteristics of the force main system.
13-678 Bentley SewerCAD V8i User’s Guide

Theory
During an Extended Period Simulation flows to the gravity system are solely deter-mined based on the hydraulic characteristics of the force main system.
If the force main empties into an outlet the HGL boundary is determined by the eleva-tion of the user specified-tailwater. The HGL boundary between the force main and gravity system is determined by the elevation of the force main at the boundary point.
Hydraulic (HGL) Transition from Pressure to Gravity Network
If the force main empties into and outlet element, then the hydraulic grade will be the higher of the set tailwater elevation or the crown of the pressure pipe.
The hydraulic grade at a manhole or a junction chamber downstream from a discharging force main is not considered when performing pressure calculations. Instead, the boundary hydraulic grade is assumed to be equal to the crown elevation of the discharge pipe.
For example, if a 150 mm pipe discharges at an invert elevation of 10.000 m, the hydraulic grade that is used as the boundary condition for the pressure system is 10.150 m.
This asinverttion is absolutely valid and conservative when the hydraulic grade line in the gravity element is below the crown of the pipe.
This is generally a valid asinverttion when the hydraulic grade line is above the crown of the pipe as the head at the entrance of the gravity network is often insignificant compared to the friction losses incurred through the force mains.
Hydrologic (Flow) Transition from Pressure to Gravity Network
The hydrologic transition from a pressure system into a gravity system during a Steady State analysis is somewhat complicated, with different desired behaviors for different analysis purposes. If the model is built for direct analysis of flows in the system, it is most likely that instantaneous pumped flows are important, and the down-stream gravity loads should include the pumped discharge from the pressure system. If the analysis is for large-scale planning purposes, however, it is more likely that instantaneous pumping rates are not as important. In these cases, the downstream gravity system should be analyzed based on the total contributing population, area, or other factors for determining peak flows.
Bentley SewerCAD V8i User’s Guide 13-679
Transitioning Between Gravity and Pressure Networks
Hydrologic Transition from Pressure to Gravity During Steady State Analysis
Conserving Pumped Flow
When instantaneous pumped flows are a concern in the downstream gravity system, the calculation option to conserve pumped flow should be used. This is found on the Pressure Hydraulics Options tab of the Calculation Options dialog. When this option is used, the contributing load components from the pressure system are ignored, and a load of type "Pumped" is added to the gravity system with the magnitude of the flow in the discharging pressure pipe. If the flow in the pressure pipe is such that the gravity system would be draining into the pressure system, no load is transferred to that gravity node.
Conserving Load Components
When instantaneous pumped flows are not a concern in the downstream gravity system, the calculation option to conserve load components (not pumped flow) should be used. When conserving load components, the total contributing components to the pressure system (population, area, and so forth) are considered. The total contributing load is distributed to the downstream gravity systems proportionally to the pressure pipe discharge rates. If the flow in a pressure pipe is such that the gravity system would be draining into the pressure system, no load is transferred to that gravity node.
Comparison of Pressure Load Routing
Consider the system below with the following load equivalents:
300 people = 100 l/s
200 people = 70 l/s
13-680 Bentley SewerCAD V8i User’s Guide
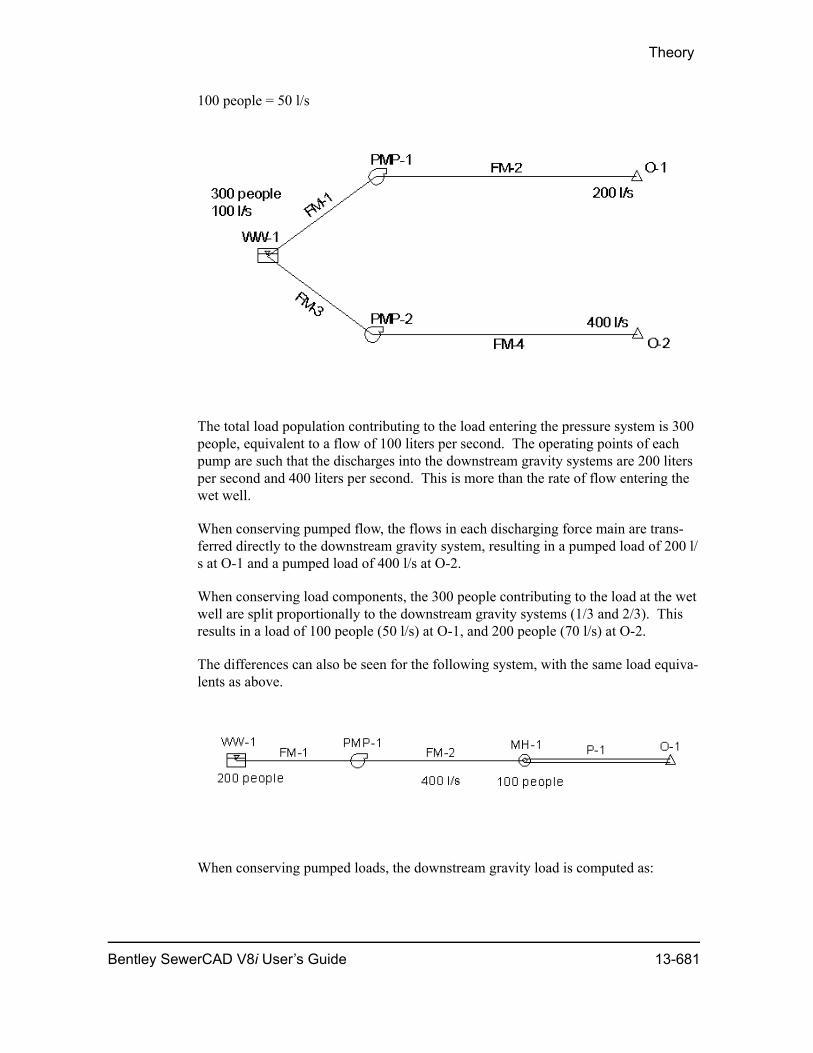
Theory
100 people = 50 l/s
The total load population contributing to the load entering the pressure system is 300 people, equivalent to a flow of 100 liters per second. The operating points of each pump are such that the discharges into the downstream gravity systems are 200 liters per second and 400 liters per second. This is more than the rate of flow entering the wet well.
When conserving pumped flow, the flows in each discharging force main are trans-ferred directly to the downstream gravity system, resulting in a pumped load of 200 l/s at O-1 and a pumped load of 400 l/s at O-2.
When conserving load components, the 300 people contributing to the load at the wet well are split proportionally to the downstream gravity systems (1/3 and 2/3). This results in a load of 100 people (50 l/s) at O-1, and 200 people (70 l/s) at O-2.
The differences can also be seen for the following system, with the same load equiva-lents as above.
When conserving pumped loads, the downstream gravity load is computed as:
Bentley SewerCAD V8i User’s Guide 13-681
Transitioning Between Gravity and Pressure Networks
400 l/s + 100 people = 400 l/s + 50 l/s = 450 l/s
When conserving load components, the downstream gravity load is computed as:
200 people + 100 people = 300 people = 100 l/s
Note that for this piping configuration (one source of loading for the pressure system, one possible discharge point for the pressure system), the downstream load will always be 100 l/s (300 people) regardless of the actual pump operating point.
Hydrologic Transition from Pressure to Gravity During Extended Period Simulations
Since the wet well level will vary over time, based on the inflow and outflow, no distinction is made between standard loads and pumped loads during an Extended Period Simulation. The loads will be transferred through the force main system based on the hydraulic characteristics of the pumps and the system headlosses.
If the elevation of the force main emptying into the gravity system is high enough that flow goes backward from the gravity element during an Extended Period Simulation, the negative portion of the hydrograph going through the gravity system at that point will be truncated. Only positive flows are analyzed in the gravity system. Negative flows are assumed to be 0. (See the Hydraulic Transition from Pressure to Gravity Network for more information).
Subnetworks
The SewerCAD solver works efficiently on complex gravity/pressure collection systems because it breaks the system into individual gravity and pressure subnetworks which it solves quickly with the most efficient and appropriate equations. At the start of each run, the system is parsed into subnetworks each of which is given its own ID which is the label for the outfall of that subnetwork (which may be a wet well in some cases) for gravity subnetworks or a number (starting at 1) for pressure subnetworks. The name of the subnetwork in which an element is located can be found in the prop-erty grid under "Results (Engine parsing)".
A gravity subnetwork consists of all the gravity conduits (and associated nodes) connected upstream from the outfall/wet well. A pressure subnetwork consists of all the pressure pipes (and associated nodes) connected to the outfall or manhole that transitions back to a gravity subnetwork.
Each pressure subnetwork can be highlighted in the drawing from the Calculation Detailed Summary > Pressure Summary tab by clicking the Highlight button next to the Pressure Subnetwork name.
13-682 Bentley SewerCAD V8i User’s Guide
Theory
Constraint Based Automatic Design
Gravity Pipes and Structures Design
This program allows you to automatically design gravity piping and structures. The design is flexible enough to allow you to specify the elements to be designed, from a single pipe size to the entire system, or anything in between.
The design algorithm adjusts invert elevations and the section size of the pipe to meet several constraints, such as allowable ranges of slope, velocity and cover. In general, the design algorithm attempts to minimize pipe size and excavation, which is typically the most expensive part of installing sewer piping and structures.
Some of the other things that are considered include:
• Pipe Matching
• Offset Matching
• Drop Structures
• Structure invert Elevations
The designed pipe will be the smallest available section size from the Engineering Library that meets the constraints and has a capacity greater than its discharge. In a situation where there are no pipe sizes with adequate capacity, the largest available size will be used.
Part Full Design
Pipes are designed such that the capacity is greater than the calculated discharge. For standard designs, this capacity is based on full pipe, normal depth - that is, the flow in the pipe when the depth is 100% of the pipe rise.
With partially full design, the designed capacity of the pipe is for a design depth that is only a portion of the pipe rise. In other words, a pipe that is designed for 50% full will be selected based on a depth of half of the pipe's rise.
For example, consider a circular pipe with the following characteristics: Slope = 0.01 m/m
Roughness n = 0.013
Required flow = 100 l/s
Bentley SewerCAD V8i User’s Guide 13-683
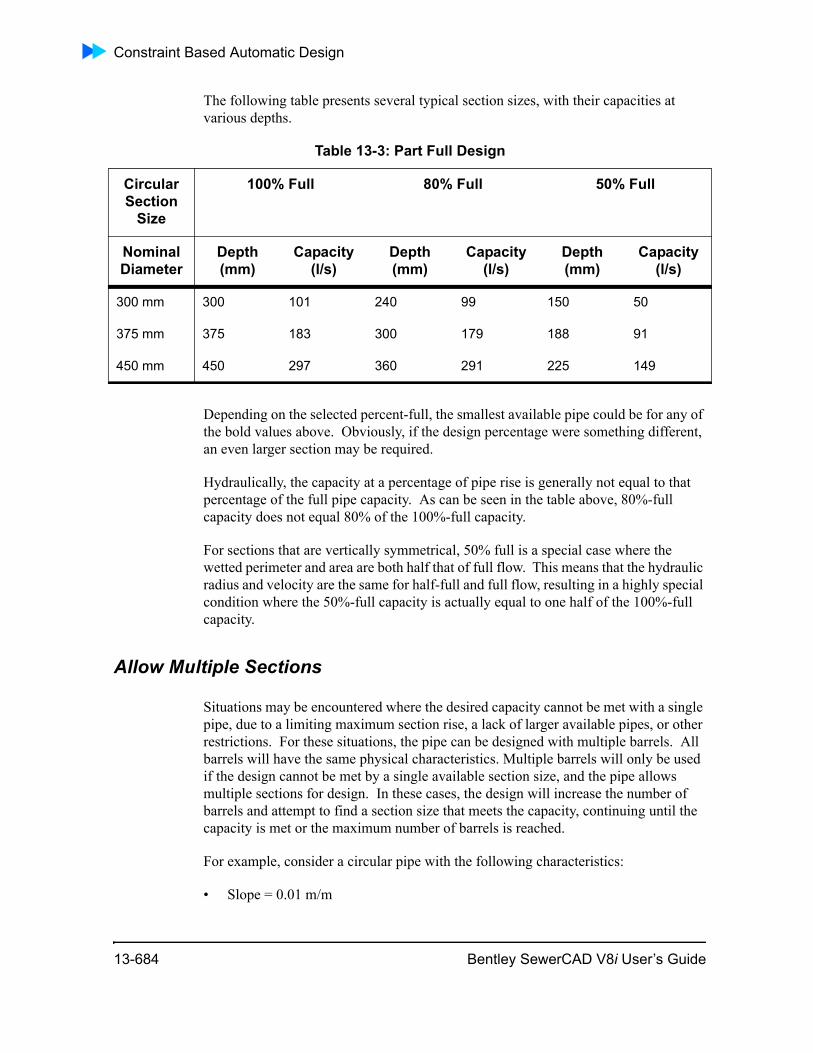
Constraint Based Automatic Design
The following table presents several typical section sizes, with their capacities at various depths.
Depending on the selected percent-full, the smallest available pipe could be for any of the bold values above. Obviously, if the design percentage were something different, an even larger section may be required.
Hydraulically, the capacity at a percentage of pipe rise is generally not equal to that percentage of the full pipe capacity. As can be seen in the table above, 80%-full capacity does not equal 80% of the 100%-full capacity.
For sections that are vertically symmetrical, 50% full is a special case where the wetted perimeter and area are both half that of full flow. This means that the hydraulic radius and velocity are the same for half-full and full flow, resulting in a highly special condition where the 50%-full capacity is actually equal to one half of the 100%-full capacity.
Allow Multiple Sections
Situations may be encountered where the desired capacity cannot be met with a single pipe, due to a limiting maximum section rise, a lack of larger available pipes, or other restrictions. For these situations, the pipe can be designed with multiple barrels. All barrels will have the same physical characteristics. Multiple barrels will only be used if the design cannot be met by a single available section size, and the pipe allows multiple sections for design. In these cases, the design will increase the number of barrels and attempt to find a section size that meets the capacity, continuing until the capacity is met or the maximum number of barrels is reached.
For example, consider a circular pipe with the following characteristics:
• Slope = 0.01 m/m
Table 13-3: Part Full Design
Circular Section
Size
100% Full 80% Full 50% Full
Nominal Diameter
Depth (mm)
Capacity (l/s)
Depth (mm)
Capacity (l/s)
Depth (mm)
Capacity (l/s)
300 mm 300 101 240 99 150 50
375 mm 375 183 300 179 188 91
450 mm 450 297 360 291 225 149
13-684 Bentley SewerCAD V8i User’s Guide
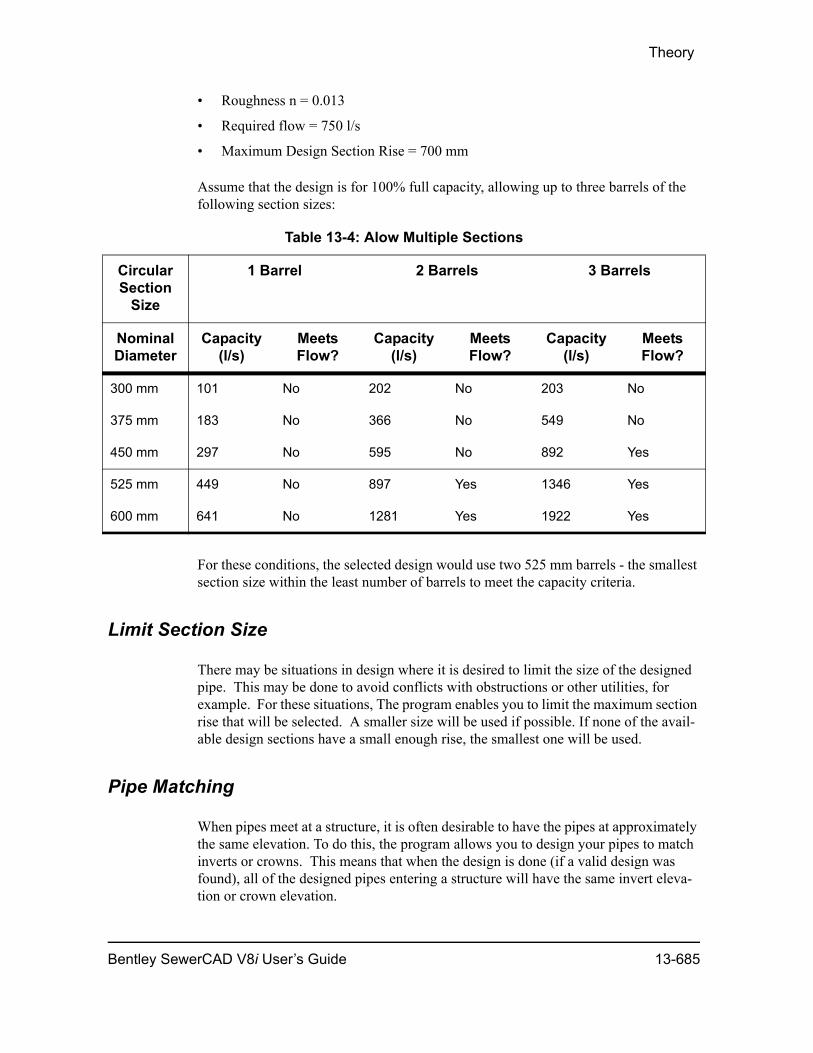
Theory
• Roughness n = 0.013
• Required flow = 750 l/s
• Maximum Design Section Rise = 700 mm
Assume that the design is for 100% full capacity, allowing up to three barrels of the following section sizes:
For these conditions, the selected design would use two 525 mm barrels - the smallest section size within the least number of barrels to meet the capacity criteria.
Limit Section Size
There may be situations in design where it is desired to limit the size of the designed pipe. This may be done to avoid conflicts with obstructions or other utilities, for example. For these situations, The program enables you to limit the maximum section rise that will be selected. A smaller size will be used if possible. If none of the avail-able design sections have a small enough rise, the smallest one will be used.
Pipe Matching
When pipes meet at a structure, it is often desirable to have the pipes at approximately the same elevation. To do this, the program allows you to design your pipes to match inverts or crowns. This means that when the design is done (if a valid design was found), all of the designed pipes entering a structure will have the same invert eleva-tion or crown elevation.
Table 13-4: Alow Multiple Sections
Circular Section
Size
1 Barrel 2 Barrels 3 Barrels
Nominal Diameter
Capacity (l/s)
Meets Flow?
Capacity (l/s)
Meets Flow?
Capacity (l/s)
Meets Flow?
300 mm 101 No 202 No 203 No
375 mm 183 No 366 No 549 No
450 mm 297 No 595 No 892 Yes
525 mm 449 No 897 Yes 1346 Yes
600 mm 641 No 1281 Yes 1922 Yes
Bentley SewerCAD V8i User’s Guide 13-685
Constraint Based Automatic Design
Offset Matching
If an offset value is specified, it represents the desired drop across the structure. The design incorporates this offset, resulting in upstream pipes that are higher than the downstream pipe by the specified offset. Note that all designed upstream pipes will have the same invert or crown elevation.
For example, an offset of 0.1 meter could result in a downstream pipe with an invert of 100.0 meters, and several upstream pipes with invert elevations at 100.1 meters.
Drop Structures
Drop structures are structures at which the incoming pipes are not all at the same elevation, nor do any of them necessarily match the downstream pipe. Including these structures may help to reduce excavation, since the entire upstream system does not need to be as deep.
The program will only use drop structures if you have chosen to allow them, and if a pipe's maximum slope constraint cannot be met. Otherwise, the upstream system will be designed as needed to maintain the desired slope and velocity constraints, which may require significantly lower pipe elevations.
Structure invert Elevations
The program can adjust structure invert elevations to account for the invert elevations of newly designed pipes, and any desired additional invert depth.
For example, if a structure is to be adjusted with a invert depth of 0.5 meters and the lowest pipe invert is 100.0 meters, the structure invert elevation would be set to 99.5 meters.
Design Priorities
Unfortunately, it is not always possible to automate a design that meets all desired constraints. With this in mind, there are certain priorities that are considered when the automated design is performed. These priorities are in place to try to minimize the effect on existing portions of the system while providing appropriate capacity in the designed pipes.
While this sequence does not go into complete detail regarding the design process, it does indicate the general priorities for the automated design. The priorities, of course, only deal with elements that are being designed. If a pipe has fixed inverts or is not to be designed at all, some or all of these criteria obviously do not apply.
13-686 Bentley SewerCAD V8i User’s Guide
Theory
A Designed Pipe Should Fit within Adjacent Existing Structures
If a pipe connects to an existing structure, the pipe rise should be completely within the existing structure. The only time this may be violated is if there are no available section sizes that would not violate that condition (i.e., the existing structure height is so small that all available pipes have rises too big). In this very unlikely condition, the smallest available section size will be selected, with the invert elevation placed at the bottom of the structure.
A Designed Pipe Should Not Have a Crown Above an Adjacent Designed Structure
Where pipe inverts are fixed, it is possible that the required section size would cause the pipe crown to be higher than the top elevation of an adjacent designed structure. If all available pipe section rises are greater than the depth of the pipe invert, the smallest pipe size will be chosen.
Note: This situation will only be encountered in situations where the structure's top elevation is set equal to the ground elevation - otherwise, the structure will be designed with a higher top elevation.
Pipe Capacity Should Be Greater Than the Discharge
If the pipe is not limited by adjacent structures, the pipe should be sized such that the design capacity is greater than the calculated discharge in the pipe. The design capacity may be based on one or more pipes, flowing full or part-full, depending on user-set design options. If site restrictions or available section limitations result in a situation where no sections meet the required capacity, the largest available size and number of barrels will be chosen.
Bentley SewerCAD V8i User’s Guide 13-687
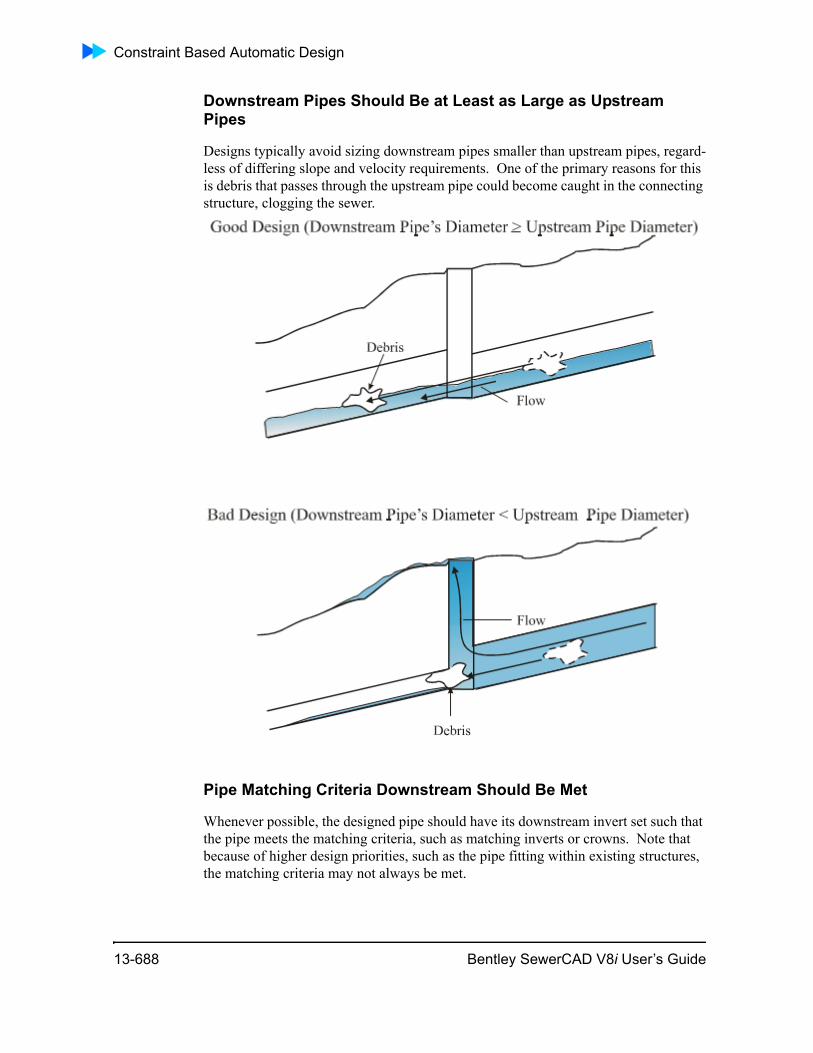
Constraint Based Automatic Design
Downstream Pipes Should Be at Least as Large as Upstream Pipes
Designs typically avoid sizing downstream pipes smaller than upstream pipes, regard-less of differing slope and velocity requirements. One of the primary reasons for this is debris that passes through the upstream pipe could become caught in the connecting structure, clogging the sewer.
Pipe Matching Criteria Downstream Should Be Met
Whenever possible, the designed pipe should have its downstream invert set such that the pipe meets the matching criteria, such as matching inverts or crowns. Note that because of higher design priorities, such as the pipe fitting within existing structures, the matching criteria may not always be met.
13-688 Bentley SewerCAD V8i User’s Guide
Theory
Minimum Cover Constraint Should Be Met
Pipe inverts should be set such that the upstream and downstream crowns of the pipe are below the ground elevation by at least the amount of the minimum cover. Note that higher design priorities, such as existing structure locations and matching criteria, may prevent the minimum cover constraint from being met.
Pipe Matching Criteria Upstream Should Be Met
The upstream invert of the designed pipe should be set to meet the matching criteria of the upstream structure. Higher design priorities, such as minimum cover constraints, may result in a pipe that does not match upstream as desired.
Maximum Slope Constraint Should Be Met
Wherever possible, the designed pipe should not exceed the desired maximum slope. In some situations, elevation differences across the system may result in a case where a drop structure can be used to offset pipes. This is used instead of a pipe that is too steep, or instead of upstream piping that would require much more excavation. Note that the maximum slope constraint may be violated if higher priority design consider-ations, such as existing structure location or pipe matching criteria, governs.
Other Constraints and Considerations
There are many degrees of freedom when designing a piping system. Several constraints that are not mentioned above, such as minimum velocity constraints and minimum slope constraints, may also result in adjustments to the designed pipe. Other constraints may be too limiting, such as maximum cover constraint and maximum velocity, resulting in designed pipes that could violate too many other constraints.
This wide range of choices and priorities emphasizes the need for careful review of any automated design by a professional. It is not always possible to meet every desired condition, so it is very much the responsibility of the engineer to make final judgments and decisions regarding the best design for the client.
Automatic Design with Hydrograph and Pattern Loads
Automatic designs are run only during a Steady State analysis, which examines only a single instant in time. There are some key behaviors attributed to time-based loads that you may wish to take into account when designing the system.
Bentley SewerCAD V8i User’s Guide 13-689
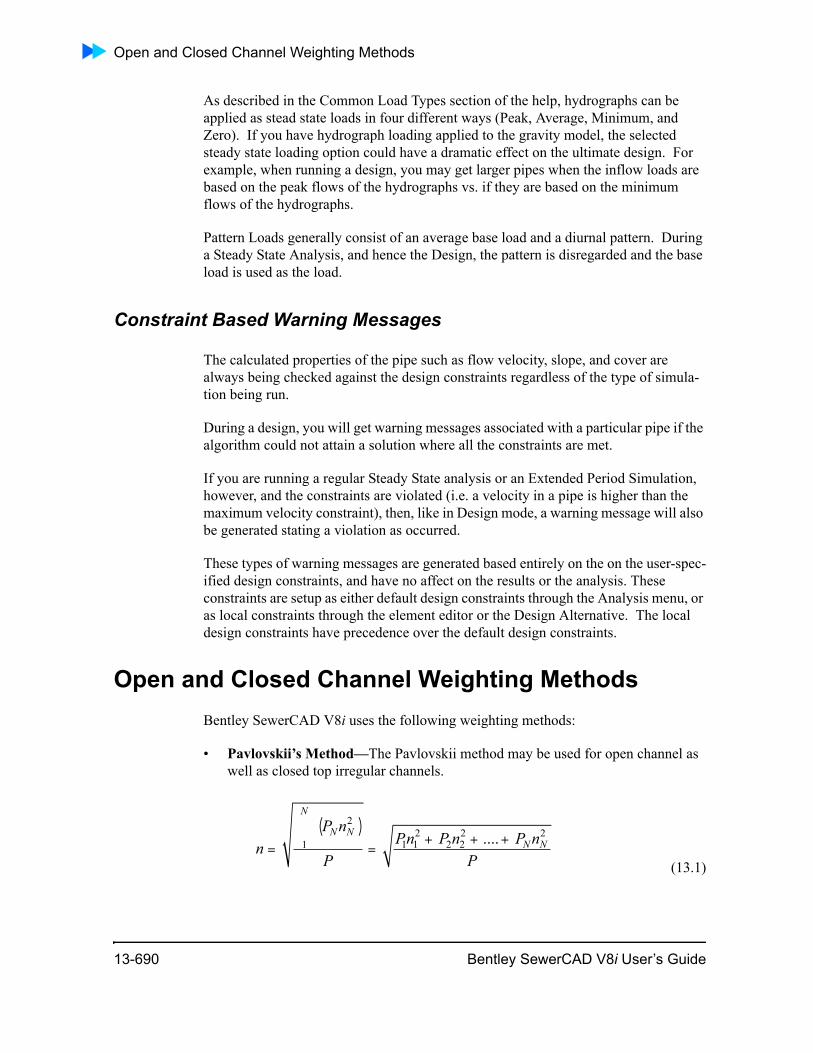
Open and Closed Channel Weighting Methods
As described in the Common Load Types section of the help, hydrographs can be applied as stead state loads in four different ways (Peak, Average, Minimum, and Zero). If you have hydrograph loading applied to the gravity model, the selected steady state loading option could have a dramatic effect on the ultimate design. For example, when running a design, you may get larger pipes when the inflow loads are based on the peak flows of the hydrographs vs. if they are based on the minimum flows of the hydrographs.
Pattern Loads generally consist of an average base load and a diurnal pattern. During a Steady State Analysis, and hence the Design, the pattern is disregarded and the base load is used as the load.
Constraint Based Warning Messages
The calculated properties of the pipe such as flow velocity, slope, and cover are always being checked against the design constraints regardless of the type of simula-tion being run.
During a design, you will get warning messages associated with a particular pipe if the algorithm could not attain a solution where all the constraints are met.
If you are running a regular Steady State analysis or an Extended Period Simulation, however, and the constraints are violated (i.e. a velocity in a pipe is higher than the maximum velocity constraint), then, like in Design mode, a warning message will also be generated stating a violation as occurred.
These types of warning messages are generated based entirely on the on the user-spec-ified design constraints, and have no affect on the results or the analysis. These constraints are setup as either default design constraints through the Analysis menu, or as local constraints through the element editor or the Design Alternative. The local design constraints have precedence over the default design constraints.
Open and Closed Channel Weighting MethodsBentley SewerCAD V8i uses the following weighting methods:
• Pavlovskii’s Method—The Pavlovskii method may be used for open channel as well as closed top irregular channels.
(13.1)n
P n
P
Pn P n P n
P
N N
N
N N=( )
=+ + +
2
1 1 12
2 22 2....
13-690 Bentley SewerCAD V8i User’s Guide
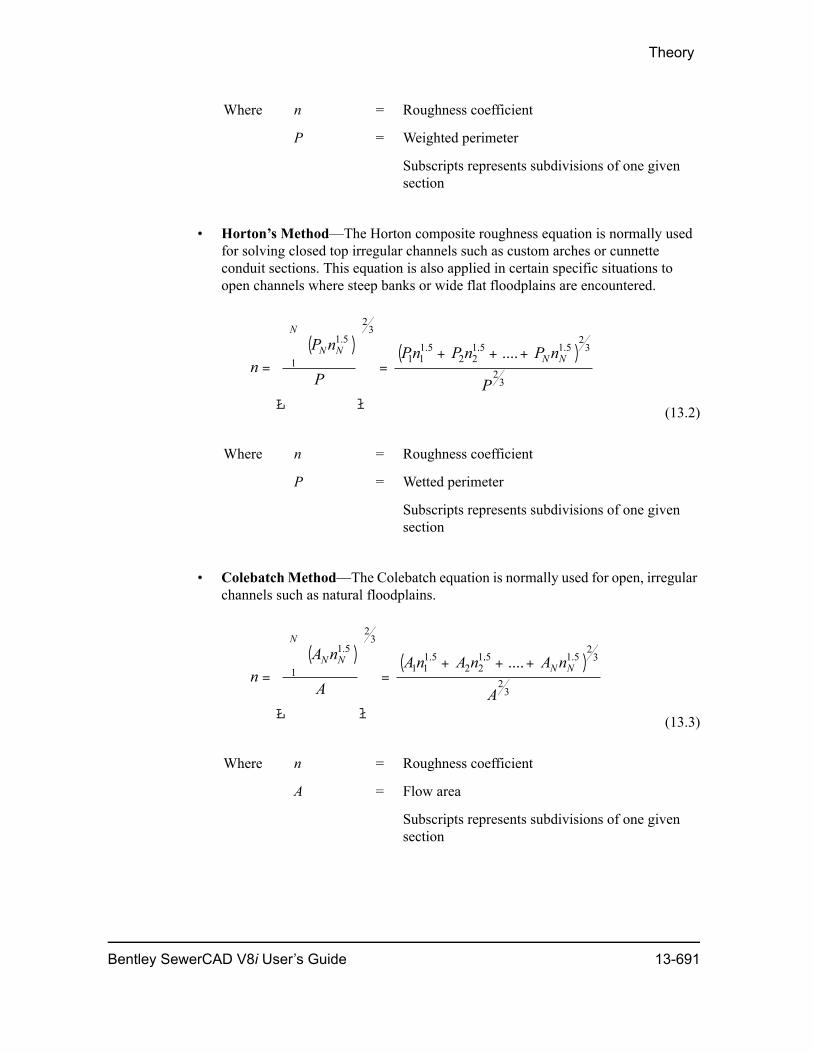
Theory
• Horton’s Method—The Horton composite roughness equation is normally used for solving closed top irregular channels such as custom arches or cunnette conduit sections. This equation is also applied in certain specific situations to open channels where steep banks or wide flat floodplains are encountered.
(13.2)
• Colebatch Method—The Colebatch equation is normally used for open, irregular channels such as natural floodplains.
(13.3)
Where n = Roughness coefficient
P = Weighted perimeter
Subscripts represents subdivisions of one given section
Where n = Roughness coefficient
P = Wetted perimeter
Subscripts represents subdivisions of one given section
Where n = Roughness coefficient
A = Flow area
Subscripts represents subdivisions of one given section
n
P n
P
Pn P nN N
N
=( )
Ł ł
=+
1 5
1
23
1 11 5
2 21
.. .. .....5 1 5
23
23
+ +( )P n
P
N N
n
A n
A
An A nN N
N
=( )
Ł ł
=+
1 5
1
23
1 11 5
2 21
.. .. .....5 1 5
23
23
+ +( )A n
A
N N
Bentley SewerCAD V8i User’s Guide 13-691
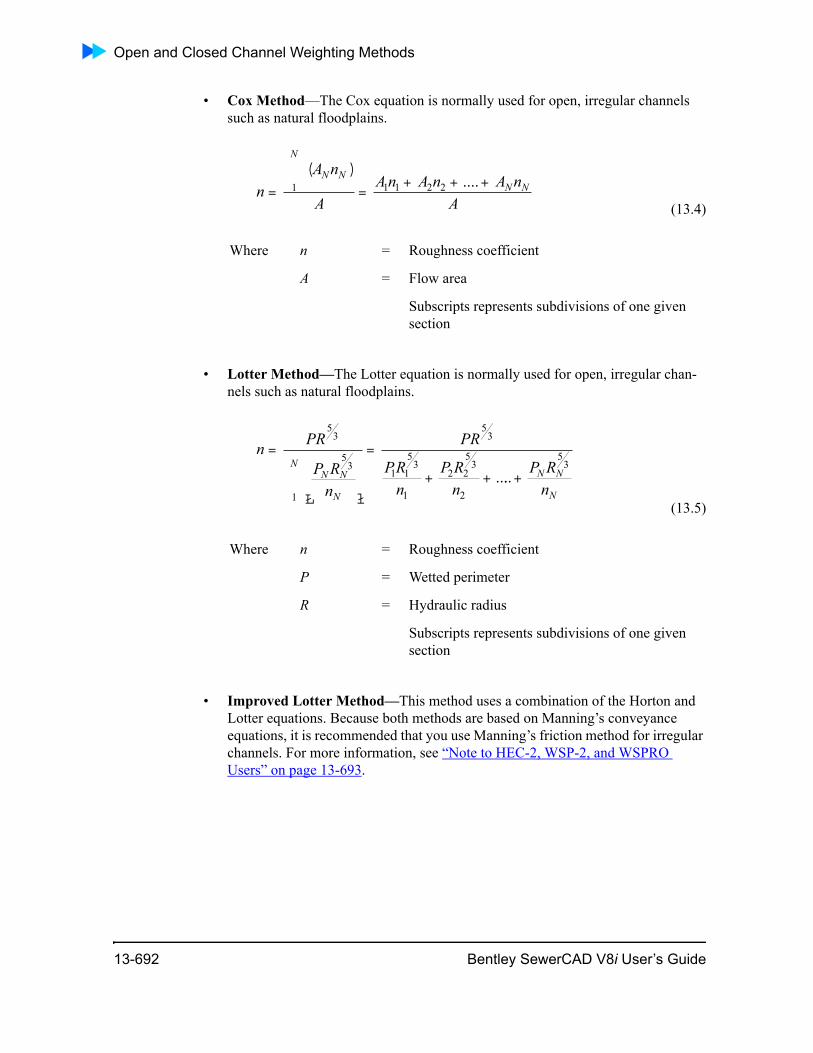
Open and Closed Channel Weighting Methods
• Cox Method—The Cox equation is normally used for open, irregular channels such as natural floodplains.
(13.4)
• Lotter Method—The Lotter equation is normally used for open, irregular chan-nels such as natural floodplains.
(13.5)
• Improved Lotter Method—This method uses a combination of the Horton and Lotter equations. Because both methods are based on Manning’s conveyance equations, it is recommended that you use Manning’s friction method for irregular channels. For more information, see “Note to HEC-2, WSP-2, and WSPRO Users” on page 13-693.
Where n = Roughness coefficient
A = Flow area
Subscripts represents subdivisions of one given section
Where n = Roughness coefficient
P = Wetted perimeter
R = Hydraulic radius
Subscripts represents subdivisions of one given section
n
A n
A
An A n A n
A
N N
N
N N=
( )=
+ + +1 1 1 2 2 ....
nPR
P Rn
PR
PRn
P Rn
N N
N
N=
Ł ł
=
+ +
53
53
1
53
1 1
53
1
2 2
53
2
.....+P RnN N
N
53
13-692 Bentley SewerCAD V8i User’s Guide
Theory
Note to HEC-2, WSP-2, and WSPRO Users
Improved Lotter Method uses a weighted roughness method for solving uniform flow equations unlike most standard step backwater programs (HEC-2, WSP-2, and WSPRO), which use a segmented conveyance method. Improved Lotter weighted roughness method is more general and, unlike the step backwater programs, can be used for both open channel sections and closed sections. Improved Lotter Method will produce results similar to the segmented conveyance method (HEC-2, WSP-2, WSPRO) except for the following two cases:
Sections containing steep vertical segments or flat shallow submerged overbanks intersected by water surface. The segmented conveyance method (HEC-2, WSP-2, and WSPRO) tends to underestimate effective roughness, and in many instances the effective weighted roughness will be actually lower than any of the input segment roughnesses. Bentley SewerCAD V8i's weighted roughness method avoids underesti-mating effective roughness by combining adjacent segments using Horton's equation in a manner similar to the method applied for subdivided main channels with banks steeper than 5H:1V as documented in Section 2.3 of the HEC-2 User's Manual (September, 1990). Unlike HEC-2, Improved Lotter Method does not confine this correction to the main channel, but will make this adjustment at any location in the section. Improved Lotter Method also dynamically adjusts its flatness and steepness checks ensuring that computed roughness values will always be higher than the minimum input value encountered over the wetter flow area. For these situations, Improved Lotter Method yields a higher effective weighted roughness for the total section than the segmented conveyance method.
Special ConsiderationsThere are a few special considerations that should be realized when analyzing a sewer system. These are conditions where special asinverttions need to be made, or where calculations may seem counter-intuitive at first glance. These considerations include:
• Energy Discontinuity
• Structure Energy Grade
• Design Considerations
Energy Discontinuity
The program by default uses hydraulic grade as the basis for its hydraulic computa-tions. Energy grade at any given point is then computed by adding the velocity head to the hydraulic grade. Because of this standard practice, energy discontinuities may occasionally occur, such as when pipe size decreases in the downstream direction, or pipe slope increases.
Bentley SewerCAD V8i User’s Guide 13-693
Special Considerations
If you want the calculations to be based on the energy grade line you can change it with the Structure Loss Mode Calculation Option.
Flow discontinuities can also be responsible for energy discontinuities. Since a struc-ture is analyzed based on a different system time than a pipe, a direct comparison of energy grades is not reasonable.
Structure Energy Grade
The energy grade line (EGL) at the upstream side of a structure is computed based on the characteristics of the structure and its upstream pipes. The reported EGL is gener-ally reported as the lowest EGL of all non- plunging upstream pipes, based on normal-ized flow values. If there are no non-plunging pipes upstream, the structure's upstream EGL is taken as the higher of the structure's downstream EGL and upstream hydraulic grade line (HGL).
In situations where the structure's upstream EGL is lower than its downstream EGL or upstream HGL, the highest value governs. This rare condition may indicate that the presumed headloss in the structure is not significant enough to produce the expected energy loss. The modeler may accept this as a minor limitation of the hydraulic theory, or may choose to use different structure headloss methods or values.
The reported upstream velocity and velocity head for the structure are based on the difference between the structure's upstream EGL and HGL.
Design Considerations
As with any automated design, the program's design is intended only as a preliminary step. It will select pipe sizes and pipe invert elevations based on the input provided, but no computer program can match the skills that an experienced engineer has. The modeler should always review any automated design, and should make any changes required to adjust, improve, and otherwise polish the system.
Reporting Flow Attributes
SewerCAD has many attributes available in the FlexTables, Annotations, Color Coding, and Database/GIS connections on different aspects of flow in a sanitary sewer system. During a Steady State analysis the flow is broken down into categories, (I.e. wet weather, sanitary, known flow and so on). This is done so the program can apply the correct extreme flow methods. During an Extended Period Simulation essentially all the different flows are lumped together into a single hydrograph and the initial categories are disregarded.
13-694 Bentley SewerCAD V8i User’s Guide
Theory
In the gravity portion of the system there are two variables that can be used in both Extended Period Simulations and Steady State analyses. These are valuable to know if you are switching back and forth between the two analysis modes, and would like to maintain the same reports, color coding, etc…
• Total Flow - Is available for gravity pipes and gravity nodes. In gravity nodes it represents the sum of all the flow exiting the node. In gravity pipes during a Steady State analysis it represents the sum of all the flow entering into the pipe. In an Extended Period Simulation it represents the flow used during a time step's hydraulic analysis and represents a flow point on the pre-routed hydrograph.
• Diverted Flow Out - Is available for gravity nodes. Represents the flow exiting the node via a diversion.
In the pressure portion of the system, the Pressure Flow attribute for the pressure pipes shows the total amount of flow going through the pipe for a time step, and is available for both Extended Period Simulations and Steady State analyses.
Manning’s n CoefficientsTable 13-5: Manning’s n Coefficient Table
Lined Channels Manning’s n
Concrete, with surfaces as indicated Formed, no finish 0.013 – 0.017
Trowel finish 0.012 – 0.014
Float finish 0.013 – 0.015
Float finish, gravel on bottom 0.015 – 0.017
Gunite, good section 0.016 – 0.019
Gunite, wavy section 0.018 – 0.022
Concrete, bottom float-finished, sides as indicated
Dressed stone in mortar 0.015 – 0.017
Random stone in mortar 0.017 – 0.020
Cement rubble masonry 0.020 – 0.025
Cement rubble masonry, plastered 0.016 – 0.020
Dry rubble (riprap) 0.020 – 0.030
Gravel bottom, sides as indicated Formed concrete 0.017 – 0.020
Random stone in mortar 0.020 – 0.023
Dry rubble (riprap) 0.023 – 0.033
Bentley SewerCAD V8i User’s Guide 13-695
Manning’s n Coefficients
Brick 0.014 – 0.017
Asphalt Smooth 0.013
Rough 0.016
Wood, planed, clean 0.011 – 0.013
Concrete-lined excavated rock Good section 0.017 – 0.020
Irregular section 0.022 – 0.027
Unlined Channels Manning’s n
Earth, uniform section Clean, recently completed 0.016 – 0.018
Clean, after weathering 0.018 – 0.020
With short grass, few weeds 0.022 – 0.027
In gravely soil, uniform section, clean 0.022 – 0.025
Earth, fairly uniform section No vegetation 0.022 – 0.025
Grass, some weeds 0.025 – 0.030
Dense weeds or aquatic plants in deep channels 0.030 – 0.035
Sides clean, gravel bottom 0.025 – 0.030
Sides clean, cobble bottom 0.030 – 0.040
Dragline excavated or dredged No vegetation 0.028 – 0.033
Light brush on banks 0.035 – 0.050
Rock: Based on design section 0.035
Based on actual mean section Smooth and uniform 0.035 – 0.040
Jagged and irregular 0.040 – 0.045
Channels not maintained, weeds and brush uncut
Dense weeds, high as flow depth 0.08 – 0.12
Clean bottom, brush on sides 0.05 – 0.08
Clean bottom, brush on sides, highest stage of flow 0.07 – 0.11
Dense brush, high stage 0.10 – 0.14
Highway Channels and Swales with Maintained Vegetation Manning’s n
Table 13-5: Manning’s n Coefficient Table (Cont’d)
13-696 Bentley SewerCAD V8i User’s Guide
Theory
(Source: Searcy 1973.)
(Values shown are for velocities of 2 and 5 fps)
Depth of flow up to 0.7 ft.
Bermuda grass, Kentucky bluegrass, buffalo grass
Mowed to 2 in. 0.07 – 0.045
Length 4 to 6 in. 0.09 – 0.05
Good Stand, any grass Length about 12 in. 0.18 – 0.09
Length about 24 in. 0.30 – 0.15
Fair stand, any grass Length about 12 in. 0.14 – 0.08
Length about 24 in. 0.25 – 0.13
Depth flow 0.7 ft. to 1.5 ft.
Bermuda grass, Kentucky bluegrass, buffalo grass
Mowed to 2 in. 0.05 – 0.035
Length 4 to 6 in. 0.06 – 0.04
Good Stand, any grass Length about 12 in. 0.12 – 0.07
Length about 24 in. 0.20 – 0.10
Fair stand, any grass Length about 12 in. 0.10 – 0.06
Length about 24 in. 0.17 – 0.09
Gutters Manning’s n
Concrete gutter Troweled finish 0.012
Asphalt pavement Smooth texture 0.013
Rough texture 0.016
Concrete gutter with asphalt pavement Smooth 0.013
Rough 0.015
Concrete pavement Float finish 0.014
Broom finish 0.016
For gutters with small slope, where sediment may accumulate, increase all above values of n by 0.002
Table 13-5: Manning’s n Coefficient Table (Cont’d)
Bentley SewerCAD V8i User’s Guide 13-697
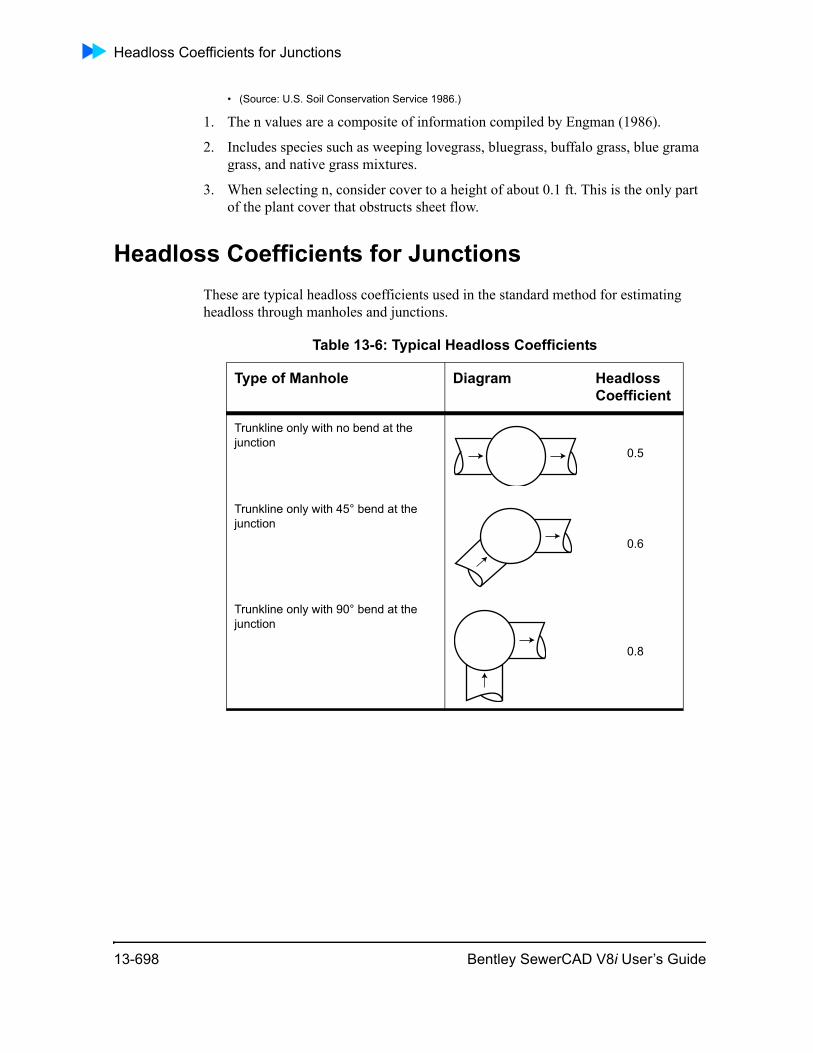
Headloss Coefficients for Junctions
• (Source: U.S. Soil Conservation Service 1986.)
1. The n values are a composite of information compiled by Engman (1986).
2. Includes species such as weeping lovegrass, bluegrass, buffalo grass, blue grama grass, and native grass mixtures.
3. When selecting n, consider cover to a height of about 0.1 ft. This is the only part of the plant cover that obstructs sheet flow.
Headloss Coefficients for JunctionsThese are typical headloss coefficients used in the standard method for estimating headloss through manholes and junctions.
Table 13-6: Typical Headloss Coefficients
Type of Manhole Diagram Headloss Coefficient
Trunkline only with no bend at the junction
0.5
Trunkline only with 45° bend at the junction
0.6
Trunkline only with 90° bend at the junction
0.8
13-698 Bentley SewerCAD V8i User’s Guide
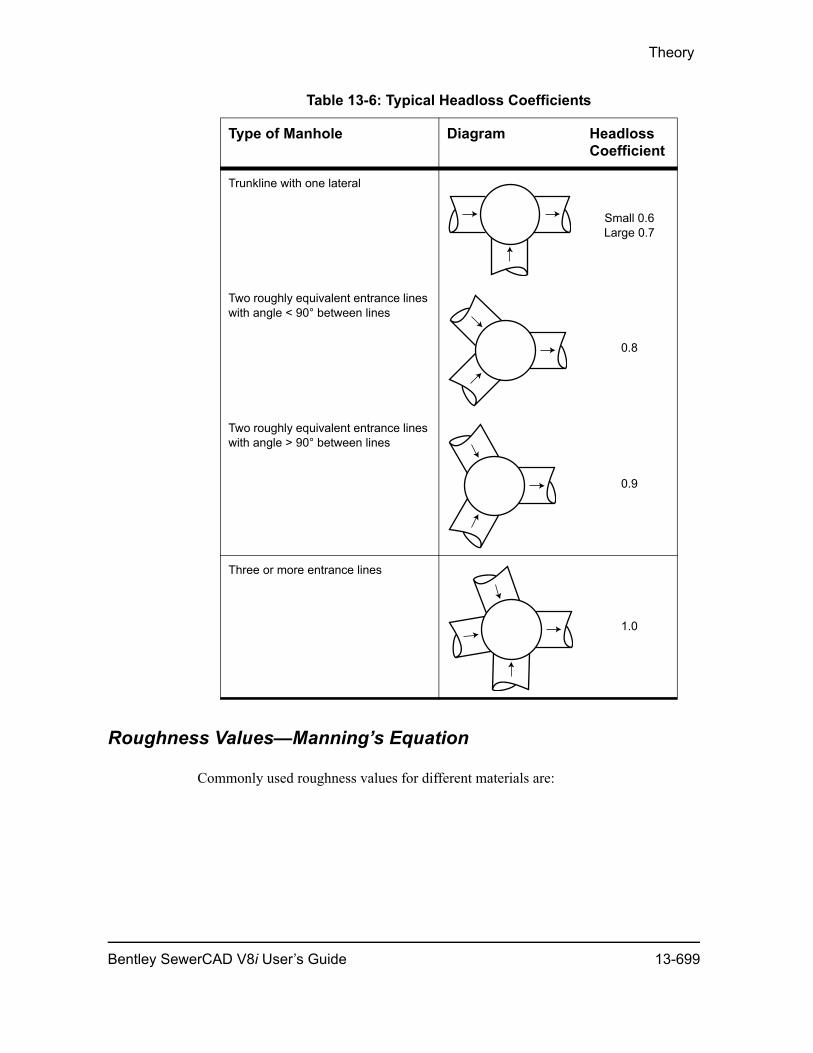
Theory
Roughness Values—Manning’s Equation
Commonly used roughness values for different materials are:
Trunkline with one lateral
Small 0.6Large 0.7
Two roughly equivalent entrance lines with angle < 90° between lines
0.8
Two roughly equivalent entrance lines with angle > 90° between lines
0.9
Three or more entrance lines
1.0
Table 13-6: Typical Headloss Coefficients
Type of Manhole Diagram Headloss Coefficient
Bentley SewerCAD V8i User’s Guide 13-699
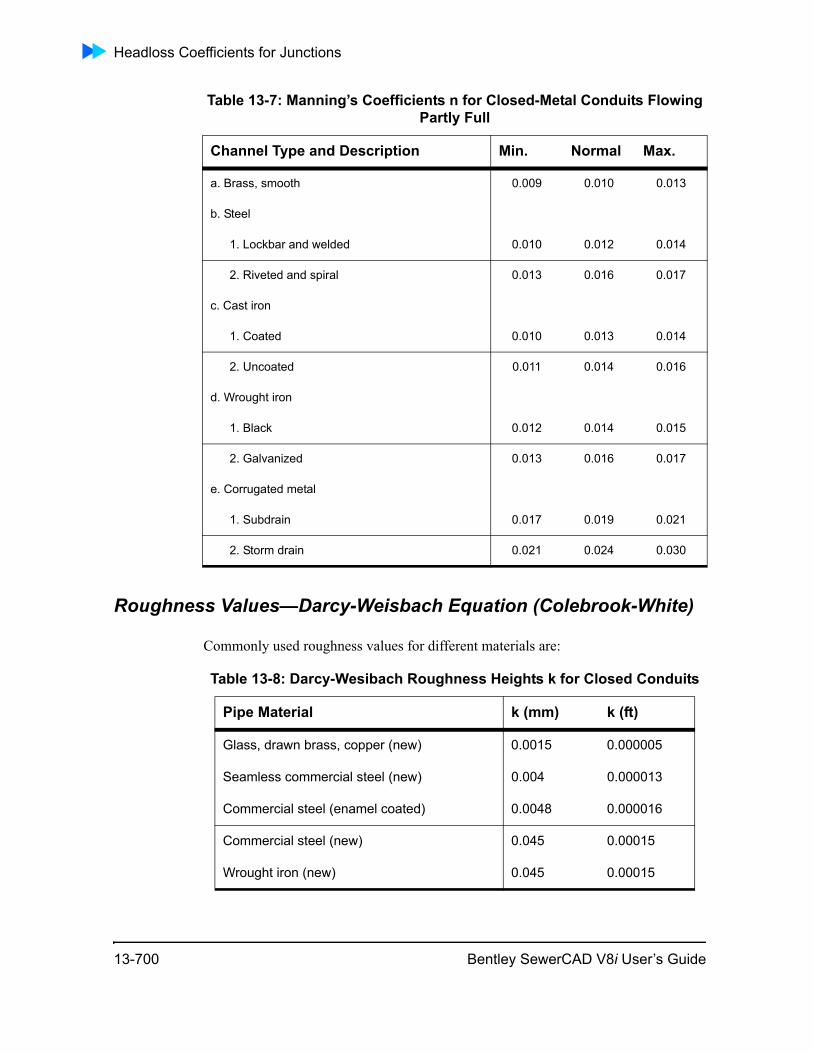
Headloss Coefficients for Junctions
Roughness Values—Darcy-Weisbach Equation (Colebrook-White)
Commonly used roughness values for different materials are:
Table 13-7: Manning’s Coefficients n for Closed-Metal Conduits Flowing Partly Full
Channel Type and Description Min. Normal Max.
a. Brass, smooth 0.009 0.010 0.013
b. Steel
1. Lockbar and welded 0.010 0.012 0.014
2. Riveted and spiral 0.013 0.016 0.017
c. Cast iron
1. Coated 0.010 0.013 0.014
2. Uncoated 0.011 0.014 0.016
d. Wrought iron
1. Black 0.012 0.014 0.015
2. Galvanized 0.013 0.016 0.017
e. Corrugated metal
1. Subdrain 0.017 0.019 0.021
2. Storm drain 0.021 0.024 0.030
Table 13-8: Darcy-Wesibach Roughness Heights k for Closed Conduits
Pipe Material k (mm) k (ft)
Glass, drawn brass, copper (new) 0.0015 0.000005
Seamless commercial steel (new) 0.004 0.000013
Commercial steel (enamel coated) 0.0048 0.000016
Commercial steel (new) 0.045 0.00015
Wrought iron (new) 0.045 0.00015
13-700 Bentley SewerCAD V8i User’s Guide
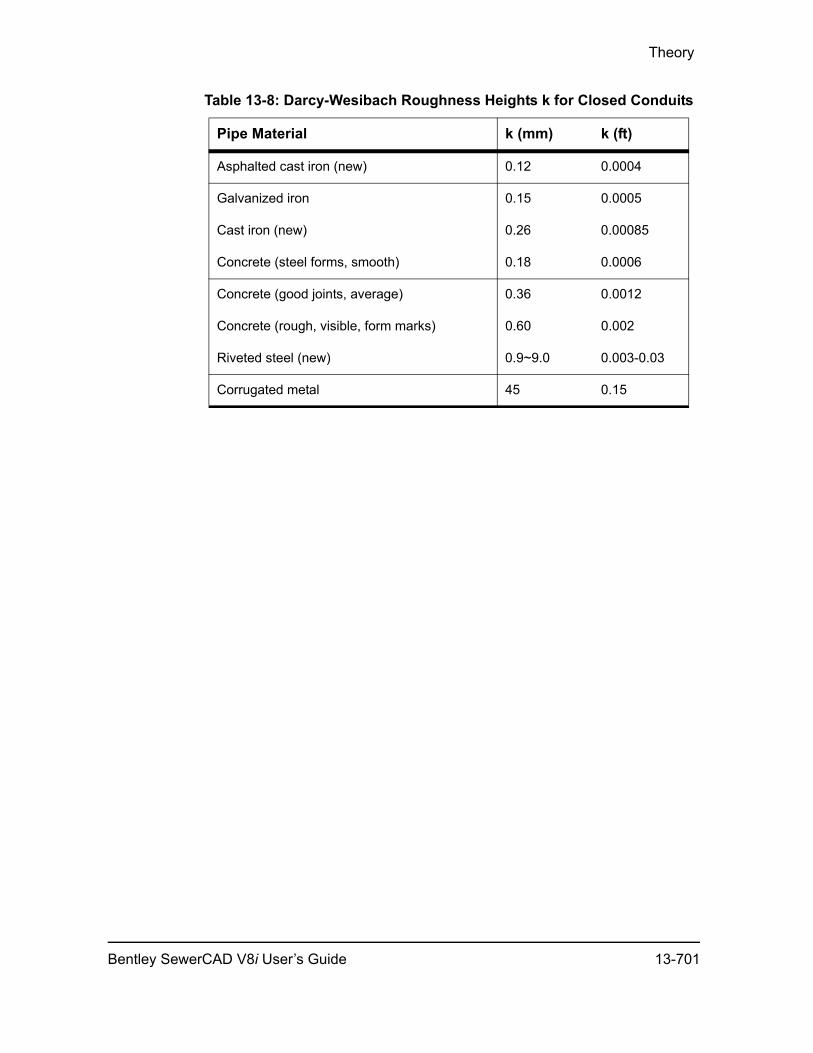
Theory
Asphalted cast iron (new) 0.12 0.0004
Galvanized iron 0.15 0.0005
Cast iron (new) 0.26 0.00085
Concrete (steel forms, smooth) 0.18 0.0006
Concrete (good joints, average) 0.36 0.0012
Concrete (rough, visible, form marks) 0.60 0.002
Riveted steel (new) 0.9~9.0 0.003-0.03
Corrugated metal 45 0.15
Table 13-8: Darcy-Wesibach Roughness Heights k for Closed Conduits
Pipe Material k (mm) k (ft)
Bentley SewerCAD V8i User’s Guide 13-701

Headloss Coefficients for Junctions
13-702 Bentley SewerCAD V8i User’s Guide
14
AppendixReferences
Ming Jin, Samuel Coran and Jack Cook (2004), “New One-Dimensional Implicit Numerical Dynamic Sewer and Storm Model”, Haestad Methods Inc., Waterbury, CT
Ben C. Yen (2001), "Hydraulics of Sewer System", in Stormwater Collection Systems Design Handbook, ed. Larry W. Mays, McGraw-Hill, New York
Danny L. Fread (1993), "Flow Routing", in Handbook of Hydrology, ed David R. Maidment, McGraw-Hill, New York
Ming Jin and Danny L. Fread (2000) "Discussion on the Application of Relaxation Scheme to Wave-Propagation Simulation in Open-Cannel Networks", Journal of Hydraulic Eng., ASCE, 126(1), 89-91.
Ming Jin and Danny L. Fread (1999) "One-dimensional modeling of mud/debris unsteady flows", Journal of Hydraulic Eng., ASCE, 25(8), 827-834.
Ming Jin and Danny L. Fread (1997) "Dynamic flood routing with explicit and implicit numerical solution schemes", Journal of Hydraulic Eng., ASCE, 123(3), 166-173.
Bentley SewerCAD V8i User’s Guide 14-703

14-704 Bentley SewerCAD V8i User’s Guide

15
AppendixAbout BentleySystems
Bentley Systems, Incorporated provides software for the lifecycle of the world’s infra-structure. The company’s comprehensive portfolio for the building, plant, civil, and geospatial vertical markets spans architecture, engineering, construction (AEC) and operations. Bentley is the leading provider of AEC software to the Engineering News-Record Design 500 and major owner-operators. For more information, visit the Bentley Web site at http://www.bentley.com.
Bentley Systems, Inc. offers software solutions to civil engineers throughout the world for analyzing, modeling, and designing all sorts of hydrologic and hydraulic systems, from municipal water and sewer systems to stormwater ponds, open channels, and more. With point-and-click data entry, flexible units, and report-quality output, Bentley Systems, Inc. is the ultimate source for your modeling needs.
In addition to the ability to run in Stand-Alone mode with a CAD-like interface, three of our products—WaterCAD, StormCAD, and Bentley SewerCAD V8i—can be totally integrated within AutoCAD. These three programs also share numerous powerful features, such as scenario management, unlimited undo/redo, customizable tables for editing and reporting, customizable GIS, database and spreadsheet connec-tion, and annotation.
Be sure to contact us or visit our Web site at http://www.haestad.com to find out about our latest software, books, training, and open houses.
Click one of the following links to learn more:
• “Software”
• “Bentley Institute Press”
• “Training”
• “Internet Resources”
SoftwareBentley Systems, Inc. software includes:
Bentley SewerCAD V8i User’s Guide 15-705
Software
• “CivilStorm”
• “SewerGEMS”
• “SewerGEMS”
• “WaterGEMS”
• “WaterCAD”
• “StormCAD”
• “PondPack”
• “FlowMaster”
• “CulvertMaster”
• “HAMMER”
• “GISConnect”
CivilStorm
CivilStorm revolutionizes municipal stormwater management. Whether your concern is a stormwater master plan, localized flooding, GASB34 requirements, water quality BMPs, NPDES permitting, or just simply being able to do faster and smarter designs every day, CivilStorm fits your needs. It is the only commercially available software package that lets you analyze all your system elements in one package. CivilStorm also gives you the ability to perform analyses using either the SWMM algorithm or CivilStorm's own implicit solution of full Saint-Venant equations.
CivilStorm provides numerical solutions for the toughest interconnected pipe, pond, and open channel networks, and provides stunning graphics and reporting tools for visualizing your storm systems in action.
Use CivilStorm For:
• Comprehensive Stormwater Master Plans
• Watershed-Based Master Planning
• Analysis of Open-channel, Closed-conduit and Combination systems
• Floodplain Studies
• Complex Flow Regime Analysis
• Water Quality Assessments
• Integrated Stormwater Quantity and Quality Assessments
• NPDES Permitting
CivilStorm can be run in a MicroStation integrated interface, a Stand-Alone graphical user interface, or an AutoCAD integrated interface.
15-706 Bentley SewerCAD V8i User’s Guide
About Bentley Systems
SewerGEMS
SewerGEMS is the first and only fully-dynamic, multi-platform (GIS, CAD, and Stand-Alone) sanitary and combined sewer modeling solution. With SewerGEMS, you will analyze all sanitary and combined sewer system elements in one package and have the option of performing the analyses with the SWMM algorithm or our own implicit solution of the full Saint Venant equations.
Simply put, SewerGEMS offers the most comprehensive solution available for opti-mizing Best Management Practice (BMP) designs and meeting sanitary sewer over-flow (SSO) and combined sewer overflow (CSO) regulations.
With SewerGEMS, you can:
• Develop system master plans
• Assess the impact of inflow and infiltration on SSOs
• Develop SSO and CSO remediation programs
• Perform system evaluations associated with US EPA CMOM and NPDES
• Optimize lift station and system storage capacities
• Determine developer connection fees
• Implement real-time control strategies
• Model relief sewers, overflow diversions, and inverted siphons
• Accurately simulate operations with variable-speed pumping and logical controls
• Simulate out-of-service or proposed sewers within the same model
SewerGEMS
SewerGEMS revolutionizes municipal stormwater management. Whether your concern is a stormwater master plan, localized flooding, GASB34 requirements, water quality BMPs, NPDES permitting, or just simply being able to do faster and smarter designs every day, SewerGEMS fits your needs. It is the only commercially available software package that lets you analyze all your system elements in one package. SewerGEMS also gives you the ability to perform analyses using either the SWMM algorithm or SewerGEMS’s own implicit solution of full Saint-Venant equations.
SewerGEMS provides numerical solutions for the toughest interconnected pipe, pond, and open channel networks, and provides stunning graphics and reporting tools for visualizing your storm systems in action.
Use SewerGEMS For:
• Comprehensive Stormwater Master Plans
Bentley SewerCAD V8i User’s Guide 15-707

Software
• Watershed-Based Master Planning
• Analysis of Open-channel, Closed-conduit and Combination systems
• Floodplain Studies
• Complex Flow Regime Analysis
• Water Quality Assessments
• Integrated Stormwater Quantity and Quality Assessments
• NPDES Permitting
WaterGEMS
WaterGEMS brings the concept of water modeling and GIS integration to the next level. It is the only water-distribution modeling software that provides full, completely seamless integration with GIS applications. Now the combined functionality of WaterCAD and GIS can be utilized simultaneously, synthesizing the distinct advan-tages of each application to create a modeling tool with an unprecedented level of freedom, power, efficiency, and usability.
You can create, display, edit, run, map, and design water models from within the GIS environment, and view the results of the simulations as native GIS maps or with tradi-tional Haestad Methods modeling tools. These abilities, in conjunction with the cross-product functionality provided by the core Unified Data and Object Model architec-ture, provide a powerful cutting-edge solution for your modeling projects.
WaterGEMS works within your choice of environments: ArcView, ArcEdit, ArcInfo, AutoCAD, or the standalone WaterGEMS Modeler interface.
WaterCAD
WaterCAD is the definitive model for complex pressurized-pipe networks, such as municipal water-distribution systems. You can use WaterCAD to perform a variety of functions, including steady-state and extended-period simulations of pressure networks with pumps, tanks, control valves, and more.
WaterCAD’s abilities also extend into public safety and long-term planning issues, with extensive water quality features, automated fire protection analyses, comprehen-sive scenario management, and enterprise-wide data-sharing capabilities.
WaterCAD is available with your choice of a stand-alone graphical user interface and/or an AutoCAD-integrated interface.
SewerCAD can be run in a stand-alone graphical user interface, an AutoCAD-inte-grated interface, or an ArcView- or ArcInfo-integrated interface.
15-708 Bentley SewerCAD V8i User’s Guide
About Bentley Systems
StormCAD
StormCAD is a highly efficient model for the design and analysis of storm sewer collection systems. From graphical layout and intelligent network connectivity to flex-ible reports and profiles, StormCAD covers all aspects of storm-sewer modeling.
Surface inlet networks are independent of pipe connectivity and inlet hydraulics conform to FHWA HEC-22 methodologies. Gradually varied flow algorithms and a variety of popular junction-loss methods are the foundation of StormCAD’s robust gravity piping computations, which handle everything from surcharged pipes and diversions to hydraulic jumps.
StormCAD is available with your choice of a stand-alone graphical user interface, an AutoCAD-integrated interface, or an ArcView- or ArcInfo-integrated interface.
PondPack
PondPack is a comprehensive, Windows-based hydrologic modeling program that analyzes a tremendous range of situations, from simple sites to complex networked watersheds. PondPack analyzes pre- and post-developed watershed conditions and estimates required storage ponds. PondPack performs interconnected pond routing, and also computes outlet rating curves with tailwater effects, multiple outfalls, pond infiltration, and pond-detention times.
PondPack builds customized reports organized by categories, automatically creating section and page numbers, tables of contents, and indexes. You can quickly create an executive summary for an entire watershed or build an elaborate drainage report showing any or all report items. Graphical displays, such as watershed diagrams, rain-fall curves, and hydrographs, are fully compatible with other Windows software.
FlowMaster
FlowMaster is an efficient program for the design and analysis of a wide variety of hydraulic elements, such as pressure pipes, open channels, weirs, orifices, and inlets. FlowMaster’s Hydraulics Toolbox can create rating tables and performance curves for any variables, using popular friction methods. Inlet calculations follow the latest FHWA guidelines, and weighting of irregular section roughness can be based on any popular techniques.
Bentley SewerCAD V8i User’s Guide 15-709

Software
CulvertMaster
CulvertMaster helps engineers design new culverts and analyze existing culvert hydraulics, from single-barrel crossings to complex multibarrel culverts with roadway overtopping. CulvertMaster computations use HDS No. 5 methodologies, allowing you to solve for whatever hydraulic variables you do not know, such as culvert size, peak discharge, and headwater elevation. Output capabilities include comprehensive detailed reports, rating tables, and performance curves.
HAMMER
HAMMER is the premier software in the world for analyzing hydraulic transients, surge control devices, and water hammer effects. HAMMER models any hydraulic element, transient source or surge protection devices, including:
• Transients for flow, head, or entrained vapor
• Pressurized pipelines and networks
• Ingress of contaminants into pipe networks
• Surcharged sewers or storage tunnels
• Pump start and shut down scenarios
• Flow shifting via pumps or valves
• Power or pump failure
• Rapid valve closure
• Catastrophic pipe or pump breaks
HAMMER can easily import steady-state model results from industry-standard models such as WaterCAD, WaterGEMS, EPANET, or EXTRAN (for line filling). Users can also build their own models using the advanced graphical interface or robust database connections.
GISConnect
Run your GIS inside AutoCAD®. GISConnect is the long anticipated product that brings together the data management power of ArcGIS® and the drawing capabilities of AutoCAD®. Master your company's existing CAD expertise to deliver the GIS solutions that your clients demand.
15-710 Bentley SewerCAD V8i User’s Guide

About Bentley Systems
Bentley Institute Press• HPRESS_Logo_CMYK.eps
Bentley Institute Press provides civil engineering professionals with affordable, quality reference and textbooks dedicated to the practical application of engineering theory to hydraulics and hydrology. Bentley Institute Press publications include:
References and Textbooks: Authored by industry-recognized experts, Bentley Institute Press offers a complete line of reference books for use in both academic and professional settings.
Technical Journals: With an eye towards computer technology, journals like “Current Methods” address the latest innovations in water-resources modeling and practical modeling case studies, as well as offering credit towards certification.
Independent Papers: Bentley Institute Press also provides funding for engineers to write case studies of their projects, with potential publication in a variety of industry journals and magazines.
Books from Bentley Institute Press:
Advanced Water Distribution Modeling and Management, first editionHaestad, Walski, Chase, Savic, Grayman, Beckwith, and Koelle
Computer Applications in Hydraulic Engineering, fifth editionHaestad, Walski, Barnard, Durrans, and Meadows
Floodplain Modeling Using HEC-RAS, first editionHaestad, Dyhouse, Hatchett, and Benn
Proceedings of the First Annual Water Security Summit, first editionHaestad
Stormwater Conveyance Modeling and Design, first editionHaestad and Durrans
Wastewater Collection System Modeling and Design, first editionHaestad, Walski, Barnard, Merritt, Harold, Walker, and Whitman
Water Distribution Modeling, first editionHaestad, Walski, Chase, and Savic
Bentley SewerCAD V8i User’s Guide 15-711

Training
To order or to receive additional information on these or any other Bentley Institute Press titles, please call 800-727-6555 (U.S. and Canada) or +1-203-755-1666 (world-wide) or visit www.bentley.com/books.
TrainingThe Bentley Institute manages professional training programs to ensure consistent, high quality, user training for a variety of Bentley products and varying levels of application experience. Bentley Institute training is developed to maximize your productivity by using examples relevant to your day-to-day project efforts. Training is developed concurrently with software applications to provide knowledge of the latest tools and features. Additionally, all Bentley Institute faculty meet rigorous certifica-tion requirements.
The Bentley Institute offers complete training for Haestad Methods products.These training programs are famous for efficiently and effectively teaching engineers how to apply hydraulic theory and state-of-the-art software to real-world design situations.
• Modelers can become certified in a variety of water-related fields, through an assortment of teaching methods including:
• JumpStart Seminars
• Comprehensive Workshops
• Publication-Based Programs
To obtain more information about Bentley Systems, Inc. certification programs or to see upcoming events in a city near you, visit http://www.haestad.com.
Accreditations
Bentley Systems has achieved the highest levels of accreditation from both the Inter-national Association for Continuing Education and Training (IACET) and the Profes-sional Development Registry for Engineers and Surveyors (PDRES). In addition to our own prestigious certifications, these endorsements enable modelers to earn Continuing Education Units (CEUs) and Professional Development Hours (PDHs) for their satisfactory participation in various training and educational programs.
15-712 Bentley SewerCAD V8i User’s Guide
Glossary
Alternative: A categorized data set that create scenarios when placed together. Alternatives hold the input data in the form of records. A record holds the data for a particular element in your system.
Backflow: The backing up of water through a conduit or channel in the direction opposite to normal flow.
Batch Run: A set of multiple scenarios that are computed together. This is helpful if you want to queue a large number of calculations, or manage a group of smaller calculations as a set.
bmp: File name extension for bitmap image files, which can be used as background layers in SewerCAD V8i.
Branch: In Bentley SewerCAD V8i, a series of connected elements. The Bentley SewerCAD V8i calculation engine includes a heuristic routine that decomposes a network into its component branches, and each branch is solved independently using an implicit solver. Each branch comprises a series of connected elements. Elements with the same branch ID are solved together.
Calculation Options Profile: A set of calculation options associated with a specific scenario.
Catalog Pipes: User-defined re-usable data sets that define common physical characteristics of pipes.
Collection: Bentley SewerCAD V8i uses the term Collection to identify some fields where you enter a set of data instead of a single value. To use this feature, click the field in which the word Collection appears, then click the Ellipsis (…) button to open a dialog box into which you enter data.
Composite Hydrograph: A graph of the total flow over time from multiple defined fixed/unit loads, hydrographs, and pattern loads.
Bentley SewerCAD V8i User’s Guide 16-713
Conduit: An open- or closed-section element through which water moves. A conduit has a constant roughness and cross section shape along its entire length. In Bentley SewerCAD V8i, a conduit can refer to any prismatic channel or pipe that conveys flow. The cross section of a conduit must remain constant from one end to the next.
Drag: Dragging is an action you perform with the mouse to select items in the drawing pane. Click in the drawing pane, hold down the mouse button, and move the mouse to form a rectangle around the elements you want to select. After you have formed the rectangle around the items you want to select, let go of the mouse button.
dwh: File name extension for the binary format file used by the SewerCAD V8i Stand-Alone mode only. The .dwh file contains the drawing.
dxf: File name extension for Data Exchange File format image files, which can be used as background layers in SewerCAD V8i. Dxf files store vector data for drawings typically produced in CAD programs.
Dynamic Manager: A dialog box that can be displayed floating above the workspace or attached (docked) to any one of the sides of the workspace.
Dynamic selection set: A selection created by running a query.
English: E-Q-TWU.S. customary units, such as inch or acre
Element Symbology: Refers to the way in which elements and their associated labels are displayed in Bentley SewerCAD V8i You use the Element Symbology manager to manage element annotations and color coding.
Element Table: A read-only, predefined FlexTable that you can use to review data about a specific element type. There is one predefined table for every element available in Bentley SewerCAD V8i.
Extended Period Simulation:A calculation type where the model is analyzed over a specified duration of time.
FlexTable: A customizable table that lets you view input data and results for all elements of a specific type in a tabular format. You can use the standard set of FlexTables or create your own FlexTables to compare data and create reports.
Freeboard: The difference between the top of dam elevation and the water surface elevation.
16-714 Bentley SewerCAD V8i User’s Guide
gif: File name extension for Graphic Image Format image files, which can be used as background layers in SewerCAD V8i.
GIS: Geographic information system
Hydrograph: A graph of discharge versus time.
Hyperlink: In Bentley SewerCAD V8i, a link to an external file, such as an image or movie file, for the purpose of associating the file with a specific element.
Implicit Engine: One of two calculation engines available in Bentley SewerCAD V8i. The implicit engine uses a four-point implicit finite difference solver which tends to be more stable than an explicit solver. The implicit engine in Bentley SewerCAD V8i is based on the solver in the National Weather Service FLDWAV model.
Infiltration: Water that enters the system from the ground through defective pipes, pipe joints, connections, or manhole walls
Inflow: Inflow is specified at a manhole or wet well as the total amount of wet weather inflow. Together with the infiltration along the pipes, the inflow forms the wet weather part of the sewer load.
Inflow Collection: A collection of any combination of fixed, hydrograph, or pattern inflows for an element.
Inlet flow: Flows added to the manholes and wet wells in your model, including user input hydrographs and flows from other sources, such as pumps.
jpg: File name extension for image files produced using the Joint Photographic Experts Group (JPEG) standard. JPEG files, which can also have the file name extension jpeg, can be used as background layers in SewerCAD V8i.
Junction chamber: A structure in which flow can be mixed or split. In combined sewers systems, flow can be split between that going to treatment and that going to an overflow.
Manhole: Element that provides access to the system for inspection and maintenance. Manholes are usually installed where there is a change in horizontal (plan-view) pipe direction or pipe slope, where several pipes join, or where the pipe size changes.
Bentley SewerCAD V8i User’s Guide 16-715
mdb: File name extension for SewerCAD V8i database files. The .mdb file contains all modeling data, and includes everything needed to perform a calculation. This file is an open access database format file and can be viewed and edited.
MrSID: File name extension for Multi-resolution Seamless Image Database format raster image files, which can be used as background layers in SewerCAD V8i.
Outfall: The ultimate termination points in a network.
Overflow: The flow lost when the water surface elevation at a manhole or other type of node is above the rim elevation or user-specified overtopping elevation.
Pattern: A series of multipliers which describe how the base load varies over time.
Pattern Load: A single average base load and a series of dimensionless multipliers used to delineate how the load varies over time.
Pattern Setup: In SewerCAD V8i, a pattern setup allows you to match unit sanitary (dry weather) loads with appropriate loading patterns. Each scenario can use a different pattern setup, thus allowing you to model different loading alternatives for different extended period simulations.
png: File name extension for Portable Network Graphic format image files, which can be used as background layers in SewerCAD V8i.
Pressure junction: A connection between two or more pressure pipes of varying characteristics. Loads may enter a pressure portion of a network through a pressure junction.
Pressure pipe: In SewerCAD V8i, a type of link element used to connect node elements in pressure portions of a network.
Profile: A graph that plots a particular attribute across a distance, such as ground elevation along a section of piping. As well as these side or sectional views of the ground elevation, profiles can be used to show other characteristics, such as hydraulic grade, pressure, and constituent concentration.
Pump: A structure in a wastewater system designed to add the energy (head) necessary to overcome elevation differences and head losses.
Q: Flow
16-716 Bentley SewerCAD V8i User’s Guide
Query: A SQL expression you build in Bentley SewerCAD V8i to filter a FlexTable or create a selection set.
Sanitary Flow Collection: A collection of loads that contains any combination of hydrograph, unit, or pattern loads.
Sanitary Load: A load that results from human activity and are not weather-dependent.
Scenario: A set of input data (in the form of alternatives), calculation options, results, and notes associated with a set of calculations. Scenarios let you set up an unlimited number of "What If?" situations for your model, and then modify, compute, and review your system under those conditions.
Selection Sets: User-defined groups of network elements that let you predefine a group of elements to manipulate together.
shp: File name extension for shapefiles, which you can import as background layers for your model.
SI: International System of units or metric units.
Static selection set: A selection set created by selecting a group of elements in your model.
swc: File name extension for SewerCAD V8i project files. The .swc file contains data such as annotation, color-coding, and project-level options. This file is an open .xml format file and can be viewed and edited.
tiff: File name extension for Tagged Image File Format raster image files, which can be used as background layers in SewerCAD V8i. The extension .tif is also used for these types of files.
Unit Hydrograph: A time versus flow curve.
Unit Sanitary Load: Loading unit count representing the local count of loading units for a specified unit dry weather load.
User data extensions: A set of one or more attribute fields that you can define to hold data to be stored in the model. User data extensions allow you to add your own data fields to your project.
User Notifications: Messages that appear after you compute your model. These messages can help you troubleshoot errors in your model.
Bentley SewerCAD V8i User’s Guide 16-717
Virtual Conduit: Virtual conduits are a special compatibility element included in Bentley SewerCAD V8i to help modelers achieve fidelity between the Bentley SewerCAD V8i model and other storm modeling solutions that model pumps and control structures such as weirs, orifices, and rating tables as network links. Virtual conduits are displayed in your model as dashed lines.
Wet Weather Load: A load that is not related to rainfall activity, such as groundwater infiltration (water leaking into a pipe through cracks, joints, and other defects) and structure inflow (surface water entering a structure through the cover).
Wet well: A boundary condition between the pressure and gravity portions of a network. Wet wells serve as a collection point for gravity systems, and as an HGL boundary node for the pressure system. Dry loads can also enter the sewer network at these locations.
16-718 Bentley SewerCAD V8i User’s Guide
Symbols
Symbols
%u 467.hlb 245.pdf 5
A
AASHTO 649about CivilStorm 1about SewerGEMS 1actions tab 275active 423active topology 421, 423active topology alternative 421active topology child alternative 422Active Topology dialog box 421actual and plan length 203actual and plan length as a function of slope 204Add Hyperlinks dialog box 253Add To Selection Set dialog box 234adding annotations 466adding background layers 457adding color coding 471adding elements 193adding fixed loads 301adding user defined hydrographs 302address
See contacting Bentley Systems. 7affinity laws 663air valve 191Allocation strategies 336Alternative Editor dialog box 420Alternative Manager 419alternatives 397, 417, 713
base 418boundary condition 444child 418creating 418defined 402editing 419initial conditions 445making elements inactive in 422merge 417overview 397, 417
Bentley SewerCAD V8i User’s Guide Index-719
B
physical 424sanitary loading 447types of 417
analysishydraulic 369, 370
analysis menu 17Animation Control Manager 370Animation Controls 482, 485Animation Options dialog box 372Annotation Properties dialog box 468annotations 462, 463, 468
%u 467adding 466deleting 467displaying units 467editing 467renaming 467
Apply Sanitary Load to Selection dialog box 332attributes
editing 199scenario 402
attributes for calculation profiles 376AutoCAD 597, 607, 608
commands 603, 614drawing synchronization 612entities 603, 613, 614importing WaterCAD 605, 617proxies 617undo/redo 604, 605, 615, 616
AutoCAD mode 11, 597, 607, 608graphical layout 598, 609project files 611toolbars 609
Autodesk 597, 607automated scenario management 398
B
backflow 713background layer files
using with ProjectWise 126Background Layer manager 454background layers 454
adding 457deleting 457dxf files 461
Index-720 Bentley SewerCAD V8i User’s Guide
C
editing 458image compression 460renaming 458shapefiles 460supported image types 454turning on and off 458working with folders 456
base alternative 417base alternatives 418Base Calcuation Options 374batch run 414, 713Batch Run Editor dialog box 415batch runs 414Batch Update Conduit Descriptions 23Bend command 194Bentley Institute Press 711Bentley SELECT 3Bentley Systems 705
about us 705accreditations 712addresses 6contacting 6email addresses 7Haestad Methods products 705program update 3training 712Web site 7
Bernoulli equation 627Billing Meter aggregation 338Border Editor dialog box 559border properties for graphs 559border tool 192boundary condition alternative 444boundary polygon feature classes 359branch 713buffering point area percentage 358, 359building a model 194
C
C coefficient 631calculation detailed summary 384calculation errors 395calculation options 395, 452Calculation Options Manager 373Calculation Options manager 373
Bentley SewerCAD V8i User’s Guide Index-721
C
Calculation Options Profile 713calculation profiles 373
attributes 376calculation warnings 395catalog pipes 247, 713certification 712change pipe width 602Change Series Title dialog box 566changing the drawing view 223Channel Weighting Methods 690characteristic curve
pump 663pumps 662, 663
Chart Options dialog box 520Chart Tab 521Export tab 556Print tab 558Series Tab 547Tools tab 555
Chart Tools Gallery dialog box 566check data 384Chezy’s equation 629, 634child alternative
creating active topology 422child scenarios 413Cholesky 672CivilStorm
about 1CivilStorm 2005 707CivilStorm database file
importing 128clearing element selection 197ClientCare 6Colebatch 691Colebrook-White
equation 630collection 713collections
inflow 322minor loss 171sanitary flow 332
color coding 470adding 471deleting 471editing 472renaming 472
Color dialog box 561
Index-722 Bentley SewerCAD V8i User’s Guide
C
Color Editor dialog box 561Color Map Tables 474Color-Coding Properties dialog box 472, 588column headings
editing for FlexTables 497commands (AutoCAD mode) 603, 614Compact Database Enabled option 112Component 144, 152component 136components menu 18Composite Action 278Composite Condition 274composite hydrograph 713composite hydrograph data table window 319Composite Hydrograph Window 318composite hydrographs 318, 323Composite Logical Action 276Compress Database command 23compressing large database files 23, 112Conditions List 276Conditions tab 269conditions tab 269conduit infiltration 299, 360conduits 714conjugate gradient method 671connecting elements 194connecting pumps to wet wells 195connection
synchronization 612connectivity
explicit 149implicit 149
conservationof mass & energy 667
constant horsepower pump 666constant power pump 666constructing a query 259, 500contacting Bentley Systems
email 7fax 7hours 7mail 7sales 6technical support 6telephone 7
continuous patterns 304contour 590, 591
Bentley SewerCAD V8i User’s Guide Index-723
D
smoothing 590, 591Contour Browser 589, 592Contour Manager 588Contour Plot 591Contours 588Control Manager 263Control Sets tab 279Controlling Results Output 382controls tab 264convert 245copy 46copying
FlexTables 505Correct Data Format 151cox 692create a new System Head Curve 214create a new Totalizing Flow Meter 211create Observed Data 518Create Selection Set dialog box 231creating
graph 511creating a model 194creating a query 257creating alternatives 418creating dynamic 231creating queries 259, 500creating reports 507creating sanitary flow collections 332creating selection sets 231, 232cross sectional shapes of link elements 174CulvertMaster 710curve
pump 662, 663, 664, 666curved pipes 194custom AutoCAD entities 603, 613, 614custom extended
pump 666customize
drawing 610customizing
FlexTables 501customizing graphs 578
D
Darcy Weisbach
Index-724 Bentley SewerCAD V8i User’s Guide
D
Colebrook-White equation 630equation 632
datacheck 383, 384organization 417validation 383
Data Format Needs Editing 151data source tables 151data types for user data extensions 285Database Utilities 23datasource 136, 142decimal point 202default units 117defining geometry of link elements 172defining pump settings 183defining sanitary flow collections 332defining user data extensions 281deleting
FlexTables 495deleting annotations 467deleting background layers 457deleting color coding 471deleting elements 198deleting groups of elements in a selection set 234deleting profiles 478demand
multipliers 306demand allocation 335demand projection 341depth 173design point 666direction of flow 677disconnect 199display format 203Display Precision 202display precision 202displaying multiple projects 110diurnal curves 303dockable managers 40Downstream Edge 145downstream edge 148downstream node 194dragging 714drawing
scale 116setup (AutoCAD mode) 610synchronization (AutoCAD mode) 612
Bentley SewerCAD V8i User’s Guide Index-725
E
drawing scale 116drop manholes 178dry weather flow collections 332DWG 611, 612DXF file
exporting 132DXF Properties dialog box 231, 234, 461dynamic inheritance 404dynamic managers 714
E
edit elements 602Edit Hyperlink dialog box 253edit menu 15editing
FlexTables 496numerous elements at once 498
editing alternatives 419editing annotations 467editing background layers 458editing color coding 472editing column headings
FlexTables 497editing element attributes 199editing scenarios 413editing units
FlexTables 497EGL 628, 629element
deleting 602modify 602moving 603, 615relabel 201
element connectivity 194element label project files 120element labeling settings 120element properties 600Element Property Inferencing 217, 223element relabeling 504element symbology 714Element Symbology Manager 463
using folders in 465element tables 507, 714elements 169
adding data to link elements 170
Index-726 Bentley SewerCAD V8i User’s Guide
E
adding in the middle of a pipe 198adding to your model 193clearing selection of 197connecting 170, 194defining cross sectional shapes of link elements 174defining geometry of link elements 172deleting 195editing attributes 199globally editing data in numerous elements 498link 170manholes 175moving 195outfalls 180overview 169pressure junctions 182pumps 182reporting on 508selecting 195selecting all 197selecting all of the same type 197viewing in selection sets 230wet wells 179
elevation vs. flow curvesadding to outfalls 181
Elevation-Flow Curve dialog box 181email 7email address 7energy
conservation 667, 668equation 627grade line 629principle 626
engineering libraries 242, 245adding unit sanitary loads in 313overview 241sharing on a network 245working with 242
engineering libraries dialog box 245engineering library file 245English units 714Enhanced Pressure Contours 592enhanced pressure contours 592entering additional data to link elements 170entering data 199entities
in AutoCAD 603, 613, 614enumerated user data extensions 289
Bentley SewerCAD V8i User’s Guide Index-727
F
Enumeration Editor dialog box 289EPS 369
analysis 369, 370EPS Results Browser 370EQT curves
adding to outfalls 181error messages 147, 383errors 393Explicit connectivity 148explicit connectivity 149explode elements (AutoCAD mode) 614export 132exporting
FlexTables 506exporting data 132
to a DXF file 132exporting FlexTables 505Extended Period Analysis 307extended period analysis 369extended period simulation 714External Tool Manager 291
F
F1 5fax 7file menu 11filter
resetting 501Find 200Find Logical Action dialog box 276finding elements 200fitting loss coefficients 660, 661fixed loads
adding 301Fixed Point 203FlexTable dialog box 492FlexTable Setup dialog box 502FlexTables 488, 714
copying 505copying data 505creating 495customizing 501deleting 495editing 496editing column headings 497
Index-728 Bentley SewerCAD V8i User’s Guide

F
editing globally 498editing units 497exporting 505exporting data 506global editing 498navigating in 497opening 494ordering columns 498printing 505, 506renaming 496reports 506saving as text 506shortcut keys 497sorting column order 498
FlexTables Manager 489folders in 491
FlexTables manager 489Flow (Diverted In Outside Subnetwork) 320Flow (Diverted Out) 321Flow (Downstream Conduit) 322Flow (In net) 322Flow (Local Diverted In Same Subnetwork) 320Flow (Locally Injected) 320Flow (Non-Diverted Out) 321Flow (Out net) 322Flow (System Known) 320Flow (System Sanitary) 320Flow (System Total Wet Weather) 321Flow (System Wet Well Collection) 320Flow (Total Diverted In) 320Flow (Total In) 320Flow (Total Out) 320, 322flow distribution 339flow increment 130FlowMaster 709folders
in Background Layers Manager 456in Element Symbology Manager 465in FlexTables Manager 491
formatunit 202
FoxPro 142freeboard 714
Bentley SewerCAD V8i User’s Guide Index-729
G
G
Gaussian elimination method 672General 203general settings 112Geometric data source 136geometry
of link elements 172polyline vertices 172
GIS 715demand allocation 335
global edit 498global editing
FlexTables 498global settings 111grade line
energy 629hydraulic 629
gradient algorithm 668derivation 669
Gradient Editor dialog box 560graph
copying and pasting data 512, 516data 516new 511
Graph dialog box 512Graph Manager 510Graph Series Options dialog box 517graph settings 517graphical layout
AutoCAD 598, 609graphing 511
changing total time period 512refresh 511
graphs 509customizing 578data 512printing 512
H
Haestad Methodsprogram update 3training 712
Haestad Press 711
Index-730 Bentley SewerCAD V8i User’s Guide
I
Haestad.log 7Hatch Brush Editor dialog box 562Hazen-Williams equation 631headloss coefficient
in minor loss collections 172HEC-22 649help menu 24HGL 628, 629history of what-if analyses 398horton’s 691hydraulic analysis 369hydraulic grade line 629hydrograph 715Hydrograph Curve dialog box 360hydrographs
user defined 302hydrographs vs. pattern loads 301hyperlinks 251, 715
adding 252deleting 254editing 253
Hyperlinks dialog box 251
I
image compression 460Image Filter 459Image Properties dialog box 458impeller 663implicit connectivity 149implicit engine 715Import
WaterCAD 605, 617import 153, 158, 162
WaterCAD 605, 617importing
CivilStorm data 128importing data 127improved Lotter 692inactive 423inactive elements in alternatives 422independent papers 711individual elements
adding to your model 193inferencing 223infiltration 360, 715
Bentley SewerCAD V8i User’s Guide Index-731
K
Infiltration (System Additional) 321Infiltration (System Non-Additional) 321Infiltration (System Total) 321inflow 298, 319, 325, 715inflow alternatives
for manholes 450, 451for pressure junctions 450for wet wells 450
inflow collection 715Inflow Collection Editor 323, 715inflow collections
defining 322inflow control center 325Inflow Control Center dialog box 325inflows 319, 325inheritance 403, 405
dynamic 404overriding 404
initial conditions alternative 445initial conditions of networks 511initial flow equals zero 511inlet flow 715Inlet Flow Settings 130interpolate 223interpolation 223introduction 1irregular channel 173
K
K coefficients 661knowledgebase 3known flows 625
L
lawsaffinity 663conservation of mass and energy 667
layoutAutoCAD 598, 609
layout settings 113layout tool 193legacy 245lessons 5
Index-732 Bentley SewerCAD V8i User’s Guide
M
Levenberg-Marquardt method 667library types 242Like operator 261line tool 192linear system equation solver 671linear theory method 668link element
defining geometry of 172link elements 170
defining cross sectional shapes of 174entering additional data to 170
Load (Calculated) 322LoadBuilder 298, 335, 342
manager 342run summary 354wizard 343
loading 297adding fixed loads 301defining inflow collections 322hydrographs vs. pattern loads 301methods for 298patterns 303types of loads 299user defined hydrographs 302
logical control 267dialog box 265manager 263set editor 280
Logical controls 266logical controls
overview 262loop-based algorithms 668losses
friction 631, 670minor 660, 661, 662
Lotter 692
M
mail 7Management controls 305Manhole Head Loss Equations (AASHTO/HEC-2 Overview) 649manholes 175, 715
inflow alternatives for 450, 451physical alternative for 431sanitary loading alternative for 448
Bentley SewerCAD V8i User’s Guide Index-733

N
Manning’s equation 633Manning’s n coefficient table 695Mapping 144mass conservation 667maximum flow 130merge
mergealternatives 417
meter aggregation 338meter assignment 336methods of entering loads 298Microsoft OLE DB Provider 142Microstation mode 10Minor Loss Coefficients dialog box 208minor loss collection 171Minor Loss Collection dialog box 172minor losses 660, 662
fitting 661model calculations
troubleshooting 395ModelBuilder 142, 153, 158, 162
errors and warnings 147supported formats 135using 135
ModelBuilder Connections manager 138ModelBuilder wizard 141move
elements 603, 615labels 604, 615
moving elements 197moving toolbars 37multiple
pump curve 666, 667multiple elements
selecting 197multiple point pump 666multiple projects
maximum number of 110Multipliers 306Municipal License Administrator 2
N
named view 44named views 44, 592navigating in a FlexTables 497
Index-734 Bentley SewerCAD V8i User’s Guide
O
Network Navigator 236New Logical Action dialog box 276nodal demand vector 669non-convergence 369Number 203
O
Observed Data 517OLE DB 142online book 5
See also .pdf.online help 5opening an existing project 110opening managers 38operation 498Operational Alternative 262options 111
drawing 116global 111labeling 120project 114ProjectWise 121setting 111units 117
Options Dialog BoxProjectWise settings 121
ORACLE 142Oracle 135ordering
FlexTable columns 498organize data 417outfalls 180
adding elevation vs. flow curves to 181adding EQT curves to 181boundary condition alternative 444physical alternative for 434
outputtables 488
output data 382overflow 716overriding inheritance 404
Bentley SewerCAD V8i User’s Guide Index-735
P
P
Pan tool 223panning 223
using a mousewheel to 224parent scenario 413paste 46pattern 305, 716
demand multipliers 305extended period analysis 307, 370pattern editor 305time steps 305
pattern load 716pattern loads 303Pattern Manager 305pattern setup 716pattern setups 307Pattern Setups dialog box 308patterns 162, 303
continuous 304stepwise 304
Pavlovskii’s 690Percent Full (Calculated) 179physical alternatives 424
for manholes 431for outfalls 434for pressure junctions 437
Pipe Catalog dialog box 247pipe infilitration 360pipe length 203pipeline infiltration 360pipes
modeling with curves 194splitting 198
point demand assignment 341Pointer dialog box 565polyline vertices 172Polyline Vertices dialog box 173Polyline-to-Pipe 137PondPack
upgrade 3predefined queries 238, 254pressure
head 627, 629pressure junctions 182
inflow alternatives for 450
Index-736 Bentley SewerCAD V8i User’s Guide
P
physical alternative for 437sanitary loading alternative for 448
pressure pipesadding a minor loss collection to 171
print previewFlexTables 506
Print Preview Window 587printing
FlexTables 506printing FlexTables 505printing graphs 512proejct queries 254profile 716
editing 478Profile Setup dialog box 479Profile Viewer dialog box 480profiles 474
creating 477deleting 478renaming 478viewing 476
Profiles manager 475project
files 599, 611, 612project inventory 507project properties 110Project Properties dialog box 110projection 341projects 110ProjectWise 13, 121
closing projects 123general guidelines for using 123guidelines 123performing operations 124using background layer files with 126using with CivilStorm 123using with SewerGEMS 123viewing status 124
ProjectWise options 121properties
editing 199Properties Editor 42Property Editor 199
using Find Element 200prototypes 239
creating 239prototypes manager 240
Bentley SewerCAD V8i User’s Guide Index-737
Q
proxies 617publications 711pump
affinity laws 662constant horsepower 666curve 662, 663, 666, 667custom extended 666impeller 663multiple point 666operating point 662, 663, 666static head 663static lift 662theory 662three point 666type 666variable speed 663
Pump Curve Definitions dialog box 182, 183pump curves 158pump definitions 153pump settings 183pumps 182
662connecting to wet wells 195defining settings for 183
Q
Q 716queries 254, 259, 500
creating 257predefined 254project 254shared 254using Like operator in 261
Queries Manager dialog box 255Query Builder dialog box 259
R
rankingFlexTable columns 498
reconnect 199redo 604, 605, 615, 616references and textbooks 711refresh 511
Index-738 Bentley SewerCAD V8i User’s Guide
S
relabeling elements 201Remove
Columns 503removing elements from selection sets 234renaming
FlexTables 496renaming annotations 467renaming background layers 458report menu 24report options 508reporting
on a group of elements in a selection set 234Reporting Time Step Type 382reports 507
creating for elements 508FlexTables 506scenario 508standard 507
resetFlexTable filter 501
Reset Workspace 37roughness
Chezy’s equation 629Colebrook-White equation 630Darcy-Weisbach equation 631Hazen-Williams equation 631Manning’s equation 633
roughness height 630, 633rounding of numbers 202rule based 263
S
sales 6Sanitary (Dry Weather) Flow Collection Editor 333sanitary flow collection 717sanitary flow collections
defining 332sanitary load 717sanitary load control center 332sanitary loading 298
unit sanitary loads 310sanitary loading alternative 447
for manholes 448for pressure junctions 448for wet wells 448
Bentley SewerCAD V8i User’s Guide Index-739

S
saving FlexTables as text 506scenario example 407Scenario Management 411
Example 407Scenario Manager 415scenario summary 508scenarios 397, 717
advantages of using 398attribute inheritance 405attributes 402base 413batch run 414calculation options for 452creating new 413editing 413inheritance 403local and inherited values in 405overview 397, 400, 412
Scientific 203Section Results dialog box 175select boundary polygon feature class 358Select in Drawing button
in Query Manager 256select the point 358selecting all elements 197selecting an element 197selecting elements
all of the same type 197selecting multiple elements 197selection 423Selection by Query dialog box 232Selection Set Element Removal dialog box 234selection sets 227, 228, 231, 234, 717
adding a group of elements to 233adding elements to 233creating 231, 232creating from queries 231group-level operations 234in FlexTables 493removing elements from 234viewing elements in 230, 231
Selection Sets Manager 228Selection tool 27Set Field Options dialog box 202setup 610SewerGEMS
about 1
Index-740 Bentley SewerCAD V8i User’s Guide
S
features 707shapefile 149Shapefile Properties dialog box 460Shared Field Specification dialog box 288shared queries 254sharing engineering libraries on a network 245shortcut keys
FlexTables 497SI 202, 717Simple Logical Action 276simultaneous path adjustment method 668smoothing contours 590snap menu (AutoCAD mode) 604, 615software
upgrades 3sorting
FlexTable columns 498sparse matrix 669, 672spatial data 142, 149, 150splitting pipes 198SQL Server 142standard extended pump 666standard reports 507start node 677starting a new project 110static head
pump 663static lift
pump 662station 173station-elevation curves 174steady state analysis 369steady-state analyses 369stepwise patterns 304Stieltjes 672stop node 677StormCAD 709submersible pump 189support 6
addresses 7hours 7
Swamee and Jain equation 633SWG file 611symbol
visibility (AutoCAD mode) 610Synchronize 137synchronize 140
Bentley SewerCAD V8i User’s Guide Index-741
T
synchronize (AutoCAD mode) 612System Head Curve editor 214System Head Curves 213, 214System Head Curves manager 213system operating point 662
T
TableProperties 502Type 502
tablesetup 502
tables 46column headings 497editing FlexTables 496Manning’s n coefficients 695units 497
tabular report 488technical journals 711technical support 6TeeChart Gallery dialog box 578text 604, 615text height 117
multiplier 117text tool 192The 712theme folders
renaming 466theme groups
deleting 466theory 619Thiessen polygon generation 354This 314three point pump 666time of simulation 512Time Series Field Data 594Tolerance 149tolerance 142Toolbar buttons 36toolbars 25, 36
customizing 36tools menu 22topology 148, 383, 384, 669Totalizing Flow Meter Editor 211Totalizing Flow Meter editor 211
Index-742 Bentley SewerCAD V8i User’s Guide
U
Totalizing Flow Meter manager 210Totalizing Flow Meter Manager Dialog 210training 712TRex Wizard 293TRex wizard 293troubleshooting 393, 395
knowledge database 3turning background layers on and off 458turning toolbars off 37turning toolbars on 37tutorials 5
See also lessons.types of loads 299
U
U.S. customary 202undo/redo operations in AutoCAD 604, 616Unit 202unit hydrograph 717unit loading 309unit of measurement 202Unit Sanitary (Dry Weather) Load dialog box 314unit sanitary load 717unit sanitary loading 309unit sanitary loads 310
adding in engineering libraries 313types of 310
units 117, 119displaying in annotations 467editing for FlexTables 497
units and formatting 202Updates 3updating PondPack via the Web 3upgrade
PondPack 3upstream node 194user data extensions 280, 717
data types 285enumerated 289
User Data Extensions dialog box 283user defined hydrographs 302User Notification Details dialog box 395user notifications 393, 717User Notifications Manager 393
Bentley SewerCAD V8i User’s Guide Index-743
V
V
validation 383, 384variable speed pump
curve equations 663variable speed pump batteries 190, 438Variable Speed Pump Battery 190variable speed pumps 663velocity
head 629vertices 172view
tabular 488view menu 19viewing elements in a selection set 230, 231viewing profiles 476virtual conduits 718visibility of symbols 610Visual FoxPro 142VSPB 190, 438
W
warning messages 147warnings 393WaterCAD 708
custom AutoCAD entities 603, 613, 614WaterCAD in AutoCAD 597, 607WaterGEMS 708WCD file 599, 612Web updates 3Website 7weighted roughness method 693weighting 690welcome dialog 109wet weather load 718wet wells 179
connecting to pumps 195inflow alternatives for 450sanitary loading alternative for 448
whitetable columns 496
window color settings 113World Wide Web
See Web. 3
Index-744 Bentley SewerCAD V8i User’s Guide
Y
Y
yellowtable cells 496
Z
Z Order 605zero flow at time 0 511Zoom 225Zoom Center 226Zoom Center dialog box 226zoom dependent visibility 470Zoom Extents 225Zoom Factor 226Zoom In 224Zoom Out 224Zoom Previous
Zoom Next 225Zoom Realtime 225Zoom Window 225zooming 223, 226element tables
See also predefined FlexTables
Bentley SewerCAD V8i User’s Guide Index-745

Z
Index-746 Bentley SewerCAD V8i User’s Guide