Embed Size (px)
Citation preview
Global incidence of dengue has increased 7-fold, from 8.3 million cases in 1990 to >58.4 million in
2013 (1). Currently, ≈390 million new infections oc-cur annually in 128 dengue-endemic countries (2). Worldwide, ≈14,000–20,000 dengue-related deaths occur each year (1,2). In dengue-endemic countries, Aedes (Stegomyia) aegypti and Ae. (Stegomyia) albopictus mosquito vectors transmit the disease.
Sri Lanka, a tropical island in the Indian Ocean (population 21 million) (3), has reported dengue cases
since the 1960s; seasonal epidemics predominantly affect areas that have annual rainfall >2,500 mm (4). However, until 1988, the more severe form of dengue virus (DENV) infection, dengue hemorrhagic fever, was reported only sporadically (5,6). During 1991–2008, dengue epidemics occurred once every few years on the background of endemic transmission (6). A disproportionate epidemic occurred in 2009 comprising 35,008 suspected cases (incidence 170 cases/100,000 population) and 346 deaths (case-fatal-ity rate 1%) (7). During 2010–2016, dengue became a major public health problem; cases increased steadily (from 28,473 in 2011 to 55,150 in 2016) throughout the country but disproportionately affected the most pop-ulated Western province (7). In 2017, a total of 186,101 suspected cases and 440 dengue-related deaths were reported to the Central Epidemiology Unit of the Ministry of Health, Sri Lanka (7). This number is the highest number of suspected cases reported in a sin-gle calendar year in Sri Lanka since dengue was des-ignated a notifiable disease in 1996. We compared the temporal, epidemiologic, virologic, entomologic, and climatic characteristics of the 2017 dengue epidemic with those of the epidemics during the preceding 5 years (2012–2016).
Methods
Data Sources
EpidemiologyWe obtained epidemiologic data from the integrated national communicable disease surveillance system, which captures symptomatic dengue patients classi-fied according to a standard case definition based on the 1997–2011 World Health Organization classifica-tion (8). Etiologic screening was conducted with NS1 antigen testing or dengue antibody assays. Howev-er, given the limited diagnostic test availability, es-pecially in remote areas of the country, many cases were clinically diagnosed using the surveillance case
Severe Dengue Epidemic, Sri Lanka, 2017
Hasitha A. Tissera, Bernard D.W. Jayamanne, Rajendra Raut, Sakunthala M.D. Janaki, Yesim Tozan, Preshila C. Samaraweera, Prasad Liyanage, Azhar Ghouse, Chaturaka Rodrigo, Aravinda M. de Silva, Sumadhya D. Fernando
682 Emerging Infectious Diseases • www.cdc.gov/eid • Vol. 26, No. 4, April 2020
Author affiliations: National Dengue Control Unit, Colombo, Sri Lanka (H.A. Tissera, B.D.W. Jayamanne, S.M.D. Janaki, P.C. Samaraweera); Central Epidemiology Unit, Colombo (H.A. Tissera, A. Ghouse); University of North Carolina, Chapel Hill, North Carolina, USA (R. Raut, A.M. de Silva); New York University, New York, New York, USA (Y. Tozan); Regional Directorate of Health Services, Kalutara, Sri Lanka (P. Liyanage); University of New South Wales Sydney, Sydney, New South Wales, Australia (C. Rodrigo); University of Colombo, Colombo (S.D. Fernando)
DOI: https://doi.org/10.3201/eid2604.190435
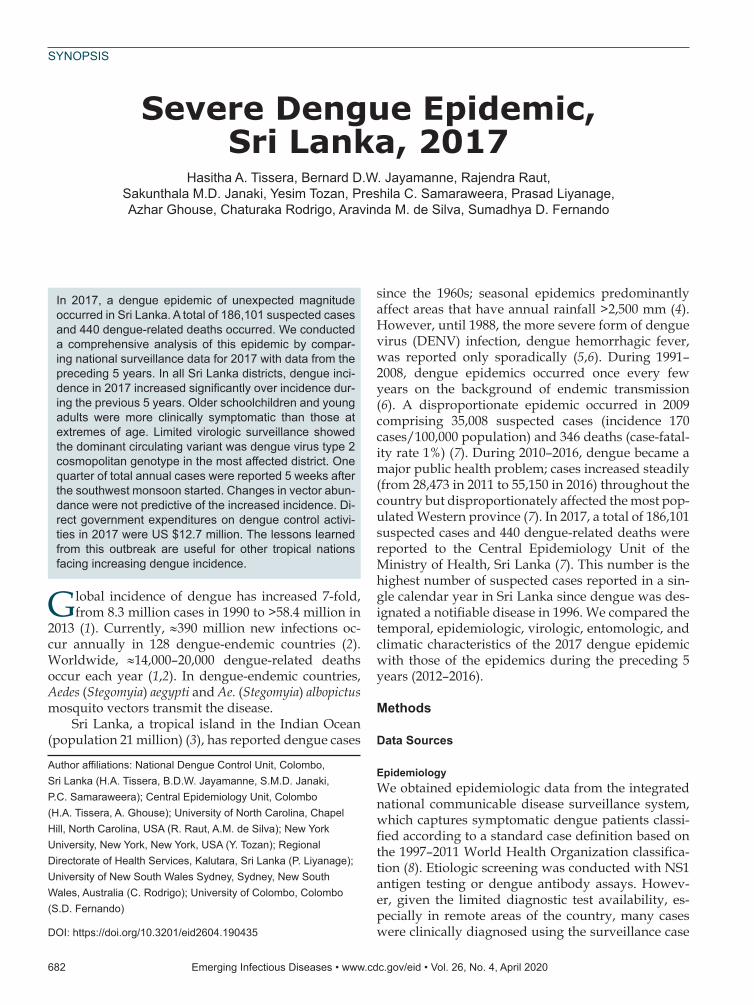
In 2017, a dengue epidemic of unexpected magnitude occurred in Sri Lanka. A total of 186,101 suspected cases and 440 dengue-related deaths occurred. We conducted a comprehensive analysis of this epidemic by compar-ing national surveillance data for 2017 with data from the preceding 5 years. In all Sri Lanka districts, dengue inci-dence in 2017 increased significantly over incidence dur-ing the previous 5 years. Older schoolchildren and young adults were more clinically symptomatic than those at extremes of age. Limited virologic surveillance showed the dominant circulating variant was dengue virus type 2 cosmopolitan genotype in the most affected district. One quarter of total annual cases were reported 5 weeks after the southwest monsoon started. Changes in vector abun-dance were not predictive of the increased incidence. Di-rect government expenditures on dengue control activi-ties in 2017 were US $12.7 million. The lessons learned from this outbreak are useful for other tropical nations facing increasing dengue incidence.
SYNOPSIS

Dengue Epidemic, Sri Lanka
definition (9). We based the population data we used on the last national census before the outbreak (2012) and projections for the following years (10).
VirologyThe Central Epidemiologic Unit has an established ongoing fever surveillance cohort of 500 families in the catchment areas of the National Institute of Infec-tious Diseases, the main referral hospital for dengue patients in the most affected Colombo district. Vi-ruses isolated from blood samples of patients sus-pected to have dengue collected during December 2016–December 2017 were sequenced (Sanger tech-nique) at the University of North Carolina (Chapel Hill, NC, USA; Appendix, https://wwwnc.cdc.gov/EID/article/26/4/19-0435-App1.pdf). The sequences were aligned using Sequencher Software version 5.4.6 (https://www.genecodes.com) and phylogenetics analysis was performed on MEGA X software (11).
EntomologySystematic entomologic surveillance is conducted in all districts of the country according to the guidelines issued by the National Dengue Control Unit of Sri Lanka’s Ministry of Health. This surveillance com-prises routine cluster surveys (systematic sampling of 100 premises per block) conducted monthly by desig-nated entomologists. The presence of Ae. aegypti and Ae. albopictus larvae and pupa are reported as Breteau index, Container index, and Premise index/House in-dex (12). A premise or container was considered posi-tive if a single larva or pupa was found in a receptacle within its boundaries, both indoors and outdoors.
MeteorologyWe extracted daily rainfall and temperature data during 2012–2017 from the Department of Meteorol-ogy for each district. The weekly cumulative rain-fall in millimeters and mean temperature (°C) were calculated using daily observations. We obtained Oceanic Niño Index data as a measure of El Niño Southern Oscillation activity from the US National Oceanic and Atmospheric Administration (https://www.noaa.gov). The Oceanic Niño Index tracks the 3-month average sea surface temperatures in the east-central tropical Pacific from 120° to 170° West (Niño 3.4 region) (13). We correlated meteorologic parameters with the dengue incidence in 2017 and of the preceding 5 years for Colombo district (Western province, wet zone; annual rainfall >2,500 mm) and Jaffna district (Northern province, dry zone; annual rainfall 1,250–2,500 mm). We selected these 2 districts because both maintained a high dengue incidence
during the 6 years examined and are representative of Sri Lanka’s 2 contrasting climatic zones. Colombo district, in the wet zone, receives most of its rainfall from the southwest monsoon during May–Septem-ber. Jaffna district, in the dry/semiarid zone, receives most of its annual rainfall from the northeast mon-soons during December–February.
Cost EstimatesWe estimated the direct costs of dengue control and outbreak response during epidemic year 2017 from the Ministry of Health perspective. Direct costs were costs of routine dengue control activities and costs of outbreak response activities. More specifically, rou-tine dengue control activities included standard mea-sures of premise inspections and removal of vector breeding sites, larval control, entomologic surveil-lance, development of electronic databases, health education, advertising through media, purchases for integrated vector control (fogging machines and chemicals), and operating costs of administrative of-fices. Outbreak response activities (after the epidemic) were establishment of extra high-dependency units in public hospitals, door-to-door premise inspection and source reduction programs in high-risk districts through civil–military cooperation, deployment of vector control brigades in high-risk districts, and extra-duty allowance for public health staff during outbreak months (May–August). We extracted the fi-nancial costs from the National Dengue Control Unit annual budget and financial expenditure records. For public health staff not exclusively engaged in den-gue-related activities, we calculated the amounts on a pro rata basis according to the approximate num-ber of hours spent on dengue-related work. This cost evaluation did not include in-kind costs, such as un-compensated work hours by community members or other stakeholders, because of the unavailability of records. We extracted all costs in local currency and converted to US dollars using the annual official exchange rate of the Sri Lanka rupee (LKR) 152.5 to US $1 in 2017 (World Bank, https://data.worldbank.org/indicator/PA.NUS.FCRF?end=2016&locations=LK&start=1960&view=chart).
Statistical AnalysesWe analyzed the data using SPSS Statistics 21.0 (IBM, https://www.ibm.com). Descriptive statistics are shown as frequencies, means (± SD), and propor-tions. We examined the statistical significance of population proportions (count data) and mean differ-ences (continuous data) by z-score test and used χ2
test for dichotomous data with statistical significance
Emerging Infectious Diseases • www.cdc.gov/eid • Vol. 26, No. 4, April 2020 683

SYNOPSIS
set at 0.05. The effect size is expressed as odds ratios or relative risk with 95% CIs. We used a distributed lag nonlinear model (14) for the analysis of exposure-lag response association between weather variables and dengue incidence. We conducted distributed lag nonlinear model construction and lagged correlation analysis in the R statistical environment (15).
Sequence Availability and Ethics ClearanceWe deposited the DENV-2 sequences used in phy-logenetic analysis in GenBank (accession nos. MK579857–61. The Ethics Review Committee of the Faculty of Medicine, University of Colombo (EC-18-004) provided ethics clearance for this study.
ResultsIn 2017, a total of 186,101 suspected dengue cases (866 cases/100,000 population) and 440 dengue-related deaths (case-fatality rate 0.24%) were reported to the national surveillance system. The weekly average of reported dengue cases was significantly higher than the average for the preceding 5 years (3,570 vs. 792 cases/week, p<0.0001, greater than mean for 2012–2016 + 2 SD) throughout the year. The national sur-veillance picked up an unusual increase in cases in the northern and eastern parts of the country from the latter half of 2016. However, a much larger increase in incidence was notable from week 16 of 2017 and peaked at week 29 when 10,699 cases were reported. Approximately one quarter of total dengue cases in 2017 were reported during weeks 27–31 (Figure 1).
Spatial Distribution of Dengue IncidenceSri Lanka’s 9 provinces are divided into 25 adminis-trative districts (Table 1; Figure 2). In 2017, the most dengue cases were reported from the 2 most popu-lous Colombo and Gampaha districts within the Western province (Colombo, 1,419/100,000; Gampa-ha, 1,323/100,000). Three other districts also had an
incidence rate >1,000 cases/100,000 population, and 10 districts reported rates above the national average (Table 1). The lowest incidence rate (118/100,000 pop-ulation) was reported from the Nuwara-Eliya district, which is in the Central province at 1,800 m above sea level. In all districts, dengue incidence in 2017 was significantly higher than the average incidence in the preceding 5 years (Table 1). When we repeated the comparison against each of the preceding 5 years (in-stead of the average), the difference remained signifi-cant for all districts.
Demographic ProfileThe sex distribution of dengue patients in 2017 was similar (99,464 [55.2%] male, 80,724 [44.8%] female; p>0.05). The mean age of dengue patients nationwide was 29.7 years, but age varied widely by province (Table 2). Mean age was significantly lower than the national average (p<0.001) in Eastern (22.3 years), Northern (27.6 years), and Western (28.7 years) prov-inces and significantly higher in Sabaragamuwa (36.5 years), North Central (34.1 years), and Southern (33.2 years) provinces (Table 2). Incidence was highest for persons 20–29 years of age (1,225 cases/100,000 population), followed by persons 10–19 years (1,057/100,000 population). Persons >50 years of age were least affected (580/100,000 population) (Figure 3). Age-specific incidence rates among provinces dif-fered noticeably. For example, young children (5–9 years) were the most affected group in the Eastern province (Appendix Table 3).
Phylogenetic AnalysisFrom blood samples collected during December 2016–December 2017 from 140 persons with acute fever, a total of 44 (31%) persons were positive for DENV RNA (DENV-2, 39; DENV-1, 4; DENV-2/3, 1). Of these, 5 DENV-2 isolates were cultured and sequenced (PrM-E region). A neighbor-joining
684 Emerging Infectious Diseases • www.cdc.gov/eid • Vol. 26, No. 4, April 2020
Figure 1. Comparison of the weekly mean attack rates of dengue reported in 2017 with the 5-year historical mean (2012–2016), Sri Lanka. Rates are cases per 100,000 population. Source: (7).

Dengue Epidemic, Sri Lanka
phylogenetic tree (Figure 4) made with a mix of oth-er DENV-2 genotype references placed the new se-quences within the cosmopolitan genotype (17,19). However, this strain differed from other DENV-2 cosmopolitan strains reported previously in Sri Lanka (18,20) and was more closely related to vari-ants isolated from Singapore and China during 2014–2017.
Entomologic SurveillanceThe mean national Breteau index for 2017 was similar to that for 2013–2016 (11.67% vs. 12.9%; p = 0.833). Provincial-level differences were not significant. Types and proportions of water-retaining contain-ers positive for Ae. aegypti mosquitoes varied by province (Table 3). In Western, Sabaragamuwa, and North-Western provinces, discarded water-holding containers were the most common receptacles posi-tive for larvae. In contrast, in Central and Northern provinces, which had an extended drought in 2017, vector breeding was observed mainly in water stor-age containers and tanks. However, entomologic pa-rameters did not correlate with the disproportionate increase in dengue cases in 2017.
Climatic FactorsWe assessed whether dengue incidence correlated with climatic parameters (Figure 5). The mean an-nual rainfall in Colombo district was lower in 2017 than in 2012–2016 (1,908 mm vs. 2,447 mm). In the Jaffna district, cumulative rainfall during 2017 (1,342 mm) was similar to the average annual rainfall for 2012–2016 (1,297 mm). El Niño conditions (Oceanic Niño Index >0.5) were observed in 2015 and 2016 but not in 2017. In addition, temperature patterns in both districts during 2017 and during the preceding 5 years did not change notably. Therefore, weather conditions were stable in both districts throughout 2012–2017, despite the disproportionate increase in dengue incidence in 2017.
Cost AnalysisWe estimated the direct cost of dengue control and outbreak response activities during the epidemic year of 2017 to be US $12.7 million (LKR 1.938 billion), cor-responding to a per capita cost of US $0.64 (Table 4). Of this total, US $4.4 million (35%; US $0.22 per capi-ta) was spent on outbreak response activities.
DiscussionIn 2017, a dengue epidemic in Sri Lanka resulted in an unprecedented number of cases and dengue-re-lated deaths and a considerable strain on resources
in terms of direct expenditures. Incidence increased substantially throughout the country; even the dis-trict with the lowest incidence for 2017 had a 3-fold increase over the average of the preceding 5 years. The epidemic primarily affected older schoolchil-dren and young adults in the workforce, with some marked disparities in age-specific incidence rates across provinces. Entomologic and climatic factors (except rainfall) did not explain the increased inci-dence. Limited virologic surveillance during 2017 in the district most affected (Colombo) showed DENV-2 dominance.
Temporal trends in dengue incidence are close-ly linked to the demographic characteristics of Sri Lanka. Historically, seasonal dengue outbreaks have heavily affected the country’s urban areas and, more conspicuously, the Colombo district (which compris-es 11% of the country’s population and has the high-est population density) (10). In entomologic surveys,
Emerging Infectious Diseases • www.cdc.gov/eid • Vol. 26, No. 4, April 2020 685
Table 1. Incidence of dengue, Sri Lanka*
Province, administrative district
Mean incidence†
2017 2012–2016 Fold increase
in 2017‡ Western Colombo 1,419 503 2.8 Gampaha 1,323 252 5.2 Kalutara 861 190 4.5 Eastern Trincomalee 1,214 107 11.4 Batticaloa 1,001 157 6.4 Kalmunai 698 131 5.3 Sabaragamuwa Kegalle 1,090 174 6.3 Ratnapura 978 214 4.6 Northern Jaffna 996 251 4.0 Vavuniya 583 87 6.7 Mannar 500 175 2.9 Kilinochchi 418 70 6.0 Mulativu 402 130 3.1 Central Kandy 990 162 6.1 Matale 616 125 4.9 Nuwara Eliya 118 40 2.9 Southern Matara 976 89 10.9 Galle 553 138 4.0 Hambantota 419 107 3.9 North-Western Puttalam 965 119 8.1 Kurunegala 665 135 4.9 Uva Moneragala 668 64 10.4 Badulla 430 88 4.9 North-Central Polonnaruwa 325 96 3.4 Anuradhapura 317 60 5.3 National average 866 189 4.6 *Source: (7). †Cases/100,000 population. ‡Increases were significant in all districts (p<0.05) compared with the average for 2012–2016.

SYNOPSIS
more than half of Ae. aegypti vector breeding occurred in discarded items (e.g., containers, tires) in the West-ern province, signifying the effect of poor container waste management, which is conducive for vector breeding. On a global scale, the high vector-to-host ra-tio profoundly affects dengue epidemiology (21–25). In Vietnam, a study of 2 outbreaks during 2005–2008 showed that dengue incidence increased in a critical window of population density (3,000–7,000/km2) and declined thereafter (26).
In most Sri Lanka provinces, including the West-ern province, the highest dengue incidence rate oc-curred among persons 20–29 years of age (without any sex difference), followed by persons 10–19 years of age. These age groups comprise children attending secondary schools (up to 18 years of age), students of tertiary education institutions, and young work-ing adults. The same trend has been observed in the
686 Emerging Infectious Diseases • www.cdc.gov/eid • Vol. 26, No. 4, April 2020
Figure 2. Comparison of dengue incidence rates per district in 2017 with the 5-year (2012–2016) average, Sri Lanka. A) Incidence rate in 2017. B) Historical mean incidence rate during 2012–2016. Incidence is cases per 100,000 population. Source: (7).
Table 2. Age distribution of dengue patients, Sri Lanka, 2017*
Province Mean age, y + SD 25th
percentile 75th
percentile Western 28.7† 18.5 14.0 40.0 Eastern 22.3† 16.4 9.0 31.0 Sabaragamuwa 35.7‡ 18.1 22.0 49.0 Northern 27.6† 16.5 17.0 36.0 Central 29.5 17.6 16.0 41.0 Southern 33.2‡ 17.3 21.0 45.0 North-Western 31.1 18.3 17.0 44.0 Uva 31.1 16.9 19.0 42.0 North-Central 34.1‡ 14.3 23.0 43.0 National average 29.7 18.2 16.0 42.0 *Source: (7). †Significantly lower mean age than the national average, p<0.05. ‡Significantly higher mean age than the national average, p<0.05.
Figure 3. Dengue incidence rates by age group and sex, Sri Lanka, 2017. Incidence is cases per 100,000 population. Source: (7).

Dengue Epidemic, Sri Lanka
Southeast Asia region, where older schoolchildren have a higher risk for clinical illness (27). However, the dengue incidence in younger age groups (0–9 years) might be underestimated because of asymp-tomatic or mild primary infection. Approximately half of primary dengue infections in children are in-apparent (28,29), whereas primary infections in adults more often result in overt disease (30). In Sri Lanka, incidence also decreased among elderly persons,
which cannot be explained by asymptomatic infec-tions. According to Sri Lanka’s 2012 census, 31.3% of the population was 10–29 years of age, and only 12.4% was >60 years of age (10). Comparable data from other countries in Asia give conflicting results about age-specific dengue incidence. For example, in Taiwan and Singapore during 2010–2015, the preva-lence of dengue was higher in persons >60 years of age than in younger persons, a plausible reflection of
Emerging Infectious Diseases • www.cdc.gov/eid • Vol. 26, No. 4, April 2020 687
Table 3. Type and proportion of breeding habitats positive for Aedes aegypti mosquitoes, Sri Lanka, 2017*
Province Discarded items,
%
Water storage containers and
tanks, %
Ponds and ornamental
items, % Wells and tube
wells, % Natural water collections, %
Other miscellaneous
items, %† Western 50.9 10.0 3.7 1.6 2.2 31.5 Eastern 33.9 22.9 3.0 11.5 1.6 27.0 Sabaragamuwa 55.6 5.1 5.1 9.5 0.8 24.0 Northern 18.8 55.0 2.9 0.2 0.1 23.0 Central 21.9 42.9 1.8 0.0 0.2 33.2 Southern 41.6 23.7 4.8 0.0 4.1 25.9 North-Western 46.4 21.7 1.1 5.6 0.2 24.9 Uva 41.2 39.2 1.2 0.0 0.5 17.9 North-Central 19.1 30.1 8.1 0.0 0.0 42.8 National average 38.7 23.9 3.4 5.8 1.3 26.8 *Total number of premises inspected: 279,728; total Ae. aegypti–positive containers: 9,699. Source: (7). †Including refrigerator trays, nonfunctional cisterns, pet feeding cups, gutters, concrete slabs, and any other water-collecting containers.
Figure 4. Phylogenetic tree for 5 dengue virus 2 (DENV-2) isolates from late 2016 and 2017 dengue epidemic (arrows), Sri Lanka, and reference DENV-2 strains. The tree is based on a 1,485-nt fragment that encodes the envelope protein. Classification and naming of DENV-2 genotypes are based on (16). The evolutionary history was inferred using the neighbor-joining method (17). The optimal tree with the sum of branch length = 0.44012906 is shown. The tree is drawn to scale, with branch lengths in the same units as those of the evolutionary distances used to infer the phylogenetic tree. The evolutionary distances were computed using the maximum composite likelihood method (18) and are in the units of the number of base substitutions per site. This analysis involved 33-nt sequences. All ambiguous positions were removed for each sequence pair (pairwise deletion option). The final dataset comprised 1,485 positions. Evolutionary analyses were conducted in MEGA X (12). Scale bar indicates nucleotide substitutions per site.

SYNOPSIS
an aging but active elderly population (31–33). On the other hand, in countries such as India, Vietnam, and Brazil, dengue incidence is increasing in a higher pro-portion of persons in younger age groups (27,34,35).
In many countries, serotype switches of circu-lating dengue viruses have been associated with se-vere epidemics when the population is exposed to a new serotype (36,37). Host immunity against 1 den-gue serotype only partially protects against other serotypes. In fact, heterotypic antibodies may exag-gerate the inflammatory response during infection with a different serotype (38). Circulating serotypes in Sri Lanka were monitored in the past by a handful of research studies in the absence of a national viro-logic surveillance program. A study conducted dur-ing 2003–2006 (39) and another during a large epi-demic in 2009 (40) concluded that DENV-1 was the dominant circulating serotype in all these periodic epidemics. This observation remained unchanged in 2 subsequent epidemics in 2010 and 2012 (41). However, during 2003–2006, DENV-2 and DENV-3 serotypes caused between-epidemic background dengue transmission (39). After 2010, the number of DENV-1 cases progressively increased, taking over
the background transmission from DENV-2 infec-tions, which might have led to a loss of immunity to DENV-2 in the population. Limited virologic sur-veillance from the Colombo district demonstrated DENV-2 dominance in the 2017 samples, but this finding cannot be extrapolated to the entire country. The viruses isolated from the 5 patients had almost identical sequences and belonged to the cosmopoli-tan genotype of DENV-2. The phylogenetic analysis demonstrates this strain to be a new strain (for Sri Lanka) that most likely came from Southeast Asia or China (18).
Of all the climatic factors studied, only monsoon rainfall had a clear relationship over the years with the dengue incidence. Historically, the incidence of dengue in Sri Lanka shows 2 peaks per year, each of which occurs a few weeks after onset of the 2 mon-soons affecting the country. The southwest monsoon brings in heavy rainfall midyear (May–September) to Western, Sabaragamuwa, Southern, and Central provinces, and the northeast monsoon brings a rela-tively heavy rainfall during December–February for the Northern, North Central, Uva, and Eastern prov-inces. The midyear peak in dengue incidence in 2017
688 Emerging Infectious Diseases • www.cdc.gov/eid • Vol. 26, No. 4, April 2020
Figure 5. Time series plot showing weekly number of reported dengue cases (red line), ONI (orange line), PI (green line), and weekly cumulative rainfall, mm (blue line), Sri Lanka, 2012–2017. A) Colombo district. B) Jaffna district. ONI, Oceanic Niño Index; PI, Premise Index.

Dengue Epidemic, Sri Lanka
was exceptionally high in all provinces affected by the southwest monsoon (weeks 25–35).
The increase in dengue incidence in 2017 could not be explained by entomologic parameters because they did not differ significantly between preceding years and 2017. The types of breeding sites reported in each of the provinces varied but also did not have any relationship with the reported case incidence.
Sri Lanka’s government-led dengue control ac-tivities mainly focus on vector control. These meth-ods include routine measures of integrated vector control that are in place periodically throughout the year and outbreak control measures during epi-demics: health education, source reduction of vec-tor breeding sites, chemical fogging, and punitive measures (e.g., fines, warnings for harboring mos-quito breeding sites). Integrating a biological control method into this framework by introducing the lar-vicidal Bacillus thuringiensis bacterium did not yield promising results in a recently concluded field trial in the city of Colombo and its suburbs in the West-ern province (42). Outbreak control measures usu-ally are conducted as civilian–military partnerships focusing on breeding site removal. These methods come into effect only when an epidemic is ongoing and are not helpful in preventing one. Government expenditure on dengue control activities (excluding costs of curative services and indirect costs) is sub-stantial, and 35% of the cost was on outbreak con-trol, which could have been averted by better out-break prevention. During the epidemic year of 2012, per capita spending for dengue in Colombo district was US $0.42 (US $0.48 when adjusted for deprecia-tion of the LKR during 2012–2017) (43). In 2017, per capita expenditure was US $0.64 in a countrywide cost assessment.
Our findings are subject to several limitations. A large volume of the national surveillance system data originates from the public health services and in-ward facilities of private hospitals. Data from out-patient departments of private hospitals and general practitioners are underrepresented. In addition, fa-cilities for laboratory diagnosis are limited. Although most cases were reported as suspected cases diag-nosed with syndromic definition using clinical crite-ria and serial blood counts, on-demand rapid antigen detection tests are becoming increasingly available. The number of dengue infections in Sri Lanka still can be underestimated because clinically inappar-ent infections are not counted. Because of the lack of national virologic surveillance, genomic data on in-fecting viruses are available only from the Western province, which might not be representative for the rest of the country.
In retrospect, the key early indicators of the dis-proportionate epidemic in 2017 were the increase in cases in the latter half of 2016 and the gradual transi-tion of the circulating strain (limited evidence from 1 district). An increase in the number of cases every year after monsoon rains is clear in all years studied. The direct costs of dengue control are huge once an outbreak occurs and could have been better spent on outbreak prevention rather than on outbreak control if prevention activities were sustained throughout the intermonsoon period and intensified during the monsoon rains. Epidemiologic surveillance based on suspected cases (vs. confirmed cases) is not ideal but is the best many dengue-endemic countries can do with limited access to point-of-care diagnostic testing. Capturing data from currently underreport-ing healthcare providers (e.g., general practitioners) is a priority to get an accurate picture of dengue in
Emerging Infectious Diseases • www.cdc.gov/eid • Vol. 26, No. 4, April 2020 689
Table 4. Direct costs of dengue control and outbreak response activities, Sri Lanka, 2017* Type of activity Sri Lanka rupee US $ Routine dengue control activities Personnel: public health staff salaries 1,060,340,000 6,955,512 Development of health education material and advertising 5,000,000 32,798 Implementation of dengue awareness campaign through electronic and print media 10,000,000 65,597 Integrated vector management; insecticides and fogging machines 156,000,000 1,023,313 Recurrent costs at National Dengue Control Unit 7,000,000 45,918 Routine vector control and recurrent costs in periphery 25,000,000 163,992 Subtotal 1,263,340,000 8,287,131 Outbreak response activities Personnel: public health staff extra duty pay for outbreak response, at national and regional/district levels
176,723,333 1,159,252
Outbreak response brigades: brigade staff salaries and other expenses during outbreak response 114,000,000 747,806 Purchase of mini cabs for vector control (50 cabs) 75,000,000 491,977 Establishment of high-dependency units in public hospitals 181,000,000 1,187,306 Intensified door-to-door premise inspection campaign in high-risk districts 128,000,000 839,642 Subtotal 674,723,333 4,425,983 Total 1,938,063,333 12,713,114 Cost per capita 96.90 0.64 *Source: (7).

SYNOPSIS
Sri Lanka. Establishing a virologic surveillance sys-tem covering the entire country is important and is becoming feasible as new third-generation sequenc-ing technologies become portable and less expensive. However, health education that results in behavior change of communities remains the most effective way of reducing vector breeding sites to prevent out-breaks. The government should facilitate health edu-cation as well as a good waste management policy backed by periodic audits.
AcknowledgmentsWe sincerely appreciate the support extended by Nimalka Pannila Hetti, Anoja Dheerasinghe, Mizaya Cader, Sunith Kumarapperuma, Iroshini Abeysekara, Thanuja Rathnayaka, and Indika Weerasinghe. We gratefully acknowledge the technical and nontechnical staff of the National Dengue Control Unit. We appreciate the work of Sampath Weerakoon and Dinusha Perera.
About the AuthorDr. Tissera is a medical epidemiologist leading the National Dengue Control Programme of the Ministry of Health, Sri Lanka. His primary research interests include national surveillance of dengue, coordination of dengue case management, and training of all levels of clinical and public health staff.
References 1. Stanaway JD, Shepard DS, Undurraga EA, Halasa YA,
Coffeng LE, Brady OJ, et al. The global burden of dengue: an analysis from the Global Burden of Disease Study 2013. Lancet Infect Dis. 2016;16:712–23. https://doi.org/10.1016/S1473-3099(16)00026-8
2. Bhatt S, Gething PW, Brady OJ, Messina JP, Farlow AW, Moyes CL, et al. The global distribution and burden of dengue. Nature. 2013;496:504–7. https://doi.org/10.1038/nature12060
3. Department of Census & Statistics, Ministry of Policy Planning and Economic Affairs. Population by ethnicity and district according to Divisional Secretary’s Division, 2012. In: Census of Population and Housing 2012—final report. Colombo (Sri Lanka): The Ministry; 2012 [cited 2018 May 15]. http://www.statistics.gov.lk/PopHouSat/CPH2011/Pages/Activities/Reports/FinalReport/FinalReportE.pdf
4. Vitharana T, Jayakuru WS. Historical account of dengue haemorrhagic fever in Sri Lanka. WHO/SEARO. Dengue Bull. 1997;21:117–8.
5. Messer WB, Vitarana UT, Sivananthan K, Elvtigala J, Preethimala LD, Ramesh R, et al. Epidemiology of dengue in Sri Lanka before and after the emergence of epidemic dengue hemorrhagic fever. Am J Trop Med Hyg. 2002;66:765–73. https://doi.org/10.4269/ajtmh.2002.66.765
6. Kulatilaka TA, Jayakuru WS. Control of dengue/dengue haemorrhagic fever in Sri Lanka. Dengue Bull. 1998;22:53–61.
7. Epidemiology Unit, Ministry of Health, Sri Lanka. Distribution of notification(H399) dengue cases by month
[cited 2018 May 15]. http://www.epid.gov.lk/web/index.php?option=com_casesanddeaths&Itemid=448&lang=en#
8. Tissera H, Weeraman J, Amarasinghe A, Wijewickrama A, Palihawadana P, Fernando L. Expediency of dengue illness classification: The Sri Lankan perspective. WHO South East Asia J Public Health. 2014;3:5–7. https://doi.org/ 10.4103/2224-3151.206884
9. Tissera H, Amarasinghe A, Gunasena S, DeSilva AD, Yee LW, Sessions O, et al. Laboratory-enhanced dengue sentinel surveillance in Colombo district, Sri Lanka: 2012–2014. PLoS Negl Trop Dis. 2016;10:e0004477. https://doi.org/10.1371/journal.pntd.0004477
10. Department of Census and Statistics of Sri Lanka. Sri Lanka census of population and housing 2011. 2012 [cited 2016 Feb 26]. http://www.statistics.gov.lk/PopHouSat/CPH2011/index.php?fileName=Activities/TentativelistofPublications
11. Kumar S, Nei M, Dudley J, Tamura K. MEGA: a biologist-centric software for evolutionary analysis of DNA and protein sequences. Brief Bioinform. 2008;9:299–306. https://doi.org/10.1093/bib/bbn017
12. World Health Organization. Vector surveillance [cited 2018 Dec 1]. https://www.who.int/denguecontrol/monitoring/vector_surveillance
13. National Oceanic and Atmospheric Administration. Cold and warm episodes by season [cited 2018 Sep 15]. https://origin.cpc.ncep.noaa.gov/products/analysis_ monitoring/ensostuff/ONI_v5.php
14. Gasparrini A, Armstrong B, Kenward MG. Distributed lag non-linear models. Stat Med. 2010;29:2224–34. https://doi.org/10.1002/sim.3940
15. R Development Core Team. R: a language and environment for statistical computing. Vienna (Austria): R Project; 2010.
16. Waman VP, Kolekar P, Ramtirthkar MR, Kale MM, Kulkarni-Kale U. Analysis of genotype diversity and evolution of Dengue virus serotype 2 using complete genomes. PeerJ. 2016;4:e2326. https://doi.org/10.7717/peerj.2326
17. Tamura K, Nei M, Kumar S. Prospects for inferring very large phylogenies by using the neighbor-joining method. Proc Natl Acad Sci U S A. 2004;101:11030–5. https://doi.org/ 10.1073/pnas.0404206101
18. Tsuboi M, Kutsuna S, Maeki T, Taniguchi S, Tajima S, Kato F, et al. Dengue virus type 2 in travelers returning to Japan from Sri Lanka, 2017. Emerg Infect Dis. 2017;23:1931–3. https://doi.org/10.3201/eid2311.171293
19. Saitou N, Nei M. The neighbor-joining method: a new method for reconstructing phylogenetic trees. Mol Biol Evol. 1987;4:406–25.
20. Moore PR, van den Hurk AF, Mackenzie JS, Pyke AT. Dengue viruses in Papua New Guinea: evidence of endemicity and phylogenetic variation, including the evolution of new genetic lineages. Emerg Microbes Infect. 2017;6:e114. https://doi.org/10.1038/emi.2017.103
21. Gubler DJ. Dengue, urbanization and globalization: the unholy trinity of the 21(st) century. Trop Med Health. 2011;39(Suppl):3–11. https://doi.org/10.2149/tmh.2011-S05
22. Câmara FP, Theophilo RL, Dos Santos GT, Pereira SR, Câmara DC, de Matos RR. Regional and dynamics characteristics of dengue in Brazil: a retrospective study [in Portuguese]. Rev Soc Bras Med Trop. 2007;40:192–6.
23. Barreto FR, Teixeira MG, Costa MC, Carvalho MS, Barreto ML. Spread pattern of the first dengue epidemic in the city of Salvador, Brazil. BMC Public Health. 2008;8:51. https://doi.org/10.1186/1471-2458-8-51
24. Li Y, Kamara F, Zhou G, Puthiyakunnon S, Li C, Liu Y, et al. Urbanization increases Aedes albopictus larval habitats
690 Emerging Infectious Diseases • www.cdc.gov/eid • Vol. 26, No. 4, April 2020

Dengue Epidemic, Sri Lanka
and accelerates mosquito development and survivorship. PLoS Negl Trop Dis. 2014;8:e3301. https://doi.org/10.1371/journal.pntd.0003301
25. Sirisena P, Noordeen F, Kurukulasuriya H, Romesh TA, Fernando L. Effect of climatic factors and population density on the distribution of dengue in Sri Lanka: a GIS based evaluation for prediction of outbreaks. PLoS One. 2017;12:e0166806. https://doi.org/10.1371/ journal.pone.0166806
26. Schmidt WP, Suzuki M, Thiem VD, White RG, Tsuzuki A, Yoshida LM, et al. Population density, water supply, and the risk of dengue fever in Vietnam: cohort study and spatial analysis. PLoS Med. 2011;8:e1001082. https://doi.org/10.1371/journal.pmed.1001082
27. Thai KT, Nishiura H, Hoang PL, Tran NT, Phan GT, Le HQ, et al. Age-specificity of clinical dengue during primary and secondary infections. PLoS Negl Trop Dis. 2011;5:e1180. https://doi.org/10.1371/journal.pntd.0001180
28. Halstead SB. Neutralization and antibody-dependent enhancement of dengue viruses. Adv Virus Res. 2003;60: 421–67. https://doi.org/10.1016/S0065-3527(03)60011-4
29. Tissera H, Amarasinghe A, De Silva AD, Kariyawasam P, Corbett KS, Katzelnick L, et al. Burden of dengue infection and disease in a pediatric cohort in urban Sri Lanka. Am J Trop Med Hyg. 2014;91:132–7. https://doi.org/ 10.4269/ajtmh.13-0540
30. Wilder-Smith A, Schwartz E. Dengue in travelers. N Engl J Med. 2005;353:924–32. https://doi.org/10.1056/ NEJMra041927
31. Hsu JC, Hsieh CL, Lu CY. Trend and geographic analysis of the prevalence of dengue in Taiwan, 2010-2015. Int J Infect Dis. 2017;54:43–9. https://doi.org/10.1016/j.ijid.2016.11.008
32. Rajarethinam J, Ang L-W, Ong J, Ycasas J, Hapuarachchi HC, Yap G, et al. Dengue in Singapore from 2004 to 2016: cyclical epidemic patterns dominated by serotypes 1 and 2. Am J Trop Med Hyg. 2018;99:204–10. https://doi.org/10.4269/ajtmh.17-0819
33. Ooi EE, Goh KT, Gubler DJ. Dengue prevention and 35 years of vector control in Singapore. Emerg Infect Dis. 2006;12: 887–93. https://doi.org/10.3201/eid1206.051210
34. Shastri J, Williamson M, Vaidya N, Agrawal S, Shrivastav O. Nine year trends of dengue virus infection in Mumbai, Western India. J Lab Physicians. 2017;9:296–302. https://doi.org/10.4103/JLP.JLP_169_16
35. Teixeira MG, Costa MCN, Coelho G, Barreto ML. Recent shift in age pattern of dengue hemorrhagic fever, Brazil.
Emerg Infect Dis. 2008;14:1663. https://doi.org/10.3201/eid1410.071164
36. Hapuarachchi HC, Koo C, Rajarethinam J, Chong C-S, Lin C, Yap G, et al. Epidemic resurgence of dengue fever in Singapore in 2013–2014: A virological and entomological perspective. BMC Infect Dis. 2016;16:300. https://doi.org/ 10.1186/s12879-016-1606-z
37. Rodriguez-Roche R, Blanc H, Bordería AV, Díaz G, Henningsson R, Gonzalez D, et al. Increasing clinical severity during a dengue virus type 3 Cuban epidemic: deep sequencing of evolving viral populations. J Virol. 2016;90:4320–33. https://doi.org/10.1128/JVI.02647-15
38. Lee K-S, Lo S, Tan SS-Y, Chua R, Tan L-K, Xu H, et al. Dengue virus surveillance in Singapore reveals high viral diversity through multiple introductions and in situ evolution. Infect Genet Evol. 2012;12:77–85. https://doi.org/ 10.1016/j.meegid.2011.10.012
39. Kanakaratne N, Wahala WM, Messer WB, Tissera HA, Shahani A, Abeysinghe N, et al. Severe dengue epidemics in Sri Lanka, 2003-2006. Emerg Infect Dis. 2009;15:192–9. https://doi.org/10.3201/eid1502.080926
40. Tissera HA, Ooi EE, Gubler DJ, Tan Y, Logendra B, Wahala WM, et al. New dengue virus type 1 genotype in Colombo, Sri Lanka. Emerg Infect Dis. 2011;17:2053–5. https://doi.org/10.3201/eid1711.101893
41. Uehara A, Tissera HA, Bodinayake CK, Amarasinghe A, Nagahawatte A, Tillekeratne LG, et al. Analysis of dengue serotype 4 in Sri Lanka during the 2012–2013 dengue epidemic. Am J Trop Med Hyg. 2017;97:130–6. https://doi.org/10.4269/ajtmh.16-0540
42. Tissera HA, Samaraweera PC, Jayamanne BDW, Janaki MDS, U Chulasiri MPP, Rodrigo C, et al. Use of Bacillus thuringiensis israelensis in integrated vector control of Aedes sp. in Sri Lanka: a prospective controlled effectiveness study. Trop Med Int Health. 2018;23:229–35. https://doi.org/10.1111/tmi.13015
43. Thalagala N, Tissera H, Palihawadana P, Amarasinghe A, Ambagahawita A, Wilder-Smith A, et al. Costs of dengue control activities and hospitalizations in the public health sector during an epidemic year in urban Sri Lanka. PLoS Negl Trop Dis. 2016;10:e0004466. https://doi.org/10.1371/journal.pntd.0004466
Address for correspondence: Hasitha A. Tissera, National Dengue Control Unit, Central Epidemiology Unit, #231, De Saram Place, Colombo 10, Sri Lanka; email: [email protected]
Emerging Infectious Diseases • www.cdc.gov/eid • Vol. 26, No. 4, April 2020 691
Page 1 of 2
Article DOI: https://doi.org/10.3201/eid2604.190435
Severe Dengue Epidemic, Sri Lanka, 2017 Appendix
Supplementary Methods
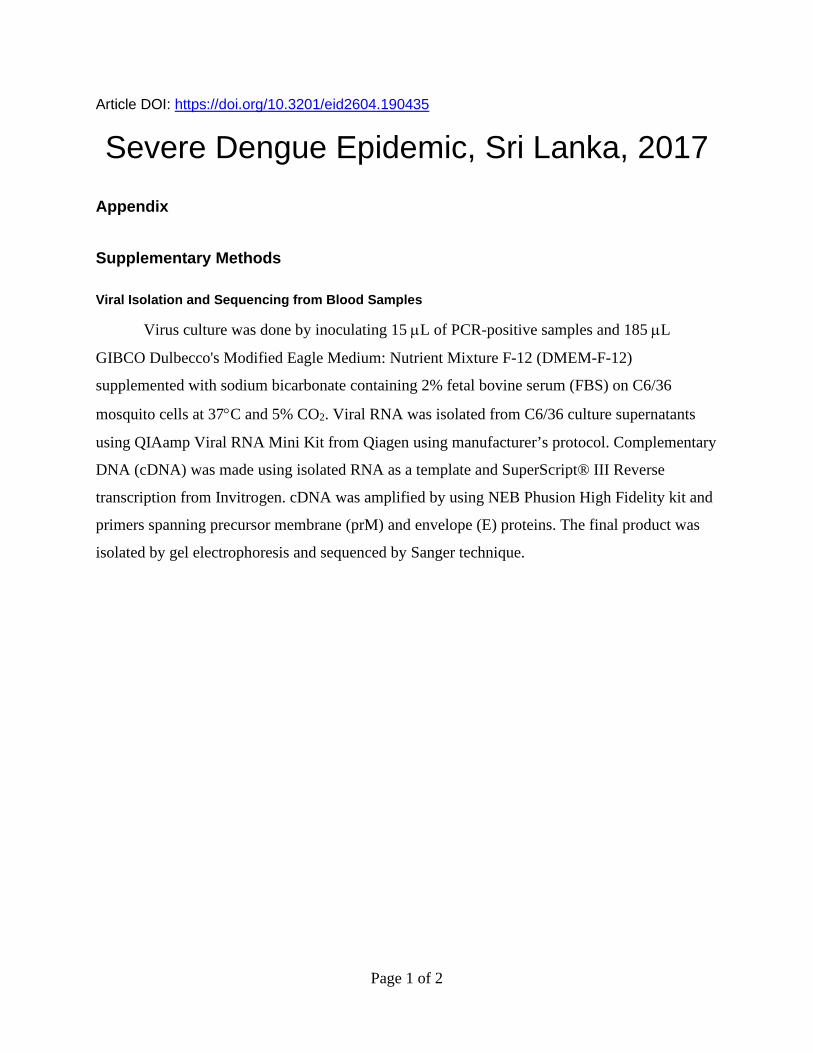
Viral Isolation and Sequencing from Blood Samples
Virus culture was done by inoculating 15 µL of PCR-positive samples and 185 µL
GIBCO Dulbecco's Modified Eagle Medium: Nutrient Mixture F-12 (DMEM-F-12)
supplemented with sodium bicarbonate containing 2% fetal bovine serum (FBS) on C6/36
mosquito cells at 37°C and 5% CO2. Viral RNA was isolated from C6/36 culture supernatants
using QIAamp Viral RNA Mini Kit from Qiagen using manufacturer’s protocol. Complementary
DNA (cDNA) was made using isolated RNA as a template and SuperScript® III Reverse
transcription from Invitrogen. cDNA was amplified by using NEB Phusion High Fidelity kit and
primers spanning precursor membrane (prM) and envelope (E) proteins. The final product was
isolated by gel electrophoresis and sequenced by Sanger technique.

Page 2 of 2
Appendix Table. Age-specific dengue incidence by province, Sri Lanka*
Province Age-specific incidence per 100,000 population
0–4 y 5–9 y 10–14 y 15–19 y 20–24 y 25–29 y 30–34 y 35–39 y 40–44 y 44–49 y 50–64 y >65 y Western 1,050.58 1,742.60 2,181.65 2,011.07 1,896.41 1401.98 1,562.64 1,247.91 1,137.35 1,029.01 994.95 849.80 Eastern 807.18 1,332.27 1,285.31 1,143.92 705.01 512.37 516.14 390.49 320.15 148.27 280.80 160.95 Sabaraga-muwa 245.22 366.83 644.99 889.44 1,107.81 949.64 1,159.29 962.81 958.22 854.35 904.92 714.39 Northern 327.35 496.99 542.26 877.08 843.38 552.60 510.08 400.41 285.90 172.67 260.59 240.18 Central 303.90 591.12 999.58 1,262.67 893.26 671.94 724.10 613.29 587.65 564.96 522.86 366.98 Southern 178.39 269.14 461.82 724.48 994.49 702.40 723.89 614.68 562.29 467.06 551.51 380.82 North Western 291.63 486.48 632.97 690.28 636.56 497.07 564.06 496.52 440.14 378.89 444.78 302.17 Uva 56.65 120.35 166.88 308.57 308.01 231.03 208.88 177.74 164.36 93.92 149.93 95.77 North Central 23.38 30.54 66.18 217.98 391.58 318.48 333.14 269.94 237.15 233.63 160.05 76.96 Total 500.76 833.17 1,080.28 1,151.98 1,094.62 819.80 899.87 735.29 672.90 586.71 608.32 472.82
*Source: sentinel site surveillance