Embed Size (px)
Citation preview

Step Up to the TEKS by GF Educators, Inc.
Seventh Grade Mathematics
2018 Released Items Analysis
Copyright © 2018
Edition I
www.StepUpTEKS.com
Teacher:


7th Grade Mathematics
Name: _______________________
Teacher: ______________________
Date: _________________________
Released Items
Step Up to the TEKS by GF Educators, Inc.
Instructional Analysis2018 Released Test
© 2018 2 7th Grade Mathematics
2018 Released Items
7th Grade Math
ITEM
TEKS
Provided by:
www.StepUpTEKS.com
ITEM
TEKS
Provided by:
www.StepUpTEKS.com
ItemAnalysis
IA
Item Analysis
Using or Including
Concept
Verb
Process TEKS
Item Analysis
Using or Including
Concept
Verb
Process TEKS
Compound Events
Tree Diagrams
Represent
Sets and Subsets
Visual Representation
Extend
Category 1 7th Grade Math
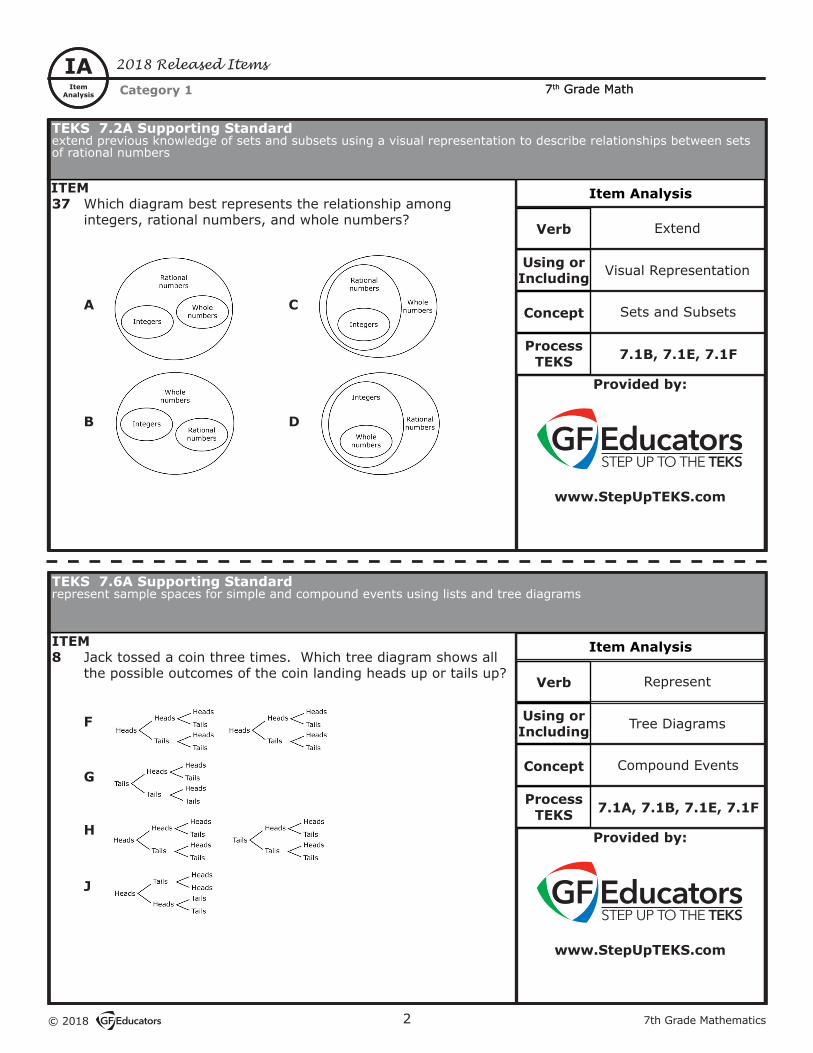
8 Jack tossed a coin three times. Which tree diagram shows all the possible outcomes of the coin landing heads up or tails up?
F
G
H
J
TEKS 7.6A Supporting Standardrepresent sample spaces for simple and compound events using lists and tree diagrams
7.1A, 7.1B, 7.1E, 7.1F
7.1B, 7.1E, 7.1F
37 Which diagram best represents the relationship among integers, rational numbers, and whole numbers?
A
C
B
D
TEKS 7.2A Supporting Standardextend previous knowledge of sets and subsets using a visual representation to describe relationships between sets of rational numbers
37th Grade Mathematics © 2018
2018 Released Items
7th Grade Math
ITEM
TEKS
Provided by:
www.StepUpTEKS.com
ItemAnalysis
IA
ITEM
TEKS
Provided by:
www.StepUpTEKS.com
Item Analysis
Using or Including
Concept
Verb
Process TEKS
Item Analysis
Using or Including
Concept
Verb
Process TEKS
Qualitative and Quantitative Predictions
Simple Experiments
Solve
Qualitative and Quantitative Predictions
Simple Experiments
Solve
Category 1 7th Grade Math
7.1A, 7.1B, 7.1G
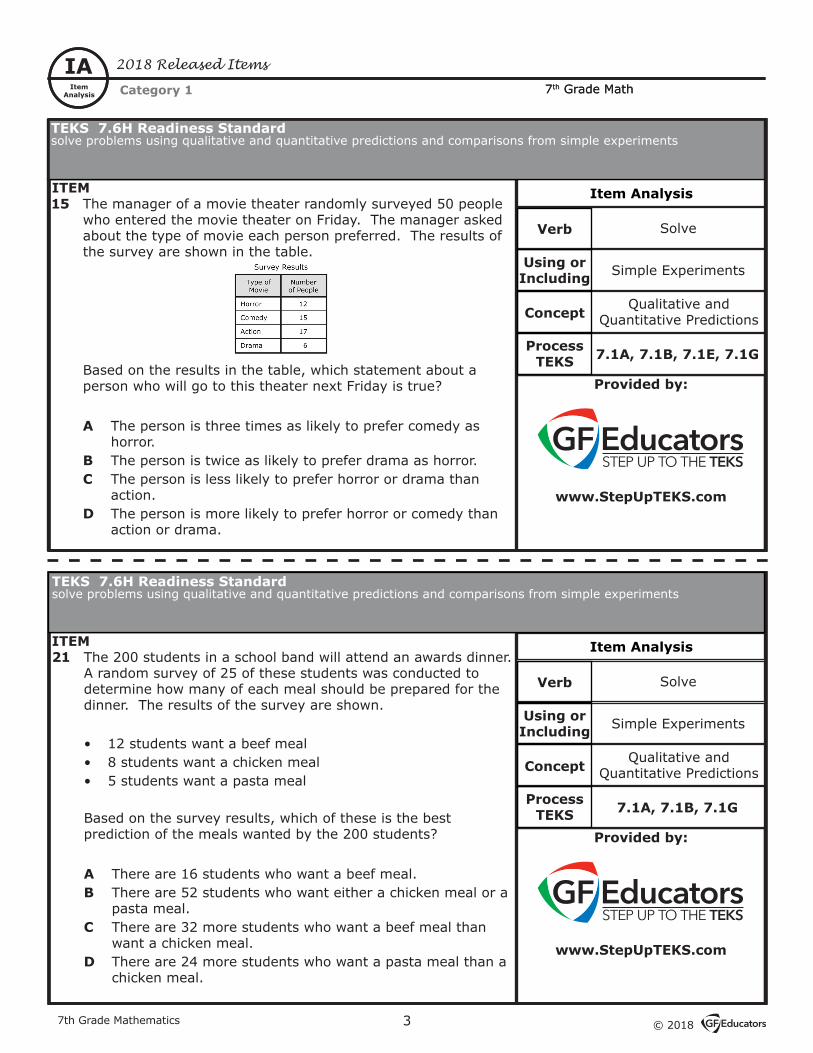
21 The 200 students in a school band will attend an awards dinner. A random survey of 25 of these students was conducted to determine how many of each meal should be prepared for the dinner. The results of the survey are shown.
• 12 students want a beef meal• 8 students want a chicken meal• 5 students want a pasta meal
Based on the survey results, which of these is the best prediction of the meals wanted by the 200 students?
A There are 16 students who want a beef meal.B There are 52 students who want either a chicken meal or a
pasta meal.C There are 32 more students who want a beef meal than
want a chicken meal.D There are 24 more students who want a pasta meal than a
chicken meal.
TEKS 7.6H Readiness Standardsolve problems using qualitative and quantitative predictions and comparisons from simple experiments
7.1A, 7.1B, 7.1E, 7.1G
15 The manager of a movie theater randomly surveyed 50 people who entered the movie theater on Friday. The manager asked about the type of movie each person preferred. The results of the survey are shown in the table.
Based on the results in the table, which statement about a person who will go to this theater next Friday is true?
A The person is three times as likely to prefer comedy as horror.
B The person is twice as likely to prefer drama as horror.C The person is less likely to prefer horror or drama than
action.D The person is more likely to prefer horror or comedy than
action or drama.
TEKS 7.6H Readiness Standardsolve problems using qualitative and quantitative predictions and comparisons from simple experiments

© 2018 4 7th Grade Mathematics
2018 Released Items
7th Grade Math
ITEM
TEKS
Provided by:
www.StepUpTEKS.com
ITEM
TEKS
Provided by:
www.StepUpTEKS.com
ItemAnalysis
IA
Item Analysis
Using or Including
Concept
Verb
Process TEKS
Item Analysis
Using or Including
Concept
Verb
Process TEKS
Data
Experimental Probability
Determine
Theoretical Probability
Sample Spaces
Determine
Category 1 7th Grade Math
7.1A, 7.1B, 7.1E, 7.1F
25 A number cube with faces labeled from 1 to 6 was rolled 20 times. Each time the number cube was rolled, the number showing on the top face was record. The table shows the results.
Based on these results, what is the experimental probability that the next time the number cube is rolled it will land with 5 or 6 showing on the top face?
A 25
B 320
C 13
D 35
TEKS 7.6I Readiness Standarddetermine experimental and theoretical probabilities related to simple and compound events using data and sample spaces
3 A classroom is arranged with 8 seats in the front row, 10 seats in the middle row, and 12 seats in the back row. The teacher randomly assigned seats to students as they enter the classroom.
Whatistheprobabilitythatthefirststudentwhoenterstheclassroom will be assigned a seat in the front row?
A 25
B 23
C 411
D 415
TEKS 7.6I Readiness Standarddetermine experimental and theoretical probabilities related to simple and compound events using data and sample spaces
7.1A, 7.1B, 7.1F

57th Grade Mathematics © 2018
2018 Released Items
7th Grade Math
ITEM
TEKS
Provided by:
www.StepUpTEKS.com
ItemAnalysis
IA
ITEM
TEKS
Provided by:
www.StepUpTEKS.com
Item Analysis
Using or Including
Concept
Verb
Process TEKS
Item Analysis
Using or Including
Concept
Verb
Process TEKS
Operations of Rational Numbers
Addition, Subtraction, Multiplication
Apply
Rational Numbers
Fluently
Multiply
7.1A, 7.1B, 7.1F
ITEM17 Maya has 120 caramel apples to sell. Each caramel apple is
covered with one topping.
•15 of the caramel apples are covered with peanuts.
•13 are covered with chocolate chips.
•310 are covered with coconut.
• The rest are covered with sprinkles.
How many caramel apples are covered with sprinkles?
A 100B 33C 25D 20
TEKS 7.3B Readiness Standardapply and extend previous understandings of operations to solve problems using addition, subtraction, multiplication, and division of rational numbers
7.1B, 7.1F
30 What is the value of the expression -9 x 2.2?
Recordyouranswerandfillinthebubblesonyouranswerdocument. Be sure to use the correct place value.
TEKS 7.3A Supporting Standardadd,subtract,multiply,anddividerationalnumbersfluently
Category 2 7th Grade Math

© 2018 6 7th Grade Mathematics
2018 Released Items
7th Grade Math
ITEM
TEKS
Provided by:
www.StepUpTEKS.com
ITEM
TEKS
Provided by:
www.StepUpTEKS.com
ItemAnalysis
IA
Item Analysis
Using or Including
Concept
Verb
Process TEKS
Item Analysis
Using or Including
Concept
Verb
Process TEKS
Constant Rate of Change
Algebraic Representation
Represent
Operations of Rational Numbers
Subtraction, Division
Apply
Category 2 7th Grade Math
7.1A, 7.1B, 7.1D, 7.1F
5 Cheddar cheese costs $4.25 per pound. Which equation best represents y, the total cost of x pounds of cheder cheese?
A x = 4.25 + yB x = 4.25yC y = 4.25 + xD y = 4.25x
TEKS 7.4A Readiness Standardrepresent constant rates of change in mathematical and real-world problems given pictorial, tabular, verbal, numeric, graphical, and algebraic representations, including d = rt
35 Marsha gave the cashier $20 to pay for 3 pairs of socks. The cashier gave her $5.03 in change. Each pair of socks cost the same amount.
What is the cost in dollars and cents for each pair of socks?
Recordyouranswerandfillinthebubblesonyouranswerdocument. Be sure to use the correct place value.
TEKS 7.3B Readiness Standardapply and extend previous understandings of operations to solve problems using addition, subtraction, multiplication, and division of rational numbers
7.1A, 7.1B, 7.1F

77th Grade Mathematics © 2018
2018 Released Items
7th Grade Math
ITEM
TEKS
Provided by:
www.StepUpTEKS.com
ItemAnalysis
IA
ITEM
TEKS
Provided by:
www.StepUpTEKS.com
Item Analysis
Using or Including
Concept
Verb
Process TEKS
Item Analysis
Using or Including
Concept
Verb
Process TEKS
Unit Rates
Real-World Problems
Calculate
Constant Rate of Change
Graphical, Verbal Description
Represent
Category 2 7th Grade Math
7.1A, 7.1B, 7.1F
7.1A, 7.1B, 7.1D, 7.1G
1 Arecipesaystouse3cupsofflourtomake48cookies.Whatis the constant of proportionality that relates the number of cookies made, y,tothenumberofcupsofflourused,x?
A 0.6B 48C 3 D 16
TEKS 7.4C Supporting Standarddetermine the constant of proportionality (k = y/x) within mathematical and real-world problems
40 The graph represents the linear relationship between the number of books Layla has read and the number of months she has been a member of a book club.
Which of these statements is supported by the rate of change in this relationship?F Laylaread2booksinthefirst3monthsshewasamember
of the book club.G Laylaread3booksinthefirst2monthsshewasamember
of the book club.H Laylaread3booksinthefirst4monthsshewasamember
of the book club.J Laylaread4booksinthefirst3monthsshewasamember
of the book club.
TEKS 7.4A Readiness Standardrepresent constant rates of change in mathematical and real-world problems given pictorial, tabular, verbal, numeric, graphical, and algebraic representations, including d = rt
© 2018 8 7th Grade Mathematics
2018 Released Items
7th Grade Math
ITEM
TEKS
Provided by:
www.StepUpTEKS.com
ITEM
TEKS
Provided by:
www.StepUpTEKS.com
ItemAnalysis
IA
Item Analysis
Using or Including
Concept
Verb
Process TEKS
Item Analysis
Using or Including
Concept
Verb
Process TEKS
Percent Problems
Percents
Solve
Percents
Percent Problems
Solve
Category 2 7th Grade Math
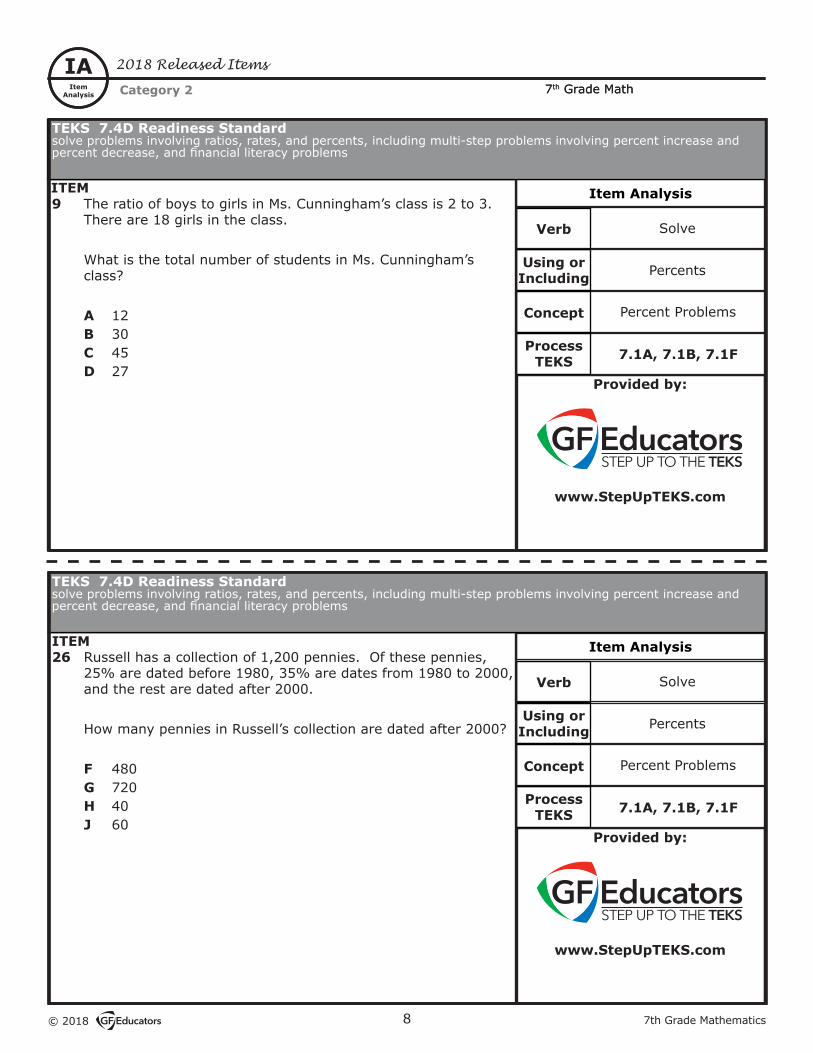
26 Russell has a collection of 1,200 pennies. Of these pennies, 25% are dated before 1980, 35% are dates from 1980 to 2000, and the rest are dated after 2000.
How many pennies in Russell’s collection are dated after 2000?
F 480G 720H 40J 60
TEKS 7.4D Readiness Standardsolve problems involving ratios, rates, and percents, including multi-step problems involving percent increase and percentdecrease,andfinancialliteracyproblems
9 The ratio of boys to girls in Ms. Cunningham’s class is 2 to 3. There are 18 girls in the class.
What is the total number of students in Ms. Cunningham’s class?
A 12B 30C 45D 27
TEKS 7.4D Readiness Standardsolve problems involving ratios, rates, and percents, including multi-step problems involving percent increase and percentdecrease,andfinancialliteracyproblems
7.1A, 7.1B, 7.1F
7.1A, 7.1B, 7.1F

97th Grade Mathematics © 2018
2018 Released Items
7th Grade MathItemAnalysis
IA
ITEM
TEKS
Provided by:
www.StepUpTEKS.com
Item Analysis
Using or Including
Concept
Verb
Process TEKS
Item Analysis
Using or Including
Concept
Verb
Process TEKS
TEKS
Provided by:
www.StepUpTEKS.com
Verbal Description
Linear Relationship
Represent
Table
Linear Relationships
Represent
Category 2 7th Grade Math
7.1A, 7.1B, 7.1D, 7.1G
24 Afishisswimmingataconstantratetowardtheoceanfloor.Theequationy = -7x – 3 can be used to represent this situation, where yisthedepthofthefishinmetersbelowsea level and xisthenumberofsecondsthefishhasbeenswimming.
Whichstatementbestdescribesthedepthofthefish,giventhis equation?
F From a starting position of 7 meters below sea level, the fishisdescending3meterspersecond.
G From a starting position of 7 meters below sea level, the fishisascending3meterspersecond.
H From a starting position of 3 meters below sea level, the fishisdescending7meterspersecond.
J From a starting position of 3 meters below sea level, the fishisascending7meterspersecond.
TEKS 7.7A Readiness Standardrepresent linear relationships using verbal descriptions, tables, graphs, and equations that simplify to the form y = mx + b
11 The table shows the relationship between y, the cost to rent a boat, and x, the amount of time the boat is rented.
Which graph best represents the relationship between x and y shown in the table?
A
C
B
D
TEKS 7.7A Readiness Standardrepresent linear relationships using verbal descriptions, tables, graphs, and equations that simplify to the form y = mx + b
7.1A, 7.1B, 7.1D, 7.1F
© 2018 10 7th Grade Mathematics
2018 Released Items
7th Grade Math
ITEM
TEKS
Provided by:
www.StepUpTEKS.com
ITEM
TEKS
Provided by:
www.StepUpTEKS.com
ItemAnalysis
IA
Item Analysis
Using or Including
Concept
Verb
Process TEKS
Item Analysis
Using or Including
Concept
Verb
Process TEKS
One-Variable, Two-Step Inequality Problem
NA
Write
One-Variable, Two-Step Inequality
NA
Write
Category 2 7th Grade Math
7.1A, 7.1B, 7.1D, 7.1F
7.1B, 7.1E, 7.1F
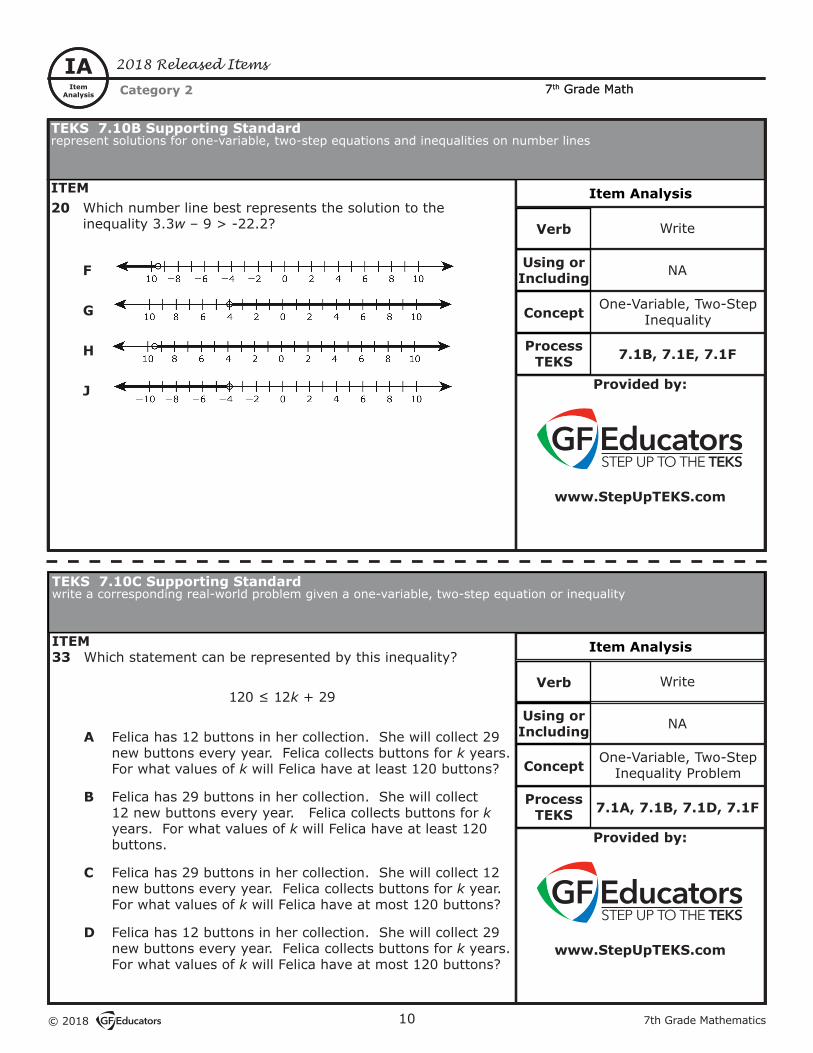
33 Which statement can be represented by this inequality?
120≤12k + 29
A Felica has 12 buttons in her collection. She will collect 29 new buttons every year. Felica collects buttons for k years. For what values of k will Felica have at least 120 buttons?
B Felica has 29 buttons in her collection. She will collect 12 new buttons every year. Felica collects buttons for k years. For what values of k will Felica have at least 120 buttons.
C Felica has 29 buttons in her collection. She will collect 12 new buttons every year. Felica collects buttons for k year. For what values of k will Felica have at most 120 buttons?
D Felica has 12 buttons in her collection. She will collect 29 new buttons every year. Felica collects buttons for k years. For what values of k will Felica have at most 120 buttons?
TEKS 7.10C Supporting Standardwrite a corresponding real-world problem given a one-variable, two-step equation or inequality
20 Which number line best represents the solution to the inequality 3.3w – 9 > -22.2?
F
G
H
J
TEKS 7.10B Supporting Standardrepresent solutions for one-variable, two-step equations and inequalities on number lines

117th Grade Mathematics © 2018
2018 Released Items
7th Grade Math
ITEM
TEKS
Provided by:
www.StepUpTEKS.com
ItemAnalysis
IA
ITEM
TEKS
Provided by:
www.StepUpTEKS.com
Item Analysis
Using or Including
Concept
Verb
Process TEKS
Item Analysis
Using or Including
Concept
Verb
Process TEKS
One-Variable, Two-Step Equation
Equation
Model and Solve
One-Variable, Two-Step Inequalities
Inequality
Solve
Category 2 7th Grade Math
7.1B, 7.1E, 7.1F
7.1B, 7.1F
ITEM28 The model represents an equation.
What is the solution for this equation?
F x = 3G x = 15H x = 5J x = 1
TEKS 7.11A Readiness Standardmodel and solve one-variable, two-step equations and inequalities
ITEM7 What is the solution set for -4x–10≤2?
A x≤-3B x≥-3C x≤2D x≥2
TEKS 7.11A Readiness Standardmodel and solve one-variable, two-step equations and inequalities

© 2018 12 7th Grade Mathematics
2018 Released Items
7th Grade Math
ITEM
TEKS
Provided by:
www.StepUpTEKS.com
ITEM
TEKS
Provided by:
www.StepUpTEKS.com
ItemAnalysis
IA
Item Analysis
Using or Including
Concept
Verb
Process TEKS
Item Analysis
Using or Including
Concept
Verb
Process TEKS
Value True
Equation
Determine
Category 2 7th Grade Math
7.1B, 7.1F
38 Which equation is true when k = -15?
F 3k – 11 = -34G -53 + 4k = 7
H k3 + 17 = 12
J k5 + 2.5 = 0.5
TEKS 7.11B Supporting Standarddetermine if the given value(s) make(s) one-variable, two-step equations and inequalities true

137th Grade Mathematics © 2018
2018 Released Items
7th Grade Math
ITEM
TEKS
Provided by:
www.StepUpTEKS.com
ItemAnalysis
IA
ITEM
TEKS
Provided by:
www.StepUpTEKS.com
Item Analysis
Using or Including
Concept
Verb
Process TEKS
Item Analysis
Using or Including
Concept
Verb
Process TEKS
Critical Attributes of Similarity
NA
Generalize
Between Measurement Systems
Unit Rate
Convert
7.1A, 7.1B, 7.1G
7.1A, 7.1B, 7.1F
4 Quadrilateral KLMN is similar to quadrilateral WXYZ.
Which statement about these quadrilaterals must be true?
F KLWX
= WZKN
G Angle NKL is congruent to angle ZWX.
H KLYZ
= LMZW
J Angle NKL is congruent to angle XYZ.
TEKS 7.5A Supporting Standardgeneralize the critical attributes of similarity, including ratios within and between similar shapes
19 The distance between two towns is 120 kilometers. There are approximately 8 kilometers in 5 miles.
Which measurement is closest to the number of miles between these two towns?
A 75 miB 3 miC 192 miD 117 mi
TEKS 7.4E Supporting Standardconvert between measurement systems, including the use of proportions and the use of unit rates
Category 3 7th Grade Math
© 2018 14 7th Grade Mathematics
2018 Released Items
7th Grade Math
ITEM
TEKS
Provided by:
www.StepUpTEKS.com
ITEM
TEKS
Provided by:
www.StepUpTEKS.com
ItemAnalysis
IA
Item Analysis
Using or Including
Concept
Verb
Process TEKS
Item Analysis
Using or Including
Concept
Verb
Process TEKS
Category 3 7th Grade Math
Solve
Similar Shapes
Similarity Problems
π
Ratio
Describe
7.1A, 7.1B, 7.1E, 7.1F
7.1B, 7.1F
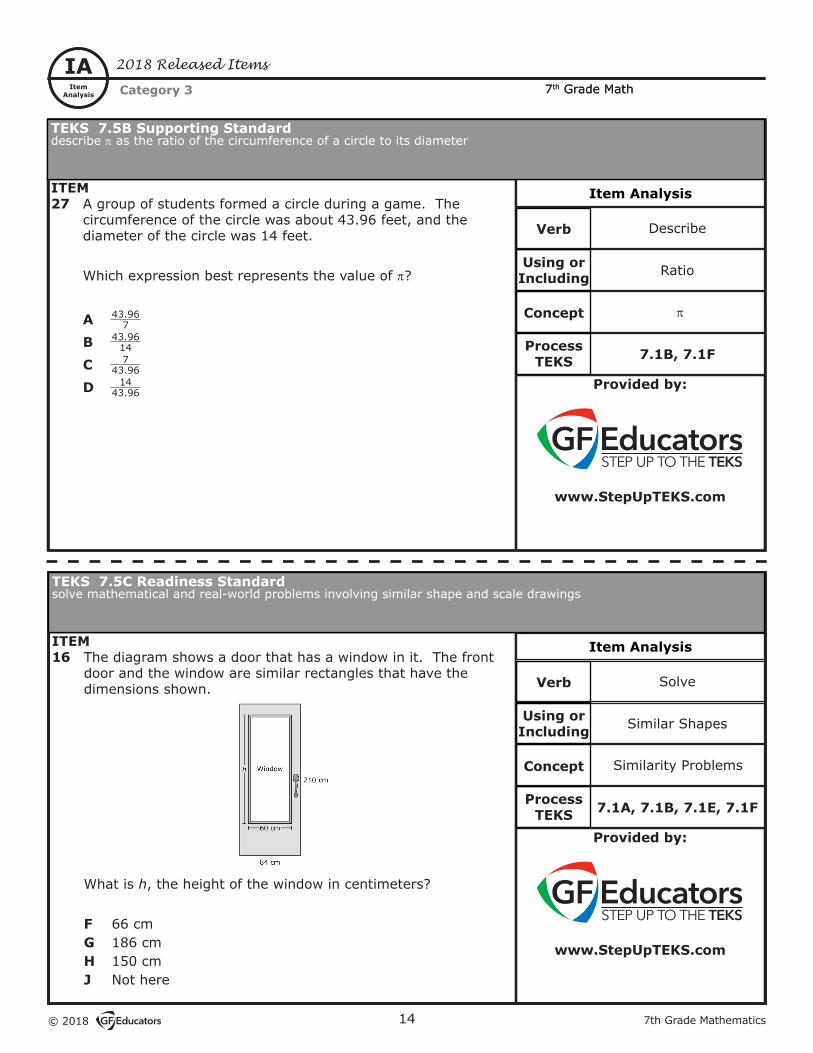
16 The diagram shows a door that has a window in it. The front door and the window are similar rectangles that have the dimensions shown.
What is h, the height of the window in centimeters?
F 66 cmG 186 cmH 150 cmJ Not here
TEKS 7.5C Readiness Standardsolve mathematical and real-world problems involving similar shape and scale drawings
27 A group of students formed a circle during a game. The circumference of the circle was about 43.96 feet, and the diameter of the circle was 14 feet.
Which expression best represents the value of π?
A 43.967
B 43.9614
C 743.96
D 1443.96
TEKS 7.5B Supporting Standarddescribe π as the ratio of the circumference of a circle to its diameter

157th Grade Mathematics © 2018
2018 Released Items
7th Grade Math
ITEM
TEKS
Provided by:
www.StepUpTEKS.com
ItemAnalysis
IA
ITEM
TEKS
Provided by:
www.StepUpTEKS.com
Item Analysis
Using or Including
Concept
Verb
Process TEKS
Item Analysis
Using or Including
Concept
Verb
Process TEKS
Category 3 7th Grade Math
Solve
Volume
Triangular Prisms
Height
Similar Shape
Solve
7.1B, 7.1C, 7.1E, 7.1F
10 The dimensions of a triangular prism are shown in the diagram.
What is the volume of the triangular prism in cubit centimeters?
F 1,360 cm3
G 408 cm3
H 1,632 cm3
J 816 cm3
TEKS 7.9A Readiness Standardsolve problems involving the volume of rectangular prisms, triangular prisms, rectangular pyramids, and triangular pyramids
7.1A, 7.1B, 7.1F
32 An architect built a scale model of a sports stadium using a scale in which 2 inches represents 30 feet. The height of the sports stadium is 180 feet.
What is the height of the scale model in inches?
F 3 in.G 105 in.H 12 in.J 60 in.
TEKS 7.5C Readiness Standardsolve mathematical and real-world problems involving similar shape and scale drawings

© 2018 16 7th Grade Mathematics
ITEM
TEKS
Provided by:
www.StepUpTEKS.com
ITEM
TEKS
Provided by:
www.StepUpTEKS.com
ItemAnalysis
IA
Item Analysis
Using or Including
Concept
Verb
Process TEKS
Item Analysis
Using or Including
Concept
Verb
Process TEKS
2018 Released Items
Category 3 7th Grade Math
Circle
Circumference
Determine
Volume
Square pyramid
Solve
7.1A, 7.1B, 7.1C, 7.1E, 7.1F
7.1B, 7.1C, 7.1E, 7.1F
2 An observatory is shaped like a cylinder standing on one of its baseswithadomeontop.Thediameteroftheflooroftheobservatory is 64 feet, as shown in the diagram.
Which measurement is closest to the circumference of the base of the observatory in feet?
F 209.96 ftG 3,215.36 ftH 100.48 ftJ 401.92 ft
TEKS 7.9B Readiness Standarddetermine the circumference and area of circles
39 Some of the dimensions of a square pyramid are shown in the diagram. The height of the square pyramid is 7.5 meters.
What is the volume of the square pyramid in cubic meters?
A 202.5 m3
B 303.75 m3
C 270 m3
D 243 m3
TEKS 7.9A Readiness Standardsolve problems involving the volume of rectangular prisms, triangular prisms, rectangular pyramids, and triangular pyramids

177th Grade Mathematics © 2018
ITEM
TEKS
Provided by:
www.StepUpTEKS.com
ItemAnalysis
IA
ITEM
TEKS
Provided by:
www.StepUpTEKS.com
Item Analysis
Using or Including
Concept
Verb
Process TEKS
Item Analysis
Using or Including
Concept
Verb
Process TEKS
2018 Released Items
Category 3 7th Grade Math
Area of Composite Figures
Rectangle, Triangle
Determine
Area
Circles
Determine
7.1A, 7.1B, 7.1C, 7.1E, 7.1F
7.1A, 7.1B, 7.1C, 7.1E, 7.1F
14 The top surface of a desk is composed of 2 rectangles and a triangle. Some side lengths of the top surface of the desk are shown.
What is the area of the top surface of the desk in square feet?
F 9.75 ft2
G 8.625 ft2
H 7.50 ft2
J 9.375 ft2
TEKS 7.9C Readiness Standarddeterminetheareaofcompositefigurescontainingcombinationsofrectangles,squares,parallelograms,trapezoids,triangles, semicircles, and quarter circles
23 Acompany’slogowasdesignedusingcirclesof3differentsizes. The diameters of two of the circles are shown.
Which measurement is closest to the area of the largest circle in square centimeters?
A 56.52 cm2
B 141.30 cm2
C 1,017.36 cm2
D 254.34 cm2
TEKS 7.9B Readiness Standarddetermine the circumference and area of circles

© 2018 18 7th Grade Mathematics
2018 Released Items
7th Grade Math
ITEM
TEKS
Provided by:
www.StepUpTEKS.com
ITEM
TEKS
Provided by:
www.StepUpTEKS.com
ItemAnalysis
IA
Item Analysis
Using or Including
Concept
Verb
Process TEKS
Item Analysis
Using or Including
Concept
Verb
Process TEKS
Category 3 7th Grade Math
Equations of Geometric Concepts
Sum of Angles in a Triangle
Solve
Composite Figures
Squares and Circles
Solve
7.1B, 7.1E, 7.1F
7.1A, 7.1B, 7.1C, 7.1E, 7.1F
12 The sum of the measures of angle M and angle R is 90°.
• The measure of angle M is (5x + 10)°• The measure of angle R is 55°.
What is the value of x?
Recordyouranswerandfillinthebubblesonyouranswerdocument. Be sure to use the correct place value.
TEKS 7.11C Supporting Standardwrite and solve equations using geometry concepts, including the sum of the angles in a triangle, and angle relationships
34 Thefigureshownwascreatedbyplacingtheverticesofasquare on the circle. Use the ruler provided to measure the dimensions of the square and the circle to the nearest centimeter.
Which measurements is closest to the area of the shaded regionofthefigureinsquarecentimeters?
F 17.6 cm2
G 265.0 cm2
H 29.5 cm2
J 127.5 cm2
TEKS 7.9C Readiness Standarddeterminetheareaofcompositefigurescontainingcombinationsofrectangles,squares,parallelograms,trapezoids,triangles, semicircles, and quarter circles

197th Grade Mathematics © 2018
2018 Released Items
7th Grade Math
ITEM
TEKS
Provided by:
www.StepUpTEKS.com
ItemAnalysis
IA
ITEM
TEKS
Provided by:
www.StepUpTEKS.com
Item Analysis
Using or Including
Concept
Verb
Process TEKS
Item Analysis
Using or Including
Concept
Verb
Process TEKS
Category 4 7th Grade Math
Data
Bar Graph
Solve
Data
Circle Graph
Solve
7.1A, 7.1B, 7.1E, 7.1G
7.1A, 7.1B, 7.1E, 7.1F
31 The bar graph shows a company’s income and expenses over the last 5 years.
Which statement is supported by the information in the graph?
A Expenses have increased $200,000 each year over the last 5 years.
B The income in Year 5 was twice the income in Year 1.C The combined income in Years 1, 2, and 3 was equal to the
combined expenses in Years 1, 2, and 3.D The combined expenses in Years 3 and 4 were $300,000
more than the combined income in Years 3 and 4.
TEKS 7.6G Readiness Standard solve problems using data represented in bar graphs, dot plots, and circle graphs, including part-to-whole and part-to-part comparisons and equivalents
6 Ursula surveyed 50 classmates about their favorite ice cream flavors.Eachclassmatechoseoneflavor.Theresultsareshown in the circle graph.
How many more of Ursula’s classmates chose chocolate than chose vanilla?
F 8G 6H 34J 16
TEKS 7.6G Readiness Standard solve problems using data represented in bar graphs, dot plots, and circle graphs, including part-to-whole and part-to-part comparisons and equivalents

© 2018 20 7th Grade Mathematics
2018 Released Items
7th Grade Math
ITEM
TEKS
Provided by:
www.StepUpTEKS.com
ItemAnalysis
IA
Item Analysis
Using or Including
Concept
Verb
Process TEKS
Item Analysis
Using or Including
Concept
Verb
Process TEKS
13 The dot plots show the numbers of miles Ian skated on several daysintwodifferentmonths?
Which statement is supported by the information in the dot plot?A The least number of miles Ian skated on a day in July is
greater than the least number of miles Ian skated on a day in August.
B The median number of miles Ian skated each day in July is greater than the median number of miles Ian skated each day in August.
C The mode of the number of miles Ian skated each day in July is less than the mode of the number of miles Ian skated each day in August.
D The range of the number of miles Ian skated each day in July is less than the range of the number of miles Ian skated each day in August.
TEKS
Provided by:
www.StepUpTEKS.com
Category 4 7th Grade Math
Compare
Centers, Spread
Two Groups of Numeric Data
Two Groups of Numeric Data
Centers, Spread
Compare
7.1A, 7.1B, 7.1E, 7.1G
7.1A, 7.1B, 7.1E, 7.1G
36 The box plots show the lengths of the songs on two digital music players in minutes.
Which statement is best supported by the information in the box plots?F The interquartile range of the data for Music Player X is equal to
the interquartile range of the data for Music Player Y.G The interquartile range of the data for Music Player X is greater
than the interquartile range of the data for Music Player Y.H The median length of the songs on Music Player X is equal to the
median length of the songs on Music Player Y.J The median length of the songs on Music Player X is less than the
median length of the songs on Music Player Y.
TEKS 7.12A Readiness Standardcompare two groups of numeric data using comparative dot plots or box plots by comparing their shapes, centers, and spreads
TEKS 7.12A Readiness Standardcompare two groups of numeric data using comparative dot plots or box plots by comparing their shapes, centers, and spreads

217th Grade Mathematics © 2018
2018 Released Items
7th Grade Math
ITEM
TEKS
Provided by:
www.StepUpTEKS.com
ItemAnalysis
IA
ITEM
TEKS
Provided by:
www.StepUpTEKS.com
Item Analysis
Using or Including
Concept
Verb
Process TEKS
Item Analysis
Using or Including
Concept
Verb
Process TEKS
Category 4 7th Grade Math
Sales Tax
NA
Calculate
Sample Populations
Inferences
Use
7.1A, 7.1B, 7.1F
7.1A, 7.1B, 7.1E, 7.1G
22 The price of a DVD is $24.00 plus 8% sales tax. What is the sales tax on this DVD in dollars and cents?
Recordyouranswerandfillinthebubblesonyouranswerdocument. Be sure to use the correct place value.
TEKS 7.13A Supporting Standardcalculate the sales tax for a given purchase and calculate income tax for earned wages
18 The manager of a music store surveyed a random sample of customers who shop in the store about their favorite type of music. The table shows the number of customers who selected each type of music.
Based on the information in the table, which inference about the favorite type of music of all the customers who shop in the music store appears to be valid?
F They are certain to select rock or pop music.G They are less likely to select country or rap music than rock
music.H They are more likely to select country music than jazz,
classical, or rap music.J They are certain to select any type of music other than jazz
music.
TEKS 7.12B Supporting Standarduse data from a random sample to make inferences about a population

© 2018 22 7th Grade Mathematics
2018 Released Items
7th Grade Math
ITEM
TEKS
Provided by:
www.StepUpTEKS.com
ITEM
TEKS
Provided by:
www.StepUpTEKS.com
ItemAnalysis
IA
Item Analysis
Using or Including
Concept
Verb
Process TEKS
Item Analysis
Using or Including
Concept
Verb
Process TEKS
Category 4 7th Grade Math
Net Worth Statement
Financial Assets and Liabilities
Create
7.1A, 7.1B, 7.1E, 7.1F
29 The table shows Peter’s net worth statement. Assets are shown as positive numbers, and liabilities are shown as negative numbers. The value of Peter’s house is not given.
Peter’s net worth is $101,800. Based on the information in the table, what is the current value of Peter’s house?
A $58,600B $78,300C $98,000D $82,100
TEKS 7.13C Supporting Standardcreateandorganizeafinancialassetsandliabilitiesrecordandconstructanetworthstatement

237th Grade Mathematics © 2018
Category 1Probability and Numerical Representations
6 Total QuestionsTEKS Item Correct
AnswerProcess TEKS
7.2A extend previous knowledge of sets and subsets using a visual representation to describe relationships between sets of rational numbers
37 D 7.1B, 7.1E, 7.1F
7.6A represent sample spaces for simple and compound events using lists and tree diagrams
8 H 7.1A, 7.1B, 7.1E, 7.1F
7.6C make predictions and determine solutions using experimental data for simple and compound events
NT
7.6D make predictions and determine solutions using theoretical probability for simple and compound events
NT
7.6Efindtheprobabilitiesofasimpleeventand its complement and describe the relationship between the two
NT
7.6H solve problems using qualitative and quantitative predictions and comparisons from simple experiments
15 D 7.1A, 7.1B, 7.1E, 7.1G
21 C 7.1A, 7.1B, 7.1G
7.6I determine experimental and theoretical probabilities related to simple and compound events using data and sample spaces
3 D 7.1A, 7.1B, 7.1F
25 A 7.1A, 7.1B, 7.1E, 7.1F
Shaded - Readiness TEKS, NT - Not TestedReadiness TEKS - 4/6 questions

© 2018 24 7th Grade Mathematics
Category 2Computations and Algebraic Relationships
15 Total QuestionsTEKS Item Correct
AnswerProcess TEKS
7.3A add, subtract, multiply, and divide rationalnumbersfluently 30 -19.8 7.1B, 7.1F
7.3B apply and extend previous understandings of operations to solve problems using addition, subtraction, multiplication, and division of rational numbers
17 D 7.1A, 7.1B, 7.1F
35 4.99 7.1A, 7.1B, 7.1F
7.4A represent constant rates of change in mathematical and real-world problems given pictorial, tabular, verbal, numeric, graphical, and algebraic representations, including d = rt
5 B 7.1A, 7.1B, 7.1D, 7.1F
40 G 7.1A, 7.1B, 7.1D, 7.1G
7.4B calculate unit rates from rates in mathematical and real-world problems NT
7.4C determine the constant of proportionality (k = y/x) within mathematical and real-world problems
1 D 7.1A, 7.1B, 7.1F
7.4D solve problems involving ratios, rates, and percents, including multi-step problems involving percent increase and percentdecrease,andfinancialliteracyproblems
9 B 7.1A, 7.1B, 7.1F
26 F 7.1A, 7.1B, 7.1F
7.7A represent linear relationships using verbal descriptions, tables, graphs, and equations that simplify to the form y = mx + b
11 D 7.1A, 7.1B, 7.1D, 7.1F
24 H 7.1A, 7.1B, 7.1D, 7.1G
7.10A write one-variable, two-step equations and inequalities to represent constraints or conditions within problems
NT
7.10B represent solutions for one-variable, two-step equations and inequalities on number lines
20 G 7.1B, 7.1E, 7.1F
7.10C write a corresponding real-world problem given a one-variable, two-step equation or inequality
33 B 7.1A, 7.1B, 7.1D, 7.1F
7.11A model and solve one-variable, two-step equations and inequalities
7 B 7.1B, 7.1F
28 J 7.1B, 7.1E, 7.1F7.11B determine if the given value(s)
make(s) one-variable, two-step equations and inequalities true
38 H 7.1B, 7.1F
Shaded - Readiness TEKS, NT - Not TestedReadiness TEKS - 10/15 questions

257th Grade Mathematics © 2018
Category 3Geometry and Measurement
12 Total QuestionsTEKS Item Correct
AnswerProcess TEKS
7.4E convert between measurement systems, including the use of proportions and the use of unit rates
19 C 7.1A, 7.1B, 7.1F
7.5A generalize the critical attributes of similarity, including ratios within and between similar shapes
4 G 7.1A, 7.1B, 7.1G
7.5B describe π as the ratio of the circumference of a circle to its diameter 27 B 7.1B, 7.1F
7.5C solve mathematical and real-world problems involving similar shape and scale drawings
16 H 7.1A, 7.1B, 7.1E, 7.1F
32 H 7.1A, 7.1B, 7.1F7.9A solve problems involving the volume of
rectangular prisms, triangular prisms, rectangular pyramids, and triangular pyramids
10 H 7.1B, 7.1C, 7.1E, 7.1F
39 A 7.1B, 7.1C, 7.1E, 7.1F7.9B determine the circumference and area
of circles2 F 7.1A, 7.1B, 7.1C, 7.1E, 7.1F
23 D 7.1A, 7.1B, 7.1C, 7.1E, 7.1F7.9C determine the area of composite
figurescontainingcombinationsofrectangles, squares, parallelograms, trapezoids, triangles, semicircles, and quarter circles
14 G 7.1A, 7.1B, 7.1C, 7.1E, 7.1F
34 H 7.1A, 7.1B, 7.1C, 7.1E, 7.1F
7.9D solve problems involving the lateral and total surface area of a rectangular prism, rectangular pyramid, triangular prism, and triangular pyramid by determining the area of the shape’s net
NT
7.11C write and solve equations using geometry concepts, including the sum of the angles in a triangle, and angle relationships
12 5 7.1B, 7.1E, 7.1F
Shaded - Readiness TEKS, NT - Not TestedReadiness TEKS - 8/12 questions

© 2018 26 7th Grade Mathematics
Category 4Data Analysis and Personal Finance
7 Total QuestionsTEKS Item Correct
AnswerProcess TEKS
7.6G solve problems using data represented in bar graphs, dot plots, and circle graphs, including part-to-whole and part-to-part comparisons and equivalents
7.12A compare two groups of numeric data using comparative dot plots or box plots by comparing their shapes, centers, and spreads
7.12B use data from a random sample to make inferences about a population
7.12C compare two populations based on data in random samples from these populations, including informal comparative inferences aboutdifferencesbetweenthetwopopulations
7.13A calculate the sales tax for a given purchase and calculate income tax for earned wages
7.13B identify the components of a personal budget, including income; planned savings for college, retirement, and emergencies;taxes;andfixedandvariable expenses, and calculate what percentage each category comprises of the total budget
7.13Ccreateandorganizeafinancialassetsand liabilities record and construct a net worth statement
7.13D use a family budget estimator to determine the minimum household budget and average hourly wage needed for a family to meet its basic needs in the student’s city or another large city nearby
7.13E calculate and compare simple interest and compound interest earnings
7.13F analyze and compare monetary incentives, including sales, rebates, and coupons
Shaded - Readiness TEKS, NT - Not TestedReadiness TEKS - 4/7 questions