Embed Size (px)
Citation preview

Seven steps to increase your profit through
understanding business costs
Andrew Mault ACMA

Introduction
BASIC FINANCIAL REPORTS
COST DYNAMICS
PRICING STRATEGIES
BENCHMARKING & KPI’S
BUDEGTING
COST CONTROL
CREDIT

The Picture

Financial Elements

Profit & Loss Account A summary of business transactions for a given period, and displays the turnover (or revenue) and the costs associated against the turnover figures.
PROFIT = TURNOVER LESS COSTS
It shows managers, directors and investors whether the business made or lost money during the period being reported.
Basic Financial Reports

Balance SheetIs a financial statement of a business at any given point in time and is often described as a “snapshot of a company's financial condition”. It shows what a business owns or is owed (assets) and what it owes (liabilities) as of a specific date such as the end of its financial year (Year End).
Basic Financial Reports

Cashflow StatementIs a financial statement that shows how changes in balance sheet accounts and income, affect cash and cash equivalents. All cash received (inflows) and spent (outflows) by the business will be shown in this statement.
Basic Financial Reports

Ratio analysis provides a starting point for further investigation into the performance of a company.
Profitability Ratio’s
• Profit Margin is an indicator of a company's pricing strategies and how well it controls costs. Differences in competitive strategy and product mix cause the profit margin to vary among different companies. Two types: Gross & Net
• Return On Capital Employed (ROCE) is used to prove the value the business gains from its assets and liabilities, a business which owns lots of land but has little profit will have a smaller ROCE to a business which owns little land but makes the same profit.
Accounting Ratio’s

Costs can be categorized by:
• Nature or element: materials, labour, expenses
• Functions: production, selling, distribution, administration, R&D, development
• As direct and indirect
• Variability: fixed, variable, semi-variable
• Controllability: controllable, uncontrollable
• Normality: normal, abnormal
Dynamics of Cost

• Activity Based Costing
• Lean Accounting
• Margin Accounting
• Standard Costing
• Job Costing Accounting
Costing Techniques

Extract from a company who manufactures Jeans P&L reporting variance to budget……
Actual Budget Variance
Cost of Sales 1014.00 960.00 54.00
But why did the variance occur…….
Standard costing can help with this………
Standard Costing

Standard Actual
Actual Jeans manufactured 160.00 160.00
Standard metres of denim per jean manufactured 2.00 2.44
Total standard yards of denim for the actual good Jean manufactured- the number of yards of denim that should have been used to make the good output 320.00 390.00
Standard cost per metre 3.00 2.60
Standard cost of denim in the good output -the jeans actually produced 960.00 1014.00
Standard Actual Variance Variance £
Direct Material Usage Variance
320.00
390.00 - 70.00 - 210.00 (adverse)
Direct Cost Variance 3.00
2.60 0.40 156.00 (favourable)
- 54.00
Standard Costing

Job Costing
Revenues
Costs
Job P&L
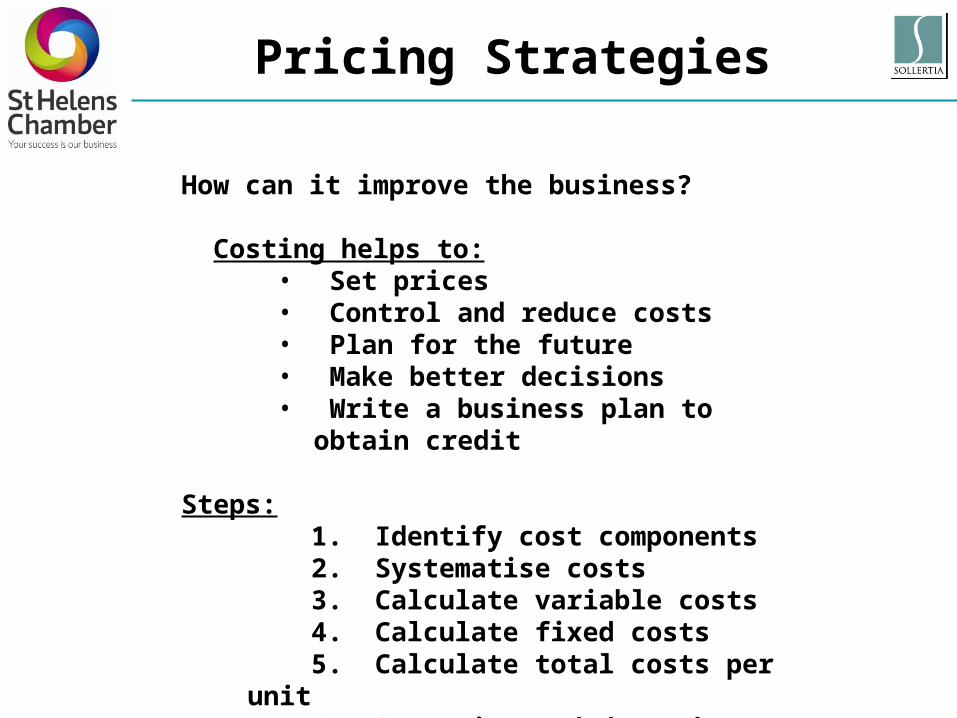
How can it improve the business?
Costing helps to:• Set prices• Control and reduce costs• Plan for the future• Make better decisions• Write a business plan to obtain credit
Steps:
1. Identify cost components 2. Systematise costs 3. Calculate variable costs 4. Calculate fixed costs 5. Calculate total costs per unit 6. Set Prices, deduct the breakeven point
Pricing Strategies

QUALITY
LOW HIGH
Economy Penetration
PremiumSkimming
Pricing Strategy Matrix
LOW
HIGH
PRICE

Breakeven analysis is used to determine how much sales volume your business needs to start making a profit.
The breakeven analysis is especially useful when you're developing a pricing strategy, either as part of a marketing plan or a business plan.
To conduct a breakeven analysis, use this formula:
Fixed Costs divided by (Revenue per unit - Variable costs per unit)
The break-even point (BEP) is the point at which the cost of producing a product or providing a service exactly matches the revenue gained from selling that product or service. For example, if a firm’s total annual costs are £1m and in the same year it generates £1m of revenue, then the firm is said to have broken-even, as it hasn’t made any more or less than it has invested.
Break Even Calculation

Fixed costs (Pink horizontal line) do not vary with output - they are the costs of running the business.
Revenue (Blue line starting from zero) shows the total sales at a given price and volume.
Variable Costs (Yellow line starting from zero) are directly related to volume and increase or decrease as production and sales increase or decrease.
Total Costs (Green line starting on top of fixed costs) are fixed and variable costs added together.
The BEP (Break-Even Point) is the point at which the revenue and total cost lines cross.
Break Even Point

A designer / photographic mug costs £10 to buy.
The variable costs are £6 per mug which makes the contribution [price less variable costs] to fixed costs £4 per unit.
The total fixed costs are £1,200.
The BEP is calculated as follows:
Fixed costs / contribution per unit = BEP
1,200 / 4 (10-6) = 300 units
Or in terms of value
BEP in units x price per unit = BEP value
300 x £10 = £30,000
Break Even Exercise

Benchmarking is the process of comparing one's business processes and performance metrics to industry bests and/or best practices from other industries. Dimensions typically measured are quality, time, and cost. Improvements from learning mean doing things better, faster, and cheaper.
Benchmarking
Information is available to benchmark your business performance against that of other business in your same market or sector.
Useful websites:
Companies House www.companieshouse.gov.ukRisk Disk www.riskdisk.comDun and Bradstreet www.dnb.co.ukExperian www.experian.co.uk
Alternatively, contact St Helens Chamber as UK limited company reports available through the Business Information Team as part of membership.
Internal Benchmarking - comparing departments, sales reps etc.
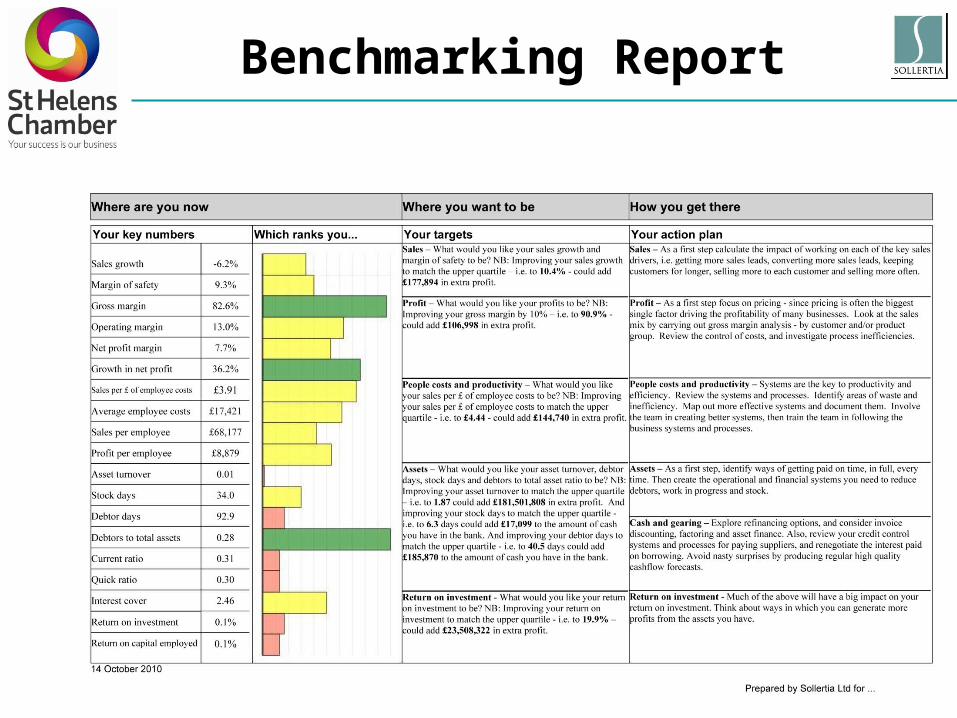
Benchmarking Report

KPI’s are measures by which the performances of organizations, business units, and their division, departments and employees are periodically assessed.
The principles of SMARTA (Specific, Measurable, Agreed to, Realistic, Timely and Aligned) must underpin the KPI's.
The measurement must make a difference• Employees must have a significant degree of control over achievement of the KPI.• They need to provide positive reinforcement for desired behaviour. • There needs to be alignment between individual and organisational KPI's.
Types of KPI’s• financial and non-financial measures • short-term and long-term indicators • performance drivers (future-oriented) and outcomes (past-oriented) • quantitative and qualitative measures • 'lead' and 'lag' indicators
Examples include: Creditor days, Debtors days, Gearing, Fixed Costs, Variable Costs, Invoice Processing Costs, Profit Per Product, Profit Per Project / Job
Key Performance Indicators

Range of indicators to include …
• Financial measures – including profitability, return on investment, revenue growth and mix, cost control, productivity, asset use, investment strategy
• Customer perceptions – market share, customer acquisition and retention, customer satisfaction
• Internal business processes - such as customer service, innovation, operational efficiency, quality, cycles, resource consumption
• Innovation & learning – measures that allow the organisation to develop, change, improve, respond to changing circumstances, and remain sustainable. The main categories are employee capabilities/skills, retention, productivity, information systems capability, knowledge management, employee empowerment, motivation and values alignment
How many KPI's?
Key Performance Indicators
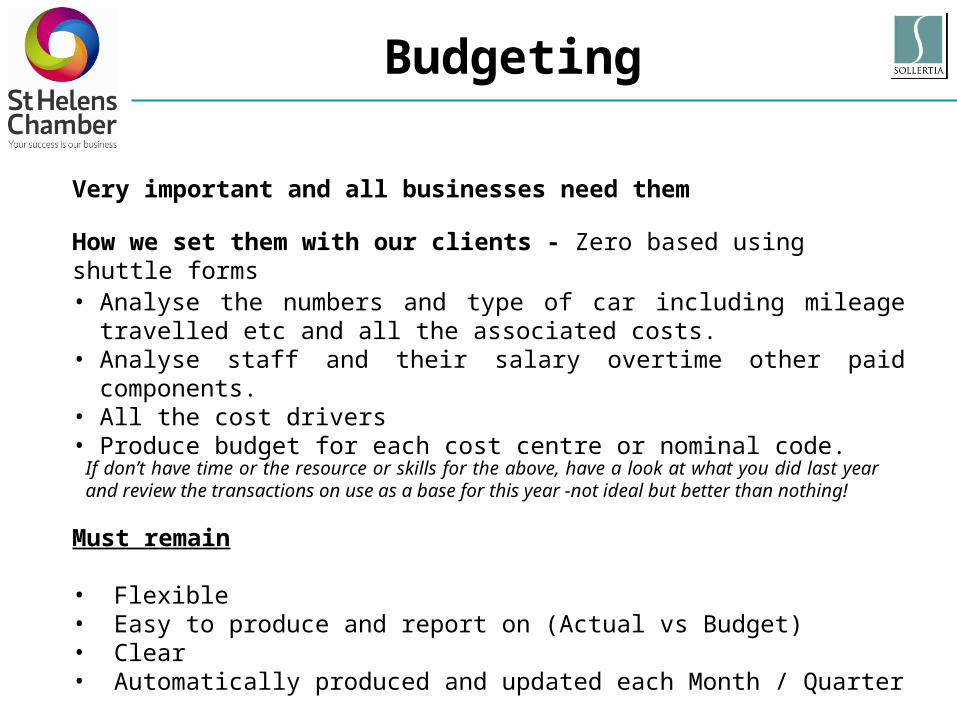
Very important and all businesses need them
How we set them with our clients - Zero based using shuttle forms
• Analyse the numbers and type of car including mileage travelled etc and all the associated costs.
• Analyse staff and their salary overtime other paid components.• All the cost drivers• Produce budget for each cost centre or nominal code.
If don’t have time or the resource or skills for the above, have a look at what you did last year and review the transactions on use as a base for this year -not ideal but better than nothing!
Must remain
• Flexible• Easy to produce and report on (Actual vs Budget)• Clear• Automatically produced and updated each Month / Quarter
Budgeting

Budgeting

• Your costs • Identify your major cost centres.• Identify the major types of cost within each cost centre. • Choose the costs to focus on first.
• Systematic cost control • Start from your business objectives. • Establish your ‘standard costs’ for achieving your objectives. • Establish realistic ‘budgeted costs’ based on your actual experience.• Record your actual costs and compare them with the standard and budgeted costs.• Periodically review what you are doing and how you are doing it.
• Who is involved?• Each cost centre is usually the responsibility of one manager.• Involve employees in cost control.• Include your customers and suppliers.• External consultants.
Cost Control

• Easy savings• Checking supplier invoices may reveal overcharging.• Eliminate unnecessary costs.• Crack down on excessive costs.• Root out inefficiency.
• Opportunities• Reduce your payroll costs.• Improve your purchasing. • Find ways to make production more efficient. • Review your finances.• Get the most out of your premises.• Cut the cost of communications.
• PitfallsReducing costs which directly impact on employees is fraught with difficulty.Almost every cost saving has a potential downside.
• ConsultantsExternal consultants can offer an advantage over purely internal cost control.Select a consultant carefully. Negotiate a clear, written contract.
Cost Control

1. Consumableswww.cartridgeworld.co.uk/business-direct
www.inkcycle.co.uk
2. Energy Efficiencywww.Uswitchforbusiness.com
www.comparethemarket.com/business-energy
www.sthelenschamber.com/extranet/membership_services/chamber_utilities
3. Postage
4. Quotations
5. Networkingwww.bni.eu/chapter.php?chapter=544
www.freshnetworking.co.uk
www.sthelenschamber.com/events/2010/11/l/Networking
10 Simple Cost Cuts

6. Direct Debits
7. Paperless Businesswww.greengrantsmachine.co.uk www.freefaxtoemail.net
www.efax.com
8. Telecommunicationswww.skype.com www.business.bt.com
www.voiptalk.org www.voipcheap.co.uk
9. Brand Visibilitywww.facebook.com www.twitter.com
www.youtube.com www.linkedin.com
www.qype.co.uk www.yelp.com
www.google.com/maps
10. Credit Checks & Control
10 Simple Cost Cuts

Optimising cash flow and reducing bad debts are two key objectives of any successful business.
Setting up a good credit control system is a starting point for both:
• Improve Cash flow
• Reduce bad debts
• Increase profits
• Build customer loyalty
• Build financial confidence
• Increase sales
Credit Account Application Form
www.sthelenschamber.com/extranet/guidance_documents
Effective Credit Control

• Understand• Analyse• Listen to your business• Focus on key areas of cost• Take Advice• Watch for signs• Plan• Budget• Forecast• Reduce Costs• Increase Profits!
Summary