Embed Size (px)
Citation preview

Deborah J. del Junco, Erin E. Fox, Elizabeth A. Camp, Charles E. Wade, M. Hossein Rahbar, John B. Holcomb & the PROMMTT Study Group
1
Seven Deadly Sins:Bias in Trauma Outcomes and
Comparative Effectiveness Research

The Original 7 Deadly Sins1. Lust
2. Gluttony
3. Sloth
4. Envy
5. Pride
6. Greed
7. Wrath
Our work has been supported in part by the US Army Medical Research and Materiel Command subcontract W81XWH-08-C-0712, NIH CTSA grant UL1RR024148, NIH/NHLBI grant U01HL077863, the U.S. Department of Defense Research and Development Canada and CIHR CRR-120612
Specific Aims1. Help explain conflicting trauma research
findings (beyond chance) acrossobservational studies and randomized clinical trials (RCTs)
2. Improve the validity & reproducibility of trauma outcomes and comparative effectiveness research (CER)

7 Deadly Sins in Trauma Outcomes Research1
Overlooking or ignoring sources of bias:1. Indications for treatment
2. Collider Bias
3. Survivorship bias
4. Time‐varying, dynamic treatment regimes
5. Time‐dependent confounding
6. Non‐uniform effects over time
7. Non‐random, non‐ignorable missing values

1. Indication BiasDefinition:In an observational CER study of interventions A & B, patients receiving intervention A ≠ patients receiving the alternate intervention B. Unlike in a randomized trial, the eligibility criteria and indications for interventions A & B may differ substantially.

1. Indication Bias continued2
Example:Plasma early vs. later in resuscitating bleeding trauma patients?• Trauma patients are extremely heterogeneous
in injury and bleeding severity and in their need for life-saving resuscitation interventions.
• Patients who needed plasma early but died before it could be administered get counted in the same later group as those who actually got plasma later and those who never got or needed any plasma at all.

1. Indication Bias continued3
Resolution:1. Capture data on as many important pre-
intervention baseline covariates as possible.
2. Use stratification, propensity score matching2
or modeling (e.g., regression) to appropriately adjust for the pre-intervention baseline covariates.
2. Collider Bias
Definition:Prevalent in trauma research, collider bias results from subgrouping or adjusting analyses by a covariate that is a consequence (collider) rather than a cause (confounder) of both the treatment and outcome.

2. Collider Bias continued2
Example:Randomized trials of prehospitalhypertonic saline vs. standard-of-care resuscitation fluids subgrouped patient data by a well-known surrogate for bleeding severity: >10 PRBC units/24hrs or “massive transfusion”, MT

2. Collider Bias continued3
Resolution:1. Early in the design phase, thoroughly evaluate
covariates, especially surrogates, with causal diagrams (Directed Acyclic Graphs or DAGs).7
2. Replace colliders with valid pre-intervention (or pre-randomization) baseline covariates and conduct the most rigorous subgroup or adjusted analyses possible.
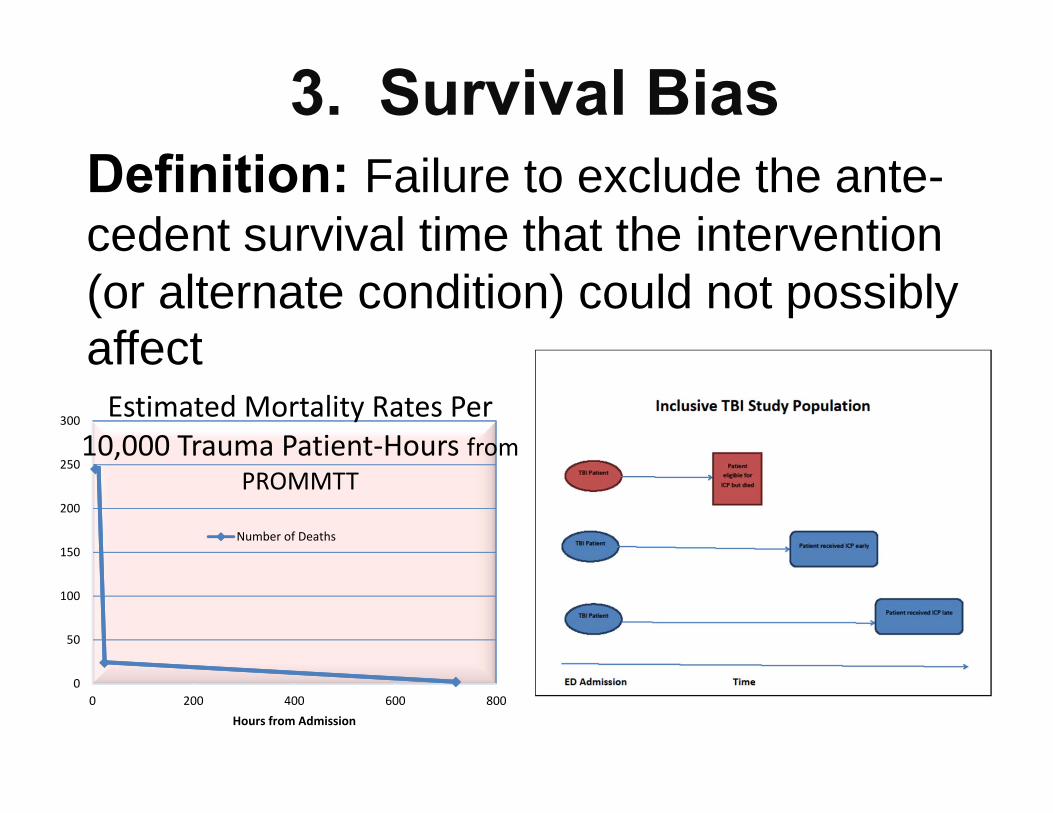
3. Survival BiasDefinition: Failure to exclude the ante-cedent survival time that the intervention (or alternate condition) could not possibly affect
0
50
100
150
200
250
300
0 200 400 600 800Hours from Admission
Estimated Mortality Rates Per 10,000 Trauma Patient‐Hours from
PROMMTT
Number of Deaths

3. Survival Bias continued2Example:For bleeding trauma patients, does a 1:1:1 balanced transfusion ratio of plasma:platelets:PRBC over the first 24 hours save more lives than an unbalanced ratio < 1:1:2The longer a bleeding trauma patient survives, the more likely s/he will eventually receive units of plasma and platelets to balance a rapid sequence of PRBC units transfused. But many bleeding trauma patients die before having the chance to receive anything but PRBCs.

3. Survival Bias continued3
Resolution:1. Use time-dependent covariate analysis
(e.g., Cox proportional hazards regression modeling)3
2. Use logistic regression with appropriate time intervals conditioned on survival4

4. Time Varying Treatment
Definition:Interventions are often dynamic regimens that may dramatically fluctuate in both complexity and intensity (e.g., dose) over time. A single cumulative summary or mid-point average can be misleading for patients in different phases.
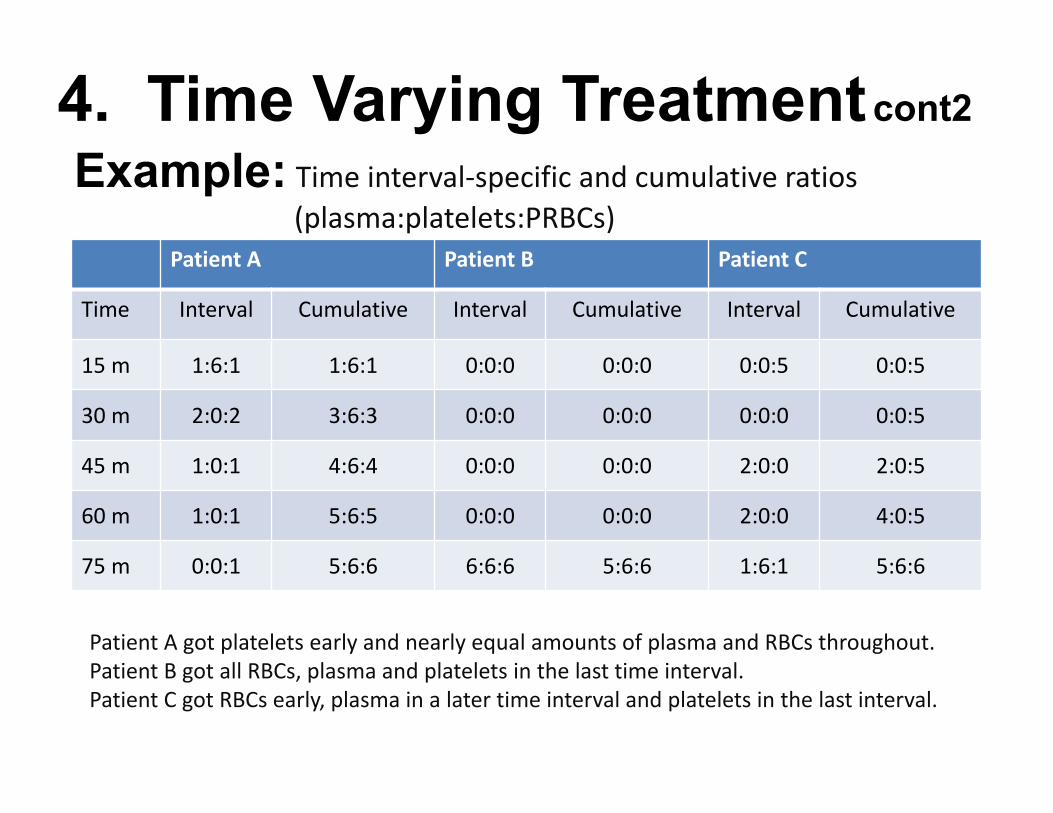
Example: Time interval‐specific and cumulative ratios (plasma:platelets:PRBCs)
Patient A Patient B Patient C
Time Interval Cumulative Interval Cumulative Interval Cumulative
15 m 1:6:1 1:6:1 0:0:0 0:0:0 0:0:5 0:0:5
30 m 2:0:2 3:6:3 0:0:0 0:0:0 0:0:0 0:0:5
45 m 1:0:1 4:6:4 0:0:0 0:0:0 2:0:0 2:0:5
60 m 1:0:1 5:6:5 0:0:0 0:0:0 2:0:0 4:0:5
75 m 0:0:1 5:6:6 6:6:6 5:6:6 1:6:1 5:6:6
Patient A got platelets early and nearly equal amounts of plasma and RBCs throughout.Patient B got all RBCs, plasma and platelets in the last time interval.Patient C got RBCs early, plasma in a later time interval and platelets in the last interval.
4. Time Varying Treatmentcont2

Resolution:1. Accurately and completely capture the
timing and characteristics of dynamic and complex interventions with meaningful granularity over a broad range.
2. Capture data on the short, intermediate and long-term outcomes.
3. Use time-dependent covariate analysis if appropriate
4. Time Varying Treatment cont3

5. Time-dependent Confounding
Definition and Example:In a dynamic treatment regimen (e.g., blood product transfusion), when a covariate (platelet transfusion) predicts future treatment (plasma transfusion) and outcome (survival) and is itself predicted by past treatment (plasma), time-dependent covariate adjustment can fail to produce unbiased estimates of the treatment (plasma) effect.

Resolution:1. Marginal structural models using inverse
probability of treatment weighting offers a more complex but potentially more valid approach.5
2. Stratification by treatment sequence within defined time windows is another approach if sample size allows.4
5. Time-dependent Confounding continued2

6. Non-uniform Intervention Effects Over Time continued2
PROMMTT3 provided a striking example. Primary causes of death, mortality rates and RRs changed over time.
Time interval after ED admission
Deaths(cause)
Hours at Risk
Mortality Rate(RR of
association)Within 6 hours 88
(hemorrhage) 3,5900.0245
(1:1:2>1:1:1)
From >6 hours to 24 hours
34(head injury) 14,039
0.0024(1:1:2=1:1:1)
From >24 hours to 30 days
84(complication) 491,618
0.0002(1:1:2=1:1:1)

6. Non-uniform Effects Over Time continued2
Resolution:1. Stratification by time periods should be routinely
examined to identify potentially differential short, intermediate and long-term effects.
2. Data analysis should include standard statistical tests for homogeneity of effects across strata or appropriate modeling with the inclusion of treatment by time interaction terms.

7. Non-random Missing Values
Definition:Missing values in trauma research data imply 1 of 3 underlying mechanisms (best case to worst): missing completely at random (MCAR), missing at random (MAR), and missing not at random (MNAR).

Missing Completely at Random (MCAR) isassumed in Complete Case Analysis (CCA), which excludes patients with missing values.
Missing at Random (MAR) is assumed inanalyses using multiple imputation.
Missing Not at Random (MNAR) cannot berefuted or confirmed; it can only be explored in sensitivity analyses with hypothetical scenarios.
7. Non-random missing values continued2

7. Non-random Missing Values continued3
Example: Trauma data are notorious for
missing covariate values. Patients at the two opposite extremes
of severity are the most likely to have missing data raising concern for the standard approach, CCA, that assumes MCAR as well as for multiple imputation that assumes MAR.6
7. Non-random Missing Values continued4
Resolution:1. Consider multiple imputation with
the less restrictive MAR assumptions and compare results with CCA.
2. Seek expert advice to explore various worst-case scenarios with sensitivity analysis, the only MNAR option.

Conclusions
MT
Multi‐disciplinary Trauma Research Teams
can rid trauma research of the 7 deadly sins

References:1. del Junco DJ, Fox EE, Camp EA, Rahbar MH, Holcomb JB. Seven deadly sins in
trauma outcomes research: An epidemiologic post-mortem for major causes of bias. J Trauma Acute Care Surg. 2013;74:S97-S103.
2. Newgard CD, Hedges JR, Arthur M, Mullins RJ. Advanced statistics: The propensity score – a method for estimating treatment effect in observational research. Acad Emerg Med. 2004;11:953-961.
3. Holcomb JB, del Junco DJ, Fox EE, Wade CE, Cohen MJ, Schreiber MA, Alarcon LH, Bai Y, Brasel KJ, Bulger EM et al. The PRospective Observational Trauma Transfusion Study: Comparative effectiveness of a time-varying treatment with competing risks. JAMA Surg. 2013;148:127-136.
4. del Junco DJ, Holcomb JB, Fox EE Brasel KJ, Phelan HA, Bulger EM, Schreiber MA, Muskat P, Alarcon LH, Cohen MJ, Cotton BA, Wade CE, Myers JG, RahbarMH. Resuscitate early with plasma and platelets or balance blood products gradually: Findings from the PROMMTT study. J Trauma Acute Care Surg. 2013;75:S24-S30.
5. Pirracchio R, Sprung CL, Payen D, Chevret S. Utility of time-dependent inverse-probability-of-treatment weights to analyze observational cohorts in the intensive care unit. J Clin Epidemiol. 2011;64:1373-1382.
6. Glance LG, Osler TM, Mukamel DB, Meredith W, Dick AW. Impact of statistical approaches for handling missing data on trauma center quality. Ann Surg. 2009;249:143-148.
7. Sauer B, VanderWeele TJ. Use of directed acyclic graphs. In: Velentgas P, Dyer NA, Nourjah P et al, eds. Developing a Protocol for Observational Comparative Effectiveness Research: A User’s Guide. Rockville, MD: Agency for Healthcare Research and Quality; 2013:177-184.