Embed Size (px)
Citation preview

Research Report
356
SETTLEMENT OF HIGHWAY BRIDGE APPROACHES
AND EMBANKMENT FOUNDATIONS
by
Tommy C. Hopkins
Research Engineer Senior
February 1973


Research Report 356
SETTLEMENT OF IDGHWAY BRIDGE APPROACHES AND EMBANKMENT FOUNDATIONS
BLUEGRASS PARKWAY BRIDGES OVER CHAPLIN RIVER
INTERIM REPORT KYHP R-64-17; HPR- 1(8), Part II
by
Tommy C. Hopkins Research Engineer Senior
Division of Research DEPARTMENT OF HIGHWAYS
Commonwealth of Kentucky
in cooperation with the U.S. Department of Transportation
Federal Highway Administration
The contents of this report reflect the views of
the author who Is responsible for the facts and
the accuracy of the data presented herein. The
contents do not necessarily reflect the official
views or policies of the Department of Highways
or the Federal Highway Administration. This
report does not constitute a standard,
specification, or regulation.
February 1973


TECHNICAL REPORT STANDARD TITLE PAGE
I. Report No. 2. Government Accession No. 3. Recipient's Catalog No.
4. Title and Subtitle 5. Report Date
Settlement of Highway Bridge Approaches and Embankment February 1973 Foundations, 6. Performing Organization Code
Bluegrass Parkway Bridges over Chaplin River. 7. Author! s) 8. Performing Organization Report No.
Tommy C. Hopkins 356
9. Performing Organization Nome and Address 10. Work Unit No.
Division of Research Kentucky Department of Highways 11 . Contract or Grant No.
533 South Limestone KYHPR- 64-17 Lexington, Kentucky 40508 13. Type of Report and Period Covered f.--
Sponsoring Agency Name and Address 12. DllO Interim
14. Sponsoring Agency Code
15. Supplementary Notes
Prepared in cooperation with the US Department of Transportation, Federal Highway Administration
Study Title: Settlement of Bridge Approaches and Embankments 16. Abstract
The report examines the cause of a differential settlement between the highway approach embankments and bridge decks and abutment tilting at a bridge site located on the Bluegrass Parkway in Kentucky. The site contains several design, construction and maintenance features and soil types that are typical of many bridge sites in Kentucky. The approach embankments are side-hill fills. The approach pavements have settled several inches and have been patched on numerous occasions. Each of the four abutments give the appearance of having tilted backward toward the backfill. However, closer examination shows that the abutments have moved laterally toward the bridge ends and are bearing against the steel girder spans. Slope inclinometer readings obtained at each approach embankment over a two-year period shows that the· approach fills have moved toward the bridge ends some three inches. The front portion of the western fill failed in 1969, some four years after construction, and exposed several feet of piling. Shear strength of the embankment and foundation soils were established fro,m consolidated isotropic, undrained triaxial tests with pore pressure measurements and consolidated drained, direct shear tests. Slope stability analyses were performed using a computerized solution of Bishop's simplified method of slices. Study results show that the approaches settled as a result of embankment instability due to progressive failure. Based on peak shearing strength of the soils, the long-term safety factors of the approach embankments ranged from 0.96 to 1.03. Based on residual strength, the long-term safety factors were about 0.70. Consequently, the western embankment failed apparently as a result of a (time-conditioned) gradual decrease of the shear strength of the soils. Slope indicator data indicate that progressive failure is spreading; movement of the embankments is continuing. Stability of the approach fills, abutments and piles is precarious. Several re�edial solutions are described.
17. Key Words 18. Distribution Statement
Differential Settlement, Bridge Approach Pavements, Slope Stability, Peak and Residual Shear Strengths
19. Security Classif. (of this report) 20. Security Classif. {of this page) 21· No. of Pages 22. Price
Unclassified Unclassified
Form DOT F 1700.7 ts-•9l


CHARLES PRYOR, JR.
COMMISSIONER OF HIGHWAYS
COMMONWEALTI:I OF KENTUCKY
DEPARTMENT OF HIGHWAYS
FRANKFORT, KENTUCKY 40601
February 20, 1973
MEMORANDUM TO: J. R. Harbison
State Highway Engineer
Chairman, Research Connnittee
ADDRESS R.EI'LY TO: DEPARTMENT OF HIGHWAYS
DIVISION OF RESEI?IRCH
533 SOUTH LIMESTONE STREET
LEXINGTON, KENTUCKY 40508 TELEPHONE 606·254-4475
H.3.17
SUBJECT: Chaplin River Bridges, Bluegrass Parkway; Interim Report on Study
KYHPR-64- 17; HPR- 1(8), Part II
In connection with the referenced study of settlement of embankments at bridges (i.e. The Bump
at the End of the Bridge), we have made an in-depth study of the situation at the Chaplin River bridges
on the Bluegrass Parkway. Our interest in this site goes back a few years.·· at least to the time when
the abutments closed against the span and the piles under the west abutment became exposed.
Unfortunately, in some respects perhaps, we made some false starts in the beginning in attempting to
resolve expedient solutions to the problem. However, as time passed the symptoms become more fully
revealed.
Now, having the advantage of well-slope histories and soil parameters, we find that the west
embankment has developed into a landslide or fill-slip situation, which extends about 50 feet into the
roadway on the west end. To complicate the matter further, recent well-slope measurements indicate
that the movement into the bridge is accelerating. Failure of the west abutments seems imminent.
Whereas the planned Campground Reservoir was previously expected to submerge these bridges,
I have been advised by Mr. Blankenship that current plans set the high-water elevation at 664 feet,
which is 4 feet below the lowest point in the deck. The girders, of course, would be in water at times
unless the bridge( s) are raised.
Several alternatives have been explored. Only one has been analyzed thoroughly from the standpoint
of structural stability. It is the one discussed in the attached report. The berm configuration presented
there (Figure 34) represents the maximum ftlling that seems possible. Structurally, it does not provide
a safety factor which would assure a high degree of certainty or success. It would, therefore, be an
expedient measure. The hydraulics of the resulting channel have not been analyzed; this would have
to be done. The present channel velocity is in the order of 10 feet per second.
A retaining wall at the to� of each embankment should not be dismissed if the risks of excavating
can be surmounted.
We have sketched a conceptual alternative involving low-water culverts and an underflow dam under
the bridges to buttress the approach embankments on both sides of the channel. Overflow would be
critical from the standpoint of erosion, and slope protection would be essential throughout. This scheme


would not interfere with traffic ·· but neither would the berm as proposed in the report.
A lightweight backfill, involving excavation of the west embankment and refilling with lightweight
material is also discussed in the report. This scheme could work in conjunction with the berm to attain
a higher factor of safety. Of course, it would interfere with traffic.
Other alternatives might include the addition of one or more spans to the bridges at each end.
We have not determined whether piers are plumb or not.
Having realized the criticality of the problem very recently, we have expedited our report and
submitted advance draft copies for early consideration to W. B. Drake, J. R. Spurrier, A. R. Romine,
and A. B. Blankenship on February I, 1973.
JHH:dw
Attachment
cc's: Research Committee


INTRODUCTION
Differential settlement between highway pavements and bridge decks, Figure I, not only presents a hazardous condition to rapidly flowing traffic but creates a rough uncomfortable ride. Additionally, these roadway surface faults require costly maintenance which usually involves mudjacking and(or) patching the approach pavement. Where heavy traffic movements exist, such maintenance operations tend to impede normal flow. Moreover, settlement of bridge approaches adversely affects durability of the road and structure. Previous studies (1. 2, 3, 4, 5) revealed that, statistically, 80 percent of bridge approach pavements constructed during the past decade in Kentucky eventually settled to such a degree that maintenance was required. Studies ( 6. 7) and inquiries by others have shown that the approach settlement problem is not necessarily confined to Kentucky; but rather, it occurs in many areas of the world.
The earlier studies showed that approach foundation settlement can be an important factor leading to development of faulted bridge approaches and emphasized the need to conduct settlement investigations at sites of proposed bridge construction projects to provide a basis for design to control or minbnize the effect of approach settlement. Settlement of the approach embankment was recognized as a contributor to the settlement of bridge approaches, although the cause -- whether due to a volume change or some form of instability, such as creep or progressive failure �� was not recognized.
Figure 1. IUustration of Differential Settlement at
Bridges.
Figure 2. Tilted Bridge Abutment.
Results of informal observations made in 1969 at several bridge sites where the abutments were supported on piles strongly indicated that approach settlement was due to embankment instability. Abutments at these sites gave the appearance, as illustrated in Figure 2, of having tilted backward toward the backfill. However, closer examination revealed that the 4-inch spaces initially existing between the faces of the abutments and the bridge girder spans and the 2-inch spaces of the bridge expansion dams were, in many instances, closed or nearly closed. Consequently, the abutments had moved laterally toward the bridge and rotated about a horizontal axis. Movements of the type shown in Figure 2 are closely associated with the approach settlement problem. As the abutment moves toward the bridge, there is a tendency for the backfill to move laterally and vertically downward. In every case where such abutment movements have been observed, the approach pavements had settled excessively and required extensive maintenance. Furthermore, in many cases, additional and costly maintenance has been required to reset bridge rockers and replace bridge expansion dams. Possible structural damage, such as deck cracking, of the bridges at these sites after the abutments have borne against the bridge girder spans has not been assessed.
Terzaghi and Peck (8) in 1948 noted that an abutment located on a spread footing and underlain by a compressible layer will become inclined towards the central and deeper part of the settlement crater. In a study of seven underpass bridge structures, Stermac, Devata and Selby (9) attributed the unusual abutment movements to foundation settlement. They also noted that patching the approach pavements only contributes to the process of tilting and subsidence. However, in
a study of a bridge site iu New Jersey where earth pr.essure cells and strain meters were attached to the abutments and top portion of the piles, respectively, Tscebotarioff ( 10) concluded that the settlement concept as the governing factor leadiug to the development of abutment tilting was iuadequate.
Measurements obtained at that site ( 11) showed that lateral pressures actiug agaiust the abutment decreased with time while the lateral pressures actiug agaiust the vertical H-piles under the heel of the abutment iucreased. These measurements suggested that embankment instability may be a likely cause of abutment tiltiug and approach settlement. Tscebotarioff concluded that sheariug deformations in an embankment foundation are a factor causing abutment tiltiug.
There is other evidence that embankment iustability is an important factor causing approach settlement. Bishop (cf. 12) concluded that local overstress can occur in certain areas of the slope when the safety factor, determiued by a slip circle method, is below a value of 1.8. Long-term safety factors of the majority of existiug approach embankment slopes are unlikely to have safety factors above this value. The majority of earth structures are designed for safety factors less than 1.8. Consequently, a state of plastic equilibrium must be considered to exist in a portion of the slope (12 ). Such a condition probably initiates embankment creep and may, in some cases, lead to failure.
PROJECT DESCRIPTION
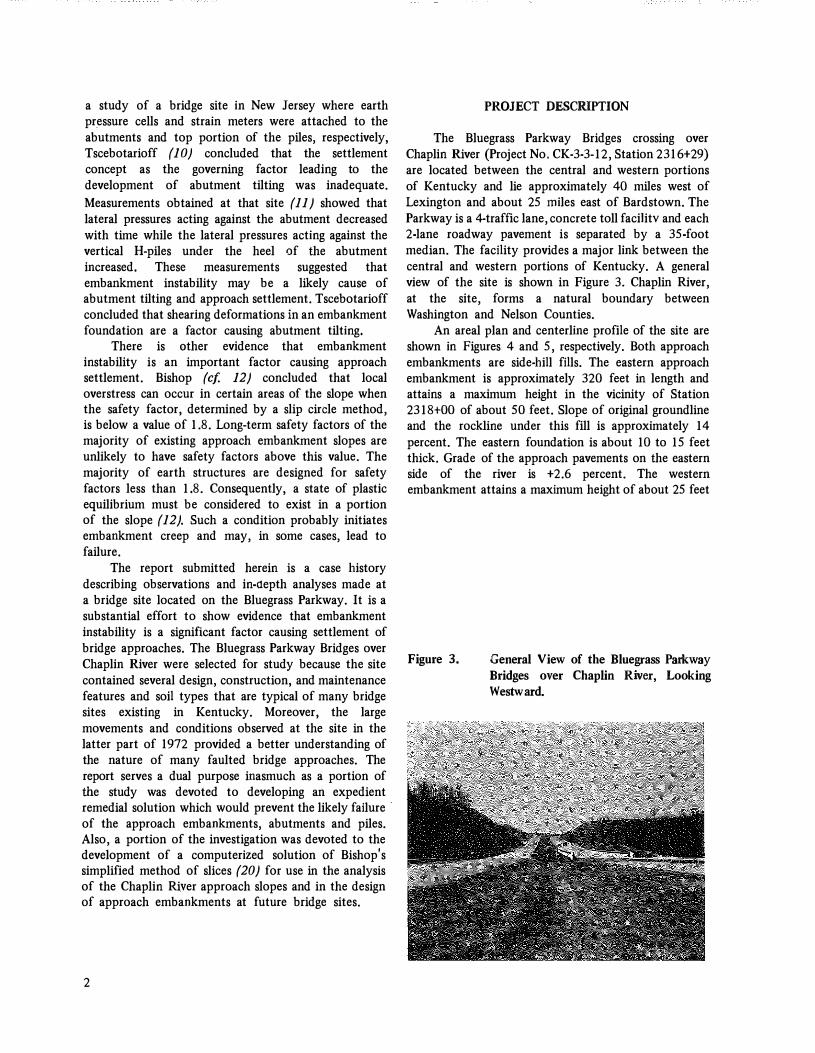
The Bluegrass Parkway Bridges crossing over Chapliu River (Project No. CK-3-3- 12, Station 23 16+29) are located between the central and western portions of Kentucky and lie approximately 40 miles west of Lexington and about 25 miles east of Bardstown. The Parkway is a 4-traffic lane, concrete toll facilitv and each 2-lane roadway pavement is separated by a 35-foot median. The facility provides a major liuk between the central and western portions of Kentucky. A general view of the site is shown in Figure 3. Chaplin River, at the site, forms a natural boundary between Washiugton and Nelson Counties.
An areal plan and centerliue profile of the site are shown iu Figures 4 and 5, respectively. Both approach embankments are side-hill fills. The eastern approach embankment is approximately 320 feet iu length and attaius a maximum height in the vicinity of Station 23 18+00 of about 50 feet. Slope of original groundline and the rockliue under this fill is approximately 14 percent. The eastern foundation is about 10 to 15 feet thick. Grade of the approach pavements on the eastern side of the river is +2.6 percent. The western embankment attaius a maximum height of about 25 feet
The report submitted hereiu is a case history describiug observations and iu-depth analyses made at a bridge site located on the Bluegrass Parkway. It is a substantial effort to show evidence that embankment iustability is a significant factor causing settlement of bridge approaches. The Bluegrass Parkway Bridges over Chapliu River were selected for study because the site Figure 3. General View of the l!luegrass Parkway
Bridges over Chapliu River, Lookiug Westward.
contained several design, construction, and maintenance features and soil types that are typical of many bridge sites existiug in Kentucky. Moreover, the large movements and conditions observed at the site in the latter part of 1972 provided a better understanding of the nature of many faulted bridge approaches. The report serves a dual purpose inasmuch as a portion of the study was devoted to developing an expedient remedial solution which would prevent the likely failure of the approach embankments, abutments and piles. Also, a portion of the investigation was devoted to the development of a computerized solution of Bishop's simplified method of slices (20) for use in the analysis of the Chapliu River approach slopes and in the design of approach embankments at future bridge sites.
2

610 PIERS
soo���---596 ------�--��--�---
59s CHAPLIN RIVER
soc
CRACK IN
"'Q "' ,.,_o
"'
Figure 4.
'l:JQ "'
---670
------680
0 SAMPLE BORING
0 SLOPE INDICATOR
BG P over CHAPLIN RIVER
WASHINGTON COUNTY
SCALE I" = 50'
Areal Plan of the Bluegrass Parkway Bridges over Chaplin River.
3

....
_lQQ 1-1&1 .HQ. "' IL
_§§9. z S?MQ. 1-<( > _§ZQ. Ul ...J "' JillQ.
WESTERN APPROACH
I 2314
HOLE 2 SLOPE INDICATOR
1 HOLE 6
I 2315
j, UNDISTURBED SHELBY T TUBE SAMPLES
2315+64Q..Q
Figure 5.
CHAPLIN RIVER
--------------·
I 2316
PIER
2316+94QQ
I I 2317
STATION NUMBER
Centerline Profile Section of the Chaplio River Site.
EASTERN APPROACH
SLOPE INDICATOR HOLE 7 HOLE 3 HOLE 4
I 2318
,_, ,_, ,_,
I 2319
1QQ_
.li6Q_ HOLE 5
.2.§Q_
- J>!lQ_
�
600

near Station 2314+70 and is about 70 feet in length. Record plans show that the foundation under this fill was to have been benched in the vicinity of the latter station. Rockline under the western embankment slopes steeply; it has a grade of about 40 percent. Grade of the western approach pavement is -4.0 percent. Each approach embankment contains an earth core constructed to. facilitate pile driving. Slopes of the front portion of each approach embankment are 1.5 horizontal to I vertical. Record plans specified that the front portion of each embankment was to have been constructed of rock.
The two bridges and four abutments are identical in design. The bridges are 330 feet in length, 30 feet in width and have span lengths of I 00, 130 and I 00 feet. Each abutment is 14 feet in height, 8 feet in width at the bottom, 2 feet in width at the top and 37 feet in length, and rests on two rows of H-piles (12 BPS 3) totaling 13. Wingwalls of the abutments are not supported on piles. Piles in both the front and back rows were battered according to recommendation by Stermac, Devata and Shelby (9) that provisions should be made in abutment design to resist a horizontal force, presumably acting in a direction away from the bridge. Batter of the front piles was 3 horizontal to 12 vertical; the. back row was battered 2 to 12. The concept was utilized for a periOd of time at several bridge sites on the Bluegrass Parkway and in the Department's design criteria, but it was later abandoned when experience indicated the reverse batter produced more likelihood of lateral movement toward the bridge ( 13 ).
Design records show that, in checking the stability of the abutments, the equivalent-fluid concept was used to compute the active horizontal thrust due to the weight of the backfill. In these computations, the unit weight of the backfill was assumed to have a value of 34 pounds per cubic foot. The equivalent fluid concept has been used extensively in Kentucky. Computations show that for the backfill to conform to the above assumption it would have an internal angle of friction, rf;, of about 35 degrees. In effect, the design backfill material is assumed to be sand or gravel. In actuality, few abutments in the state have been backfilled with such materials. Records show that construction of the embankments and bridges started in the spring of 1 1964; they were completed in the spring of 1965.
SURFACE INVEl>TIGATION
Topography. The site is situated in the western portion of the Bluegrass Physiographic Region, one of three sections occupying the Interior Low Plateaus Providence of mid-central, eastern United States. The Bluegrass area is limestone country and, typically, a
rolling upland in the youthful stage of dissection. The area is characterized by Ordovician outcrop ( 14). The surface of the area is mildly karst and gently rolling. However, in the vicinity of large streams, the surface is geologically mature and distinctly rough.
Topography in the vicinity of the site is rugged, dissected and consists of long, narrow, steep-sided ridges and narrow, winding, V-shaped valleys (15). The drainage pattern of the area is dendritic. Such terrain is typical of the Eden Hill country, one of three distinguishable areas of the Bluegrass Region. Total variation in relief near the site is approximately 130 feet, ranging from an elevation of 595 feet in the valley bottom of Chaplin River to an elevation of about 725 feet at the crests of the adjoining hills.
Present Site Conditions. During inspections of the site (Figure 3) in late 1972, several visible failure signs
were observed which indicated the stability of the approach embankment piles and abutments as being precarious. These are indicated on the areal plan of the site (Figure 3). As shown in Figure 6, a portion of the embankment located in front of the western abutments had slumped and moved downward several feet exposing some 8 to 10 feet of the H-piling supporting the westbound abutment and the top of the piling supporting the eastbound abutment. The lower portion of the failure was resting against the piers located on the west side of the river (Figure 7). The surface of the slump was S-shaped. Development of the slump started somethne in 1969. Efforts made at that thne to correct the failure consisted of removing a portion of the material at the top of the slump, installing perforated pipe near an elevation of 650 feet at Station 2314+70 and rebuilding the top of the slump with stone to approximately the original grade. These efforts were based on the assumption that failure was caused by ground water seepage. Unfortunately, the reconstruction was unsuccessful, and since 1969 the slump continued to move downward as shown in Figure 6. Placement of rock at the top of the slump added additional driving moments.
The downward and lateral movement of the slump apparently affected other portions of the western embankment. As shown in Figure 8, transverse cracks occurred in the pavement some 56 feet behind the abutments near Station 2314+00. Both abutments had tilted backward (Figure 9); the bottom portions of each abutment were bearing against the bottoms of the bridge girder spans (Figure 10). A portion of the embankment (Figure 11) located between the wingwalls of the western abutments failed in late 1972. As shown in the bottom photograph of Figure 8 cracks occurred in the western approach pavements some 20 feet behind the abutment. Both approach pavements settled and required patching.
5

Present conditions at the eastern approach Figure 7. View of the Bottom Portion of the Western Embankment Slump Resting against the Piers Located on the West Side of the River, Station 2315 + 64.
embankment are similar to those of the western embankment, although no portion of the eastern embankment has failed. Both abutments tilted, as typified in Figure 9, and the bottom portion of each abutment contacted the bottom edges of the steel girder spans. Approximately 76 feet behind the abutments, transverse pavement cracks appeared (Figure 12). Some slumping or settling of the embankment along the wingwalls is evident, as shown in Figure 13. Both approach pavements have settled excessively and required patching (Figure 14). The easterly abutment in the eastbound lanes is cracked.
Figure 6.
6
View of the Embankment Slump Located in Front of the Western Abutments, Station 2314 + 00.
SUBSURFACE INVESTIGATION
Engineering Geology. Bedrock (Clays Ferry Formation) of the hills adjoining the site is composed of sedimentary rocks of Upper Ordovician Age. A generalized geologic columnar section is shown in Figure IS. Rock strata at the site consist predominantly of olive�gray, lumpy, calcareous shale with some thin, medium to dark gray, evenly bedded, argillaceous limestone and dark�gray, calcareous siltstone layers. The limestone occurs as calcarenite and calcisilite in lN to 3-inch thick beds (15}. The siltstone, which forms a relatively small portion of the Clays Ferry Formation, occurs in 1- to 3-inch thick platy beds.
The hilly and geologically mature topography at the site was formed by weathering and erosion of the weaker, impervious shale layers. When soaked, the shales of the Clays Ferry Formation slake and fall apart. Downcutting action by Chaplin River created the present valley at the site. With the rapid erosion of the weak shales on the steep slopes, slabs of intercallated limestones were left scattered over the surface as shown in Figure 3, a view of the terrain and geology of the site.
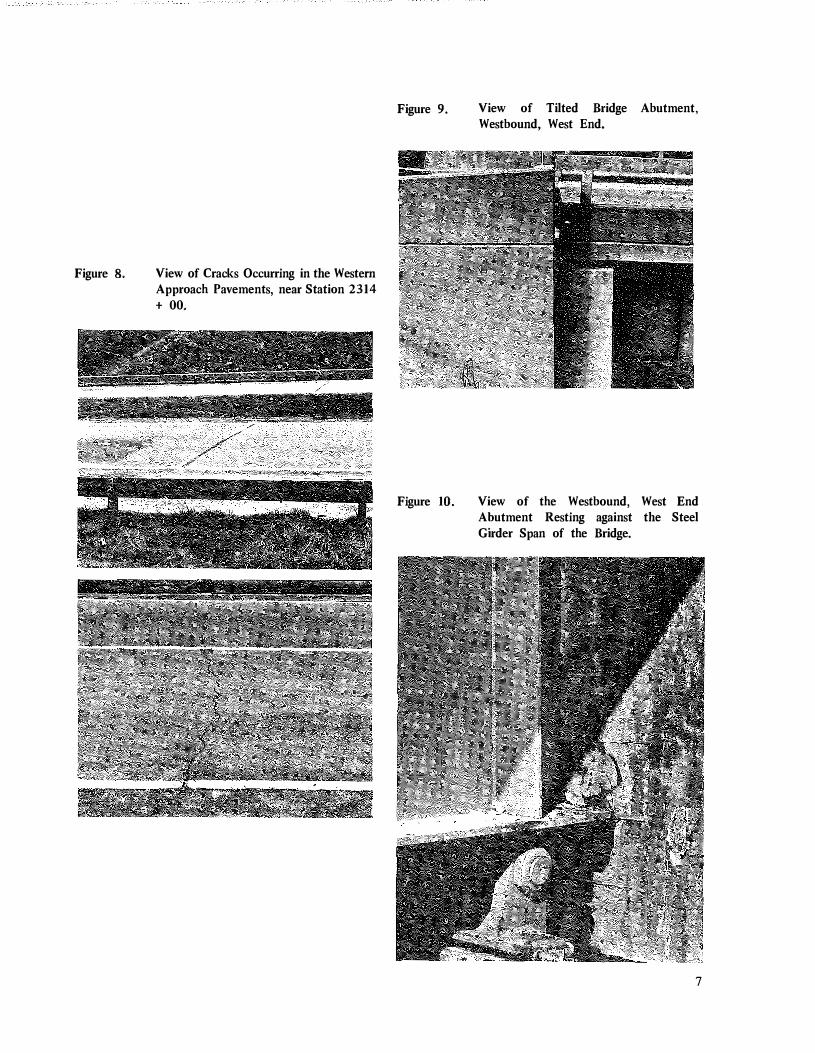
Figure 8. View of Cracks Occurring in the Western Approach Pavements, near Station 2314 + 00.
Figure 9.
Figure 10.
View of Tilted Bridge Abutment, Westbound, West End.
View of the Westbound, West End Abutment Resting against the Steel Girder Span of the Bridge.
7

Figure II.
Figure 12.
8
View of Slumped Material Located between the Wingwalls of the Western Abutments.
View of Cracks Occurring in the Eastern Approach Pavements, near Station 2318 + 70.
Figure 13.
Figure 14.
Settlement of the Embankment along the Eastern Abutment Wingwalls.
View of the Heavily Patched Eastern Approach Pavements.

1:1 m "" to
" '" � 0 '"·
"' m m " '" "" " zz ., "" uu z 0" '" in" " -o f.< �z ., " ·� 0:
z "< �z �0 �&; Q
z
"'
u
> 0 "
" Cl � "
0
ALLUVIUM /0-ll02cf�,:f.: .zj OHIO
OR NJi;W
ALBANY SHALE
UNNAMED �ANDSTONE MEMBEH
r:ARHARD SANDSTONE
Figure 15.
LITHOLOGY
f'lay, SJil, aand nnrl somo gravel M•ximum thickness uf nearly Hit f�et on Rolling �'ork" few mile-' <lownstr<•am from Nelson f'm<nt.Y line.
Black highly fi""ile shalt• with l:r<•••n sl"tl•• layers lne�lly. Clh•le ountaino graW> <.I ojUo>rl, .. ]tyrite. ann nthor miner�ls, and organic• fn!Ll<•rial. Thm >".<1\o!,·tcme or c•alt•art'DU' i<Wet' aro more numeC<JllS ""''Hrol tho 1>1""- Pyrite m"y he• pre.<ent M oontact with <or1il<•rlyin)< lintestnne.
i ,;, h . '
Hit] t' llil
Bluish to li!<i11-gr,.y fine-gTaineol "'"'';,.,. tlulomiUe lime>t<>tl"' nnt !>resent in Wa•h<n!<hort l'"""IY "'"I may be ab,ent in M«ri<>n County.
i. il
' ... "' lit -.
Mas"'"" hl10ish-1<ray fin�-gr"ined dolomitic limestone with •·ural •�•f near the l<Jp; moy be absent in M,.rinn County.
Hhli<h-�ra)' lump)' cla��J<L'"" anol thin-l"''ltlt•d sh><lo• with IIUJ<·h inlerheddeol irl'<'l("l."·- knull.v, an•l nol.hl;limo·"""''
Thm- tn modiom-i>etld•d rubbl_,. "'"'illaoo•mo" limes\""" with nntdl shale' thm, 1•�·-lly ''''"'"bodtlt•tl crystallin� rubbly limestont• w1th some oh•le i(l lnW<•r part I !lellvvuo limest<mc nu•mber)
Fine-�<raine<l t•alcaronus ""ndsl<>r"" <>r •ilt,.lnne 1<riltling into "moly lim<•stone and shult above and bo•l .. w; botteJ" devei<�Jeol ;,, Ma.-ion Coon�\' ll""' in N,•lsoll ami' W•,hingt<Jn Counti<•"
Hlomil-1""-" lumpy c·:�lcMe.,,e< 'hah• with thin ''''''"lv hetl<l<•d "r,:::illao'o'o"" lin•e<'<>m· I.L.V<"ro that,,.,. rltmH•o·nu< and lilkko•c tuwar<l the b""'" Ma)• t•on>i'< alnl<O<\ enl1rely .,f "hal•• 10 ourrw """''"'
Thin- l" lhio·k-loedde<l fine- tl> t'<>ar>t'-)<o'ain<•d limeel<>n<•. lm·nll)• ,.,..,,he<l<lo·d. '"hbl,l', "' l"'ul<lory, with dc.h en· hlui<h->:r">' "halo•_ lipp<'t IHOl"t "''"" shal.v in"''"' pla•·••s
A Generalized Geologic Columnar Section of the Chaplin River Area.
9
The surface of the sedimentary rock strata decomposed by weathering, forming a relatively thin zone of residual soils. The residual soils are highly plastic and are the most unstable regolith found in the area. These soils are always potential failure planes and several highway fill slips have occurred in the area. A thin layer of alluvium measuring about 20 feet in thickness covers the bedrock in the valley bottom of Chaplin River. The alluvium Gonsists of clay, silt and gravel. Occurrence of these materials is of nominal significance to the stability of the approach embankments except as a drainage basin. The approach embankments are located mainly on the residual soils paralleling the underlying rock surface, although a relatively small portion of each of the embankment toes rests on the alluvial deposits in the bottom of Chaplin River.
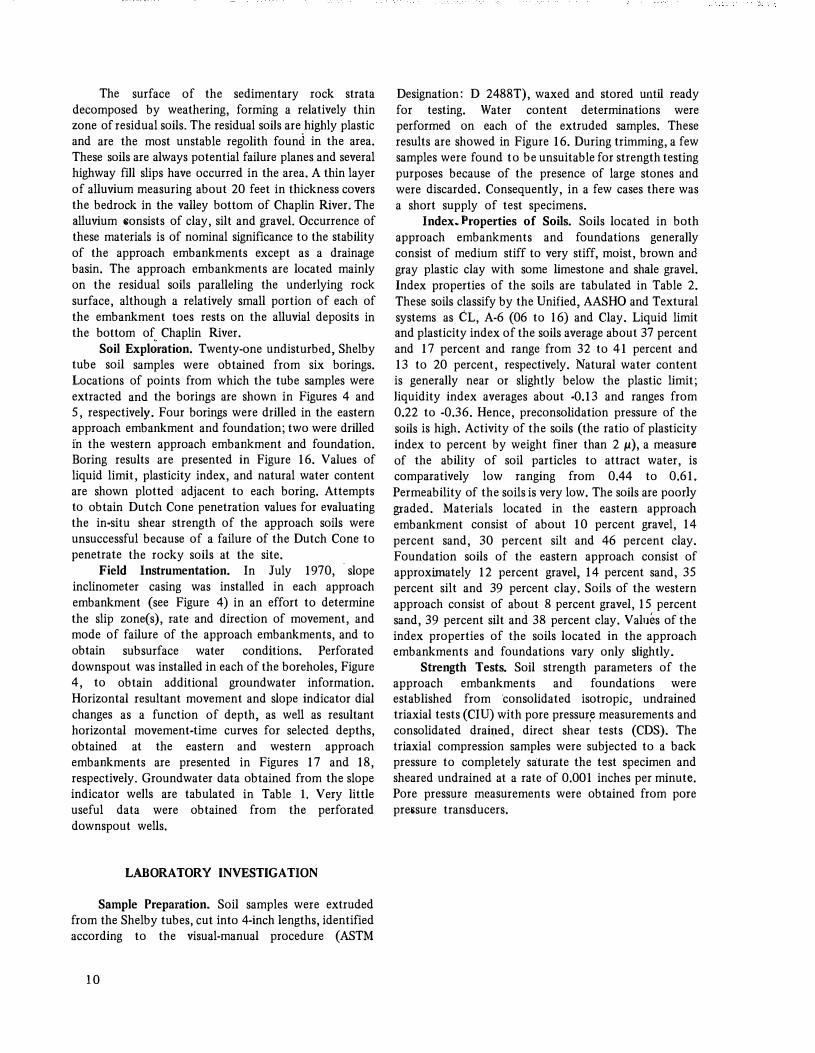
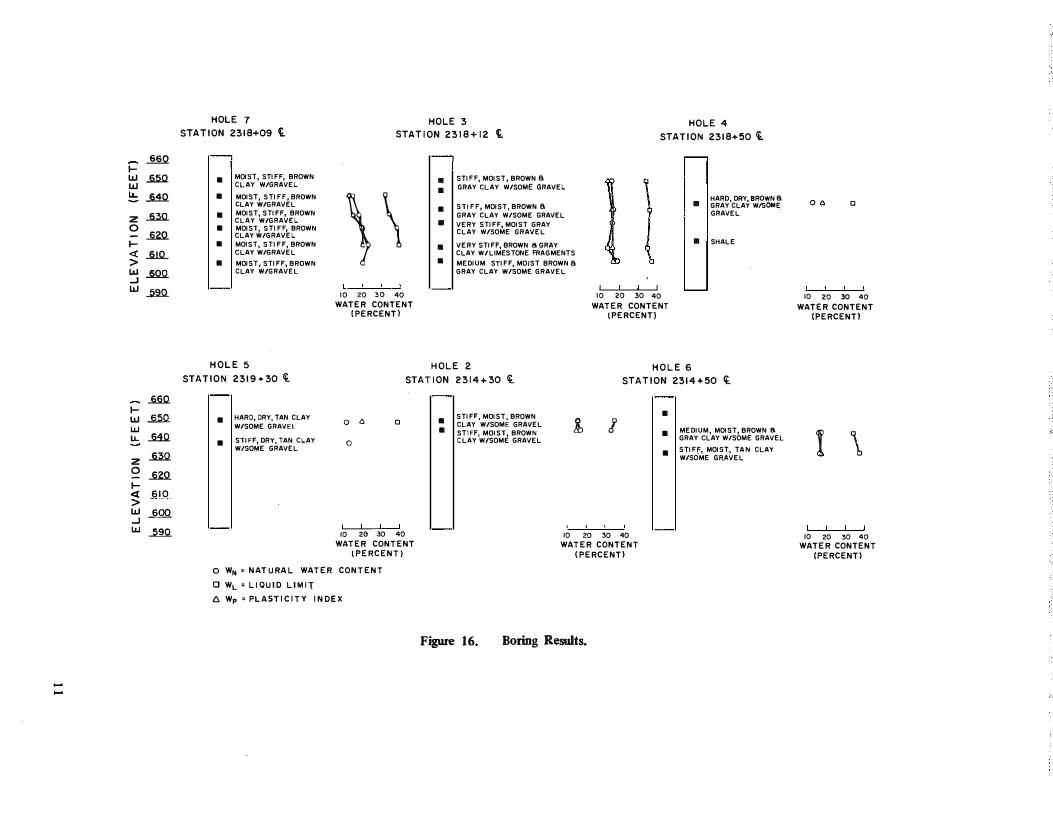
Soil Exploration. Twenty-one undisturbed, Shelby tube soil samples were obtained from six borings. Locations of points from which the tube samples were extracted and the borings are shown in Figures 4 and 5, respectively. Four borings were drilled in the eastern approach embankment and foundation; two were drilled fn the western approach embankment and foundation. Boring results are presented in Figure 16. Values of liquid limit, plasticity index, and natural water content are shown plotted adjacent to each boring. Attempts to obtain Dutch Cone penetration values for evaluating the in-situ shear strength of the approach soils were unsuccessful because of a failure of the Dutch Cone to penetrate the rocky soils at the site.
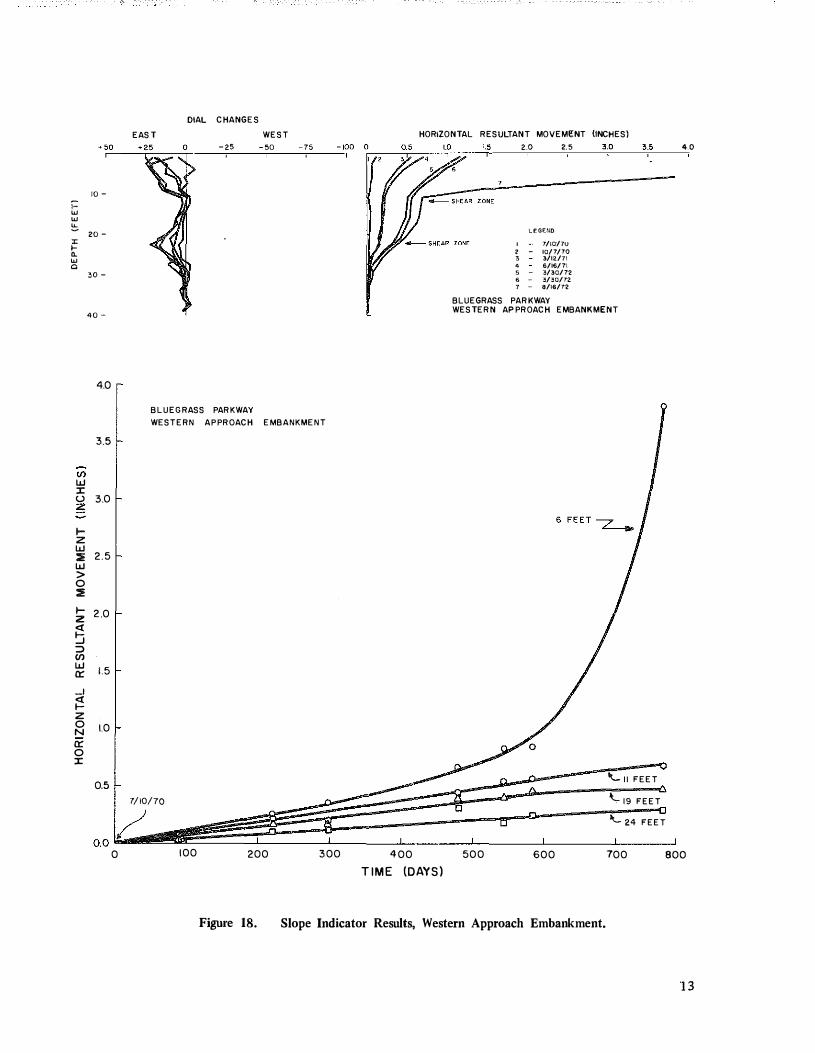
Field Instrumentation. In July 1970, ·slope inclinometer casing was installed in each approach embankment (see Figure 4) in an effort to determine the slip zone(s), Eate and direction of movement, and mode of failure of the approach embankments, and to obtain subsurface water conditions. Perforated downspout was installed in each of the boreholes, Figure 4, to obtain additional groundwater information. Horizontal resultant movement and slope indicator dial changes as a function of depth, as well as resultant horizontal movement�time curves for selected depths, obtained at the eastern and western approach embankments are presented in Figures 17 and 18, respectively. Groundwater data obtained from the slope indicator wells are tabulated in Table I. Very little useful data were obtained from the perforated downspout wells.
LABORATORY INVESTIGATION
Sample Preparation. Soil samples were extruded from the Shelby tubes, cut into 4-inch lengths, identified according to the visual-manual procedure (ASTM
10
Designation: D 2488T), waxed and stored until ready for testing. Water content determinations were performed on each of the extruded samples. These results are showed in Figure 16. During trimming, a few samples were found to be unsuitable for strength testing purposes because of the presence of large stones and were discarded. Consequently, in a few cases there was a short supply of test specimens.
Index. l'roperties of Soils. Soils located in both approach embankments and foundations generally consist of medium stiff to very stiff, moist, brown and gray plastic clay with some limestone and shale gravel. Index properties of the soils are tabulated in Table 2. These soils classify by the Unified, AASHO and Textural systems as CL, A-6 (06 to 16) and Clay. Liquid limit and plasticity index of the soils average about 37 percent and 17 percent and range from 32 to 41 percent and 13 to 20 percent, respectively. Natural water content is generally near or slightly below the plastic limit; liquidity index averages about -0.13 and ranges from 0.22 to -0.36. Hence, preconsolidation pressure of the soils is high. Activity of the soils (the ratio of plasticity index to percent by weight finer than 2 /1), a measure of the ability of soil particles to attract water, is comparatively low ranging from 0.44 to 0.61. Permeability of the soils is very low. The soils are poorly graded. Materials located in the eastern approach embankment consist of about 10 percent gravel, 14 percent sand, 30 percent silt and 46 percent clay. Foundation soils of the eastern approach consist of approxhnately 12 percent gravel, 14 percent sand, 35 percent silt and 39 percent clay. Soils of the western approach consist of about 8 percent gravel, 15 percent sand, 39 percent silt and 38 percent clay. Values of the index properties of the soils located in the approach embankments and foundations vary only slightly.
Strength Tests. Soil strength parameters of the approach embankments and foundations were established from 'consolidated isotropic, undrained triaxial tests (CIU) with pore pressur� measurements and consolidated drail!ed, direct shear tests (CDS). The triaxial compression samples were subjected to a back pressure to completely saturate the test specimen and sheared undrained at a rate of 0.001 inches per minute. Pore pressure measurements were obtained from pore pressure transducers.
_&§Q f-"' "' _§l>Q_ lL _MQ_
z� :?� f-..: __qjQ_ >
�-= w�
_§2Q_ f-"'� w lL _MQ
z_MQ_ �� f-<X 610 > w 600 _, --
UJ _;l!Q_
-
HOLE 7
STATION 2318+09 t
• MOIST, STIFF, BROWN CL.AY W/GRAVEL
• MOIST, STIFF ,BROWN CLAY W/GRAVEL
• MOIST, STIFF, BROWN CLAY W/GRAVEL
• MOIST, STIFF, BROWN CLAY W/GRAVEL
• MOIST, STIFF, BROWN CLAY W/GRAVEL
• MOIST, STIFF, BROWN CLAY W/GRAVEL
HOLE 5
STATION 2319+30 l
•
•
HARD, DRY, TAN CLAY W/SOME GRAVEL
STIFF, DRY, TAN CLAY W/SOME GRAVEL
HOLE 3
STATION 2318+12 t HOLE 4
STATION 2318+50 l
• STIFF, MOIST, BROWN a • GRAY CL.AY W/SOME GRAVEL
\ \ l � I I HARD, DRY, BROwN a
• STIFF, MOIST,BROWN a Ill GRAY CLAY W/SOME GRAY CLAY W/SOME GRAVEL GRAVEL
• VERY STIFF, MOIST GRAY CLAY W/SOME GRAVEL
II I I II I SHALE • VERY STIFF, BROWN a GRAY CLAY W/ LIMESTONE FRAGMENTS
• MEDIUM STIFF, MOIST BROWN B. GRAY CLAY W/SOME GRAVEL
'0 '0 30 40 '0 '0 30 40 WATER CONTENT WATER CONTENT
(PERCENT) {PERCENT)
HOLE 2
STATION 2314+30 l HOLE 6
STATION 2314+50 l
0 0 0
0
10 2G :30 40 WATER CONTENT
{PERCENT}
• •
STIFF, MOIST, BROWN CLAY W/SOME GRAVEL STIFF, MOIST, BROWN CLAY W/SOME GRAVEL
£ l
10 20 :30 40 WATER CONTENT
{PERCENT!
•
•
•
MEDIUM, MOIST, BROWN B. GRAY CLAY W/SOME GRAVEL
STIFF, MOIST, TAN CLAY W/SO
.ME GR.AVEL
0 WN =NATURAL WATER CONTENT
0 WL:: LIQUID LIMIT
D. Wp "PLASTICITY INDEX
Figure 16. Boring Results.
00 0
10 20 :30 40 WATER CONTENT
{PERCENTl
I \
10 20 :30 40 WATER CONTENT
{PERCENT!

10-
20-
;:: w 30-w !0 I ... .. •o-w "
50-
60-
<O-
3.0
(f) 2.5 LiJ :I: u � f-z 2.0 w ::;; w > 0 ::;: 1-z 1.5 <{ '::; :::J (f) LiJ "' ..J �
1.0
z 0 N ;;:: 0 :I: 0. 5
DIAL CHANGES EAST WEST
BLUEGRASS PARKWAY EASTERN APPROACH EMBANKMENT
6/12/70
HORIZONTAL RESULTANT MOVEMENT (INCHES} 2.5 3.0 3.5
-SHEAR ZONE
BLUEGRASS PARKWAY EASTERN APPROACH EMBANKMENT
LEGENO
6/1�/70
7/2�/70
8/20/70 12/10/70
3/12/71
12/15/71
3/30/72
6/14/72
9 - B/16/72
MOVEMENT " 0 0026 TIME {DAYS)
0 � 547 DAYS
"-MOVEMENT = 0.0014 TIME (DAYS)
0 � 547 DAYS
3/30/72
0
•o
L� • 0.0 ��----�------�-------L------�------_J�----�J��---��----�
0 100 200 300 400 500 600 700 BOO
TIME (DAYS)
Figure 17. Slope Indicator Results, Eastern Approach Embankment.
12
10-;::: w w � 20-" f-"-w "
;o-
40-
4.0
3.5
en w :I: u 3.0 ;!!;
1-z w ::!! 2.5 w > 0 ::!!
� 2.0
� :.J ::> (/) w a::
--' � z 0 N a:: 0 :I:
1.5
1.0
0.5
DIAL CHANGES
EAST -25
BLUEGRASS PARKWAY
WEST -50 -75
WESTERN APPROACH EMBA NKMENT
7/10/70
0 100 200 300
HORIZONTAL RESULTANT MOVEM�NT (INCHES}
400
TIME (DAYS)
2.0 2 .5 ;.o '·' 40
lEGE:.'JD
I 1/10/70 ' 10/7/70 ' 3/12./71 ' 6/16/71 , 3/30/72 ' - 3/30/72. ' - 8/16/72
BLUEGRASS PARKWAY WESTERN APPROACH EMBANKMENT
500 600
\.._II FEET
-\.,. 19 FEET
'-._ 24 FEET
700 BOO
Figure 18. Slope Indicator Resnlts, Western Approach Embankment.
13

Table 1.
Groundwater Elevations Observed at the Eastern and Western Approach Embankments.
WATER TABLE ELEVATIONS (FEET)
DATE EASTERN APPROACH WESTERN APPROACH
SLOPE HOLE SLOPE HOLE INDICATOR NUMBER INDICATOR NUMBER
WELL 5 WELL 2
6/14/70 630.5 6/25/70 616.5 631.5 7/23/70 613.3 631.5 8/20/70 616.5 6:i 1.5 10/07/70 617.0 631.6 12/10/70 617.5 DRY 1/12/71 619.3 DRY 3/12/71 619.2 635.5 4/07/71 616.0 DRY 6/16/71 618.1 DRY DRY 12/15/71 622.5 2/24/72 625.8 3/24/72 624.6 637.2 3/30/72 624.5 DRY 6/14/72 620.0 DRY DRY 652.0
14

-"'
HOLE SAMPLE � NUMBER NUMBER FROM TO
(FEET)
" "
" "
21.5 ns
30.8 32.8
" "
" "
" "
" "
" "
" "
" m
" "
" "
" 47.5
" 57.5
,. " "
" "
" "
" "
" "
Table 2.
DESCRIPTION
Index Properties of Eastern and Western Approach Embankments and Foundation Soils.
LIQUID LIMIT
PLI\STICITY 'NDill<
UQUIDI1Y INDEX
_GRMN SIZE __ D_I_S_l]�l_B_UJIQ!L(P_ERCENTl SAND SILT CLAY
NATURAL MOISTURE CONTENT
(PERCENT)
COARSE AGGREGATE
»MM 2 TO 0.5MM O.SMM TO 51! <2>< "''
Hard, Dry, Tan Cllly w/ some Gravel
Stiff, Dry, Tan Clay w/some Gravel
H.ud, Dry, Brown & Gray Clay w/SQ!IIe Gravel
'""'
Stiff, Moist, Brown & Gray Clay w/snme Gravel
Stiff, Moi•t, Brown & Gray w/rome Gravel
Vozy Still, Moist Gray Clay w/sorrw: Gravel
Very Stiff, Brown & Gray Clay w/some Llrnestooe Fragments
Medium Stiff, Moist, Brown & Gray Clay w/some Gravel
Stiff, Moist, Brown Clay w/some Gravel
Stiff, Moist, Brown Clay. w/some Gravel
Stiff, Moist, Tan Clay w{some Gravel
Medium-stiff, Moist, Brown Clay w/some Gravel
Medium-Stiff, Moist Brown Clay w/some Gr""el
Modium.Stiff, Moist, Bnwro Clay w/some Gravel
Stiff, Moiot Brown Clay w/some Gravel
Stiff, Moist Brown Clay w/some Gravel
Modium, Moist Brown & Gray Clay w/some Gravel
Stiff, Moist tan Clay w/som_e Gravel
Soft, Saturated Gray Clay
11.9
13,2
12.7
16.1
16.6
16.0
l i9
19.1
14.6
18.1
19.1
22.8
19.8
16.0
17.0
16.9
16.6
37.3
"
" " "
"
" " "
" " ''
" " " "
"
" "
'" '"
" "
" "
"
"
"
" "
"
" " "
"
" " "
" " "
" " '" "
"
" "
" "
" "
" ''
"
"
"
" "
.0.36
.0.22
.;us
.().]6
.. ().31
-<1.22
-{).29
-0.12
•.oo
-0.16
.0.01
-0.19
-0.07
-{).07
-{).20
" "
" "
" "
" " "
"
B
"
'" "
" "
" "
B " B
w
"
"
" B " "
"
" "
" "
" "
" "
" " "
"' "
"
" "
'" % " "
"
" "
" ;o
" "'
" "
" " "
" "
'"
" "
"' '"
" "
"
" +>
" "
" "
" "
" '" '"
" D
"
" "
" "
" "
"
" "
NOTE: Borillgs 2, 3, 4, 5 and 7 drilled at Eastern Approach and Hole 6 drilled at WeSiern Approach
CLASSIFICATION
UNIFIED AASHO TEXTURAL
cc cc
cc cc
cc cc
cc cc cc
cc cc
cc cc cc cc cc cc cc
cc
cc cc
A-6(08) A-6(11)
A-6{06) A.6(08)
A-6(08) A-6(06)
A-6(11) A-6(!3) A-6{13)
A-6(12) A.6(08)
A-6(1}9)
A-6{15) A-6(16)
A-6(J3) <1.-6(J6)
A-6(13) M>{l2)
A-6(09)
A--6(11) A-6(21)
'"' '"'
'"' '"'
'"' Clay
'"' Clay '"'
"'' "''
"''
Clay '"'
,., '"'
'"' C1ay
Clay Loam
'"' "''
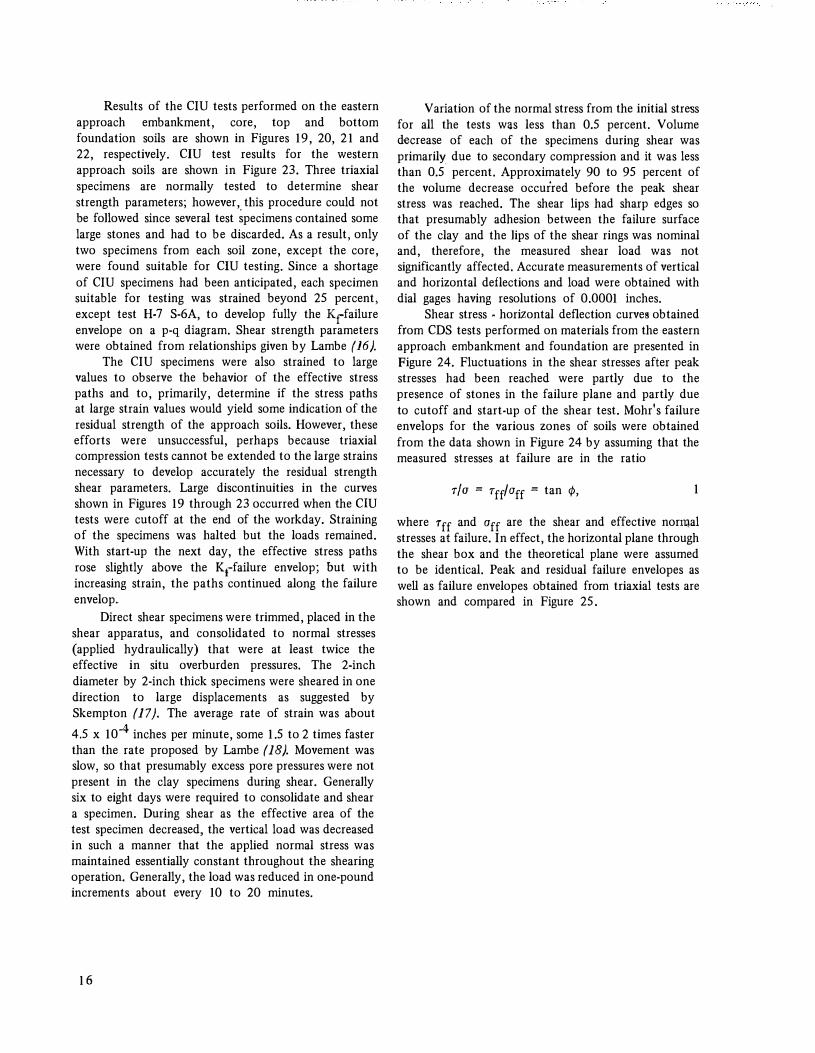
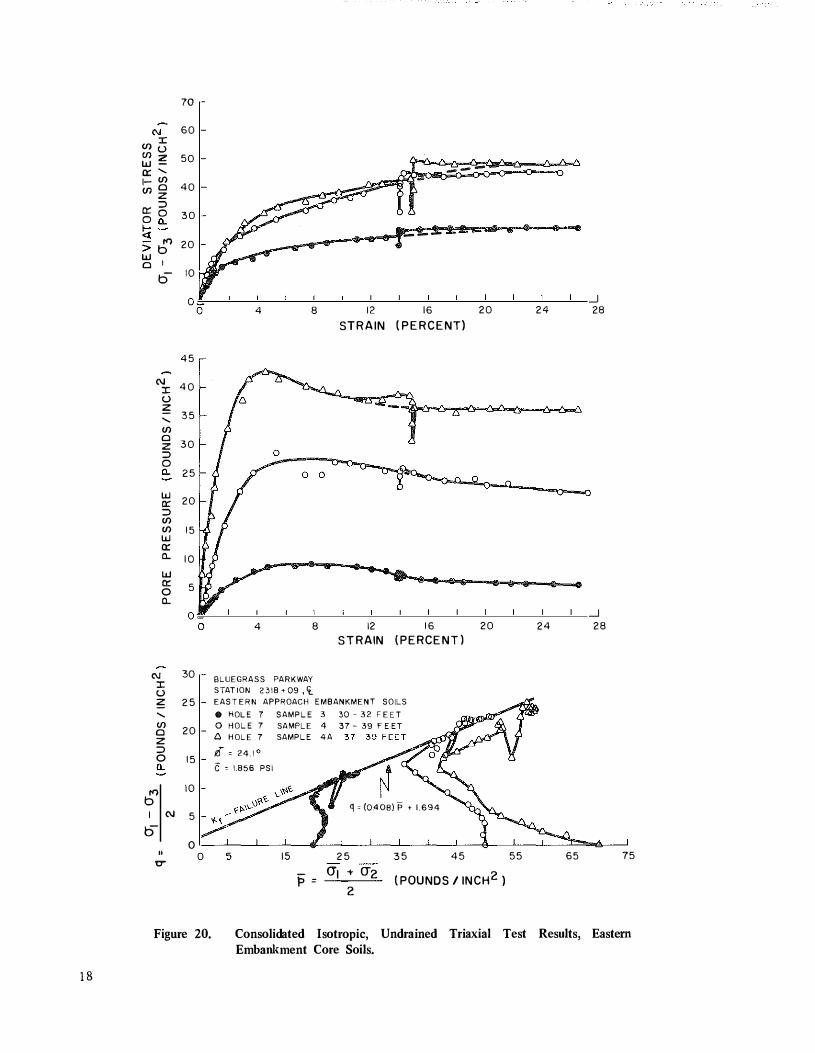
Results of the CIU tests performed on the eastern approach embankment, core, top and bottom foundation soils are shown in Figures 19, 20, 2 1 and 22, respectively. CIU test results for the western approach soils are shown in Figure 23. Three triaxial specimens are normally tested to determine shear strength parameters; however,_ this procedure could not be followed since several test specimens contained some large stones and had to be discarded. As a result, only two specimens from each soil zone, except the core, were found suitable for C!U testing. Since a shortage of CIU specimens had been anticipated, each specimen suitable for testing was strained beyond 25 percent, except test H-7 S-6A, to develop fully the Krfailure envelope on a p-q diagram. Shear strength parameters were obtained from relationships given by Lambe (16 ).
The CIU specimens were also strained to large values to observe the behavior of the effective stress paths and to, primarily, determine if the stress paths at large strain values would yield some indication of the residual strength of the approach soils. However, these efforts were unsuccessful, perhaps because triaxial compression tests cannot be extended to the large strains necessary to develop accurately the residual strength shear parameters. Large discontinuities in the curves shown in Figures 19 through 23 occurred when the C!U tests were cutoff at the end of the workday. Straining of the specimens was halted but the loads remained. With start-up the next day, the effective stress paths rose slightly above the K1failure envelop; but with increasing strain, the paths continued along the failure envelop.
Direct shear specim·ens were trimmed, placed in the shear apparatus, and consolidated to normal stresses (applied hydraulically) that were at least twice the effective in situ overburden pressures. The 2�inch diameter by 2-inch thick specimens were sheared in one direction to large displacements as suggested by Skempton (17). The average rate of strain was about
4.5 x 104 inches per minute, some 1.5 to 2 times faster than the rate proposed by Lambe (18 ). Movement was slow, so that presumably excess pore pressures were not present in the clay specimens during shear. Generally six to eight days were required to consolidate and shear a specimen. During shear as the effective area of the test specimen decreased, the vertical load was decreased in such a manner that the applied normal stress was maintained essentially constant throughout the shearing operation. Generally, the load was reduced in one-pound increments about every 10 to 20 minutes.
16
Variation of the normal stress from the initial stress for all the tests was less than 0.5 percent. Volume decrease of each of the specimens during shear was primarily_ due to secondary compression and it was less than 0.5 percent. Approximately 90 to 95 percent of the volume decrease occur'red before the peak shear stress was reached. The shear lips had sharp edges so that presumably adhesion between the failure surface of the clay and the lips of the shear rings was nominal and, therefore, the measured shear load was not significantly affected. Accurate measurements of vertical and horizontal deflections and load were obtained with dial gages having resolutions of 0.0001 inches.
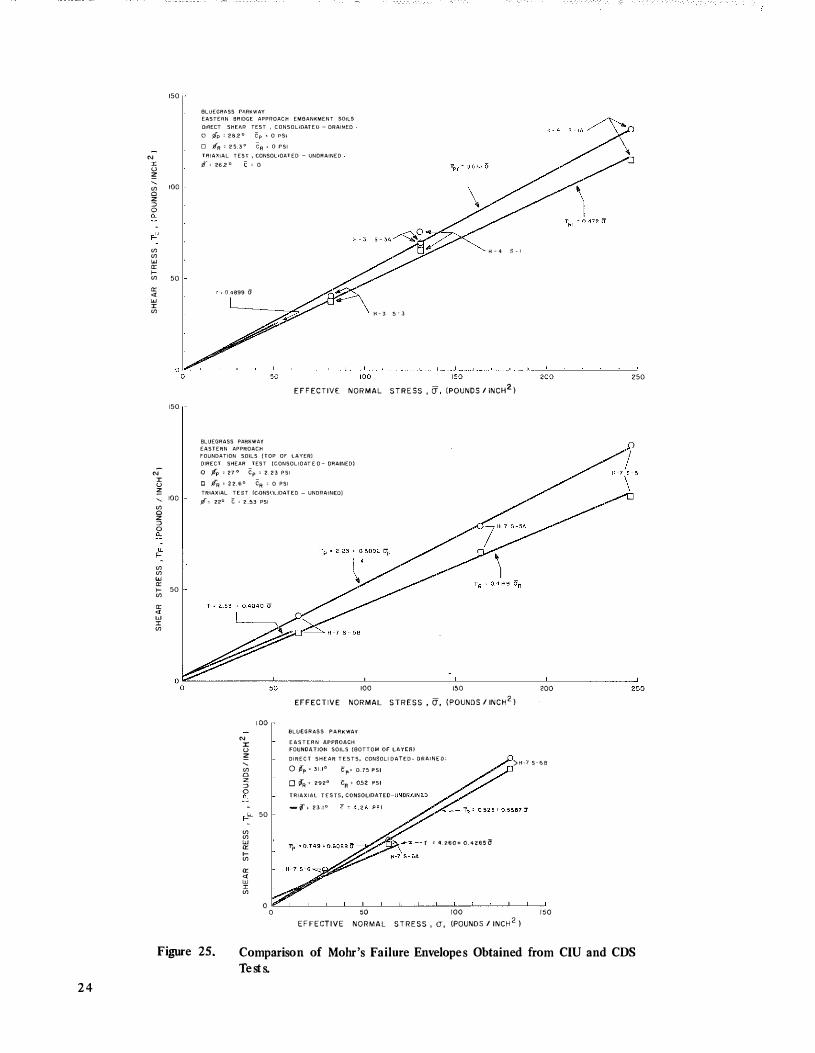
Shear stress - horizontal deflection curve• obtained from CDS tests performed on materials from the eastern approach embankment and foundation are presented in Figure 24. Fluctuations in the shear stresses after peak stresses had been reached were partly due to the presence of stones in the failure plane and partly due to cutoff and start-up of the shear test. Mohr's failure envelops for the various zones of soils were obtained from the data shown in Figure 24 by assuming that the measured stresses at failure are in the ratio
r/a � Tff/aff � tan ¢, 1
where Tff and off are the shear and effective normal stresses at failure. In effect, the horizontal plane through the shear box and the theoretical plane were assumed to be identical. Peak and residual failure envelopes as well as failure envelopes obtained from triaxial tests are shown and compared in Figure 25.

(\J (f) :I:
VJU w;<!; "' ' 1-VJ cno
z a::=>
oo �-� c( - "' > b w O l
b-
(\J :1: u � ' Ul 0 z :l 0 Q_
w a:: :l Ul Ul w 0: Q_
w 0: 0 Q_
(\J :1: u ;<!; ' (/) 0 z ::> 0 Q_
"' b
I (\J
b "
....
40
30
20
10
45
40
35
30
25
20
15
10
5
0 0
40
35
30
25
20
15
10
5
0 0
2 4 6 8
0
2 4 6 8
BLUEGRASS PARKWAY
STATION 2318 -t-09 , Cf_
6
10 14 STRAIN
6
10 14
STRAIN
EASTERN APPROACH EMBANKMENT SOILS
Cl HOLE 7 SAMPLE 2 20-22.5 FEET
0
18 2 2 26 (PERCE NT)
6
0
18 22 26
(PERCENT)
0 HOLE 7 SAMPLE 2A 20-22.5 FEET
rr = 26.2°
c = 0
10 20
Q: 0.4409 p
40 50
(POUNDS /INCH2)
60
30
30
70 eo
Figure 19. Consolidated Isotropic, Undrained Triaxial Test Results, Eastern Embankment Soils.
17
70
"' 60
:L cnu <n:z 50 w- ---a:: ' I- (f) (f) 0 4 0 z a:: ::>
0 30 0 a. � ---
"' 20 > b w 0 I
b- 10
4 8 12 16 20 24 28
STRAIN (PERCENT)
4 5
"' 4 0 :L
u � --' 3 5
(f) 0 3 0 z ::>
0 a. 2 5
w 20 a:: ::> (f)
(f) 15 w a:: "- 10 w a::
5 0 "-
4 8 12 16 20 24 28
ST RAIN (PERCENT)
"' 30 BLUEGRASS PARKWAY :L STATION 2318+09 ,l_ u
� 2 5 EASTERN APPROACH EMBANKMENT SOILS
' .. HOLE 7 SAMPLE 3 30-32. FEET (f)
20 0 HOLE 7 SAMPLE 4 37 � 39 FEET 0 D. HOLE 7 SAMPLE 4A z ::> iJ= 24.1° 0 15
"- C � 1.856 PSI
"' 10
b <1 = (0408) p + 1.694 "' 5
0 0 "
0 5 15 2 5 3 5 4 5 5 5 65 75 ,..
i' =
()"I + ()"2 (POUNDS I INCH2) 2
Figure 20. Consolidated Isotropic, Undrained Triaxial Test Results, East em Embankment Core Soils.
18

70
C\J 60 (f)
I <f> u w � 50 O: ' 1- <f> ({) 0
z 40
o: "' 0 0 30 l- eo ::! "'
20 > b w o •
b 10
0 0
45
NI 40 u � 35 .... (f) 0 30 z :::> 0 0.. 25
w 20• 0: :::> (f) (f) 15 w 0: 0.. 10
w 0: 5 0 0..
0 0
C\J 30 I u � 25 .... (f) 20 0 z :::> 0 15 0.. �
"' 10 b
C\J 5 b
0 II 0 ,..
- - - - - - -
��4
2 4 6 8
2 4 6 8
BLUEGRASS PARKWAY
STATION 2318 + 27 , <i
10 14 18
STRAIN (PERCENT)
10 14 18
STRAIN (PERCE NT )
EASTERN APPROACH FOUNDATION SOILS (TOP OF LAYER)
0 HOLE 3 SAMPLE 5 45-47.5 FEET 6 HOLE 3 SAMPLE 5A 45-47.5 FEET
Jl" = 22.0° C = 2 . 5 3 PSI
22
22
q = 2.368 + 0 . 3 74 ii
10 20 40 50
(POUNDS /INCH2 )
26 30
26 30
60 70 80
Figure 21. Consolidated Isotropic, Undraioed Triaxial Test Results, Eastern Fopndation Soils, Top Layer.
1 9

90
80
(\) 70 f.!) I "' u
60 w "" 0:: -... 1- (/) Ul 0 50
z :::>
"' o 40 O o_ !;( -- "' 30 > b w 0 I
b 20
1 0
0 0
25
w -"' "' :> I 20 (f) u Ul z 1 5 w ' a: Ul a. 0 1 0 z w ::J a: 0 0 a.. 5 0..
0 0
45
C\1 40 ::r: u 35 z ..._ Ul 30 0 z ::;) 25 0 "-
20
b' I C\1 15
b-10
" u- 5
0 0
20
4 8
4 8
BLUEGRASS P A R K WAY STAT I O N 231 8 + 09 , It
1 2 STRAIN
1 2 STRAIN
- -
1 6 20 24 (PERCENT)
1 6 2 0 2 4 (PERCE NT)
E A S T E R N APPROACH FOUN DATION S O I L S (BOTTOM O F L A Y E R ) 0 H O L E 7 S A M PL E 6 55 - 57.5 F E E T 6 H O L E 7 S A M P L E 6 A 55-57,5 F E E T 0 � 2 3 . 1 ° C = 4 . 2 6 P S I
10 20 30
p =
50 60
(POUNDS/ I NCH2
)
28
28
80
Figure 22. Consolidated Isot ropic, Und rained Triaxial Test Results, Eastern Foundation Soils, Bottom Layer.
90 100

70
(\j 60
en I (.) en � w 50
0:: ' 1- en
(f) 0 4 0 z
c:: => 0
0 30 �- �
<( "' > b 2 0 w
I 0
b 1 0
0 0
N I 30 (.) � ' 25 (f) 0 z 20 ::;) 0 fl_
15
w 0:: ::;) 10
(f) (f)
5 w a: CL
0
w 0:: 0 - 5 fl_ 0
4 0
N 3 5 I u
� 30 ' (f) 0 2 5 z ::;) 0
2 0 fl_
"' 15 b
"'
b- 10
" 5 ..,.
0
0
Figure 23.
-.... .... -
0
4 8 12 16 20
STRAIN (PERCENT )
4 8 12 16 20 STRAIN (PERCENT)
BLUEGRASS PARKWAY
STAT ION 2 3 1 4 + 5 0 , Cf_ WESTERN APPROACH SOILS
0 HOLE 6 SAMPLE 3 27 - 2 9 F E E T C:. HOLE 6 SAMPLE 3 A 27 - 2 9 F E E T
f � 2 1 . 8 °
C = 1.60 PSI
5 1 5
F = 25 35 45 55
(jl +
2 ..::..!.._;_:O':_,Z;_ (POUNDS I INCH
2l
24 28
24 28
65 75
Consolidated Isotropic, Undrained Triaxial Test Results, Western Approach Soils.
2 1

N I u � ' m 0 z � 0 ::0 � m m w "' >-m "' « w I m
2 2
80
<O
N 60 I u � ' m 0 50 z � 0 ::0 � 40
m m w "' 30 >-m
"' « w I m
0 " 0
000
50
l
BLUEGRASS PARKWAY [/\�TERN APPROACH EMBANKMENT SOILS
IJIRECT SHEAR TEST ICONSOLIDIITED - DRAINED)
STATION 2318 + 09, 'i_ KOLE 3 SAMPLF � DEPTH
00 0 2 0.3
HORIZONTAL DEFLECTION (INCHES)
0
BLUEGRASS PARKWAY EASTERN APPROACH EMBANKMENT SOILS
DIRECT SHEAR TEST (CONSOLIDATED - DRAINED)
STATION 2318 + 64, lt_
HOLE 4 SAMPLE I DEPTH 21.5- 2:'1.5 F E E T
O L_----�--�----0 0 01 0.2 0.3 0.4
HORIZONTAL DEFLECTION (INCHES)
K-3 S - 3A
1 1 - 3 s - 3
0.4 0.5
0.5 0.6
Figure 24. Shear Stress-Horizontal Deflection Curves, Eastern Approach Soils.
0.7

130
120
110
N 100 " u ;;; 90
"' 0 so z " 0 70 "-� 60 "' "' w "' 50 >-"' "' 4 0
"' w 30 " "' 20
10
N " u � ' "' 0 z " 0 eo f-"' "' w "' >-"' "' "' w " "'
o 'b 0 0
BLUEGRASS PARKWAY
STATION 2318 + 09 , �
3 H-7 S - 5
2 H-7 S 5A
EASTERN APPROACI-l FOUNDATION SOILS (TOP OF LAYER)
0
0 . 2
9 0
BLUEGRASS PARKWAY
HOLE 7 SAMPLE 5
HOLE SAMPLE 5A HOLE SAMPLE 58
0 . 3 0 4 0.5
HORIZONTAL DEFLECTION (INCHES)
EASTERN APPROACH FOUNDATION SOILS (BOTTOM OF LAYER)
DIRECT SHEAR TEST (CONSOLIDATED - DRAINED)
80 STATION 2318 + 2 7 , rt_ HOLE 3 SAMPLE 6
DEPTH 52 - 54 FEET
70
60
50
4 0
K-7 s - ss
0.6
H - 7 S - 6 8
H · · 7 S - 6A
30
20
10
0 1 0_2 0 3
HORIZONTAL DEFL ECTION
0.4
(INCHES)
Figure 24. (Continued)
K - 7 s- 6
0.5 0.6
0.7
23
2 4
'"
N I u � ' m '" 0 z 0 0 "
f-" m m w " e m " " " w I m
'"
N-I u • '" m 0 z 0 0 ;o "
f-_ m m w " r " m " " w I m
BLUEGR�SS P��KWAY EASTERN BRIDGE APPROACH EMBANKMENT SOILS OtRECT SHEAR TEST , CONSOLWATE!J - DRAINED 0 Jip • 28 2 ° Cp • O PSI
D ifR • 2 5 3 ° CR ' O PSI TRIAXIAL TEST , CONSOUOATED - UNDRAINED ff" • 26 2 ° • 0
- o 4899 G
H - 4 � - I
K - 3 5 - J
EFFECTIVE NORMAL STRESS , �. (POUNDS / INCH2J
BLUEGRASS PARKWAY EASTERN APPROACH FOUNDATION SOILS (TOP OF LAYER) DIRECT SHEAR TEST (GONSOLIOAT E O - DRAINED) 0 Jip • 27 ° Cp • 2 23 PSI
Cl ,£)R ' 22 6° CR ' 0 PSI TRlAXIAL TEST (GONS\lL.IDATED - UNDRAtNF.!J) ;;f' 22° C ' 2.53 PSI
100 150 EFFECTIVE NORMAL STRESS , (J, {POUNDS / INCH2J
N I u �
' " BLUEGRASS PARKWAY
EASTERN APPROACH FOUNDATION SOILS (BOTTOM Of LAYER!
'"
' DIRECT SHEAR TESTS, CONSOLI DATED- ORAINEO' ) H - I S - 6 B
m D z 0 0 ;o
F-" "
m m w " r m " " w I m
0 0
Q ifp ' 31.1° Cp' 0.75 PSI
0 fR • 292° CR ' 052 PSI
TRIAXIAL TESTS, CONSOLIDATED
- if ' 23,1°
' �-260+ 0.4265 0'
50 roo rso
EFFECTIVE NORMAL STRESS , 0", (POUNDS / INCH2 )
'"
Figure 25. Comparison of Mohr's Failure Envelopes Obtained from CIU and CDS Tests.
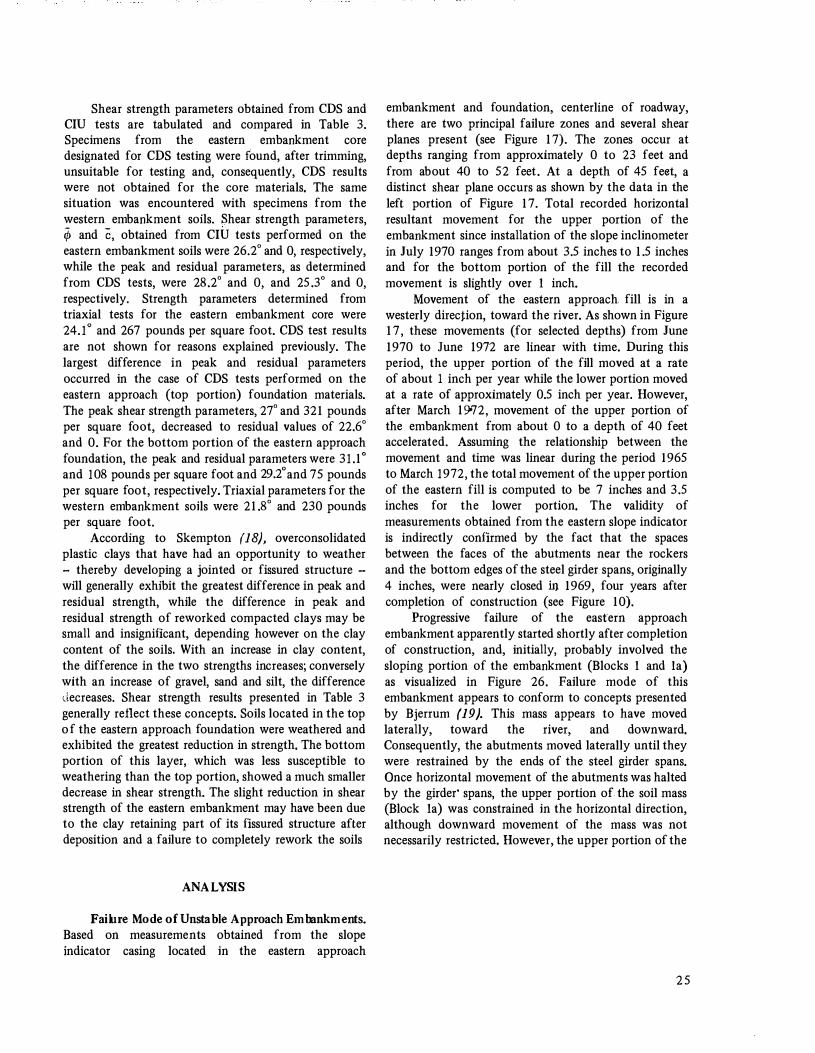
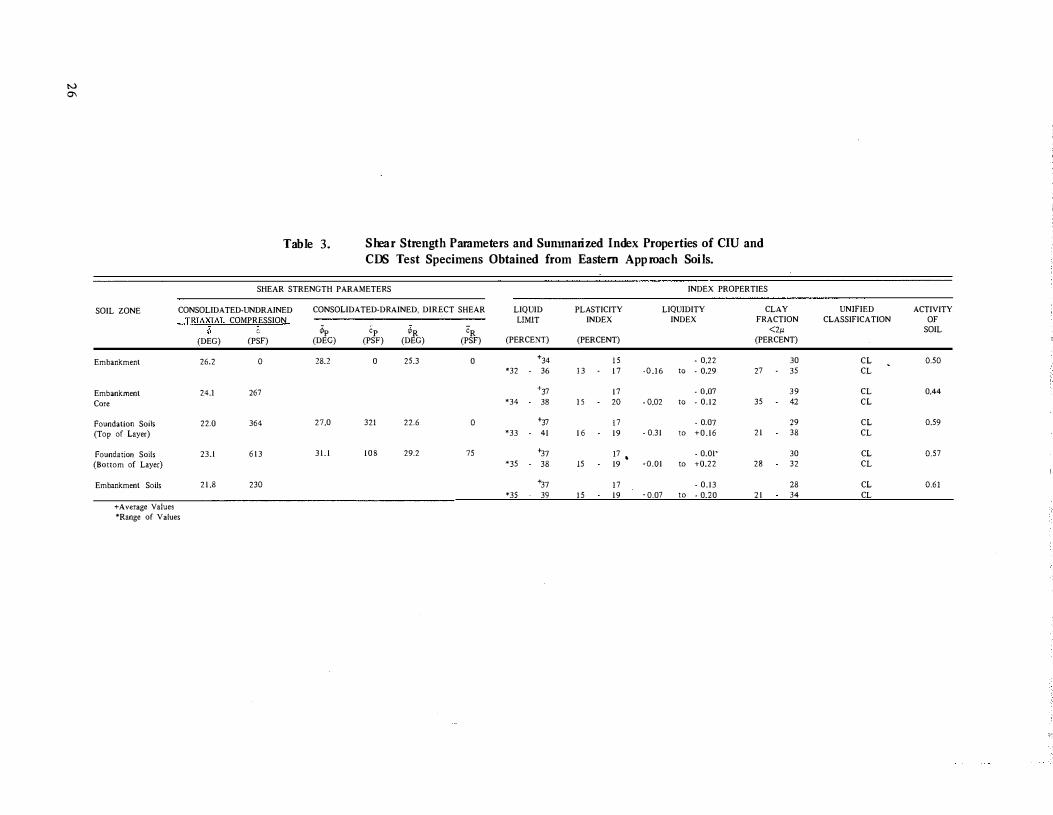
Shear strength parameters obtained from CDS and CIU tests are tabulated and compared in Table 3. Specimens from the eastern embankment core designated for CDS testing were found, after trimming, unsuitable for testing and, consequently, CDS results were not obtained for the core materials. The same situation was encountered with specimens from the western embankment soils. Shear strength parameters, if, and c, obtained from CIU tests performed on the eastern embankment soils were 26.2° and 0, respectively, while the peak and residual parameters, as determined from CDS tests, were 28.2° and 0, and 25.3° and 0, respectively. Strength parameters determined from triaxial tests for the eastern embankment core were 24.1 o and 267 pounds per square foot. CDS test results are not shown for reasons explained previously. The largest difference in peak and residual parameters occurred in the case of CDS tests performed on the eastern approach (top portion) foundation materials. The peak shear strength parameters, 27° and 321 pounds per square foot, decreased to residual values of 22.6° and 0. For the bottom portion of the eastern approach foundation, the peak and residual parameters were 31.1 o and 108 pounds per square foot and 29.2o and 75 pounds per square foot, respectively. Triaxial parameters for the western embankment soils were 21.8° and 230 pounds per square foot.
According to Skempton ( 18 ), overconsolidated plastic clays that have had an opportunity to weather - thereby developing a jointed or fissured structure -·
will generally exhibit the greatest difference in peak and residual strength, while the difference in peak and residual strength of reworked compacted clays may be small and insignificant, depending however on the clay content of the soils. With an increase in clay content, the difference in the two strengths increases; conversely with an increase of gravel, sand and silt, the difference decreases. Shear strength results presented in Table 3 generally reflect these concepts. Soils located in the top of the eastern approach foundation were weathered and exhibited the greatest reduction in strength. The bottom portion of this layer, which was less susceptible to weathering than the top portion, showed a much smaller decrease in shear strength. The slight reduction in shear strength of the eastern embankment may have been due to the clay retaining part of its fissured structure after deposition and a failure to completely rework the soils
ANALYSIS
Failure Mode of Unstable Approach Embankments. Based on measurements obtained from the slope indicator casing located in the eastern approach
embankment and foundation, centerline of roadway, there are two principal failure zones and several shear planes present (see Figure 17). The zones occur at depths ranging from approximately 0 to 23 feet and from about 40 to 52 feet. At a depth of 45 feet, a distinct shear plane occurs as shown by the data in the left portion of Figure 17. Total recorded horizontal resultant movement for the upper portion of the embankment since installation of the slope inclinometer in July 1970 ranges from about 3.5 inches to 1.5 inches and for the bottom portion of the fill the recorded movement is slightly over I inch.
Movement of the eastern approach. fill is in a westerly direction, toward the river. As shown in Figure 17, these movements (for selected depths) from June 1970 to June 1972 are linear with time. During this period, the upper portion of the fill moved at a rate of about I inch per year while the lower portion moved at a rate of approximately 0.5 inch per year. However, after March 19'72, movement of the upper portion of the embankment from about 0 to a depth of 40 feet accelerated. Assuming the relationship between the movement and time was linear during the period 1965 to March 1972, the total movement of the upper portion of the eastern fill is computed to be 7 inches and 3.5 inches for the lower portion. The validity of measurements obtained from the eastern slope indicator is indirectly confirmed by the fact that the spaces between the faces of the abutments near the rockers and the bottom edges of the steel girder spans, originally 4 inches, were nearly closed in 1969, four years after completion of construction (see Figure 10).
Progressive failure of the eastern approach embankment apparently started shortly after completion of construction, and, initially, probably involved the sloping portion of the embankment (Blocks I and Ia) as visualized in Figure 26. Failure mode of this embankment appears to conform to concepts presented by Bjerrum ( 19 ). This mass appears to have moved laterally, toward the river, and downward. Consequently, the abutments moved laterally until they were restrained by the ends of the steel girder spans. Once horizontal movement of the abutments was halted by the girder· spans, the upper portion of the soil mass (Block Ia) was constrained in the horizontal direction, although downward movement of the mass was not necessarily restricted. However, the upper portion of the
2 5
N "'
T able 3. Shear Strength Parameters and Sunnnarized Index Properties of CIU and CDS Test Specimens Obtained from Eastern Approach Soils.
SHEAR STRENGTH PARAMETERS INDEX PROPERTIES
SOIL ZONE CONSOLIDATED-UNDRAINED
Embankment
Embankment Core
Foundation Soils (Top of Layer)
Foundation Soils (Bottom of Layer)
Embankment Soils
+Average Values *Range of Values
TRIAXIAL COMPRESSION
¢ c (DEG) (PSF)
26.2 0
24.1 267
22.0 364
23.1 6 1 3
21 .8 230
CONSOLIDATED-DRAINED, DIRECT SHEAR
¢p 'P 'R 'R (DEC) (PSF) (DEG) (PSF)
28.2 0 25.3 0
27.0 321 22.6 0
3 1 . 1 1 0 8 29.2 75
LIQUID PLASTICITY LIQUIDITY CLAY LIMIT INDEX INDEX FRACTION
<2M (PERCE�-H) (PERCENT) (PERCENT)
'34 J 5 - 0.22 30 *32 36 1 3 1 7 -0.16 " - 0.29 27 35
'37 17 - om 39 '34 38 1 5 20 - 0.02 " - 0.12 35 42
'37 17 - 0.07 29 '33 41 1 6 19 - 0.31 '" +0.16 21 38
'37 17 • - 0.01' 30 '35 38 15 19 -O.Dl '" +0.22 28 32
'37 17 - 0.13 28 '35 39 15 19 - 0.07 '" - 0.20 2 1 34
UNIFIED ACTIVITY CLASSIFICATION OF
SOIL
CL 0.50 CL
CL 0.44 CL
CL 0.59 CL
CL 0.57 CL
CL 0.61 CL

N __,
= .... "' .§§.Q_ UJ ...
ji§Q_ z '? MQ .... � ..6.ZQ. "' ..J "' _.6.Q.Q.
·WESTERN APPROACH
·;._..:___: __ ..;_=__:- PAVE ME NT CRACKS r APPROACH SETTLEMENT \BLOC� \ SlOf>E I N D ICATOR
SHEAR ZONES
2 3 1 4
BENCHING
I 2 3 1 5
BLOCK @ BLOCK CD
Figure 26.
2 3 1 5+649.2.
CHAPLIN R I V E R
.... _ _ _ _ _ _ _ _ _ _ _ _
I 2 3 1 6
P I E R
2 3 1 6 +942!1
' I 2 3 1 7
STATION NUMBER
EASTERN APPROACH
I 2 3 1 8
A P P ROACH SETTLEMENT
I 2 3 1 9
Visualized Failure Patterns of the Approach Embankments.
lQQ_
.2J!Q_
.6.0Q_
.HQ_
Ji<.Q_
_§QQ.

fill located between the abutments (part of Block Ia) and the portion of the fill located in front of the abutments (Block I ) continued to move laterally and downward. Evidence of this is,indicated in Figure I I . The present groundline around the wingwalls and abutments is located several inches below the original groundline. With a release of the first block of soil in front of the abutments, a second block gradually developed as depicted in Figure 26. Existence and development of a second failure mass is strongly indicated by the appearance in early 1972 of transverse pavement cracks located approximately 75 feet behind the abutment and by slope indicator data (see Figures 1 2 and 17).
Shear stresses along the leading edges of each of the failure masses were apparently greater than the peak strengths of the soils· in those zones. The condition was largely fostered by the intrusion of groundwater into the bottom portion of the embankment. With a rise in the water table and an increase in pore pressures, shear strengths of the soils decreased. Additionally, the availability of water also may have resulted in an increase in shear stresses above those normally induced by the force of gravity. These supplementary shear stresses can be caused • by the tendency of over-consolidated plastic clays, such as located in the bottom portion of the fill at this site, to swell or expand in the presence of water. This tendency to expand would, in effect, induce lateral stresses parallel to the foundation. With downward and outward movement of Block 1 , lateral stresses between the two blocks gradually decreased, mobilizing resistance of the battered piles and the shear strength of the soils along the second plane of failure (Block 2). The accelerated movements of the embankment observed after March 1972 and the observed pavement cracks at about the same time indicate the yield stress of the steel plies may have been reached. Consequently, stability of the eastern approach embankment is precarious, and complete failure of the embankment, piles and abutment is a likely possibility.
The failure mode of the western approach embankment is similar in ahnost every respect to the failure pattern, as described above, of the eastern approach embankment. However, in the former case, the failure pattern was more explicit and developed at a faster rate. Progressive failure apparently began hnmediately after construction and has continued. Referring to Figure 26, the front portion of the embankment, Block I , completely failed in early 1969, some four years after construction, moving downward and outward toward the river and exposing, initially, about 5 feet of the battered piles of the westbound, west abutment (see Figure 6). Complete failure of the
2 8
soil mass between the abutments (a portion of Block I a), which contained the upper portion of the slope indicator casing, was delayed partly perhaps by the effect of arching between the abutments until mid-1972. The recorded movement of that mass from mid-1970 to mid-1972 was about 9 inches (Figure 18). From mid-1970 to mid-1971, the mass moved at a rate of about 0.5 inch per year; after mid-197 1 , the movements accelerated and in August 1972 the mass collapsed. Assuming a linear relationship between movement and time for the period mid-1965 to mid-1969, the computed total movement of Block Ia located behind the abutments was 2 inches.
With the downward and outward movement of Block I , lateral stresses between Blocks I and 2 gradually decreased, mobilizing the shear strength of soils along the leading edges of Block 2 and the resistance of the battered piles. Consequently, the active thrust of Blocks 2 and Ia and the piles was large enough to push the bottom of the abutments near the rockers against the steel girder spans - an event which occurred during the period 1965 to 1969. Once the abutments contacted the ends of the bridge girder spans, portions of Block l a were constrained to some extent in a horizontal and vertical direction by the piles and abutments. However, slope indicator data and the appearance of pavement, shoulder, and ground cracks indicate that failure of Block 2 is in progress. Slope indicator data show that a distinct failure zone has developed at a depth of above 22 feet, near the rock line. Block 2 is moving at a rate of about 0.3 inch per year. Hence, stability of the western approach , embankment is extremely precarious.
Stability Analysis of Constructed Embankments. Slope stability of the bridge approach embankments was analyzed using the simplified version of Bishop's method of slices (20 ). Slope stability computations were based on effective stress methods. Bjerrum (21) and Sevaldson (23) have shown that the application of total stress methods to long-term stability of existing slopes is invalid. The accuracy and justifiable use of the Bishop approach in slope stability problems has been well documented and established (21, 22, 23). Equations of the shnplified Bishop method and the general equations necessary to describe the geometry of a given slope were programmed for the 370 IBM computer in order to investigate rapidly practically all avenues of failure in a given slope problem and so that the minhnum ·safety factor and the most critical failure circle could be obtained from a grid type, search operation. Accuracy of the computer program was verified by comparing safety factors obtained by others ( 16, 22) with safety factors obtained from the computer program. Additionally, safety factors determined from hand

computations of several slope stability example problems were found to be the same as those obtained from the computer program.
Efforts to determine the short-term and long-term stability of the constructed approach embankments were influenced and complicated by three factors and involved certain simplifying assumptions. The first factor involved the treatment in the analyses of the influence of the external resisting forces due to the soil-abutment-bridge girder spans interaction, piles, and piers on the stability of the approach embankments. Inclusion of these forces in the analyses would have required an extension of the Bishop equations and the computer program. Furthermore, an accurate determination of these forces appeared formidable. Consequently, by ignoring these forces, the stability analyses were simplified. Therefore, safety factors computed on the basis of this simplifying assumption represented minimum values; that is, the actual safety factors were indeterminately higher.
The second factor influencing the results of the stability analyses involved an accurate determination of pore pressures and an assessment of their effect on the shear strength of soils located in the approach embankments and foundations. Accurate determinations of the short-term stabllity of the embankments were not made because the initial foundation pore pressures were unknown. No attempt was made to estimate these pore pressures. Nor was an attempt made to evaluate the short-term stability of the embankments based on a total stre·� analysis using undrained strength, Cu, since the initial strength of the foundation materials were
unknown. However, an upper bound of short-term safety factors was determined based on the assumption that seepage lines at each approach were located initially in the lower portion of each approach foundation. Hence, in these computations excess hydrostatic pore pressures were ignored; resulting values of short-term safety factors gave some indication of the short-term stability of the embankments. Furthermore, the results also were useful in assessing benefits that might be derived from lowering the water table.
Long-term stability of the embankments was determined using pore pressures obtained from flow nets. Seepage lines at each embankment were established from the highest observed water table elevations occurring during a two-year period. In performing the long-term analyses, excess pore pressures due to foundation consolidation were assumed to have disappeared, and pore pressures corresponding to the highest observed seepage lines were used. Changes in the highest observed seepage lines were assumed to be limited to relatively small seasonal variations; that is, these seepage lines were assumed to be in a state of equilibrium.
The third factor having a great effect on the slope stability results involved a proper selection of shear strength parameters. Four different cases of shear strength were used in analyzing the eastern approach embankment; two of those cases were used in the western approach embankment analyses. The various effective stress parameters (apparent values) and the shear strength cases considered in the analyses are tabulated in Table 4. Case I and 2 strength parameters
Table 4. Strength Parameters and Shear Strength Cases Considered in Stability Analyses of Approach Embankments.
1 SLOPE SOIL PEAK (ClUj
c � (PSF) (DEG)
Embankment r, = 129 PCF 0 26.2
Core r, = 129 PCF 267.3 24.1
Eastern Top Foundation 'Yt = 129 PCF 364.3 22
Bot.. Foundation 'Yt =
' 129 PCF 613.4 23
Western Embankment 7t = 130 PCF 230 21 .8
Eastern & Rock Berm Western 'Yt = 130 PCF 0 35
CASE NUMBER
2 PEAK (CDS)
' ifi (PSF) (DEG)
0 28.2
0 28.2
364.3 27
108 31.1
3 BJlSlDUAL (CDS)
c iP (PSF) (DEG)
0 25.3
0 25.3
0 22.6
75 29.2
4 c - O (C!!.ll ' ifi
(PSF) (DEG)
0 26.2
0 24.1
0 22
0 23
0 21.8
29
represent peak shear strengths observed in the CIU and CDS tests, respectively, while Case 3 parameters represent residual shear strength determined from the CDS tests. Case 4 parameters were obtained from the CIU tests, but the cohesive values determined in those tests were set equal to zero. The primary purpose of using peak and residual shear strengths was to obtain a bound of maximum and minimum values of safety factors that may exist at the site today, considering that present values of true cohesion and internal angles of friction ( cf. 16) of soils in the shear zones may not necessarily be the same as those determined by tests, and also considering that portions of the slip planes may contain soils having peak strengths while other portions may consist of soils having residual soils. Another objective was to compare safety factors obtained using Case I strength data with those determined from Case 2 strengths and to make comparisons of safety factors determined on the basis of Case 3 and 4 shear strengths.
Long-term safety factors of the approach embankments based on the highest observed pore pressures and the different cases of shear strength are presented in Figure 27. Critical failure circles corresponding to those safety factors are compared graphically in that figure with slope indicator data and the failure profile of the slump located in the front portion of the western approach embankment. At both embankments and for all cases of shear strehgth considered in the analyses, the long-term safety factors ai'e near or below a value of 1 .0, and the corresponding critical circles pass slightly under the abutments near the uppermost shear zones detected by the slope indicator. Long-term safety factors based on peak strengths (Case I , CIU strength, and Case 2, CDS strength) of the eastern slope are slightly below 1.0 and have values of 0.95 and 0.91, respectively. Safety factors associated with Case 3 (residual strength) and Case 4 ( c = 0) of the later slope were approximately the same and have values of 0.75 and 0.68, respectively. Based on peak strength {Case 1), the long-term safety factor of the western slope is 1.03; for Case 4 strength, the safety factor is 0.73. Both critical failure circles corresponding to these safety factors pass near failure points of the existing profile of the western slope.
In the series of analyses shown in Figure 28, seepage lines were lowered and assumed io be located near the rock line under each approach soil mass. The safety factors shown represent conservative estimates of the initial stability of the approach slopes. Safety factors of the eastern slope ranged from about 0.96 (peak strength) to 0.78 (residual strength); for the western slope, they ranged from 1 .06 to 0.75. Results of these analyses are about the same as those shown in Figure 27; the safety factors are only slightly higher. Hence,
3 0
lowering the water table has little effect on the stability of the front port(ons of the approach embankments.,
The analyses shown in Figures 28 and 29 were performed to determine the stability of the slopes for failure circles passing near the pavement cracks and the lower shear zones detected by the slope indicators. At the western approach, the circles also passed near the indicated failure point located near the toe of the slump. Safety factors of the eastern slope based on the high water �able (Figure 29) ranged from 1.27 to 0.90, and for the lower seepage line, the safety factors varied between 1 .48 and 1 .07 (Figure 30). Safety factors of the western slope were approximately the same for a given shear strength and for both considered positions of the water table. Using peak strength, the safety factors were 1 .17 and 1.21 for the high and low water tables, respectively. Safety factors of the slope-based on Case 4 shear strength were 0.86 for a higli �water table and 0.90 for the low water table. With regard to the deeper failure circles and a lowering of the water table, stability of the eastern slope would improve moderately; for the western slope, the stability would increase only slightly.
Remedial Stability Analysis. Three different schemes were investigated for purposes of dev�loping a remedial solution that would improv'e the present stability of the approach slopes and likely prevent failure. As shown in Figure 3 1 , benefits of using lightweight material, such as cinders, were investigated. The material was assumed to have a ¢ of 35" and a unit weight of 70 pounds per cubic foot. To determine the maximum benefits of such a plan, the entire fill located behind the abutments was replaced with the lightweight material. Circles passing slightly under the abutments were critical; safety factors of these cirCles were compared with circles previously obtained using the fill material. These results show the safety factors . of the front portion of the slopes are increased slightly (about 0.03 for the western slope and 0.08 for the eastern slope). However, a more' significant gain in stability is achieved when failure circles passing through the lower shear zones and near the pavement cracks are considered. The gain in safety factor is 0.15 for the eastern slope and 0.08 for the western slope. Peak strengths were used in all analyses shown in Figure 3 1 .
The gain in stability, if the bridges were extended and the backfill behind the bridge abutments were excavated leaving a void space, is shown in Figure 32. For the critical circles passing slightly under the abutments, the safety factor gain is 0.12 for the eastern slope and 0.07 for the western slope. For the deeper circles, the increases are 0.07 (eastern slope) and 0.25 (western slope).

w �
_zQQ_ -.... "" ..§§Q_ "' IL
..§§Q_ z � 640 .... .. > .f>2Q_ w --' UJ _2QQ_
W E S T E R N A P P R O AC H CASE I , F S. = I . 0 3 CASE 4 , F. S. = 0.73
Pli\I<OM""�IT /\�lr'l SLOPE IND ICATOR
CASE 3 , F.S. = 0 . 7 5
CASE 4 , F. S. = 0.68 CASE I , F S = 0. 9 5 CASE 2 , F.S = 0 9 1
CASE I (CTi] PEAK STRENGTH)
CASE 2 ( C D S PEAK STRENGTH ) CASE 3 (CDS RESIDUAL STRENGTH)
CASE 4 {Ci"iJ STRENGTH, C = 0 )
E A S T E R N A PPROACH
IND I CATOR
1QQ_
.2.ll.ll.
ORIGIN�y�r::CONSTRUCTEO SLOPE \ lsruoGE I
"' .2.§.Q_
GROUND --.. . r FAILED SLOPE
SHEAR ZONES
BENCHING
2 3 1 5 + 642!i!
2314 2315
CHAPLIN R I V E R NORMAL
POOL ' - - - - - ----=-·- - --=
I 2 3 1 6
P I E R
2 3 1 6 + 94QQ
' I 2 3 1 7
STAnON N U M B E R
I 2 3 1 8
Figure 27. Long-term Stability Results Based on Highest Observed Seepage Lines.
I 2 3 1 9
W E S T E R N A P P ROACH E A S T E R N A P PROACH CASE I , F S = 1 .06 CASE 4, F S =·0.75
SLOPE IND ICATOR / CASE 4 , F S = 0. 7 8 SLOPE IND ICATOR
------��----o-" .. =-�ct--n)BRIDGEf /'/ /
/ SHEAR ZONES
2 3 ! 4 23 1 5
Figure 28.
2 3 1 5 + 64Q2 l
2 3 1 6
NORMAL POOL
- - _ ;;:-PIER
2 3 1 6 + 94£2
' I 2 3 1 7
STATION N U M B E R
I 2 3 1 8
Conservative Estimates of the Short-term Stability of Approach Slopes Assuming Position of Watertable is Near Rock line.
- CiRO�.£. ·- - -.,.----::-::- -"'"""" '""" '��
2 3 1 9
.lclll.
�
.§QQ_
1QQ_
.2.ll.ll.
Q.§Q_
.lclll.
�
.§QQ_

w N
= ,._ "' _§!lQ. w u_
.MQ z � 640 ,._ " > _o_2Q_ UJ ..J UJ _2QQ_
= ,._ "' _§!lQ. UJ u_
.MQ z � 640 ,._
;:: _o_.aQ_ "' -' "' _2QQ_
W E S T E R N APPROACH
2 3 1 4 2 3 1 5
Figure 29.
C A S E 2 , F.S. = 1 . 2 7
C A S E 4 , F. S_ = 0.90 E A S T E R N A P PROACH
2 3 1 5 +64QQ
BREAK
C H A P L I N R I V E R
--- - - - - -
2 3 1 6
C A S E I , F.S. = 1 . 1 9
C A S E 3 , F.S : 0 . 9 5
P I E R
2 3 1 6 + 94Q.Q
' I 2 3 1 7
STA T ION N U M B E R
SLOPE I N D I CATOR
I 2 3 1 8
Long-term Stability Results B ased on Highest Observed Seepage Lines and Failnre Circles Passing tbrougb Lower Shear Zones D etected by Slop e Indicators and near Pavement Cracks.
PAVEMENT CRACKS
2 3 1 9
W E S T E R N A P P ROACH E A S T E R N A P P ROACH
2 3 1 4
CASE I F. S • 1.21 CASE 4 FS ' 0.90
CASE F:S ' 1.37 CASE 3 F'S = 1.14
CASE 2 FS_ • 1.49
CASE 4 �S ' L07
SLOPE INDICATOR F A I L E D SLOPE
CONSTRUCTED // / PROBABLE BREAK
��,: 1\r '""' " I .SLOPE
PAVEMENT CRACKS
I N D I C ATOR /
y --�� R I V E R
I 2315
Fignre 30.
�-
2 3 1 5+64QQ
- - - - - - - - -
I 2 3 1 6
,
P I E R
2 3 1 6 + 94Q.Q
' I 2 3 1 7
STA T ION N U M B E R
I 2 3 1 8
Stability of Approach Slop es B ased o n Lowered Seepag e Lines and Failure Circles Passing tbrougb Lower Shear Z ones D etected b y Slop e Indicators and near Pavement Cracks.
2 3 1 9
700
.QJ!Q_
.2.§Q_
1iN
=
600
1QQ_
.liJlQ_
.2.§Q_
1iN
=
_§QQ_

w w
_LQQ_ 1-.... .§all. "' "-
.§all. z � MQ 1-
� .tiZQ. "' ...J "' _§QQ.
= 1-"' .§all. "' "-
_2§Q. z � 640 1-
� .tiZQ. UJ ...J "' _§QQ.
W E S T E R N A P P R O A C H
E XCAVATION LIMITS
BENCHING
2 3 1 4 I
2315
E A S T E R N A PPROACH CASE I FS " LOG W/LIGHTWEIGIH FILL i':S. • 1.0� W/0 LIGHTWEIGHT
CASE 2 ES, ' 1.1� W/LIGHTWEIGHT FILL
CASE I F.S. ' 1.2.5 W/LIGIHWEIGHT FILL F.S. ' 1.17 W/0 LIGHTWEIGIH FILL
F.S. 1.05 W/0 LIGHTWEIGHT FILL
PROBABLE BREA�
CASE 2 I'S ' 1.42 W/LIGHTWEIGHT FILL F.S. ' 1.27 W/0 LIGHTWEIGHT FILL
2315+640£1
CHAPLIN RIVER
..... _ _ _ _ _ _ _
I 2 3 1 6
PIER
2 3 1 6 + 9422 ' I
2 3 1 7
STA T I O N N U M B E R
SLOPE INOI CATOR
I 2 3 1 8
EXCAVAT ION LIMITS
I 2 3 1 9
=-
2.\l.
2.\l.
�
.2.ZQ.
_§QQ.
Figure 31. Stability Results Using Lightweight Aggregate Fill.
W E S T E R N APPROACH
SlOPE INDICATOR
2 3 1 4 2315
CASE I F S ' 1.10 W/VOIO F.S ' 1 0� W/0 VOID
CASE I F.S ' 42 W/VOID FS • I 17 W/D VOID
PROBA.BLE BREAK
CHAPLIN RIVER
-.;o-_ _ _ _ _ _ _
231 5+641l2
2 3 1 6
CASE 2 F.S_ • 1,17 W/VOIO FS_ ' 1.05 W/0 VOID
CASE 2 FS. • 1.34 W/VOIO �S I 27 W/0 VOID
PIER
2 3 1 6 + 942!1 ' I
2 3 1 7
STATION N U M B E R
E A S T E R N APPROACH
=-
SLOPE INDI CATOR 2.\l.
I 2 3 1 8
.2§Q_ Q
- - � ouN..Q - -/ -------;;;::. GJ'- -------� J)o'G'�::.:------
.2.Z.Q_
I 2 3 1 9
_§QQ.
Figure 32. Stability Results Using Unloading and Bridge Extension Scheme.
In the third remedial scheme, several berm, slope, different shear strength situations, and water table configurations were considered as shown in Figures 33 through 35. However, construction of berms or sTope changes at the site may seriously constrict the flow of Chaplin River. Furthermore, whether such berms or slope changes could withstand forces due to the large velocities of the river flow is questionable. Hence, hydraulic changes in the river channel due to such construction should be investigated. As shown in.Figure 33, decreasing the slopes to 2.25 horizontal to 1 .0 vertical is about the maximum slope decrease that might be tolerated without seriously constricting the channeL Based on peak strength and observed pore pressures, the safety factors are l . l 8 (western slope) and 1 . 39 (eastern slope), Materials of the slope berms were assumed to be sound rock and to have a ;p of 35°, Comparative values based on residual strengths is 1,01 and L l l , respectively, The uppermost circles passing through the slopes indicate the portions of the slopes would be stable, Safety factors for those circles are based on the lower shear strengths
In Figure 35, the effect of rapid drawdown was investigated. Normal flow depth conditions were assumed to exist and a computerized solution of Manning's equation was used to obtain approximate values of flow depths. Computations were based on 50-year flood data. As shown in Figure 35, rapid drawdown lowers the safety factor from L 1 8 to 0.95 (western slope) and from 1.39 to 1 .05 (eastern slope). Peak strength data were used in the latter analysis. Hence, for rapid drawdown and a 50-year flood, the analysis shows the change in slopes would be inadequate and constructiort of the sloping berms involves a calculated risk.
From a viewpoint of soil mechanics, the berms shown in Figure 34 are more desirable than the slope changes of Figure 33. Based on peak strength, safety factors are 1 .43 for the western slope and 1 .41 for the eastern slope. Comparative values based on lower shear strengths are 1 .21 and 1.26. If rapid drawdown is considered, comparative values based on the higher shear strengths are 1 . 1 1 and 1 .24. However, the berms would largely restrict the flow of Chaplin River, and from a hydraulics standpoint may be objectionable.
CONCLUSIONS
Stability of the eastern and western bridge approach slopes is precarious. Slope indicator data and results of slope stability analyses and surface observations show that eventual failure of the approach embankments, piles, and abutments is a likely
3 4
possibility. Slope indicator data show both embankments are moving and that shear zones are located in the upper and lower portions of each embankment. Movements of the eastern embankments have accelerated, indicating the yield stress of the piles supporting the eastern abutments may have been reached.
Slope stability analyses of the slopes, as constructed, show the front portions of each approach embankment have been near failure since construction. Based on peak strength data, safety factors of the front portions of the eastern and western slopes were 0.95 and 1 .03, respectively. Failure of a portion of the embankment located in the front of the western abutments corroborates results of the stability computations. This failure was a �esult of a gradual (time·conditioned) decrease in shear strength of the approach soils. The slope failed as the shear strength dropped from peak to residual values. Safety factors of the front portions of both embankments computed on the basis of residual strength (and CIU strength with c equal to zero) ranged from 0.68 to 0.75, some 25 percent below 1 .0.
The lower shear zones detected by the slope indicators, the fact that the embankments are continuing to move as recorded by the slope indicators, and the appearance of pavement cracks located several feet behind each abutment strongly indicate that progressive failure of the embankments is spreading. Safety factors determined for failure circles passing through the cracks and the lower shear zones at the eastern and western embankments were 1 .27 and 1 . 1 7 (peak strength) and 0.90 and 0.86 (residual strength). Therefore, the analyses indicate the larger soil masses may eventually fail once the soils reach residual strength values. The time of failure cannot be predicted; however, the appearance of cracks indicates it may be imminent. These analyses did not consider external forces due to the piles and abutment-bridge interaction. However, it is questionable whether such forces are sufficient to prevent the larger failures:

w V>
= -,__ UJ .2.Q. "' "-
_li2.Q. z � ..§.iQ. ,__ ;; � "' -' UJ ..2QQ_
= ,__ "' .2.Q. w "-
_li2.Q. z � 640 ,__ <( > � "' -' w ..2QQ_
C A S E 4 FS • I .6
W E S T E R N A P P ROACH
SLOPE I N D I C ATOR
2 3 1 4 2 3 1 5
Figure 33.
W E S T E R N A P P R O A C H
SLOPE I N D I C A T O R
2 3 1 4 2315
Figure 34.
CASE 3 FS • I 2 5 I "'' . " , ,,
CASE I
\ E A S T E R N APPROACH
FS ' l iS
2 3 1 5+64Q.Q I
2 3 1 6
CHAPLIN R IVER
CASE 2 F S "' CASE � FS
P I E R
2 3 1 6 +94f!..2
' I 2 3 1 7
STATION N U M B E R
I \ I
SLOPE I N D I CATOR
I 2 3 1 8
Stability Results Using Slope Changes and Highest Observed Seepage Lines.
2 3 1 9
E A S T E R N A PPROACH CASE 4 F S ' I 2 J
23l 5 + 64Q..!!
Q
2 3 1 6
CASE 3 FS_ ' I 26
P I E R
2 3 1 6 + 9 42..2
' I 2 3 1 7
STA T I O N N U M B E R
SLOPE I N D I C ATOR
I 2 3 1 8
Stability Resu lts Using B enns and Highest Observed Seepage Lines.
2 3 1 9
lQQ_
&Jl.Q_
liQ_
_fd.Q_
=
_§QQ_
lQQ_
J&Q_
liQ_
_fd.Q_
=
600
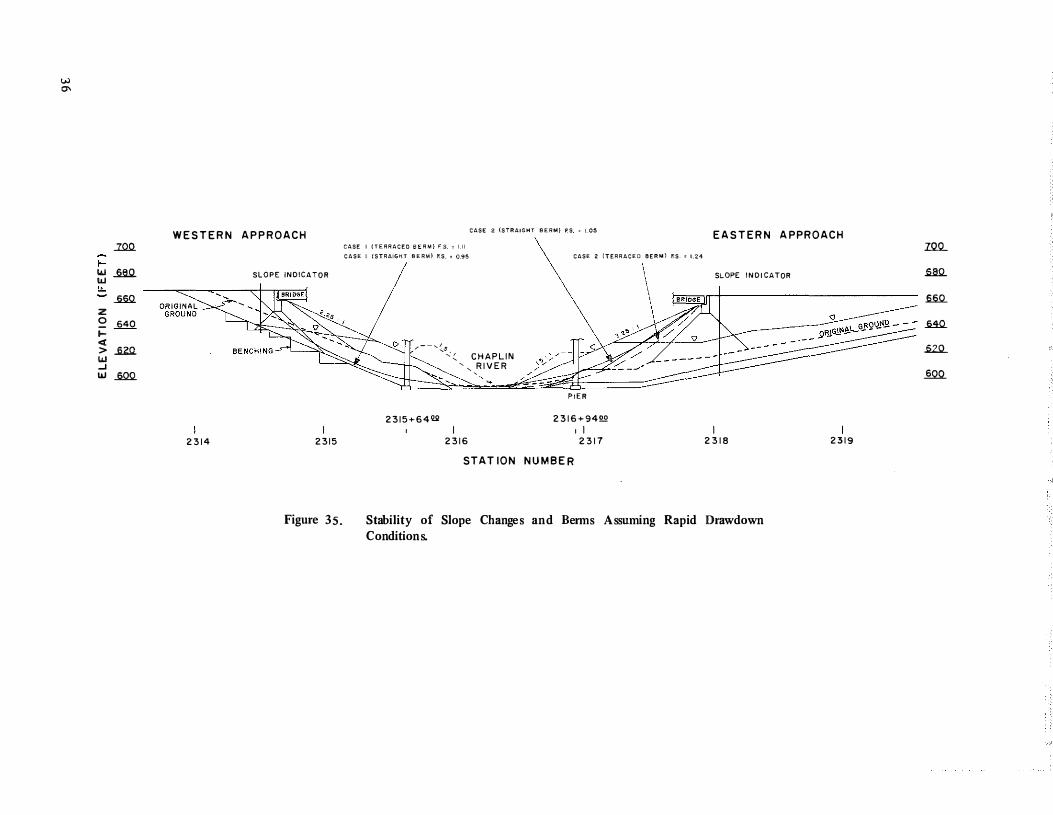
"' "'
_IQQ_ .... "' ..2aQ. "' "-
..2aQ. z � 640 .... .. > ..o.w. ..... ..J w JiQQ_
W E S T E R N A P P ROACH
2 3 1 4
SLOPE INDICATOR
I 2315
Figure 35.
CASE 2 (STRAIGHT BERM) �S ' 1.05 E A S T E R N A PPROACH
CASE I (TERRACEO B E R M ) F s � 1 . 1 1
CASE I (STRAIGKT B E R M ) f:S. ' O.SS
,--,<,.
2 3 1 5 + 6 4 Q.Q
' � CHAPLIN ' , .,.R I V E R
I 2 3 1 6
CASE 2 (TERRACED B E R M ) f:S. ' 1.24
P I E R
2 3 1 6 + 94!1..2 ' I
2 3 1 7
STAT ION N U M B E R
SLOPE I N D I CATOR
I 2 3 1 8
Stability of Slope Changes and B erms Assnming Rapid D rawdown Conditions.
2 3 1 9
1QQ_
JillQ_
JillQ_
�
.2ZlL
JiQQ_

Settlement of the bridge approaches and the tilting of the abutments at this site were a result of embankment instability. Analyses showed that the most critical failure circles pass slightly under the bottoms of the bridge abutments and near the toe of the embankment. Stability analyses indicate this region of the approach embankments is the most vulnerable to movement and failure. Previous studies (3. 4} have shown that approach settlement is generally confined to a distance of 100 feet behind the abutments; maximum settlement is normally located at a distance ranging from !5 to 50 feet behind the abutment -· a point on the pavement, as shown in Figure 27, where the critical failure circle tends to intersect the ground surface and a region of the pavement which receives the most maintenance. Soils located in the approach embankments and foundations at the Chaplin River site are typical of materials commonly found at many bridge sites in Kentucky. Hence, embankment instability is considered a significant factor causing settlement of bridge approaches.
Safety factors obtained using peak strength data from consolidated isotropic, undrained triaxial tests with pore pressure measurements and those determined using strength data from the consolidated-drained, direct shear tests were about the same . Safety factors associated with the direct shear test were slightly lower than those obtained when using the consolidated-undrained effective stress data. There was good agreement between safety factors obtained using residual strength from the direct shear tests and the safety factors based on the consolidated�undrained effective stress parameters with cohesion set equal to zero.
Slope instability due to progressive failure should be considered in the design of approach embankments at sites of proposed bridge construction projects to prevent or minimize settlement of approach pavements. Where approach embankments are constructed on foundations consisting of soils which exhibit a significant drop in shear strength after peak shear strength is reached, the possibility of progressive failure increases and safety factors based on peak shear strengths are unconservative. In the stability analysis of the Chaplin River slopes, a drop of about t to 4° between the peak and residual angles of shearing resistance produced a difference of some 20 to 25 percent in the safety factor. In particular, approach foundations containing brittle, highly plastic, or overconsolidated clays or clay shales -- soils that are more likely to exhibit significant decreases in shear strengths -- should be thoroughly investigated and tested. When such soils are encountered, consideration should be given in design to increasing the long-term factor of safety above the normally accepted value (1 .5), using
the residual shear strengths, or alternately, using shear strength intermediate between peak and residual strengths.
Stability of the bridge approach embankments could be improved, as indicated by the stability analysis, by the following
,a!ternate plans: , . .
I . Decrease the slopes of each embankment to 2.25 horizontal to I vertical as shown in Figure 33. Channel soils located under each toe of the sloping berms and in the . front of each pier should be dredged to bedrock before start of construction of the slope changes. The sloping berms should be constructed of a free-draining ·
material (sound sandstone or limestone) having a minimum angle of shearing resistance, ¢, of 35°. The lower faces of the berm should be protected by a rip-rap blanket measuring at least 2 feet thick. On the western slope, the sloping berm should be constructed . to an
• elevation near the toe of the slump before leveling excess material at the toe of the slump. However, only small sections of that material should be leveled at a time; rock should be placed immediately in the leveled sections.
2. Construct berms to the dimensions shown in Figure 34 using materials and the construction sequence specified under Plan I .
3 . Excavate material located behind and between the abutments approximately as shown in Figur� 32 and extend each end of the bridges.
4. Excavate materials behind and between the abutments as indicated in Figure 31 and backfill with lightweight material. Reconstruct the pavements.
From a viewpoint of increasing the stability of the approach embankments to an acceptable limit, construction of the berms (Plan 2) is more desirable. However, hydraulics of the channel would be appreciably affected. Decreasing >he slopes of · the approach embankments (Plan I) would increase stability of the slop�s to a marginal limit. If progressive failure continued, or if rapid drawdown· occurred (based on a 50-year flood) after construction, then the slopes would be near a state of failure. The effect of the rapid· drawdown on the stability of the sloping berms might be largely decreased by a liberal use of perforated pipe in the bottom portion of the .decreased slopes. Provided rapid drawdown could be avoided, the sloping berms would provide marginal stability in the near future; but
37

with increasing time , the slopes would eventually approach an unstable condition. Changes in the stream hydraulics resulting from the construction of the berms should be investigated.
Unloading the top of the approach slopes (Plans 3 or 4) would not prevent eventual failure of the slopes. The front portion of each embankment would continue to move. The bridge extension (Plan 3) would increase the safety of the western slope 0.07 and 0.12 for the eastern slope. Comparable increases in the safety factors of Plan 4 were 0.03 and 0.08. However, the unloading schemes could delay embankment failures for a time and might serve as a short-term remedial solution.
A fifth alternate which was not mentioned above consists of constructing piers at the present location of the abutments, extending the ends of the bridge and excavating large portions of the approach embankments.
Although a dewatering plan involving horizontal drains had been corisidered as a means of increasing stability of the slopes, the analyses showed that lowering the water table would yield only nominal benefits. Moreover, because of the low permeability of the approach soils, a considerable time would be required to lower the water tables using a dewatering scheme.
IMPLEMENTATION
Both settlement and stability investigations are being conducted at sites of proposed bridge construction projects involving significant fill heights in an attempt to control bridge approach settlement. The computer program developed in 1966 and the program (Bishop's simplified method) developed as a result of this study are being used to design the approach embankments at those sites.
38

REFERENCES
I . Hopkins, T. C., Settlement of Highway Bridge Approaches and Embankment Foundations, Kentucky Department of Highways, February 1968.
2 . Hopkins, T . C., The Bump at the l{nd of the Bridge, Kentucky Department of Hig!i.;;ays, 1969.
3. Hopkins, T. C. and Deen, R. C., The Bump at the End of the Bridge, Record 302, Highway Research Board, 1970.
4. Hopkins, T. C. and Scott, G. D., Estimated and Observed Settlements of Bridge Approaches, Record 302, Highway Research Board, 1970.
5. Hopkins, T. C. and Deen, R. C. , Mercury-Filled Settlement Gage, to be published by the Highway Research Board.
6. Jones, C. W., Smoother Bridge Approaches, Civil Engineering, June 1959.
7 . Irick, P. E. and Copas, T. L., Bridge Approach Design and Construction Practices, NCHRP Synthesis of Highway Practice 2, Highway Research Board, 1969.
8. Terzaghi, K. and Peck, R. B., Soil Mechanics in Engineering P ractice, John Wiley and Sons, Inc.: New York, 1964.
9. Stermac, A. G., Devata, M. and Selby, K. G., Unusual Movements of Abutments Supported on Piles, Canadian . Geotechnical Journal, Vol V, May 1968.
10. Tschebotarioff, G. P., Bridge Abutments on Piles Driven through Plastic Clay, D esign and Installation of Pile Foundations and Cellular Structures, Edited by Hsai-Yanf Fang and Thomas D. Dismuke, Envo Publishing Co., 1970.
I I . Movement Towards Its Backfill of Pile Supported Bridge Abutment, Research Report submitted to New Jersey State Department of Transportation by King and Garvis, September 1970.
12. Turnbull, W. J. and Hvorslev, M. J., Special Problems in Slope Stability, J ournal of the Soil Mechanics and Foundations Division, ASCE, July 1967.
13. Vansant, G. F., Unusual Movements of Abutments Supported on End-Bent Piles, Memorandum to C. G. Cook, Director of Division of Bridges, Kentucky Department of Highways, November 18, 1968.
14. McFarland, A. C., G eology of Kentucky, Kentucky Geological Survey, 1961.
I S . Hall, F. R. and Planquist, W. N., Availability of G round Water in Marion, N elson and Washington Counties, Kentucky, Atlas HA-21, U.S. Geologic Survey, 1960.
16. Lambe, T. W. and Whitman, R. V., Soil Mechanics, John Wiley and Sons, Inc., 1969.
17. Skempton, A. W ., Long Term Stability of Clay Slopes, G eotechulque, Vol 14, 1964.
18. Lambe, T. W., Soil Testing for Engineers, John Wiley and Sons, 195 1.
19. Bjerrum, L., Progressive Failure in Slopes of Over-Consolidated Plastic Clay and Clay Shales, Proceedings, ASCE, Vol 93, SMS (Part 1), pp. 1-49, 1967.
�0. Bishop, A. W., The Use of the Slip Circle in the Stability Analysis of Earth Slopes, Geotechulque, Vol 5, 1955.
21. Bjerrum, L. and Kjaernsli, B., Analysis of the Stability of Some Norwegian Natural Clay Slopes, Geotechnique, V o1 7, 1957.
22. Whitman, R. V. and Bailey, W. A., Use of Computers for Slope Stability Analysis, P roceedings, ASCE, Vol 93, SM4, 1967.
23. Seva1sdon, R. A., The Slide in Lodalen, October 6th, 1954, Geotechulque, Vol 6, 1956.
3 9


� ...ilQ_ !-= 1.1.. - 660 z 0 i= 640 <( > w 620 ..J
---
w 600
I 2 3 1 4
'
S L O P E I N D I C A T O R
O R I G I N A L G R O U N D
B E NC H I NG __./
I 2 3 1 5
2 3 1 5 + 64 !1.2 I
23 16 STAT I ON N U M B E R
P I E R
2 3 1 6 + 94 !1l1 I I 23 17
Conc eptual Plan for Butt r e s sing Pile End-bent Abutme nts
Chaplin River Bridge s , Blue g ra s s P arkway
S LO P E I N DI C A T O R
I 2 3 1 8