Embed Size (px)
Citation preview

Proc. Instn Ciu. Engrs, Part 1,1986,80, Dec., 1625-1648
8917 DISCUSSION GROUND ENGINEERING GROUP
Settlement of foundations on sand and gravel
J. B. Burland and M. C . Burbidge
Professor Burland The Paper was first presented in 1984 at the Centenary Celebrations of the Glas- gow and West of Scotland Association and was published in the centenary volume. The paper is based on Mr Burbidge’s Masters thesis’ in which he assembled an enormous number of case records, each of them meticulously pre- sented and analysed.
122. As mentioned in 116 no attempt was made to compare the results of the correlations derived in the Paper with predictions of other methods as this would have required a case-by-case comparison. One of my students carried out com- parisons of nine of the case histories for which the soils data were well established (Maail 1985).90 The observed settlements p, were compared with the calculated settlements p, using six methods including the one given in the Paper. The results are given in Fig. 34 where the observed settlements are plotted against pJp, and pJp, for each method. A point lying above the horizontal axis represents an overestimate of settlement (conservative) whereas a point lying below the axis represents an underestimate of settlement (unconservative). The number against each point refers to the case number given in Appendix- 1.
123. The predictions given by Terzaghi and Peck7 are given in Fig. 34(a) and can be seen to be generally very conservative. Meyerh~f’.’~ increased the allow- able bearing pressure given by Terzaghi and Peck by 50% and dispensed with the correction for the water table. As can be seen from Fig. 34(b) some of the predic- tions have become very unconservative. Peck, Hanson and Thornburn (1974) proposed a revised set of charts with an overburden correction applied to the SPT results.’’ Tomlinson*’ uses the original Terzaghi and Peck charts with an over- burden correction applied to the SPT results. These two methods give results which are plotted in Figs 34(c) and (d) respectively. It can be seen that in both cases the agreement between observed and calculated settlements is reasonable. Fig. 34(e) shows the comparison with Parry’s method.33 For most of the cases the calculations are unconservative. As a check Fig. 34(f) shows the comparison with the method proposed in the Paper. It is encouraging that most of the observations lie within one standard deviation of the best estimate of the settlement.
Mr E. J. Wilson, Consultant Engineering Geologist The Terzaghi and Peck7 chart for estimating settlement is arguably the most used and almost certainly the most misused chart in soil mechanics; but it was pro- duced in 1948 by Terzaghi and Peck on the basis of a study of plate bearing tests, some standard and non-standard penetration tests, and probably no actual settle- ment measurements on structures. They made it clear that this was a very conser-
Paper published: Proc. Instn Ciu. Engrs, Part 1,1985,78, Dec., 1325-1381
1625

DISCUSSION
Observed settlement: mm +?O 40 60 80
‘90’ I I I
I 090
Observed settlement: mm
P=--+ t
t l 090
t
O’Glddings (1 984) Fig. 34. Observed settlements from case histories compared with calculated settle- ments, by six di$erent methods: (a) Terzaghi and Peck’; (b) Meyerhof’; (c) Peck, Hanson and Thornburn”; (d) Tomlinson”; (e) Parry3’; (f) Burland and Burbidge (1 985)
vative relationship and that it should be reviewed as and when settlement data became available.
125. The next thirty years saw a succession of refinements based on theory and laboratory work and on some observed settlements. Corrections were made for soil types, for overburden pressure, for groundwater and Meyerhof’.’’ recom- mended a wholesale upgrading of bearing pressures. The value of these refine- ments was, however, limited by the originally limited data base and by the rather simplistic interpretation which was put upon it. More recently other workers such as DAppolonia and Parry moved away from the empirical approach towards elastic analysis, and this work tended to give very small predicted settlements which underestimated in many instances.
1626

8917
126. Burland and Burbidge have made an entirely fresh empirical appraisal on a new data base of over 200 good settlement records coupled with good initial site investigation data. This is the first entirely new empirical approach giving design based on actual settlement measurements. Empirical methods are good because they work. The analysis of these results has been sophisticated enough to provide a powerful method for dealing with a wide range of conditions. At the same time the zoning of SPT results in which it is based recognizes the inexactitude of that test.
127. Equation (4) gives the estimated settlement from the product of bearing pressure, ground compressibility and foundation breadth to the power of 0.7. It is not difficult, but the use of the function is slightly awkward and would probably take it out of the realm of rapid and ad hoc site use. In Fig. 1 that same function appears as denominator so surely the chart could be more simply presented for general use.
128. Time dependent settlement must come as a novelty to many in terms of settlement on sand and gravel. What mechanism do the Authors envisage for time dependent settlement bearing in mind the fairly low point contact stresses relative to the strength of the quartz grains? Do they feel there is any correlation between time dependent settlement and groundwater in the sense that it might be related more to submerged sands or to sands within the zone of fluctuation of ground- water level such that it represents constant submergence and emergence?
129. The Authors mention that there is very little influence from foundation depth. This is within limits since spread foundations are being considered, not pile foundations. Therefore could the Authors suggest any sort of limit to which that comment might apply?
Dr P. R. Vaughan, Imperial College, London The extensive collection of data presented by the Authors and the conclusions drawn by them may be compared with a laboratory study concerning settlements on sand made at Imperial College some years ago by Daram~la.’~-’~ Triaxial samples of a medium quartz sand were pluviated at varying initial densities, given a stress history of normal or over-consolidation under K , conditions, and then tested under stress paths appropriate to loading beneath the centre of a 25 m diameter circular flexible load. The stress path method of Lambe (1967) was used,96 with stress paths predicted using the theory of isotropic elasticity, for three depths, using a Poisson’s ratio derived from the tests performed for each depth. Strains were measured on the sides of the samples to avoid the bedding errors inherent in using platten to platten measurement. A method developed by Dr Skinner was used. For the data presented here the use of platten to platten mea- surement with 38 mm diameter samples would have overestimated settlement by more than 100%.
131. Four typical results are illustrated on Fig. 35, for two initial densities of sand, normally and over-consolidated. The zone of influence which contributes to the settlements is similar to that indicated in the Paper. The Authors suggest that, for the same N value, the compressibility of over-consolidated sand can be taken as one third of that for normally consolidated sand. Daramola’s data gives this ratio directly, if a reasonable value of N is assigned to each density tested in the laboratory. This is done on Fig. 36, on the basis of relative density, which is shown. Line A assumes that N is solely a function of porosity and does not sense stress history. Line B assumes that the standard penetration test senses over- consolidation because of the higher horizontal stresses present, to the extent that,
1627

DISCUSSION
Estlmated settlements, mm e = 0.58 NC 15
oc 7 e = 0.72 NC 38
oc 1 1
Fig. 35. Estimated vertical strain and settlement beneath a 25 m diameter flexible foundation: pressure = 100 k N / m 2
for the same density, N is 25% greater when the sand is over-consolidated. The results suggest that, for a given value of N , the ratio of settlement (normally consolidated) to settlement (over-consolidated) may be a little more than three when the sand is loose, dropping to two or less if the sand is dense.
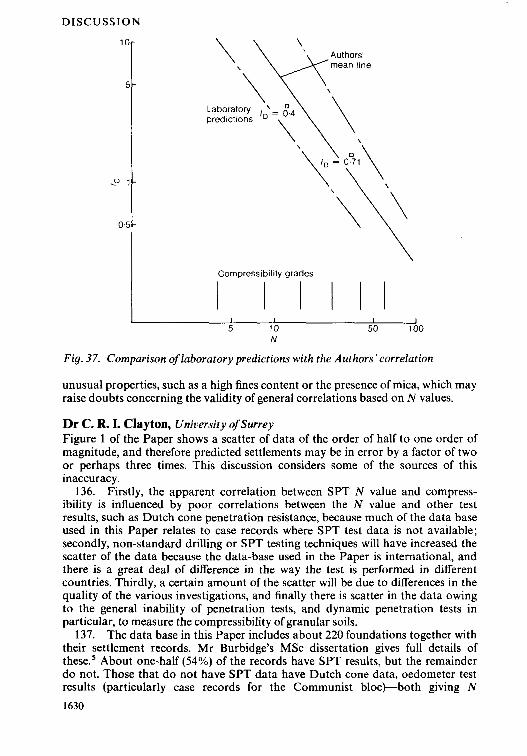
132. Daramola’s predictions for normally consolidated sand from Fig. 35 may be compared directly with the correlations of the Authors if the N values assigned in Fig. 36 are used, as shown in Fig. 37. The laboratory predictions fall well within the scatter of the field observations. Exact agreement with their average line is obtained if the N values assigned are changed from 12 to 15 and from 35 to 27, which is within the accuracy with which these values can be estimated.
133. At first sight this agreement is surprising, since Daramolag4 showed that ageing of the sand in the laboratory produced a substantial increase in stiffness. Field settlements on geologically aged sand might thus be expected to be substan- tially less than those given by laboratory tests on reconstituted samples only aged for a few hours, as is the case for the data of Fig. 35. However, loading of the laboratory samples over the appropriate stress range only took a few minutes, and 1628

8 9 1 7
\ \ ' \ \
Compresslbllity grades
1 I I 1 5 10
Assumed N 50 100
Fig. 36. Influence of overconsolidation no settlement as a function of N
was about four orders of magnitude faster than typical field loading rates. The Authors' summary of creep settlements indicates that rapid loading is likely to overestimate the stiffness relevant to field loading rates quite substantially. Thus it seems that the effects of rapid consolidation and rapid loading in the laboratory largely cancel each other, and that reasonable field predictions may be achieved.
134. Daramola's data gives broad support to the conclusions of the Authors from an independent method. Moreover, the agreement between the two methods suggests that the laboratory approach may be a useful supplementary design aid for important projects, provided that reasonably correct stress paths are used and strains are correctly measured. It may be of particular value where a sand has
1629
DISCUSSION
1 O r
5 -
-0 1 -
0.5 -
\ \
Cornpressiblllty grades
I I I I l 5 10
N 50 100
Fig. 37. Comparison of laboratory predictions with the Authors’correlation
unusual properties, such as a high fines content or the presence of mica, which may raise doubts concerning the validity of general correlations based on N values.
Dr C. R. I. Clayton, University of Surrey Figure 1 of the Paper shows a scatter of data of the order of half to one order of magnitude, and therefore predicted settlements may be in error by a factor of two or perhaps three times. This discussion considers some of the sources of this inaccuracy.
136. Firstly, the apparent correlation between SPT N value and compress- ibility is influenced by poor correlations between the N value and other test results, such as Dutch cone penetration resistance, because much of the data base used in this Paper relates to case records where SPT test data is not available; secondly, non-standard drilling or SPT testing techniques will have increased the scatter of the data because the data-base used in the Paper is international, and there is a great deal of difference in the way the test is performed in different countries. Thirdly, a certain amount of the scatter will be due to differences in the quality of the various investigations, and finally there is scatter in the data owing to the general inability of penetration tests, and dynamic penetration tests in particular, to measure the compressibility of granular soils.
137. The data base in this Paper includes about 220 foundations together with their settlement records. Mr Burbidge’s MSc dissertation gives full details of these.5 About one-half (54%) of the records have SPT results, but the remainder do not. Those that do not have SPT data have Dutch cone data, oedometer test results (particularly case records for the Communist blocFboth giving N
1630

8917
values-or plate loading tests-giving compressibility grade. Most of the cases with SPT data are from the United States of America (see Table 5), and that is probably because 50 of the foundations come from DAppolonia, DAppolonia and Brisette (1968).97 The UK data are represented by only 19 foundations, which is only 10% of all the case records. It is likely that our ability to predict settlements from SPT data would be improved if there were a unified worldwide standard for the test. Some of the scatter of data in this Paper undoubtedly arises from the wide geographical distribution of the case records, but since case records are hard to come by researchers must use all the records currently available.
138. The factors which influence the result obtained from an SPT are numer- ous, but can be grouped under the headings
(a) SPT equipment design and maintenance (b) drilling equipment and technique (c) SPT test method, and reporting of results (6) the soil in which the test is performed.
Although the test is termed the ‘Standard penetration test’ it is not yet stan- dardized, and was certainly not standardized in 1948 when it was published by Terzaghi and Peck.7 Indeed, Hvorslev’s report* in 1949 describes Terzaghi and Peck‘s method, but does not refer to it as the standard penetration test, and compares it with three other rather similar penetration tests then in use in the USA.
139. It is clear that the SPT will give variable results in the same soil as a result of the factors above, and therefore it should be accepted, particularly by those who work overseas, that results will differ depending on how the test is done. Table 6 shows the main variables between countries. The major influence in Britain, given uniform soil conditions, is likely to be borehole disturbance. Lower penetration resistances are likely to be produced using British methods than in other countries for a number of reasons. Firstly, light percussion drilling with a shell tends signifi- cantly to loosen the soil below the bottom of the borehole. Secondly, although it is well-known that the borehole should be kept full of water, in practice the drilling method makes this difficult, so increasing disturbance. Thirdly, British practice uses larger diameter boreholes than anywhere else in the world and this increases the length of the disturbed zone below the bottom of the borehole. Finally, an automatic trip hammer is used, which provides more energy input to the rods than some other methods such as the use of a cathead with several turns of rope on it. There are therefore good reasons to believe that British SPT N values would be
Table 5 . Country of origin of SPT data
Country or origin 1 % or SPT cases I % of a11 cases
USA UK
56
1 Yugoslavia 2 South Africa 2 New Zealand 3 Nigeria 5 Germany 5 Brazil 8 Australia
19 10
163 1

DISCUSSION
lower than those obtained using the techniques favoured by other countries. 140. Dynamic penetration tests, and other forms of penetration test such as
the Dutch cone test, cannot determine the compressibility of granular soils with any accuracy, as was shown by Clayton, Hababa and Simons" (see Table 7). This piece of laboratory work was limited because tests were only on one sand at one density, using a model dynamic penetrometer in a test chamber. The sand was subjected to a number of stress paths, and its penetration resistance and compress- ibility were measured at the end of those stress paths. It was found that penetra- tion resistance depends strongly on current stress levels on the soil element under test, but it is almost totally unaffected by stress history. This is not to say that the SPT cannot detect over-consolidation, because for a given vertical stress level the process of over-consolidation leads to an increase in horizontal stress which results in higher penetration resistance. If, however, stresses are increased and then returned to some previous values of both horizontal and vertical stress, penetra- tion resistance will not be increased even though the compressibility of a granular material would be significantly altered. Because the compressibility of a granular soil is so sensitive, even to minor variations of stress path, too much cannot be ex- pected from penetration tests. The maximum effect found in these tests was a fac- tor of times plus or minus three, but some unlikely stress paths were used, and for
Table 6. Main variables aflecting SPT data from country to country
Method of drilling
Borehole fluid
Borehole diameter
Hammer mechanism
Hammer design
Rod stiffness, length
Split spoon geometry
Washboring, augering, rotary drilling, light percussion drilling
None, part-water, full-water, mud
635 mmJ01.6 mm, 152.4 mm, 203.2 mm, up to 381.0 mm
Automatic trip, handoperated trip, slip rope (cathead), hand dropped
Weight of striker plate, use of cushion block, ratio of total weight/l40 Ib
'E' + 'NW' rods, use of steadies
Cutting shoe design, vent area, inside clearance (lack of liners), 60" solid cone, ball check valve, spring catchers
Table 7. Inability of dynamic penetration tests to measure compressibilitylO*
Penetration resistance 1 Compressibility
Depends upon N K (U: + 2 4 )
Stress history Current stress levels ~~
Unaffected by Current stress levels Stress history
* Tests under laboratory conditions, on one sand at a single density, but subjected to variations in stress level and stress path. Maximum effect X & 3, probable effect X k 2 (?) error in settlement predic- tion.
1632

8 9 1 7
most soils the effect would probably be less than a factor of times plus or minus 2. 141. In summary, the SPT N value cannot give perfect settlement predictions
because it cannot measure the decrease in compressibility of a granular material due to prestressing. Design engineers must recognize that there will always be limitations, and that other penetration tests such as the Dutch cone test will suffer the same problem. In spite of these problems, however, the SPT will continue to be widely used because it is such a simple and versatile tool. The Authors' method should give much better predictions of settlement than old methods, such as that by Terzaghi and Peck (1948), but still better results could be obtained if the problems of standardization and borehole disturbance could be overcome. Whether or not these problems are faced, there remains a great need for further structures on granular soils in the UK to be monitored, in order that the UK data base can be expanded.
Professor P. Rocha Filho, Pontifical Catholic University, Rio de Janeiro Plate load tests and several SPTs were carried out in a granular and cemented young gneissic residual soil in Rio de Janeiro. Concrete footings of 0.40,0.80 and 1.60 m diameter were used for the plate load tests, which were on an excavated platform (Figs 38 and 39).99
Orlglnal ground level
-%. residual Mature \ '
- \ ' \
soil (gnelssic) \ '
\
Level of in situ tests
\
Young residual so11 (gnelsslc)
_ _ _ _ _ _ _ _ _ _ _ _ _ _ - - Very weathered rock
_ _ _ _ _ _ _ _ _ _ _ _ _ - - _ Weathered rock
Fig. 38. Simplified cross section of gneissic residual soilg9 1633

DISCUSSION
S PT 0 SPT-standard penetration test
PLT-plate loading test
Scale of metres
0 2 4 6
SPT PLT (1.6 m) SPT N
SPT PLT(0.4 m) 0 0 PLT (0.8 m)
0 0 0 S PT 0 0
SPT S PT
SPT 0
Fig. 39. Location plan of in situ tests99
143. The empirical equation proposed by Burland and Burbidge for granular and uncemented soils, expressed as
overestimated the measured settlement. The calculated settlement ratio between predicted and measured values, corrected for footing shape, was of the magnitude of 2.5 and 1.5 corresponding, respectively, to the 0.40 m (N = 20) and 1.60 m (W = 25) plates. The at&’ ratio was about 0.45 for the three plate load tests.
144. To separate the influence of the compressibility and geometrical scale factors, equation (16) has been compared with the closed form solution based on Bossinesq’s formulation, proposed by Whitman and Richart (1967)”’ as
, (1 - v2) 1
B, E p = q -- B
where B, is the shape factor, about 1.1 for square plate; v is the Poisson’s ratio, taken as 0.35; and E is the drained Young’s Modulus. The relationship between E and Nspr was adopted as E(kN/mz) = (29 + 270) X 98.07, derived from the back analysis of the plate load tests (Fig. 40).
145. Comparing equations (16) and (17) we have
(29 N + 270) 1 - P N1.4 ~ 0 . 3
or
where n is a numerical constant andf,, f2 and f3 correspond, respectively to the stress history, compressibility and geometrical scale factor.
1634

8917
S PT 20 4n
Plate load tests (diameter = 0.40
Burmlster
Carrier and Christian
Number/@’ of tests
and 1.60
_-_ V = 0.3 - v = 0.4 14) \
SPT average values
Weathered rock CI 11 m
Fig. 40. Results of SPT and plate load tests99
146. The results presented in Fig. 41 suggest that for stiffer soil cementing has less influence on the relationship between compressibility and NspT. It also can be observed that the extrapolation relationship obtained from the case records also overestimates the settlement ratio for small footings. This may be because of the small sample: B was smaller than 1.0 m in less than 5% of the case records presented by Burland & Burbidge.
Dr W. H. Ward, Member About three years ago Peter Fraenkel and Partners sought my advice on the interpretation of some pile-loading tests made in connection with a chimney foun- dation being built on a coastal spit of wind-blown and alluvial sand which is fully exposed to the dominant south west winds. At the time when they were asked to check on the expected performance of the foundation for the 52 m high steel chimney most of the 20 bored piles had been installed, see plan Fig. 42(a), so they arranged for test piles to be placed nearby.
1635

DISCUSSION
4 -
2 -
L 0
* \
* \ .l*
t l
0-4 0-8 5 : m
1.6
Fig. 41. Compressibility and geometrical scale factors
148. The results of the pile tests and their application to the foundation per- formance are relevant to the Authors’ views expressed in $ 110, that the larger long-term and stepwise settlement behaviour of chimney foundations on sand is due to the wind action inducing fluctuating foundation loads.
149. Information about ground conditions came from three borings, about 30-40 m away, made about 30 years earlier. The ground surface lies only about 6 m above sea level and the water table is about 1 m below surface. A medium to fine, brown and grey sand extends to a depth of about 12 to 14 m. Its silt content is as low as 2%, but at some horizons rises to about 9% and then is slightly organic. At lower levels, some zones contain sparse gravel, coal and shell fragments. The sand overlies cobbles and boulders in a clay matrix, a boulder clay, 1 to 7 m thick. Beneath is a silty sandstone of Carboniferous age.
1636

8 9 1 7
c m m m a
0 m a 0
l 0 m m
C m
E 5 a 0
E
1;
N values ) 20 40 60 80 100
I I 1 I 1 m
* m 0
H
H
e,
Fig. 42. (a ) Plan of chimney foundation showing pile positions; (b ) standard penetra- tion test results from three boreholes, log. N values (uncorrected)
150. It was early days for standard penetration tests in the UK but several were made in each borehole using a Raymond sampler. The log N values (uncorrected in any way) are plotted with depth in Fig. 42(b). Down to a depth of about 2 m the sand is loose to medium density, or grade V according to the Authors’ classification. Between 2 and 6 m deep the sand is medium to dense, or grade 111 to 11. Below about 7 m it is apparently very dense, or grade I, the number of blows being curtailed at about 23 cm, 64 and 64 cm penetration respectively at the three deeper levels indicated in Fig. 42(b).
151. The foundation and test piles penetrated to a depth of 8 m where the sand has become very dense. They were bored piles, 0.43 m diameter, formed by percus- sive boring within steel casing, with the water level maintained high in the casing. The concrete was tremied into place while the casing was steadily removed. On completion the concrete was checked sonically for its integrity.
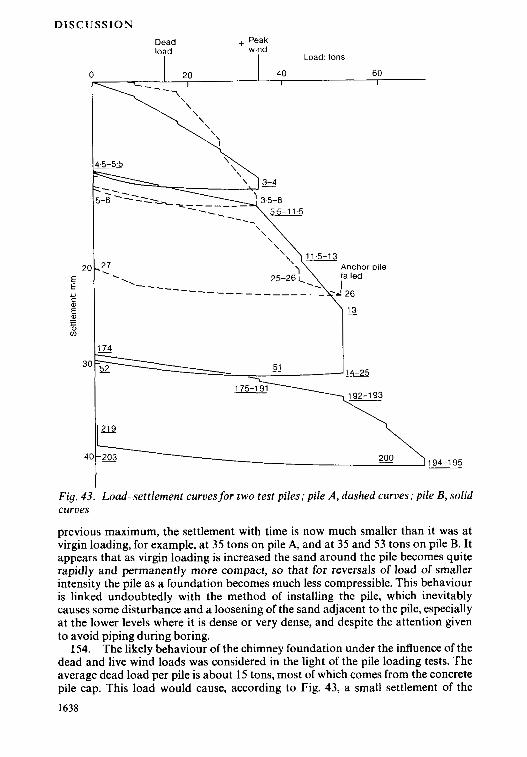
152. Test pile A used anchor piles of the same diameter for reaction, two 8 m long on one side and one 12 m long on the other side. For the second test pile, B, 80 tons of kentledge were used. The load-settlement diagrams are presented in Fig. 43, pile A by the dashed curves and pile B by the solid curves. The numbers at intervals alongside each curve are the hours elapsed since first application of loading to each pile, the values for pile B being underlined. The hyphenated numbers indicate periods of constant load and provide an indication of the settle- ment with time.
153. During loading of pile A at about 53 tons the 12 m long reaction pile on one side yielded in tension-at a load of about 25 tons, so kentledge was brought in for the second test pile. Up to 53 tons the load-settlement characteristics of both piles are very similar. The virgin loading curve is steep and significant settlement ensues when constant load is maintained. In contrast the recovery, including recoverable concrete strain, on unloading is very small. The settlement on reload- ing to the previous maximum is also small. When the load is remaintained at the
1637
DISCUSSION Dead load
+ Peak wlnd
Load: tons
0 40 60 20 l l
\
20 -2,7 E E
. . ---- - - - _ _ _ - C
m c
1 2
51
194-195
I Fig . 43. Load-settlement curves for two test piles: pile A, dashed curves: pile B, solid curves
previous maximum, the settlement with time is now much smaller than it was at virgin loading, for example, at 35 tons on pile A, and at 35 and 53 tons on pile B. It appears that as virgin loading is increased the sand around the pile becomes quite rapidly and permanently more compact, so that for reversals of load of smaller intensity the pile as a foundation becomes much less compressible. This behaviour is linked undoubtedly with the method of installing the pile, which inevitably causes some disturbance and a loosening of the sand adjacent to the pile, especially at the lower levels where it is dense or very dense, and despite the attention given to avoid piping during boring.
154. The likely behaviour of the chimney foundation under the influence of the dead and live wind loads was considered in the light of the pile loading tests. The average dead load per pile is about 15 tons, most of which comes from the concrete pile cap. This load would cause, according to Fig. 43, a small settlement of the
1638

8917
foundation of about 2 to 4 mm, most of which would occur before chimney erection began. The piles are spread somewhat unsymmetrically around the per- iphery of the stiff pile cap. Nevertheless the peak wind moment reacting on the piles causes an additional downward load on the leeward piles of up to about 20 tons, and an equal upward additional load on the windward piles. Hence the maximum load applied to the leeward piles is about 15 + 20 = 35 tons (see Fig. 43) while there is an upward tensile load of about 15 - 20 = - 5 tons on the windward piles. Thus, if shortly after chimney erection a steady wind increased to its peak value in one direction, an additional settlement would arise on the leeward side piles of about 8 to 12 mm and there would be a small uplift of the order of 2 mm on the windward side. This would cause the chimney to become out of plumb by about 60 to 120 mm, depending partly on the wind direction in relation to the pile cap.
155. In reality winds are variable in magnitude and direction, strong winds come with gusts and eddies, so the chimney oscillates and the foundation tilts back and forth. Under these conditions the results in Fig. 43 show that the foundation would settle ratchet-like, and in doing so, become stiffer both to tilting and to settlement, especially under loads less than those already experienced. So the actual maximum tilt of the chimney was expected to be less than estimated above, depending on the incidence of wind magnitudes in a given direction.
156. The settlement was expected to develop stepwise with most occurring during the first very stormy winters and with little happening during calm periods. The ultimate settlement would be at least equivalent to a load of 35 tons acting on every pile, which according to Fig. 43 would be at least 15 mm. This is a small settlement for a foundation, but how much more settlement occurs with each peak wind?
157. If the rather large tilts of the foundation during early high winds were not acceptable to the chimney designers my recommendation was to preload each of the foundation piles, either singly or in pairs, with the 80 tons of kentledge already on site, before casting the pile cap, and to record the settlement of each pile. This procedure would stiffen up the foundation significantly, reducing both the ultimate settlement, but more importantly the tilting in early high winds to a few milli- metres. It is understood that this recommendation was not adopted, so it would be interesting to know how the foundation has performed.
Mr D. G. Richards, Golder Associates Could the Authors say how much information was available as to the likely maximum settlement, and the variation between maximum settlement and the settlement at the edges of the foundation in any particular case? How far do they consider that their results can be extrapolated with large foundations and very large loads?
Professor N. E. Simons, University of Surrey Professor Burland suggested that Terzaghi and Peck always overestimated settle- ment, and the writer knows of only one case in which it was not, and it was the one case that he had to deal with. It concerned the Fawley oil tanks where one had to predict the settlement of two very large tanks which were floated on to a new foundation consisting of compacted sand. Eight methods were tried to predict the settlement before 1974. The first six used the SPT, and the first one is the Terzaghi
1639

DISCUSSION
and Peck standard procedure. The prediction was 33 mm and the range using SPT was from 7 mm to 33 mm. The Dutch cone and the standard Dutch procedure were then used, as well as the Schmertmann procedure, and two further predic- tions of 14 to 110 mm were made. A figure had to be estimated for settlement in the compacted sand before the tanks were loaded and this was 50 mm, and the actual settlements of the two tanks were almost identical at 60 mm. This is one case where the standard Terzaghi and Peck seriously under-predicted the settlement.
160. Dr Clayton mentioned that the SPT and also the Dutch cone test do not accurately reflect the effects of over-consolidation. Over-consolidation material would have a smaller compressibility than an ordinary consolidated material other things being equal. However, the difficulty is that possible over- consolidation can be determined in advance with clays but not with sand. One example is the 20-storey office block in Lagos, described by Grimes and Cantlay in 1965.64 The ground consisted of sand on top of interbedded sands and clays, and from the clays it could be estimated that they were over-consolidated, and the included sands were almost certainly over-consolidated. One could not be sure about the top sand. The upper 6 m were compacted by vibroflotation for that particular case. The calculated settlements were 95 mm total settlement with the compaction compared with 220 mm without compacting the upper sands, and the major settlement of only 25 mm. The main points from this are that these particu- lar sands, perhaps because they were clean and contained no fines, were amenable to treatment by vibroflotation and that the soils were over-consolidated, and a 20-storey building could be founded cheaply by simply using a raft.
161. Another case, also in Lagos, concerned a very large building 140 m high, an oflice block which had a fairly heavy loading intensity. It was founded on a raft of about 2 m thick. The upper loose sands were compacted by using compaction piles, small size concrete piles, to compact the upper sands. At the start of the investigation, using no influencing factors, just the measured compress- ibility of the clays and SPTs from the first site investigation, predicted settlements were of the order of 250 to 375 mm for a shallow raft, unacceptable for this large building. A much more detailed site investigation was carried out, and although all the influencing factors possible were used to bring the settlements down, a calcu- lated figure lower than 90 mm could not be found. If a solution of piling into the lower sand was considered, which was more expensive, there was little benefit, and a figure of 80 mm was found. So this large structure was founded simply by compacting the upper loose sands using compaction piles and putting it on a raft, and the figure was 90 mm. It is unlikely that the settlement will be greater than 40 mm, and the reason for this very low settlement is that the sands were over- consolidated, which was not reflected in the results of the SPT.
162. Using different people’s approaches produces a tremendous variation in predicted settlements. At this time there were six case records. The first method is the standard one of Terzaghi and Peck, which on average over-predicts by a factor of two. However, it is no good being right on average-the prediction should be right every time. At Fawley the observed settlements were twice those predicted. The range is enormous and almost unacceptable. A method of settlement predic- tion was adopted at the University of Surrey and it predicted a settlement of 44.7 mm. Using it for the Fawley settlements a range of 0.22 to 2.1 was found which was no worse than any of the other methods. That is a good example of how, when prediction methods using SPT and the Dutch cone are assessed, the range of results is quite unacceptable.
1640

8917
Mr S. R. Coatsworth, Dames and Moore Recent research work undertaken by the writer at Imperial College,'" provided an opportunity to assess six settlement prediction methods including the Burland and Burbidge m e t h ~ d . ' ~ . ~ ~ * ' ~ ' . ' ~ ~ The assessment was performed on field settle- ment data acquired independently from that upon which any of the six methods have been based. This is a pertinent point because several of the commonly used prediction methods share, at least in part, a common data base.
164. The data presented, which was kindly made available by the Main Roads Department, Perth, Western Australia, concerns the settlement of six bridge struc- tures founded on quartz sand in Perth. In total, eleven bridge pier footings were analysed. Each footing was treated as an independent case record, with its own specific SPT profile, groundwater, loading and construction conditions. At many of the pier foundation positions, it was evident that site grading had occurred (and in some cases, additional local groundwater lowering) prior to or during construc- tion of the footings. It was therefore decided to account for the associated stress changes by adjusting the original SPT data taken in the site investigation, prior to undertaking the settlement calculations. A repeat set of calculations was also performed using the original 'non-adjusted' SPT data for comparison. The method adopted for adjustment to the N value was that proposed by Parry,33 according to the ratio of final to initial effective overburden pressure, where PIadjusted = (Final effective overburden pressure/Initial effective overburden pressure) X Noriginal.
165. The following limitations to the data should be noted. Only a limited range of foundation geometry ( B = 2.5 m to 6 m), bearing pressure and soil compressibility are represented, the sands encountered being predominantly medium dense. For each footing analysed there is a degree of uncertainty in at least some of the factors
( a ) loading magnitude (b) loading history (c ) foundation depth (d) construction/groundwater conditions (e ) settlement interpretation.
These factors, together with inherent soil variability and potential errors intro- duced during the site investigation, contribute to the overall variation in the results presented. Notwithstanding, one of the principal attractions of the study is that the ground conditions at each site comprise a seemingly consistent thickness of sand. No clay layers of significance (which would otherwise introduce com- plications and uncertainties into the analyses) are known to be present beneath any of the footings.
166. Figures *a) to (f) show the comparisons between the measured settle- ments (p,) and calculated settlements (p,) for the six prediction methods. In this Figure the measured settlement has been plotted against the ratio pJp, as Pro- fessor Burland has done in his introduction. It should be noted that for case 4 (Cloister Avenue pier 3) the measured settlement is generally very much less than the predictions for five of the six methods and this is thought to be due to errors in the settlement measurements.
167. Figure 44 shows that the methods of Burland and Burbidge (Fig. 44(a)), Meyerhof (Fig. 44(b)) and Schmertmann (Fig. 44(f)) all give a reasonable range of predictions. For the Burland and Burbidge method most of the cases lie within one
1641

DISCUSSION
Measured settlement: mm
5 4 8 12 16 1.4 ’ I 1
gL (a) Burland and Burbldge
(c) Schultze and Sherlf (1973)
Measured settlement: mm
L (b) Meyerhof (1 965)
c 4.
I l (e) D’Appolonla (1 968) (0 Schmertmann (1 978)
(1) Edgewater Road (2) Cloister Ave. 1 (3) Cloister Ave. 2 (4) Clolster Ave. 3 (5) Scarborough Beach Rd 2 (6) Scarborough Beach Rd 6 (7) Vlncent St 5 (8) Vlncent St 7 (9) Vlncent St 8 (1 0) Erlndale Bridge South ( 1 1 ) Ewtng St 1 (c)
Fig. 44. Comparison between measured settlements on six bridges in Perth, Western Australia and calculations using various methods
standard deviation from the estimated settlement. The Meyerhof method gives the best overall agreement but there is a tendency for a small underestimate of the settlements for many of the cases. The DAppolonia method is also satisfactory but again for most of the cases the settlements are slightly underestimated. Figs 44(c) and (d) show that both the Schultze and Sherif and the Parry methods seriously underestimate the settlements. Similar comparisons based on the original SPT values, uncorrected for changes in effective overburden pressure, give generally rather worse correlations between measured and calculated settlements although the relative performance of each method remains unchanged.
1642

8917
N
E
Y t 2 10 E
N 0 ?
X m-
1
\ \ \ '
1 10 -
100
N value
For sand body wlth linearly increasing N proflle, D/B = 0.4. V B = 1
Burland and Burbidge
X - Meyerhof
- - - Schultze and Sherif
- - - Parry
Fig. 45. Comparison between foundation subgrade compressibility and SPT N value for various predictive methods, for a 4.5 m square footing founded at depth
168. In an attempt to quantify the differences between the predictive methods used, Fig. 45 shows a plot of foundation subgrade compressibility, a, against N value for four of the prediction methods, where a, is the settlement per unit applied pressure in units of mm/kN/m3. The plot is drawn for a uniformly loaded 4.5 m square footing at shallow depth within a deep sand layer, which exhibits a linearly increasing N value profile with depth. These conditions closely resemble those typically encountered at the bridge sites. The figure clearly demonstrates that for the footings analysed, where N is typically 10 to 30, the Schultze and Sherif and Parry methods will under-predict settlement relative to the Burland and Burbidge and Meyerhof methods. This is borne out by the results given in Fig. 44.
169. With respect to the zone of influence factor, Z+ introduced by Burland
1643

DISCUSSION
and Burbidge, for many of the footings analysed only one or two SPT N values had been determined within this zone. It is evident that the conventional choice of spacing of SPT samples, typically 1-1.5 m in upper soil strata, may be inadequate where settlement prediction of small width footings is proposed using the Burland and Burbidge method.
Dr U. Holzlohner, Bundesanstaltfir Mnterialpriifung, West Berlin The Authors presented a comprehensive investigation of foundation settlement on sand. Most certainly the method will be a reliable tool in practice. The investiga- tion shows the variation of stiffness with depth to the key property of sand soils. Some remarks on the use of results from theory concerning heterogeneity are pertinent.
171. In this field the term ‘theory’ usually means an analysis of an elastic heterogeneous half-space. The Authors use the Gibson type of heterogeneity
E = E, + kz (20)
whereas others prefer parabolic increase of Young’s modulus E with depth z
E = Hz“ (21)
H and k are constants of the half-space. The obtained results apply, strictly speak- ing, to the elastic bodies considered; the application to the soil remains somewhat uncertain. The heterogeneity of equation (21) can be treated, however, under more general conditions by dimensional analysis (Holzlohner 1984, 1985).‘03*’04 No constitutive equations are assumed. E need not be an elastic quantity-only its dimension is assumed to be that of a stress. For any given a of the range 0 a 1, results can be obtained concerning the effect of side ratio and breadth of the footing, mutual dependence of adjacent footing, and depth of influence. Because of the general basis the results should be in agreement with footing behaviour at least in tendency. The results lead to the following comments.
172. In Fig. 8 the Authors compare the average depth of influence of real footings to results of the Gibson soil by equation (20) where E,/ak = 10 and a = 0.1 m. As a general feature of footing behaviour is described this implies the ‘natural length’ of Eo/k = 1 m. Can this strange situation be traced back to geological facts or to engineering practice? One possible explanation is offered in the papers cited above where two limiting cases of a footing on a homogeneously deposited sand are considered: the small footing where the deformation due to the load of the footing outweighs the deformation due to overburden pressures and the large footing where the latter deformation predominates. The same sand half- space reacts as a homogeneous half-space with the small footing whereas it dis- plays increasing stiffness with depth by equation (21) with a = 0.5 in the case of the large footing. Correspondingly, the depth of influence z/B is smaller with the large footing. This agrees with the Authors’ Fig. 8 in principle; z /B is constant, however, for any fixed value of a. A horizontal line in Fig. 8 would not be a bad approx- imation for the observed values for B > 1 m. Cases 27 and 63 may reflect extremely increasing stiffness with depth rather than a general influence of breadth.
173. If the depth of influence depends on the breadth it must also depend on the length of the loaded area. A consistent mechanical model of a soil half-space that behaves otherwise would be extremely unlikely. In the writer’s paper’04 it is shown that the depth of influence should be related to J L B rather than to B. 1644
8917
174. In Fig. 5 the Authors give three charts for assessing the compressibility from plate loading tests. Would not one diagram of p / B against q be suffcient? This would be in agreement with Fig. 21 of Burland et al. (1977)'05 where p/q - B can be read for small footings. In addition, my analysis of the small footing yields p B.
175. Heterogeneity is of such importance that the actual variation of stiffness of every site should be approximated by equation (20) or equation (21) in order to average the N value and to calculate the depth of influence individually. The consideration of the degree of heterogeneity would make it easier to expand the method to other types of soil.
Dr D. A. Greenwood, Cementation Piling and Foundations The writer hesitates to challenge Professor Simons following his contribution to the discussion in which he claimed that the only occasion on which he had ever known the Terzaghi and Peck method of estimating settlements from SPTs to underpredict was in relation to Fawley tanks where predictions less than 50 mm had been exceeded by a measurement of 60 mm. However, having checked the facts the predictions from SPTs were considerably less than 50 mm, and the figure of 60 mm was derived by calculation by finite element methods, as a substitute for measurement following the failure of hydraulic instruments placed below the centre of the tanks in question.
177. This raises the interesting but rather esoteric point that where live loading dominates the ambient stress in the ground below the centre of the loaded area, in dense sands strain stiffening occurs with increasing load which cannot be reflected by SPTs or cone penetrometers or plate tests made from unloaded surfaces. Accordingly with the geometry of such tanks-at Fawley with diameter seven times the depth of sand-and with relative density after compaction in excess of 80% it is almost certain that live load stresses, virtually constant throughout the depth of sand, controlled and increasingly reduced its compressibility under the centre. In contrast at the edges of the tank where loading changes abruptly from zero beyond the perimeter of the tank to full load within the tank and is fairly accurately known, shear strain must contribute significantly and increasingly with load to settlement for the surface footing. Measurements show the perimeter settlements to be remarkably consistent within + 3 mm on 33 mm total. Thus it was probable the Terzaghi and Peck method actually overestimated settlements within the sand at the centre, as usual.
178. This potential for strain hardening arising from contained anisotropic stressing depends on the detail of geometry, initial density, and live load stress intensity. It is rarely a practical issue because most structures apply comparatively small average live loadings. Professor Burland's review probably masks any such effects.
Dr Burland and Mr Burbidge Mr Wilson referred to the slight awkwardness of dealing with the function B'" for rapid site use and wondered whether the chart in Fig. 1 could be more simply presented. In fact Fig. 1 was derived from Fig. 21 which could equally well be used for design purposes.
180. In answer to Mr Wilson's question about the mechanism of time depen- dent settlement it is as yet not well understood. The Authors believe that as compression takes place under increasing load the sand grains move into a denser
1645

DISCUSSION
packing in a series of cascades as arching structures build up and collapse. This process continues at a steadily decreasing rate under constant load due to creep and stress redistribution at the grain contact points. A fluctuating water table could well accelerate such a process.
181. With regard to the question of the influence of foundation depth raised by Mr Wilson the Authors are of the opinion that for deep foundations such as piles, particularly below the water table, the disturbance caused by stress relief due to excavation, seepage and so on is much more significant than the effect of depth of embedment. Thus poor control during excavation and construction could result in a significant increase in the foundation subgrade compressibility.
182. The laboratory study described by Dr Vaughan is of very considerable interest and provides a valuable addition to the Paper. The key feature of the study is that the strains were measured locally on the samples and were therefore unin- fluenced by bedding errors at the end plattens. The importance of accurate mea- surement of small strains is illustrated in Fig. 35 where it is evident that in practice the vertical ground strains will usually be very much less than 0.1%. At strains as small as these, bedding errors will normally swamp any routine determination of strain using external measurements between end plattens.
183. Dr Clayton has reinforced the view expressed in i j 31 that there is a great need for standardizing the SPT. He has also provided evidence to demonstrate that no form of penetration test can determine the compressibility of a granular soil accurately because they are insensitive to stress history. Thus the engineer must appreciate the limitations of any method of settlement prediction based on the results of penetration tests.
184. Professor Rocha Filho has presented some interesting results of plate loading tests on a cemented residual soil derived from the weathering of gneiss. He shows that the empirical correlation given by equation (5) overestimates the settle- ment by between 2.5 and 1.5. As the residual soil must be different from uncemented quartzitic sands in a number of respects it is perhaps surprising that the agreement is as close as it is. No doubt the cementation has contributed to the overprediction of settlement. As emphasized in 9: 23 and by Dr Vaughan caution should be exercised in applying the method to unusual granular materials.
185. The problem of the response of chimneys founded on sand to wind loading has been raised by Dr Ward. The results of the pile tests presented by him suggest that the use of piled foundations does not necessarily eliminate progressive settlement due to wind action. The Authors wonder whether the use of bored piles have done anything to reduce settlements in this case. The disturbance caused by the installation of the piles may well have been counterproductive and serves to underline the point made by the Authors in 4 181 about the possible disturbance caused by excavation.
186. Information was requested by M r Richards about maximum and differen- tial settlements of foundations on sand. It is difficult to make general statements about this as much depends on the degree of heterogeneity of the sand, the relative stiffness of the foundation and the distribution of load. The results plotted in Fig. 30 suggest that a factor of at least 1.5 should be allowed for inherent variability. For the larger structures, such as power stations, settlement observations were made at a number of locations and mean values were used in the analysis. The differences between maximum and minimum settlements were sometimes in excess of a factor of two. With regard to extrapolation of the results to large foundations and very large loads the Authors believe that provided the soil profile over the full
1646

8917
depth of influence is properly accounted for and provided an adequate factor of safety on bearing capacity exists such extrapolation is acceptable.
187. Dr Holzlohner has asked for an explanation for the natural length implied by E& = 1 m for the full line in Fig. 8. A careful reading of 4 61 will show that the sole purpose of the full line was to show that the trend of the field observations in Fig. 8 is broadly in accordance with elastic theory for increasing stiffness with depth. In practice the variation of stiffness with depth will vary from site to site. To fit a horizontal line to the data in Fig. 8 for B 1 m would give undue weight to the results of Kriegel and Weisner which may in any case be influenced by the presence of deep clay layers as discussed in 0 59. Clearly more field measurements are needed of the distribution of settlement with depth.
188. The Authors agree with Dr Holzlohner that the depth of influence depends on the LIB ratio as well as B. Once again more field measurements are required before the significance of LIB can be assessed. The Authors believe that B is the dominant variable. Dr Holzlohner suggested that the three diagrams in Fig. 5 might be plotted as a single diagram of p / B versus q. Without going back to the original data the Authors would hesitate to comment on this possibility except to say that it is only likely to be valid for a strictly limited range of B.
189. M r Coatsworth's discussion is of particular interest because he has analysed a completely independent set of settlement data from Perth. It is gratifying that the measured settlements generally lie within one standard devi- ation of the best estimate of settlement (i.e. a factor of about 1.8) for the method given in the Paper. It is perhaps one of the more important features of the method that it provides the engineer with a measure of the accuracy with which he can expect to estimate settlements on sands and gravels.
190. Professor Simons has described vividly the dilemma facing the engineer when he is faced with making predictions of settlement on sand. The various methods give an unacceptably wide range of predictions and there has been no central framework of theory or empiricism against which to develop judgement. It is hoped that the Paper goes someway to remedying the situation. Clearly what is needed above all else are simple and reliable methods of determining the in situ deformation characteristics of sands and gravels.
References 90. MAAIL S. Comparison of methods of predicting settlement on sand and gravel. MSc.
Thesis, London University, 1985. 91. GIDDINGS, T. Predictions of settlements of shallow footings on sand: some observa-
tions. Ground Profile (Newsletter of Div. of Geotechnical Engng, S. African Inst. Civ. Engrs), 1984,38, April, 22-26.
92. PECK, R. B., HANSQN, W. E. and THORNBURN, T. H. Foundation Engineering. 2nd Edn, Wiley, New York, 1974.
93. DARAMOLA, 0. The influence of stress history on the deformation of sand. PhD Thesis, University of London, 1978.
94. DARAMOLA, 0. The effect of consolidation age on the stiffness of sand. GCotechnique 1980,30,2,31>316.
95. DARAMOLA, 0. On estimating K, for over-consolidated granular soils. Gtotechnque, 1980,30,3,31G313.
96. LAMBE, T. W. The stress path method. J. Soil Mech. Fdns Diu. Am. Soc. Civ. Engrs, 93,
97. DAPPOLONIA D. J., DAPFQLONIA E. and BRISET~E R. F. Settlement of spread footings SM6,309-331.
on sand. J. Soil Mech. Fdns Diu. Am. Soc. Civ. Engrs, 1968,94, SM6,899-915.
1647

DISCUSSION
98. HVORSLEV M. J. Subsurface exploration and sampling ofsoils for Civil Engineering pur- poses. Waterways Experimental Station, Vicksburg, USA, 1949.
99. ROCHA FILHO P. and ROMANEL C. Residual soil elastic properties form in-situ tests. International Symposium on In-Situ Testings, Paris 1983, volume 2,199-223.
100. WHITMAN R. V. and RICHART F. F. Design Procedure for Dynamically Loaded Foun- dations. J . Soil Mech. Fdns Diu. Am. Soc. Ciu. Engrs, 93, SM6, 169-193.
101. COATSWORTH S . R. Predicted and measured settlements of bridge pier foundations on sand-a comparative study. MSc dissertation, Imperial College, University of London, 1985.
102. SCHMERTMANN J. H., HARTMAN J. P. and BROWN P. R. Improved strain influence factor diagrams. Tech. Note. J . Geotech. Engng. Diu., ASCE, Am. Soc. Ciu. Engrs, 1978, 104, GT8.
103. HOLZL~HNER U. Settlements of shallow foundations on sand, Soils Fdns, 1984, 24, 4,
104. HOLZLOHNER U. Sand properties governing foundation settlement, Proc. 11th lnt. Con$
105. BURLAND J. B., BROMS B. B. and DE MELLO V. F. B. Behaviour of foundations and
58-70.
Soi[ Mech. Foundations Engng. San Francisco, 1985,1A25,507-510.
structures, Proc. 9th lnt. Con$ Soil Mech. Foundations Engng, Tokyo 1977,2,495-546.
1648