Embed Size (px)
Citation preview
ISSN 1175-1584
MINISTRY OF FISHERIES
Te Tautiaki i nga fini a Tangaroa
Settlement indices for 2001 for the red rock lobster (Jasus edwardsh)
J. D. Booth J. S. Forman D. R. Stotter
New Zealand Fisheries Assessment Report 2003131 July 2003

Settlement indices for 2001 for the red rock lobster (Jasus edwardsii)
J. D. Booth J. S. Forman D. R Stotter
NIWA Private Bag 14901
Wellington
New Zealand Fisheries Assessment Report 2003131 July 2003
Published by Ministry of Fisheries Wellington
2003
ISSN 1175-1584
@ Ministry of Fisheries
2003
Citation: Booth, J.D.; Forman, J.S.; Stotter, D.R (2003).
Settlement indices for 2001 for the red rock lobster (Jarus edwardsi3. New Zealand Fisheries Assessment Report 2W3/31. 29 p.
This series continues the informal New Zealand Fisheries Assessment Research Dawnent series
which ceased at the end of 1999.

EXECUTIVE SUMMARY
Booth, J.D.; F o m n , J.S.; Stotter, D.R. (2003). Settlement indices for 2001 for the red rock lobster (Jmw edwmrls?.
New Zealand Fsheries Assessment Report 2003131.29 p.
This report addresses the one objective of Ministry of Hsheries project CRA;?00101.
To estimate monthly and annual indices of puerulus settlement at key sites over the main area of the fishery (one site in CRA 1, T a m g a [Bowentown], Gisborne, Napier, Castlepoint, Wellington, Kaikoura, Moeraki, Halfincon Bay, Chalky Inlet, and Jackson Head).
We update and extend the information on spatial and temporal pattems of settlement of the red rock lobster, Jasus edwardrii, on crevice collectors around New Zealand. Levels of settlement in 2001 on the east coast of the country, at least from Gisbome to Kaikoura, were generally low to moderate compared with the time series of previously estimated settlement levels. At most sites, settlement in 2001 was higher than in 2000, in turn greater than the particularly low settlement of 1999. Although still low along the southeast coast of the South Island compared with further north, the sigmficantly higher settlement levels of 2000, the highest since the early 1980s. continued into 2001. Settlement in 2001 was moderate in the southwest of the South Island. We also update the mid-year abundances of 1, 2, and 3-year old juveniles at Wellington where the main change in mid 2002 was a large and unexplained influx of 2 and 3-year olds into two of the sites.

1. INTRODUCTION
1.1 Background
Rock lobsters support one of New Zealand's most valuable fisheries. Understanding larval recruitment processes will greatly assist management of this fishery because it may explain changes in levels of recruitment to the fishery and enable prediction of trends in catch levels at least 4 years in advance, allowing management and commercial strategies to be implemented. This report updates and extends the patterns of spatial and temporal settlement of J a m edwardsii on crevice coIlectors in New Zealand previously reported (Booth et al. 2002a). In so doing, we address the objective of Minktry of Fisheries project CRA200101. We also update the indices of juvenile abundance in relation to the settlement indices at Wellington.
To estimate monthly and annual indices of puerulus settlement at key sites over the main area of the fishery (one site in CRA 1, Tauranga powentown], Gisborne, Napier, Castlepoint, Wellington, Kaikoura, Moeraki, H a l h n Bay, Chalky Inlet, and Jackson Head).
The estimates of settlement have been made available to the National Rock Lobster Management Group (NRL.MG) and the Rock Lobster Working Group (RLWG) during 2002: they were presented to the NRL,MG and the Rock Lobster Research Planning Meeting on 26 September 2002 and to the RLWG on 27 September 2002.
Rock lobsters spend several months as phyllosoma lame in waters tens to hundreds of kilometres offshore. They return to the shore as postlarval pueruli after metamorphosing near the shelf break The puerulus stage is the settling stage: it resembles the juvenile in shape and is 9-13 mm in carapace length (cL), but it-is transparent~p~eki settle when they cease &ive forward swimming i d take residence on the substrate. Some older pueruli and young juveniles, however, move into collectors after first settling elsewhere. Post-settlement migration such as this is common in invertebrates and inour studies we cannot distinguish it kom puerulus settlement except where collectors are cleared after short intervals (e.g., daily). We use the term settlement to encompass both initial puerulus settlement and the capture of animals after post-settlement migration (see Booth 62 Stewart (1993) and Booth & Forman (1995)). The puerulus moults into the f i t juvenile instar (sometimes referred to as the first moult postpuerulus) a few days to 3 weeks after settlement, according to water temperature. Depending on sex and locality, the rock lobster then takes several years to reach minimum legal size.
Monthly occurrence of pueruli and young juveniles on crevice collectors (Booth & Tarring 1986) has been followed at eight or nine key sites within the main rock lobster fishery since the early 1980s. New sites were recently established in CRA 1 and CRA 2. Results h m this and other monitoring show that settlement is not uniform in time or space. Settlement is mainly at night and at any lunar phase, is usually seasonal, and levels of settlement can vary by an order of magnitude or more kom year to year. Since the early 1980s, highest settlement has been along the east coast of the North Island south of East Cape (= southeast North Island or SENI), in the general region of highest offshore abundance of phyllosoma larvae.
1.2 Literature
The only publications on early life history and larval recruitment in J. edwardsii appearing since those referred to by Booth et al. (2002a) were popular articles on the possibility of enhancing juvenile abundance in the wild through the provision of artificial shelters (Anon 2002, Booth et al. 2002b).

1.3 Why estimate relative abundance of early l ie history stages?
Knowing the relative abundance of the early life history stages (phyllosomas, pueruli, and young juveniles) will enhance understanding of the factors that drive fishery recruitment. It may be possible to relate changes in levels of settlement to changes in breeding stock abundance, abundance of advanced stage larvae, and to changes in the ocean climate. In particular, a knowledge of seasonal, annual, and geographic variation in settlement will help us to better understand larval recruitment processes. For example, geographically Merent settlement patterns may be due to the different water masses fiom which the postlanae come. Information on year to year settlement levels may be used to predict trends in redtmenf provide early warning of overfishing, and indicate the extent to which recruitment varies from year to year. Such information can improve the usefulness of fishery assessment models.
The benefits of accurate prediction of recruitment trends are well demonstrated in Western Australia, where there are more than 30 years of settlement data (Phillips et al. 2000). Accurate forecasts allow improved financial plarming and investment by fishers and processors, and proactive rather than reactive fisheries management. Using collectors set in sufficient numbers to deal with spatial variability in settlement is the most cost-effective means of measuring puerulus settlement. Almost every major rock lobster fishery in the world now has in place or is developing such a programme. (Notable recently is the high correlation in Tasmania between settlement of J. edwardrii and subsequent fishery CPUE - Gardner et al. (2001)).
Abundance of juveniles soon after settlement has been an associated estimate at some of the settlement- monitoring sites. There have been good correlations between levels of settlement and juvenile abundance at the sites for which there is sufficient information, although recent work has shown that postlarval recruitment pulses are more efficiently measured on crevice collectors than through dive surveys (Booth et al. 2001). However, provisional results from a comparison of the collector indices, standardised, with the estimated status of the stoclcs based on the length-structured stock assessment model (which primarily uses fishery CPUE and size frequency data) suggest that the settlement data have limited value in explaining or predicting changes in the year by year status of the substocks (Bentley et al., Trophia, unpubl. results). This may be because of the many years delay between settlement and recruitment to the fishery.
The usefulness of the settlemeit data in predicting trendr in recruitment has not yet, however, been tested. It is only since the early to mid 1990s that several fisheries have become largely single-sex (male) fisheries, thus reducing the confounding iduence of males and females recruiting at very different ages. Further, it is only recently that for the east coast (at least 5om Gistiome to Kaikoura) a trend in settlement level over time has become established: among the highest-recorded settlements occurred in the early 1990s, declining to among the lowest-recorded settlements in the late 1990s, followed by a recovery in settlement levels beginning in the early 2000s. Consistent with this, a) the periods of high settlement on the east coast of central New Zealand were followed by periods of high CPUE, and declines in CPUE followed declines in levels of settlement, and b) the stock assessment models suggest that a large recruitment pulse occurred in the northern and central substocks, NSN and NSC, in the early to mid 1990s, followed by much lower recruitment in subsequent years (Sullivan & O'Brien 2002).
The settlement indices remain the only widespread fishery-independent data collected in this fishery. Continuation of the settlement time series will allow the usefulness of the settlement data in predicting trends in recruitment to be tested.

2. SPATIAL AND TEMPORAL PAlTERNS OF SElTLEMENT ., . . ... . .
. . . . . : - . r * . . : ~ . . . ' ~ ~ * , ~ F*",. .::. . . . * . "4- - I Introduction . .. . . .,.. .
Key sites are sampled to follow levels of settlement on crevice collectors along the main rock lobster fishing coasts of New Zealand (Figure I), these sites having been finalised after trials over many years. Each key site is separated ffom its neighbour by 15GI00 km, its location chosen based on the distance ffom the neighbouing site, accessibility, and level of puerulus catch. Other details were given by Booth & Stewart (1993). The recent changes in the key sites include collectors being installed near Jackson Head in 1999 and in CR4 1 and CRA 2 in 199P-2000.
At the key sites, crevice collectors are set in groups of 3-9, with a minimum spacing of 2 m between individual c&ctors. There is usually a core group at each key site; additional groups of collectors are set in both directions along the coast, as conditions allow, 0.1-25 Ian from the core wllectars.
The crevice collectors are either shore, closing, or suspended (see Booth & Tarring 1986 and Phillips & Booth 1994 for collector design) Fable 1). Collectors are checked approximately monthly, at least over the main settlement season, and all lobsters removed (details of methods were given by Booth & Stewart 1993). The index of annual settlement is the mean catch per collector of pueruli, plus juveniles up to and including 14.5 mm CL (the maximum size for a first instar juvenile observed from laboratory studies), of the core collectors over the main settlement season 1 s.e. of that mean. The main settlement season varies between 6 and 10 months according to site, so the nominal values of the mual index are not always directly comparable between sites.
Crevice collectors on the sea floor (shore and closing crevice collectors) provide a combined index of (a) the number of pueruli in the water column which are settling, and @) the result of post-settlement migration, the net number of older animals (older pueruli, and less often, young juveniles) moving onto the collector after having lived on the surrounding sea floor, and animals of similar age moving &om the collector to the surrounding sea floor (Booth & Stewart 1993). Most of the animals on the collectors are from the first group and we assume that for each collector the proportion of each of these groups which make up the index is more or less constant among years. In contrast, crevice collectors suspended above the sea floor or at the surface (suspended crevice collectors, previously referred to as surfadmidwater crevice collectors) provide an index mainly of the number of pueruli in the water column minus emigration. This is because there is less opportunity for inmigration ffom the sea floor (although it can take place over a scale of metres - Booth & Forman (1995)). In this document, the presence in a collector of a puerulus at any stage of development or a first instar juvenile is taken to mean that there has been settlement.
The main settlement season varies according to region (see Booth 1994). Adjacent sites have similar seasons, except for those pairs of sites that straddle regional boundaries. Winter is the most widespread main settlement season.
There is variation in levels of settlement within and among sites. Monthly catches of adjacent collectors within groups at any particular check are often very different, but the average catches of these individual collectors measured over several months or years are usually similar. These results are consistent with spatially uniform settlement over the scale of metres to tens of metres over time intervals of months to years.
Levels of settlement among areas can be compared when the same collection techniques have been used at several sites over a number of years: settlement over the past almost two decades has generally been several times higher in SEN1 than in most other parts of the country. Year to year settlement is correlated between several widespread sites. Changes in the large-scale ocean climate can contribute to changes in the patterns of puerulus recruitment: for example, there is significant positive correlation

between El Niiidouthern Oscillation (ENSO) events and levels of settlement off Western Australia (F'earce & Phillips 1988).
2.2 Collector catches, 2001
Catches for key sites by group and by month are given in Table 2, and for most sites in Figures 2-9. The figures and table also show the 2001 catches against those of previous years.
2.2.1 Houhora
This is a new site, so settlement data are still sparse. Collector catch rates during 2001 were very low, most lobsters being taken during winter (not shown).
2.2.2 Bowentown
Again, this is a new site. Collector catch rates during 2001 were low, most lobsters being taken during summer and winter (not shown).
2.2.3 Gisborne
Although well up on the record low of 1999,2001 was a low to moderate settlement year (Figure 2). As in previous years, settlement on all collectors peaked in winter and there was little summer settlement. Outside the port, the Whangara collectors had highest levels of settlement, while Kaiti catches were the lowest (Table 2).
2.2.4 Napier
Although well up on 1999, the record recent low year, 2001 was only a moderate settlement year (Figure 3, Table 2). The Harbour collectors had the highest catches of all groups, Cape Kidnappers the lowest. Settlement peaked during winter.
2.2.5 Castlepoint
Settlement in 2001 remained low, at similar levels to 2000 but up on the record low year of 1999 (Figure 4). On all groups of collectors, settlement took place throughout the year, except for late winter and early spring. There was unusually high settlement on all collectors in November. The Castlepoint collectors had the highest settlement rates, Mataikona the lowest (Table 2). The Orui collectors (including additional ones installed in an attempt to deal with collectors becoming filled with sand) remained sanded for most of the year.
2.2.6 Wellington
Settlement on all collectors peaked in summer and autumn (Figure 5). Catch rates during 2001 were moderate, at similar levels to 2000 but up on the recent record low year of 1999. Highest settlement was again recorded at Island Bay, the lowest at Breaker Bay (Table 2).

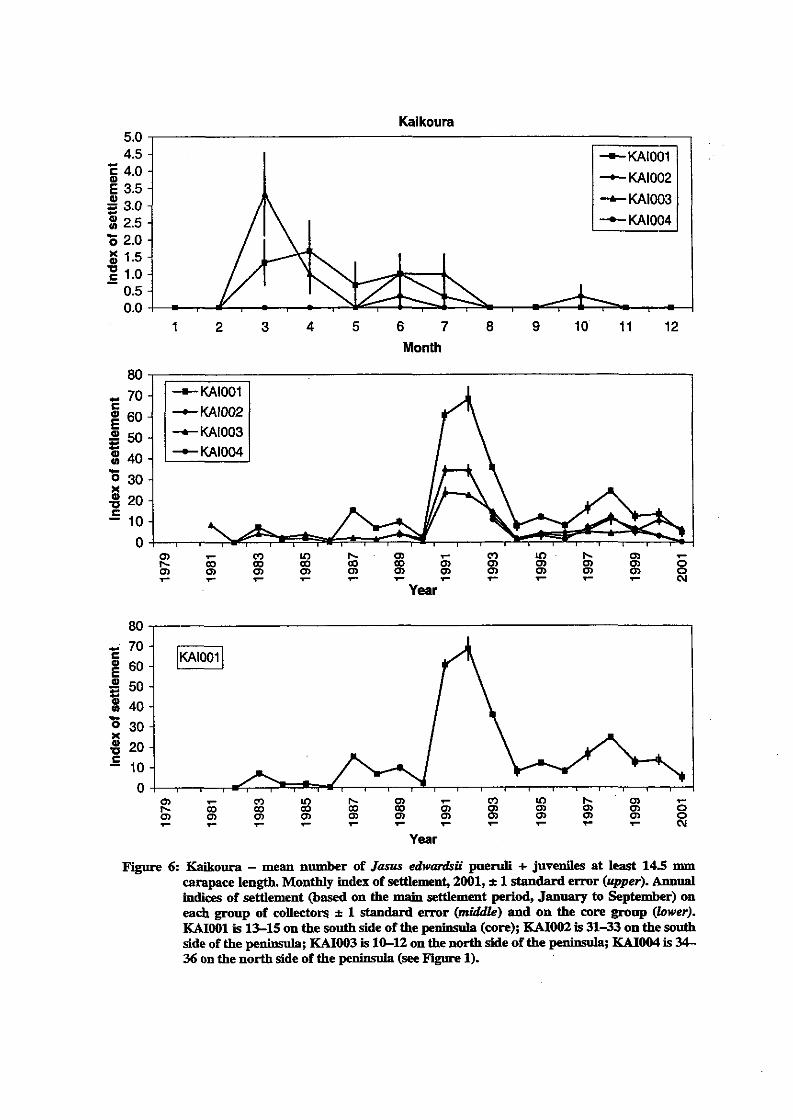
2.2.7 Kaikoura
In 2001, catch rates were down on 2000, and were the lowest since 1990 (Figure 6, Table 2). Most settlement was during autumn and winter with no sumn-m peak evident.
2.2.8 Moeraki
The upturn in settlement levels seen in 2000 continued into 2001, with most settlement taking place during winter (Figure 7). Collectors installed in Moeraki Bay continue to have the highest catches (Table 2).
2.2.9 Halfmoon Bay
The slight improvement in settlement levels seen in 2000 continued into 2001, most settlement taking place during late winter (Figure 8, Table 2).
2.2.10 Chalky Inlet
Settlement was highest in winter and low in spring but the remoteness of this site meant several of the monthly checks were missed (Figure 9, Table 2). Like 2000,2001 was a moderate settlement year.
2.2.11 Jackson Bay
Settlement levels continued at about the same (low) level seen in 2000 (Table 2), the most successful collectors being the wharf ones (not shown). This is a relatively new site for which the logistics of monthly checks of all groups of collectors are still being determined.
2.2.12 Summary
Generally, 2001 was a low to moderate settlement year on collectors &om Gisborne to Halfmoon Bay compared with the time series of estimated settlement levels for each site. At most sites, 2000 and 2001 were up on 1999, which had among the lowest recorded levels of settlement. The most dramatic change in settlement levels for the east coast of the country was in the southeast of New Zealand (southeast South Island and east coast Stewart Island, SENZ), particularly Moerald, where the greatly i n m e d levels of settlement in 2000 continued into 2001. At Chalky Inlet, settlement in 2001 was moderate c o m p d with the time series of estimated settlement levels.
The within-site patterns reported by Booth et al. (2000) persisted: there were often significant differences in the levels of settlement between groups of collectors within sites and sometimes this difference was large. Seasonality between groups at particular sites was, however, generally consistent. The most widespread main settlement season is winter, but along the east coast of central New Zealand (Castlepoint to Kaikoura), settlement in summer and autunm can be at least as high as in winter. However, in 2001 no summer settlement was registered at Kaikoura. The reasons for these seasonalities, and their variation between areas, remain unclear.
The Jackson Head site has not been long enough established for patterns of settlement to be evident: It usually takes at least a year for collectors to fully condition and at least 1-2 years for groups of

collectors to be set up to adequately represent the prevailing settlement levels. Settlement on the four groups of collectors currently in place (Jackson Bay Wharf, two groups just inside Jackson Head, and one group at Smoothwater Bay) bas been highest in spring.
2.3 Variability among sites over the long term
The geographic pattern in settlement on the collectors in 1994-98 was similar to that seen through the 1980s, in that settlement on the east coast was generally high as far south as about Cook Strait. In contrast, during 1991-93 the area of high settlement extended further south, to at least Kaikowa (but not as far south as the south side of Banks Peninsula). In 1999, settlement along the east coast of the North Island was exceptionally low, about the same as on the east coast of the South Island, although it improved slightly in 2000, and still further in 2001. However, in both 2000 and 2001 there was a marked increase in settlement levels in SENZ, at Moeraki, to a level similar to that of the early 1980s. In the southwest of the South Island, at Chalky Inlet, the levels of settlement on the collectors for most years have been moderate to high compared with those in SENZ.
2.4 Reasons for spatial variation in settlement
The much higher levels of settlement usually seen on collectors along SENI compared with those along SENZ is consistent with the pattem of phyllosoma abundance found in all widespread sampling (Booth 1994) and with the later plankton surveys in April 1994, March 1995, and February 1998 (see Booth et al. 2001). Advanced phyllosomas (those at and beyond Stage 5) were widespread and abundant off SENI, catches being orders of magnitude greater than off SENZ. It was concluded that regional differences in phyllosoma abundance were likely to be a major determinant of the differences in levels of settlement seen between SENI and SENZ. This in turn seemed to be closely related to the abundance of breeders, the oceanography, and certain environmental factors such as the persistence of southerly storms (see Booth et al. 2000). Unfortunately, there are not any more recent data on phyllosoma distributions or abundance, but we contend that the low to moderate levels of settlement along SEN in 1999-2001 were probably due more to the La NSia conditions than to any reduced abundance offshore of phyllosomas. The increased settlement off SENZ in 2000-01 could have been a result of increased numbers of advanced phyllosomas there. It is interesting that this increased settlement in SENZ took place in the face of La Nfia conditions, which would normally be expected to act against higher settlement given the pattern further north.
2.5 Year to year variation in settlement over the long term
Indices of year to year settlement on the core collectors at the key sites given above and in Table 2 update those given by Booth et al. (2002a). Levels of annual settlement remain ~ i ~ c a n t l y correlated among sites along the east coast ftom Gisbome south (Gisbome-NapierCastlepoint; Moeraki-Halhoon Bay) (Table 3). Interannual levels of settlement between groups of collectors within the key sites with sufficient data are usually highly correlated (not shown).
On the east coast of the country, there was generally high settlement in 1981, 1983, 1987, and 1989. Settlement in 1991, 1992, and 1993 was also high, and in 1998 moderate, for sites at least as far south as Kaikoura. This suggests that factors that drive larval recruitment affect wide areas.
Settlement in SENZ has been low, except in the early 1980s, and in 2001M1 when it increased markedly at Moeraki.

Settlement was moderate to high in the southwest of the South Island during 1987-91, in 1994, during 1996-97, and in 200041; it was low in 1992,1993,1995, and 1998-99.
3. JUVENILE ABUNDANCE IN RELATION TO LEVELS OF SETnEMENT
3.1 Introduction
The abundance of 1, 2, and 3 year old juveniles can be a check on the usefulness of collectors to distinguish high and low years of puerulus recruitment and can also provide insight into the ecological processes taking place after settlement. Here we report the mid-year abundances of juveniles for Wellington for 2002. W lobsters are those immediately post-settlement and up to but less than 1 year of age, 1+ lobsters are 1 but under 2 years of age, and so on.
3.2 Wellington
The abundance ofjuveniles has been followed at least quarterly since 1993 or 1994 until 2000 at several sites on the south Wellington coast (Palmer Head End Rock and Split Rock], Moa Point, and Island Bay [Coast and Island]) and one site within Wellington Harbour (Kaiwharawhara) (Booth et al: 2002a). After 2000, surveys have taken place mid-year only.
The juvenile abundance survey method was descnid by Booth et al. (2002a). To summarise, the same spots (isolated reef, crevice, hole, most being at 5-9 m depth) at each site were surveyed each sampling period. Sites were approached cautiously so as to minimise disturbance to any lobsters present. If lobsters moved back into crevices where they could not be clearly observed, the site was surveyed later in the dive. Sizes of lobsters were estimated in 5 mm intervals for animals 30-80 mm CL; those bigger than 80 rnm CL were grouped. A lobster at 30 mm CL was estimated to be between 27.5 and 32.5 mrn CL. Divers each enmed the accuracy of their lobster size estimations before and during m y i n g . Surveys were conducted in one of two ways depending on the diver, the site, and the number of lobsters present. In the first methcd, all individual lobsters of the same size were counted at once, usually starting with the smallest size groups. In the second, the size of each individual was estimated and recorded as the diver worked through the group of animals; this method was best when the lobsters were in a row, such as in a crack, or were in small groups. With both methods, the measuring stick was frequently used during counts to confirm lobster sizes. Animals moving during the count were sometimes a problem, addressed by starting the count again or returning to the den later in the dive. Juveniles at I+ were uncommon in all sampling, probably because of their small size and cryptic behaviour. Surveys made at individual sites over successive days showed small variation in counts (Stotter, pas. obs.).
The results for Kaiwharawhara, sampled almost evay 3 months fiom June 1993 to September 2000 and again in mid 2001 and 2002, are consistent with low settlement since the high settlement years of 1991 and 1992: 2 and 3 year olds were present in large proportion only until 1994 and 1995 respectively (Figure 10). However results fiom the other sites are less consistent with the settlement record. The abundances of 2+ and 3+ juveniles at Palmer Head and Moa Point, although reasonably consistent with the previous settlement levels until mid 2001, were disproportionately high in mid 2002 ( F i w 1 l- 12). At Island Bay (two areas combined), 2+ and 3+ lobsters were not particularly well represented when sampling began in mid 1994, then became generally more abundant but with large year to year variations (Figure 13). Correlation values and significances between settlement levels and juvenile abundances, and correlations of abundance between different annual cohorts, were given in detail in Booth et al. (2002a). The reasons for the differences between sites, as well as the unexpected increases in abundance of 2+ and 3+ juveniles at Palmer Head and Moa Point by mid 2002, remain obscure but

may be related to local, small-scale spatial patterns of settlement and dispersion of juveniles varying over the study period.
4. MANAGEMENT IMPLICATIONS
Although the 1999 and 2000 settlement levels for nearly all SEN1 sites were very low in relation to the time series of settlement estimates - about 20% or less of those of the recent peak years 1991-92 - settlement in 2001 was closer to the average. In most areas the fishery is still largely dependent on just a few newly recruited year classes (Ministry of Fisheries and S e a m data). Nowhere else are the implications of the recent settlement estimates likely to be more marked than at Gisborne, where the fishery is mainly directed at very small, young, newly recruited males (Sullivan & O'Brien 2002). The record low settlement recorded in CRA 3 in 1999, with only a modest increase in 2000, is likely to contribute to even lower recruitment and fishery CPUE than have been seen there in recent years, beginning around 2003. The much improved settlement in 2001 over that in 1999 should mean, however, that any such period of particularly poor recruitment will be short-lived. As always, however, the validity of such predictions can be confounded by variable growth and survival - including density- dependence in these which can smooth peaks and troughs in recruitment - between years, predation, migration, and high levels of illegal fishing.
5. ACKNOWLEDGMENTS
Many people have made this report possible. Our thanks to you all and particularly Andy Bassett, Neil Burden, Bruce Hollows, Bany Home, Simon Marwick, Gany Neave, Craig Petherick, Geoff Robson, Neil Rose, Bill Spanhake, Bob Streef Davy Walters, Peter Young, and Merv Velenski for collector checks and field assistance, and Russell Cole for useful comments and suggestions on our manuscript.
This research (project CRA2001101) was funded by New Zealand's Ministry of Fisheries.
6. REFERENCES
Anon (2002). Enhancing juvenile koura. Aniwaniwa 2 0 2. Booth, J.D. (1994). Jarus edwardrii larval recruitment off the east coast of New Zealand. Crustaceans
66: 295-317. Booth, J.D.; Bradford, E.; Renwick, J. (2000). Jasus edwardrii puerulus settlement levels examined in
relation to the ocean environment and to subsequent juvenile and recruit abundance. New Zealand Fisheries Assessment Report 2000/34.48 p.
Booth, J.D.; Forman, J.S. (1995). Larval recruitment in the red rock lobster, Jasus edwardsii. New Zealand Fisheries Assessment Research Document 9517. 46 p. (Draft report held in NIWA Greta Point library, Wellington.)
Booth, J.D.; Forman, J.S.; Stotter, D.R (1998). Abundance of early life history stages of the red rock lobster, Jasus edwardrii, with management implications. New Zealand Fisheries Assessment Research Document 98110.71 p. (Draft report held in NlWA Greta Point library, Wellington.)
Booth, J.D.; Forman, J.S.; Stotter, D.R. (2002a). Settlement indices for 2000 for the red rock lobster, Jarus edwardrii. New Zealand Fisheries Assessment Report 2002/12.34 p.
Booth, J.; Forman, J.; Jeffs, A. (2002b). Enhancing rock lobster survival. The Lobster Newsletter 15(1): 14-15.
Booth, J.D.; Stewart, R.A. (1993). Puexulus settlement in the red rock lobster, Jasus edwardsii. New Zealand Fisheries Assessment Research Document 9315. 39 p. (Draft report held in NIWA Greta Point library, Wellington.)
Booth, J.D.; Stotter, D.R.; Forman, J.S.; Bradford, E. (2001). Juvenile abundance both mirrors and

masks a settlement pulse of the rock lobster Jasus edwardsii. Marine and Freshwater Research 52: 1067-1075.
Booth, J.D.; Taning, S.C. (1986). Settlement of the red rock lobster, Jasus edwardsii, near Gisbome, New Zealand. New Zealand Journal ofMarine and Freshwater Research 20: 291-297.
Gar&er, C.; Frusher, S.D.; Kennedy, RB.; Cawthorn, A. (2001). Relationship between settlement of southern rock lobster pueruli, Jasw edwardsii, and recruitment to the fishery in Tasmania, Australia. Marine and Freshwater Research 52: 1067-1075.
Phillips, B.F.; Booth, J.D. (1994). Design, use, and effectiveness of collectors for catching the puerulus stage of spiny lobsters. Raiavs in Fishen'es Science 2: 255-289.
Phillips, B.F.; Cruz, R.; Caputi, N.; Brown, R.S. (2000). Predicting the catch of spiny lobster fisheries. In: Spiny lobsters. Fisheries and culture. Phillips, BE.; Kittaka, J. (eds) pp. 357-375. Blackwell Science, Oxford.
Pearce, A.F.; Phillips, B.F. (1988). ENS0 events, the Leeuwin Current, and larval recruitment of the western rock lobster. Journal du Conseil Intematio~lpour I'Eaploration de la Mer 45: 13-21.
Sullivan, K.J.; O'Brien, C.J. (2002). Report from the Mid-Year Fishery Assessment Plenary, November 2002: stock assessment and yield estimates. (Draft report held in NIWA Greta Point library, Wellington.)

Table 1: Collector type ahd number by site, and main settlement season. For definitions of collector type, see Booth & Tarring (1986) and Phillips & Booth (1994). Not all sites have a designated core se t
Site Houhora
Bowentown
Gisborne
Napier
Castiepoint
Wehgton
Kaikow
Moeraki
No. collectors Core group
HalhoonBay 3 3 3 3 3
Chalky Inlet 6
JacksonHead 3
3
3
3
GIs002
NAP001 I
m o o 1
KAIOOl
MOEOO 1
HMBOOl
m o o 1
Additional P U P S HOU001 HOU002 BOW001 BOW002
GIs001 GIs003 GISOW
NAP002 NAP003 NAPOW
m o o 2 CF'T003 WGTOOl WGTOO2 WGM03 WGT004
KAI002 WOO3 W o o 4
MOE002 MOEO04 MOEOOS MOE006
HMB002 m o o 3 HMBO04 m o o 5
JACOOl
JACQ02
JACOO3
JACOW
Main settlement
Location TYPe season Heads Suspended ? Henderson Shore ? Papatu Shore ? Yellow Shore ? Whangara Shore Apr-Oct Harbour Suspended Tatapomi Shore Apr-Oct Kaiti Shore Apr-Oct Harbour suspended AprSep Westshore Closing Apr-Sep C. Kidnappers Shore A~r*ep Breakwater Shore A ~ r S e p Castlepoint Shore DecSep Orui Shore D e w Mataikona Shore Decsep Island Bay Shore ]-May
LPll Bay Shore J d a y Breaker Bay Shore l d a y Palmer Head Shore Jan-May South 13-15 Shore la"-% South 3 1-33 Shore J M e p North 10-12 Shore J=-% North 34-36 Shore J d e p Shag Point Shore Ma1-0ct wharf Closing Mar* MillersBeach Shore Mar-Oct The Kaik Shore Mat-Oct Kakanui Shore Mar-Oct Wharf Suspended May433 Thompsons Closing May-Oct Old Mill Closing May-Oct The Neck Closing May-Oct Mamaku Point Closing MapOct Shallow Closing Mar-Oa Passage Jackson Bay Suspended Mar-Oct wharf Jackson Head Closing Mar-Oct Inner Jackson Head Closing Mar* Outer Smoothwater Closing Mar-Oct Bay

Table 2: Annual settlement indices (mean number of pueruli +juveniles at least 145 mm carapace length per collector during the main settlement season -see Table 2) on core (usually, but not always, 001) and additional groups of collectors at the key sites to 2001. Collectors are all crevice collectors. GISOOl is Harbour 1-5 at Gisborne, GISOOZ is Whangara 1-5, GIs003 is Tatapouri 1-5, and GIs004 is Kaiti 1-5; NAP001 is Harbour 1-6 at Napier, NAP002 is Westshore 1-3, NAP003 is Cape Kidnappers 1-5, and NAP004 is Breakwater 1-3; CPTOOl is Castlepoint 1-9 at Castlepoint, CPTOOZ is Orui 1-5, and CPT003 is Mataikona 1-5; WGTOOl is Island Bay 1-3, WGTOOZ is LyaU Bay 1-3, WGT003 is Breaker Bay 1-3, and WGT004 is Palmer Head 1-3; KAIOOl is South 13-15 on the Kaikoura Peninsula, K.1002 is South 31-33, K.1003 is North 10-12, and W W is North 34-36; MOEOOI is Shag Point 1-4 near Moeraki, MOE002 is Wharf 1-3, MOE004 is Millers Beach 1-3, MOE005 is The Kaik 1-3, MOE006 is Kakanui 1-3, Overall is an index based on at least nine collectors each month, but the collectors checked were not always the same; H M B O O l is Wharf 1-3 in H a h o o n Bay, Stewart Island, J3MJ3002 is Thompsons 1-3, -003 is Old Mill 1-3, HMB004 is The Neck 1-3, and HMB005 is M a e Point 1-3; CHA is Chalky Inlet 1-6. Settlement (Overall) at Houhora @IOU), Bowentown (BOW), and Jackson Head (JAC) was usually based on at least nine collectors checked each month but more rigorous treatment of these results was not appropriate. Columns give mean catch across the collectors 1 s.e. of that mean; -, no data.
Houhora Overall 2001 0.5
Bowentown Overall 2001 3.2
Gisbome. 1987 1988 1989 1990 1991 1992 1993 1994 1995 1996 1997 1998 1999 2000 200 1
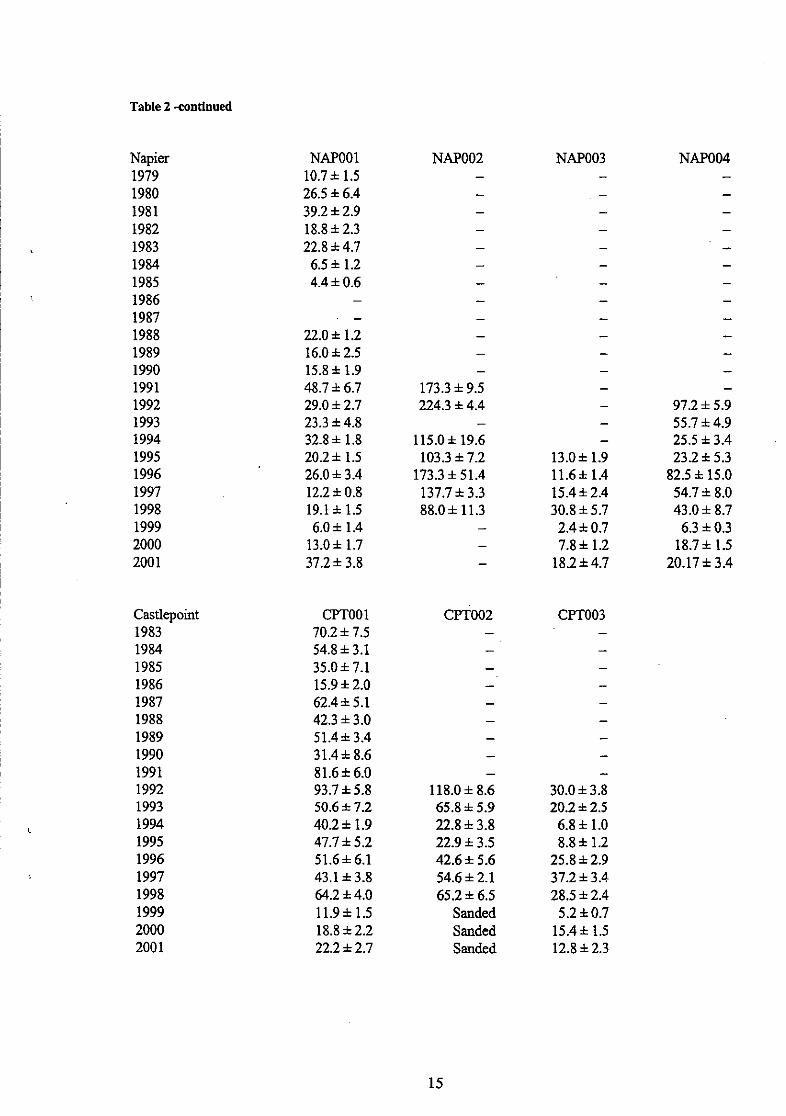
Table 2 -continued
Napier 1979 1980 1981 1982 1983 1984 1985 1986 1987 1988 1989 1990 1991 1992 1993 1994 1995 1996 1997 1998 1999 2000 2001
NAPOW
Castlepoint 1983 1984 1985 1986 1987 1988 1989 1990 1991 1992 1993 1994 1995 1996 1997 1998 1999 2000 2001
m o o 1 70.2 * 7.5 54.8 * 3.1 35.05 7.1 15.9 i 2.0 62.4* 5.1 42.3 * 3.0 51.4i3.4 31.4i 8.6 8l.6* 6.0 93.7 * 5.8 50.6 5 7.2 40.2 i 1.9 47.7 i 5.2 51.6*6.1 43.1 i 3.8 64.2 * 4.0 11.9* 1.5 18.8 * 2.2 22.2 i 2.7
- 118.0 i 8.6 65.8 * 5.9 22.8 5 3.8 22.9 * 3.5 42.6 5 5.6 54.6 i 2.1 65.2 i 6.5
Sanded Sanded Sanded

Table 2 -continued
Wellington 1981 1982 1983 1984 1985 1986 1987 1988 1989 1990 1991 1992 1993 1994 1995 1996 1997 1998 1999 2000 2001
Overall 6.3 0.2 3.7 0.4 - - - - - -
- - -
6.6 4.9 4.2
22.8 5.3 3.0
14.2 12.3
WGTOOl 6.3 0.2 3.7 0.4 - - - - - - - - -
11.7 i 2.0 4.7 i 1.8 7.3 i 1.2
57.0 * 5.6 10.0 i 1.0 7.0 i 2.3
19.7 & 1.2 21.3 i 4.9
W O O 1 - 0
7.2 i 1.2 1.7 i 0.3 2.0 i 0.6 0.3 i 0.3
15.2 i 0.6 6.7 i 0.9 9.7 & 1.5 2.3 * 1.5
60.7 * 2.2 68.5 i 5.7 35.7* 1.2 7.8 i 2.1
12.0 * 1.2 8 .0 i 1.3
16.3 i 2.7 24.5 1.2 12.5 i 0.7 13.5 i 2.4 5.0 i 2.1

Table 2 -continued
Moeraki Overall 1981 1982 1983 1984 1985 1986 1987 1988 1989 1990 1991 1992 1993 1994 1995 1996 1997 1998 1999 2000 2001
Halfinoon Bay 1981 1982 1983 1984 1985 1986 1987 1988 1989 1990 1991 1992 1993 1994 1995 1996 1997 1998 1999 2000 2001
MOEOOl MOE002 - - - -
4.3 * 1.9 - 0.7 * 0.3 -
0 - 0 -
3.3 * 1.0 3.7 * 1.0 0 0
4.7 * 1 2 2.0 * 0.6 0.8 i 0.7 -
0 0 0.5 A 0.3 0.5 * 0.3
0 0 0.5 i 0.3 0
0 0.3 kO.6 0.4 0.3 3.3 .t 2.3
0 1.7 * 0.3 - 2.0 *o - 0.3 * 0.3 - 11.7i0.3 - 8.7 *4.1

Table 2 -continued
Chalky Inlet CHAOO 1 1987 53.3 i 5.3 1988 49.1 * 5.2 1989 67.0 i 9.0 1990 35.5 i 4.2 1991 37.9 * 6.1
CHAOO 1 CHAOO 1 1992 13.5i1.7 1997 47.3 i 9.5 1993 5.3 i 0 . 7 1998 5.0i 1.1 I994 90.5 * 21.3 1999 12.3 1.7 1995 19.0 2.9 2000 33.7zk2.9 1996 37.6 4.7 2001 29.6 * 4.8
Jackson Head Overall 2000 5.9 2001 6.3
Table 3: Pearson correlation coefficients for the pattern of year to year settlement (mean number of puernli + juveniles at least 145 mm carapace length per collector during the main settlement season) on core conectors among some key sites (insufficient data for J a c b n Bay). GIS, Gisborne (1992-2001); NAP, Napier (1979-85,1988-2001); CPT, Castlepoint (1983-2001); KAI, Kaikoura (1982-2001); MOE, Moeraki overall (1981-2001); HMB, Halfmoon Bay (1981-2001); CBA, Chalky Met (1987-2001); degrees of freedom are given in parentheses; P < 0.05, ** P < 0.01, *** P < 0.001; other correlations not significant.
GIs NAP CPT KAI MOE HMB
NAP 0.74(8)* CF'T 0.80(8)** 0.45(15) KAI 0.61(8) 0.53(16)* 0.70(17)*** MOE -0.21(8) 0.29(17) -0.24(17) -0.18(18) HMB 0.31(8) 0.42(17) 0.22(17) -0.06(18) . 0.71(19) *** CHA 0.11(8) 0.17(12) -0.09(13) -0.38(13) 0.07(13) 0.15(13)

...... krn
Jackson Bay I
Gisborne
,.! . Napier Westshore (1-3)
Breakwater (1-3)
Kidnapper: (1-5)
Kaikoura
1 O.,
krn
Figure 1: Map of New Zealand showing Location of collectors at the key monitoring sites. The insets &ow the numbers and arrangement of coUectors at sites with more than one set of coUectors *, are group dmllcetors where one has been nominated.

Gisborne
1 2 3 4 5 6 7 8 9 10 11 12
Month
Year
90 -,
Year
Figure 2: Giiborne -mean number of Jasus edwanisii pueruli +juveniles at least 145 mm carapace length per collector. Monthly index of settlement, 2001, * 1 standard error (upper). Annual indices of settlement (based on the main settlement period, April to October) on groups of wJIeftors + 1 standard error (middle) and on the core group (lower). GISOOl is the Harbour group; GIs002 is Whangm (core); GI5003 is TatapoPri, GIS004 is Kaiti (see F i 1). GIs001 is not shown on the middle panel because it obscures and confuses the interannual pattern (see Booth et aL 1998).

1 2 3 4 5 6 7 8 9 10 11 12 Month
O i l 4 , , , c , 3 , , , 8 , , , , , $ L , = , , -
Year
5 50-
.h 0 8 20 u c 10
m 7 m LD b m - m LD IC m 7
Ic w m m m w m m m m m 0 ? z z z z z z z z z z 0 N
Year
F i e 3: Napier - mean number of Jasus edwardrl' pueruli +juveniles at least 14.5 mm earapace length per couector. Monthly index of settlement, 2001, + 1 standard ermr (upper). Annual indices of settlement (based on the main settlement period, April to September) on each group of coUectors * 1 standard ermr (mLtfie) and on the core group (lower). NAPOOl is the Harbour group (core); NAP002 is Westshore; NAP003 is Cape Kidnappers; NAP004 is Breakwater (see Figure 1). CoUector positions and deployment changed after 1985; no data available for 1986-87.

Castlepoint 9.0 ,
1 2 3 4 5 6 7 8 9 10 11 12 Month
Year
Year
Figure 4: Castlepoint - mean number of Jarus edwanlrh' pueruli + juveniles at least 145 nrm carapace length per coUector. Monthly index of settlement, 2001, & 1 standard error (upper). Annual indices of settlement on the main settlement period, December to September) on each group of coUectors i 1 standard error (middle) and on the core group (lower). CPTOOl is the core group at Castlepoint; CPTOO2 is Orui, CPlW3 is Mataikona (see Figurr 1). There were no data for CPTOO2 for 1999 or 2000 because the collectors were sanded over.

Wellington 14.0 7
1 2 3 4 5 6 7 8 9 10 11 12 Month
X 0 20-
E l o -
O T , ,*, 1 r 8 , 8 8 8 , #&>
Year
Year
F i 5: Wellington - mean number of Jasus edwardsii pueruli + juveniles at least 1 4 5 mm carapace length per collector. Monthly index of settlement, 2001, i 1 standard error (upper). Annual indices of settlement @as& on the main settlement period, January to May) on each group of collectors + 1 standard error (middle) and an index based on all collectors each month (but the collectors checked were not always the same) (lower). WGTOOl is Island Bay (core); WGT002 is LyaU Bay; WGT003 is Breaker Bay;WGT004 is Palmer Head (see F i e 1).
Kaikoura 5.0 4.5 - + KA1001
-KA1002 E 3.5 -
KA1004
1 2 3 4 5 6 7 8 9 10 11 12
Month
Year
Figure 6: Kaikoura - mean number of Jasur edwardrii pueruli + juveniles at least 145 mm carapace length. Monthly index of settlement, 2001, * 1 standard error (upper). Annual indices of settlement (based on the main settlement period, January to September) on each group of collectors * 1 standard error (middle) and on the core gronp (lower). KAI00l is 13-15 on the south side of the peniasula (core); KAI002 is 31-33 on the south side of the peninsula; KAI003 is 10-12 on the north side of the peninsula; KAI004 is 34- 36 on the north side of the peninsula (see F i 1).

Moeraki 7.0 1 I
1 2 3 4 5 6 7 8 9 10 11 12 Month
Year
, , , # , # - m LD I. m 7 m LD m - k m m m m m m m m m 0 m 7
m m m m 7
m 7
m 7
m 7
m 7 7
m 7 7 7 8
Year
F i 7: Mwraki - mean number of Jarw edwardsii pueruli + juveniles at least 145 mm carapace length per collector. Monthly index of settlement, 2001, + 1 standard error (upper). Annual index of settlement based on the main settlement period (March to October) (middk) and an index based on at least nine collectors each month (but the collectors checked were not always the same) (lower). MOEOOl is Shag Point 1-4, MOE002 is Pier 1-3, MOE004 is Millers Beach 1-3, MOE005 is The Kaik 1-3, MOE006 is Kakanui 1-3 (see Figure 1). No data for 1998-2000 for MOE001.

Halfmoon Bay 3.5 ,
1 2 3 4 . 5 6 7 8 9 10 11 12
Month
Year
Year
Figure 8: Halhnoon Bay - mean number of Jarus e d w d i i pueruli +juveniles at least 14.5 mm' carapace length. Monthly index of settlement, 2001,2 1 standard error (upper). Annual indices of settlement (based on the main settlement period, May to October) on each group of coUectors + 1 standard e m r (mriddlP) a d on the core group (lower). HMBOOl is under the wharf (core); HMBOOZ is Thompson's Nugget; HMB003 is Old Mill, -004 is the Neck; EMBOOS is Mamaku Point (see Figure 1).

Chalky Inlet . '
12
1 2 3 4 . 5 6 7 8 9 10 1 1 12 Month
Year
F i e 9: Chalky Inlet (Blind Enhance) - mean number of Jasus e d w d pueruli +juveniles at least 145 mm carapace length. Monthly index of settlement, 2001, t 1 standard error (upper). Annual indim of settlement (based on the main settlement period, March to October) on the one group of coUectors (+ 1 standard error, lower).

- - 0 - - C P T Kaiwharawhara --0--KAI
d -x- 3+
1990 1991 1992 1993 1994 1995 1996 1997 1998 1999 2000 2001
Year
Figure 10: Juvenile year-class abundance of J a m edwahu at Kaiwharawhara, Wellington Harbour, each June 1993-2002 plotted agninst the year of settlement and the Castlepoint (CPT) and Kaikoura (KAI) settlement indices. See text for further details.
1990 1991 1992 1993 1994 1995 1996 1997 1998 1999 2000 2001 Year
Figure 11: Juvenile year-class abundance of Jaus edwardsii at Palmer Head, Wellington, each June 1993-2002 plotted against the year of settlement and the Castlepoint ( C m and Knikoura (KAI) settlement indices. See text for further details.

1990 1991 1992 1993 1994 1995 1996 1997 1998 1999 2000 2001
Year
Figure 12: Juvenile year-elass abundance of Jasus edwardsii at Moa Point, Wellington, each June 1993-2002 plotted against the year of settlement and the Castlepoint (CPT) and Kaikoura (KAI) settlement indices. See text for further details.
1990 1991 1992 1993 1994 1995 1996 1997 1998 1999 2000 2001
Year
Figure 13: Juvenile year-class abundance of Jasus edwardsii at Island Bay, Wellington, each June 199442 plotted against the year of settlement and the Castlepoint (CPT) and Kaikoura 0 settlement indices. See text for further details.