Embed Size (px)
Citation preview

SET A
Rajasthan Institute of Engineering & Technology, Jaipur
I Mid Term examination Session: 2018-19
Sem:7th & Branch CSE Subject “Data Mining &
Warehousing”
Time: 2 hrs. M.M.:20
Q.1 (A) What do you mean by data reduction and what is the different process of data
reduction?(2.5)
Solution:
Data reduction is the process of minimizing the amount of data that needs to be stored in a data
storage environment. Data reduction can increase storage efficiency and reduce costs.
Data reduction can be achieved using several different types of technologies. The best-known
data reduction technique is data deduplication, which eliminates redundant data on storage
systems. The deduplication process typically occurs at the storage block level. The system
analyzes the storage to see if duplicate blocks exist, and gets rid of any redundant blocks. The
remaining block is shared by any file that requires a copy of the block. If an application attempts
to modify this block, the block is copied prior to modification so that other files that depend on
the block can continue to use the unmodified version, thereby avoiding file corruption.
Some storage arrays track which blocks are the most heavily shared. Those blocks that are shared
by the largest number of files may be moved to a memory- or flash storage-based cache so they
can be read as efficiently as possible.
1.data cube aggregation.
2.attributed subset selection
3.data compresstion
4 numerosity reduction
5discretization and concept hierarchy generation.
(B) How do you fill the missing values of the data? (2.5)
Solution:

OR
Q.1 Suppose a group of 12 sales price records has been sorted as follows :
5,10,11,13,15,35,50,55,72,92,204,215 partition them into three bins by each of the following
methods:
I) equal-frequency (equidepth) partitioning
(2)
ii) equal-width partitioning (2)
Iii) Clustering
(1)
Solution:
Missing values are a common occurrence, and you need to have a strategy for treating them. A missing value can signify a number of different
things in your data. Perhaps the data was not available or not applicable or the event did not happen. It could be that the person who entered the
data did not know the right value, or missed filling in. Data mining methods vary in the way they treat missing values. Typically, they ignore
the missing values, or exclude any records containing missing values, or replace missing values with the mean, or infer missing values from
existing values.
Missing Values Replacement Policies:
Ignore the records with missing values.
Replace them with a global constant (e.g., ―?‖).
Fill in missing values manually based on your domain knowledge.
Replace them with the variable mean (if numerical) or the most frequent value (if categorical).
Use modeling techniques such as nearest neighbors, Bayes’ rule, decision tree, or EM algorithm.

Q.2 (a)Explain data transformation methods.
(2.5)
Solution:
In this preprocessing step, the data are transformed or consolidated so that the resulting mining
process may be more efficient, and the patterns found may be easier to understand.
Data Transformation Strategies Overview
In data transformation, the data are transformed or consolidated into forms appropriate for
mining. Strategies for data transformation include the following:
1. Smoothing,.
2. Aggregation
3. generalization
4. Normalization
(b) What do you mean by data mining? Briefly explain knowledge discovery as a process.
(2.5)
Solution:
Data mining refers to extracting or ―mining‖ knowledge from large amounts of data.
Many other terms carry a similar or slightly different meaning to data mining, such as
knowledge mining from data, knowledge extraction, data/pattern analysis, another popularly
used term, Knowledge Discovery from Data, or KDD.

Essential step in the Process of knowledge discovery. Knowledge discovery as a process is
depicted in Figure consists of an iterative sequence of the following steps:
Data cleaning: to remove noise and inconsistent data
Data integration: where multiple data sources may be combined
Data selection: where data relevant to the analysis task are retrieved from the database
Data transformation: where data are transformed or consolidated into forms appropriate for
mining by performing summary or aggregation operations, for instance
Data mining: an essential process where intelligent methods are applied in order to extract data
patterns
Pattern evaluation to identify the truly interesting patterns representing knowledge based on
some interestingness measures;
Knowledge presentation where visualization and knowledge representation techniques are
used to present the mined knowledge to the user

The architecture of a typical data mining system may have the following major components
Database, data warehouse, Worldwide Web, or other information repository: This is one or a set
of databases, data warehouses, spreadsheets, or other kinds of information repositories. Data
cleaning and data integration techniques may be performed on the data.
Database or data warehouse server: The database or data warehouse server is responsible for
fetching the relevant data, based on the user’s data mining request.
Knowledge base: This is the domain knowledge that is used to guide the search or evaluate the
interestingness of resulting patterns. Such knowledge can include concept hierarchies, used to
organize attributes or attribute values into different levels of abstraction. Other examples of
domain knowledge are additional interestingness constraints or thresholds, and metadata (e.g.,
describing data from multiple heterogeneous sources).

OR
Q.2 (a)What are the different levels of analysis in data mining?
(2.5)
Data Analysis
Data analysis is concerned with a variety of different tools and methods that have been
developed to query existing data, discover exceptions, and verify hypotheses. These include:
Queries and Reports. A query is simply a question put to a database management system,
which then generates a subset of data in response. Queries can be basic (e.g., show me Q3 sales
in Western Europe) or extremely complex, encompassing information from a number of data
sources, or even a number of databases stored within dissimilar programs (e.g., a product catalog
stored in an Oracle database, and the product sales stored under Sybase). A well-written query
can exact a precise piece of information; a sloppy one may produce huge quantities of worthless
or even misleading data.
Managed Query Environments. The term managed query environment has been adopted by the
industry to describe a query and reporting package that allows IT control over users' access to
data and application facilities in accordance with each user's level of expertise and business
needs. For example, in some organizations, IT may build a set of queries and report structures
and require that employees use only the IT-created structures; in other organizations, and perhaps
within other areas of the same organization, employees are permitted to define their own queries
and create custom reports.
.
Online Analytical Processing (OLAP). The most popular technology in data analysis is OLAP.
OLAP servers organize data into multidimensional hierarchies, called cubes, for high-speed data
analysis. Data mining algorithms scan databases to uncover relationships or patterns. OLAP and
data mining are complementary, with OLAP providing top-down data analysis and data mining
offering bottom-up discovery.
OLAP tools allow users to drill down through multiple dimensions to isolate specific data items.
For example, a hypercube (the multidimensional data structure) may contain sales information
categorized by product, region, salesperson, retail outlet, and time period, in both units and
dollars. Using an OLAP tool, a user need only click on a dimension to see a breakdown of dollar
sales by region; an analysis of units by product, salesperson, and region; or to examine a
particular salesperson's performance over time.
Information can be presented in tabular or graphical format and manipulated extensively. Since
the information is derived from summarized data, it is not as flexible as information obtained
from an ad hoc query; most tools offer a way to drill down to the underlying raw data. For
example, PowerPlay provides the automatic launch of its sister product, Impromptu, to query the
database for the records in question.
Although each OLAP product handles data structures and manipulation in its own way, an
OLAP API, developed by a group of vendors who form the OLAP Council, standardizes many
important functions and allows IT to offer the appropriate tool to each of its user groups. The
MD-API specifies how an OLAP server and client connect, and it defines metadata, data fetch
functions, and methods for handling status messages. It also standardizes filter, sort, and cube
functions; compliant clients are able to communicate with any vendor's compliant server.
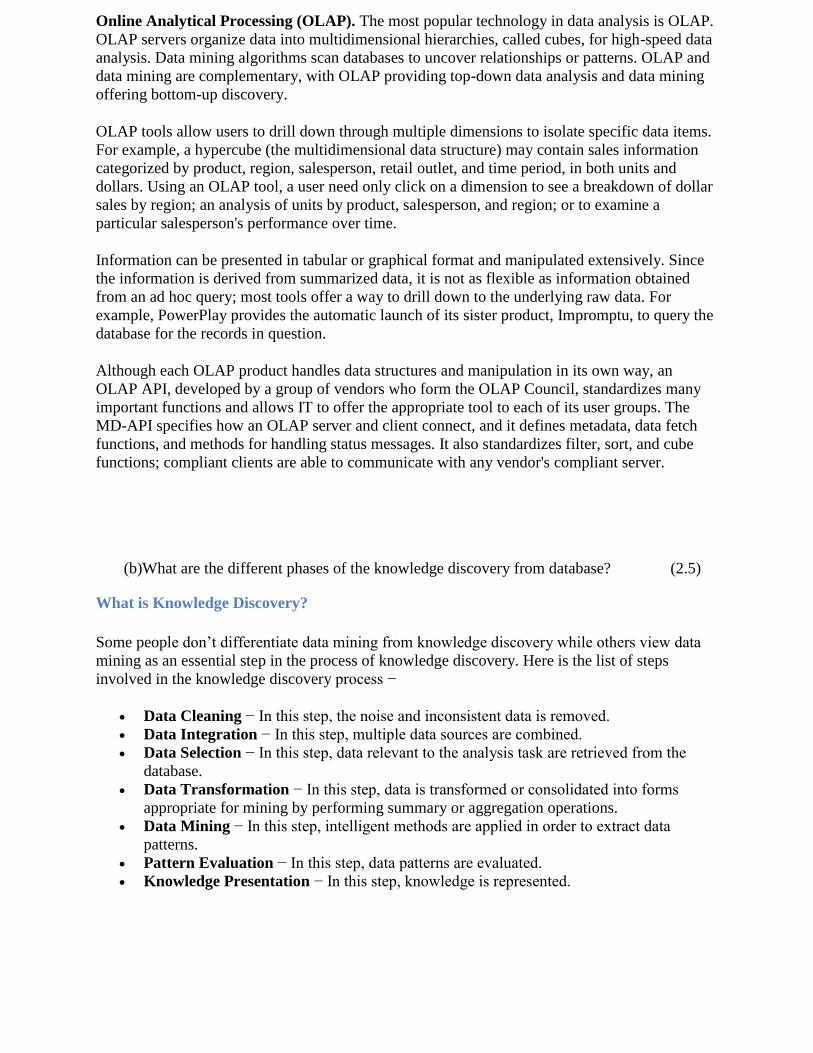
(b)What are the different phases of the knowledge discovery from database? (2.5)
What is Knowledge Discovery?
Some people don’t differentiate data mining from knowledge discovery while others view data
mining as an essential step in the process of knowledge discovery. Here is the list of steps
involved in the knowledge discovery process −
Data Cleaning − In this step, the noise and inconsistent data is removed.
Data Integration − In this step, multiple data sources are combined.
Data Selection − In this step, data relevant to the analysis task are retrieved from the
database.
Data Transformation − In this step, data is transformed or consolidated into forms
appropriate for mining by performing summary or aggregation operations.
Data Mining − In this step, intelligent methods are applied in order to extract data
patterns.
Pattern Evaluation − In this step, data patterns are evaluated.
Knowledge Presentation − In this step, knowledge is represented.

Q.3(a) Describe in detail the apriori algorithm.
(3)
Apriori Algorithm
Apriori algorithm is a classical algorithm in data mining. It is used for mining frequent itemsets
and relevant association rules. It is devised to operate on a database containing a lot of
transactions, for instance, items brought by customers in a store.
It is very important for effective Market Basket Analysis and it helps the customers in
purchasing their items with more ease which increases the sales of the markets. It has also been
used in the field of healthcare for the detection of adverse drug reactions. It produces association
rules that indicates what all combinations of medications and patient characteristics lead to
ADRs.
Support
The support of an itemset X, supp(X) is the proportion of transaction in the database in which the
item X appears. It signifies the popularity of an itemset.
supp(X)=Number of transaction in whichXappearsTotal number of transactions.
In the example above, supp(Onion)=46=0.66667.
If the sales of a particular product (item) above a certain proportion have a meaningful effect on
profits, that proportion can be considered as the support threshold. Furthermore, we can identify
itemsets that have support values beyond this threshold as significant itemsets.
Confidence
Confidence of a rule is defined as follows:
conf(X⟶Y)=supp(X∪Y)supp(X)
It signifies the likelihood of item Y being purchased when item X is purchased. So, for the rule
{Onion, Potato} => {Burger},
(b) Write short notes on:
(2)
i. Quartiles
Solution: A quartile is a type of quantile. The first quartile (Q1) is defined as the
middle number between the smallest number and the median of the data set. The
second quartile (Q2) is the median of the data. The third quartile (Q3) is the middle
value between the median and the highest value of the data set.

ii. Range
Solution: The range of a set of data is the difference between the highest and
lowest values in the set
iii. Outliers
Solution: An outlier is an observation that lies an abnormal distance from other
values in a random sample from a population. In a sense, this definition leaves it
up to the analyst (or a consensus process) to decide what will be considered
abnormal. Before abnormal observations can be singled out, it is necessary to
characterize normal observations.
iv. Boxpots
Solution: The box plot (a.k.a. box and whisker diagram) is a standardized way of
displaying the distribution of data based on the five number summary: minimum,
first quartile, median, third quartile, and maximum. In the simplest box plot the
central rectangle spans the first quartile to the third quartile (the interquartile
range or IQR). A segment inside the rectangle shows the median and "whiskers"
above and below the box show the locations of the minimum and maximum.
OR
Q.3 (a) Describe techniques to improve efficiency of mining association rules. (2.5)
(b)Explain in brief the measure of central tendency. (2.5)
Solution:
Introduction
A measure of central tendency is a single value that attempts to describe a set of data by
identifying the central position within that set of data. As such, measures of central tendency are
sometimes called measures of central location. They are also classed as summary statistics. The
mean (often called the average) is most likely the measure of central tendency that you are most
familiar with, but there are others, such as the median and the mode.
The mean, median and mode are all valid measures of central tendency, but under different
conditions, some measures of central tendency become more appropriate to use than others. In
the following sections, we will look at the mean, mode and median, and learn how to calculate
them and under what conditions they are most appropriate to be used.

Mean (Arithmetic)
The mean (or average) is the most popular and well known measure of central tendency. It can
be used with both discrete and continuous data, although its use is most often with continuous
data (see our Types of Variable guide for data types).
Median
The median is the middle score for a set of data that has been arranged in order of magnitude.
The median is less affected by outliers and skewed data.
Mode
The mode is the most frequent score in our data set. On a histogram it represents the highest bar
in a bar chart or histogram. You can, therefore, sometimes consider the mode as being the most
popular option.
Q.4 What is Market Basket problem? How it classifies the input data? (5)
Solution:
Market Basket Analysis is a modelling technique based upon the theory that if you buy a certain
group of items, you are more (or less) likely to buy another group of items. For example, if you
are in an English pub and you buy a pint of beer and don't buy a bar meal, you are more likely to
buy crisps (US. chips) at the same time than somebody who didn't buy beer.
The set of items a customer buys is referred to as an itemset, and market basket analysis seeks to
find relationships between purchases.
Typically the relationship will be in the form of a rule:
IF {beer, no bar meal} THEN {crisps}.
The probability that a customer will buy beer without a bar meal (i.e. that the antecedent is true)
is referred to as the support for the rule. The conditional probability that a customer will
purchase crisps is referred to as the confidence.
The algorithms for performing market basket analysis are fairly straightforward (Berry and
Linhoff is a reasonable introductory resource for this). The complexities mainly arise in
exploiting taxonomies, avoiding combinatorial explosions (a supermarket may stock 10,000 or
more line items), and dealing with the large amounts of transaction data that may be available.
A major difficulty is that a large number of the rules found may be trivial for anyone familiar
with the business. Although the volume of data has been reduced, we are still asking the user to
find a needle in a haystack. Requiring rules to have a high minimum support level and a high
confidence level risks missing any exploitable result we might have found. One partial solution
to this problem is differential market basket analysis, as described below.

OR
Q.4 What are advantages and disadvantages of decision tree approach over other (5)
Solution: Decision trees are diagrams that attempt to display the range of possible outcomes and
subsequent decisions made after an initial decision. For example, your original decision might be
whether to attend college, and the tree might attempt to show how much time would be spent
doing different activities and your earning power based on your decision. There are several
notable pros and cons to using decision trees.
Decision trees are diagrams that attempt to display the range of possible outcomes and
subsequent decisions made after an initial decision.
For example, your original decision might be whether to attend college, and the tree might
attempt to show how much time would be spent doing different activities and your earning
power based on your decision. There are several notable pros and cons to using decision trees.
Advantage 1: Decision trees implicitly perform variable screening or feature selection
We described here why feature selection is important in analytics. We also introduced a few
common techniques for performing feature selection or variable screening. When we fit a
decision tree to a training dataset, the top few nodes on which the tree is split are essentially the
most important variables within the dataset and feature selection is completed automatically!
Advantage 2: Decision trees require relatively little effort from users for data preparation
To overcome scale differences between parameters - for example if we have a dataset which
measures revenue in millions and loan age in years, say; this will require some form of
normalization or scaling before we can fit a regression model and interpret the coefficients. Such
variable transformations are not required with decision trees because the tree structure will
remain the same with or without the transformation.
Another feature which saves data prep time: missing values will not prevent splitting the data for
building trees. This article describes how decision trees are built.
Decision trees are also not sensitive to outliers since the splitting happens based on proportion of
samples within the split ranges and not on absolute values.
...
Advantage 3: Nonlinear relationships between parameters do not affect tree performance
As we described here, highly nonlinear relationships between variables will result in failing
checks for simple regression models and thus make such models invalid. However, decision trees
do not require any assumptions of linearity in the data. Thus, we can use them in scenarios where
we know the parameters are nonlinearly related.

Advantage 4: The best feature of using trees for analytics - easy to interpret and explain to
executives!
Decision trees are very intuitive and easy to explain. Just build one and see for yourself!
These advantages need to be tempered with one key disadvantage of decision trees: without
proper pruning or limiting tree growth, they tend to overfit the training data, making them
somewhat poor predictors.
SET B
Rajasthan Institute of Engineering & Technology, Jaipur.
I Mid Term examination Session: 2018-19
Sem:7th & Branch CSE Subject “Data Mining &
Warehousing”
Time: 2 hrs. M.M.:20
Q.1 (a) Explain the issues and usefulness of data mining? (2.5)
Solution:
Major Issues In Data Mining
The scope of this book addresses major issues in data mining regarding mining methodology,
user interaction, performance, and diverse data types. These issues are introduced below:

1. Mining methodology and user-interaction issues. These reect the kinds of knowledge
mined, the ability to mine knowledge at multiple granularities, the use of domain knowledge,
ad-hoc mining, and knowledge visualization.
Mining different kinds of knowledge in databases.
Since different users can be interested in different kinds of knowledge, data mining should
cover a wide spectrum of data analysis and knowledge discovery tasks, including data
characterization, discrimination, association, classification, clustering, trend and deviation
analysis, and similarity analysis. These tasks may use the same database in different ways and
require the development of numerous data mining techniques.
Interactive mining of knowledge at multiple levels of abstraction.
Since it is difficult to know exactly what can be discovered within a database, the data mining
process should be interactive. For databases containing a huge amount of data, appropriate
sampling technique can first be applied to facilitate interactive data exploration. Interactive
mining allows users to focus the search for patterns, providing and refining data mining requests
based on returned results. Specifically, knowledge should be mined by drilling-down, rolling-
up, and pivoting through the data space and knowledge space interactively, similar to what
OLAP can do on data cubes. In this way, the user can interact with the data mining system to
view data and discovered patterns at multiple granularities and from different angles.
Incorporation of background knowledge.

Background knowledge, or information regarding the domain under study, may be used to guide
the discovery process and allow discovered patterns to be expressed in concise terms and at
different levels of abstraction. Domain knowledge related to databases, such as integrity
constraints and deduction rules, can help focus and speed up a data mining process, or judge the
interestingness of discovered patterns.
Data mining query languages and ad-hoc data mining.
Relational query languages (such as SQL) allow users to pose ad-hoc queries for data retrieval.
In a similar vein, high-level data mining query languages need to be developed to allow users to
describe ad-hoc data mining tasks by facilitating the speci_cation of the relevant sets of data for
analysis, the domain knowledge, the kinds of knowledge to be mined, and the conditions and
interestingness constraints to be enforced on the discovered patterns. Such a language should be
integrated with a database or data warehouse query language, and optimized for e_cient and
exible data mining.
Presentation and visualization of data mining results.
Discovered knowledge should be expressed in high-level languages, visual representations, or
other expressive forms so that the knowledge can be easily understood and directly usable by
humans. This is especially crucial if the data mining system is to be interactive. This requires
the system to adopt expressive knowledge representation techniques, such as trees, tables, rules,
graphs, charts, crosstabs, matrices, or curves.
Handling outlier or incomplete data.

The data stored in a database may reect outliers | noise, exceptional cases, or incomplete data
objects. These objects may confuse the analysis process, causing over_tting of the data to the
knowledge modelconstructed. As a result, the accuracy of the discovered patterns can be poor.
Data cleaning methods and data analysis methods which can handle outliers are required. While
most methods discard outlier data, such data may be of interest in itself such as in fraud
detection for Finding unusual usage of tele-communication services or credit cards. This form
of data analysis is known as outlier mining.
Pattern evaluation: the interestingness problem.
A data mining system can uncover thousands of patterns. Many of the patterns discovered may
be uninteresting to the given user, representing common knowledge or lacking novelty. Several
challenges remain regarding the development of techniques to assess the interestingness of
discovered patterns, particularly with regard to subjective measures which estimate the value of
patterns with respect to a given user class, based on user beliefs or expectations. The use of
interestingness measures to guide the discovery process and reduce the search space is another
active area of research.
2. Performance issues. These include efficiency, scalability, and parallelization of data mining
algorithms.
Efficiency and scalability of data mining algorithms.
To effectively extract information from a huge amount of data in databases, data mining
algorithms must be efficient and scalable. That is, the running time of a data mining algorithm
must be predictable and acceptable in large databases. Algorithms with exponential or even
medium-order polynomial complexity will not be of practical use. From a database perspective

on knowledge discovery, efficiency and scalability are key issues in the implementation of data
mining systems. Many of the issues discussed above under mining methodology and user-
interaction must also consider efficiency and scalability.
Parallel, distributed, and incremental updating algorithms.
The huge size of many databases, the wide distribution of data, and the computational
complexity of some data mining methods are factors motivating the development of parallel and
distributed data mining algorithms. Such algorithms divide the data into partitions, which are
processed in parallel. The results from the partitions are then merged. Moreover, the high cost
of some data mining processes promotes the need for incremental data mining algorithms which
incorporate database updates without having to mine the entire data again \from scratch". Such
algorithms perform knowledge modification incrementally to amend and strengthen what was
previously discovered.
3. Issues relating to the diversity of database types.
Handling of relational and complex types of data.
There are many kinds of data stored in databases and data warehouses. Since relational
databases and data warehouses are widely used, the development of efficient and effective data
mining systems for such data is important. However, other databases may contain complex data
objects, hypertext and multimedia data, spatial data, temporal data, or transaction data. It is
unrealistic to expect one system to mine all kinds of data due to the diversity of data types and
different goals of data mining. Specific data mining systems should be constructed for mining
specific kinds of data. Therefore, one may expect to have different data mining systems for
different kinds of data.
Mining information from heterogeneous databases and global information systems.
Local and wide-area computer networks (such as the Internet) connect many sources of data,
forming huge, distributed, and heterogeneous databases. The discovery of knowledge from
di_erent sources of structured, semi-structured, or unstructured data with diverse data semantics
poses great challenges to data mining. Data mining may help disclose high-level data
regularities in multiple heterogeneous databases that are unlikely to be discovered by simple
query systems and may improve information exchange and interoperability in heterogeneous
databases.
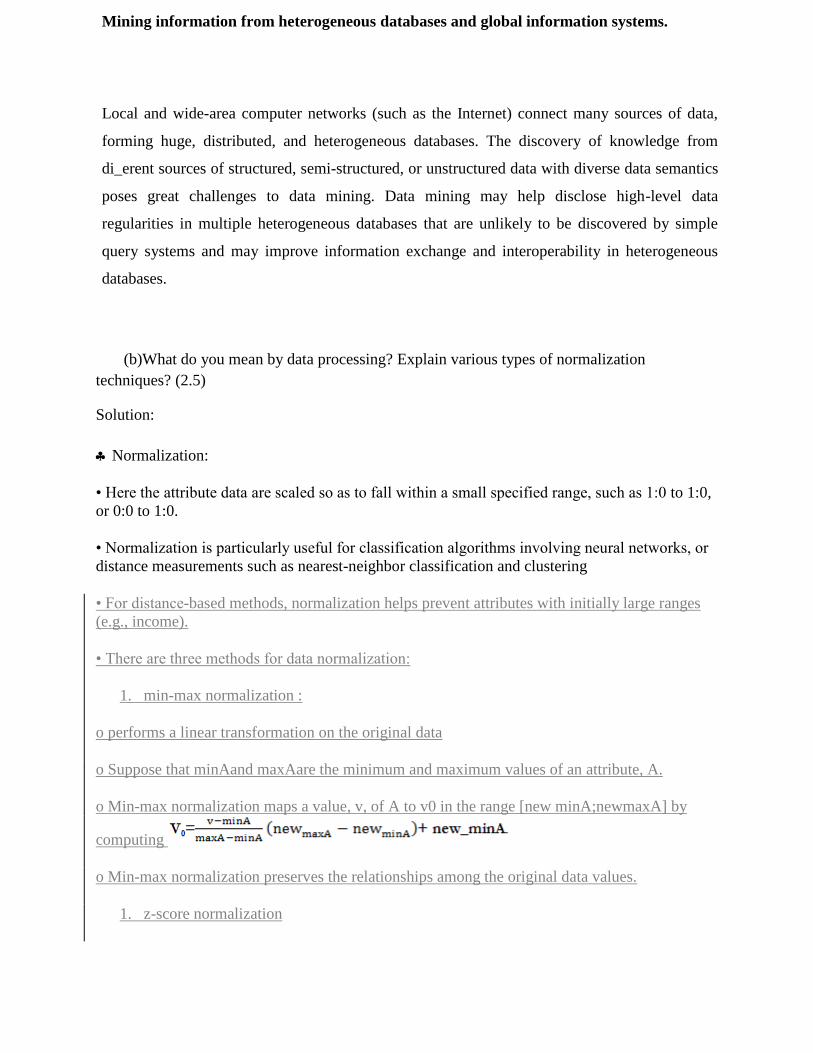
(b)What do you mean by data processing? Explain various types of normalization
techniques? (2.5)
Solution:
Normalization:
• Here the attribute data are scaled so as to fall within a small specified range, such as 1:0 to 1:0,
or 0:0 to 1:0.
• Normalization is particularly useful for classification algorithms involving neural networks, or
distance measurements such as nearest-neighbor classification and clustering
• For distance-based methods, normalization helps prevent attributes with initially large ranges
(e.g., income).
• There are three methods for data normalization:
1. min-max normalization :
o performs a linear transformation on the original data
o Suppose that minAand maxAare the minimum and maximum values of an attribute, A.
o Min-max normalization maps a value, v, of A to v0 in the range [new minA;newmaxA] by
computing
o Min-max normalization preserves the relationships among the original data values.
1. z-score normalization

o Here the values for an attribute, A, are normalized based on the mean and standard deviation of
A.
o Value, v of A is normalized to v0 by computing , where A and σA are the mean and
standard deviation, respectively.
o This method of normalization is useful when the actual minimum and maximum of attribute
Aare unknown, or when there are outliers that dominate the min-max normalization.
1. normalization by decimal scaling:
o Here the normalization is done by moving the decimal point of values of attribute A.
o The number of decimal points moved depends on the maximum absolute value of A.
o Value, v of A is normalized to v0 by computing where j is the smallest
integer such that Max
OR
Q.1 (a) What do you mean by data reduction and what is the different process of data reduction?
(2.5)
Solution:
Data reduction is the process of minimizing the amount of data that needs to be stored in a data
storage environment. Data reduction can increase storage efficiency and reduce costs.
Data reduction can be achieved using several different types of technologies. The best-known
data reduction technique is data deduplication, which eliminates redundant data on storage
systems. The deduplication process typically occurs at the storage block level. The system
analyzes the storage to see if duplicate blocks exist, and gets rid of any redundant blocks. The
remaining block is shared by any file that requires a copy of the block. If an application attempts
to modify this block, the block is copied prior to modification so that other files that depend on
the block can continue to use the unmodified version, thereby avoiding file corruption.
Some storage arrays track which blocks are the most heavily shared. Those blocks that are shared
by the largest number of files may be moved to a memory- or flash storage-based cache so they
can be read as efficiently as possible.
1.data cube aggregation.
2.attributed subset selection
3.data compresstion
4 numerosity reduction
5discretization and concept hierarchy generation.

(b) Explain data discretization and concept hierarchy of generation. (2.5)
Solution:
Data Discretization and Concept Hierarchy Generation
Data Discretization techniques can be used to divide the range of continuous attribute into
intervals.Numerous continuous attribute values are replaced by small interval labels.
This leads to a concise, easy-to-use, knowledge-level representation of mining results.
Top-down discretization
If the process starts by first finding one or a few points (called split points or cut points) to split
the entire attribute range, and then repeats this recursively on the resulting intervals, then it is
called top-down discretization or splitting.
Bottom-up discretization
If the process starts by considering all of the continuous values as potential split-points, removes
some by merging neighborhood values to form intervals, then it is called bottom-up
discretization or merging.
Discretization can be performed rapidly on an attribute to provide a hierarchical partitioning of
the attribute values, known as a concept hierarchy.
Concept hierarchies
Concept hierarchies can be used to reduce the data by collecting and replacing low-level
concepts with higher-level concepts.
In the multidimensional model, data are organized into multiple dimensions, and each dimension
contains multiple levels of abstraction defined by concept hierarchies. This organization provides
users with the flexibility to view data from different perspectives.
Data mining on a reduced data set means fewer input/output operations and is more efficient than
mining on a larger data set.
Because of these benefits, discretization techniques and concept hierarchies are typically applied
before data mining, rather than during mining.
Discretization and Concept Hierarchy Generation for Numerical Data
Typical methods
1 Binning

Binning is a top-down splitting technique based on a specified number of bins.Binning is an
unsupervised discretization technique.
2 Histogram Analysis
Because histogram analysis does not use class information so it is an unsupervised discretization
technique.Histograms partition the values for an attribute into disjoint ranges called buckets.
3 Cluster Analysis
Cluster analysis is a popular data discretization method.A clustering algorithm can be applied to
discrete a numerical attribute of A by partitioning the values of A into clusters or groups.
Each initial cluster or partition may be further decomposed into several subcultures, forming a
lower level of the hierarchy.
Some other methods are
Entropy-Based Discretization
Discretization by Intuitive Partitioning
Q.2 (a)Describe the major elements of data mining. (2.5)
Solution:
1. Accuracy
As with any technical solution or authoritative resource, the value is only as good as the quality.
When preparing a data mining tool, ensuring the sources you are looking to gather information
from to add into the data set has to be accurate. Without ensure the quality of the data at the base
level, any strategy or technology built from erroneous data will lead you to erroneous
conclusions that will dramatically impact your results.
A retailer, for example, may want to gather a pricing from a variety of competitors. In
preparing to harvest that information, there are several considerations:
Season: Is the pricing based on the season, geography, current trend?
Source: Is the price source an outlet, manufacture, discount retailer or reseller?
Product: Is the price for the same product or a variation?
Data gathering tools have to have the ability to differentiate the types of data they are gathering
if you aren’t able to do the heavy lifting of programmatically ensuring the data is accurate and
aligned to the reason you’re harvesting.
2. Relevancy
Context matters when it comes information, so when a simple tool or programmed solution
works to support data harvesting efforts, it may miss out on some of the context needed to ensure

the source it is harvesting from is relevant. Machine learning and AI technology are starting to
bridge the gap, ―teaching‖ crawlers to acknowledge context. IBM points to three types of context
in particular when talking about machine learning: industry, data, and transfer.
If you are crafting a MySQL or other programming data aggregator, then your code cannot
recognize context. More sophisticated tools learn about the context of the data set by using
accumulated data and logical expressions to refine the automated parameters of the harvest.
Controlling the list or set of sources used in data mining can help keep the data relevant as well–
combine with ML or AI technology, and your data sets will revolutionize how you operate,
impacting your bottomline.
3. Specificity
Is there anything worse in data than abstract? Nope. As of 2017, there are 2.5 quintillion bytes of
data produced every day. Obviously, you don’t want to harvest or scrape all of that data. But,
you do want to mine it for vital information that should inform you business strategy,
competitive planning, and industry awareness. Without ensuring that the data your collecting is
specific to your goals, customers, and industry niche, you’re wasting time, energy, and money.
You can ensure specificity by limiting the number of sources, the types of sources targeted in
your data mining efforts, and controlling the depth of your effort. It isn’t always necessary to
follow every lead, link or graphic. Limiting the depth of the mining effort will help you collect
the data you need without pulling in iterations of the same data or duplicate content replicated
across several resources.
Finding Valuable Data
Not sure where to start or if you have the ability currently to mine the data you need?
Connotate’s unique data mining platform can provide customized data mining and you can easily
train the machine-intelligent agent to provide the right data, from the right sources, for the
insight you’re looking for. This can be accomplished easily, by non-technical personnel, which
saves resources and allows you to focus on putting the information you gather to good use, fairly
quickly.
Start mining valuable information from competitive or market data sets to fuel your business. To
learn more about Connotate and our unique, machine-learning platform, request a consultation.
(b)Explain the term missing value, Noisy data and data cleaning.
(2.5)
Solution:
Missing value:
Missing data can occur because of nonresponse: no information is provided for one or more
items or for a whole unit ("subject"). Some items are more likely to generate a nonresponse than
others: for example items about private subjects such as income. Attrition is a type of
missingness that can occur in longitudinal studies—for instance studying development where a

measurement is repeated after a certain period of time. Missingness occurs when participants
drop out before the test ends and one or more measurements are missing.
Nosiy data:
Noisy data is meaningless data. The term has often been used as a synonym for corrupt data.
However, its meaning has expanded to include any data that cannot be understood and
interpreted correctly by machines, such as unstructured text. Any data that has been received,
stored, or changed in such a manner that it cannot be read or used by the program that originally
created it can be described as noisy.
Data Cleaining:
Data cleaing is use to remove nosiy data from the knwolege base data. And produce the accurate
solution to the user to perform information from the data.
OR
Q.2 a) What is data integration and transformation? Explain with example.
(2.5)
Aggregation:
• Here summary or aggregation operations are applied to the data.
• This step is typically used in constructing a data cube for analysis of the data at multiple
granularities.
• Aggregation is a form of data reduction.
Generalization :
• Here low-level or ―primitive‖ (raw) data are replaced by higher-level concepts through the use
of concept hierarchies.
• For example, attributes, like age, may be mapped to higher-level concepts, like youth, middle-
aged, and senior.
• Generalization is a form of data reduction.
b) Explain data cube aggregation in brief.
(2.5)

solution: What are Cube Aggregates?
Definition
An aggregate is a materialized, summarized and condensed view of the data in an Info Cube. An
aggregate maintain the dataset of an Info Cube redundantly and persistently.
Summarized and Condensed view refers to the condensing of the fact table of an Info
cube to an aggregate table.
An aggregate table no longer contains certain characteristics of the Info cube and has
been condensed across attributes.
Q.3 Assume the user specified minimum support is 50% the transaction database show below:
(5)
Tid A B C D E F
T1 1 0 1 1 0 0
T2 0 1 0 1 0 0
T3 1 1 1 0 1 0
T4 0 1 0 1 0 1
APPLY apriori algorithm to generate frequent item set on the above transaction.
Solution:
OR
Q.3 Explain the following terms with suitable example
(5)
(I)Support - Support

The support of an itemset X, supp(X) is the proportion of transaction in the database in which the
item X appears. It signifies the popularity of an itemset.
supp(X)=Number of transaction in whichXappearsTotal number of transactions.
In the example above, supp(Onion)=46=0.66667.
If the sales of a particular product (item) above a certain proportion have a meaningful effect on
profits, that proportion can be considered as the support threshold. Furthermore, we can identify
itemsets that have support values beyond this threshold as significant itemsets.
(II) Confidence- Confidence
Confidence of a rule is defined as follows:
conf(X⟶Y)=supp(X∪Y)supp(X)
It signifies the likelihood of item Y being purchased when item X is purchased. So, for the rule
{Onion, Potato} => {Burger},
(III) Association rule - Association rules are if/then statements that help uncover relationships
between seemingly unrelated data in a relational database or other information repository. An
example of an association rule would be "If a customer buys a dozen eggs, he is 80% likely to
also purchase milk."
An association rule has two parts, an antecedent (if) and a consequent (then). An antecedent is an
item found in the data. A consequent is an item that is found in combination with the antecedent.
Association rules are created by analyzing data for frequent if/then patterns and using the criteria
support and confidence to identify the most important relationships. Support is an indication of
how frequently the items appear in the database. Confidence indicates the number of times the
if/then statements have been found to be true.
In data mining, association rules are useful for analyzing and predicting customer behavior. They
play an important part in shopping basket data analysis, product clustering, catalog design and
store layout.
Programmers use association rules to build programs capable of machine learning. Machine
learning is a type of artificial intelligence (AI) that seeks to build programs with the ability to
become more efficient without being explicitly programmed.

(IV) IQR - Any set of data can be described by its five number summary. These five numbers,
in ascending order, consist of:
The minimum, or lowest value of the dataset
The first quartile Q1 - this represents a quarter of the way through the list of all the data
The median of the data set - this represents the midpoint of the list of all of the data
The third quartile Q3 - this represents three quarters of the way through the list of all the
data
The maximum, or highest value of the data set.
(V) Percentile- A percentile (or a centile) is a measure used in statistics indicating the value
below which a given percentage of observations in a group of observations fall. For example, the
20th percentile is the value (or score) below which 20% of the observations may be found.
The term percentile and the related term percentile rank are often used in the reporting of scores
from norm-referenced tests. For example, if a score is at the 86th percentile, where 86 is the
percentile rank, it is equal to the value below which 86% of the observations may be found
(carefully contrast with in the 86th percentile, which means the score is at or below the value of
which 86% of the observations may be found - every score is in the 100th percentile). The 25th
percentile is also known as the first quartile (Q1), the 50th percentile as the median or second
quartile (Q2), and the 75th percentile as the third quartile (Q3). In general, percentiles and
quartiles are specific types of quantiles.
Q.4 What is Market Basket problem? How it classifies the input data?
(5)
Solution:
Market Basket Analysis is a modelling technique based upon the theory that if you buy a certain
group of items, you are more (or less) likely to buy another group of items. For example, if you
are in an English pub and you buy a pint of beer and don't buy a bar meal, you are more likely to
buy crisps (US. chips) at the same time than somebody who didn't buy beer.
The set of items a customer buys is referred to as an itemset, and market basket analysis seeks to
find relationships between purchases.
Typically the relationship will be in the form of a rule:
IF {beer, no bar meal} THEN {crisps}.
The probability that a customer will buy beer without a bar meal (i.e. that the antecedent is true)
is referred to as the support for the rule. The conditional probability that a customer will
purchase crisps is referred to as the confidence.

The algorithms for performing market basket analysis are fairly straightforward (Berry and
Linhoff is a reasonable introductory resource for this). The complexities mainly arise in
exploiting taxonomies, avoiding combinatorial explosions (a supermarket may stock 10,000 or
more line items), and dealing with the large amounts of transaction data that may be available.
A major difficulty is that a large number of the rules found may be trivial for anyone familiar
with the business. Although the volume of data has been reduced, we are still asking the user to
find a needle in a haystack. Requiring rules to have a high minimum support level and a high
confidence level risks missing any exploitable result we might have found. One partial solution
to this problem is differential market basket analysis, as described below.
OR
Q.4 What do you understand by classification? Explain decision tree algorithm with example.
(5)
Solution:
Decision Trees Example - Building the Decision Tree to Use in Decision Tree Analysis
In this scenario, you can either:
Build the new software: To build the new software, the associated cost is $500,000.
Buy the new software: To buy the new software, the associated cost is $750,000.
Stay with the legacy software: If the company decides to stay with the legacy software, the
associated cost is mainly maintenance and will amount to $100,000.
Looking at the options listed above, you can start building the decision trees as shown in the
diagram. By looking at this information, the lobby for staying with the legacy software would
have the strongest case. But, let’s see how it pans out. Read on.
The Buy the New Software and Build the New Software options will lead to either a successful
deployment or an unsuccessful one. If the deployment is successful then the impact is zero,
because the risk will not have materialized. However, if the deployment is unsuccessful, then the
risk will materialize and the impact is $2 million. The Stay with the Legacy Software option
will lead to only one impact, which is $2 million, because the legacy software is not currently
meeting the needs of the company. Nor, will it meet the needs should there be growth. In this
example, we have assumed that the company will have growth.
In this example, Decision Trees analysis will be used to make the project risk management
decision. The next step is to compute the Expected Monetary Value for each path in the Decision
Trees. Let's see how this helps in this Decision Trees example.