Embed Size (px)
Citation preview
Session Tracing
Session Tracing allows an operator to trace subscriber activity at various points in the network and at variouslevels of detail in an EPS network. This chapter provides information on how theMME implements subscriberSession Tracing functionality in the LTE service.
• Feature Description, page 1
• How Session Tracing Works, page 3
• Session Trace Configuration, page 7
• Monitoring and Troubleshooting the Session Trace, page 12
Feature DescriptionThe Session Tracing feature provides a 3GPP standards-based subscriber session-level trace function for calldebugging and testing new functions and access terminals in an LTE environment.
In general, the Session Trace capability records and forwards all control activity for the monitored subscriberon the monitored interfaces. This is typically all the signaling and authentication/subscriber services messagesthat flow when a UE connects to the access network.
The EPC network entities like MME, S-GW, P-GW support 3GPP standards based session-level tracecapabilities to monitor all call control events on the respective monitored interfaces including S6a, S1-MMEand S11 on MME, S5, S8, S11 at S-GW and S5 and S8 on P-GW. The trace can be initiated using multiplemethods:
• Management initiation via direct CLI configuration
• Management initiation at HSS with trace activation via authentication response messages over S6areference interface
• Signaling-based activation through signaling from subscriber access terminal
Once the trace is provisioned it can be provisioned through the access cloud via various signaling interfaces.Important
The session level trace function consists of trace activation followed by triggers. The time between the twoevents is where the EPC network element buffers the trace activation instructions for the provisioned subscriberin memory using camp-onmonitoring. Trace files for active calls are buffered as XML files using non-volatile
MME Administration Guide, StarOS Release 21.1 1
memory on the local dual redundant hard drives on the chassis. The trace depth defines the granularity of datato be traced. Six levels are defined including maximum, minimum and medium with ability to configureadditional levels based on vendor extensions.
Only maximum trace depth is supported in the current release.Important
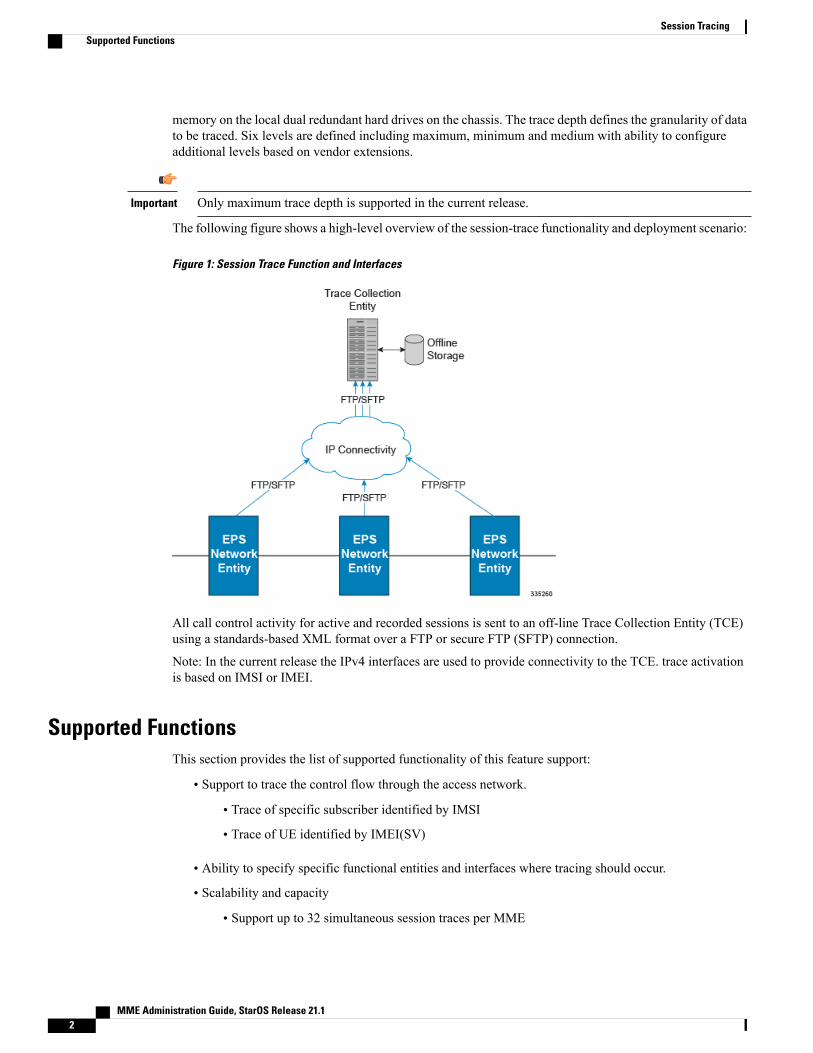
The following figure shows a high-level overview of the session-trace functionality and deployment scenario:
Figure 1: Session Trace Function and Interfaces
All call control activity for active and recorded sessions is sent to an off-line Trace Collection Entity (TCE)using a standards-based XML format over a FTP or secure FTP (SFTP) connection.
Note: In the current release the IPv4 interfaces are used to provide connectivity to the TCE. trace activationis based on IMSI or IMEI.
Supported FunctionsThis section provides the list of supported functionality of this feature support:
• Support to trace the control flow through the access network.
• Trace of specific subscriber identified by IMSI
• Trace of UE identified by IMEI(SV)
• Ability to specify specific functional entities and interfaces where tracing should occur.
• Scalability and capacity
• Support up to 32 simultaneous session traces per MME
MME Administration Guide, StarOS Release 21.12
Session TracingSupported Functions
• Each MME is equipped with a storage buffer of size 40 MB to collect trace files locally
• Statistics and State Support
• Session Trace Details
• Management and Signaling-based activation models
• Trace Parameter Propagation
• Trace Scope (EPS Only)
• MME: S10, S11, S13, S1-MME, S3, S6A
• S-GW: S4, S5, S8, S11, Gxc
• PDN-GW: S2a, S2b, S2c, S5, S6b, Gx, S8, SGi
• Trace Depth: Maximum, Minimum, Medium (with or without vendor extension)
• XML Encoding of Data as per 3GPP standard 3GPP TS 32.422 V8.6.0 (2009-09)
• Trace Collection Entity (TCE) Support
• Active pushing of files to the TCE
• Passive pulling of files by the TCE
• 1 TCE support per context
• Trace Session Recovery after Failure of Session Manager
Standards ComplianceSupport for the following standards and requests for comments (RFCs) have been added with this interfacesupport:
• 3GPP TS 32.421 V10.5.0: 3rd Generation Partnership Project Technical Specification Group Servicesand System Aspects Telecommunication management Subscriber and equipment trace: Trace conceptsand requirements (Release 10)
• 3GPP TS 32.422 V10.5.0: 3rd Generation Partnership Project Technical Specification Group Servicesand System Aspects Telecommunication management Subscriber and equipment trace Trace controland configuration management (Release 10)
• 3GPP TS 32.423 V10.5.0: 3rd Generation Partnership Project Technical Specification Group Servicesand System Aspects Telecommunication management Subscriber and equipment trace: Trace datadefinition and management (Release 10)
How Session Tracing WorksThis section describes the various functionality involved in tracing subscriber sessions on EPC nodes.
MME Administration Guide, StarOS Release 21.1 3
Session TracingStandards Compliance
OperationThe session trace functionality is separated into two steps - activation and trigger.
Before tracing can begin, it must be activated. Activation is done either via management request or when aUE initiates a signaled connection. After activation, tracing actually begins when it is triggered (defined bya set of trigger events).
Trace SessionA trace session is the time between trace activation and trace de-activation. It defines the state of a tracesession, including all user profile configuration, monitoring points, and start/stop triggers. It is uniquelyidentified by a Trace Reference.
The Trace Reference id is composed of the MCC (3 digits) + the MNC (3 digits) + the trace Id (3 byte octetstring).
On a session manager failure, the control activity that have been traced and not written to file will be lost.However, the trace sessions will continue to persist and future signals will be captured as expected.
Important
Trace Recording SessionA trace recording session is a time period in which activity is actually being recorded and traceable data isbeing forwarded to the TCE. A trace recording session is initiated when a start trigger event occurs andcontinues until the stop trigger event occurs and is uniquely identified by a Trace Recording Session Reference.
Network Element (NE)Network elements are the functional component to facilitate subscriber session trace in mobile network.
The term network element refers to a functional component that has standard interfaces in and out of it. It istypically shown as a stand-alone AGW. Examples of NEs are the MME, S-GW, and P-GW.
Currently, subscriber session trace is not supported for co-located network elements in the EPC network.
ActivationActivation of a trace is similar whether it be via the management interface or via a signaling interface. In bothcases, a trace session state block is allocated which stores all configuration and state information for the tracesession. In addition, a (S)FTP connection to the TCE is established if one does not already exist (if this is thefirst trace session established, odds are there will not be a (S)FTP connection already established to the TCE).
If the session to be traced is already active, tracing may begin immediately. Otherwise, tracing activityconcludes until the start trigger occurs (typically when the subscriber or UE under trace initiates a connection).A failure to activate a trace (due to max exceeded or some other failure reason) results in a notification beingsent to the TCE indicating the failure. If the (S)FTP connection is not established with the TCE, the TCEconnectivity needs to checked. Nevertheless, the MME continues to send the trace files to the TCE, and tries
MME Administration Guide, StarOS Release 21.14
Session TracingOperation
to establish an (S)FTP connection. The MME provides a storage buffer of size 40 MB to collect the trace fileslocally.
Management ActivationThe Operator can activate a trace session by directly logging in to the NE and enabling the session trace (forcommand information, see Enabling Subscriber Session Trace on EPC Network Element section below). TheNE establishes the trace session and waits for a triggering event to start actively tracing. Depending upon theconfiguration of the trace session, the trace activation may be propagated to other NEs.
Signaling ActivationWith a signaling based activation, the trace session is indicated to the NE across a signaling interface via atrace invocation message. This message can either be piggybacked with an existing bearer setup message (inorder to trace all control messages) or by sending a separate trace invocation message (if the user is alreadyactive).
Start TriggerA trace recording session starts upon reception of one of the configured start triggers. Once the start triggeris received, the NE generates a Trace Recording Session Reference (unique to the NE) and begins to collectand forward trace information on the session to the TCE.
List of trigger events are listed in 3GPP standard 3GPP TS 32.422 V8.6.0 (2009-09).
DeactivationDeactivation of a Trace Session is similar whether it was management or signaling activated. In either case,a deactivation request is received by the NE that contains a valid trace reference results in the de-allocationof the trace session state block and a flushing of any pending trace data. In addition, if this is the last tracesession to a particular TCE, the (S)FTP connection to the TCE is released after the last trace file is successfullytransferred to the TCE.
Stop TriggerA trace recording session ends upon the reception of one of the configured stop triggers. Once the stop triggeris received, the NE will terminate the active recording session and attempt to send any pending trace data tothe TCE. The list of triggering events can be found in 3GPP standard 3GPP TS 32.422 V8.6.0 (2009-09).
Data Collection and ReportingSubscriber session trace functionality supports data collection and reporting system to provide historical usageand event analysis.
All data collected by the NE is formatted into standard XML file format and forwarded to the TCE via (S)FTP.The specific format of the data is defined in 3GPP standard 3GPP TS 32.423 V8.2.0 (2009-09)
MME Administration Guide, StarOS Release 21.1 5
Session TracingStart Trigger
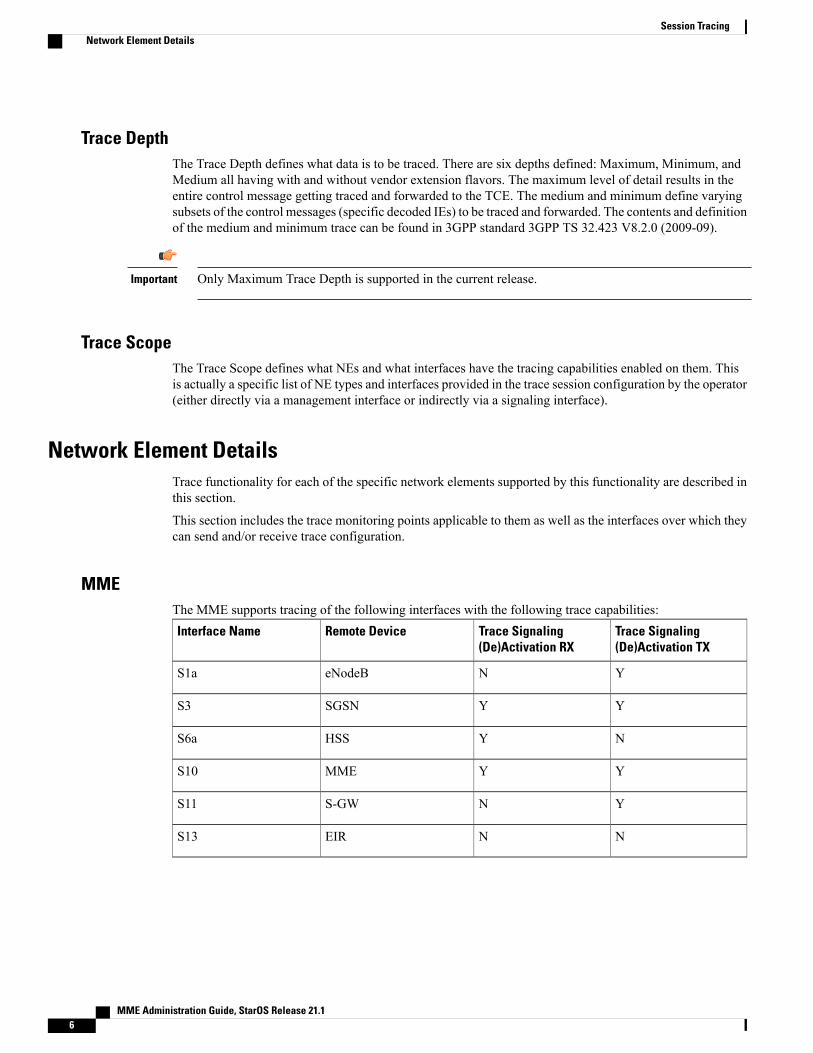
Trace DepthThe Trace Depth defines what data is to be traced. There are six depths defined: Maximum, Minimum, andMedium all having with and without vendor extension flavors. The maximum level of detail results in theentire control message getting traced and forwarded to the TCE. The medium and minimum define varyingsubsets of the control messages (specific decoded IEs) to be traced and forwarded. The contents and definitionof the medium and minimum trace can be found in 3GPP standard 3GPP TS 32.423 V8.2.0 (2009-09).
Only Maximum Trace Depth is supported in the current release.Important
Trace ScopeThe Trace Scope defines what NEs and what interfaces have the tracing capabilities enabled on them. Thisis actually a specific list of NE types and interfaces provided in the trace session configuration by the operator(either directly via a management interface or indirectly via a signaling interface).
Network Element DetailsTrace functionality for each of the specific network elements supported by this functionality are described inthis section.
This section includes the trace monitoring points applicable to them as well as the interfaces over which theycan send and/or receive trace configuration.
MMEThe MME supports tracing of the following interfaces with the following trace capabilities:
Trace Signaling(De)Activation TX
Trace Signaling(De)Activation RX
Remote DeviceInterface Name
YNeNodeBS1a
YYSGSNS3
NYHSSS6a
YYMMES10
YNS-GWS11
NNEIRS13
MME Administration Guide, StarOS Release 21.16
Session TracingNetwork Element Details
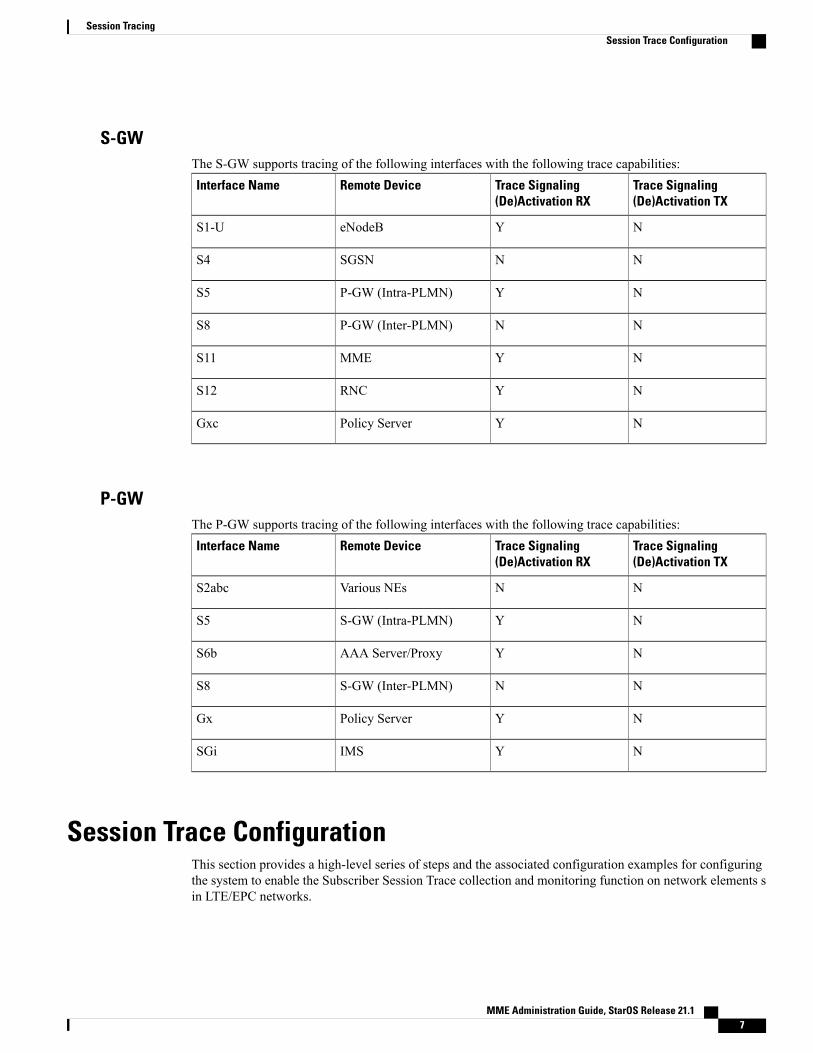
S-GWThe S-GW supports tracing of the following interfaces with the following trace capabilities:
Trace Signaling(De)Activation TX
Trace Signaling(De)Activation RX
Remote DeviceInterface Name
NYeNodeBS1-U
NNSGSNS4
NYP-GW (Intra-PLMN)S5
NNP-GW (Inter-PLMN)S8
NYMMES11
NYRNCS12
NYPolicy ServerGxc
P-GWThe P-GW supports tracing of the following interfaces with the following trace capabilities:
Trace Signaling(De)Activation TX
Trace Signaling(De)Activation RX
Remote DeviceInterface Name
NNVarious NEsS2abc
NYS-GW (Intra-PLMN)S5
NYAAA Server/ProxyS6b
NNS-GW (Inter-PLMN)S8
NYPolicy ServerGx
NYIMSSGi
Session Trace ConfigurationThis section provides a high-level series of steps and the associated configuration examples for configuringthe system to enable the Subscriber Session Trace collection and monitoring function on network elements sin LTE/EPC networks.
MME Administration Guide, StarOS Release 21.1 7
Session TracingSession Trace Configuration
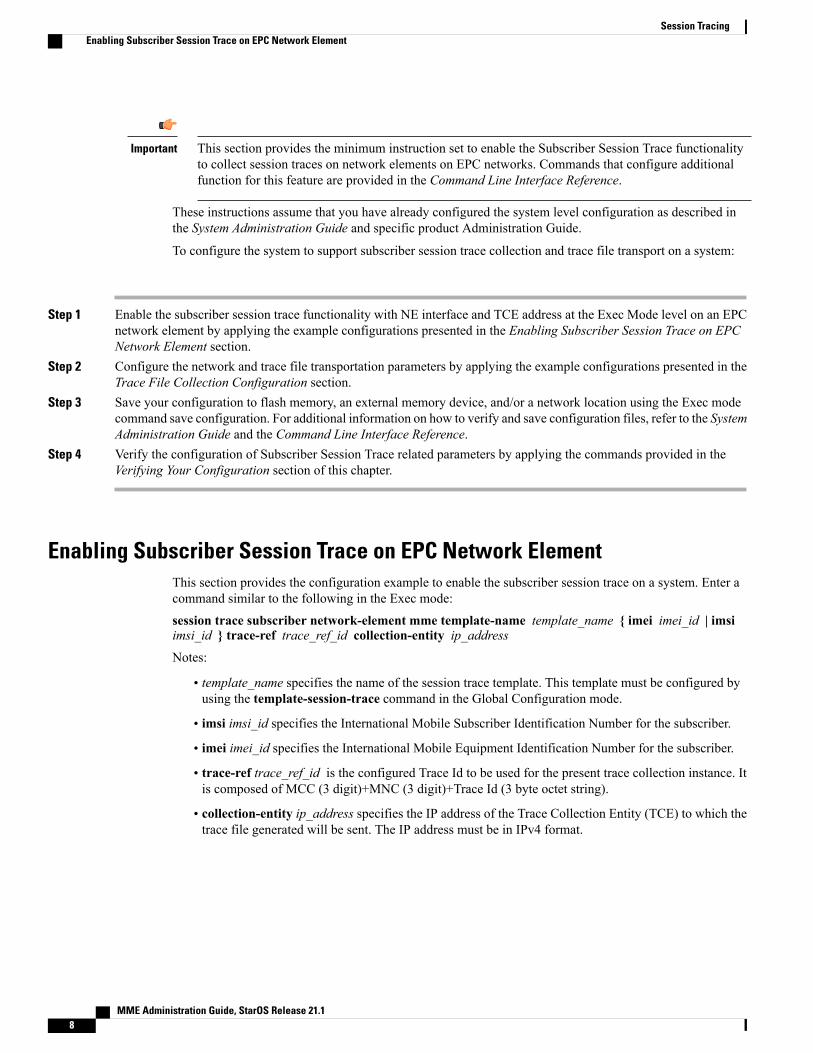
This section provides the minimum instruction set to enable the Subscriber Session Trace functionalityto collect session traces on network elements on EPC networks. Commands that configure additionalfunction for this feature are provided in the Command Line Interface Reference.
Important
These instructions assume that you have already configured the system level configuration as described inthe System Administration Guide and specific product Administration Guide.
To configure the system to support subscriber session trace collection and trace file transport on a system:
Step 1 Enable the subscriber session trace functionality with NE interface and TCE address at the Exec Mode level on an EPCnetwork element by applying the example configurations presented in the Enabling Subscriber Session Trace on EPCNetwork Element section.
Step 2 Configure the network and trace file transportation parameters by applying the example configurations presented in theTrace File Collection Configuration section.
Step 3 Save your configuration to flash memory, an external memory device, and/or a network location using the Exec modecommand save configuration. For additional information on how to verify and save configuration files, refer to the SystemAdministration Guide and the Command Line Interface Reference.
Step 4 Verify the configuration of Subscriber Session Trace related parameters by applying the commands provided in theVerifying Your Configuration section of this chapter.
Enabling Subscriber Session Trace on EPC Network ElementThis section provides the configuration example to enable the subscriber session trace on a system. Enter acommand similar to the following in the Exec mode:
session trace subscriber network-element mme template-name template_name { imei imei_id | imsiimsi_id } trace-ref trace_ref_id collection-entity ip_address
Notes:
• template_name specifies the name of the session trace template. This template must be configured byusing the template-session-trace command in the Global Configuration mode.
• imsi imsi_id specifies the International Mobile Subscriber Identification Number for the subscriber.
• imei imei_id specifies the International Mobile Equipment Identification Number for the subscriber.
• trace-ref trace_ref_id is the configured Trace Id to be used for the present trace collection instance. Itis composed of MCC (3 digit)+MNC (3 digit)+Trace Id (3 byte octet string).
• collection-entity ip_address specifies the IP address of the Trace Collection Entity (TCE) to which thetrace file generated will be sent. The IP address must be in IPv4 format.
MME Administration Guide, StarOS Release 21.18
Session TracingEnabling Subscriber Session Trace on EPC Network Element
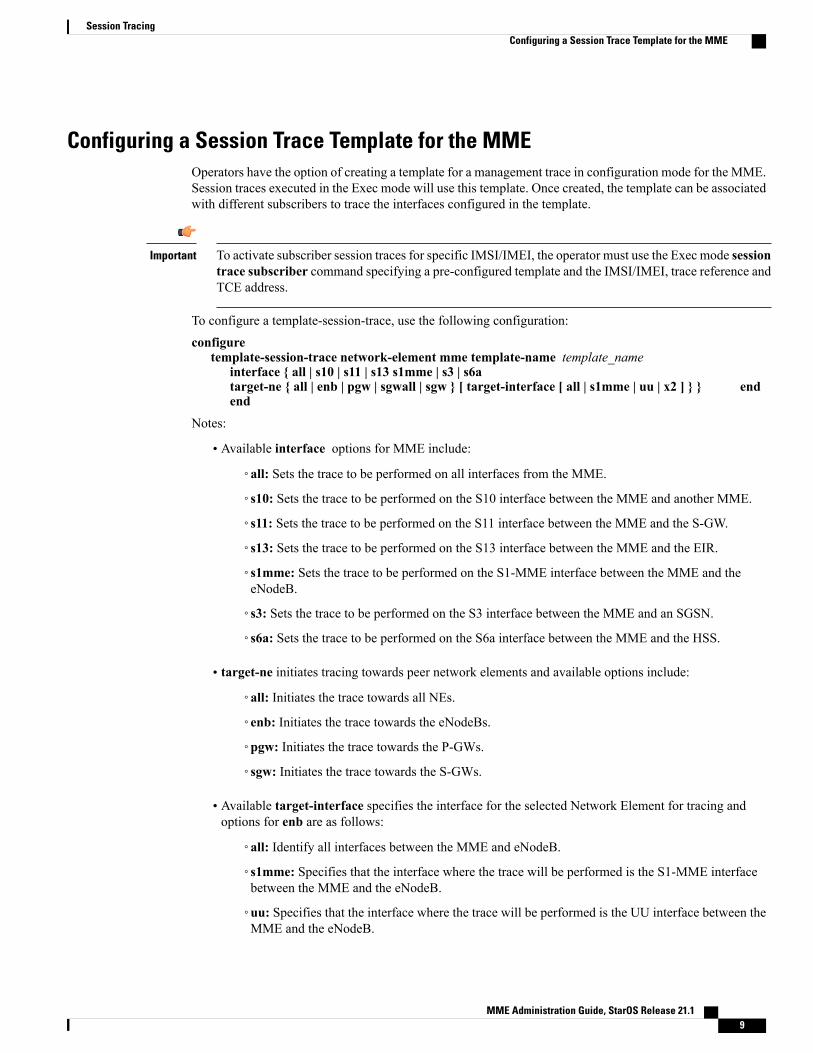
Configuring a Session Trace Template for the MMEOperators have the option of creating a template for a management trace in configuration mode for the MME.Session traces executed in the Exec mode will use this template. Once created, the template can be associatedwith different subscribers to trace the interfaces configured in the template.
To activate subscriber session traces for specific IMSI/IMEI, the operator must use the Exec mode sessiontrace subscriber command specifying a pre-configured template and the IMSI/IMEI, trace reference andTCE address.
Important
To configure a template-session-trace, use the following configuration:
configuretemplate-session-trace network-element mme template-name template_name
interface { all | s10 | s11 | s13 s1mme | s3 | s6atarget-ne { all | enb | pgw | sgwall | sgw } [ target-interface [ all | s1mme | uu | x2 ] } } endend
Notes:
• Available interface options for MME include:
◦all: Sets the trace to be performed on all interfaces from the MME.
◦s10: Sets the trace to be performed on the S10 interface between the MME and another MME.
◦s11: Sets the trace to be performed on the S11 interface between the MME and the S-GW.
◦s13: Sets the trace to be performed on the S13 interface between the MME and the EIR.
◦s1mme: Sets the trace to be performed on the S1-MME interface between the MME and theeNodeB.
◦s3: Sets the trace to be performed on the S3 interface between the MME and an SGSN.
◦s6a: Sets the trace to be performed on the S6a interface between the MME and the HSS.
• target-ne initiates tracing towards peer network elements and available options include:
◦all: Initiates the trace towards all NEs.
◦enb: Initiates the trace towards the eNodeBs.
◦pgw: Initiates the trace towards the P-GWs.
◦sgw: Initiates the trace towards the S-GWs.
• Available target-interface specifies the interface for the selected Network Element for tracing andoptions for enb are as follows:
◦all: Identify all interfaces between the MME and eNodeB.
◦s1mme: Specifies that the interface where the trace will be performed is the S1-MME interfacebetween the MME and the eNodeB.
◦uu: Specifies that the interface where the trace will be performed is the UU interface between theMME and the eNodeB.
MME Administration Guide, StarOS Release 21.1 9
Session TracingConfiguring a Session Trace Template for the MME
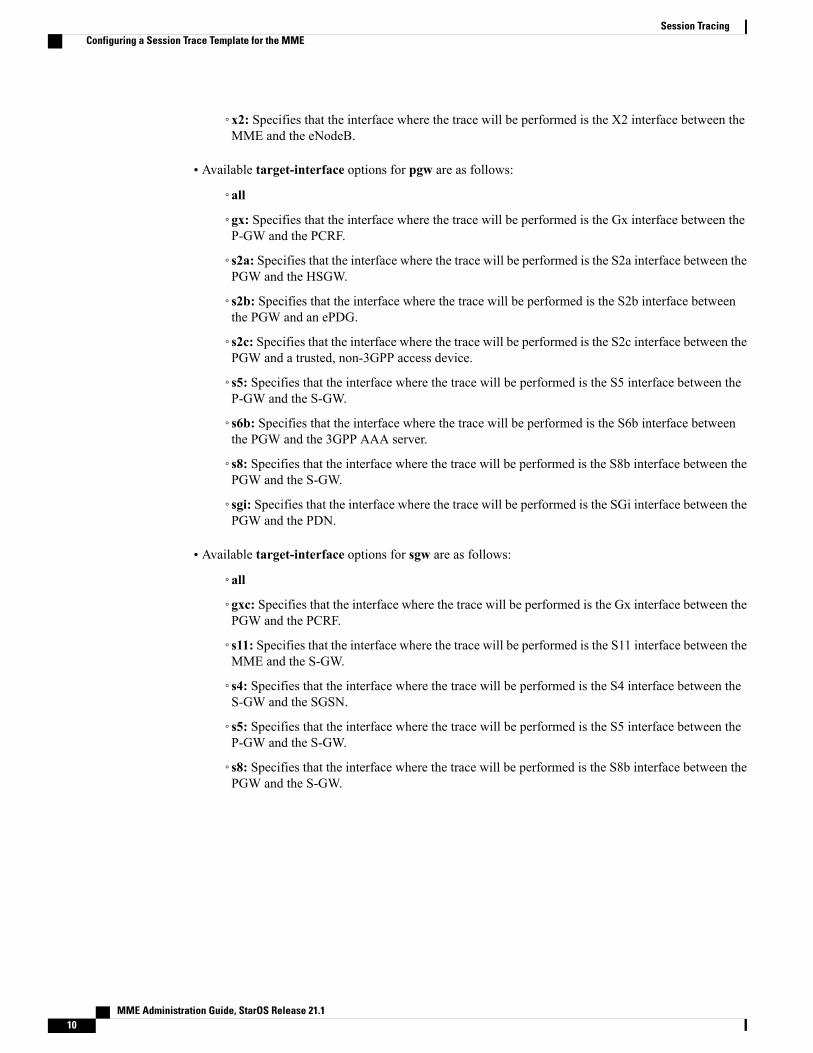
◦x2: Specifies that the interface where the trace will be performed is the X2 interface between theMME and the eNodeB.
• Available target-interface options for pgw are as follows:
◦all
◦gx: Specifies that the interface where the trace will be performed is the Gx interface between theP-GW and the PCRF.
◦s2a: Specifies that the interface where the trace will be performed is the S2a interface between thePGW and the HSGW.
◦s2b: Specifies that the interface where the trace will be performed is the S2b interface betweenthe PGW and an ePDG.
◦s2c: Specifies that the interface where the trace will be performed is the S2c interface between thePGW and a trusted, non-3GPP access device.
◦s5: Specifies that the interface where the trace will be performed is the S5 interface between theP-GW and the S-GW.
◦s6b: Specifies that the interface where the trace will be performed is the S6b interface betweenthe PGW and the 3GPP AAA server.
◦s8: Specifies that the interface where the trace will be performed is the S8b interface between thePGW and the S-GW.
◦sgi: Specifies that the interface where the trace will be performed is the SGi interface between thePGW and the PDN.
• Available target-interface options for sgw are as follows:
◦all
◦gxc: Specifies that the interface where the trace will be performed is the Gx interface between thePGW and the PCRF.
◦s11: Specifies that the interface where the trace will be performed is the S11 interface between theMME and the S-GW.
◦s4: Specifies that the interface where the trace will be performed is the S4 interface between theS-GW and the SGSN.
◦s5: Specifies that the interface where the trace will be performed is the S5 interface between theP-GW and the S-GW.
◦s8: Specifies that the interface where the trace will be performed is the S8b interface between thePGW and the S-GW.
MME Administration Guide, StarOS Release 21.110
Session TracingConfiguring a Session Trace Template for the MME
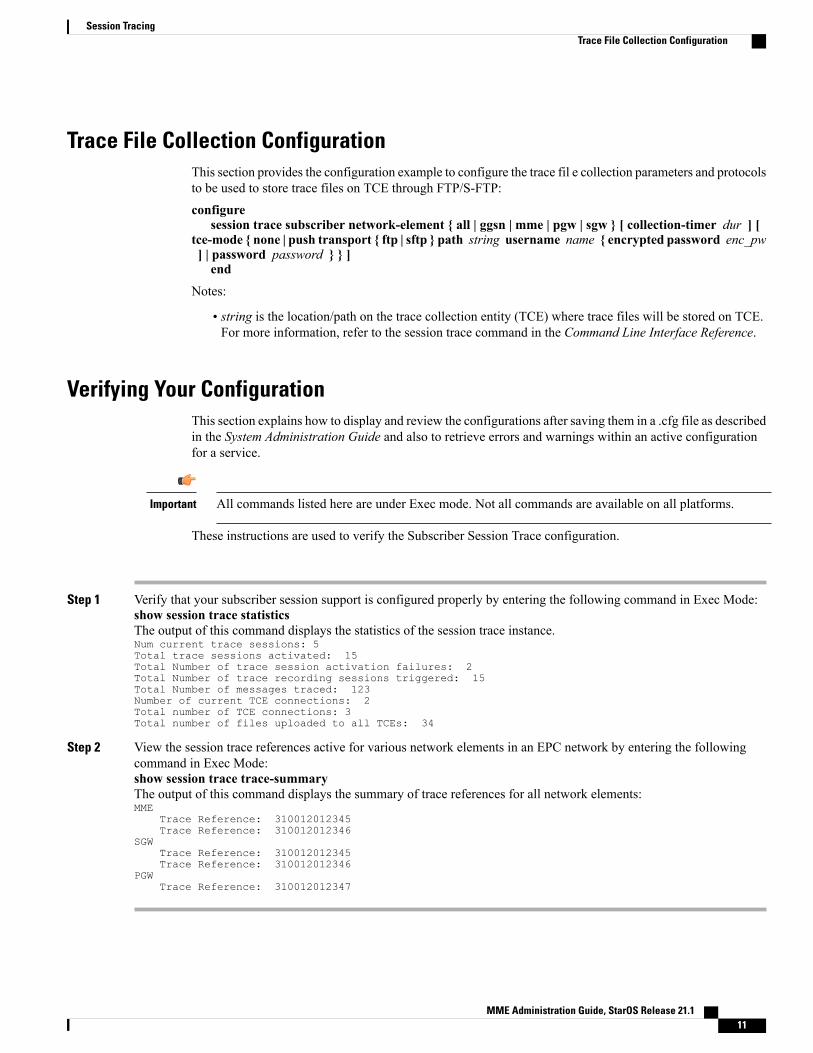
Trace File Collection ConfigurationThis section provides the configuration example to configure the trace fil e collection parameters and protocolsto be used to store trace files on TCE through FTP/S-FTP:
configuresession trace subscriber network-element { all | ggsn | mme | pgw | sgw } [ collection-timer dur ] [
tce-mode { none | push transport { ftp | sftp } path string username name { encrypted password enc_pw] | password password } } ]
end
Notes:
• string is the location/path on the trace collection entity (TCE) where trace files will be stored on TCE.For more information, refer to the session trace command in the Command Line Interface Reference.
Verifying Your ConfigurationThis section explains how to display and review the configurations after saving them in a .cfg file as describedin the System Administration Guide and also to retrieve errors and warnings within an active configurationfor a service.
All commands listed here are under Exec mode. Not all commands are available on all platforms.Important
These instructions are used to verify the Subscriber Session Trace configuration.
Step 1 Verify that your subscriber session support is configured properly by entering the following command in Exec Mode:show session trace statisticsThe output of this command displays the statistics of the session trace instance.Num current trace sessions: 5Total trace sessions activated: 15Total Number of trace session activation failures: 2Total Number of trace recording sessions triggered: 15Total Number of messages traced: 123Number of current TCE connections: 2Total number of TCE connections: 3Total number of files uploaded to all TCEs: 34
Step 2 View the session trace references active for various network elements in an EPC network by entering the followingcommand in Exec Mode:show session trace trace-summaryThe output of this command displays the summary of trace references for all network elements:MME
Trace Reference: 310012012345Trace Reference: 310012012346
SGWTrace Reference: 310012012345Trace Reference: 310012012346
PGWTrace Reference: 310012012347
MME Administration Guide, StarOS Release 21.1 11
Session TracingTrace File Collection Configuration
Monitoring and Troubleshooting the Session TraceThe following section describes commands available to monitor Session Trace functionality on the MME.
Session Trace Show Command(s) and/or Outputs
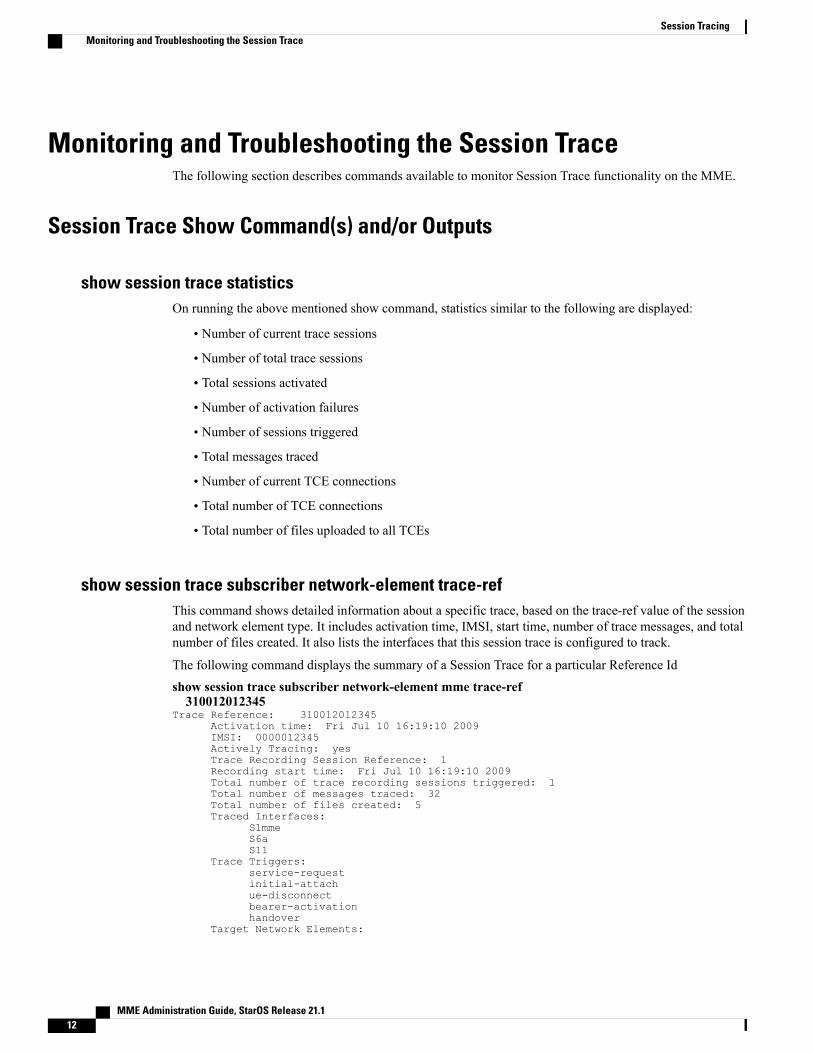
show session trace statisticsOn running the above mentioned show command, statistics similar to the following are displayed:
• Number of current trace sessions
• Number of total trace sessions
• Total sessions activated
• Number of activation failures
• Number of sessions triggered
• Total messages traced
• Number of current TCE connections
• Total number of TCE connections
• Total number of files uploaded to all TCEs
show session trace subscriber network-element trace-refThis command shows detailed information about a specific trace, based on the trace-ref value of the sessionand network element type. It includes activation time, IMSI, start time, number of trace messages, and totalnumber of files created. It also lists the interfaces that this session trace is configured to track.
The following command displays the summary of a Session Trace for a particular Reference Id
show session trace subscriber network-element mme trace-ref310012012345
Trace Reference: 310012012345Activation time: Fri Jul 10 16:19:10 2009IMSI: 0000012345Actively Tracing: yesTrace Recording Session Reference: 1Recording start time: Fri Jul 10 16:19:10 2009Total number of trace recording sessions triggered: 1Total number of messages traced: 32Total number of files created: 5Traced Interfaces:
S1mmeS6aS11
Trace Triggers:service-requestinitial-attachue-disconnectbearer-activationhandover
Target Network Elements:
MME Administration Guide, StarOS Release 21.112
Session TracingMonitoring and Troubleshooting the Session Trace
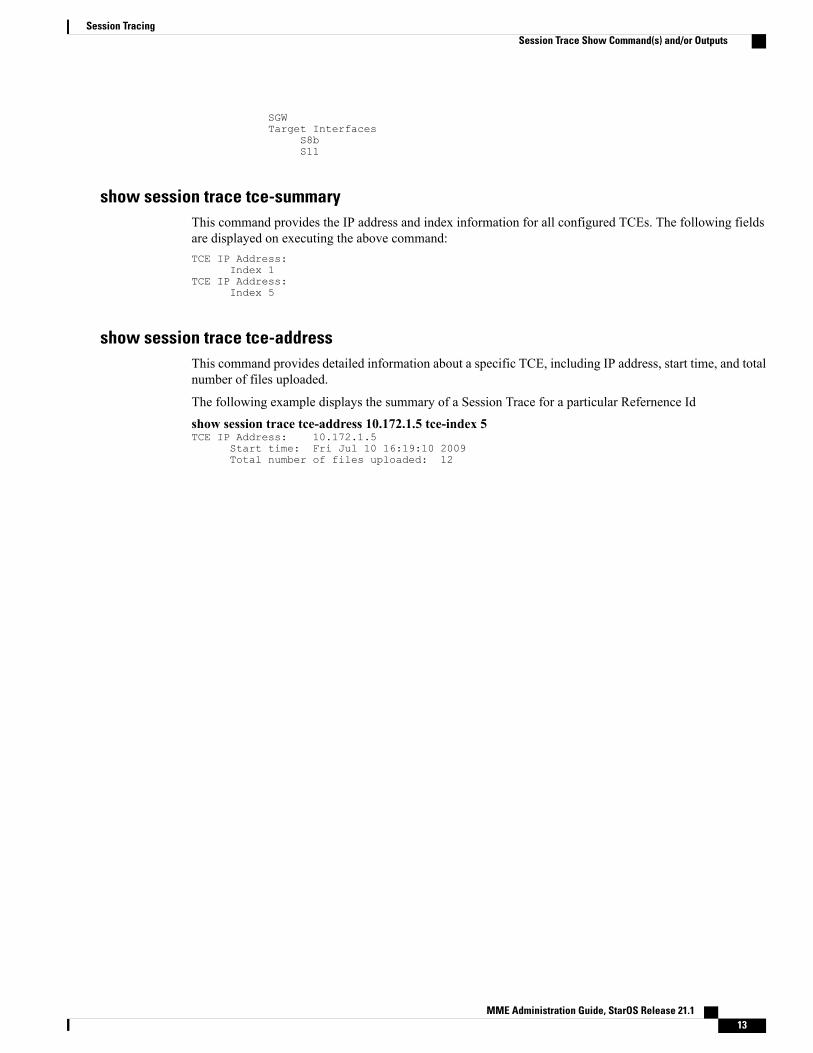
SGWTarget Interfaces
S8bS11
show session trace tce-summaryThis command provides the IP address and index information for all configured TCEs. The following fieldsare displayed on executing the above command:TCE IP Address:
Index 1TCE IP Address:
Index 5
show session trace tce-addressThis command provides detailed information about a specific TCE, including IP address, start time, and totalnumber of files uploaded.
The following example displays the summary of a Session Trace for a particular Refernence Id
show session trace tce-address 10.172.1.5 tce-index 5TCE IP Address: 10.172.1.5
Start time: Fri Jul 10 16:19:10 2009Total number of files uploaded: 12
MME Administration Guide, StarOS Release 21.1 13
Session TracingSession Trace Show Command(s) and/or Outputs
MME Administration Guide, StarOS Release 21.114
Session TracingSession Trace Show Command(s) and/or Outputs