Embed Size (px)
Citation preview

Session introduction
David MitchellBTRE
Improving North-South corridor road and rail links – issues, options, payoffs

Inter-capital freight movement – road predominant
Note Freight estimates exclude steel movements carried by rail and bulk freight moved by coastal shipping, the latter includes significant quantities of liquid fuel transported from Westernport (Vic.) to Sydney and Brisbane.
Source BTRE 2006, Freight measurement and modelling in Australia (Report 112).
(million tonnes)
Mode
Corridor Road Rail Sea All modes
Bne–Syd 4.9 0.9 0.03 5.9
Syd–Mel 7.9 1.0 0.01 8.9
Bne–Mel 2.0 0.9 0.05 2.9
Total 14.8 2.9 0.09 17.7
Share (tkm-basis, per cent)
Total 79.9 19.6 0.5 100.0

Inter-capital passenger travel – air predominant
Source BTRE 2007, Passenger movements between Australian cities, 1970-71 to 2030-31 (Information Sheet 26).
(‘000 passenger trips)
Mode
Corridor Air Car Bus Rail Other All modes
Bne–Syd 1 804 546 32 44 194 2 620
Syd–Mel 4 529 913 126 69 169 5 806
Bne–Mel 1 233 94 19 8 41 1 395
Total 7 566 1 553 177 121 404 9 821
Share (pkm-basis, per cent)
Total 74.1 17.6 2.0 1.5 4.8 100.0

North–South corridor traffic volumes
Light vehicles (AADT) Heavy vehicles (AADT)
$
$
$
0 80 160 240
Kilom eters
LV AADT
25000 12500 6250Melbourne
Sydney
Brisbane
1 0 0 0 0(2 0 3 2 )
A vg . 1 8 3 0L o w (6 5 3 )
1 1 7 3 0(1 4 5 0 )
1 6 8 2 0(5 3 4 0 )
$
$
$
0 80 160 240
Kilom eters
HV AADT
5000 2500 1250Melbourne
Sydney
Brisbane
3670(1597)
A vg . 828Low (291)
1518(332)
4640(805)
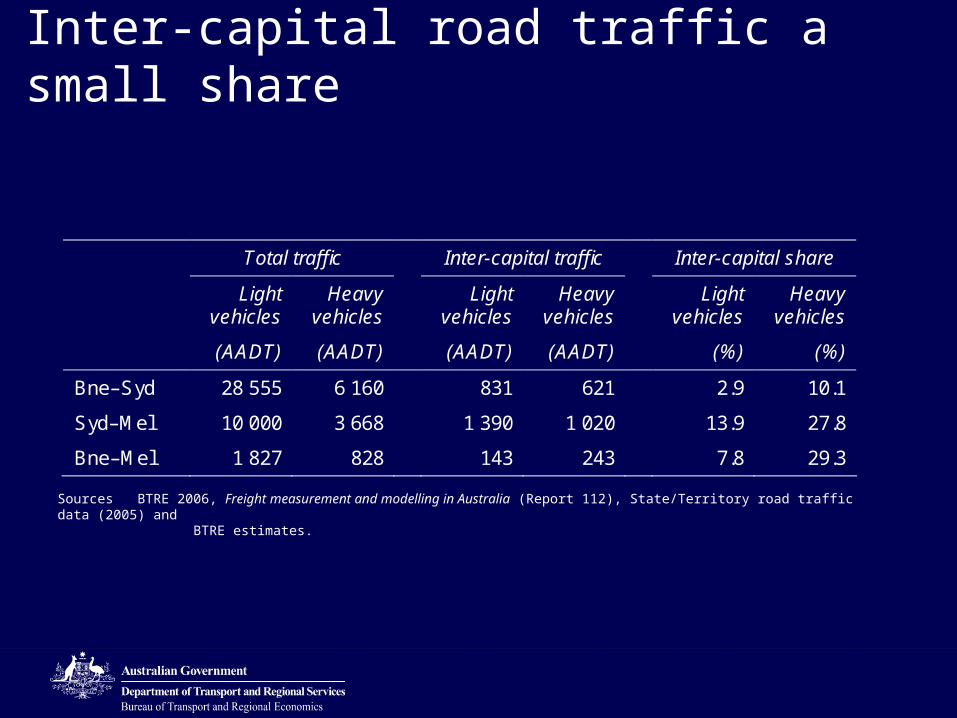
Inter-capital road traffic a small share
Sources BTRE 2006, Freight measurement and modelling in Australia (Report 112), State/Territory road traffic data (2005) and BTRE estimates.
Total traffic Inter-capital traffic Inter-capital share
Light
vehicles Heavy
vehicles Light
vehicles Heavy
vehicles Light
vehicles Heavy
vehicles
(AADT) (AADT) (AADT) (AADT) (%) (%)
Bne–Syd 28 555 6 160 831 621 2.9 10.1
Syd–Mel 10 000 3 668 1 390 1 020 13.9 27.8
Bne–Mel 1 827 828 143 243 7.8 29.3
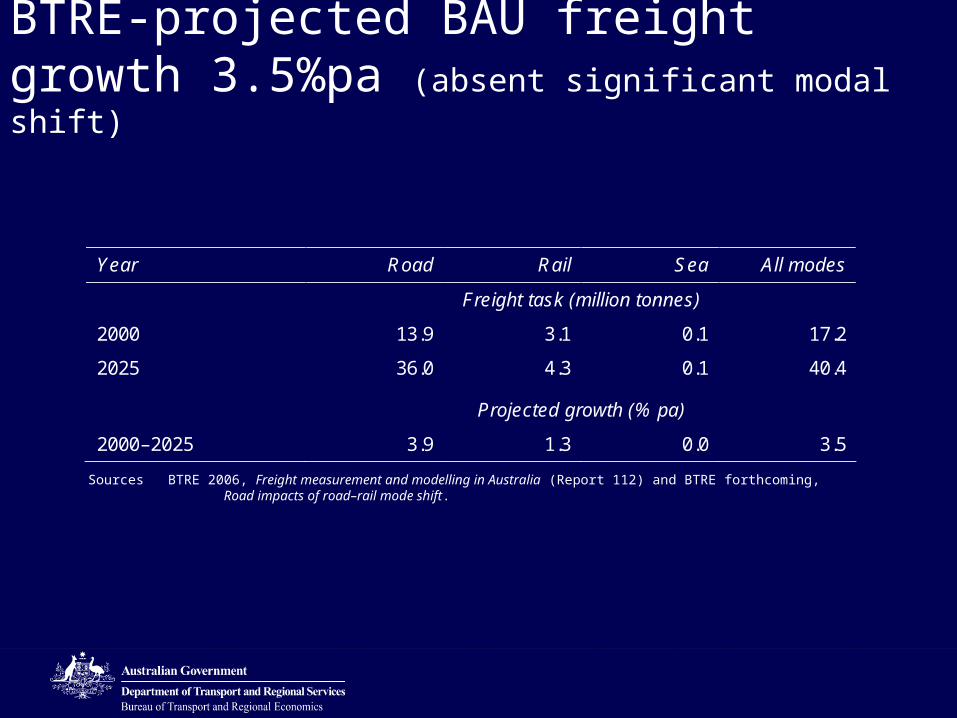
BTRE-projected BAU freight growth 3.5%pa (absent significant modal shift)
Sources BTRE 2006, Freight measurement and modelling in Australia (Report 112) and BTRE forthcoming, Road impacts of road–rail mode shift.
Year Road Rail Sea All modes
Freight task (million tonnes)
2000 13.9 3.1 0.1 17.2
2025 36.0 4.3 0.1 40.4
Projected growth (% pa)
2000–2025 3.9 1.3 0.0 3.5

Projected BAU North-South freight by mode
Sources BTRE 2006, Freight measurement and modelling in Australia (Report 112) and BTRE forthcoming, Road impacts of road–rail mode shift.
0
5
10
15
20
25
30
35
40
45
1972 1976 1980 1984 1988 1992 1996 2000 2004 2008 2012 2016 2020 2024
(mill
ion
tonn
es)
Sea
Rail
Road
ProjectionsEstimates
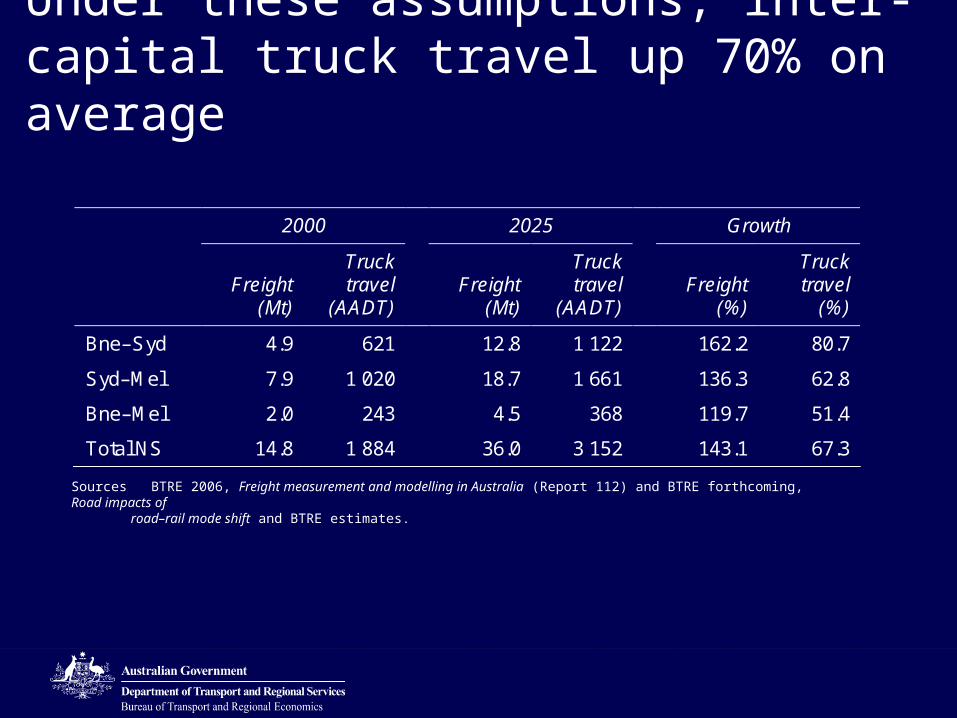
Under these assumptions, inter-capital truck travel up 70% on average
Sources BTRE 2006, Freight measurement and modelling in Australia (Report 112) and BTRE forthcoming, Road impacts of road–rail mode shift and BTRE estimates.
2000 2025 Growth
Freight
(Mt)
Truck travel
(AADT) Freight
(Mt)
Truck travel
(AADT)
Freight
(%)
Truck travel
(%)
Bne–Syd 4.9 621 12.8 1 122 162.2 80.7
Syd–Mel 7.9 1 020 18.7 1 661 136.3 62.8
Bne–Mel 2.0 243 4.5 368 119.7 51.4
Total NS 14.8 1 884 36.0 3 152 143.1 67.3
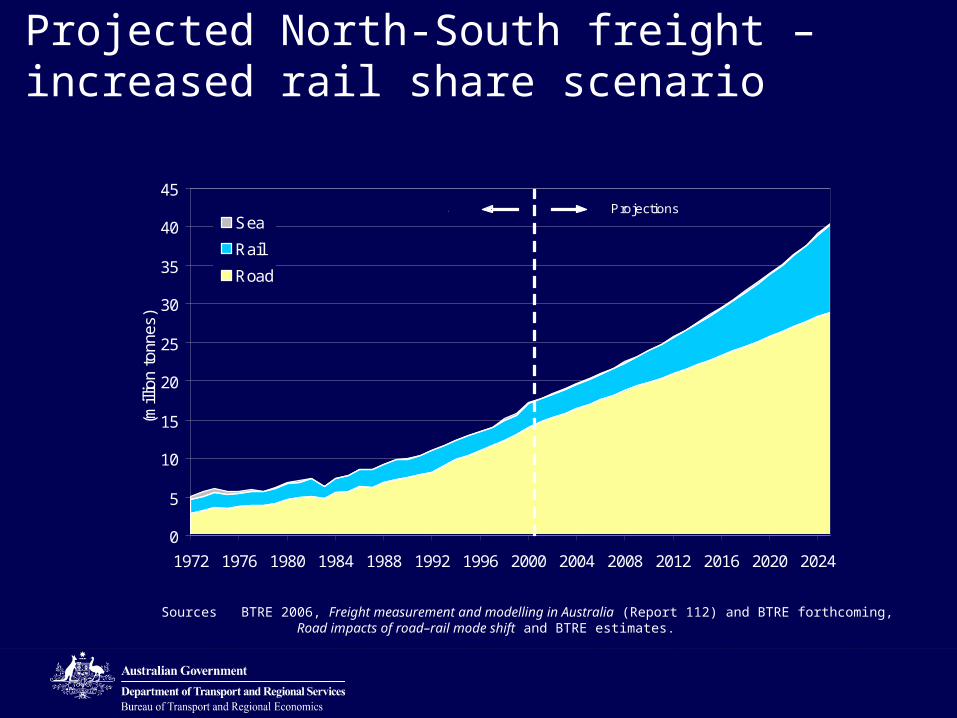
Projected North-South freight – increased rail share scenario
Sources BTRE 2006, Freight measurement and modelling in Australia (Report 112) and BTRE forthcoming, Road impacts of road–rail mode shift and BTRE estimates.
0
5
10
15
20
25
30
35
40
45
1972 1976 1980 1984 1988 1992 1996 2000 2004 2008 2012 2016 2020 2024
(mill
ion
tonn
es)
Sea
Rail
Road
ProjectionsEstimates
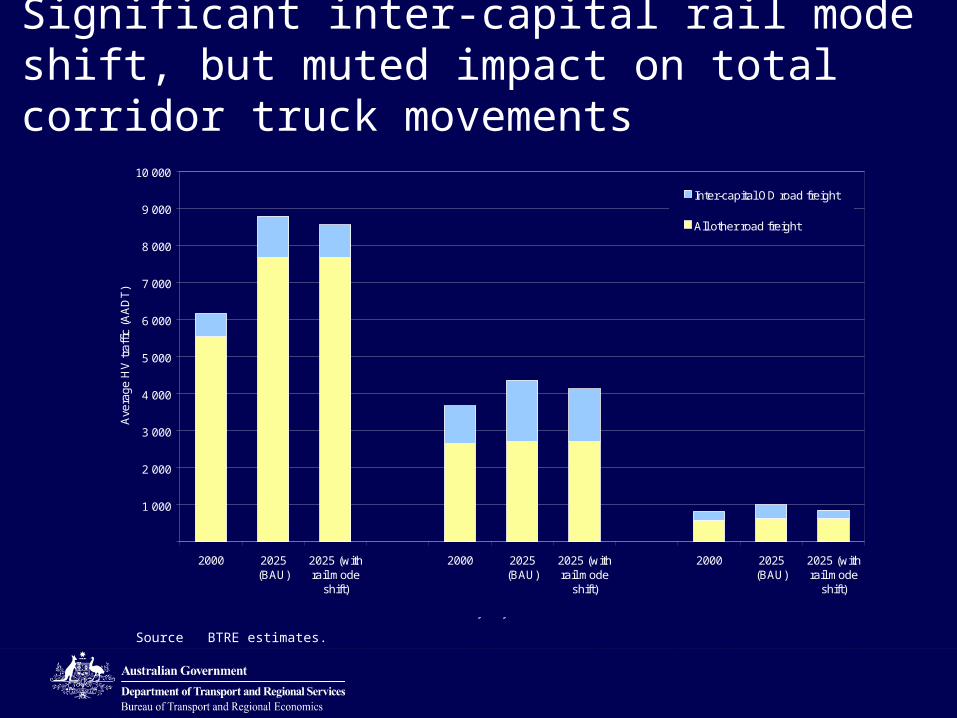
Significant inter-capital rail mode shift, but muted impact on total corridor truck movements
Source BTRE estimates.
1 000
2 000
3 000
4 000
5 000
6 000
7 000
8 000
9 000
10 000
2000 2025(BAU)
2025 (withrail mode
shift)
2000 2025(BAU)
2025 (withrail mode
shift)
2000 2025(BAU)
2025 (withrail mode
shift)
Ave
rage
HV
tra
ffic
(A
AD
T)
Inter-capital OD road freight
All other road freight
Brisbane-Sydney Brisbane-MelbourneSydney-Melbourne
Supporting material
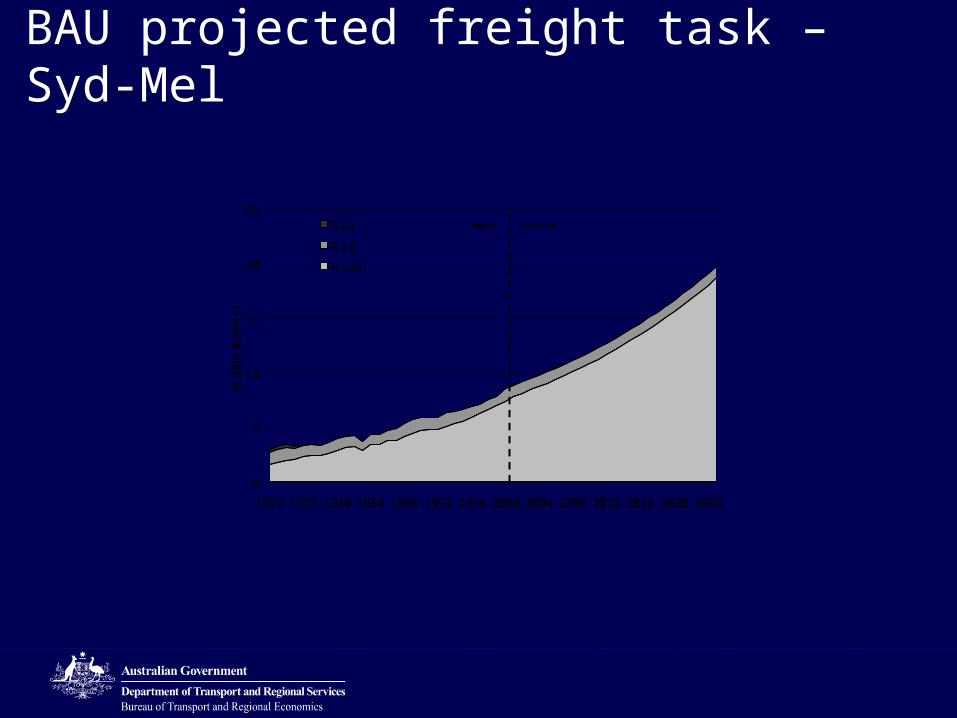
BAU projected freight task – Syd-Mel
0
5
10
15
20
25
1972 1976 1980 1984 1988 1992 1996 2000 2004 2008 2012 2016 2020 2024
(mill
ion
tonn
es)
Sea
Rail
Road
ProjectionsEstimates
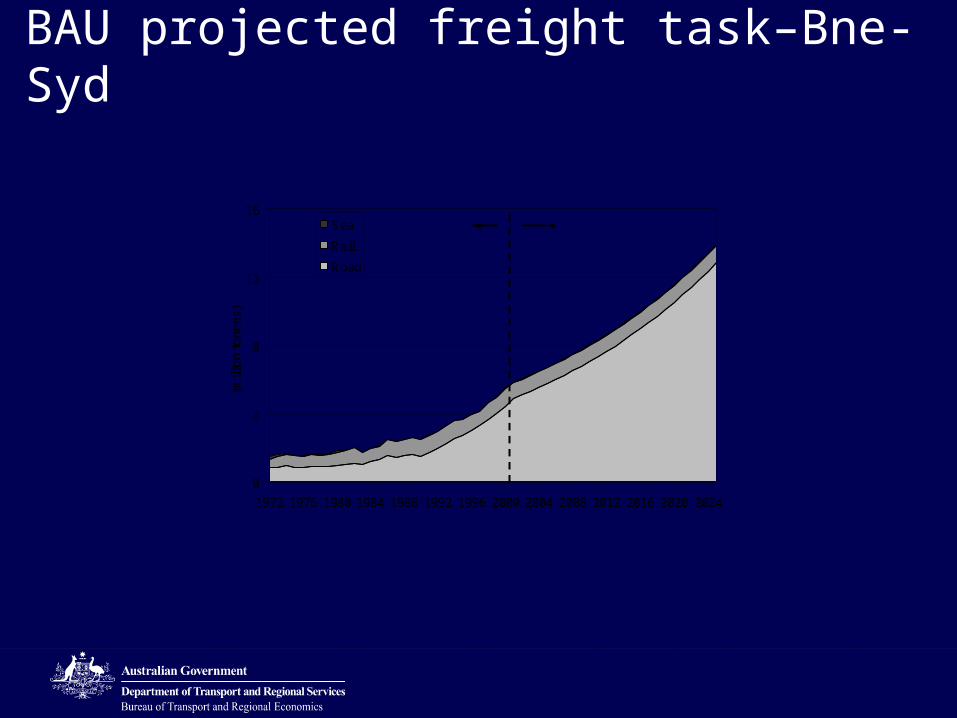
BAU projected freight task–Bne-Syd
0
4
8
12
16
1972 1976 1980 1984 1988 1992 1996 2000 2004 2008 2012 2016 2020 2024
(mill
ion
tonn
es)
Sea
Rail
Road
ProjectionsEstimates

BAU projected freight task–Bne-Mel
0
2
4
6
8
1972 1976 1980 1984 1988 1992 1996 2000 2004 2008 2012 2016 2020 2024
(mill
ion
tonn
es)
Sea
Rail
Road
ProjectionsEstimates
Other material

Key issues
• Volume of freight likely to switch• Infrastructure costs• Benefits
– Reduced road wear– Reduced external costs (e.g. accidents, pollution, congestion)– Reduced shipper costs/increased service quality

Avoidable road infrastructure costs are low• Life-cycle pavement cost based modelling implies avoidable
road costs between 1–2 c/km for heavy vehicles on these corridors– Well below current fuel-based variable charges (9–10 c/km)
• External costs– Accidents costs most significant – between 1–5 c/km for HVs,
varying with road standard and traffic mix– Greenhouse gas emissions (@ $A10/t CO2) – between x–y c/km– Other external costs negligible for inter-capital freight

Net road-side impact and implications• For most inter-capital links, including North-South corridors:
– Avoidable pavement wear & external costs < Current variable road use charge
– The implication is that heavy vehicles more than cover avoidable infrastructure and external costs
– For infrastructure assessments, this implies that the indirect impacts of rail investment is nil (negative)
– For rail projects then, the benefits within the rail mode should at least cover the project costs to be considered.

Concluding remarks
• Projected growth in North-South inter-capital freight will be serviced by road—freight to more than double 2005–2025
• Increasing vehicle size will mitigate the growth in vehicle numbers
• Rail may increase share. However, likely to reduce inter-capital HV traffic by less than 20%
• Indirect road-side savings likely to be small