Embed Size (px)
Citation preview

SESSION 8
City of Phoenix Mixed Oxidant Trials for TTHM Reduction
Brian Fayle
City of Phoenix Over the past 23 years, Brian’s worked at every Phoenix operated water treatment plant. He’s currently the Process Control Specialist at the 24th Street and Deer Valley Water Treatment Plants. Contact Information: Email: [email protected]

1
City of PhoenixMixed Oxidant Trials for TTHM Reduction
Deer Valley WTPAugust - November 2011
Deer Valley & 24th Street WTP’sMay – December 2012

2
Definition
Mixed Oxidants – Water treatment strategy of adding chlorine and chlorine dioxide in close proximity to each other, upstream of GAC filters, for the purpose of finished water TTHM reductions.
3
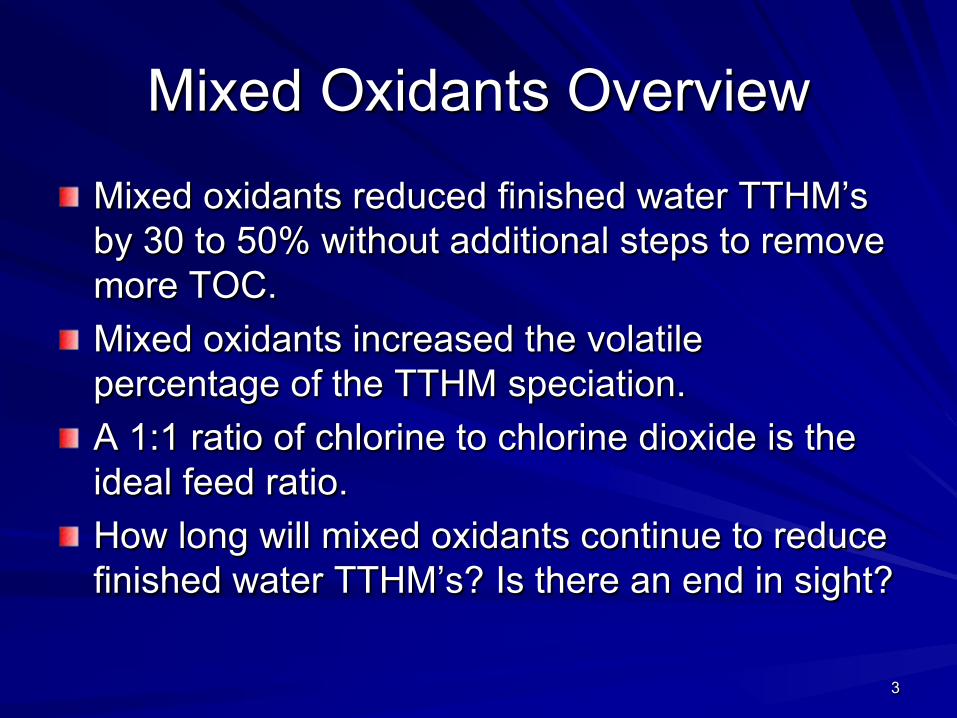
Mixed Oxidants Overview
Mixed oxidants reduced finished water TTHM’s by 30 to 50% without additional steps to remove more TOC.Mixed oxidants increased the volatile percentage of the TTHM speciation.A 1:1 ratio of chlorine to chlorine dioxide is the ideal feed ratio.How long will mixed oxidants continue to reduce finished water TTHM’s? Is there an end in sight?
4
Canal Raw WaterPumps
Pre-SedBasin
RapidMix
SandBallasted
Flocculation(SBF)
GACFilters
Reservoir #220 MG
Reservoir #120 MG
EPDS
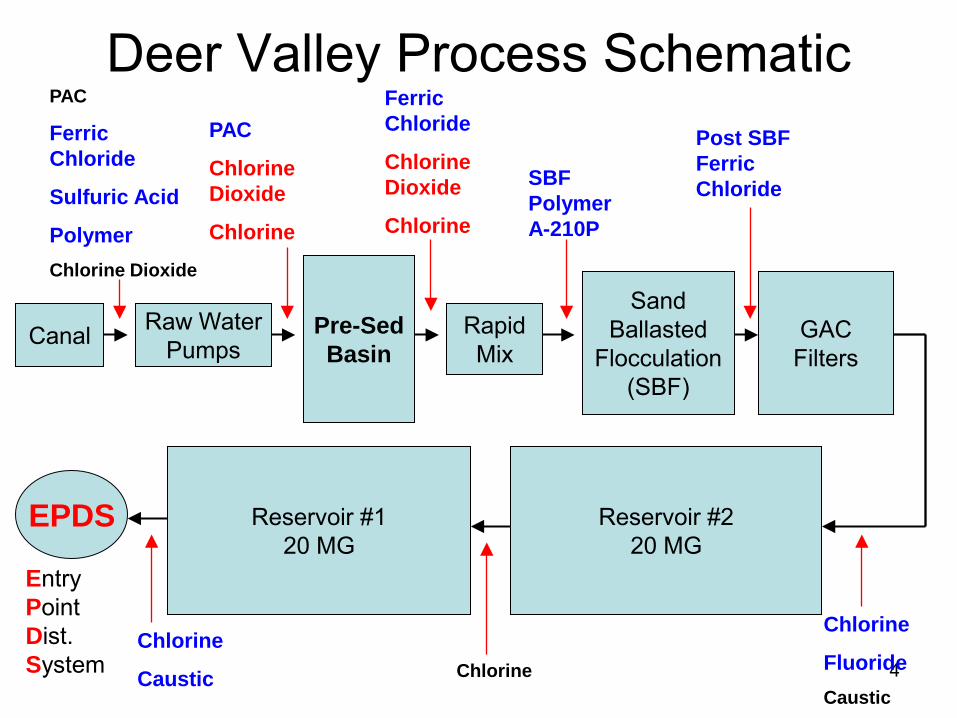
Deer Valley Process SchematicPAC
Ferric Chloride
Sulfuric Acid
PolymerChlorine Dioxide
PAC
Chlorine Dioxide
Chlorine
Ferric Chloride
Chlorine Dioxide
Chlorine
SBF Polymer A-210P
Post SBF Ferric Chloride
Chlorine
FluorideCaustic
ChlorineChlorine
Caustic
Entry Point Dist. System

5
#1 1 PPM Additional Cl2 Added Through the ClO2 Generator#2 1 PPM Additional Cl2 Added Through a Separate Chlorinator#3 .5 PPM Additional Cl2 is Not Enough
0
5
10
15
20
25
30
358/
16/1
1
8/18
/11
8/20
/11
8/22
/11
8/24
/11
8/26
/11
8/28
/11
8/30
/11
9/1/
11
9/3/
11
9/5/
11
9/7/
11
9/9/
11
9/11
/11
9/13
/11
9/15
/11
9/17
/11
9/19
/11
TTH
M's
0.0
0.2
0.4
0.6
0.8
1.0
1.2
1.4
ClO
2 & C
l 2 D
osag
e PP
M..
EPDSTTHM's
Pre-Sed Eff.ClO2Dose
Pre-Sed Eff.Cl2Dose
Pre-Sed Inf.Cl2Dose
#1 #2 #3

6
Mixed Oxidants Produced Lower SBF Eff and EPDS TTHM’s versus Cl2By itself. Mixed Oxidants Upstream of GAC had a Beneficial Synergistic
Effect to Reduce Finished Water TTHM’s
0
5
10
15
20
25
30
358/
16/1
1
8/19
/11
8/22
/11
8/25
/11
8/28
/11
8/31
/11
9/3/
11
9/6/
11
9/9/
11
9/12
/11
9/15
/11
9/18
/11
9/21
/11
TTHM
's
0.0
0.3
0.6
0.9
1.2
1.5
1.8
2.1
ClO
2 & C
l 2 Do
sage
PPM
..
EPDSTTHM's
SBF Eff.Total THM's
GAC Eff. TTHM's
Pre-Sed Eff.ClO2Dose
Pre-Sed Eff.Cl2Dose
Pre-Sed Inf.Cl2Dose
#1 #2 #3
7
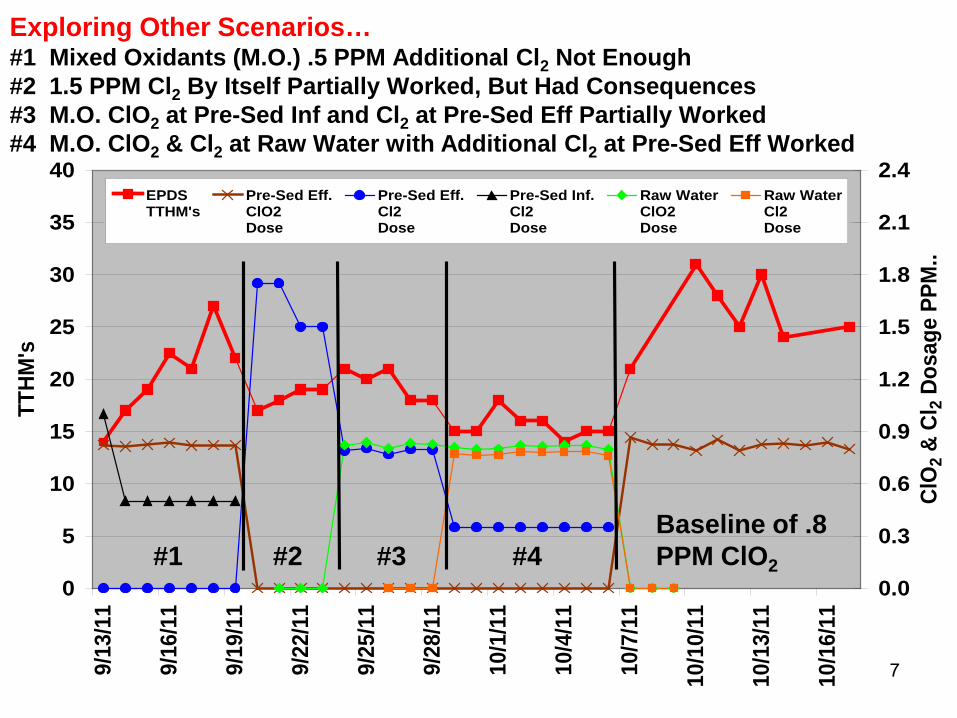
Exploring Other Scenarios…#1 Mixed Oxidants (M.O.) .5 PPM Additional Cl2 Not Enough#2 1.5 PPM Cl2 By Itself Partially Worked, But Had Consequences#3 M.O. ClO2 at Pre-Sed Inf and Cl2 at Pre-Sed Eff Partially Worked#4 M.O. ClO2 & Cl2 at Raw Water with Additional Cl2 at Pre-Sed Eff Worked
#1 #2 #3 #4
Baseline of .8 PPM ClO2
0
5
10
15
20
25
30
35
40
9/13
/11
9/16
/11
9/19
/11
9/22
/11
9/25
/11
9/28
/11
10/1
/11
10/4
/11
10/7
/11
10/1
0/11
10/1
3/11
10/1
6/11
TTHM
's
0.0
0.3
0.6
0.9
1.2
1.5
1.8
2.1
2.4
ClO
2 & C
l 2 Do
sage
PPM
..
EPDSTTHM's
Pre-Sed Eff.ClO2Dose
Pre-Sed Eff.Cl2Dose
Pre-Sed Inf.Cl2Dose
Raw WaterClO2Dose
Raw WaterCl2Dose
#1 #2 #3 #4Baseline of .8 PPM ClO2
8
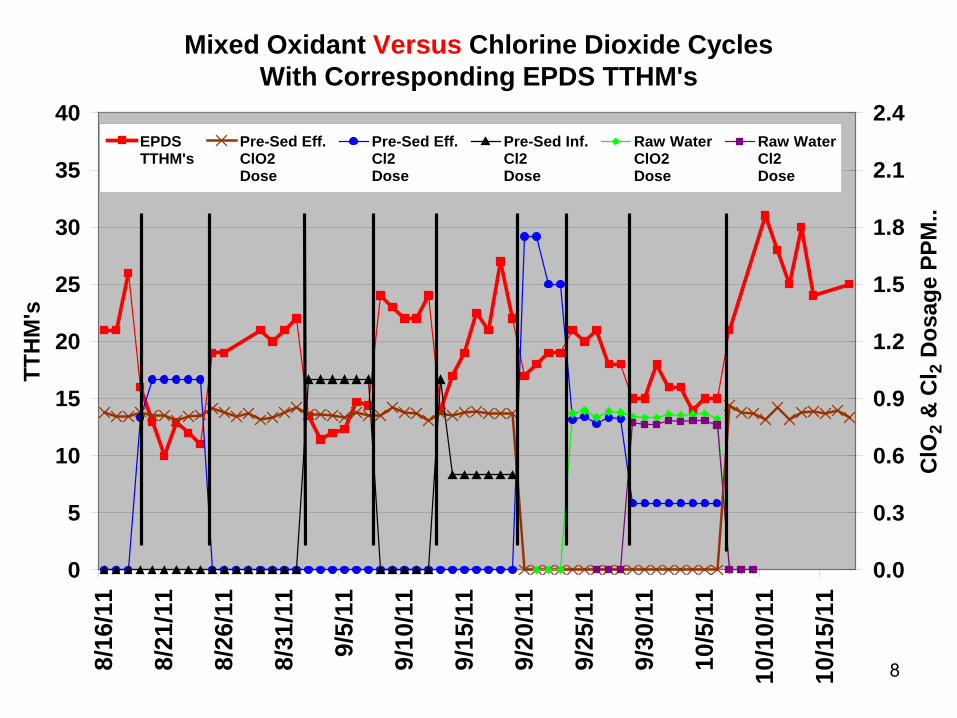
Mixed Oxidant Versus Chlorine Dioxide Cycles With Corresponding EPDS TTHM's
0
5
10
15
20
25
30
35
408/
16/1
1
8/21
/11
8/26
/11
8/31
/11
9/5/
11
9/10
/11
9/15
/11
9/20
/11
9/25
/11
9/30
/11
10/5
/11
10/1
0/11
10/1
5/11
TTH
M's
0.0
0.3
0.6
0.9
1.2
1.5
1.8
2.1
2.4
ClO
2 & C
l 2 D
osag
e PP
M..
EPDSTTHM's
Pre-Sed Eff.ClO2Dose
Pre-Sed Eff.Cl2Dose
Pre-Sed Inf.Cl2Dose
Raw WaterClO2Dose
Raw WaterCl2Dose

9
Mixed Oxidants ProducedSubstantial EPDS TTHM Reductions
0
5
10
15
20
25
30
35
4010
/10/
11
10/1
4/11
10/1
8/11
10/2
2/11
10/2
6/11
10/3
0/11
11/3
/11
11/7
/11
11/1
1/11
11/1
5/11
TT
HM
's
0.0
0.2
0.4
0.6
0.8
1.0
1.2
1.4
1.6
ClO
2 &
Cl 2
Do
sag
e P
PM
..
EPDSTTHM's
Pre-SedEff.ClO2Dose
Pre-SedEff.Cl2Dose
RawWaterClO2Dose
RawWaterCl2Dose
43% Reduction
53% Reduction

10
Mixed Oxidant Trials OverviewNew GAC Media TOC Removal & TTHM’s – Extreme Low & High TTHM
Swings Representative of Mixed Oxidant ON / Off Cycles
0
10
20
30
40
50
60
702/
10/1
1
3/10
/11
4/10
/11
5/10
/11
6/10
/ 11
7/10
/11
8/10
/11
9/10
/11
10/1
0/11
11/1
0/11
TOC
Rem
oval
& T
emp.
.
0
5
10
15
20
25
30
35
TTH
M's
GAC FiltersTOCRemoval%
EPDSTempDeg C
EPDSTTHM's
Mixed Oxidant Trials
Chlorine Dioxide Only

11
Constant Temperature THM Study Through Mixed Oxidant TrialsGAC Eff Spiked with Cl2 and Set Up in a 30 Degree Celsius Incubator
0
10
20
30
40
50
60
7010
/3/1
1
10/1
0/11
10/1
7/11
10/2
4/11
10/3
1/11
11/7
/11
11/1
4/11
11/2
1/11
11/2
8/11
TTHM
's
EPDSTTHM's
24 HrGAC Eff.TTHM'sat 30 Deg C
48 HrGAC Eff.TTHM'sat 30 Deg C
Mixed Oxidants
Chlorine Dioxide Only
Mixed Oxidants Produced THM Reductions of 32% in 24 Hr & 34% in 48 Hr

12
Mixed Oxidants Lowered EPDS TTHM’s Without Additional Steps to Lower TOC
0.000.250.500.751.001.251.501.752.002.252.502.753.003.253.503.75
2/9/
11
3/9/
11
4/9/
11
5/9/
11
6/9/
11
7/9/
11
8/9/
11
9/9/
11
10/9
/11
11/9
/11
TOC
mg/
LFilter 1
Filter 2
Filter 3
Filter 4
Filter 5
Filter 6
Filter 7
Filter 8
Filter 9
Filter 10
Filter 11
Filter 12
Filter 13
Filter 14
Filter 15
Filter 16
Filter 17
Filter 18
SBF EffTOC
Source SwitchVerde to Salt
Source SwitchSalt to Verde
Start ofMixed OxidantTrials
Mixed Oxidants Lowered TTHM's without Additional Steps to Lower TOC

13
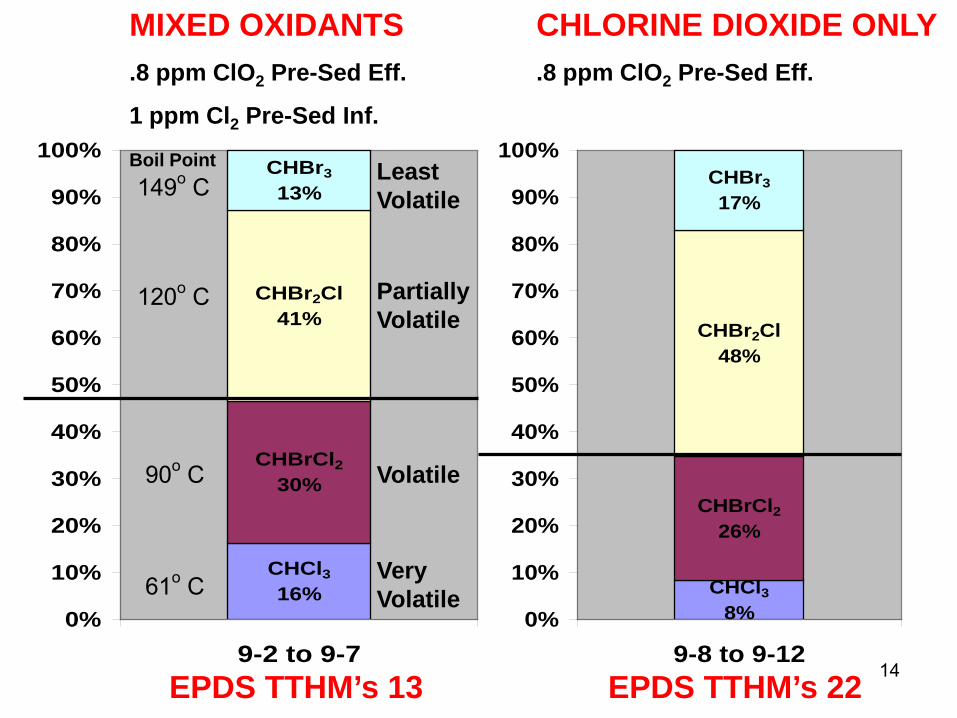
Mixed Oxidants Upstream of GAC Filters Not Only Reduced EPDS TTHM’s, But Also Increased the
Volatile Percentage of the TTHM Speciation. Great news for Aeration Reduction Techniques
Bromoform – Least VolatileCHBr3 – Percentage Decreased
Dibromochloromethane – Partially VolatileCHBr2Cl – Percentage Decreased
Bromodichloromethane - VolatileCHBrCl2 – Percentage Increased
Chloroform – Very VolatileCHCl3 – Percentage Substantially Increased
14
CHCl38%
CHBrCl226%
CHBr2Cl48%
CHBr317%
0%
10%
20%
30%
40%
50%
60%
70%
80%
90%
100%
9-8 to 9-12
CHCl316%
CHBrCl230%
CHBr2Cl41%
CHBr313%
0%
10%
20%
30%
40%
50%
60%
70%
80%
90%
100%
9-2 to 9-7
CHLORINE DIOXIDE ONLY.8 ppm ClO2 Pre-Sed Eff.
MIXED OXIDANTS.8 ppm ClO2 Pre-Sed Eff.
1 ppm Cl2 Pre-Sed Inf.
EPDS TTHM’s 13 EPDS TTHM’s 22
Boil Point
61o C
90o C
120o C
149o C
Very Volatile
Volatile
Partially Volatile
Least Volatile

15
MIXED OXIDANTS8 . ppm ClO2 Raw Water.8 ppm Cl2 Raw Water.3 ppm Cl2 Pre-Sed Eff.
CHLORINE DIOXIDE ONLY.8 ppm ClO2 Pre-Sed Eff.
CHCl310%
CHBrCl226%
CHBr2Cl46%
CHBr317%
0%
10%
20%
30%
40%
50%
60%
70%
80%
90%
100%
10-10 to 10-24
CHCl319%
CHBrCl231%
CHBr2Cl38%
CHBr312%
0%
10%
20%
30%
40%
50%
60%
70%
80%
90%
100%
9-29 to 10-6EPDS TTHM’s 15 EPDS TTHM’s 28
Very Volatile
Volatile
Partially Volatile
Least Volatile
61o C
90o C
120o C
149o CBoil Point
16
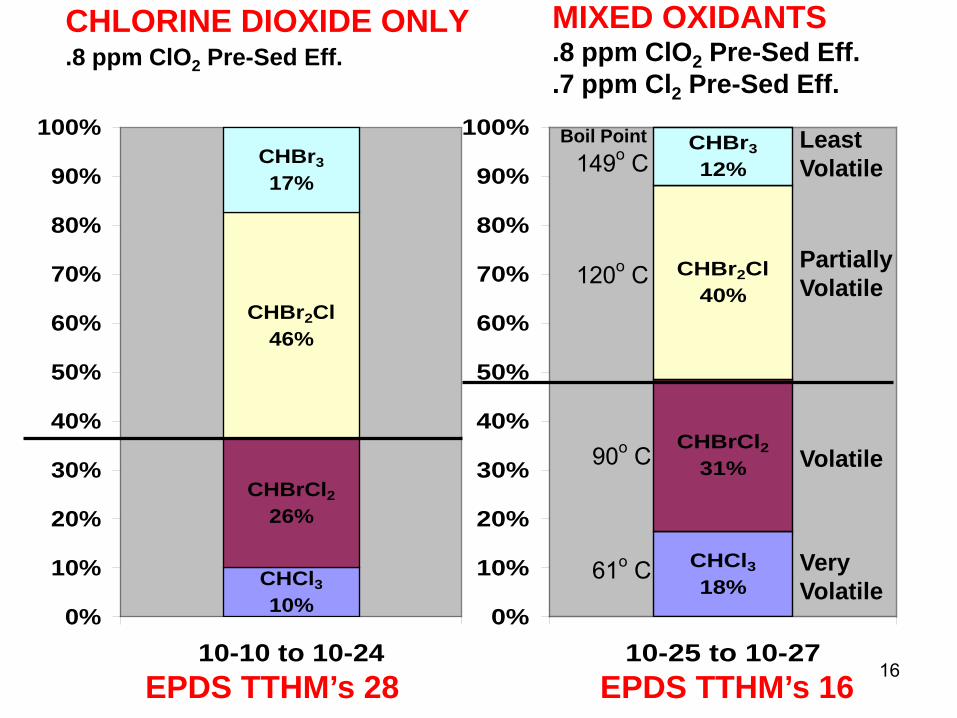
CHLORINE DIOXIDE ONLY.8 ppm ClO2 Pre-Sed Eff.
MIXED OXIDANTS.8 ppm ClO2 Pre-Sed Eff..7 ppm Cl2 Pre-Sed Eff.
CHCl318%
CHBrCl231%
CHBr2Cl40%
CHBr312%
0%
10%
20%
30%
40%
50%
60%
70%
80%
90%
100%
10-25 to 10-27
CHCl310%
CHBrCl226%
CHBr2Cl46%
CHBr317%
0%
10%
20%
30%
40%
50%
60%
70%
80%
90%
100%
10-10 to 10-24EPDS TTHM’s 28 EPDS TTHM’s 16
61o C
90o C
120o C
149o C
Very Volatile
Volatile
Partially Volatile
Least Volatile
Boil Point
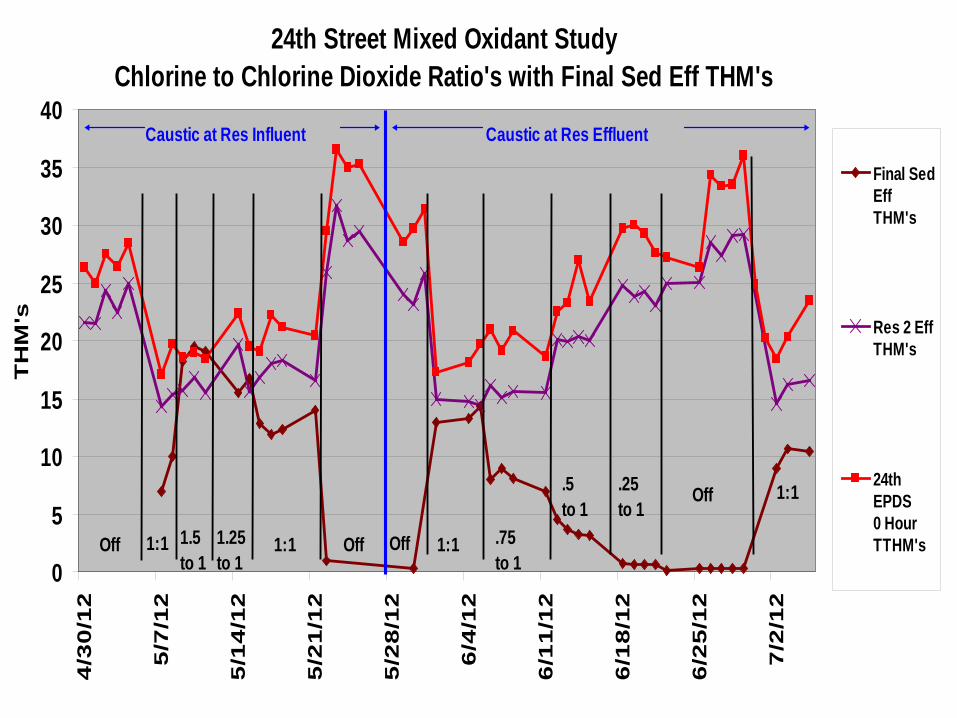
24th Street Mixed Oxidant StudyChlorine to Chlorine Dioxide Ratio's with Final Sed Eff THM's
0
5
10
15
20
25
30
35
404
/30
/12
5/7
/12
5/1
4/1
2
5/2
1/1
2
5/2
8/1
2
6/4
/12
6/1
1/1
2
6/1
8/1
2
6/2
5/1
2
7/2
/12
TH
M's
Final SedEffTHM's
Res 2 EffTHM's
24thEPDS0 HourTTHM'sOff 1:1 1.5
to 11.25to 1
1:1 Off Off 1:1 .75to 1
.5to 1
.25to 1
Off 1:1
Caustic at Res Influent Caustic at Res Effluent
18
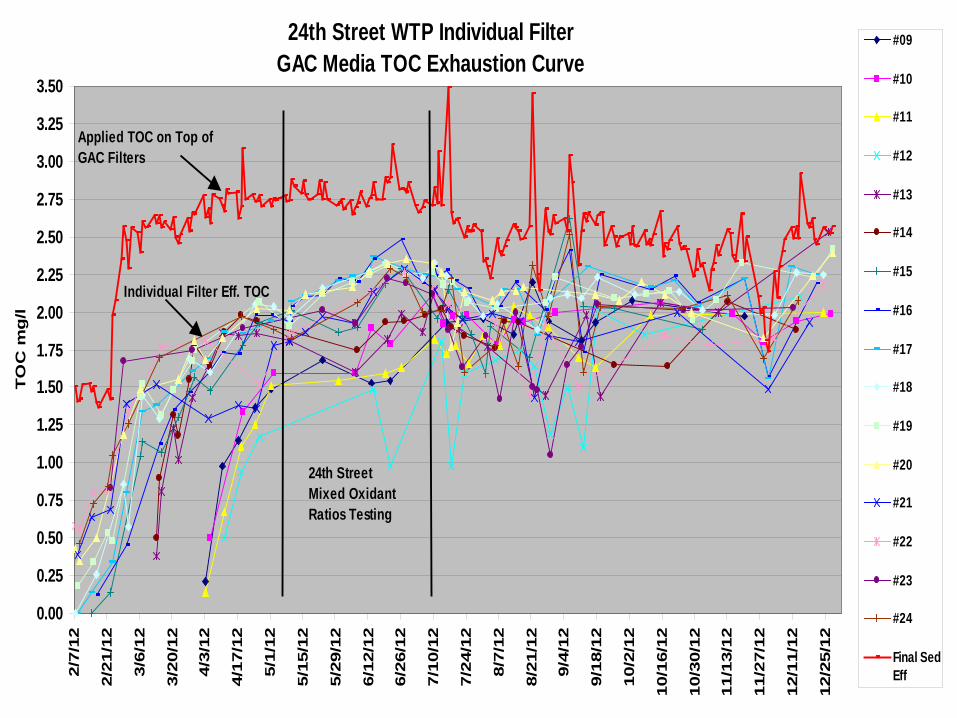
24th Street WTP Individual FilterGAC Media TOC Exhaustion Curve
0.00
0.25
0.50
0.75
1.00
1.25
1.50
1.75
2.00
2.25
2.50
2.75
3.00
3.25
3.502/
7/12
2/21
/12
3/6/
12
3/20
/12
4/3/
12
4/17
/12
5/1/
12
5/15
/12
5/29
/12
6/12
/12
6/26
/12
7/10
/12
7/24
/12
8/7/
12
8/21
/12
9/4/
12
9/18
/12
10/2
/12
10/1
6/12
10/3
0/12
11/1
3/12
11/2
7/12
12/1
1/12
12/2
5/12
TO
C m
g/l
#09
#10
#11
#12
#13
#14
#15
#16
#17
#18
#19
#20
#21
#22
#23
#24
Final SedEff
Applied TOC on Top of GAC Filters
Individual Filter Eff. TOC
24th StreetMixed OxidantRatios Testing
19
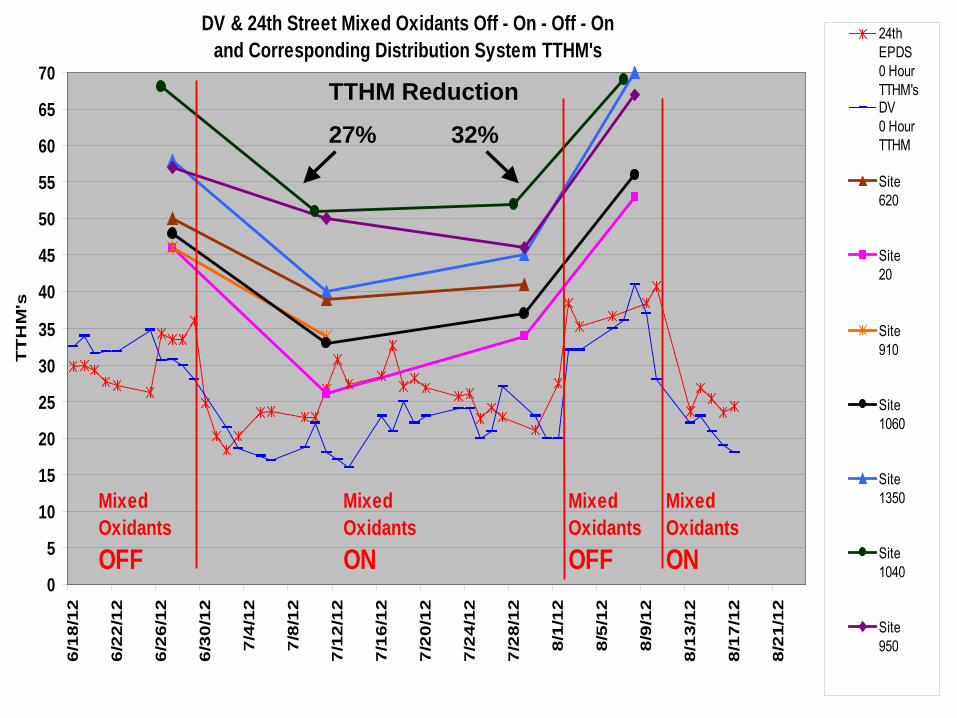
DV & 24th Street Mixed Oxidants Off - On - Off - Onand Corresponding Distribution System TTHM's
0
5
10
15
20
25
30
35
40
45
50
55
60
65
706
/18
/12
6/2
2/1
2
6/2
6/1
2
6/3
0/1
2
7/4
/12
7/8
/12
7/1
2/1
2
7/1
6/1
2
7/2
0/1
2
7/2
4/1
2
7/2
8/1
2
8/1
/12
8/5
/12
8/9
/12
8/1
3/1
2
8/1
7/1
2
8/2
1/1
2
TT
HM
's24thEPDS0 HourTTHM'sDV0 HourTTHM
Site620
Site20
Site910
Site1060
Site1350
Site1040
Site950
MixedOxidantsOFF
MixedOxidantsON
MixedOxidantsOFF
MixedOxidantsON
TTHM Reduction
27% 32%
20
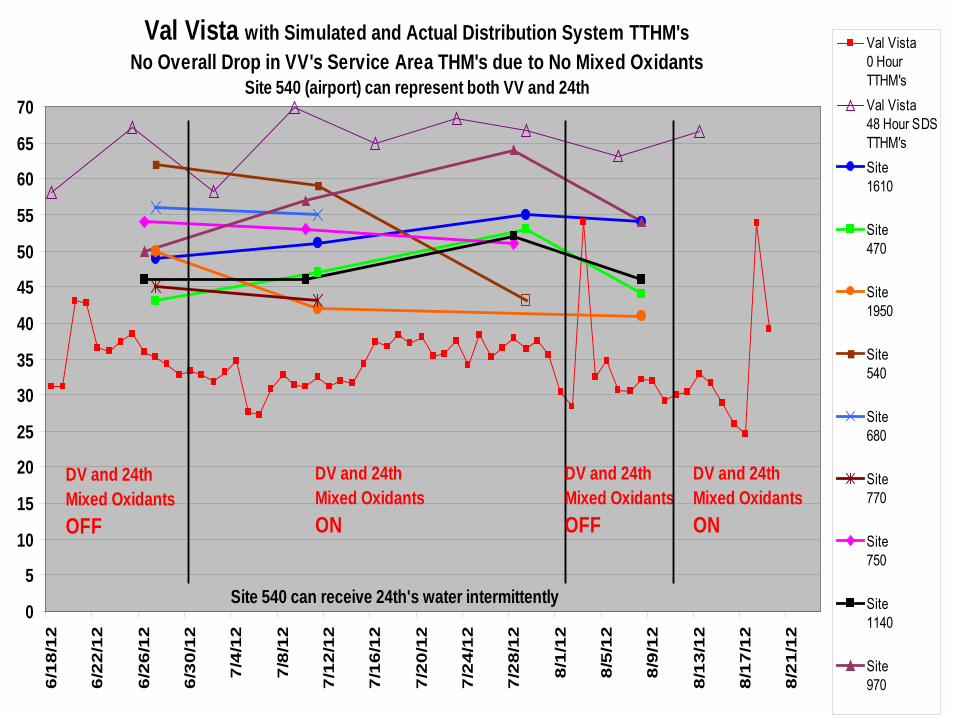
Val Vista with Simulated and Actual Distribution System TTHM'sNo Overall Drop in VV's Service Area THM's due to No Mixed Oxidants
Site 540 (airport) can represent both VV and 24th
0
5
10
15
20
25
30
35
40
45
50
55
60
65
70
6/1
8/1
2
6/2
2/1
2
6/2
6/1
2
6/3
0/1
2
7/4
/12
7/8
/12
7/1
2/1
2
7/1
6/1
2
7/2
0/1
2
7/2
4/1
2
7/2
8/1
2
8/1
/12
8/5
/12
8/9
/12
8/1
3/1
2
8/1
7/1
2
8/2
1/1
2
Val Vista0 HourTTHM'sVal Vista48 Hour SDSTTHM'sSite1610
Site470
Site1950
Site540
Site680
Site770
Site750
Site1140
Site970
DV and 24thMixed OxidantsOFF
DV and 24thMixed OxidantsON
DV and 24thMixed OxidantsOFF
Site 540 can receive 24th's water intermittently
DV and 24thMixed OxidantsON
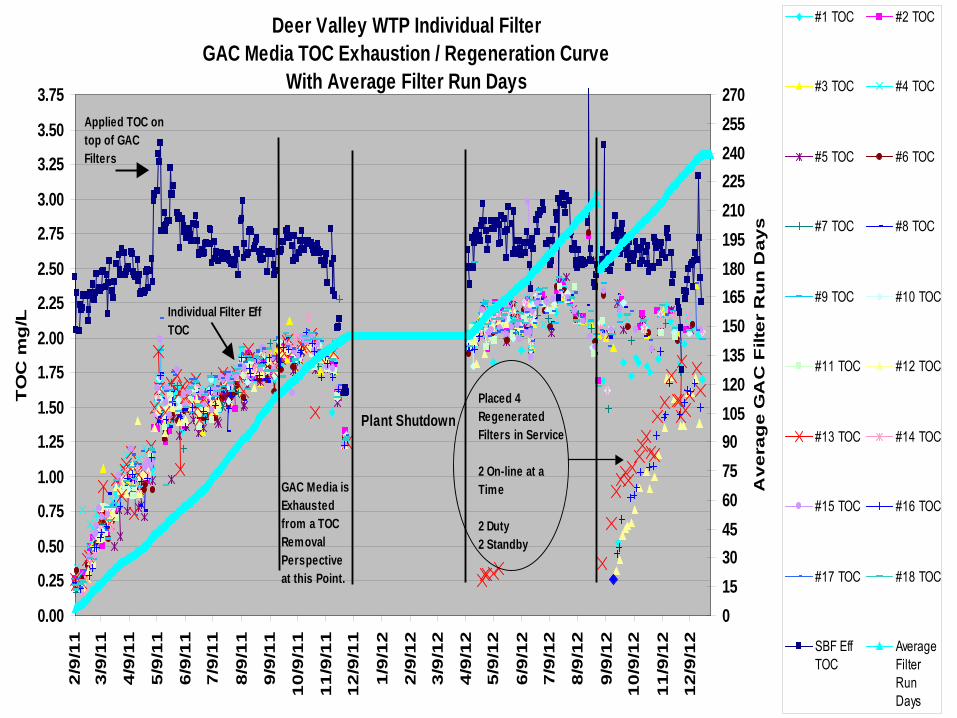
Deer Valley WTP Individual FilterGAC Media TOC Exhaustion / Regeneration Curve
With Average Filter Run Days
0.00
0.25
0.50
0.75
1.00
1.25
1.50
1.75
2.00
2.25
2.50
2.75
3.00
3.25
3.50
3.752
/9/1
1
3/9
/11
4/9
/11
5/9
/11
6/9
/11
7/9
/11
8/9
/11
9/9
/11
10
/9/1
1
11
/9/1
1
12
/9/1
1
1/9
/12
2/9
/12
3/9
/12
4/9
/12
5/9
/12
6/9
/12
7/9
/12
8/9
/12
9/9
/12
10
/9/1
2
11
/9/1
2
12
/9/1
2
TO
C m
g/L
0153045607590105120135150165180195210225240255270
Av
era
ge
GA
C F
ilte
r R
un
Da
ys
#1 TOC #2 TOC
#3 TOC #4 TOC
#5 TOC #6 TOC
#7 TOC #8 TOC
#9 TOC #10 TOC
#11 TOC #12 TOC
#13 TOC #14 TOC
#15 TOC #16 TOC
#17 TOC #18 TOC
SBF EffTOC
AverageFilterRunDays
GAC Media isExhaustedfrom a TOC Removal Perspectiveat this Point.
Plant Shutdown
Applied TOC on top of GAC Filters
Individual Filter Eff TOC
Placed 4 Regenerated Filters in Service
2 On-line at a Time
2 Duty2 Standby
22
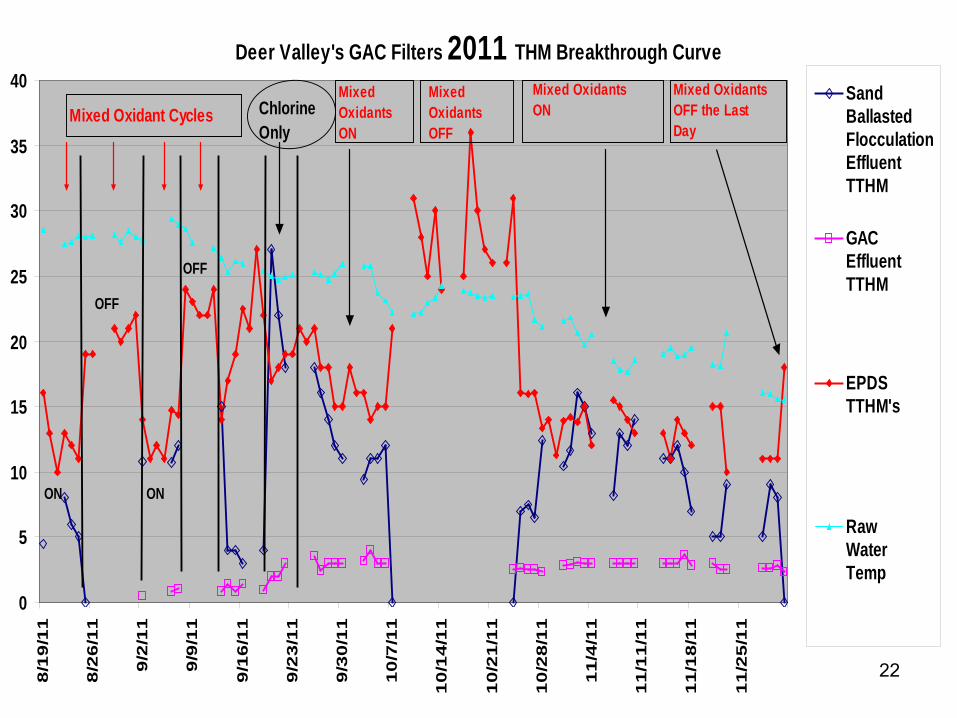
Deer Valley's GAC Filters 2011 THM Breakthrough Curve
0
5
10
15
20
25
30
35
40
8/1
9/1
1
8/2
6/1
1
9/2
/11
9/9
/11
9/1
6/1
1
9/2
3/1
1
9/3
0/1
1
10
/7/1
1
10
/14
/11
10
/21
/11
10
/28
/11
11
/4/1
1
11
/11
/11
11
/18
/11
11
/25
/11
SandBallastedFlocculationEffluentTTHM
GACEffluentTTHM
EPDSTTHM's
RawWaterTemp
ON
OFF
ON
OFF
Mixed Oxidant Cycles ChlorineOnly
MixedOxidantsON
Mixed OxidantsOFF
Mixed OxidantsON
Mixed OxidantsOFF the LastDay
23
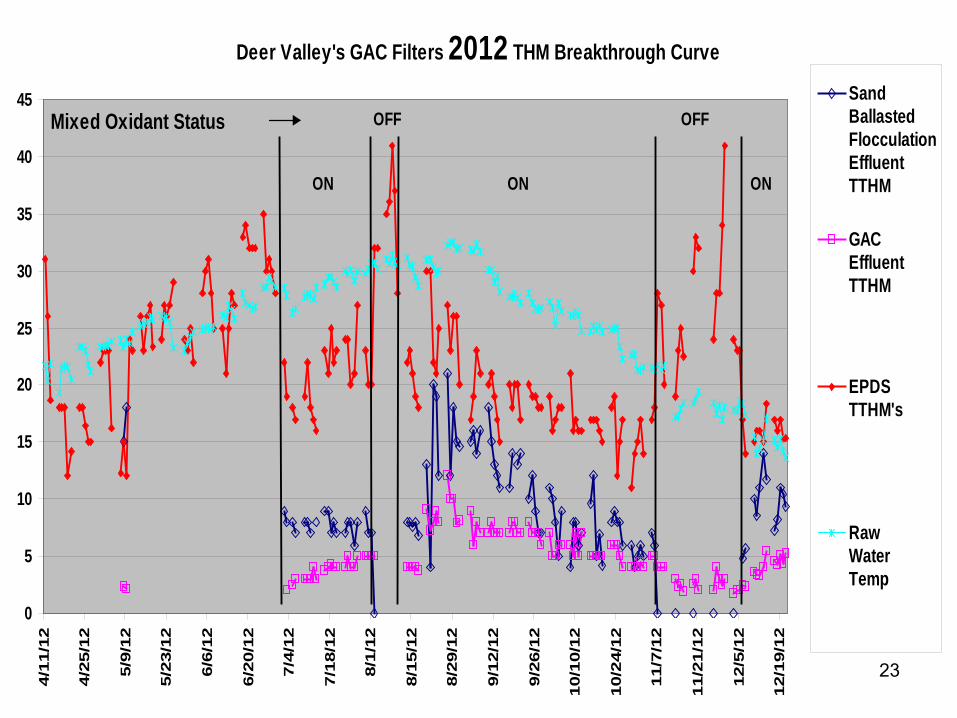
Deer Valley's GAC Filters 2012 THM Breakthrough Curve
0
5
10
15
20
25
30
35
40
45
4/11
/12
4/25
/12
5/9/
12
5/23
/12
6/6/
12
6/20
/12
7/4/
12
7/18
/12
8/1/
12
8/15
/12
8/29
/12
9/12
/12
9/26
/12
10/1
0/12
10/2
4/12
11/7
/12
11/2
1/12
12/5
/12
12/1
9/12
SandBallastedFlocculationEffluentTTHM
GACEffluentTTHM
EPDSTTHM's
RawWaterTemp
ON
OFF
ON
OFF
ON
Mixed Oxidant Status
24
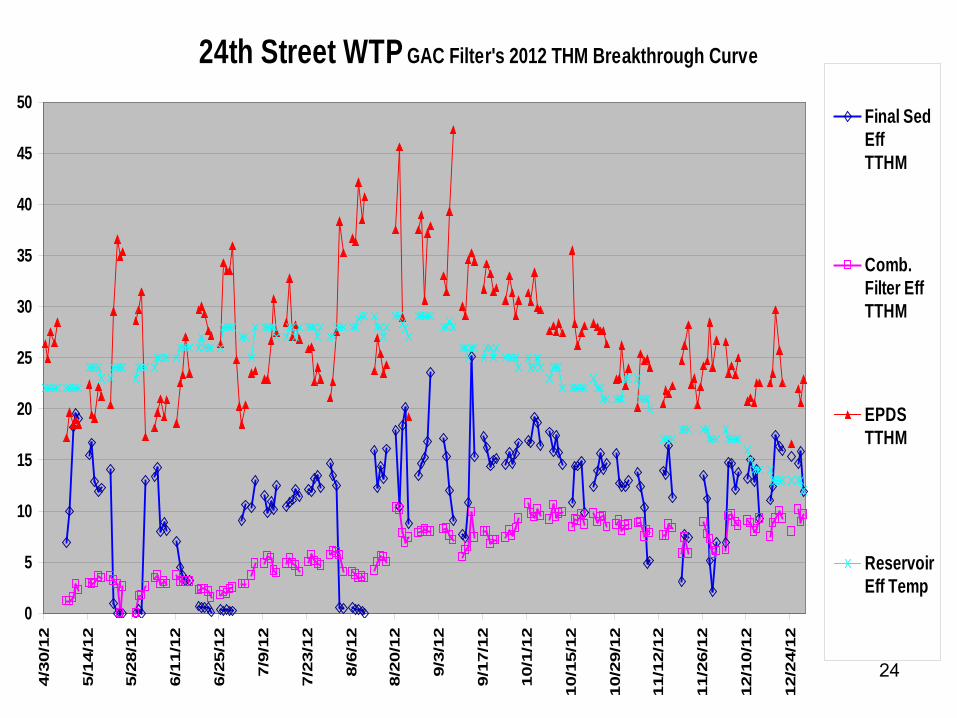
24th Street WTP GAC Filter's 2012 THM Breakthrough Curve
0
5
10
15
20
25
30
35
40
45
50
4/30
/12
5/14
/12
5/28
/12
6/11
/12
6/25
/12
7/9/
12
7/23
/12
8/6/
12
8/20
/12
9/3/
12
9/17
/12
10/1
/12
10/1
5/12
10/2
9/12
11/1
2/12
11/2
6/12
12/1
0/12
12/2
4/12
Final SedEffTTHM
Comb.Filter EffTTHM
EPDSTTHM
ReservoirEff Temp

25
Deer Valley WTP GAC Media Chlorite Exhaustion Curve
0.0
0.1
0.2
0.3
0.4
0.5
0.6
0.7
0.8
0.9
1.0
2/9/
2011
3/9/
2011
4/9/
2011
5/9/
2011
6/9/
2011
7/9/
2011
8/9/
2011
9/9/
2011
10/9
/201
1
11/9
/201
1
12/9
/201
1
1/9/
2012
2/9/
2012
3/9/
2012
4/9/
2012
5/9/
2012
6/9/
2012
7/9/
2012
8/9/
2012
9/9/
2012
10/9
/201
2
11/9
/201
2
12/9
/201
2
Sand BallastedFlocculation EffChloritePPM
CombinedFilter EffChloritePPM
EPDSChloritePPM
PlantShutDown
IncreasedChlorine Dioxide Dose
Early Sign of ChloriteRemoval Exhaustion
26
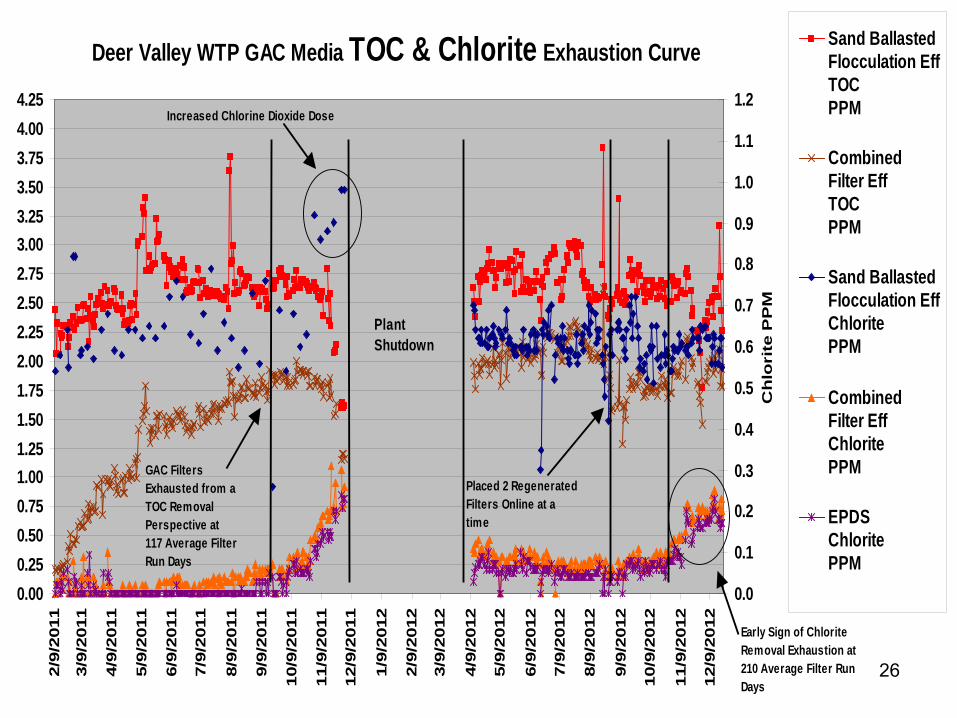
Deer Valley WTP GAC Media TOC & Chlorite Exhaustion Curve
0.000.250.500.751.001.251.501.752.002.252.502.753.003.253.503.754.004.25
2/9/
2011
3/9/
2011
4/9/
2011
5/9/
2011
6/9/
2011
7/9/
2011
8/9/
2011
9/9/
2011
10/9
/201
1
11/9
/201
1
12/9
/201
1
1/9/
2012
2/9/
2012
3/9/
2012
4/9/
2012
5/9/
2012
6/9/
2012
7/9/
2012
8/9/
2012
9/9/
2012
10/9
/201
2
11/9
/201
2
12/9
/201
2
0.0
0.1
0.2
0.3
0.4
0.5
0.6
0.7
0.8
0.9
1.0
1.1
1.2
Ch
lori
te P
PM
Sand BallastedFlocculation EffTOCPPM
CombinedFilter EffTOCPPM
Sand BallastedFlocculation EffChloritePPM
CombinedFilter EffChloritePPM
EPDSChloritePPM
PlantShutdown
GAC FiltersExhausted from aTOC RemovalPerspective at117 Average FilterRun Days
Increased Chlorine Dioxide Dose
Placed 2 RegeneratedFilters Online at atime
Early Sign of ChloriteRemoval Exhaustion at210 Average Filter RunDays

27
Optimum Mixed Oxidant Dosages and Locations
Best THM Reductions If Dosed at the Same Location• Chlorine & Chlorine Dioxide Dosed at ≈ 1 to 1 Ratio
If Dosed at Different Locations• Chlorine dosed first, enough to carry a slight free
residual to the chlorine dioxide feed point still worked.
• However, chlorine dioxide dosed first only partially worked. The chlorine dioxide residual dissipated before the chlorine feed location.

28
TTHM Reductions Using Mixed Oxidants Upstream of GAC Filters
• EPDS TTHM’s were reduced by 43% to 53% WITHOUT Additional Steps to Remove More TOC
• TTHM’s in the far reaches of the distribution system were reduced by 30%
• Mixed Oxidants altered the TTHM speciation to allow a greater percentage of the TTHM’s formed to be volatilized, which should also improve the THM reduction efficiency of aeration methods
29
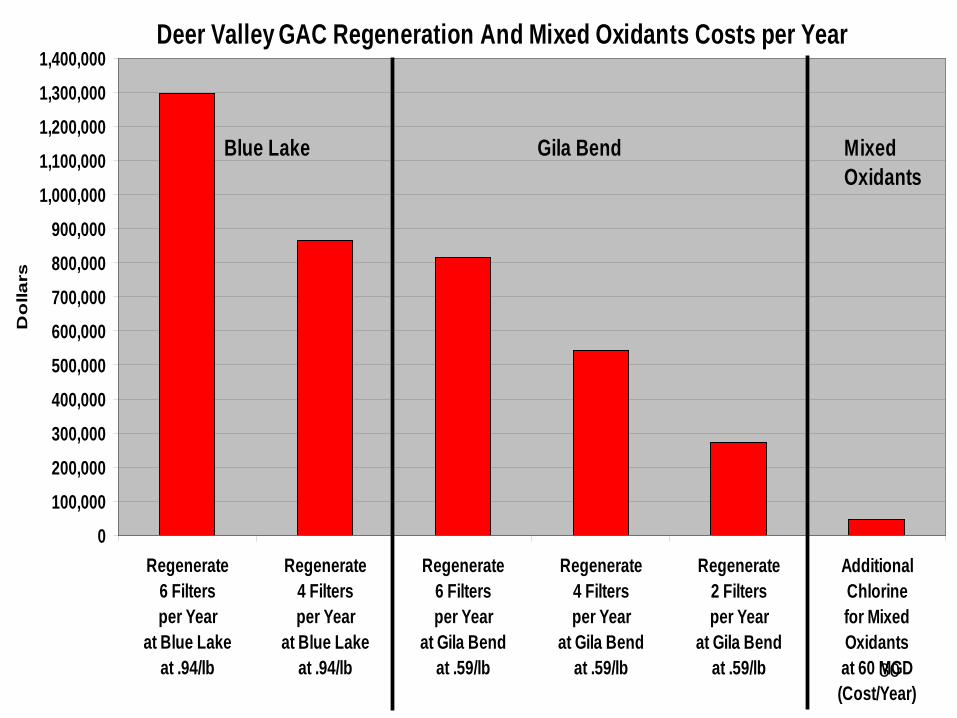
Cost Savings• Deer Valley’s GAC has continued to adsorb THM’s a
year after its been considered exhausted from a TOC removal perspective, which has allowed mixed oxidants to continue to reduce finished water TTHM’s.
• GAC Regeneration frequency can now be based on either a TOC exhaustion frequency or a THM exhaustion frequency.
• Deer Valley regenerated 6 GAC filters during their first year based on projected TOC removal exhaustion rates. Due to the overall THM reductions seen while using mixed oxidants, Deer Valley will only regenerate 4 filters this year, and the potential exists to reduce that further the following year.
30
Deer Valley GAC Regeneration And Mixed Oxidants Costs per Year
0
100,000
200,000
300,000
400,000
500,000
600,000
700,000
800,000
900,000
1,000,000
1,100,000
1,200,000
1,300,000
1,400,000
Regenerate6 Filtersper Year
at Blue Lakeat .94/lb
Regenerate4 Filtersper Year
at Blue Lakeat .94/lb
Regenerate6 Filtersper Year
at Gila Bendat .59/lb
Regenerate4 Filtersper Year
at Gila Bendat .59/lb
Regenerate2 Filtersper Year
at Gila Bendat .59/lb
AdditionalChlorinefor MixedOxidantsat 60 MGD(Cost/Year)
Do
llars
Blue Lake Gila Bend MixedOxidants

31
Questions?