Embed Size (px)
Citation preview

Session 7: Hypothesis
Test, Part I
Li (Sherlly) Xie
http://www.nemoursresearch.org/open/StatClass/February2013/

Session 7 Flow
1. Terminologies
A. Null and alternative hypotheses
B. One and two-sided tests
C. Type I and II errors, significance level, power
C. Rejection region and confidence interval
E. P-value, test statistic
F. Degree of freedom
2. 1- and 2-sample paired and unpaired t tests;
Wilcoxon (signed-rank) test; Mann Whitney test

Null and alternative hypotheses
Null (Ho): hypothesis to be tested
Alternative (Ha): complementary to Ho, so
that the mutually exclusive pair (Ho and
Ha) together exhaust ALL possible
outcomes.
Typical Ho: No association between X and Y,
outcome is not different in placebo and
treatment groups, proportion of those who
have symptoms is not different among the
exposed and non-exposed, etc.
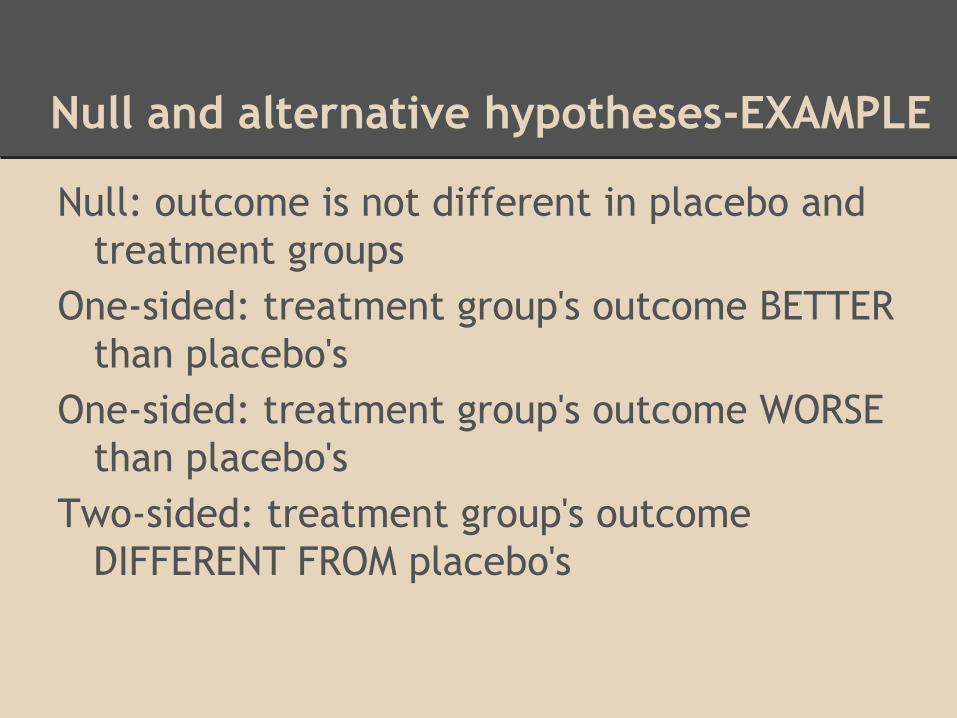
Null and alternative hypotheses-EXAMPLE
Null: outcome is not different in placebo and
treatment groups
One-sided: treatment group's outcome BETTER
than placebo's
One-sided: treatment group's outcome WORSE
than placebo's
Two-sided: treatment group's outcome
DIFFERENT FROM placebo's

One and Two-sided tests-
QUANTIFIED
One-sided: treatment group's thromboxane
level lower than placebo's
One-sided: treatment group's thromboxane
level higher than placebo's
Two-sided: treatment group's thromboxane
level lower or higher than placebo's

Why running two-sided tests is
standard practice
p-value from a two-sided test is 2 times the p-
value from a one-sided test -> guard against
type I error (claiming stat sig difference
when there is none)

Ho in 2 groups vs GLOBAL Ho in >2
groups
Suppose 50% subjects in treatment group are
on high-dose scheme, 50% are on low-dose
Questions could be asked:
1. Does the drug has ANY effect?
2. Is there any evidence for dose-dependent
effect?
Pop quiz: formulate Ho and Ha for question 1

GLOBAL Null Hypothesis
When comparing more than 2 groups, has
more than 3 possible results/inferences
Example: placebo, treatment-low-dose,
treatment-high-dose
Possible results: Let's enlist all 9

GLOBAL Null Hypothesis
Placebo Low-dose High-dose
P=L=H P=L<H P=L>H
P<L=H P<L<H P<L>H
P>L=H P>L<H P>L>H
Shortcut:
# possible results = 3 to the power of (# grps - 1)
5 groups=3^4=3x3x3x=81 possible results
when comparing groups
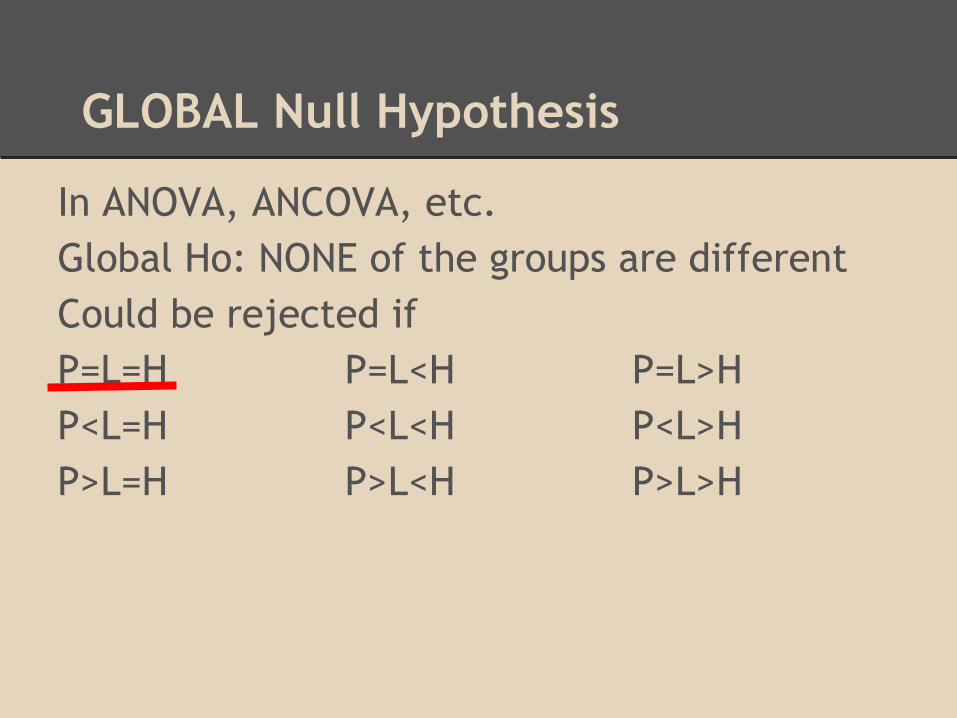
GLOBAL Null Hypothesis
In ANOVA, ANCOVA, etc.
Global Ho: NONE of the groups are different
Could be rejected if
P=L=H P=L<H P=L>H
P<L=H P<L<H P<L>H
P>L=H P>L<H P>L>H

Application to Homework Data Set
Case 1 Theory: Prevalence of family history of
diabetes is associated with BMI
Case 2 Theory: Prevalence of family history of
diabetes is differentially associated with BMI
in different racial/ethnic groups (suppose C,
A, AA, O 4 racial/ethnic groups)
Case 1 Ho:
Case 1 Ha(s):
Case 2 Ho:
Case 2 Ha(s):

Type I and II Errors
Type 1 error: finding stat sig diff when there
is none (rejecting null when null is true)
Type 2 error: not finding stat sig diff when
there is (accepting null when null is false)
Significance level = PROBABILITY of making
type 1 error. "a=0.05" is a 5% PROBABILITY
Power = PROBABILITY of rejecting null when
null is false = 1 - Prob(type 2 error)

P-value and Test Statistic
P-value: PROBABILITY of obtaining a test
statistic at least as extreme as the one that
was actually observed, assuming (not GIVEN)
Ho is true.
Test statistic: a summary statistic of a set of
data that reduces the data to one or a small
number of values that can be used to
perform a hypothesis test.
t-test statistic

Rejection Region and Confidence
Interval
Test statistic: acceptance region + rejection region
Critical value: value of test statistic that leads to rejection of Ho
Sample: confidence interval + elsewhere
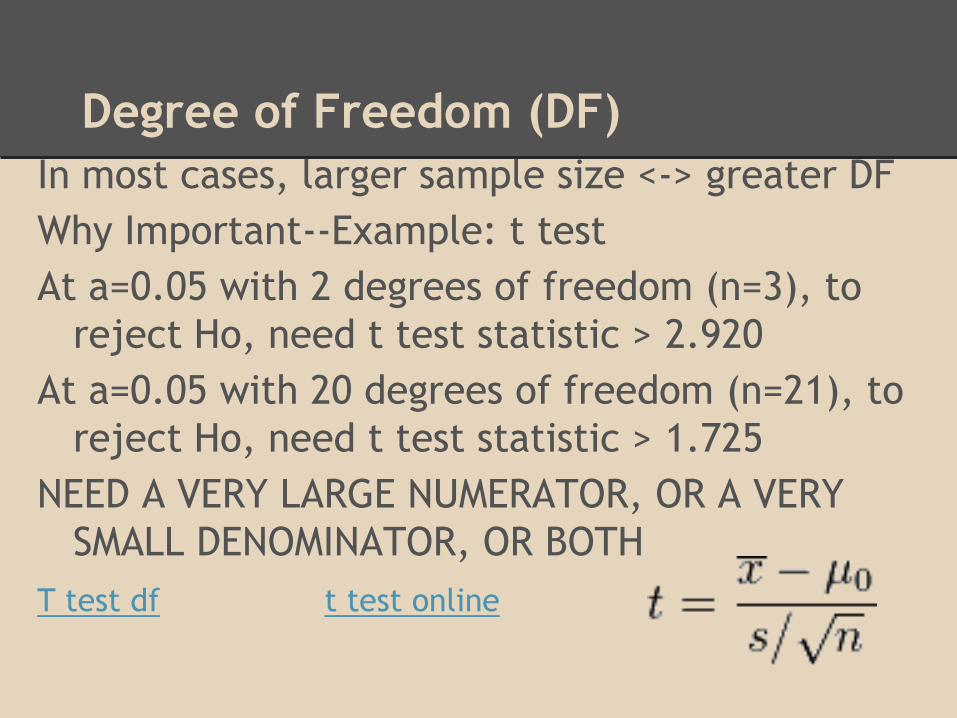
Degree of Freedom (DF)
In most cases, larger sample size <-> greater DF
Why Important--Example: t test
At a=0.05 with 2 degrees of freedom (n=3), to
reject Ho, need t test statistic > 2.920
At a=0.05 with 20 degrees of freedom (n=21), to
reject Ho, need t test statistic > 1.725
NEED A VERY LARGE NUMERATOR, OR A VERY
SMALL DENOMINATOR, OR BOTH
T test df t test online
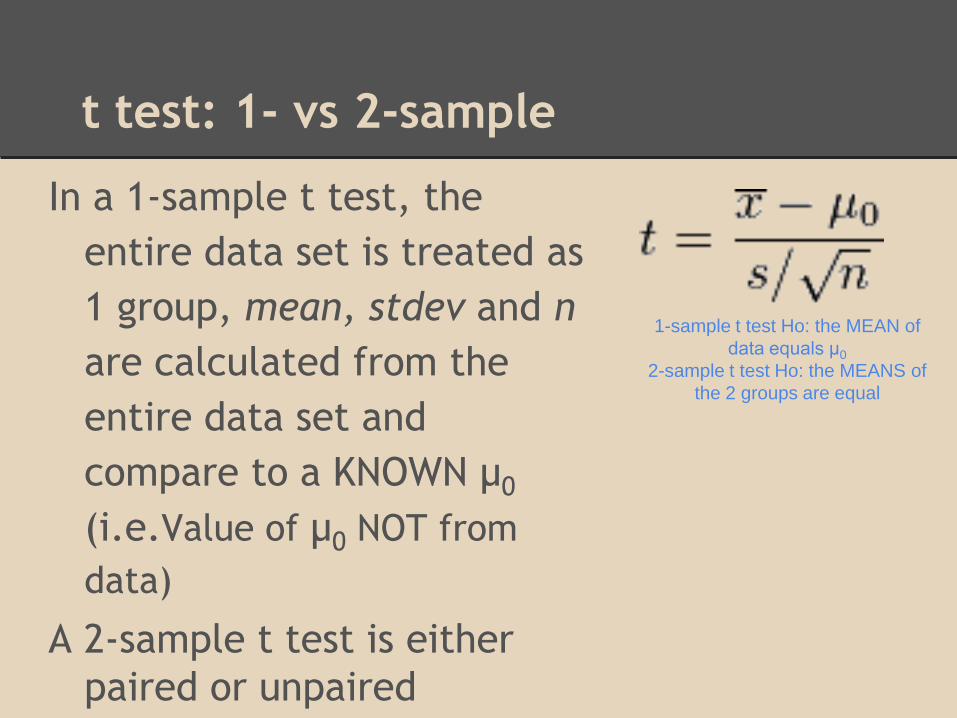
t test: 1- vs 2-sample
In a 1-sample t test, the
entire data set is treated as
1 group, mean, stdev and n
are calculated from the
entire data set and
compare to a KNOWN μ0
(i.e.Value of μ0 NOT from
data)
A 2-sample t test is either
paired or unpaired
1-sample t test Ho: the MEAN of
data equals μ0
2-sample t test Ho: the MEANS of
the 2 groups are equal

t test: paired vs unpaired 2-sample
In a 2-sample paired t test,
test statistic is calculated
from the DIFFERENCE
between paired
observations from each
group and # subjects
from the 2 groups
In a 2-sample unpaired t
test, test statistic is
calculated from mean
stdev n of each of the 2
groups
(d=diff btw paired obs)

Paired vs unpaired t test
Quick check for paired vs unpaired:
If re-assigning ID number from one of the
groups is okay, then unpaired. If not, paired.
TYPICAL PAIRED data: baseline-endline (not
okay to re-assign baseline ID), matched case-
control (cannot break the matching), etc.

t test assumptions
1. No group A subject is in group B
2. Dependent variable is continuous
3. Each observation (or pair of observations) of
the dependent variable is independent of the
other observations of the dependent variable.
4. Random sampling
5. Dependent variable follows a normal
distribution (1-sample & 2-sample unpaired);
Dependent variable follows normal distribution
with EQUAL VARIANCE in 2-sample paired t test

Assessing assumptions: When Box
Plot Comes in Handy
Location of means?
Difference in variances (stdev) ?

Formal Tests for Equality of
Variance and Normal Distribution
F test: Ho: variances in 2 groups are equal
Shapiro-Wilk test: Ho: data is normally
distributed

If T tests assumptions are
violated...
Wilcoxon (signed-rank) test
Ho: MEDIAN diff between pairs in each group=0
Mann Whitney test (Wilcoxon rank-sum test)
Ho: Median diff between GROUPS=0
Parametric test Non-Parametric analogue
1-sample t test NONE
Paired 2-sample t test Wilcoxon (signed-rank)
test
Unpaired 2-sample t test Mann Whitney (U) test

Ordinal (Ranked) dependent variables
Wilcoxon test
Ho: MEDIAN diff in rank between pairs in each
group=0
Mann Whitney test
Ho: Median diff in rank between GROUPS=0
Parametric vs Non-Parametric Tests
Non-parametric tests
Pro: robust to outlier, less assumptions
Con: larger p-value compare to parametric
analogues, does not work well when n is
small, less sensitive and efficient if data
meets assumptions of parametric analogues

Hypothesis Test Decision Tree (2
groups, continuous dependent variable)
1. determine variable type->2. calculate
appropriate descriptive statistics->3.
generate appropriate plots->4. assess
parametric test assumptions
->5a. if assumptions are met, then
parametric
->5b. if assumptions are violated, check
descriptive statistics in each group, examine
extreme values, remove outliers when
appropriate, re-start at step 2