Embed Size (px)
Citation preview

SESSION 7 – ACTIVITIES & THEIR ANALYSIS
Copyright 2011 Phil Heywood

Activity Systems Analysis & Modelling
Simplified Models, Urban Transport & Journey to Work Systems
WORKWORK
RECREATIONRECREATION HOMEHOME SHOPSHOP
SCHOOLSCHOOL

Activity Systems Analysis & Modelling
Simplified Models, Urban Transport & Journey to Work Systems
WORKWORKHOMEHOME

Techniques of Access & Transport Analysis(Including road, rail, water, cycle,
foot & information technology channels)
1. Barriers to access analysis2. Journey to work analysis and projection by mode3. Strategic Origins and Destination Survey & Analysis 4. Information Technology review, projection and substitution
potential 5. Investment need & proposal analysis

Community & Culture:Including Social Characteristics & Capital
1. Social composition: description, analysis & trends
2. Cultural diversity, ethnicity, conflicts and mutual aid
3. Indigenous issues
4. Community organization review and analysis ( social capital & human resources analysis)
5. Social, Human & Cultural Capital review (e.g. JAPA Spring 2004 Special Edition)

Conceptual Model: Employment Change
JOBS
WORKERS
Future Employment
Total & Structure
Future Unemployment
Rate & Total
POLITICAL CHOICE
Existing Employment
Total
Existing Population
Total
Projected Future
Employment Demand
Projected Future
Population Total &
Age/Sex Structure
Existing Unemployment
Projected Unemployment- Labour supply
deficiency/excess rates
Projected Future
Labour/Supply Potential
Future Employment
Policy (length of working week, retirement age,
education policy, etc)
Activity Rates
Employment Trends
Net Reproduction Rates

Economy, Employment & Training(Including existing industry, economic base, cluster,
employment and skills analysis)
1. Shift /Share analysis ( previous & existing employment by local and national growth performance projected to compare local and national, contracting & expanding industries)
2. Job Availability: description, analysis and projection3. Skills audit : analysis of Resident Population skills and structure4. Industrial complex & cluster analysis5. Basic employment (Area Forming) & Local Service (Area Serving)
employment analysis6. Analysis of training opportunities7. Resource Inventory of District infrastructure – water, power,
sewage, liquid and solid waste disposal, regional and national transport facilities
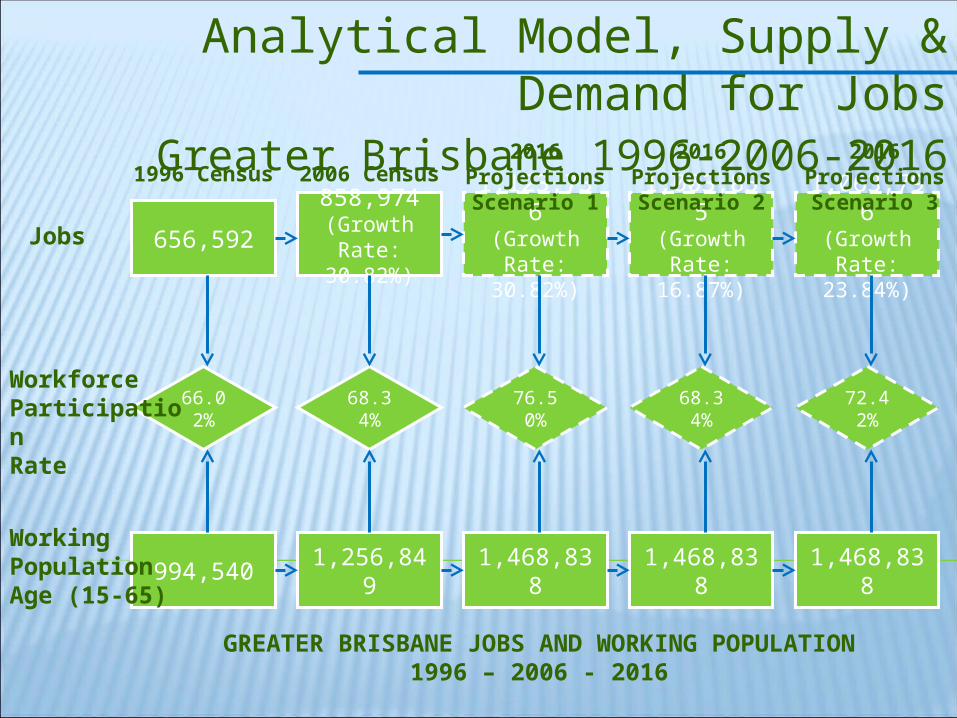
Analytical Model, Supply & Demand for JobsGreater Brisbane 1996-2006-2016
656,592858,974
(Growth Rate: 30.82%)
1,123,736(Growth Rate:
30.82%)
1,003,855(Growth Rate:
16.87%)
1,063,796(Growth Rate:
23.84%)
66.02% 68.34% 76.50% 68.34% 72.42%
994,540 1,256,849 1,468,838 1,468,838 1,468,838
Jobs
WorkforceParticipationRate
WorkingPopulationAge (15-65)
1996 Census 2006 Census2016 Projections
Scenario 12016 Projections
Scenario 22016 Projections
Scenario 3
GREATER BRISBANE JOBS AND WORKING POPULATION1996 – 2006 - 2016

Cycle of Human Use of Natural Resources
* Recycling: water, metals, paper, glass, sewerage, animal waste+ Reclamation: Mining spoil, chemicals. Plastics, concrete, bricks, domestic refuse, derelict land
Transformed Natural
Environment & Matter
Polluted Natural
Environment
Mind, Values & Ideas
Natural Environment & Matter
Energy Sources
Raw Material
sFood
Sources:Atmosphere,
sun, soil, water
TechnologicalTransformatio
n
Natural Ecological Processes
The Closing Circle
Recycling*
Human Use
Bio-hostile Matter
Production Refuse Waste
Reclamation &
Restoration+

Environment & Natural Resources(Including land, water, air & habitat)
1. Resource inventory of water, land, air and habitats2. Review and mapping of open space systems and potentialities3. Existing & anticipated technological & societal impacts 4. Quality & pollution analysis of land air & water resources5. Review and mapping of recreation facilities 6. Land tenure, capacity and quality (description and analysis).7. Resource Demand projection, costing and options 8. Scenario Development for likely impacts of technological
change9. Leading practice examples and implications

Governance & Administration(Including representative Government, public participation, corporations,
public private partnerships & community organisation)
1. Structure and role of different levels and departments of government, community, and private sector organizations
2. Distribution, dominance, dependency & population ratios of District & Neighborhood organizations
3. Content and consistency of different levels of existing and proposed plans
4. Description and analysis of different local boundaries of service organizations (including tables, diagrams and maps)
5. Institutional analysis of service providers

Strategic Issues for Housing in South East Queensland
Courtesy Peter Walsh
Dominant Preference for Detached Housing
Rapid & Externally Driven Population Growth
Growth in One & Two Person Households
Movement to Urban FringeAgeing of Population
DEMAND FACTORS
Strength Tenure Options
Incentives for Private Rental
Integrated Opportunities for Low Income Households
Coordinated Infrastructure Support
Efficient Residential Land Use
Appropriate Housing Form
SUPPLY FACTORS
Uneven Spatial Distribution of Tenure
Low Supply of Alternative Tenure
Options
Segmented Housing Market
Affordability Issues
Infrastructure Supply Constraints
Increased Pressure on Private Rental Market
Affordable & Available Land on the Fringe
Decreasing Government Housing and Infrastructure Funds
Housing Policy & Provision(Including household forecasts, land demand & supply
& neighbourhood design)
1. Demographic analysis and projections, particularly of households
2. Household size and housing type analysis and projection
3. Housing Land Supply description & analysis (SEQ’s Broad Hectare Study)
4. Housing Tenure description, analysis & projection
5. Description & analysis of design options and implications
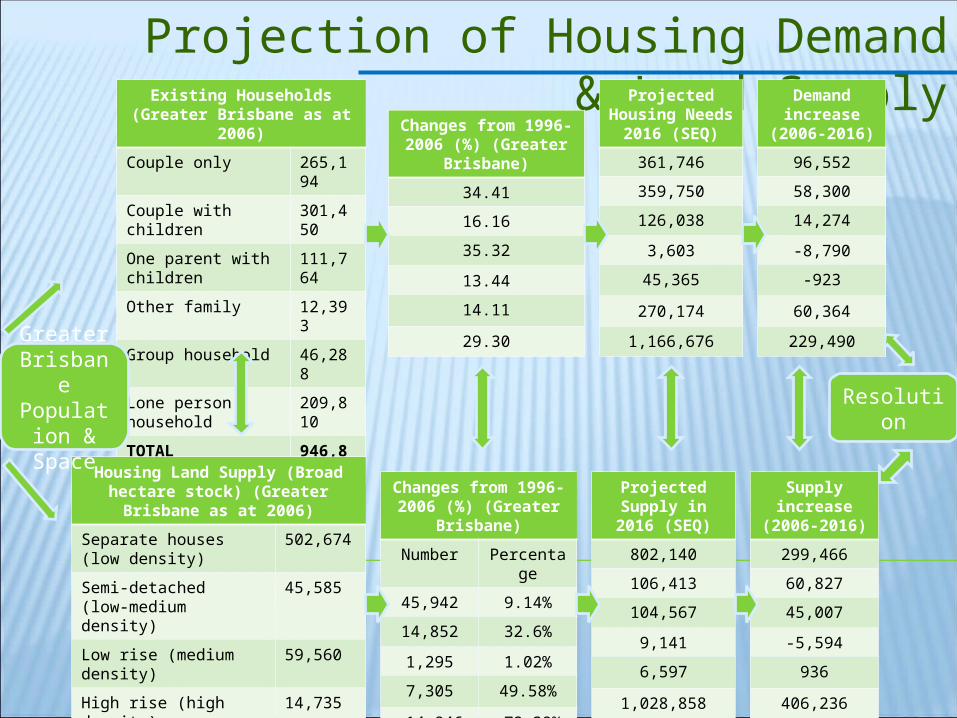
Projection of Housing Demand & Land SupplyExisting Households (Greater
Brisbane as at 2006)
Couple only 265,194
Couple with children 301,450
One parent with children 111,764
Other family 12,393
Group household 46,288
Lone person household 209,810
TOTAL 946,899
Housing Land Supply (Broad hectare stock) (Greater Brisbane as at 2006)
Separate houses (low density) 502,674
Semi-detached (low-medium density)
45,585
Low rise (medium density) 59,560
High rise (high density) 14,735
Other dwellings 5,661
TOTAL 628,216
Changes from 1996-2006 (%) (Greater Brisbane)
34.41
16.16
35.32
13.44
14.11
29.30
Projected Housing Needs 2016 (SEQ)
361,746
359,750
126,038
3,603
45,365
270,174
1,166,676
Demand increase (2006-2016)
96,552
58,300
14,274
-8,790
-923
60,364
229,490
Changes from 1996-2006 (%) (Greater Brisbane)
Number Percentage
45,942 9.14%
14,852 32.6%
1,295 1.02%
7,305 49.58%
-14,846 -72.39%
Projected Supply in 2016 (SEQ)
802,140
106,413
104,567
9,141
6,597
1,028,858
Supply increase (2006-2016)
299,466
60,827
45,007
-5,594
936
406,236
Greater Brisbane
Population & Space
Resolution

Resulting Excess/ Deficiencies Forecast
Household type In separate houses (low density) % Number
Couple only 24 23,172
Couple with children 70 40,810
One parent with children 45 6,423
Other family - -
Group household 80 -738
Lone person household - -TOTAL HOUSEHOLD DEMAND
70,945
TOTAL LAND SUPPLY 299,466DEFICIT/EXCESS +228,521

Resulting Excess/ Deficiencies Forecast
Household type In attached (Low-medium density) % Number
Couple only 24 23,172
Couple with children 30 17,490
One parent with children 35 4,996
Other family 34 -2,989
Group household 20 -185
Lone person household 35 21,127TOTAL HOUSEHOLD DEMAND
66,785
TOTAL LAND SUPPLY 60,827DEFICIT/EXCESS -5,958

Resulting Excess/ Deficiencies Forecast
Household type In low rise (medium density) % Number
Couple only 24 23,172
Couple with children - -
One parent with children 15 2,141
Other family 33 -2,901
Group household - -
Lone person household 20 12,073TOTAL HOUSEHOLD DEMAND
37,386
TOTAL LAND SUPPLY 45,007DEFICIT/EXCESS +7,621

Resulting Excess/ Deficiencies Forecast
Distribution High rise (high density) % Number
Couple only 24 23,172
Couple with children - -
One parent with children - -
Other family 33 -2,901
Group household - -
Lone person household 40 24,146TOTAL HOUSEHOLD DEMAND
47,318
TOTAL LAND SUPPLY -5,594DEFICIT/EXCESS -41,724

Resulting Excess/ Deficiencies ForecastHousehold type In other dwellings (mainly mobile
homes) % Number
Couple only 4 3,852
Couple with children - -
One parent with children 5 714
Other family - -
Group household - -
Lone person household 5 3,018TOTAL HOUSEHOLD DEMAND
7,594
TOTAL LAND SUPPLY 936DEFICIT/EXCESS -6,658
TOTAL OVERALL HOUSING LAND EXCESS = 181,802
Human Development & Services(Including social capital, characteristics, services & facilities)
1. Inventory of Community facilities and provisions for human development services
2. Needs analysis & projection for districts & suburbs: health; education; social, cultural and community services
3. Analysis and projection of dependency, independency and interdependency

Model of Land Use Generation (Highly generalised)
ElectorsPolitical Parties
Alternative Party Programs Elections
4th State Mass Media
Govt. Policies Local & Central
Households
Workers
Students
Movers
People at Play
Shoppers
Natural Resources
Capital
Education
Production
Recreation
Exchange
Consumption (the market)
Private Investment
National Revenue
Residence
Manufacture
Commerce
Recreation
Communications
Education
Homes
Lodginghouses
Factories
Farms
Offices
Shops
Theatres
Parks
Roads
Railways
Air & Sea Ports
Schools
House-holders
Workers
Shoppers
People at Play
Movers
Students
Electors
Residence

Land Uses, Settlement Form & Urban Design (Including central places)
1. District, Suburb & local character analysis (Lynch & Bentley et al)
2. Pattern of existing Major Land Uses
3. Current Policy inventory and Analysis
4. Central Place hierarchy
5. Grain, Character and Diversity
6. Comparative Settlement Form Analysis and Options Development

The Role of Activity Systems in Planning Analysis
1. Systems are universal- a way of looking at things that focuses on elements and relations, emphasising inputs, processes and outputs
2. Ideal for identifying and quantifying relationships with other systems e.g. links between population, housing & employment
3. A good diagram can help build bridges with colleagues & among different specialists

Evaluating the Ethics of SEQ Water Supply & Demand Policies Lacey & Heywood, 2010
ETHICAL PRINCIPLES INDICATORS SUPPLY OPTIONS DEMAND OPTIONS
Dam
Construction
PRW
Desalination
Dispersed W
ater Collection
Groundw
ater
Dom
estic Dem
and M
anagement
Industrial WEM
Ps
Power G
eneration
Wastage &
Leakage Control
EQUITABLE OUTCOMES Safe, clean & affordable water to meet basic life needs of all citizens
++ ? +/- +/- ? ++ + + +
Fair & equitable criteria for decisions over water distribution & access policies
- -- - ? ? + + + +
FAIR PROCESSES Open, timely & transparent control over decision processes
-- -- -- ? + + + ? N
Fair distribution of costs and benefits between different groups of users
-- - ? +/- - ++ + + +
OPTIMISED USER CAPABILITIES
Adequate access to water to meet demands for forecast consumer groups (i.e. residents, workers, tourists, recreation seekers etc.)
+ - + N N + N ++ +
Equal influence, involvement & status to participate in water decisions
-- - -- + - + N - N
EFFECTIVE COMMUNICATION & COMMUNITY ENGAGEMENT
Freely available & accessible information in understandable form
- ? - + ? ++ N N ?
Clear & effective links between communication & influence on outcomes (including conflict & negotiation)
-- +/- -- ++ ? ++ + + ?

Systems Analysis Attributes
1. Allows quantification of relationships and therefore assists prediction
2. Highlights causal links
3. Good for scoping impacts & testing policies

Conclusions
• Community Planning Methods should start from simple human concerns and objectives that everyone can understand & contribute to
• They should conclude in clear, costed and identifiable plans that can be committed to and implemented, phase by phase
• In between, the level of analysis may become quite sophisticated and expert, but must always be clearly explicable