Embed Size (px)
Citation preview

Session 501: Metrics Magic: Ask the Experts!
Rae Ann Bruno | John Custy | Jeff Rumburg

A Note About this Slide Deck
2
Please note that this is not a
standalone presentation. These
slides were compiled by the
panelists for illustrative purposes
only, and to assist in answering
questions from the audience.

3
Download Today’s Presentation and eBooks
MetricNet.com/HDI19

Your Speaker: Rae Ann Bruno
4
▪ Rae Ann Bruno is the president of Business Solutions
Training, Inc., where she consults and trains in various areas
of ITIL, KCS, communications, internal marketing, metrics,
and process improvement. Rae Ann holds several ITIL
certifications, is a faculty trainer for HDI, and is the author of
"Translating IT Metrics into Business Benefits" and "What
Have You Done for Me Lately? Creating an Internal
Marketing Culture." She is also a member of the HDI
International Certification Standards Committee, IT Industry
Legends, and HDI Hall of Fame.

John CustyJPC [email protected] Management Practitioner, Consultant and Educator▪ Ron Muns Lifetime Achievement Award
▪ IT Industry Legends
▪ HDI Hall of Fame
▪ ITIL Expert & ITIL Service Manager
▪ ITIL Intermediate – SS, SD, ST, SO, CSI, OSA, SOA, PPO, RCV
▪ DevOps Certified - Instructor
▪ KT Certified Instructor
▪ ITIL Accredited Trainer
▪ KCS Verified Consultant
▪ ISO/IEC 20000 Consultant
▪ ISFS, ISMAS based on ISO/IEC 27002
▪ HDI Faculty & Certified Instructor
25 Service Management Experts to Watch in 2016, 2017, 201820 Best Service Management People to Follow on TwitterTop 25 Thought Leaders in Technical Support and Service Management20 of the Best ITSM Thought Leaders of 2018
John Custy
ITSMNinja
johncusty
Your Speaker: John Custy
5

◼ Co Founder and Managing Partner, MetricNet, LLC
◼ Winner of the Ron Muns Lifetime Achievement Award
◼ Named one of HDI’s Top 25 Thought Leaders 2016, 2017 &
2018
◼ Former CEO, The Verity Group
◼ Former Vice President, Gartner
◼ Founder of the IT Service and Support Benchmarking
Consortium
◼ Author of A Hands-On Guide to Competitive Benchmarking
◼ Harvard MBA, Stanford MS
Your Speaker: Jeff Rumburg
6

• A type of metric that measures progress toward achieving one’s goals and objectives
• Leading or lagging
• Understand their interconnected cause-and-effect relationships
5-4
Key Performance Indicators (KPI)
7

Types of Metrics
Leading Indicators
✓ Activities
✓ “How are we likely to perform?”
✓ Predictive in nature
✓ I.e., AHT
Lagging Indicators
✓ Results
✓ “How did we perform?”
✓ Results or outcome of change
✓ Normally easy to identify and capture
✓ Goals and objectives should be
based on lagging indicators whenever
possible
✓ I.e., CSAT
8

Where Am I Going? What to Measure? The Cat only grinned when it saw Alice. It
looked good-natured, she thought; still it had
very long claws and a great many teeth, so
she felt that it ought to be treated with
respect.
“Cheshire Cat,” she began, rather timidly,
“Would you tell me, please, which way to go
from here?”
“That depends a good deal on where you
want to get to,” said the Cat.
“I don’t much care where,” said Alice.
9

Where Am I Going?
“Then it doesn’t matter which way you go,” said the Cat.
“So long as I get somewhere,” Alice added as an explanation.
“Oh, you’re sure to do that,” said the Cat. “If you only walk long enough.”
10

METRICS
PEOPLE
PROCESS
TECH
METRICS: An Even More Fundamental Building Block!
11

10%
20%
30%
40%
50%
60%
70%
80%
90%
100%
1 2 3 4 5
Metrics Maturity Ranking
Deskto
p S
up
po
rt B
ala
nced
Sco
re
n = 143
The Evidence for Metrics as a Foundation Block
12

5 %
10%
10 %
20%
80%
90%
30%
100%
Incre
as
ing
Valu
e!
60%
Have You Leveraged KPIs for World-Class Performance?
Do You Use Metrics Prescriptively?
Do You Use Metrics to Continuously Improve?
Do You Use Metrics Diagnostically?
Can you Define Your KPI’s?
Do You Use Metrics for Reporting?
Do You Understand KPI Cause-and-Effect?
Do You Have KPIs?
Do You Set Performance Targets with KPIs?
The Dilemma with Service Desk KPIs
13

❑ Cost per Inbound Contact
❑ Cost per Minute of Inbound Handle Time
❑ Net First Level Resolution Rate
Cost Productivity
Service Level
Quality
Technician
❑ Average Speed of Answer (ASA)
❑ % of Calls Answered in 30 Seconds
❑ Call Abandonment Rate
❑ Inbound Contacts per Technician per
Month
❑ Outbound Contacts per Technician per
Month
❑ Technician Utilization
❑ Technicians as a % of Total Headcount
❑ Call Quality
❑ Net First Contact Resolution Rate
❑ Customer Satisfaction ❑ Annual Technician Turnover
❑ Daily Technician Absenteeism
❑ Technician Occupancy
❑ Schedule Adherence
❑ New Technician Training Hours
❑ Annual Technician Training Hours
❑ Technician Tenure (months)
❑ Technician Job Satisfaction
Contact Handling
❑ Inbound Contact Handle Time (minutes)
❑ Outbound Contact Handle Time (minutes)
❑ Inbound Contacts as a % of Total
Contacts
❑ User Self-Service Completion Rate
And there are
hundreds more!!
Some Common Service Desk Metrics
14

◼ Cost per TicketCost
Productivity
Quality
Call Handling
◼ Agent Utilization
◼ Customer Satisfaction
◼ First Contact Resolution Rate
Agent ◼ Agent Job Satisfaction
Aggregate ◼ Balanced Scorecard
TCO ◼ First Level Resolution Rate
The 80/20 Rule for Service Desk KPI’s
15

5 – Optimized Maturity
4
3
2
1
Pro
cess Matu
rity
Characteristics of an Optimized Service Desk
16
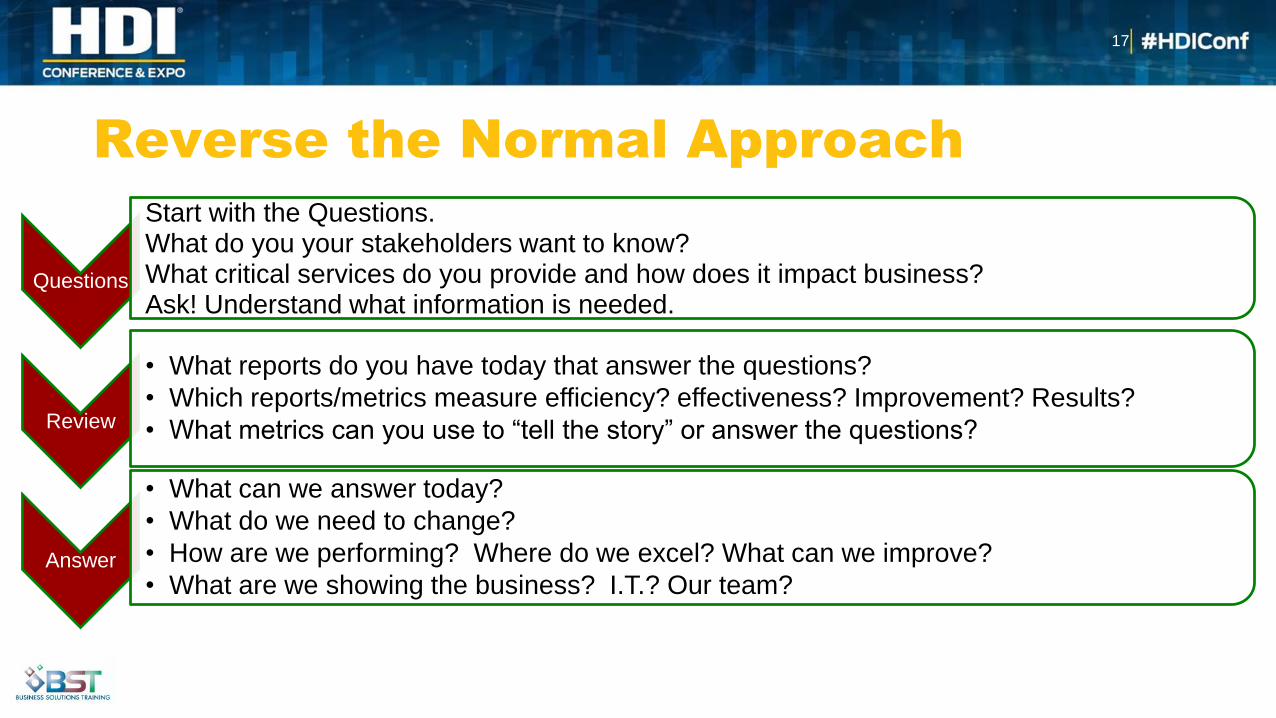
Reverse the Normal Approach
Questions
Start with the Questions. What do you your stakeholders want to know?What critical services do you provide and how does it impact business?Ask! Understand what information is needed.
Review
• What reports do you have today that answer the questions?
• Which reports/metrics measure efficiency? effectiveness? Improvement? Results?
• What metrics can you use to “tell the story” or answer the questions?
Answer
• What can we answer today?
• What do we need to change?
• How are we performing? Where do we excel? What can we improve?
• What are we showing the business? I.T.? Our team?
17

Efficiency Quality Value
• Network speed
• First contact resolution (FCR)
• IT hours spent on projects
• Time to resolution
• Accuracy
• On time, on budget
• Transactions per second
• Defect removal
• Correct routing
• Automation
• Appropriate prioritization
• Maximum duration of outage
• Number of Core system
outages
• Reliability
• Mean time to repair
• Baseline
• System Performance
Monitoring
• Incident Monitoring
• Knowledge Monitoring
• Quality Index
• Core System Availability
• Coaching
• Alignment with goals
• Proper sense of urgency
• Customer Service Skills
• SLA/OLA compliance
• Service Review meetings and
improvement plans
• Customer Satisfaction
• Saved time
• Productivity
• Business impact
• Correlation to business
needs
• WIIFM (What’s in it for me?)
• Accuracy
• Trending
• Top types
• Priority
• Cost
• Per contact
• To business
18

Customer Orientation Scorecard Metrics
Objective Measures
Customer Satisfaction Business Unit survey ratingsService quality and responsivenessContribution to business objectives
Development services performed
Major project success scoresGoal attainmentSponsor satisfaction
Operational services performed
Service level complianceMean time to restore service during major incidents
Source: Taylor & Francis Group
19

Operational Excellence Scorecard Metrics
Objective Measures
Operational process performance
ProductivityResponsivenessChange management effectivenessIncident occurrence levels
Process maturity Assessed level of maturity Delivery and supportMonitoring
Architecture Management State of the infrastructure assessmentProduct acquisition compliance with technology standardsIncreased reliability as result of architecture changes
Source: Taylor & Francis Group
20

CRM Scorecard Metrics
Source: Taylor & Francis Group
Objective Measures
Customer Retention percentWin-back percentCustomer acquisitionsCustomer satisfaction
Process Conversion rate per sales channelCost of sales per sales channelService level per channelCost per service encounter
Staff Employee satisfactionEmployee retention
21

Customer Satisfaction Business Value
• Overall satisfaction of IT Services• Projects delivered within budget• Projects delivered on time or sooner• Results achieved from new or changed
service
• Active projects linked to business initiatives• Cost or time savings realized• Active projects with approved
funding/business cases• Projects delivering expected business
results/benefits
Operational Excellence Innovation/Future Growth
• Mean time to restore services• Success of user training• % of Security incidents• Incidents related to releases• Reliability of services• Security incidents prevented• Service quality and responsiveness
• New technology capabilities introduced• Automation of routine requests/business
processes• Increased number of new ideas• Revenue or results from new products or
services
22

Share Your Thoughts & Shape the Future!
Evals4Education: For every completed evaluation, HDI will donate $1 to the Tangelo Park Elementary School through AdoptaClassroom.org!
23


![INDEX []...INDEX Page 501-E01 CYLINDER, HEAD AND COVER 3 501-E02 PISTON/CRANKSHAFT 5 501-E03 INTAKE/ESHAUST 7 501-E04 WATER PUMP 11 501-E05 OIL PUMP 13 501-E06 OIL SYSTEM 15 501-E07](https://img.dokumen.tips/doc/110x75/5e9579482775034fef0cc642/index-index-page-501-e01-cylinder-head-and-cover-3-501-e02-pistoncrankshaft.jpg)