Embed Size (px)
Citation preview

Soil Aquifer Treatment (SAT)
S.Sharma/IHE_2011 1
Soil Aquifer Treatment (SAT) for Wastewater Treatment and ReuseWastewater Treatment and Reuse
Saroj SharmaEmail: [email protected]
December 2011Delft, The Netherlands
Contents
• Introduction• Factors affecting performance of SAT• Removal of different contaminants during SAT
2

Soil Aquifer Treatment (SAT)
S.Sharma/IHE_2011 2
Natural Systems for Treatment Water Treatment Wastewater Treatment
and ReuseTerrestrial System(Soil/Aquifer-based)
1. Bank Filtration2 Artificial Recharge
1. Slow Rate Irrigation2 Overland Flow(Soil/Aquifer-based)
Managed Aquifer Recharge (MAR)
2. Artificial Recharge3. Sub-surface GW Treatment
2. Overland Flow3. Soil Aquifer Treatment
Aquatic System
Vegetation-based(macrophytes)
1. Constructed Wetlands2. Water Hyacinths
Pond-based(Storage Reservoirs)
1. Anaerobic2 Facultative (Algal ponds)(Storage Reservoirs) 2. Facultative (Algal ponds)3. Aerobic4. Maturation
- Hybrids : Different combinations of natural systems and conventional systems- Commercial systems: “Living Machines”, “Eco Restorers”
- From decentralised (household level) to centralised (city level) systems
Soil Aquifer Treatment (SAT)
• Infiltration of wastewater effluent through the vadose (unsaturated) zone to recharge the underlying aquifer(unsaturated) zone to recharge the underlying aquifer
• Vadose and saturated zone treatment
• Long-term storage of renovated water: aquifer storage and recovery
4
• Natural and sustainable treatment- Removal of organics (DOC & trace organics) - Removal of microorganisms (bacteria, viruses, protozoa) - Removal of nitrogen (Ammonia + Nitrate)
Soil Aquifer Treatment (SAT)
S.Sharma/IHE_2011 3
SAT: Infiltration to Recovery (Mekorot, 2004)
Why SAT is important ?• Alleviate water shortages; wastewater effluent as a
(potable) water resource
• Augment existing sources; replenish diminishing GW
• Eliminate additional treatment;an alternative to advanced/tertiary treatment:- Reclaimed/recycled (waste)water - Storm water
S f t
6
- Surface water
• Salt water intrusion barrier
• Potential worldwide application, depending on geology, soils, hydrology, etc.

Soil Aquifer Treatment (SAT)
S.Sharma/IHE_2011 4
Soil Aquifer Treatment (SAT)
Reclaimed Wastewater
7
PROCESS/PROCESS/PARAMETERPARAMETER
INFILTRATIONINFILTRATIONINTERFACEINTERFACE
SOILSOIL--PERCOLATIONPERCOLATION
GROUNDWATERGROUNDWATERTRANSPORTTRANSPORT
Treatment Filtration Biodegradation Biodegradation
Comparison of Typical SAT Zones
Treatment Mechanisms
Filtration , Biodegradation
Biodegradation , Adsorption
Biodegradation, Adsorption, Dilution
Transport Saturated Unsaturated Saturated
Residence Time Minutes Hours to Days Months to Years
Travel Distance Centimeters 3 – 30 m Variable
Mixing No No Yes (regional G.W.)
Oxygen (O ) Recharge Water Unsaturated Zone Regional G W
8
Oxygen (O2) Supply
Recharge Water Unsaturated Zone Regional G.W.
Biodegradable Org. Carbon Availability
Excess Excess/Limiting Limiting
Redox Conditions Aerobic Aerobic to Anoxic Anoxic to Aerobic?
Soil Aquifer Treatment (SAT)
S.Sharma/IHE_2011 5
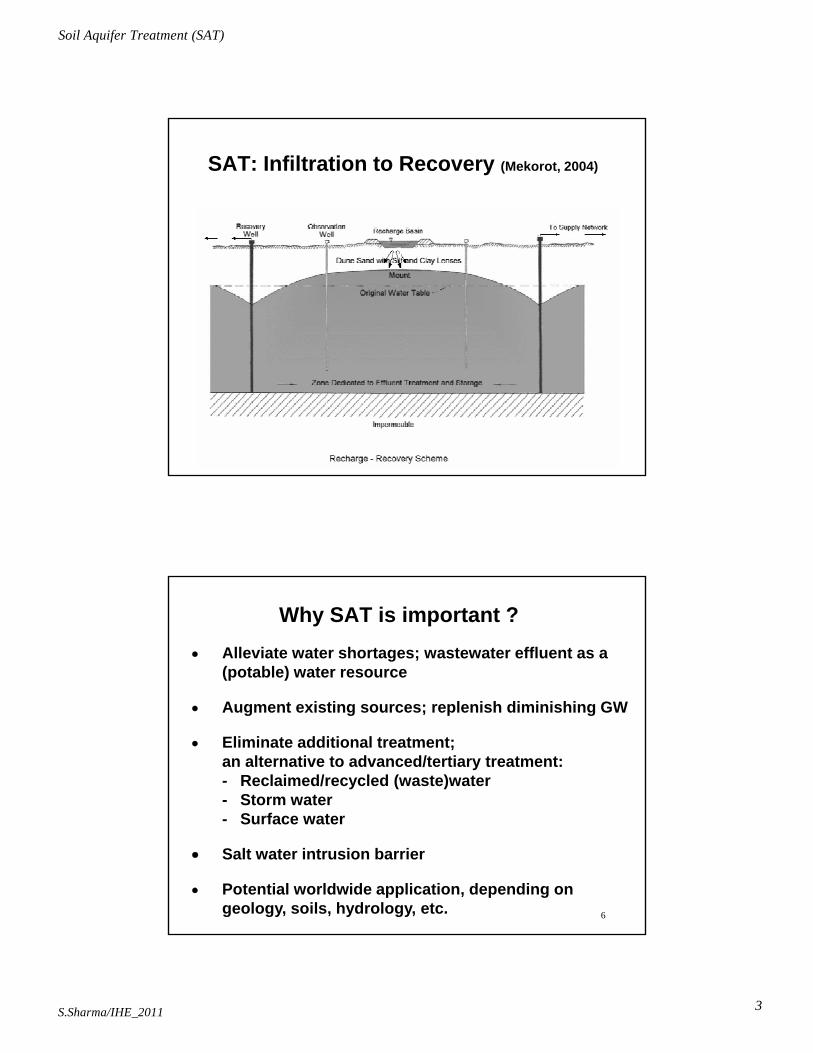
Three Engineered Methods of Groundwater Recharge
9SAT Source: USEPA (2004)
Factors affecting performance of SAT system • Site Specific Conditions
• Source water quality• Geology and Soils• Geology and Soils• Geohydrology
Alluvial, Unconfined AquiferIf confined, injection well
Unsaturated Zone Depth (depth to water table)Aquifer Depth (depth from water table to bedrock)Permeability (Conductivity)
10
• Travel DistanceWell Placement, spacing between the wells
• Travel TimeWell Placement and Operation (Pumping Rate)Permeability (Conductivity)

Soil Aquifer Treatment (SAT)
S.Sharma/IHE_2011 6
Soil Aquifer Treatment for Water ReclamationProcess conditions
- redox, soil type- aquifer type
-HLR time distance
Wastewater treatment plant effluent
Post-treatment
Pre-treatment
Soil Aquifer Treatment
1. Primary2 Secondary
1. None2 Membrane Filtration
1. UF (viruses)2 NF (trace organics)
-HLR, time, distance
11
2. Secondary3. Tertiary
2. Membrane Filtration3. O3 , Advanced oxidation4. Combinations
of 2 and 3
2. NF (trace organics)3. Post disinfection
(chlorination)
(Depends on intended use of reclaimed water)
Applicability of SAT
Eliminate additional treatment; an alternative to advanced/tertiary wastewater treatment:
Reclaimed/recycled (waste)water Indirect potable and non-potable reuse
Storm water Surface water
Potential worldwide application, depending on geology, soils, hydrology, etc.
12
g gy, , y gy,(presently in USA, Israel, Australia, Europe)

Soil Aquifer Treatment (SAT)
S.Sharma/IHE_2011 7
SAT in Indirect Potable Reuse
Water Reclamation
Wastewater
Surface spreadingor deep injection
Reservoir
13
Water TreatmentConsumer
SAT
Preferences for Natural Systems Barrier (Environmental Returns)
14

Soil Aquifer Treatment (SAT)
S.Sharma/IHE_2011 8
General schemes of wastewater generation, treatment, reuse and infiltration to aquifers
(A) commonly-occurring unplanned and uncontrolled situation
15
General schemes of wastewater generation, treatment, reuse and infiltration to aquifers
(B) economical interventions aimed at reducing groundwater source pollution risk
16

Soil Aquifer Treatment (SAT)
S.Sharma/IHE_2011 9
• Groundwater recharge of effluent achieves additional water quality benefits because of SAT.
S l d l t t b hi d ith t
Advantages of Indirect Potable Reuse based on aquifer recharge
• Seasonal and longer term storage can be achieved without evaporative losses.
• Groundwater recharge protects water against recontamination by birds and mammals and possibly even by human
• Groundwater recharge keeps sunlight away from water, thereby preventing growth of algae and associated water quality problems; to avoid algal growth in a surface reservoir the
17
problems; to avoid algal growth in a surface reservoir, the wastewater must be treated to remove nitrogen or phosphorus.
• Reclaimed water recovered from wells is conceived as groundwater, an aesthetically superior and more publicly acceptable source.
SAT Treatment ObjectivesBulk Organic Matter
Natural Organic Matter (NOM)Effl t O i M tt (EfOM)Effluent Organic Matter (EfOM)
Nitrogen SpeciesAmmonia (NH3)Nitrate (NO3
-)Microbes
Viruses an Controlling (most mobile) Organism
18
Viruses an Controlling (most mobile) OrganismEffluent-Derived Organic Micropollutants
Pharmaceutically Active Compounds (PhACs)Endocrine Disrupting Compounds (EDCs)

Soil Aquifer Treatment (SAT)
S.Sharma/IHE_2011 10
Water Quality at Phoenix (Arizona), SAT System
19
• Suspended solids and particulate organic matter are removed by filtration at or near the soil surface (in first few meters) during SAT.
Removal of Suspended Solids and Bulk Organic Matter
• DOC may be adsorbed by the soil or may be removed from the percolating wastewater by soil biota.
• Suspended solids and bulk organic matter removals are generally not affected by the level of preapplication t t t
20
treatment.
• High hydraulic loadings of wastewaters with highconcentrations of DOC and suspended solids can cause clogging of the soil.

Soil Aquifer Treatment (SAT)
S.Sharma/IHE_2011 11
DOC and UVA profile along the depth of the soil column at different hydraulic loading rates with settled primary effluent,
under aerobic conditions
00.25 0.50 0.75 1.00
UVA at 254 nm (absorbance/cm)
010 15 20 25 30 35 40
DOC (mg/L)
1
2
3
4Soil
colu
mn
dept
h (m
)1
2
3
4Soil
colu
mn
dept
h (m
)
21
5
HLR = 1.25 m/day HLR = 2.5 m/day
5
HLR = 1.25 m/day HLR = 2.5 m/day
From 35 mg/L,DOC reduced to 15.2 mg/L at HLR = 1.25 m/day, and to 18.4 mg/L at HLR = 2.5 m/day (removal 57% to 49%)
00 5 10 15 20
DOC (mg/L)
00.25 0.50 0.75 1.00
UVA at 254 nm (absorbance/cm)
DOC and UVA profile along the depth of the soil column at different hydraulic loading rates with secondary effluent,
under aerobic conditions
1
2
3
4oil c
olum
n de
pth
(m) 1
2
3
4
oil c
olum
n de
pth
(m)
22
4
5
S
HLR = 1.25 m/day HLR = 2.5 m/day
4
5
S
HLR = 1.25 m/day HLR = 2.5 m/day
DOC removal 30% at HLR = 1.25 m/day and 15% and HLR = 2.5 m/day
Soil Aquifer Treatment (SAT)
S.Sharma/IHE_2011 12
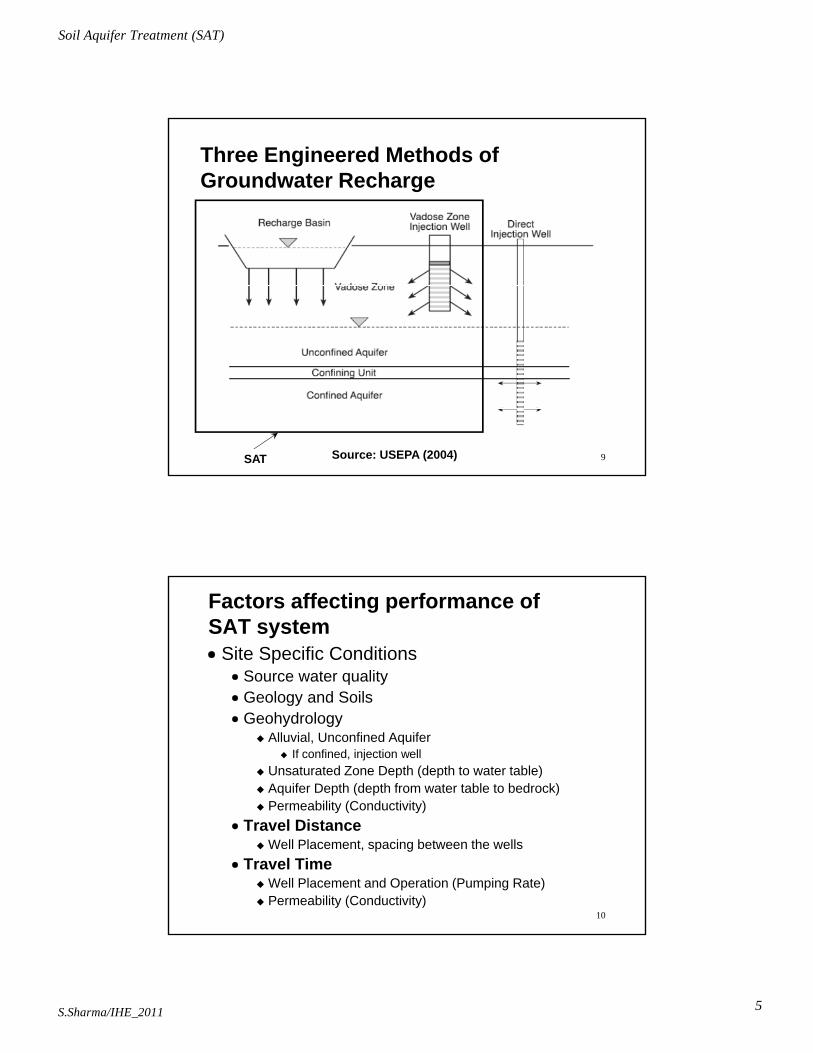
Summary of DOC removal data for SAT with different influents
Type of SAT i fl t
Influent ( /L)
Effluent ( /L)
Removal ffi iinfluent (mg/L) (mg/L) efficiency
(%)
Primary effluent 9-35 7-21 12-62
Secondary effluent
2-24 1.5-16 10-94
23
Tertiary effluent 5-20 2-14 19-80
Source: Sharma et al. (2008)
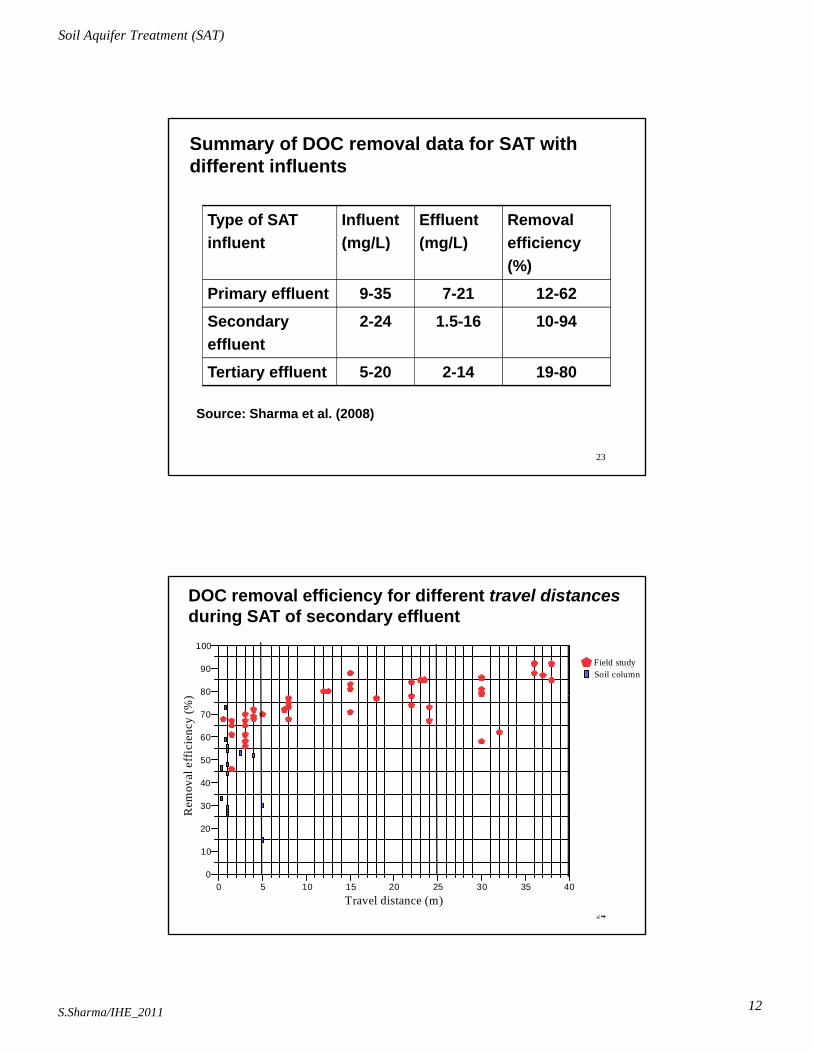
DOC removal efficiency for different travel distancesduring SAT of secondary effluent
80
90
100
Field studySoil column
30
40
50
60
70
Rem
oval
eff
icie
ncy
(%)
24
0 5 10 15 20 25 30 35 40Travel distance (m)
0
10
20
R

Soil Aquifer Treatment (SAT)
S.Sharma/IHE_2011 13
DOC removal efficiency for different travel timesduring SAT of secondary effluent
90
100
Batch reactorsField study
40
50
60
70
80
mov
al e
ffic
ienc
y (%
)
ySoil column
250 10 20 30 40 50 60 70 80
Residence time (days)
0
10
20
30
Rem
BOD Removal for Soil Aquifer Treatment Systems
26
Source: Crites and Tchobanoglous (1998)

Soil Aquifer Treatment (SAT)
S.Sharma/IHE_2011 14
Travel Redox Removal Standard
DOC removal from SAT systems treating secondary effluents under different redox conditions
distance (m)
conditions efficiency (%) deviation (%)Range Average
Vadose zone
1-2 Oxic 46-68 59 102-10 Oxic/anoxic* 56-70 63 6
10-20 Oxic/anoxic* 72-73 73 120 40 O i / i * 77 88 77 12
27
20-40 Oxic/anoxic* 77-88 77 12Saturated
zone>40 Oxic/anoxic* 77-94 83 8
* Dependent on availability of adequate electron acceptor (NO3-)
Soil type Influent quality (mg/L)
Travel distance
(m)
Travel time
(days)
SAT Removal efficiency
(%)Sandy loam 14 0.82 7 soil column 59-73
Influence of soil type and travel distance/time on DOC removal from secondary effluent during SAT
Sandy loam 14 0.82 7 soil column 59 7311 1 1 soil column 5415 2.5 3 soil column 53
Poorly graded sand
4-12 1 1-2 soil column 26-48
Silty sand 12 1 3 soil column 44Silica sand 4-8 0.3 1 soil column 33-46
28
Silica sand 4 8 0.3 1 soil column 33 468 1.0 1 soil column 29
11-14 5 2-4 soil column 15-30Poorly graded silty sand
13 1.0-2.0 2-4 Field SAT 56

Soil Aquifer Treatment (SAT)
S.Sharma/IHE_2011 15
• Both nitrification and denitrification are accomplished by soil bacteria. Temperature, pH, soil type and redox conditions affect N removal.
Nitrogen removal during SAT
• The optimum temperature for nitrogen removal is 30°C to 35°C. Both processes proceed slowly between 2°C and 5°C and stop near 0°C.
• Nitrification rates decline sharply in acidic soil diti d h li iti l t i t l
29
conditions and reach a limiting value at approximately pH 4.5. The denitrification reaction rate is reduced substantially by pH values below 5.5.
• Alternating aerobic and anaerobic conditions must be provided for significant nitrogen removal.
• Nitrogen removal is also a function of detention time,C : N ratio (adequate organic carbon source), andanoxic conditions.
Nitrogen removal during SAT
• Nitrogen removal by denitrification requires both adequate organic carbon, which acts as a “food” source for microorganisms, and adequate detention time.
I t f BOD N ti ti f 3 1 i
30
• In terms of BOD:N ratio, a ratio of 3:1 or more is recommended to ensure adequate carbon to drive the denitrification reaction.
• Alternating aerobic and anaerobic conditions must be provided for significant nitrogen removal.

Soil Aquifer Treatment (SAT)
S.Sharma/IHE_2011 16
NO3--N profile along the soil column at different HLR when operated with settled primary
effluent under aerobic conditions
2 6 10 14 18
NO3--N (mg/L)
0.0
1.0
2.0
3.0
of s
oil c
olum
n (m
)
Nitrification and denitrification
can be achieved during SAT
31
4.0
5.0
Dep
th o
HLR = 1.25 m/day HLR = 2.5 m/day
NO3--N profiles along the soil column at different HLR
when operated with settled primary effluent under aerobic conditions
0.02 6 10 14 18
NO3--N (mg/L)
0 5 2 5 4 5 6 5 8 5
O2 (mg/L)
1.0
2.0
3.0
4.0
Dep
th o
f soi
l col
umn
(m) 0.0
1.0
2.0
3.0
4.0
0.5 2.5 4.5 6.5 8.5
Col
umn
dept
h (m
)
t = 2 dayst = 4 dayst = 18 dayst = 30 days
5.0
HLR = 1.25 m/day HLR = 2.5 m/day5.0
32

Soil Aquifer Treatment (SAT)
S.Sharma/IHE_2011 17
Fate of Nitrogen During Wet and Dry Cycle
33
Summary of nitrogen removal at selected SAT sites
34

Soil Aquifer Treatment (SAT)
S.Sharma/IHE_2011 18
Nitrogen Removal for Soil Aquifer Treatment Systems
35
Source: (USEPA, 2006)
• Phosphorus removal in SAT is accomplished byadsorption and chemical precipitation.
Phosphorus removal during SAT
• The adsorption occurs quickly and the slower occurring chemical precipitation replenishes the adsorption capacity of the soil.
• Phosphorus removal is highly dependent on soil type and travel time available before abstraction of
l i d t
36
reclaimed water.

Soil Aquifer Treatment (SAT)
S.Sharma/IHE_2011 19
Phosphorus Removal for Soil Aquifer Treatment Systems
37
Source: (USEPA, 2006)
• Removal of organic micrpollutants (OMPs) is one of the main concerns in groundwater recharge with treated wastewater and use of reclaimed water.
Removal of Organic Micropollutants
• It is reported that majority of OMPs (including PhACs, EDCs and pesticides) are removed in SAT system if proper travel time and redox conditions are present.
• OMPs can be removed in SAT by sorption and degradation (chemical or biological); OMPs removal i SAT i i il th lt f bi l i l ti it
38
in SAT is primarily the result of biological activity.
• Removal rates depend on the constituent, the appliedconcentration, the loading rate, and the presence ofeasily degradable organics to serve as a primarysubstrate, redox conditions and temperature.

Soil Aquifer Treatment (SAT)
S.Sharma/IHE_2011 20
Removal efficiency of selected PhACs from secondary effluents in soil columns (HLR = 1.25 m/day, Depth of column = 2.5 m)
39
Better removal of ROX, CLA, ERY, TMP (>30%); higher removal under oxic conditions Btri, SMX, SMZ more persistent (< 10%) removalSMX and SMZ are removed better under anoxic than under oxic conditions
TMPSMXSMZERY-H2OROX
25°C 15°C 5°C
CLA
Effect of temperature on removal of PhACs during soil passage
60
80
1002
mov
al [%
]
0
20
40
TMPERY-H2O SMZ SMXCLA
rem
ROX 40

Soil Aquifer Treatment (SAT)
S.Sharma/IHE_2011 21
8794
90100
Removal of OMPS in Secondary Effluent during Soil Passage (depth of Soil column = 5 m, HLR = 1.25 m/day)
22
0
71
58
48
36
8075 74
87
0
74 73
0102030405060708090
Aver
age
rem
oval
(%)
41
0
ND
MA
1,4-
Dio
xane
Bez
afib
rate
Caf
fein
e
Car
bam
azep
ine
Clo
fibric
aci
d
Dic
lofe
nac
Feno
prof
en
Gem
fibro
zil
Ibup
rofe
n
Ket
opro
fen
Nap
roxe
n
Acet
amin
ophe
n
Pent
oxify
lline
Phen
acet
ine
A
Source: Caballero (2010)
100
SE+SAT SE+NF SE+SAT+NF
Removal of OMPs in Secondary Effluent in Different Treatment System (depth of Soil column = 5 m, HLR = 1.25 m/day, Membrane used = NF-90)
0
20
40
60
80
100
l c e n n n d e e n e n eage
rem
oval
(%)
42
Gem
fibro
zil
Dic
lofe
nac
Bez
afib
rate
Ibup
rofe
n
Feno
prof
en
Nap
roxe
n
Clo
fibric
aci
d
Caf
fein
e
Car
bam
azep
ine
Acet
amin
ophe
n
Pent
oxify
lline
Ket
opro
fen
Phen
acet
ine
Aver
a
Source: Caballero (2010)

Soil Aquifer Treatment (SAT)
S.Sharma/IHE_2011 22
Microbes removal during SAT of secondary effluents
6.00
7.00
Coliform bacteriaColiphageMS2 Virus
3.00
4.00
5.00
Log
rem
oval
Polio virus type 1PRDI virusSalmonella spp
43
0.00 1.00 2.00 3.00 4.00 5.00 6.00
Travel distance (m)
0.00
1.00
2.00
44

Soil Aquifer Treatment (SAT)
S.Sharma/IHE_2011 23
• Crites, R.W. , Middlebrooks, E. J. and Reed, S.C.(2006) Natural Wastewater Treatment Systems. CRC Publications.
• NCSWS (2001) An Investigation of Soil Aquifer Treatment for Sustainable Water Reuse. Research Project Summary, National Centre
Bibliography
for Sustainable Water Supply, USA.
• NAP (1994) Groundwater Recharge Water of Impaired Quality. National Academy Press. Washington, D.C., USA.
• NAP (2007) Prospects of Managed Underground Storage of Recoverable Water. National Academy Press. Washington, D.C., USA.
• Sharma, S.K., Harun, C.M. and Amy, G. (2008) Framework for assessment of performance of soil aquifer treatment systems Water
45
assessment of performance of soil aquifer treatment systems. Water Science and Technology, 57 (6), 941-946.
• USEPA (2006) Process Design Manual: Land Treatment of Wastewater Effluents. EPA/625/R-06/16. US Environmental Protection Agency, Washington, DC.
• USEPA (2004) Guidelines for Water Reuse. EPA/625/R-04/108. US Environmental Protection Agency, Washington, DC.