Embed Size (px)
Citation preview

Session 2a:
2017 Annual Update of
ACI Competitiveness Ranking and Simulation Studies:
33 Provinces and Six Regions of Indonesia
1
2017 Asia Economic Forum on
“The One-Belt One-Road Initiative: Impact and Implications”
Seminar 1: Competitiveness, Trade, Liveability and Productivity in ASEAN Economies
Jointly Organised by
The World Bank Group
&
Asia Competitiveness Institute (ACI) at Lee Kuan Yew School of Public Policy (LKYSPP),
National University of Singapore (NUS)
28th August 2017
Presenters:
Dr. Mulya AMRI
Research Fellow & Deputy Director (Research), ACI-LKYSPP-NUS
Nursyahida Binte AHMAD
Research Assistant, ACI-LKYSPP-NUS
Diamanta Vania LAVI
Research Assistant, ACI-LKYSPP-NUS
Associate Professor Tan Khee Giap
Co-Director, ACI-LKYSPP, NUS
In 2016 and 2017, ACI was ranked 13th globally, 2nd in Asia and 1st in Singapore amongst 90 think tanks worldwide under the “Best University Affiliated Think Tank” category
by the Think Tanks and Civil Societies Program at the University of Pennsylvania, USA.

Presentation Outline
1. Motivation and Objectives
2. Research Framework and Methodology
3. Empirical Findings
4. Conclusion and Policy Implications
2

1. MOTIVATION & OBJECTIVES
3

ACI’s Research on Indonesia
4

5
Motivation:
Indonesia’s Economic Potential (1/3)
Source: World Bank, World Development Indicators Source: World Bank, World Development Indicators
As the largest economy in Southeast Asia, Indonesia contributes 41% of the region’s population and 36% of
its GDP. The global commodity price bust affected Indonesia, leading to a steady decline in GDP growth from
6.2% (2011) to 4.8% (2015). Solid macroeconomic foundation is helping Indonesia bring growth back up to
5.0% (2016), but the country is still behind its neighbours in terms of exporting and attracting investments.
Indonesia41%
Philippines16%
Vietnam15%
Thailand11%
Myanmar8% Malaysia
5%
Cambodia2%
Lao PDR1%
Singapore1%
Brunei Darussalam…
Other4%
Population (2016)
Indonesia36%
Thailand16%
Philippines12%
Singapore12% Malaysia
11%
Vietnam8%
Myanmar3%
Cambodia1%
Lao PDR1%
Brunei Darussalam…
Other5%
GDP (2016)Current US$

6
Motivation:
Indonesia’s Economic Potential (2/3)
ACI’s Annual Competitiveness Analysis of ASEAN-10 countries found that Indonesia’s Overall
Competitiveness vis-à-vis its neighbours increased between 2005 and 2010, but has deteriorated
until 2013. However, Indonesia’s competitiveness increased again in 2014, mostly due to stabilising
conditions and declining performance of Thailand.
Source: Asia Competitiveness Institute
Note: Value in the parenthesis denotes the 2017competitiveness ranking amongst ASEAN-10.
-2.00
-1.50
-1.00
-0.50
0.00
0.50
1.00
1.50
2.00
2.50
2000 2001 2002 2003 2004 2005 2006 2007 2008 2009 2010 2011 2012 2013 2014
Ove
rall
Com
peti
tive
ness
Sco
re
Singapore
Indonesia (5th)
Brunei (3rd)
Thailand (4th)
Malaysia (2nd)
Philippines (6th)
Vietnam (7th)
Cambodia (8th)Laos (9th)
Myanmar (10th)

7
Motivation:
Indonesia’s Economic Potential (3/3)
Other international analyses also highlighted a rise followed by decline in Indonesia’s recent
competitiveness level. But again recently, Indonesia showed signs of improving competitiveness.
Source: IMDSource: WEF
Singapore, 3
Malaysia, 24Thailand, 27
4239
37
42
48
Indonesia, 42
Philippines, 41
0
10
20
30
40
50
2012 2013 2014 2015 2016 2017
IMD World Competitiveness Ranking (selected ASEAN countries)
Singapore, 2
Malaysia, 25
Thailand, 34
50
3834
37Indonesia, 41
Philippines, 57
Vietnam, 60
0
10
20
30
40
50
60
70
80
2012-13 2013-14 2014-15 2015-16 2016-17
WEF Global Competitiveness Index (selected ASEAN countries)

Research Objectives:
8
To track the competitiveness landscape across Indonesia’s provinces
and regions.
Identify strengths and weaknesses and suggest development
strategies based on simulation studies and empirical results.
Highlight challenges faced by each province/region that require
unique solution.
To spur intellectual debates among key stakeholders to lift
Indonesia’s competitiveness as a whole.
To further attract collaboration with strategic partners and
strengthen efforts to raise competitiveness in Indonesia through
more outward-oriented policies (trade, FDI for technology transfer,
etc).

2. RESEARCH FRAMEWORK &
METHODOLOGY
9

10
Source: Asia Competitiveness Institute
Overall Competitiveness
• 4 Environments
• 12 Sub-environments
• 100 Indicators
• Aggregation uses equal weightage
𝑺𝒕𝒂𝒏𝒅𝒂𝒓𝒅𝒊𝒔𝒆𝒅 𝒗𝒂𝒍𝒖𝒆 =𝑶𝒓𝒊𝒈𝒊𝒏𝒂𝒍 𝑽𝒂𝒍𝒖𝒆 − 𝑴𝒆𝒂𝒏
𝑺𝒕𝒂𝒏𝒅𝒂𝒓𝒅 𝑫𝒆𝒗𝒊𝒂𝒕𝒊𝒐𝒏
ACI adopts a comprehensive approach to
competitiveness, taking into account different factors
that collectively shape the ability of an economy to
achieve substantial and inclusive economic
development over a sustained period of time.
Calculation of Standardised Score
0 (zero) = same as national average
- (negative) = below national average
+ (positive) = above national average
The further away from zero, the further from national average
ACI’s Competitiveness Framework

11
Secondary Data (76%) in 2014:
Central Statistical Bureau (BPS)
World Bank Indonesia Database for
Policy and Economic Research
(INDO-DAPOER)
Bank Indonesia
Ministry of Health
Etc.
Secondary
Data
(76 indicators)
Primary Data
(24 indicators)
Primary Data (24%) in 2016: ACI’s perception survey in 33
provinces (in collaboration with
Indonesian Employers’ Association
(APINDO), provincial government
agencies, and local universities).
Sampling methodology: Purposive
Sampling.
Measurement: Likert Scale of 1 – 9,
where 9 is the most favourable
response and 1 is the least.
The surveys were conducted using
an electronic response system,
where questions were presented on
a computer projector and participants
entered their answers using keypads
or “clickers”.
Respondents Number
APINDO members 803
Provincial academics 775
Provincial government 757
Total 2335
Average per province 71
Data Sources
Source: Asia Competitiveness Institute

1. Sort the indicators for each economy
No Indicator Score
1 Indicator A Highest for
economy
2 Indicator B
3 Indicator C
4 Indicator D
5 Indicator E
…
96 Indicator V
97 Indicator W
98 Indicator X
99 Indicator Y
100 Indicator Z Lowest for
economy
2. Identify
top 20%
weakest
indicators
3. Raise their
values to
average if
lower than
average
4. Recalculate
ranking with
scores for other
economies
remaining constant
Higher score
Lower score
13
What-if Competitiveness Simulation
Identifies the potential for each economy to
improve their competitiveness ranking.
Helps each economy to identify priority
areas for intervention, as well as hints for
further research required.
Improvement in competitiveness scores
matter more than rankings; even if rankings
remain unchanged, scores do improve.

• Shapley value is widely applied in cooperative game theory, which measures
the marginal contribution of an agent. In our context, the agent could be
indicators, sub-environments and environments.
• The formula for Shapley value is:
• With different marginal contribution to the overall competitiveness ranking,
different weights should be assigned to indicators, sub-environments and
environments.
• We would like to propose an objective weighting method based on Shapley
value – the “Bottom-Up” Approach.
Shapley Value Ranking Algorithm
13
Ф 𝒗 = 𝑺⊆𝑵\{𝒊
𝑺 ! 𝑵 − 𝑺 − 𝟏 !
𝑵!𝒗 𝑺 ∪ 𝒊 − 𝒗 𝑺
Robustness Check of ACI Competitiveness Scores by Shapley Weightage
(1/3)

Shapley Value Theoretical Foundation
14
• Formally, let 𝑣𝐼 be the characteristic function of the indicators, where 𝑣𝐼: 2𝐼 → ℝ. Then
for each indicator 𝑖 ∈ 𝐼, 𝑣𝐼(𝑖) ∶ ℝ𝐸 → ℝ , which reflects that the value of indicator 𝑖 is
derived from 𝑋𝑒𝑖 for all 𝑒 ∈ 𝐸. As we involve large number of indicators in our case
studies, for the ease of numerical computation, we simply define that
𝑣𝐼(𝑖) = 𝑒=1𝐸 |𝑆𝑉𝑒𝑖| .
• We further assume the Additivity of the characteristic function 𝑣𝐼, i.e.
𝑣𝐼(𝑖 ∪ 𝑗) = 𝑣𝐼 (𝑖) + 𝑣𝐼(𝑗) for any indicator 𝑖 , 𝑗 ∈ 𝐼.
• With all these defined, we are able to proceed with the computation of the Shapley
value Ф𝑖𝐼 of indicator 𝑖 ∈ 𝐼.
Ф𝑖𝐼 = 𝕀⊆𝐼\{𝑖
𝕀 ! 𝐼− 𝕀 −1 !
𝐼!(𝑣𝐼 𝕀 ∪ 𝑖 − 𝑣𝐼(𝕀)) for all 𝑖 ∈ 𝐼
=
𝕀⊆𝐼\{𝑖
𝕀 ! 𝐼 − 𝕀 − 1 !
𝐼!(𝑣𝐼 𝕀 ∪ 𝑖 − 𝑣𝐼(𝕀)) =
𝕀⊆𝐼\{𝑖
𝕀 ! 𝐼 − 𝕀 − 1 !
𝐼!𝑣𝐼 𝑖 = 𝑣𝐼 𝑖
• Then the indicator weight 𝑤𝑖𝐼 based on Shapley value is simply
𝑤𝑖𝐼 =
Ф𝑖𝐼
𝑗=1𝐼 Ф𝑗
𝐼 =𝑣𝐼(𝑖)
𝑗=1𝐼 𝑣𝐼(𝑗)
.
Robustness Check of ACI Competitiveness Scores by Shapley Weightage
(2/3)

The weights of Sub-environments are computed in “bottom-up” manner according to both
standardised scores and Shapley Weights of indicators under that particular sub-
environment.
Shapley Value Simplified: “Bottom-Up” Approach
15
1We start from the lowest level of analysis (indicators) and identify the inequality of the
units being measured (economies and sub-national economies). This is called the “Shapley
Value”, which is computed from the standardised score of each indicator.
Subsequently, the Shapley Value is used to calculate Shapley Weight, where more
weights are assigned to those indicators with higher Shapley value.
Finally, the weights of Environments and Overall Index are computed in a similar
way.
2
3
4
Robustness Check of ACI Competitiveness Scores by Shapley Weightage
(3/3)

3. EMPIRICAL FINDINGS
16

Indonesia Provincial Competitiveness Ranking & Score
Overall Competitiveness
17Data for Year 2017 is based on 2014 secondary data from official sources and 2016 primary data based on ACI’s perception surveys in 33 provinces.
Source: Asia Competitiveness Institute
Rank Province
Score
2014 2015 2016 2017 2017
1 1 1 1 DKI Jakarta 3.459
2 2 2 2 East Java 1.723
3 3 5 3East Kalimantan (inc.
North Kalimantan)1.303
4 5 3 4 Central Java 1.035
5 4 4 5 West Java 0.946
12 9 11 6 Banten 0.741
14 12 7 7 Bali 0.687
7 10 6 8 South Sulawesi 0.557
6 6 10 9 DI Yogyakarta 0.423
11 7 12 10 Riau Islands 0.399
8 8 8 11 South Kalimantan 0.318
21 20 14 12 Central Sulawesi 0.270
15 13 13 13 Central Kalimantan 0.090
24 25 18 14 Lampung 0.061
17 22 23 15 West Sumatra -0.018
9 16 15 16 Riau -0.093
10 11 9 17 North Sulawesi -0.270
Rank Province
Score
2014 2015 2016 2017 2017
14 27 28 18 Jambi -0.296
28 27 21 19 Gorontalo -0.298
19 15 24 20 North Sumatra -0.304
18 19 17 21 West Kalimantan -0.308
20 30 20 22 Bangka Belitung Islands -0.403
29 21 16 23 Southeast Sulawesi -0.412
16 17 22 24 South Sumatra -0.460
13 24 26 25 Aceh -0.526
22 26 19 26 West Nusa Tenggara -0.582
30 23 25 27 Bengkulu -0.595
25 18 30 28 West Sulawesi -0.597
23 29 29 29 Maluku -0.712
32 32 32 30 East Nusa Tenggara -1.238
33 31 31 31 North Maluku -1.304
31 33 33 32 Papua -1.706
26 28 27 33 West Papua -1.891

Top-3 and Bottom-3 Provinces Geographical Spread
Overall Competitiveness
Data for Year 2017 is based on 2014 secondary data from official sources and 2016 primary data based on ACI’s perception surveys in 33 provinces.
Source: Asia Competitiveness Institute
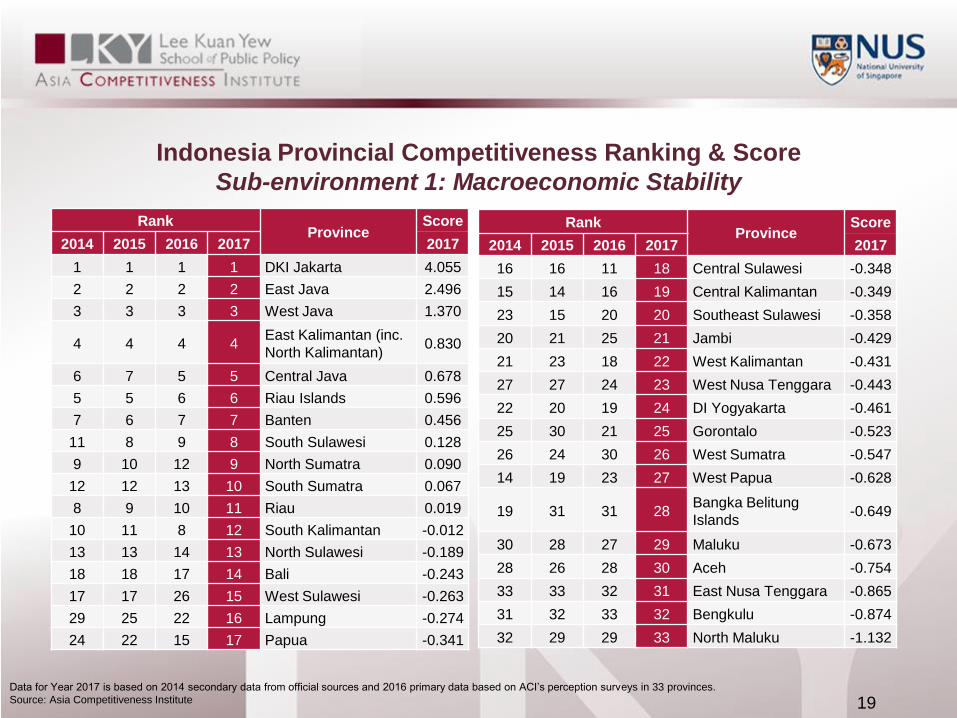
Indonesia Provincial Competitiveness Ranking & Score
Sub-environment 1: Macroeconomic Stability
19
Rank Province
Score
2014 2015 2016 2017 2017
1 1 1 1 DKI Jakarta 4.055
2 2 2 2 East Java 2.496
3 3 3 3 West Java 1.370
4 4 4 4East Kalimantan (inc.
North Kalimantan)0.830
6 7 5 5 Central Java 0.678
5 5 6 6 Riau Islands 0.596
7 6 7 7 Banten 0.456
11 8 9 8 South Sulawesi 0.128
9 10 12 9 North Sumatra 0.090
12 12 13 10 South Sumatra 0.067
8 9 10 11 Riau 0.019
10 11 8 12 South Kalimantan -0.012
13 13 14 13 North Sulawesi -0.189
18 18 17 14 Bali -0.243
17 17 26 15 West Sulawesi -0.263
29 25 22 16 Lampung -0.274
24 22 15 17 Papua -0.341
Rank Province
Score
2014 2015 2016 2017 2017
16 16 11 18 Central Sulawesi -0.348
15 14 16 19 Central Kalimantan -0.349
23 15 20 20 Southeast Sulawesi -0.358
20 21 25 21 Jambi -0.429
21 23 18 22 West Kalimantan -0.431
27 27 24 23 West Nusa Tenggara -0.443
22 20 19 24 DI Yogyakarta -0.461
25 30 21 25 Gorontalo -0.523
26 24 30 26 West Sumatra -0.547
14 19 23 27 West Papua -0.628
19 31 31 28Bangka Belitung
Islands-0.649
30 28 27 29 Maluku -0.673
28 26 28 30 Aceh -0.754
33 33 32 31 East Nusa Tenggara -0.865
31 32 33 32 Bengkulu -0.874
32 29 29 33 North Maluku -1.132
Data for Year 2017 is based on 2014 secondary data from official sources and 2016 primary data based on ACI’s perception surveys in 33 provinces.
Source: Asia Competitiveness Institute

Top-3 and Bottom-3 Provinces Geographical Spread
Macroeconomic Stability
Data for Year 2017 is based on 2014 secondary data from official sources and 2016 primary data based on ACI’s perception surveys in 33 provinces.
Source: Asia Competitiveness Institute

Indonesia Provincial Competitiveness Ranking & Score
Sub-environment 2: Government and Institutional Setting
21
Rank Province
Score
20172014 2015 2016 2017
1 1 1 1 DKI Jakarta 2.680
12 15 9 2 Central Sulawesi 1.395
3 13 2 3 South Sulawesi 1.066
24 19 8 4 Bali 0.885
4 2 18 5
East Kalimantan
(inc. North
Kalimantan)
0.844
23 16 15 6 Banten 0.745
6 12 6 7 West Java 0.730
2 4 3 8 Central Java 0.700
10 9 21 9 West Sulawesi 0.649
21 28 19 10 Lampung 0.606
5 5 5 11 East Java 0.506
8 6 4 12 North Sulawesi 0.431
18 22 11 13 Gorontalo 0.404
11 7 7 14 South Kalimantan 0.298
7 3 10 15 DI Yogyakarta 0.246
13 14 12 16 West Kalimantan 0.178
19 8 16 17 Central Kalimantan 0.164
Rank Province
Score
20172014 2015 2016 2017
25 24 26 18 West Sumatra 0.129
22 10 17 19 Southeast Sulawesi -0.062
26 11 24 20 Jambi -0.153
20 26 14 21 Maluku -0.167
14 30 22 22 Riau -0.174
16 32 20 23Bangka Belitung
Islands-0.426
9 29 23 24 Aceh -0.541
30 23 25 25 Bengkulu -0.672
15 20 13 26West Nusa
Tenggara-0.676
17 17 27 27 South Sumatra -0.849
32 21 29 28 East Nusa Tenggara -0.941
28 25 28 29 Papua -0.956
27 27 33 30 North Sumatra -1.019
33 33 31 31 North Maluku -1.510
31 18 32 32 Riau Islands -1.722
29 31 30 33 West Papua -2.788
Data for Year 2017 is based on 2014 secondary data from official sources and 2016 primary data based on ACI’s perception surveys in 33 provinces.
Source: Asia Competitiveness Institute

Top-3 and Bottom-3 Provinces Geographical Spread
Government and Institutional Setting
Data for Year 2017 is based on 2014 secondary data from official sources and 2016 primary data based on ACI’s perception surveys in 33 provinces.
Source: Asia Competitiveness Institute

Indonesia Provincial Competitiveness Ranking & Score
Sub-environment 3: Financial, Businesses, and Manpower Conditions
23
Rank Province
Score
20172014 2015 2016 2017
1 1 1 1 DKI Jakarta 3.375
3 2 2 2 East Java 1.998
2 3 3 3 Central Java 1.665
6 6 9 4 Riau Islands 1.463
5 5 4 5 West Java 0.887
17 8 7 6 Bali 0.635
4 4 5 7East Kalimantan (inc.
North Kalimantan)0.575
9 11 12 8 Central Kalimantan 0.560
8 12 11 9 West Kalimantan 0.332
13 9 14 10 DI Yogyakarta 0.270
26 21 16 11 Lampung 0.100
22 17 18 12 Banten 0.057
10 14 8 13 South Sulawesi 0.014
14 28 13 14Bangka Belitung
Islands-0.032
21 13 15 15 North Sumatra -0.039
19 24 21 16 West Sumatra -0.068
27 22 25 17 Central Sulawesi -0.091
Rank Province
Score
20172014 2015 2016 2017
28 20 27 18 Jambi -0.161
15 15 10 19 South Kalimantan -0.310
18 25 17 20 South Sumatra -0.315
24 19 22 21 Bengkulu -0.346
7 10 23 22 Riau -0.364
29 31 31 23 East Nusa Tenggara -0.522
32 30 19 24 Southeast Sulawesi -0.706
20 32 24 25 West Nusa Tenggara -0.720
25 26 30 26 Aceh -0.731
33 27 26 27 Gorontalo -0.755
31 23 33 28 North Maluku -0.807
23 23 32 29 Maluku -1.083
16 18 20 30 North Sulawesi -1.134
30 16 29 31 West Sulawesi -1.209
11 29 28 32 Papua -1.241
12 7 6 33 West Papua -1.295
Data for Year 2017 is based on 2014 secondary data from official sources and 2016 primary data based on ACI’s perception surveys in 33 provinces.
Source: Asia Competitiveness Institute

Top-3 and Bottom-3 Provinces Geographical Spread
Financial, Businesses and Manpower Conditions
Data for Year 2017 is based on 2014 secondary data from official sources and 2016 primary data based on ACI’s perception surveys in 33 provinces.
Source: Asia Competitiveness Institute

Indonesia Provincial Competitiveness Ranking & Score
Sub-environment 4: Quality of Life and Infrastructure Development
25
Rank Province
Score
20172014 2015 2016 2017
2 1 1 1East Kalimantan (inc.
North Kalimantan)2.068
1 2 4 2 DI Yogyakarta 1.347
3 3 3 3 DKI Jakarta 1.347
7 6 10 4 Banten 1.197
6 8 6 5 South Kalimantan 1.076
8 7 5 6 Bali 0.999
4 5 8 7 Riau Islands 0.986
4 5 2 8 East Java 0.706
9 11 7 9 South Sulawesi 0.637
11 12 13 10 West Sumatra 0.427
13 14 9 11 Central Java 0.383
10 15 15 12 Aceh 0.284
16 16 16 13 Riau 0.213
15 9 12 14 West Java 0.146
12 13 11 15 North Sulawesi -0.001
14 10 20 16 North Sumatra -0.040
20 21 18 17 Central Sulawesi -0.061
Rank Province
Score
20172014 2015 2016 2017
17 18 14 18 Central Kalimantan -0.076
21 19 21 19 Bengkulu -0.079
26 22 19 20 West Nusa Tenggara -0.089
27 26 26 21 Gorontalo -0.111
22 24 23 22 Lampung -0.228
25 25 22 23Bangka Belitung
Islands-0.229
19 17 25 24 Jambi -0.239
24 23 17 25 Southeast Sulawesi -0.240
18 20 24 26 South Sumatra -0.427
23 27 29 27 Maluku -0.435
31 28 28 28 North Maluku -0.870
30 29 27 29 West Kalimantan -1.100
29 30 30 30 West Sulawesi -1.155
28 32 32 31 West Papua -1.550
32 31 31 32 East Nusa Tenggara -1.773
33 33 33 33 Papua -3.111
Data for Year 2017 is based on 2014 secondary data from official sources and 2016 primary data based on ACI’s perception surveys in 33 provinces.
Source: Asia Competitiveness Institute

Top-3 and Bottom-3 Provinces Geographical Spread
Quality of Life and Infrastructure Development
Data for Year 2017 is based on 2014 secondary data from official sources and 2016 primary data based on ACI’s perception surveys in 33 provinces.
Source: Asia Competitiveness Institute

-4-3-2-1012345
Regional Economic VibrancyOpenness to Trade and
Services
Attractiveness to ForeignInvestors
Government Policies andFiscal Sustainability
Institutions, Governance andLeadership
Competition, RegulatoryStandards and Rule of Law
Financial Deepening andBusiness Efficiency
Labour Market Flexibility
Productivity Performance
Physical Infrastructure
Technological Infrastructure
Standard of Living, Educationand Social Stability
Max DKI Jakarta West Papua
27
Findings: Median and Maximum Competitiveness Web AnalysisDKI Jakarta (#1) and West Papua (#33), 2017
Median Competitiveness Web Maximum Competitiveness Web
Max: East Java
Max: Banten
Max: DI Yogyakarta
Max: East Java Max: Central Sulawesi
Max: Central Sulawesi
Max: DKI Jakarta
Max: DKI Jakarta
Max: DKI Jakarta
Max: DKI Jakarta
Max: DKI Jakarta
Max: DKI Jakarta
-4-3-2-1012345
Regional Economic VibrancyOpenness to Trade and
Services
Attractiveness to ForeignInvestors
Government Policies andFiscal Sustainability
Institutions, Governance andLeadership
Competition, RegulatoryStandards and Rule of Law
Financial Deepening andBusiness Efficiency
Labour Market Flexibility
Productivity Performance
Physical Infrastructure
Technological Infrastructure
Standard of Living, Educationand Social Stability
Median DKI Jakarta West Papua

28
What-If Competitiveness Simulation Result, 2017
Overall Competitiveness
The data is from 2014 secondary data from official sources and 2016 primary data based on ACI’s perception survey.
Source: Asia Competitiveness Institute
EconomyRank Score
Before After Before After
Aceh 25 16 -0.526 -0.051
Bali 7 5 0.687 0.969
Bangka Belitung
Islands22 13 -0.403 0.117
Banten 6 4 0.741 1.115
Bengkulu 27 17 -0.595 -0.159
Central Java 4 3 1.035 1.409
Central Kalimantan 13 11 0.090 0.347
Central Sulawesi 12 8 0.270 0.569
DI Yogyakarta 9 6 0.423 0.769
DKI Jakarta 1 1 3.459 3.900
East Java 2 2 1.723 2.099
East Kalimantan (inc.
North Kalimantan)3 3 1.303 1.640
East Nusa Tenggara 30 26 -1.238 -0.586
Gorontalo 19 14 -0.298 0.077
Jambi 18 15 -0.296 -0.018
Lampung 14 9 0.061 0.457
Maluku 29 17 -0.712 -0.235
EconomyRank Score
Before After Before After
North Maluku 31 25 -1.304 -0.492
North Sulawesi 17 13 -0.270 0.210
North Sumatra 20 13 -0.304 0.260
Papua 32 28 -1.706 -0.725
Riau 16 11 -0.093 0.368
Riau Islands 10 4 0.399 1.042
South Kalimantan 11 9 0.318 0.532
South Sulawesi 8 6 0.557 0.786
South Sumatra 24 16 -0.460 -0.082
Southeast Sulawesi 23 15 -0.412 0.027
West Java 5 3 0.946 1.440
West Kalimantan 21 15 -0.308 0.019
West Nusa Tenggara 26 17 -0.582 -0.193
West Papua 33 25 -1.891 -0.592
West Sulawesi 28 16 -0.597 -0.104
West Sumatra 15 12 -0.018 0.281

29
Robustness Check Result: Comparison of Weights
for Each Competitiveness Environment, 2017
Shapley Weight MethodologyEqual Weight Methodology

Robustness Check of ACI Provincial Competitiveness Index: Comparing
Results based on Equal Weight and Shapley Weight Methods
• Overall Competitiveness, 2017
30*Red and bold font show instances where a province’s rank changes by two or more positions, between equal weight method and Shapley weight method
Province
Rank Std. Score
Equal
Weight
Shapley
Weight
Equal
Weight
Shapley
Weight
Jambi 18 19 -0.296 -0.274
Gorontalo 19 17 -0.298 -0.217
North Sumatra 20 21 -0.304 -0.378
West Kalimantan 21 18 -0.308 -0.255
Bangka Belitung
Islands22 22 -0.403 -0.392
Southeast Sulawesi 23 23 -0.412 -0.397
South Sumatra 24 24 -0.460 -0.468
Aceh 25 26 -0.526 -0.562
West Nusa Tenggara 26 25 -0.582 -0.540
Bengkulu 27 28 -0.595 -0.587
West Sulawesi 28 27 -0.597 -0.563
Maluku 29 29 -0.712 -0.733
East Nusa Tenggara 30 30 -1.238 -1.255
North Maluku 31 31 -1.304 -1.387
Papua 32 32 -1.706 -1.753
West Papua 33 33 -1.891 -2.090
Province
Rank Std. Score
Equal
Weight
Shapley
Weight
Equal
Weight
Shapley
Weight
DKI Jakarta 1 1 3.459 3.253
East Java 2 2 1.723 1.667
East Kalimantan (inc.
North Kalimantan)3 3 1.303 1.268
Central Java 4 4 1.035 1.123
West Java 5 5 0.946 0.893
Banten 6 7 0.741 0.704
Bali 7 6 0.687 0.788
South Sulawesi 8 8 0.557 0.664
DI Yogyakarta 9 9 0.423 0.521
Riau Islands 10 12 0.399 0.331
South Kalimantan 11 11 0.318 0.335
Central Sulawesi 12 10 0.270 0.407
Central Kalimantan 13 13 0.090 0.181
Lampung 14 14 0.061 0.145
West Sumatra 15 15 -0.018 -0.002
Riau 16 16 -0.093 -0.152
North Sulawesi 17 20 -0.270 -0.275

31
0
5
10
15
20
25
30
35
DK
I Jak
arta
East
Jav
a
East
Kal
iman
tan
(in
c. N
ort
h…
Cen
tral
Jav
a
Wes
t Ja
va
Ban
ten
Bal
i
Sou
th S
ula
wes
i
DI Y
ogy
akar
ta
Ria
u Is
lan
ds
Sou
th K
alim
anta
n
Cen
tral
Su
law
esi
Cen
tral
Kal
iman
tan
Lam
pu
ng
Wes
t Su
mat
ra
Ria
u
No
rth
Su
law
esi
Jam
bi
Go
ron
talo
No
rth
Su
mat
ra
Wes
t K
alim
anta
n
Ban
gka
Be
litu
ng
Isla
nd
s
Sou
thea
st S
ula
we
si
Sou
th S
um
atra
Ace
h
Wes
t N
usa
Ten
ggar
a
Ben
gku
lu
Wes
t Su
law
esi
Mal
uku
East
Nu
sa T
engg
ara
No
rth
Mal
uku
Pap
ua
Wes
t P
apu
a
Comparison of Provincial Overall Competitiveness Ranking
Rank Based on Equal Weight Rank Based on Shapley Weight
• Overall Competitiveness, 2017
Robustness Check of ACI Provincial Competitiveness Index: Comparing
Results based on Equal Weight and Shapley Weight Methods

• Macroeconomic Stability, 2017
32*Red and bold font show instances where a province’s rank changes by two or more positions, between equal weight method and Shapley weight method
Province
Rank Std. Score
Equal
Weight
Shapley
Weight
Equal
Weight
Shapley
Weight
DKI Jakarta 1 1 4.055 3.875
East Java 2 2 2.496 2.577
West Java 3 3 1.370 1.450
East Kalimantan 4 4 0.830 0.870
Central Java 5 5 0.678 0.721
Riau Islands 6 6 0.596 0.506
Banten 7 7 0.456 0.459
South Sulawesi 8 8 0.128 0.229
North Sumatra 9 10 0.090 0.063
South Sumatra 10 9 0.067 0.152
Riau 11 11 0.019 0.014
South Kalimantan 12 12 -0.012 -0.001
North Sulawesi 13 13 -0.189 -0.118
Bali 14 15 -0.243 -0.213
West Sulawesi 15 14 -0.263 -0.180
Lampung 16 16 -0.274 -0.252
Papua 17 19 -0.341 -0.340
Province
Rank Std. Score
Equal
Weight
Shapley
Weight
Equal
Weight
Shapley
Weight
Central Sulawesi 18 17 -0.348 -0.313
Central Kalimantan 19 20 -0.349 -0.344
Southeast Sulawesi 20 18 -0.358 -0.318
Jambi 21 22 -0.429 -0.425
West Kalimantan 22 24 -0.431 -0.449
West Nusa Tenggara 23 21 -0.443 -0.401
DI Yogyakarta 24 23 -0.461 -0.428
Gorontalo 25 25 -0.523 -0.496
West Sumatra 26 26 -0.547 -0.588
West Papua 27 27 -0.628 -0.680
Bangka Belitung Islands 28 29 -0.649 -0.708
Maluku 29 28 -0.673 -0.701
Aceh 30 30 -0.754 -0.805
East Nusa Tenggara 31 31 -0.865 -0.922
Bengkulu 32 32 -0.874 -0.948
North Maluku 33 33 -1.132 -1.287
Robustness Check of ACI Provincial Competitiveness Index: Comparing
Results based on Equal Weight and Shapley Weight Methods

33*Red and bold font show instances where a province’s rank changes by two or more positions, between equal weight method and Shapley weight method
• Government and Institutional Setting, 2017
Province
Rank Std. Score
Equal
Weight
Shapley
Weight
Equal
Weight
Shapley
Weight
DKI Jakarta 1 1 2.680 2.371
Central Sulawesi 2 2 1.395 1.495
South Sulawesi 3 3 1.066 1.141
Bali 4 4 0.885 0.945
East Kalimantan (inc.
North Kalimantan)5 5 0.844 0.864
Banten 6 6 0.745 0.770
West Java 7 10 0.730 0.637
Central Java 8 8 0.700 0.693
West Sulawesi 9 7 0.649 0.717
Lampung 10 9 0.606 0.662
East Java 11 13 0.506 0.429
North Sulawesi 12 11 0.431 0.473
Gorontalo 13 12 0.404 0.453
South Kalimantan 14 14 0.298 0.339
DI Yogyakarta 15 15 0.246 0.293
West Kalimantan 16 16 0.178 0.215
Central Kalimantan 17 17 0.164 0.210
Province
Rank Std. Score
Equal
Weight
Shapley
Weight
Equal
Weight
Shapley
Weight
West Sumatra 18 18 0.129 0.156
Southeast Sulawesi 19 19 -0.062 -0.034
Jambi 20 20 -0.153 -0.136
Maluku 21 21 -0.167 -0.151
Riau 22 22 -0.174 -0.246
Bangka Belitung Islands 23 23 -0.426 -0.394
Aceh 24 24 -0.541 -0.554
Bengkulu 25 25 -0.672 -0.661
West Nusa Tenggara 26 26 -0.676 -0.668
South Sumatra 27 27 -0.849 -0.882
East Nusa Tenggara 28 28 -0.941 -0.937
Papua 29 29 -0.956 -0.997
North Sumatra 30 30 -1.019 -1.054
North Maluku 31 31 -1.510 -1.532
Riau Islands 32 32 -1.722 -1.747
West Papua 33 33 -2.788 -2.870
Robustness Check of ACI Provincial Competitiveness Index: Comparing
Results based on Equal Weight and Shapley Weight Methods

34*Red and bold font show instances where a province’s rank changes by two or more positions, between equal weight method and Shapley weight method
• Financial, Businesses and Manpower Conditions, 2017
ProvinceRank Std. Score
Equal
Weight
Shapley
Weight
Equal
Weight
Shapley
Weight
DKI Jakarta 1 1 3.375 3.087
East Java 2 2 1.998 1.962
Central Java 3 3 1.665 1.727
Riau Islands 4 4 1.463 1.507
West Java 5 7 0.887 0.720
Bali 6 5 0.635 0.818
East Kalimantan (inc.
North Kalimantan)7 8 0.575 0.500
Central Kalimantan 8 6 0.560 0.721
West Kalimantan 9 9 0.332 0.454
DI Yogyakarta 10 10 0.270 0.449
Lampung 11 11 0.100 0.223
Banten 12 13 0.057 0.029
South Sulawesi 13 12 0.014 0.053
Bangka Belitung Islands 14 16 -0.032 -0.054
North Sumatra 15 17 -0.039 -0.108
West Sumatra 16 15 -0.068 -0.021
Central Sulawesi 17 14 -0.091 -0.002
Province
Rank Std. Score
Equal
Weight
Shapley
Weight
Equal
Weight
Shapley
Weight
Jambi 18 18 -0.161 -0.115
South Kalimantan 19 20 -0.310 -0.270
South Sumatra 20 21 -0.315 -0.305
Bengkulu 21 19 -0.346 -0.254
Riau 22 22 -0.364 -0.417
East Nusa Tenggara 23 23 -0.522 -0.457
Southeast Sulawesi 24 26 -0.706 -0.739
West Nusa Tenggara 25 24 -0.720 -0.694
Aceh 26 27 -0.731 -0.785
Gorontalo 27 25 -0.755 -0.703
North Maluku 28 28 -0.807 -0.841
Maluku 29 29 -1.083 -1.154
North Sulawesi 30 30 -1.134 -1.245
West Sulawesi 31 31 -1.209 -1.269
Papua 32 32 -1.241 -1.339
West Papua 33 33 -1.295 -1.476
Robustness Check of ACI Provincial Competitiveness Index: Comparing
Results based on Equal Weight and Shapley Weight Methods

35*Red and bold font show instances where a province’s rank changes by two or more positions, between equal weight method and Shapley weight method
• Quality of Life and Infrastructure Development, 2017
Province
Rank Std. Score
Equal
Weight
Shapley
Weight
Equal
Weight
Shapley
Weight
East Kalimantan (inc.
North Kalimantan)1 1 2.068 1.964
DI Yogyakarta 2 3 1.347 1.350
DKI Jakarta 3 2 1.347 1.474
Banten 4 4 1.197 1.054
South Kalimantan 5 5 1.076 1.031
Bali 6 7 0.999 0.945
Riau Islands 7 6 0.986 0.977
East Java 8 9 0.706 0.670
South Sulawesi 9 8 0.637 0.705
West Sumatra 10 11 0.427 0.388
Central Java 11 10 0.383 0.528
Aceh 12 12 0.284 0.291
Riau 13 14 0.213 0.182
West Java 14 13 0.146 0.195
North Sulawesi 15 17 -0.001 -0.030
North Sumatra 16 20 -0.040 -0.059
Central Sulawesi 17 15 -0.061 0.020
Province
Rank Std. Score
Equal
Weight
Shapley
Weight
Equal
Weight
Shapley
Weight
Central Kalimantan 18 19 -0.076 -0.057
Bengkulu 19 21 -0.079 -0.096
West Nusa Tenggara 20 16 -0.089 0.019
Gorontalo 21 18 -0.111 -0.030
Lampung 22 24 -0.228 -0.237
Bangka Belitung Islands 23 22 -0.229 -0.165
Jambi 24 25 -0.239 -0.253
Southeast Sulawesi 25 23 -0.240 -0.225
South Sumatra 26 26 -0.427 -0.425
Maluku 27 27 -0.435 -0.433
North Maluku 28 28 -0.870 -0.891
West Kalimantan 29 29 -1.100 -1.141
West Sulawesi 30 30 -1.155 -1.176
West Papua 31 31 -1.550 -1.679
East Nusa Tenggara 32 32 -1.773 -1.837
Papua 33 33 -3.111 -3.056
Robustness Check of ACI Provincial Competitiveness Index: Comparing
Results based on Equal Weight and Shapley Weight Methods

Indonesia Regional Competitiveness Analysis:
Overall Competitiveness, 2017Provinces in the Six Regions:
Sumatra Region
Aceh, North Sumatra, West Sumatra, Riau,
Riau Islands,
Jambi, Bengkulu, South Sumatra, Lampung
and Bangka Belitung Islands
Java Region
Banten, DKI Jakarta, West Java, Central
Java, DI Yogyakarta, and East Java
Kalimantan Region
West Kalimantan, Central Kalimantan, South
Kalimantan, and East Kalimantan
Sulawesi Region
North Sulawesi, Central Sulawesi, Gorontalo,
West Sulawesi, Southeast Sulawesi, and
South Sulawesi
Bali-Nusa Tenggara Region
Bali, West Nusa Tenggara, and East Nusa
Tenggara
Maluku-Papua Region
Maluku, North Maluku, Papua, and West
Papua
The six Indonesian regions are derived from the regional grouping of six
“Economic Corridors” according to Master Plan for Acceleration and Expansion of
Indonesia’s Economic Development 2011-2025 (MP3EI)
36The data is from 2014 secondary data from official sources and 2016 primary data based on ACI’s perception survey.
Source: Asia Competitiveness Institute

Indonesia Regional Competitiveness Ranking & Score:Overall Competitiveness
37The data is from 2014 secondary data from official sources and 2016 primary data based on ACI’s perception survey.
Source: Asia Competitiveness Institute
Rank Region
Score Top province in
region
Bottom province
in region2014 2015 2016 2017 2017
1 1 1 1 Java 1.629DKI Jakarta DI Yogyakarta
(1) (9)
2 2 2 2 Kalimantan 0.534East Kalimantan (inc.
North KalimantanWest Kalimantan
(3) (21)
3 3 3 3 Sulawesi 0.189South Sulawesi West Sulawesi
(8) (28)
4 4 4 4 Sumatra -0.114Riau Islands Bengkulu
(10) (27)
5 5 5 5Bali and Nusa
Tenggara-0.615
BaliEast Nusa
Tenggara
(7) (30)
6 6 6 6 Maluku and Papua -1.623Maluku West Papua
(29) (33)

38The data is from 2014 secondary data from official sources and 2016 primary data based on ACI’s perception survey.
Source: Asia Competitiveness Institute
RankRegion
2017
Score2014 2015 2016 2017
1 1 1 1 Java 2.084
2 2 3 2↑ Sumatra 0.117
3 3 2 3↓ Kalimantan -0.155
4 4 4 4 Sulawesi -0.300
6 6 6 5↑ Bali - Nusa Tenggara -0.830
5 5 5 6↓ Maluku - Papua -0.916
Indonesia Regional Competitiveness Ranking & Score
Sub-environment 1: Macroeconomic Stability
-1.5
-1
-0.5
0
0.5
1
1.5
2
2.5
Java Sumatra Kalimantan Sulawesi Bali andNusa
Tenggara
Malukuand Papua
Regional Economic Vibrancy
Openness to Trade and Services
Attractiveness to Foreign Investors

39The data is from 2014 secondary data from official sources and 2016 primary data based on ACI’s perception survey.
Source: Asia Competitiveness Institute
RankRegion
2017
Score2014 2015 2016 2017
1 1 1 1 Java 1.149
2 3 2 2 Sulawesi 1.128
3 2 3 3 Kalimantan 0.511
5 4 4 4 Bali - Nusa Tenggara -0.447
4 5 6 5↑ Sumatra -0.847
6 6 5 6↓ Maluku - Papua -1.493
Indonesia Regional Competitiveness Ranking & Score
Sub-environment 2: Government and Institutional Setting
-1.5
-1
-0.5
0
0.5
1
1.5
2
2.5
Java Sulawesi Kalimantan Bali andNusa
Tenggara
Sumatra Malukuand Papua
Government Policies and Fiscal Sustainability
Institutions, Governance and Leadership
Competition, Regulatory Standards and Rule of Law

40The data is from 2014 secondary data from official sources and 2016 primary data based on ACI’s perception survey.
Source: Asia Competitiveness Institute
RankRegion
2017
Score2014 2015 2016 2017
1 1 1 1 Java 1.693
2 2 2 2 Kalimantan 0.761
4 3 3 3 Sumatra 0.036
5 4 4 4 Sulawesi -0.480
6 5 5 5 Bali - Nusa Tenggara -0.615
3 6 6 6 Maluku - Papua -1.395
Indonesia Regional Competitiveness Ranking & Score
Sub-environment 3: Financial, Businesses, and Manpower Conditions
-2.5
-2
-1.5
-1
-0.5
0
0.5
1
1.5
2
2.5
Java Kalimantan Sumatra Sulawesi Bali andNusa
Tenggara
Malukuand Papua
Financial Deepening and Business Efficiency
Labour Market Flexibility
Productivity Performance

41The data is from 2014 secondary data from official sources and 2016 primary data based on ACI’s perception survey.
Source: Asia Competitiveness Institute
RankRegion
2017
Score2014 2015 2016 2017
1 1 1 1 Java 0.942
2 2 2 2 Kalimantan 0.806
4 4 3 3 Sulawesi 0.335
3 3 4 4 Sumatra 0.282
5 5 5 5 Bali - Nusa Tenggara -0.323
6 6 6 6 Maluku - Papua -2.041
Indonesia Regional Competitiveness Ranking & Score
Sub-environment 4: Quality of Life and Infrastructure Development
-2.5
-2
-1.5
-1
-0.5
0
0.5
1
1.5
2
Java Kalimantan Sulawesi Sumatra Bali andNusa
Tenggara
Malukuand Papua
Physical Infrastructure
Technological Infrastructure
Standard of Living, Education and Social Stability

4. CONCLUSION & POLICY
IMPLICATIONS
42

Conclusion and Policy Implications (1/2)
• Competitiveness of a region or sub-national area is not a simple matter to explain.
– Having abundant natural resources does not seem to explain competitiveness
(see scatterplot in Slide 44)
– However, having a strong manufacturing sector may be correlated to higher
competitiveness scores (see scatterplot in Slide 45), and
– And being an archipelagic province seems to present substantial challenges
(see Slide 46)
• There are opportunities to learn from the most-improved and least-improved
provinces over the years, and identify the drivers of such improvement and
deterioration (see Slide 47)
– Central Sulawesi, Central Kalimantan, Lampung and Bangka Belitung Islands
are some of the most-improved ones for 2013-2017
– South Sumatra, Aceh, West Sulawesi, and Papua are some of the least-
improved ones for the same period.43

44
Scatterplot of Provinces’ Share of Natural Resources in GRDP
and Overall Competitiveness Scores
The data is from 2014 secondary data from official sources and 2016 primary data based on ACI’s perception survey.
GRDP from natural resources constitutes GRDP from Oil and Gas.
Source: Asia Competitiveness Institute
High Natural Resources
High Competitiveness
High Natural Resources
Low Competitiveness
Low Natural Resources
Low CompetitivenessLow Natural Resources
High Competitiveness

45
Scatterplot of Provinces’ Share of Secondary Industry in
GRDP and Overall Competitiveness Scores
The data is from 2014 secondary data from official sources and 2016 primary data based on ACI’s perception survey.
Source: Asia Competitiveness Institute
High Manufacturing Share
High Competitiveness
High Manufacturing Share
Low Competitiveness
Low Manufacturing Share
Low Competitiveness
Low Manufacturing Share
High Competitiveness

46
Competitiveness Scores by Environment for
Indonesia’s Seven Archipelagic Provinces
-2
-1.5
-1
-0.5
0
0.5
1
1.5
2
Riau Islands(#10)
North Sulawesi(#17)
Bangka BelitungIslands(#22)
West NusaTenggara
(#26)
Maluku(#29)
East NusaTenggara
(#30)
North Maluku(#31)
Macroeconomic Stability
Government and Institutional Setting
Financial, Businesses and Manpower Conditions
Quality of Life and Infrastructure Development

47
Most Declined Provinces, 2013 - 2017
Source: Asia Competitiveness Institute
Most Improved Provinces, 2013 - 2017
Provinces & Rank 2013 2014 2015 2016 2017
Central Sulawesi 23 21 20 14 12
Central Kalimantan 26 15 13 13 13
Lampung 20 24 25 18 14
Bangka Belitung
Islands29 20 30 20 22
Provinces & Rank 2013 2014 2015 2016 2017
South Sumatra 12 16 17 22 24
Aceh 16 13 24 26 25
West Sulawesi 21 25 18 30 28
Papua 24 31 33 33 32
23
12
26
13
20
14
29
22
2013 2014 2015 2016 2017
CentralSulawesi
CentralKalimantan
Lampung
Bangka BelitungIslands
12
24
16
25
21
28
24
32
2013 2014 2015 2016 2017
South Sumatra
Aceh
West Sulawesi
Papua
Indonesia’s Most Improved and Least Improved Provinces

Conclusion and Policy Implications (2/2)
• ACI’s 2017 competitiveness analysis of Indonesia’s sub-national economies still highlight
high competitiveness of six provinces in Java Region. DKI Jakarta’s dominance, however,
is lessening over the years, with East Java increasing competitiveness on almost all fronts.
• Sumatra Region, often coined as Java’s peer in terms of development level, stays at
fourth position - below Kalimantan and Sulawesi regions! However, some Sumatra
provinces are now catching up.
• Sulawesi Region fares promisingly in governance and standard of living indicators, and
has rightly increased its attractiveness to investors.
• Disparity between the easternmost provinces and the rest of Indonesian provinces still
persists. West Papua’s lagging performance on Government and Institutional Setting, and
Papua’s particularly low score for Quality of Life and Infrastructure Development are
worrying and deserving of attention.
• The national agenda to enhance maritime infrastructure and connectivity gives a
promising outlook for the Maluku-Papua Region, as well as other lagging archipelagic
provinces to be more integrated in intra- and inter-regional trade.
• Efforts to increase growth engines throughout the country is welcomed and should be
prepared by taking into account provincial and regional competitiveness. 48

Discussion
49

APPENDIX
50

1. Macroeconomic Stability (18 indicators)
1.1 Economic Vibrancy 1.2 Openness To Trade and Services 1.3Attractiveness To Foreign
Investors
1.1.01 Gross Regional Domestic Product (GRDP) 1.2.01 Exports 1.3.01 Last 3 Year Average Foreign Investment
1.1.02 GRDP, non-oil and gas 1.2.02 Exports, non-oil and gas 1.3.02 Last 3 Year Average Domestic Investment
1.1.03 GRDP Growth 1.2.03 Imports 1.3.03 Investment Promotion and Management [S]
1.1.04 GRDP Per Capita 1.2.04 Imports, non-oil and gas
1.1.05 GRDP per Capita, non-oil and gas 1.2.05 Openness To Trade
1.1.06 Size of Primary Industry
1.1.07 Size of Secondary Industry
1.1.08 Size of Tertiary Industry
1.1.09 Gross Domestic Fixed Capital Formation
1.1.10 Consumer Price Index [R]
51[R] denotes Reverse Indicator
[S] denotes Survey-based Indicator
List of Indicators by Competitiveness Environment (1/4)

2. Government and Institutional Setting (16 indicators)
2.1Government Policies and Fiscal
Sustainability2.2
Institutions, Governance and
Leadership2.3
Competition, Regulatory
Standards and Rule of Laws
2.1.01 Government Revenue 2.2.01 Lack of Corruption [S] 2.3.01 Regulatory Governance [S]
2.1.02 Tax Revenue 2.2.02 Crime Rate [R] 2.3.02 Rule of Law [S]
2.1.03 Tax Revenue per Government Revenue 2.2.03 Security [S] 2.3.03 Vibrancy of Competition and Collaboration [S]
2.1.04 Government Expenditure 2.2.04Government Inclusiveness and Accountability
[S]
2.1.05 Fiscal Balance 2.2.05 Government Progress & Expectation [S]
2.2.06 Government Efficiency [S]
2.2.07 Coordination of Local Governments [S]
2.2.08 Provincial Governing Capacity [S]
52[R] denotes Reverse Indicator
[S] denotes Survey-based Indicator
List of Indicators by Competitiveness Environment (2/4)

3. Financial, Businesses and Manpower Conditions (26 indicators)
3.1Financial Deepening and
Business Efficiency3.2 Labour Market Flexibility 3.3 Productivity Performance
3.1.01 Total Bank Deposits 3.2.01 Labour Force 3.3.01 Labour Productivity, Overall
3.1.02 Total Bank Loans 3.2.02 Number of Employment 3.3.02 Labour Productivity, Non-oil and gas
3.1.03 Non Performing Loans [R] 3.2.03 Employment in Primary Industry 3.3.03 Labour Productivity, Primary Industry
3.1.04 Non Performing Loans per Total Loans [R] 3.2.04 Employment in Secondary Industry 3.3.04 Labour Productivity, Secondary Industry
3.1.05 Number of Bank Branch/Office 3.2.05 Employment in Tertiary Industry 3.3.05 Labour Productivity, Tertiary Industry
3.1.06 Population per Bank Branch/Office [R] 3.2.06 Employment Participation Rate
3.1.07 Ease of Dealing With Banks [S] 3.2.07 Unemployment Rate [R]
3.1.08 Firms' Performance [S] 3.2.08 Minimum Wage Per Month [R]
3.1.09 Firms' Human Resource Capacity [S] 3.2.09 Labour Relations [S]
3.1.10 Firms' Equipment Capacity [S]
3.1.11 Firms' Application of IT [S]
3.1.12 Firms' Innovation [S]
53[R] denotes Reverse Indicator
[S] denotes Survey-based Indicator
List of Indicators by Competitiveness Environment (3/4)

4. Quality Of Life and Infrastructure Development (40 indicators)
4.1 Physical Infrastructure 4.2 Technological Infrastructure 4.3Standard of Living, Education
and Social Stability
4.1.01 Population 4.2.01 Telephone Ownership 4.3.01 Adult Illiteracy Rate [R]
4.1.02 Population Growth 4.2.02 Handphone Ownership 4.3.02 Mean Years of Schooling
4.1.03 Urban Population 4.2.03 Desktop Computer Ownership 4.3.03 School Enrollment Rate (Primary)
4.1.04 Length of (Paved) Roads 4.2.04 Laptop Computer Ownership 4.3.04 School Enrollment Rate (Junior High)
4.1.05 Registered Motor Vehicles per KM of Road [R] 4.2.05 Internet Access at Home 4.3.05 School Enrollment Rate (Senior)
4.1.06 Cargo at Domestic Seaport 4.2.06 Internet Access at Office 4.3.06 Student-Teacher Ratio (Primary) [R]
4.1.07 Cargo at International Seaport 4.2.07 Internet Access at School 4.3.07 Student-Teacher Ratio (Junior High) [R]
4.1.08 Passengers of Domestic Air Traffic 4.2.08 Internet Access with Handphone 4.3.08 Student-Teacher Ratio (Senior High) [R]
4.1.09 Passengers of International Air Traffic 4.2.09 Quality of Technological Infrastructure [S] 4.3.09 Human Development Index
4.1.10 Households with Piped Water Services 4.3.10 Life Expectancy at Birth
4.1.11 Households with State Electricity Services 4.3.11 Gini Ratio [R]
4.1.12 Ease of Acquiring Land/Office Rental 4.3.12 Population Per Number of Health Facilities [R]
4.1.13 Quality of Physical Infrastructure [S] 4.3.13 Population Per Number of Medical Workers [R]
4.3.14 Environmental Quality Index
4.3.15 Fatalities due to Natural Disaster [R]
4.3.16 Quality of Education [S]
4.1.17 Quality of Healthcare [S]
4.3.18 Affordability of Goods and Services [S]
54[R] denotes Reverse Indicator
[S] denotes Survey-based Indicator
List of Indicators by
Competitiveness Environment (4/4)

• A step-by-step description of the ranking process for N regions, M practical indicators and C
environments, with each environment comprising S sub-environments.
(1) Compute the mean value of practical indicator j (j = 1, ... , M),
𝑿𝒋 =𝟏
𝑵
𝒊=𝟏
𝑵
𝑿𝒊𝒋
where 𝑋𝑖𝑗 represents the value that region i (i = 1, ... , N) takes for practical indicator j.
(2) For each practical indicator j (j = 1, ... , M), calculate its standard deviation (SD),
𝑺𝑫𝒋 =𝟏
𝑵 𝒊=𝟏
𝑵 𝑿𝒊𝒋 − 𝑿𝒋𝟐
(3) Compute the standardised value of indicator (SVI) that each region i (i = 1, ... , N) takes
under each of the practical indicators j (j =1, ... , M),
𝑺𝑽𝑰𝒊𝒋 =𝑿𝒊𝒋− 𝑿𝒋
𝑺𝑫𝒋
55
Computation of ACI’s Competitiveness Ranking:
The Algorithm (1/4)

56
(4) Compute the ‘ranked’ standardised value of indicator (RSVI) that each region i (i = 1, ... , N) takes under
each of the practical indicators j (j = 1, ... , M),
𝑹𝑺𝑽𝑰𝒊𝒋 = 𝑺𝑽𝑰𝒊𝒋, 𝒊𝒇 𝒂 𝒉𝒊𝒈𝒉𝒆𝒓 𝒗𝒂𝒍𝒖𝒆 𝒊𝒔 𝒃𝒆𝒕𝒕𝒆𝒓
−𝑺𝑽𝑰𝒊𝒋, 𝒊𝒇 𝒂 𝒍𝒐𝒘𝒆𝒓 𝒗𝒂𝒍𝒖𝒆 𝒊𝒔 𝒃𝒆𝒕𝒕𝒆𝒓
(5) For each practical indicator j (j = 1, ... , M), a ranking can be obtained for regions. Regions with a higher value of RSVI for
indicator j are ranked ahead of those with a lower value.
(6) For each region i (i = 1, ... , N), calculate the RSVI for each sub-environment k (k = 1, ... , S) belonging to environment l (l
= 1, ... , C),
𝑹𝒂𝒘_𝑹𝑺𝑽𝑰𝒊,𝒍𝒌 =𝟏
𝒚𝒍𝒌
𝒑=𝟏
𝒚𝒍𝒌
𝑹𝑺𝑽𝑰𝒊,𝒋𝒍𝒌,𝒑
𝑴𝒆𝒂𝒏_𝑹𝑺𝑽𝑰𝒍𝒌 =𝟏
𝑵
𝒊=𝟏
𝑵
𝑹𝒂𝒘_𝑹𝑺𝑽𝑰𝒊,𝒍𝒌
𝑺𝑫_𝑹𝑺𝑽𝑰𝒍𝒌 =𝟏
𝑵
𝒊=𝟏
𝑵
𝑹𝒂𝒘_𝑹𝑺𝑽𝑰𝒊,𝒍𝒌 −𝑴𝒆𝒂𝒏_𝑹𝑺𝑽𝑰𝒍𝒌𝟐
𝑹𝑺𝑽𝑰𝒊,𝒍𝒌 =𝑹𝒂𝒘_𝑹𝑺𝑽𝑰𝒊,𝒍𝒌 −𝑴𝒆𝒂𝒏_𝑹𝑺𝑽𝑰𝒍𝒌
𝑺𝑫_𝑹𝑺𝑽𝑰𝒍𝒌
where 𝑦𝑙𝑘 is the total number of practical indicators under sub-environment k of environment l and (RSVIi,jlk,1 , ... ,
RSVIi,jlk,ylk) are the RSVIs for region i that make up sub-environment k of environment l.
Computation of ACI’s Competitiveness Ranking:
The Algorithm (2/4)

57
(7) For each region i (i = 1, ... , N), calculate the RSVI for each environment l (l = 1, ... , C),
𝑹𝒂𝒘_𝑹𝑺𝑽𝑰𝒊,𝒍 =𝟏
𝑺𝒍
𝒌=𝟏
𝑺𝒍
𝑹𝑺𝑽𝑰𝒊,𝒍𝒌
𝑴𝒆𝒂𝒏_𝑹𝑺𝑽𝑰𝒍 =𝟏
𝑵
𝒊=𝟏
𝑵
𝑹𝒂𝒘_𝑹𝑺𝑽𝑰𝒊,𝒍
𝑺𝑫_𝑹𝑺𝑽𝑰𝒍 =𝟏
𝑵
𝒊=𝟏
𝑵
𝑹𝒂𝒘_𝑹𝑺𝑽𝑰𝒊,𝒍 −𝑴𝒆𝒂𝒏_𝑹𝑺𝑽𝑰𝒍𝟐
𝑹𝑺𝑽𝑰𝒊,𝒍 =𝑹𝒂𝒘_𝑹𝑺𝑽𝑰𝒊,𝒍 −𝑴𝒆𝒂𝒏_𝑹𝑺𝑽𝑰𝒍
𝑺𝑫_𝑹𝑺𝑽𝑰𝒍
where (RSVIi,l1, . . . , RSVIi,lS) are the RSVIs for the S sub-environments under each environment l.
(8) Overall rank score of region i (i = 1, ... , N),
𝑹𝒂𝒘_𝑹𝒊 =𝟏
𝑪
𝒍=𝟏
𝑪
𝑹𝑺𝑽𝑰𝒊,𝒍
𝑴𝒆𝒂𝒏_𝑹 =𝟏
𝑵
𝒊=𝟏
𝑵
𝑹𝒂𝒘_𝑹𝒊
𝑺𝑫_𝑹 =𝟏
𝑵
𝒊=𝟏
𝑵
𝑹𝒂𝒘_𝑹𝒊 − 𝑴𝒆𝒂𝒏_𝑹 𝟐
𝑹𝒊 =𝑹𝒂𝒘_𝑹𝒊 − 𝑴𝒆𝒂𝒏_𝑹
𝑺𝑫_𝑹
Computation of ACI’s Competitiveness Ranking:
The Algorithm (3/4)

58
• The aggregate score for each main environment is given an equal weight: 25% of the Indonesia
regional overall competitiveness index
• An identical weight is assigned to each environment as they present equal significance to the
computation of the index
• This method is repeated and applied consistently across all the regions to ensure precision of the
rankings
• Mathematically, this can be illustrated as follows:
India Regional Overall Competitiveness Index = 25% × (Macroeconomic Stability) + 25%
× (Government and Institutional Setting) + 25% × (Financial, Business and Manpower
Conditions) + 25% × (Quality of Life and Infrastructure Development)
Computation of ACI’s Competitiveness Ranking:
The Algorithm (4/4)