Embed Size (px)
Citation preview
©2017 by The Regents of the University of California
1
Session 10: Cause and Effect and Ocean Acidification
Overview
This session focuses on the causes and effects of ocean acidification, the crosscutting concept of cause and effect, making and interpreting graphs, and how graphs are useful to make predictions. Through hands-on investigations, the development and interpretation of a data visualization, and some brief readings, participants explore the causes and effects of ocean acidification. They learn that some shell building organisms are and will be negatively impacted by ocean acidification. They also use the information they gather to create a cause and effect flowchart, which serves as a mental model for how all of the new information they have learned fits together. Additionally, participants use their cause and effect flowcharts as the basis for developing solutions to a real-life problem faced by oyster farmers in one community. Participants end the session by reflecting on all of the ways in which the crosscutting concept of cause and effect supported their learning around ocean acidification, as well as any other crosscutting concepts or science and engineering practices they used during the session.
Session Goals
Theme Goals
Climate Science Ideas
● Gain an understanding of the meaning and causes of ocean acidification
● Explore the effects of ocean acidification on organisms with exoskeletons and shells— some have difficulty building hard parts, and others’ hard parts may dissolve due to ocean acidification
● Apply understanding of the direct effects of ocean acidification to making predictions about cause and effect to other organisms within an ocean food web
● Apply knowledge of daily and seasonal variability in ocean pH and ocean observing systems to propose solutions to real-life problems facing the oyster industry in the Pacific Northwest as a result of ocean acidification.
©2017 by The Regents of the University of California
2
Using Data Build on skills covered in previous sessions and explore ways to: ● Choosing the most appropriate data visualization to show your data and help
answer your question, ● Explore the difference between correlation and causation in a relationship
between two variables.
Learning & Teaching
● Discuss the value of using local ecological knowledge and local environmental issues to promote student engagement and learning
Framework/ NGSS
● Read the cause and effect crosscutting concept in NGSS and reflect on how it might be applied in teaching and learning to deepen student understanding of specific science content
Materials Needed For the class:
● Big Chart (Crosscutting Concepts) ● Climate Sciences Ideas Chart ● Masking tape ● PowerPoint presentation and Digital/data projector ● Computer ● Speakers ● 8 sheets of 8.5 X 11 paper ● Video and animation:
○ http://www.pmel.noaa.gov/co2/story/Ocean+Acidification's+impact+on+oysters+and+other+shellfish
○ http://www.whoi.edu/home/oceanus_images/ries/calcification.html.
For each pair of students:
● One pack of large sticky notes (at least 3x5”) ● One dark colored marker (Permanent or other thick marker) ● One 11 X 17” sheet of paper ● glue stick ● Cause and Effect Cards handout
©2017 by The Regents of the University of California
3
● Scissors
For each student:
● One copy of pages 86-89 of A Framework for K-12 Science Education ● Handout: Yeast Investigation
● Handout: Data Component of Final Project (distributed in Session 9)
● Handout: Final Project Guideline (distributed in Session 8)
● Handout: Solving Local Environmental Challenges
● Handout: Like Putting Headlights on a Car
● Handout: Key to Data Visualizations (distributed in Session 9)
● For homework - Analyzing and Interpreting Data: ○ NGSS Appendix F, p. 9 ○ Framework pp. 51; 61-63
For the Transferring Data from Tables to Visualizations to Interpret activity For each student:
● One copy of the Yeast Investigation Handout (either with the graph axes labeled or not depending on which you would prefer to use with your participants)
● Pens
For the Ocean Acidification: Effects on Organisms activity “Break Down” activity 1 complete set of the following for each group of 4-6 students:
● 1 cafeteria tray ● 1 dropper bottle filled with white vinegar labeled “lower pH water” ● 1 petri dish divided into three parts each with a permanent marker (label each section with one of
the following: shells/corals, seaweed, jellies) ● damp calcium carbonate powder ● gelatin powder (unflavored Knox Brand found in many grocery stores works well) ● small plastic cup/medicine cup ● 2 spoons ● damp seaweed (dampened with tap water) ● shell and coral samples ● Picture of jellies
©2017 by The Regents of the University of California
4
● Direction sheet for Break Down Investigation ● Permanent marker
“Build-Up” Activity 1 complete set of the following for each group of 4-6 students:
● 1 cafeteria tray ● Bottle of distilled water ● ¾ cup of limewater in a sealable jar or cup (see preparation instructions below; requires Calcium
hydroxide powder and distilled water) ● 3 Straws with a 1 cm diamond-shaped hole cut about two inches from the top ● 1 dropper bottle filled with white vinegar labeled “lower pH water” ● Permanent marker ● 3 6-8 oz. plastic Solo cups with lids (make holes in the lids large enough for a straw to fit
through)—label cups 1, 2, and 3 ● Direction sheet for and Build Up Investigation ● Build Up Student Sheet ● Litmus paper ● Video animation http://www.whoi.edu/home/oceanus_images/ries/calcification.html.
For the Ocean Acidification: Food Web activity 1 complete set of the following reference sheets for each group of 4-6 students:
● Ocean Acidification Food Web and Organism information sheets ● Manilla folder (to contain the reference sheets)
Preparation of Materials 1. Make the numbered sheets. On eight 8.5 x 11” sheets of paper, write a single, large number
from 1 to 8 so that each sheet has a different number on it that takes up most of the paper and can be seen from a distance. Tape the numbers up in different places around the classroom so that there is space for a group to gather near each number.
2. Make copies. ● One per participant:
○ pages 86-89 of A Framework for K-12 Science Education (Cause & Effect) ○ Yeast Investigation Handout
©2017 by The Regents of the University of California
5
○ Data Components of Final Project (provided in Session 9 - make a few extra copies as needed)
○ Final Project Guidelines (provided in Session 8 - make a few extra copies as needed)
○ “Build Up” Student Worksheet ○ Like Putting Headlights on a Car Handout ○ Solving Local Environmental Challenges Handout ○ For homework - Analyzing and Interpreting Data:
■ NGSS Appendix F (p. 9) ■ Framework pp. 51; 61-63
● One per group of 4-6 participants: ○ “Break Down” Investigation Directions ○ “Build Up” Investigation Directions ○ 1 set of Ocean Acidification Food Web and Organism information sheets
● One per pair of participants: ○ Cause and Effect Cards
3. Display the posters. Post Crosscutting concepts poster where they will be physically accessible to participants.
4. Ocean Acidification: Effects on Organisms: a. Prepare limewater. Limewater is a Calcium hydroxide solution. To make
it, dissolve 1/4 tsp Calcium hydroxide powder in 1000 mL of distilled water. Invert the mixing container several times to mix the powder until the water is relatively clear—you may need to dilute further so that water becomes more clear (sometimes it is necessary to dilute by half). To test the prepared limewater, add about an inch of limewater to each of two clear cups. Add a few drops of vinegar to one of the cups. Cover the cups with a lid that has a hole in it for a straw to fit through. Using a straw, blow into each of the cups for about 30 seconds. Then compare the cups side by side. The difference between the cups should be visible, with the plain limewater cup turning cloudy and the cup with added vinegar staying clear. NOTE: If you prepare the limewater more than immediately before you pour it into the cups for the groups to use, you may need to shake the solution before pouring it into the cups. The Calcium hydroxide can come out of solution.
©2017 by The Regents of the University of California
6
b. Prepare gelatin powder. Scoop into a small sealable container enough gelatin powder for each group of 4-6 to be provided with 1 tablespoon. Dampen the gelatin with water until it is spongy feeling or gelatinous-looking, but not “liquidy”. Cover the container so that the gelatin powder does not dry out. Just before class, put about one tablespoon of dampened gelatin powder into a small medicine cup or other small plastic cup for each group.
c. Place materials on trays. Place all of the prepared materials on the cafeteria trays for each of the “Break Down” and “Build Up” Investigations. Make sure to leave the dampened seaweed and dampened gelatin powder off the trays until just before class so that they do not dry out.
Session at a Glance
Task Description Time (minutes)
A. Partner Share: reflecting on homework & Session goals
With a partner, participants discuss and receive peer feedback on the products of their homework assignment.
30
B. Crosscutting Concept: Cause and Effect
Participants explore the relationship between carbon dioxide in the air and pH of water through a class demonstration using yeast. Correlation vs. causation is introduced. Participants then engage in active reading of the Crosscutting Concept Cause and Effect.
35
C. Transferring Data from Tables into Visualizations to Interpret
Using the demonstration data, participants create their own graphs, practice their orientation teaching skills, and analyze the relationship between increases in CO2 in the air and decreases in pH in the water. Determining if the relationship is only correlated or if it is causal is discussed.
25
D. Ocean acidification:
Through a hands-on investigation and readings, students examine the processes of ocean acidification that are or will
25

©2017 by The Regents of the University of California
7
effects on organisms directly impact some types of organisms.
E. Ocean acidification: Cause and effect flow chart
Participants make a cause and effect flowchart for ocean acidification and impacts on organisms
15
F. Solving Local Environmental Challenges: Ocean acidification
Participants read a short article and view a short video describing the effect of ocean acidification on the shellfish industry in the Pacific Northwest. They bring together what they know about the variability of pH in coastal waters to propose a real-world solution to the problem, then compare this to what shellfish growers have done.
30
G. Optional: Think-Pair-Share: Big Charts
Participants think-pair-share how the Crosscutting Concept of Cause and Effect was used to support their sense-making around ocean acidification.
10 (Time not
included in total)
H. Homework 1. Read Analyzing and Interpreting Data in NGSS Appendix F and in A Framework for K-12 Science Education
2. Complete Part 4 of the Data Components of Final Project worksheet.
3. Bring a draft of your Final Project to next class session to receive feedback from instructor and peers.
10
TOTAL: 2 hrs 50 min 170
©2017 by The Regents of the University of California
8
Session Details A. Partner share: Reflecting on homework
1. Project final project topics. Project a slide showing a numbered list of all of the topic area concepts for the final project:
1. Photosynthesis, Respiration and Oxygen 2. Daily Rains 3. Land vs Sea Breezes 4. Upwelling/Density 5. Temperatures around the Planet 6. El Nino, Rainfall and Temperature 7. Heat, Air, Currents 8. Variability in Chlorophyll Concentrations
2. Participants get into groups and partners by topic. a. Ask participants to take out their homework from the last session—deciding on one to
two More Focused Questions based on exploration of online data, and completing Parts 1–3 of the Data Components of Final Project worksheet.
b. Point out the sheets numbered 1 to 8 posted around the room. With their partners, have them take their homework and stand next to the numbered sheet that corresponds to the number of the topic listed on the projected slide, e.g., those who chose the topic “Photosynthesis, Respiration and O2” would go to the sheet with a “1” on it.
c. Once all partners find the correct sheet, have them partner up with another pair standing nearby. If your class is large enough, participants may even have time to find partners interested in a subtopic closely related to their own.
3. Return to seats with groups and discuss homework. Have participants return to a seat with
their partner groups of 4 and let them know they have about 15 minutes to discuss the homework. Have them discuss the following prompts, making sure that each pair has an opportunity to share and receive feedback:
a. Which data did you explore related to the topic area? b. What were your two More Focused Questions?
©2017 by The Regents of the University of California
9
c. What did the data suggest that you found interesting and wanted to create a question around?
d. How could you revise your More Focused Questions more to make them even more specific of a relationship, time period, and location in which you will investigate (i.e., a testable question)?
Session Goals Display session goals slide. Display the goals and briefly introduce each with a description of how they are connected and flow from one to another.
● Climate science ideas: Gain an understanding of the cause and effects of ocean acidification (OA) by engaging in an activity and applying this knowledge to propose solutions to real-life problems resulting from OA.
● Using data: Gain skills necessary to create and interpret data visualizations and explore the difference between correlation and causation.
● Learning and teaching: Discuss the value of using local ecological knowledge and issues to promote student engagement and learning.
● Framework/NGSS: Read the cause and effect crosscutting concept and reflect on how it might be applied to deepen student understanding of science content.
B. Crosscutting Concept: Cause and Effect
1. Project slide of SAT Scores vs. Family Income graph. This graph comes from a NY Times article in 2009 (http://economix.blogs.nytimes.com/2009/08/27/sat-scores-and-family-income/). Tell participants that today we will focus on cause and effect, one of the crosscutting concepts in NGSS, but first we need to gain clarity on what is meant by causality. When clear graphical patterns emerge, it is often tempting to say that one variable causes the other. However, it is frequently the case that variables are correlated without a direct causal relationship between the two variables. Correlation demonstrates the degree and direction of association of variable phenomena, e.g., the relationship between the variables. This is different from causality, which implies that one variable directly causes the other variable.
2. Ask about SAT Scores vs. Family Income. Ask, “Does this graph of SAT Scores vs. Family
Income show correlation or causation? What is your evidence?” Let a few participants answer
©2017 by The Regents of the University of California
10
and provide evidence for their ideas. Make sure to share the following information if it doesn’t come up.
This relationship is correlational. Without ruling out many other factors related to what underlies family income (e.g., income of past generations, parents’ education level, parents’ IQ, race/ethnicity, etc.) and other factors related to SAT scores (e.g., parents’ education level, test preparation/tutoring, quality of schools, etc.), there is no way to know if an increase in family income is a direct cause of an increase in SAT scores. Without direct evidence of causality, all we can say at this time is that there is a correlation.
3. Project slide of Atmospheric CO2 vs. Ocean pH. Ask, “Does this graph show correlation (a
relationship between two variables) or causation (a relationship between two variables where one variable directly impacts the other)? What is your evidence?” Tell participants you will not discuss these questions now, but they should keep the questions in mind as you move through the later activity (the Demonstration of Relationship between CO2 and pH).
4. Use the active reading protocol to discuss Cause and Effect. Have participants use the active
reading protocol to engage with the Crosscutting Concept of Cause and Effect readings. a. Hand out pages 86-89 of A Framework for K-12 Science Education. Remind participants
to underline interesting and important points, to circle things they have questions about, and to write their questions in the margins.
b. Tell them to partner up when they have finished reading and to discuss what they found interesting, surprising, or confusing.
c. When about 6 minutes remain for this part of the session, ask participants to share out anything they found relevant or questions they still have with the class.
d. Tell participants to keep the crosscutting concept of cause and effect in mind as they move through today’s session.
Demonstration of relationship between CO2 and pH *The following yeast investigation has been modified with permission from: C-MORE Ocean Acidification kit (http://cmore.soest.hawaii.edu/education/teachers/science_kits/ocean_acid_kit.htm) Bruno, B.C., K.A. Tice, N. Puniwai, and K. Achilles (2011). Ocean acidification: Hands-on experiments to explore the causes and consequences. Science Scope, 34(6), 23-30. If interested in running the activity
©2017 by The Regents of the University of California
11
as a hands-on demonstration in class see the “Demonstration of Relationship between CO2 and pH Instructions” information.
1. Set the context of the demonstration. Explain to the participants that they will be investigating the relationship between atmospheric CO2 and ocean pH using yeast, as well as pH and CO2 sensors, using the Demonstration of Relationship between CO2 and pH Instructions slides.
2. Explain the background of the demonstrations. Inform the participants that you previously ran the demonstration and are going to explain the set-up so they have a better idea of where the data are coming from. Yeast was activated by adding warm water and sugar, causing the yeast to respire CO2 gas as participants did in a previous session (Session 7). In one set-up the CO2 gas was directed into a chamber that contained room temperature tap water, and the resulting change in pH of the water over time (pH slide) was measured. In the other set-up CO2 gas was directed into a chamber that contained air, and the change in gaseous CO2 concentration in this chamber over time was measured to determine how much CO2 was produced through respiration by the yeast (CO2 slide).
3. Address the use of two yeast set-ups (optional). Participants may ask why you did not direct the CO2 gas from a single bottle of activated yeast into both the CO2 chamber and the water sample chamber for pH. Explain to them that one bottle of yeast does not produce enough pressure to travel through both tubes, so it was necessary for the pH and the CO2 trials to be done using separate bottles of yeast.
4. Make predictions. Before you show the participants the data, have them discuss their predictions with a partner using the following prompts. Remind participants that they need to state what prior knowledge they are using when making their predictions, as predictions are not random guesses but rather based upon prior knowledge and understanding of the system.
● What will happen to the CO2 concentration in chamber 1 and the pH in chamber 2? ● Do you think that the CO2 concentration will change throughout the demonstration? ● If so, will it change at a constant rate?
[Instructor note: Participants will likely draw evidence from the previous yeast experiment done in Session 7. In that experiment, they used BTB as a chemical indicator and determined that yeast-fed sugar produced CO2. They may also remember that BTB actually indicates the presence of an acid because when CO2 is added to water it makes carbonic acid; therefore the change in color of BTB is a proxy for change in CO2 concentrations.]
©2017 by The Regents of the University of California
12
5. Record predictions on the board. After a minute or so, pull the class back together and have
participants report out the predictions and rationales for their predictions. Record them on the board. Be accepting of all predictions, but remember to probe for their reasoning/rationale.
6. Explain the experiment. After participants have shared their predictions/reasoning, share how
the demonstration was run: a. The demonstration for both the pH and the CO2 portions were started at the same time by
filling each round 500mL bottle with 250mL of hot water. b. Using the funnel, 3 packets of sugar were added to each of the round 500mL bottles and
then 1 yeast packet. It was stirred by swirling the round 500mL bottles for 5 seconds. c. The small, black stoppers were quickly inserted into the top of each round 500mL bottle
to make sure there was a tight seal. d. The demonstration ran for 15 minutes, and data was recorded in the data table every
minute. e. The yeast solution in each round 500 mL bottle foamed. After a few minutes, the gas that
was produced by the yeast traveled through the rubber tubing, producing bubbles in the water where pH was being measured.
C. Transferring Data from Tables into Visualizations to Interpret
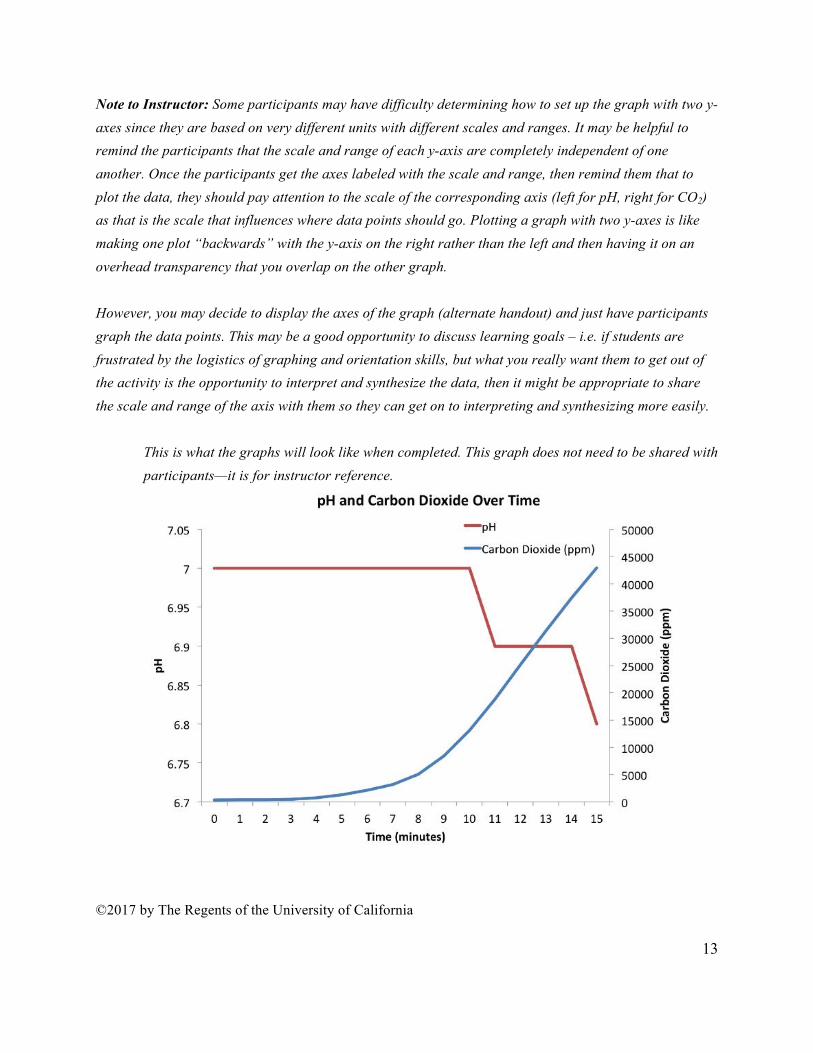
1. Completing the Yeast handout. Distribute the Yeast Investigation Handout to each participant. Ask participants to complete the handout by creating graphs of the pH and CO2 concentration over time. Before the participants make their graphs have them work with a partner to refer back to their Data Visualization Key from Session 9 and ask them (using the “Transferring Data from Tables into Visualizations to Interpret” slides):
● What kind of data do we have? [Continuous data] ● What do they want to show with the data? [Comparison over many time periods] ● Therefore, what kind of graph should they use to display the pH and CO2 data? [Line
chart] ● How many lines do you expect to include on your line chart? [Two – one showing pH
and one showing CO2.]
©2017 by The Regents of the University of California
13
Note to Instructor: Some participants may have difficulty determining how to set up the graph with two y-axes since they are based on very different units with different scales and ranges. It may be helpful to remind the participants that the scale and range of each y-axis are completely independent of one another. Once the participants get the axes labeled with the scale and range, then remind them that to plot the data, they should pay attention to the scale of the corresponding axis (left for pH, right for CO2) as that is the scale that influences where data points should go. Plotting a graph with two y-axes is like making one plot “backwards” with the y-axis on the right rather than the left and then having it on an overhead transparency that you overlap on the other graph. However, you may decide to display the axes of the graph (alternate handout) and just have participants graph the data points. This may be a good opportunity to discuss learning goals – i.e. if students are frustrated by the logistics of graphing and orientation skills, but what you really want them to get out of the activity is the opportunity to interpret and synthesize the data, then it might be appropriate to share the scale and range of the axis with them so they can get on to interpreting and synthesizing more easily.
This is what the graphs will look like when completed. This graph does not need to be shared with participants—it is for instructor reference.
©2017 by The Regents of the University of California
14
2. Comparing graphs. When the participants have completed their graphs, have them compare their graphs and ask them to practice their orientation teaching skills by orienting their partner to their graph (i.e. axis labels, range, etc.) as if they were a student. Then, have them focus on interpreting and synthesizing the results by answering the questions under the graph together.
3. Debrief the graphs. Bring the participants back together and ask if the CO2 concentration
increased or decreased over time? [Increased] What about the pH over time? [Decreased] What is the relationship between CO2 and pH? [As CO2 increases, pH decreases over time]
4. Causal or correlational? Was this a causal relationship? Remind the participants to use evidence
and data to support their explanations of the relationship. You may need to remind participants to consider the homework reading that provided information on what we know about CO2 and its interaction with water as well as the yeast demonstration today and the ocean pH and atmospheric CO2 data from Washington State that they looked at in Session 9. Give participants a minute to turn and talk before responding. Then facilitate a whole-group discussion. Remember to:
● Listen to their responses ● Ask participants to provide explanations, evidence, or clarifications to elaborate on their
thinking. ● Remember to stay neutral in your reaction to participants’ comments. ● Invite others to react and respond to the ideas shared. Suggested probing questions:
○ Can anyone add something to that comment? ○ Who would like to share an alternative opinion? ○ Does anyone disagree with that comment?
● Reference and cross-reference their comments as you facilitate the discussion to encourage participants to think about and respond to one another’s ideas.
At the end of the discussion, if it hasn’t come up, share the following:
● The information in the homework was based on the results of others’ experiments. This counts as evidence.
● They had some direct experience with CO2 changing the pH of water from the experiment in which they blew into the cup of water with BTB a few sessions earlier. The change in color of the BTB indicated that there was a change in the amount of carbonic acid in the water (as CO2 was added), which resulted in a
©2017 by The Regents of the University of California
15
change in pH of the water. The yeast experiment they just conducted provided additional evidence.
5. Optional: More discussion of increasing CO2 causing decrease in pH. If the participants are
struggling to reach the conclusion that increases in CO2 causes a decrease in the pH of surrounding water, engage them in a thought process of connecting the steps through a mental model of how changes in atmospheric CO2 causes changes in the pH of the water:
1. An increase in atmospheric CO2 results in what? [increase in the amount/concentration of CO2 molecules in the air]
2. An increase in the concentration of CO2 molecules in the air results in what changes in the air that is incorporated into surrounding water? [the amount of CO2 molecules that are incorporated into the water increases]
3. As the amount of CO2 molecules incorporated into the water increases, what product is produced at an increased amount? [more carbonic acid is made as CO2 reacts with water]
4. As more carbonic acid is formed what results in the level of pH of the water? [the pH decreases]
D. Ocean Acidification: Effects on Organisms
1. Minute Paper. Participants take two minutes to write down a response to the following prompts: —What is ocean acidification? Explain as best you can. ––Which concept(s) on the Climate Science Ideas chart may have to do with ocean acidification? —Which organisms do you think might be affected by ocean acidification, and how?
2. Share a quick definition. Since the start of the Industrial Revolution, the ocean has gotten about
25% more acidic. This has been caused by excess CO2 entering the atmosphere and thus more CO2 being absorbed (taken in) by the ocean. The extra CO2 comes from the burning of fossil fuels—from cars, trucks, airplanes, factories, making cement, clear cutting forests and other sources. Tell participants that atmospheric CO2 levels have been steadily increasing since the Industrial Revolution.
3. Review – CO2 in the ocean. Remind participants that CO2 occurs naturally in ocean water, through respiration (similar to when they blew directly into water containing BTB) and

©2017 by The Regents of the University of California
16
absorption (similar to if/when in Session 8 they blew into the air over the BTB water and the BTB changed colors, indicating that the water had an increased amount of carbonic acid due to an increase in absorbed CO2). Remind them that some ocean organisms, just like land organisms, use CO2 for photosynthesis AND that organisms that build shells use the carbon from CO2 for making calcium carbonate shells.
4. Introduce the exploration question. Share the Exploration Question: “What happens to some
ocean organisms if the ocean absorbs more CO2 than they are adapted for?” Remind participants that in the last investigation, they saw that increasing amounts of CO2 entering the water decreases the pH of the water, i.e., there is an inverse causal relationship between CO2 and pH.
5. Introduce two questions to investigate. Tell participants that to help them think about their
answer to the broad Exploration Question, they will investigate two smaller questions that focus on forming and maintaining shells. (1) “Which organisms’ parts might break down in water with a lower pH than they are adapted for?” and (2) “Can shells form if ocean water has a lower pH than they are adapted for?”
Break Down Investigation
1. Introduce “Break Down” investigation to participants. Pass out trays of materials for “Break Down” investigation to each group. Tell participants that they will begin their explorations by following the steps on the direction card for the “Break Down” investigation.
a. Tell participants that they will use calcium carbonate powder to represent shells since this is what shells are made of. Give them a minute to explore and handle the real shells and corals. Tell them that calcium carbonate powder is basically crushed shells.
b. Tell them they will use gelatin to represent jellies since jellies are made of similar material. Encourage them to feel the gelatin powder and look at the image of a jelly on their tray.
NOTE: This demonstration has been included to represent the phenomenon of the dissolution of carbonate-based shells in lower pH seawater. The reaction that results from mixing CaCO3 with vinegar is representative of the dissolution process, but not the speed and intensity of what happens to seashells or coral at the pH range predicted by the various models of the effects of climate change on global ocean pH. Further, the dissolution of calcium carbonate powder (versus solid shells) will occur much more rapidly, as the surface area exposed to the acid is greater with
©2017 by The Regents of the University of California
17
powder than shells. Despite these shortcomings, this is an effective model for the dissolution of calcium carbonate shells in acidified oceans.
2. If it seems necessary, briefly describe the steps written on the card:
a. Spoon a small amount of each of the appropriate materials in each of the labeled areas on the petri dish (seaweed, jellies, shells/corals).
b. Predict what will happen when “lower pH water” is dropped on each of these materials. c. Using the eyedropper, add a few drops of “lower pH water” to each material on your
plate. d. Note what happens to each material. e. Discuss these questions: Are any of the materials unaffected by the lower pH water? If so,
which ones? Which materials seem to be most affected by lower pH water?
3. Participants conduct investigation. Give participants a few minutes to conduct the investigation and discuss the questions. Listen in as they share their responses to the discussion questions. They should notice that the calcium carbonate (shells/corals) is the most affected (it bubbles), while the seaweed and gelatin (jellies) remain unaffected.
4. Discuss results. Ask, “What types of organisms might be affected by ocean acidification based
on your evidence so far? Which organisms might fare well in a more acidic (lower pH) ocean?” [shelled organisms might have a tough time maintaining their shells, while jellies and seaweeds appear to be unaffected].
Build Up Investigation
1. Introduce how marine calcifiers build shells. Tell participants that in a minute they will make predictions about how ocean acidification may impact shell formation. In order to do this, provide them with a bit of information on how marine calcifiers build shells using this animation: http://www.whoi.edu/home/oceanus_images/ries/calcification.html. Stop the animation before the last slide—stop on the one that discusses how hydrogen ions in seawater interfere with shell formation.
2. Turn & Talk - make predictions. Ask participants, based on what you know about shell
formation, how do you think falling ocean pH may impact organisms’ abilities to make shells?
©2017 by The Regents of the University of California
18
Give participants a minute to turn and talk to a partner. Remind them to provide reasoning in their prediction. Do not have participants share responses with the class.
3. Introduce the “Build Up” investigation to participants. Explain to the class that they will now
use containers of limewater as models of the ocean. Limewater is tap water with a lot of calcium dissolved in it (in the form of calcium hydroxide). Tell them that limewater will act as a model of the ocean because:
a. Ocean water has many different types of substances dissolved in it naturally, such as nitrogen, calcium, sodium, and carbon dioxide. So ocean water is like soup broth that has many ingredients dissolved in it.
b. Organisms, like corals, snails, and clams, use the calcium and CO2 in ocean water to form calcium carbonate that makes up their shells, just as they saw in the animation. Calcium carbonate (CaCO3) makes their shells hard. Limewater has a lot of calcium dissolved in it.
c. CO2 from respiration (our breath) will be used to add CO2 to the model ocean water (limewater). When CO2 is added to the limewater, a chemical reaction will take place producing calcium carbonate. This means that carbonate is available for combination with the calcium. During the investigation, if CaCO3 forms, the water will turn cloudy due to bits of precipitated CaCO3 floating in the water. Ocean organisms use carbonate (CO3
2-) and calcium dissolved in ocean water to make CaCO3 hard parts.
4. Do “Build Up” investigation with participants. To each group, pass out the tray of materials for the “Build Up” investigation, including the directions sheet and the “Build Up” Student Sheet. Point out that in this investigation, they will be looking at the effects of ocean acidification on organisms’ shell-building capabilities. They will be comparing the availability of CaCO3 for shell building in waters of differing pHs. If it seems necessary, briefly describe the steps written on the card:
a. Note three cups on the sheet of paper labeled, 1, 2 and 3 and a line reading higher pH at one end and lower pH at the other end. Each cup contains limewater. Line the cups up from 1 to 3, with #1 closest to the higher pH end of the line, cup #2 in the middle of the line, and cup #3 at the lower pH end of the line.
b. Drop 10 drops of vinegar into cup #2. c. Drop 20 drops of vinegar into cup #3. d. Using litmus paper, measure the pH in each cup to confirm placement on the pH line.

©2017 by The Regents of the University of California
19
e. Cover each of the cups with a lid. f. When CO2 mixes with Calcium in water, sometimes calcium carbonate is formed. Predict
what will happen when you add CO2 to each cup by breathing into them through a straw. This will mimic CO2 naturally being absorbed by ocean water. You will be able to tell if calcium carbonate forms in the cups because the cup will become cloudy from the white calcium carbonate.
g. Unwrap the straws; insert one straw through the lids into each of the three cups of limewater. Do not drink the water. Give each of the cups to different people.
h. At the same time, have each person holding a cup use their straw to blow air into the solution in the cup. Air bubbles should be apparent in the solution. Have each person blow for the same amount of time—about 30-45 seconds.
i. Record observations of each of the cups and answer the wrap-up question: Which of the cups of water seems to have more calcium carbonate available for organisms to use to build shells? What is your evidence?
5. Whole group discussion. Once participants have completed the activity and their worksheets,
bring them back together as a class and ask for groups to report out what they observed. a. Participants should notice that the higher pH water gets cloudy because more white
precipitate forms. Remind participants that this cloudiness is calcium carbonate – the compound ocean organisms use to build their shells. However, the lower pH water is less cloudy because less white precipitate forms.
b. Ask, “Which of the waters appear to have more calcium carbonate available for building shells? How do you know?” [The higher pH water seems to have more calcium carbonate available because it is cloudier than the lower pH water, therefore it could be easier for organisms to make shells in water with higher pH.]
c. Ask, “How is shell building connected to atmospheric CO2 concentrations?” [As atmospheric CO2 increases, ocean pH decreases. So, when atmospheric CO2 levels are higher, ocean organisms will most likely have a harder time building shells because there is less available carbonate in the ocean water when the pH is lower.]
6. Review models in science. Tell participants that the two investigations used models to represent
the ocean. Ask participants to think about the ways in which these models are accurate for investigating the questions regarding effects of a more acidic ocean on ocean organisms, and then ask them to think about the ways they are inaccurate. Call on a few volunteers to discuss their
©2017 by The Regents of the University of California
20
ideas. Encourage participants to build on each other’s ideas by asking questions like, “What do others think about that idea?” or “Does anyone have anything to add to that idea?”
Accurate: The models use some of the substances dissolved in ocean water, including calcium and CO2; the gelatin and the calcium carbonate are essentially the same materials the actual organisms we’re modeling are made of. Inaccurate: The models are much smaller than the actual ocean; the CO2 entering the ocean is not really from blowing into it, but is absorbed from the atmosphere; the low pH water is likely a lot more acidic than ocean water will ever actually be, but we have made it more acidic to speed up the process so that it can be seen in a short amount of time. In addition, there are other feedbacks and processes occurring in organisms than just the calcium carbonate/carbon dioxide relationship and therefore this model is not a complete picture of what is happening in the ocean to marine organisms with ocean acidification.
More information about effects of Ocean Acidification: Food Webs
1. Getting more evidence about organisms affected by ocean acidification. Tell participants that they will continue to gather evidence about the effects of ocean acidification. Pass out the set of 8 Ocean Acidification Food Web and Organism information sheets to each table group of participants. Ask table groups to divide up the 8 sheets between themselves. Then give participants a few minutes to peruse whatever interests them.
2. Participants share findings in table groups. After participants have had a few minutes to look through the information sheets, ask them to share their findings with others in their table group. Give participants about 5 minutes to share anything they found interesting or surprising.
3. Whole group share out. After a few minutes, ask the whole class, “Based on the available
evidence, what can you say about direct and indirect effects of ocean acidification on organisms?”
Remember to use the discussion map to encourage everyone to participate in the discussion. Encourage participants to build on each other’s ideas by asking questions like, “What do others think about that idea?” or “Does anyone have anything to add to that idea?” If no one points out the information on plankton, you might share that many plankton build parts from calcium carbonate, and plankton are the base of most ocean food webs. Participants should
©2017 by The Regents of the University of California
21
also mention that most organisms within the marine food web will be at least indirectly affected by ocean acidification due to effects on many organisms at the base of the food web.
4. Revisit minute papers. Have participants draw a line under their first ideas on the minute paper.
Then have them record their current thinking under the line, making sure to include evidence. Note to Instructor: Participants often have additional questions about ocean acidification that go beyond the scope of this course. If participants want more information, please share the following link: http://www.whoi.edu/ocean-acidification/. Participants may also wish to revisit the animation: http://www.whoi.edu/home/oceanus_images/ries/calcification.html.
E. Ocean Acidification: Cause and Effect Flow Chart
1. Project slide, Make a Flow Chart. Tell participants that we will now go back to the Crosscutting Concept of Cause and Effect to help us tie all of the ideas of the session together. Let participants know that the cards on the slide are examples, not cards they will use. The cards describe causes and effects, related to evidence the class has examined in past sessions. Read aloud the cards. Ask, “How could you put two of these cards together to show cause and effect?” Accept a few ideas. “Can you suggest a chain of cards connecting causes and effects?” Accept a few ideas.
2. Project slide, Flow Chart Example. Explain that this is an example of how the cards could be
arranged into a flow chart. Point out the arrows connecting the different boxes leading from causes to effects. Tell participants that in this example, one cause leads to two effects. Note that it's also possible for two causes to lead to one effect.
3. Project slide, Flow Chart with Evidence. Point out that some evidence for each cause/effect
arrow has been added to the chart. Have volunteers read aloud each of these notes. Leave this slide projected.
4. Explain pairs activity. Each pair will get a sheet that has nine printed cards to cut apart plus one
blank card. After the cards are cut out, participants will place them on a blank sheet of paper, working together and discussing how to move the cards to create a flow chart. Once their cards

©2017 by The Regents of the University of California
22
are arranged satisfactorily, they should use a glue stick to attach the cards to the paper, and they can add the arrows that go from causes to effects. Have them also include evidence along arrows.
Optional: Summarize these steps on the board: 1. Cut apart cards. 2. Discuss and create cause and effect chain. 3. Glue cards and draw arrows. 4. Write evidence along arrows. 5. Decide if you will use the blank card (and what you will write on it).
5. More than one arrow can flow from a card. Remind participants that more than one arrow can
be drawn from a card, similar to the first card shown on the example slide for the Industrial Revolution. This can be the case for both causes and effects.
6. Distribute materials; pairs begin creating charts. Remind pairs to discuss the placement of
each item, to listen to each other, and to work cooperatively. Emphasize that they should use evidence from today’s session and previous activities and talk about their reasoning. Pass each pair a Cause and Effect card sheet, a blank sheet of paper, and a pair of scissors; let them begin. Remind participants to space out the cards so there is enough room for evidence, as shown on the example slide.
7. Write evidence beside arrows. Encourage participants to look back through their Investigation
Notebooks and any notes from today to find relevant evidence and to look at the projected slide for examples of evidence describing cause and effect.
8. Debrief cause and effect flow charts. After about ten minutes, regain the class’s attention. As a
class, debrief some of the flow charts by having one pair share their chart and explanations, and then have other participants comment on it. Use a document camera, if possible.
9. Small groups write key concepts; class consensus recorded on Climate Sciences Ideas chart.
Have table groups complete the following sentence starters and then call on volunteers to share their ideas. Record ideas on the board and come to a class consensus about the wording of the ideas to add to the Climate Science Ideas chart.
©2017 by The Regents of the University of California
23
● Ocean acidification is caused by_____________________. [Answers may vary and include an increase in atmospheric CO2, production of carbonic acid out of water and CO2, increase in hydrogen ions, decrease in pH, or increase in acidity]
● The effects of ocean acidification include_________________. [Answers may vary and include dissolution of oyster and/or mussel shells and other calcifying organisms, disruption of food webs, economic challenges for communities that rely on marine resources, etc].
F. Solving Local Environmental Challenges: Ocean Acidification In this section, participants will read a short article and view a short video as an introduction to some of the adverse effects of ocean acidification on oyster larvae and the resulting challenges facing the shellfish industry in the Pacific Northwest. After reading background information provided on the handout, the first page of the NOAA article, and the first part of the PBS video on ocean acidification, participants will work together to bring in what else they know about the variability of ocean pH to propose a solution for the problems facing oyster growers in the Pacific Northwest. NOTE: The second page of the NOAA article and the last part of the video explain some of the solutions that oyster growers came up with. For this reason, only have students read and view the first part of the article and video.
1. Background on the effects of ocean acidification and oysters. Have participants read the background section of the Solving Local Environmental Challenges handout, then the first page of the short NOAA article on IOOS titled Like putting headlights on a car, which describes some of the challenges faced by the shellfish industry and how ocean observing systems are involved in the solution. While reading, ask participants to create a written list of the challenges faced by the shellfish industry. Link to article: http://www.noaa.gov/features/01_economic/pacificoysters.html
2. Gather more information from a video. Tell participants that the video you are about to watch
will provide additional information on the effects of ocean acidification on oysters. As they watch, they should add to their list of challenges. Watch the first part of the PBS report titled “Ocean Acidification's impact on oysters and other shellfish: Acidifying Waters Corrode Northwest Shellfish.” Pause the video at 3:20 after Bill Dewey of Taylor Shellfish describes the effect of ocean acidification on oyster larvae. (You will resume the video at the end of the activity).
©2017 by The Regents of the University of California
24
http://www.pmel.noaa.gov/co2/story/Ocean+Acidification's+impact+on+oysters+and+other+shellfish
3. Building/supplementing flow charts (optional): Based on the content of the video, reading and
prior content from the course, have participants add to their “Cause and Effect” flowcharts that describe the downstream effects of elevated CO2 on ocean pH, oyster larvae, adult oysters, and the people who rely on the oyster industry for income and livelihood. Give participants about 3-5 minutes to work on this.
4. Designing a solution to the problem facing oyster growers (group work): Participants will
work together in small groups to come up with strategies for how the shellfish industry can overcome the effect of ocean acidification (OA) on oyster larvae. Provide the following prompt:
“Imagine you are an oyster grower in the Pacific Northwest, with many families, employees, restaurants and seafood distributors that depend on you for oysters and livelihood. In order to maintain production of healthy oyster larvae, you need to pump fresh ocean water into your hatchery daily until they reach a size when they are less vulnerable to changing environmental conditions (approximately 2 weeks). However, if you pump ocean water into your hatchery that is too low in pH, millions of oyster larvae might die and shellfish growers will be left without oyster seed.”
Given this challenge, have participants work together in small groups to come up with a strategy to overcome some of the problems associated with ocean acidification. The following prompts are on their worksheet and are meant to help build evidence for possible solutions. Note to facilitator: Let participants know that they will be calling on previous content and making new connections regarding daily and seasonal patterns in dissolved oxygen, CO2, and pH. Specific sessions they will call on include Session 7 (i.e. OSS Activity 2.3: Tracking Carbon through Photosynthesis and OSS Activity 2.4: Tracking Carbon Over Time & Authentic Local Data), as well as Session 9 (Comparing patterns in global, regional and local data).
1) What do you know about the daily variability of oxygen and carbon dioxide? [Carbon
dioxide and oxygen go up and down and are inversely related. Due to photosynthesis, oxygen is higher during daylight hours and carbon dioxide is lower. The opposite occurs at night due to respiration].

©2017 by The Regents of the University of California
25
2) How is this variability in oxygen and carbon dioxide related to pH? [pH changes as a function of carbon dioxide concentrations].When is pH low? [At night or times when respiration is greater than photosynthesis].When is it high? [During the day when photosynthesis is greater than respiration]. Can you use this to your advantage when collecting water to raise oysters? [Collect water at times when carbon dioxide is lowest, for example most likely during the afternoon].
3) What do you know about the seasonal fluctuation of ocean pH? Is this pattern predictable? [Ocean pH varies predictably and inversely with carbon dioxide throughout the year. pH is generally higher in summer when carbon dioxide concentrations are the lowest (due to drawdown from photosynthesis). pH is lowest in the winter when there is less photosynthesis and respiration has increased the dissolved carbon dioxide concentrations].
4) Could this information help with timing the collection of water for growing oysters? [Collecting water later in the season (summer) is most likely better than winter].
5) What technologies are available to monitor ocean chemistry and water quality? [Sensors have been developed that can measure salinity, dissolved oxygen, pH, carbon dioxide, temperature, and chlorophyll (i.e., phytoplankton) concentrations - and other parameters. These sensors can be on handheld instruments, or automated instruments deployed on pilings, buoys, and gliders that provide real-time data via satellite, cellular or telemetry data streams. Remote sensing from satellite or aircraft can be used to determine ocean temperature, salinity, chlorophyll, or other features.]. How would you use these? [These technologies can be used to measure real-time ocean conditions and also predict changes in chemistry and water quality. These data can then be used in real-time to make informed decisions].
6) Is there anything else you know about the seasonal fluctuation of ocean pH? Are you familiar with any other oceanographic processes that bring low pH water to the surface? How could this information be helpful? [Students may also mention the effect of upwelling, where low pH water from the deep ocean is brought to the surface when upwelling-favorable winds occur. Hatcheries on the coast should not collect water during periods of upwelling if they intend to use this water for growing oysters].
Once they have discussed these questions, have them write down their solution. Encourage them to use drawings or illustrations to provide a more detailed description.
©2017 by The Regents of the University of California
26
5. Considering potential threats to other local ocean-based industries. The problem of ocean acidification in Pacific Northwest waters may seem remote and even abstract to many participants. To build connections to local coastal ecosystems and related environmental challenges, participants will reflect on their own local or regional coastal communities and how ocean acidification and/or climate change might pose similar challenges to those faced by oyster growers of the Pacific Northwest. (Note: Participants may generate some new ideas for solutions to their own local challenges. Feel free to encourage this, as they will revisit these ideas after they read/hear about what other scientists have done (in the article and video in step #6 below)). To promote thinking about their own local challenges, have participants reflect on the following prompts:
- What are some of the local, ocean-based industries in your area? If you don’t have any local ones, what are some ocean-based industries overall?
- Which of these might be impacted by ocean acidification? - If not ocean acidification, are there other changes in the oceans related to pH, water
quality, or climate that would have an impact on these industries?
6. Comparing Solutions: Have participants read the second page of the NOAA article and finish
the PBS report video on ocean acidification. Have them make note of the following and discuss these questions within their small group:
1) What are some of the solutions that oyster growers implemented to deal with low pH waters in the Pacific Northwest? Were these similar to the solutions your group proposed?
2) What ocean observing technologies were used to assist in the solution described in the NOAA article?
3) This exercise has focused on oysters in the Pacific Northwest. Based on your own ideas and the PBS video, what other coastal industries are potentially affected by ocean acidification?
When the small groups are done with their discussions, have them share with the other small groups and compare their strategies for dealing with the effect of low pH ocean water on oyster larvae and the oyster industry.
7. Reflecting on practice and learning: Have participants engage in a whole class summative
discussion of the value of engaging learners through their own local or regional ecological
©2017 by The Regents of the University of California
27
knowledge. If students don’t mention the information in brackets following each question, make sure to share it.
- How can learning be improved by students thinking about solutions to local problems? [When information is delivered within the context of community needs and priorities, the learning experience becomes more relevant and potentially more meaningful. Further, acquiring new information and learning for the purpose of solving practical problems is less abstract and may make it easier to motivate students to engage in learning and seek understanding]
- What are the advantages and/or challenges of using examples that are potentially geographically distant from the learners (e.g. oysters in the Pacific Northwest)? [Although the examples may be good at providing clear linkages to the content, the challenges may not seem as “real” since they don’t deal with local issues or local environments with which learners are familiar.]
- What are the advantages and/or challenges of using more local examples? [Advantages are that local data may be collected at places familiar to the student and therefore more meaningful, relevant and resonate with local student ecological knowledge. A challenge is that it may also be difficult to find legitimate, science-based examples in local waters. Also, as with any source of real-time data, the quality of data stream can be unpredictable and often patterns emerge that are hard to explain, or doing so is beyond the knowledge base of the students. NOTE: Because of these challenges, it is often prudent for the teacher to first explore local sources of data and evaluate their suitability for the level of student they are hoping to engage in data exploration. There are many sources of coastal monitoring data (see Session 8: handout of online data sources), as well as inland sources of climatological and weather data provided by the agriculture community (e.g. AgWeather) that are worth exploring.
G. Optional: Pair-Share: Big Chart of Crosscutting Concepts
1. Partner share. Have participants turn and talk to a partner about how the instructor used the crosscutting concept of Cause and Effect to support their understanding of ocean acidification, as well as how they, as learners, used the crosscutting concept. Give them about 3 minutes to discuss and to record their ideas on sticky notes.
©2017 by The Regents of the University of California
28
2. Whole Group Share. Call on one pair to share what they discussed. Record their ideas on the class big chart. Ask others if they discussed something similar and/or if they might like to add additional ideas to the chart. If so, allow them to share, and record their ideas next to the first group’s. Then, ask if other partners had different ideas. Allow each pair with a different idea to add their sticky notes to the chart. The following ideas may come up: [Teacher—continually reinforced how one thing led to another through explicit questioning; asked learners to complete cause and effect flow chart, including evidence. Participant—created cause and effect flow chart linking many ideas from this and past sessions.]
H. Homework
1. Read Analyzing and Interpreting Data in NGSS Appendix F (p. 9) and in A Framework for K-12 Science Education (pp. 51 and 61-63).
2. Work on completing the data components of the final project. Think through pitfalls your
students may encounter in looking at the data to answer the Testable Question in your investigation.
● Complete Part 4 of the “Data Components of Final Project” worksheet: Orientation, Interpretation, and Synthesis questions you will use to assist students in working with the data.
● Print out a version of the data visualization that students will use in the activity and bring it to the next class session.
3. Develop first draft of Final Project. Work with your partner to develop a first draft of the Final
Project using the Final Project Guidelines worksheet provided in Session 8. Each group should bring in their working draft write-up of their final project, including all aspects outlined in the “Final Project Guidelines” document. You and your partners will share what you’ve been working on for your lesson and have the chance to ask questions and receive some feedback from the instructor and peers. Your draft should include each section of the write-up: Introduction, Science Content Overview, Data Components, and Learning Cycle. Bring the draft to the next class session and be prepared to share and receive feedback from instructor and peers.
(Instructor Note: Optional - you may want to have your participants present their lesson to the class on the last day of class or during the time set aside for the Final.)

©2017 by The Regents of the University of California
29