Embed Size (px)
Citation preview

SERVQUAL Applied to Home Care
By Michael Pasmore
BA (Hons) Business Administration
Northbrook College
Business School
August 2007
1

Acknowledgements
I would like to thank Graham Harrison for all of his tutorial support, Richard Sykes
for helping me with statistics and quantitative techniques, Colin Shaw for assistance
with research. Many thanks to Anne Godley and Dr. Chris Rainey for allowing me to
base my research on Home Care; all Home Care employees for taking the time to look
at my questionnaires; and Home Care service users for responding to my
questionnaires.
I would also like to thank my dad for supporting me and my mum (Home Care
manager) for assisting me in gaining access to research Home Care, offering opinions
and allowing me to interview her on many occasions. I would like to thank my brother
for the endless envelope stuffing he endured and finally thanks to my girlfriend for all
her support and for being understanding during frustrating times.
2

Abstract
The research examined Home Care’s, a care service that assists people with physical
and mental health problems, service quality using an adaptation of the SERVQUAL
model. The main findings were that Home Care is not meeting the expectations, of an
excellent care service, of its service users; responsiveness had the largest negative gap
score; Chi Square tests revealed that gender has no influence on service quality
judgement and that the length of time service users have used Home Care for has no
influence on service users judgement of service quality; the overall service quality gap
may be caused by gaps 3, 2 and 1 (of Parasuraman et al.’s 1985 gap model).
Methods used included questionnaires to Home Care service users, employees and the
manager. The manager of Home Care was also interviewed using both a structured
interview technique and an informal technique.
3

Contents Introduction 6 Literature review 8 Hypotheses, aims and objectives 26 Methodology 27 Results 31 Demographics of Home Care service users 31 Demographics of Home Care employees 32 Gap 5 Perceptions minus Expectations 32 Chi Square Tests 35 Gap 3 Service Quality Specification – Service Delivery Gap 37 Gap 2 Manager Perceptions of Consumer Expectations – Service Specification 38 Gap 1 Consumer Expectations – Manager Perceptions of Consumer Expectations 39 Conclusion and Recommendations 39 Bibliography 44 Appendix 1 58 Appendix 2 59 Appendix 3 60 Appendix 4 60 Appendix 5 60 Appendix 6 61 Appendix 7 61 Appendix 8 61 Appendix 9 62 Appendix 10 62
4

Appendix 11 62 Appendix 12 63 Appendix 13 64 Appendix 14 64 Appendix 15 65 Appendix 16 67 Appendix 17 68 Appendix 18 70 Appendix 19 71 Appendix 20 72 Appendix 21 72 Appendix 22 73 Appendix 23 74 Appendix 24 77 Appendix 25 78
5

Introduction
Home Care is a service that offers assistance to people with both physical and mental
health problems who can remain living in the community. Home Care has 160 carers
who visit service users to assist them with personal care and keep records of their
well-being. Home Care provides its services to approximately 400 service users over
Mid-Sussex.
Measuring the service quality delivered by Home Care is important as it will enable
Home Care to identify areas where they may be under or over performing therefore
enabling Home Care to adjust their service accordingly. The SERVQUAL model can
be used to identify five ‘service gaps’ by measuring expectation of service quality
against the perception of the actual service quality.
The particular area of interest is in services marketing. There are many studies of
service quality, especially in the public sector including: Curry, A. (2002), Assessing
the Quality of Physiotherapy service using SERVQUAL, International Journal of
Health Care Quality Assurance, (15:1); Donnelly, M., Kerr, N.J., Rimmer, R. & Shiu,
E.M. (2006) Assessing the Quality of Police Services using SERVQUAL, Policing an
International Journal of Police Strategies & Management, (29:1); Martin, S. (2003),
Using SERVQUAL in Health Libraries across Somerset, Devon and Cornwall, Health
Information and Libraries Journal, (20); Mahapatra, S.S. & Khan, M.S. (2007) A
Framework for Analysing Quality in Education Settings, European Journal of
Engineering Education, (32:2) and Kilbourne, W.E. et al. (2004) The Applicability of
6

SERVQUAL in Cross National Measures of Health – Care Quality, Journal of
Services Marketing,(18:7).
The research carried out adds to previous studies by being more specific to Home
Care in Sussex. The main question to be addressed by this research was – does Home
Care deliver more than it promises? Specific questions have been based on the five
gaps identified by Parasuraman et al. (1985). For example gap 1 asks do management
perceptions of client expectations match actual expectations of the client? Gap 5 asks
is the client’s perceived service what they expect? Gap 4 asks are external
communications to client’s representative of service delivery? And gap 3 asks does
service delivery meet criteria set by service quality specifications?
7

Literature Review
Although services are considered to be a major part of the economies of the
industrialised countries (Bateson, 1989; Ginzberg & Vojta, 1981; Koepp, 1987;
World Bank, 1991) this was not always the case. When discussing services, and their
intangibility, Adam Smith described them as: “unproductive of any value” (Smith,
1977 [1776], p430). However Alfred Marshall (1890) challenged this view by stating
that the production of services was equally capable of producing utility to the user of
the service as the production of a tangible good and that without the services the
tangible products may not exist.
The definition of services has been the subject of much debate (Gronroos, 2000;
Lovelock et al., 1999; Palmer, 1994; Zeithaml & Bitner, 1996). Kotler and Armstrong
(1991) define services as: “…an activity or benefit that one party can offer to another
that is essentially intangible and does not result in the ownership of anything. Its
production may or may not be tied to a physical product.” (Kotler and Armstrong
cited in Palmer, 1994, p1). However Zeithaml and Bitner (1996) define services as:
“…deeds, processes, and performances” (p5). Gummerson 1987 defined services as:
“…something which can be bought and sold but which you can not drop on your
feet.” (Gummesson cited in Gronroos, 2000, p46). Gronroos (2000) defines services
as:
“…a process consisting of a series of more or less intangible activities that normally,
but not necessarily always, take place in interactions between the customer and the
service employees and/or physical resources or goods and/or systems of the service
provider, which are provided as solutions to customer problems.” (p46)
8

An interesting point, identified by Zeithaml and Bitner (1996) and Gronroos (2000), is
that services are not exclusively delivered by “service only” organisations such as
banks, HSBC, Natwest, insurance companies, Norwich Union, lawyers, accountants,
or dentists; they are part of the product offering by many manufactured-goods
producers. Administrative activities such as invoicing and handling claims are part of
the service according to Gronroos (2000). Zeithaml and Bitner (1996) use examples
such as car manufacturers offer of warranties and repair services or computer
manufacturers offer of warranties, maintenance and training. Therefore when
discussing services it is important to recognise that a wide range of industries can be
included. Although these definitions have nuances, they all state that services are
intangible. However since intangible services are not exclusive to ‘pure’ service
organisations, services and manufactured products tend to be placed somewhere along
the tangibility spectrum, as shown below (figure 1), with manufactured goods being
more tangible and services being more intangible (Lovelock et al., 1999; Palmer,
1994; Zeithaml & Bitner, 1996). Therefore it is the intangible services that will be
addressed in this research, as shown in the tangibility spectrum (figure 1) and for the
purpose of this research Gronroos’ (2000) definition of services, as quoted above, will
be used.
Tangibility Spectrum Figure 1
Intangible Dominant Tangible Dominant
Consulting Teaching
Investment management
Airlines
Fast-food outlets
Fast-food outlets Advertising
agencies
Salt Soft drinks
Detergents Automobiles Cosmetics
Source: Shostack, G.L., (1977), Breaking Free from Product Marketing, Journal of Marketing, (41), p73 – 80.
9

Although intangibility is one of the main determinants of services it is not the only
characteristic of services that differentiate them from manufactured goods (Lovelock
et al., 1999; Palmer, 1994; Zeithaml & Bitner, 1996). Others include Inseparability,
perishability, heterogeneity and lack of ownership (Gronroos, 2000; Hoffman &
Bateson, 2002; Lovelock et al., 1999; Palmer, 1994; Zeithaml & Bitner, 1996)
Pure services have no tangible properties. They cannot be touched, seen or tasted.
Goods can be touched, seen and tasted. Therefore services cannot be evaluated prior
to purchase (Hoffman & Bateson, 2002; Lovelock et al., 1999; Palmer, 1994;
Zeithaml & Bitner, 1996). According to Palmer (1994) this means that consumers of
services have less certainty about the outcome of services when choosing between
them. The level of uncertainty needs to be reduced via branding and the incorporation
of physical evidence (Palmer, 1994), such as HSBC’s bank statement folder or
Easyjet’s in flight magazine. Zeithaml & Bitner (1996) state that intangibility means
that services cannot be inventoried, creating difficulties in the management of demand
fluctuations. For example during busy periods demand for Ryannaire’s flights will
increase. To take advantage of this they may buy more planes. However when the
demand falls, they may have excess capacity. Services can easily be copied and
cannot be patented (Zeithaml & Bitner, 1996). Ryannaire did this by coping
Southwestern Airlines operation, to reduce their turnaround times. However Gronroos
(2000), Zeithaml & Bitner (2000) and Lovelock (1991) present a different view of
intangibility, stating that consumers do not always perceive manufactured goods as
tangible. For example a kilo of apples could be perceived in an intangible way as they
are going to be eaten the tangibility of the apple is lost and the consumer simply has
satisfied the need to eat.
10

The intangible nature of services leads to a lack of ownership – the consumption of a
service leads to ownership of nothing (Palmer, 1994). The consumer simply buys the
right to use the service, for example using a train or eating a meal.
Inseparability is where services are sold first and produced and consumed
simultaneously – they cannot be separated from their means of production (Hoffman
& Bateson, 2002; Lovelock et al., 1999; Palmer, 1994; Zeithaml & Bitner, 1996). In
contrast to this manufactured goods are separable since they are produced first and
then sold. The key principle to this characteristic is that there has to be interaction
between the producer and consumer of the service to be realised. For example service
users of Home Care cannot benefit from the service without being present throughout
the whole process of producing the service. Inseparability means that production of
services is radically different from the production of manufactured goods. For
example mass production is not possible meaning that economies of scale can not be
realised (Zeithaml & Bitner, 1996); the method of production becomes key to the
success of the service, where as production methods are relatively unimportant when
producing manufactured goods (Palmer, 1994); the consumer may affect the outcome
of the service (negatively or positively) for himself and other consumers (Zeithaml &
Bitner, 1996).
Another characteristic of services is perishability meaning that they cannot be stored,
resold or returned (Gronroos, 2000; Hoffman & Bateson, 2002; Lovelock et al., 1999;
Palmer, 1994; Zeithaml & Bitner, 1996). For example an unused ticket to see U2
cannot be reused, saved or resold, where as a television can be used, saved or resold.
11

This means that demand for services has to be managed more closely than products
(Palmer, 1994). Forecasting for peaks and troughs, planning for capacity utilisation
and the ability to implement recovery strategies if things go wrong are all necessary
for the successful management of services (Zeithaml & Bitner, 1996). However
Gronroos (2000) argues that although this may be true it is possible to “keep
customers in stock” (p48). For example if a restaurant is full customers could be
asked to wait in the bar until there is a free table (Gronroos, 2000).
Heterogeneity refers to the view that as a result of the personnel, and other customers,
involved in producing the service the service that one customer receives is not the
same as service another receives (Gronroos, 2000; Hoffman & Bateson, 2002;
Lovelock et al., 1999; Palmer, 1994; Zeithaml & Bitner, 1996). For example it is
impossible to control the mood of employees producing the service, which may
change from day to day and affect service production (Zeithaml & Bitner, 1996).
Heterogeneity makes it difficult for service organisations to ensure consistent service
quality (Lovelock et al., 1999). The consumers themselves also impact on the
consistency of the service if they do not articulate their needs (Zeithaml & Bitner,
1996) or if they have problems using equipment of understanding guidelines that
others did not have (Gronroos, 2000). According to Gronroos (2000) heterogeneity
creates one of the major issues of service marketing; “how to maintain an evenly
perceived quality of services produced and rendered to customers” (p49). However
heterogeneity could be an advantage if it were used to personalise the service to each
consumers individual needs (Hoffman & Bateson, 2002).
12

It is these differences between services and goods that have led to the development of
service marketing (Palmer, 1994; Zeithaml & Bitner, 1996). However Wyckham et
al., (1975) argued that the differences between services and products are not sufficient
to explain the different marketing needs of services. They argued that in the case of
some products, such as tropical fruits, it may be difficult to ensure consistency of
product quality therefore heterogeneity may be present. However the cause of the
inconsistent quality in tropical fruit may not be the same as the cause in services (the
personnel/consumer impact). According to Palmer (1994) the usefulness of the
identified service characteristics is in recognising the nature of services. However
Gronroos (2000) argues that inseparability of services creates the need for a different
approach to services marketing. Gronroos (2000) states that since product
consumption or outcome consumption, where customers consume the outcome of
production – the product, has a gap between production and consumption marketing is
needed to bridge the gap. However in service consumption or process consumption,
where the customer consumes the process of production and the process of production
itself is the most important part of the service, since the outcome of the process
(arriving at a destination, or withdrawing some money form the bank) is taken for
granted, or cannot be differentiated from other service providers, or cannot be
evaluated by the customer, there is no gap between production and consumption so
marketing needs to take a different role (Gronroos, 2000).
The differences between approaches to the marketing of physical goods and the
marketing of services can be illustrated using the marketing triangles as developed by
Kotler (1994).
13

Product Marketing Triangle (Figure 2) Marketing/sales staff
Firm
Enabling Promises Giving promises Continuous External marketing product Sales development Keeping promises
Product Market
Product features Source: Adapted from Kotler, P. (1994) Marketing Management: Analysis, Planning, Implementation and Control,
p470. In the product marketing triangle above (figure 2) the sides of the triangle represent
enabling promises, giving promises and keeping promises. Physical products are the
outcome of various resources, people, materials, technology, knowledge and
information being managed to include features that consumers in the target market
require (Kotler, 1994). This is a closed process that the customer has no part in and
customers are therefore seen as anonymous individuals. It is the task of marketing to
discover what features the market wants and to give promises about the feature to the
market (Kotler, 1994). Promises are fulfilled through product features as discovered
by the marketing. Promises are given via mass marketing and sales and enabled
through continuous product development (Kotler, 1994). However in the service
marketing triangle (figure 3) the firm has to be more flexible as a result of the
consumer not being aware of what it is he wants until he is participating in the service
process (Gronroos, 2000). Also since services are intangible and inseparable it is not
possible to pre-produce the product (Gronroos, 2000). Therefore “customer –
perceived valued follows from a successful and customer – orientated management of
resources relative to customer sacrifice, not from a pre-produced bundle of features.”
14

(Gronroos, 2000, p55). In the services marketing triangle promises are given by sales
and external marketing; promises are enabled by continuous resource development
and promises are kept by the effective management of resources and interactive
marketing (where the firm interacts with the consumer to deliver the service)
(Zeithaml & Bitner, 1996).
Services Marketing Triangle (Figure 3)
Firm Full time marketers and salespeople Enabling Promises Giving promises Continuous External marketing development Sales Internal Marketing Keeping promises Interactive marketing Part-time marketers and customer-orientated technologies and systems
Personnel Technology Knowledge Customer’s Time Customer
Customers
Source: Adapted from Kotler, P. (1994) Marketing Management: Analysis, Planning, Implementation and Control,
p470. Gronroos (2000b) believes that:
“The heart of services marketing is how the service (production) process and service
consumption process match each other, so that consumers and users perceive good
service quality and value…” (p15)
Therefore one of the aims of services marketing is to produce a service that
consumers perceive as being good quality. Lovelock (1999) concurs with this view
15

and believes that inadequate service quality leads to a competitive disadvantage.
Zeithaml & Bitner (1996) believe that one of the main challenges services marketers
face is how to improve service quality and Palmer (1994) believes that service quality
is one of the differentiating factors consumers use when evaluating services.
Service quality has become the focus of much research as it influences organisations
performance, costs, profitability, customer satisfaction and customer loyalty (Leonard
& Sasser, 1982; Cronin & Taylor, 1992; Gammie, 1992; Hallowell, 1996; Chang &
Chen, 1998; Gummesson, 1998; Lasser et al. 2000; Silvestro & Cross, 2000;
Newman, 2001; Sureshcandar et al., 2002; Guru, 2003). It has also been recognised
that services make up a large proportion of many of the industrialised countries
economies. For example in 1989, when service quality research was prolific, the
service sector accounted for 69% of the USA’s GDP, 60% of Germany’s GDP, 56%
of Japan’s GDP, 62% of the UK’s GDP, and 67% of France’s GDP (World Bank,
1991). The lack of research into service quality, since research had concentrated on
goods quality (Parasuraman et al., 1985; Gronroos, 1984), also prompted research
into the area.
Perceived service quality is defined as: “global judgment, or attitude, relating to the
superiority of the service” (Parasuraman et al., 1988, p16). Quality is defined as:
“consistently meeting or exceeding customer’s expectations” [of the service]
(Creedon, 1988; Lewis, 1989; Moore, 1987). Perceived service quality has also been
defined as: “the degree and direction of discrepancy between consumer’s perceptions
and expectations” [of a service] (Parasuraman et al., 1988, p17). Although
perceptions are never explicitly defined by Parasuraman et al., (1988) Teas (1993)
16

paraphrases Parasuraman et al., (1988) by defining perceptions as: “consumer’s
beliefs concerning the service received” (p18). Expectations are defined as: “desires
or wants of consumers, i.e., what they feel a service should offer rather than would
offer” (Parasuraman et al., 1988, p17). It is important to recognise that service quality
is not objective; it is defined by what customers want (Webster & Hung, 1994).
Since it has been recognised that service quality is an important element of services
marketing (Blackiston, 1988; Cound, 1988; Cravens, 1988; Gronroos, 2000;
Langevin, 1988; Lovelock, 1999; Palmer, 1994; Sherden, 1988; Zeithaml & Bitner,
1996) a number of service quality models have been developed. One of the first to be
developed was the technical and functional quality model (Gronroos, 1982). Based on
consumer behaviour literature and the effects of expectations of goods performance
on post – consumption evaluations (Anderson, 1973; Cardozo, 1965, Cohen &
Goldberg, 1969; Lewin et al., 1944; Oliver, 1977; Olshavsky & Miller, 1972)
Gronroos (1982) developed the idea that perceived service quality was the result of
consumers evaluation of what they expected to receive from the service compared to
their perceptions of what they did receive (a disconfirmation paradigm). Gronroos
(1982) stated that because this has been found to be the case in consumer behaviour
(Oliver, 1977; Hansen, 1972) it must apply to services also. This is known as
perceived service quality.
Swan and Combs (1976), in research into perceived product performance, stated that
there are two dimensions to perceived performance: instrumental and expressive
performance. Instrumental performance relates to the technical dimension of a
product, for example the picture a television provides, and expressive performance
17

relates to the psychological level of performance (Swan & Combs, 1976). Gronroos
(1982) argues that these sub – processes can be applied to services marketing as
instrumental performance (renamed technical quality for services) corresponds with
the out come of the service, arriving at a destination after using a train service or
receiving some money from an ATM after a bank has stored it, and expressive
performance (renamed functional quality for services) corresponds with the process of
reaching the outcome, the conditions of the train journey or the usability of the ATM.
Gronroos (1982) also stated that the image of the firm will influence consumer
expectations. Image is built up by the technical and functional quality of a firm’s
service (Gronroos, 1982).
However the most important part of Gronroos’ (1982) model is the perceived service
quality approach, which is based on a disconfirmation paradigm. According to
Parasuraman et al. (1985) managers of service firms and researchers (Churchill &
Surprenant, 1982; Lehtinen & Lehtinen, 1982; Lewis & Booms, 1983; Sasser et al.,
1978; Smith & Houston, 1982) agree that service quality is based on a comparison of
expectations and perceptions of a service. This has become the predominant approach
to service quality research (Gronroos, 2000) and is the foundation of the SERVQUAL
instrument (Parasuraman et al., 1988), which has been extensively used in many
settings (Asubonteng et al., 1996; Buttle, 1994; Lovelock et al.1999)
Parasuraman et al. (1985) developed the Gap model of service quality using the works
of Sasser et al. (1978), Gronroos (1982) and Lehtinen & Lehtinen (1982) and from a
qualitative research study that both defined service quality and identified the
dimensions that consumers use to evaluate the perceived service quality (Parasuraman
18

et al., 1985, 1988). Parasuraman et al. (1985) identified five gaps, which they state
can be major challenges to the services marketer. The gaps are consumer expectations
– management perceptions of consumer expectations (gap 1), management
perceptions of consumer expectations – service quality specification (gap 2), service
quality specification – service delivery (gap 3), service delivery – external
communications (gap 4) and expected service – perceived service (gap 5)
(Parasuraman et al., 1985). They believe that perceived service quality: “depends on
the size and direction of gap 5” (Parasuraman et al., 1985, p46) and that that depends
on the tendencies of the other four gaps so that: “gap 5 = f (gap 1, gap 2, gap 3,
gap4)” (Parasuraman et al., 1985, p46).
Parasuraman et al., (1985) also identified ten dimensions that consumers employ
when developing expectations and perceptions of services, which can be used across a
broad range of services. The dimensions were reliability, responsiveness, competence,
access, courtesy, communication, credibility, security, understanding, and tangibles
(see appendix 3 for definitions and examples) (Parasuraman et al., 1985). However
the dimensions were collapsed into five: tangibles, reliability, responsiveness,
assurance and empathy (see appendix 4 for definitions) (Parasuraman et al., 1988).
The last two dimensions were incorporated to represent seven of the original items
(communication, credibility, security, competence, courtesy, understanding/ knowing
customers, and access) that were not distinct after scale purification (Parasuraman et
al., 1988).
However Parasuraman et al (1988) were most interested in gap 5, perceived service
minus expected service, and in 1988 developed SERVQUAL. SERVQUAL contained
19

two sections each having 22 items (statements) that consumers would agree or
disagree with to varying levels via the use of a seven point likert scale (Parasuraman
et al. 1988). The first section of the section was intended to measure consumers’
expectations of a service; the second measured consumers’ perceptions of a service.
These individual scores for expectations and perceptions would be subtracted from
each other to determine the gap score (Parasuraman et al. 1988).
In 1991 Parasuraman et al. developed SERVQUAL further in response to criticism
most notably from Carman (1990). The original SERVQUAL items were altered so
that they would not ask for normative consumer expectations (what customers
expected from a service they had consumed) but would ask for consumer expectations
of an “excellent service” (p422). Parasuraman et al. (1991) believed this would reduce
unrealistic expectation scores, overall means of 6.22 in their study of a telephone
company, which had been present when the word “should” (p422) had occurred in the
original expectations items. They also changed some of the wording for the
perceptions items to make them parallel to the expectations items (Parasuraman et al.,
1991). Parasuraman et al. (1991) changed negatively worded items to positively
worded items as they were confusing to respondents, since the standard deviation was
higher (2.07) (p442) than the positive items (0.77), were considered “awkward and
not as meaningful as the positively worded items” (p422) by managers who reviewed
them and had lower reliability coefficients (Cronbach’s alphas). Two original items,
one under tangibles and one under assurance, were replaced with new items to reduce
confusion as recommended by managers who reviewed the items (Parasuraman et al.,
1991).
20

However according to Smith (1995) “such ad hoc procedures for amending the
original SERVQUAL instrument questions the utility of the thorough and detailed
process … as the basis for development” (p259) when considering the extensive
testing and piloting undertaken during the development of the original SERVQUAL
items. According to Morrison Coulthard (2004) many replications of the study have
failed to confirm the validity and application of SERVQUAL. Although Smith (1995)
comments that this may be the result of the failure to replicate the methodology of
Parasuraman et al. (1991). As suggested by Parasuraman et al. (1991) most
researchers adapt the instrument to make it relevant to the service they are studying
(Morrison Coulthard, 2004). However Babakus and Boller (1992), Babakus and
Mangold (1992), Bowers et al, (1994), Carman, (1990), Cronin and Taylor (1992),
Finn and Lamb (1991), Headley and Miller (1993), Lytle and Mokwa (1992),
McAlexander et al. (1994), O’Connor et al. (1993) and Taylor and Cronin (1994)
have found similar Cronbach’s alpha reliability coefficients for the five SERVQUAL
dimensions confirming the reliability of the scale items that make up the dimensions.
According to Asubonteng et al. (1996), Brown et al. (1993) and Sureschandar et al.
(2001) the 22 SERVQUAL items are good predictors of service quality.
However SERVQUAL has been subjected to a number of conceptual and
methodological criticisms (Buttle, 1996; Gronroos, 2000; Lovelock et al.1999;
Morrison Coulthard, 2004). As discussed earlier SERVQUAL (Parasuraman et al.,
1988, 1991) is based on the concept of perceived service quality, which is based on a
disconfirmation paradigm. Cronin and Taylor (1992) concur with Carman (1990) that
there is little theoretical or empirical evidence to support this and suggest that an
attitudinal paradigm should be adopted. They argue that while service quality has
21
been defined as an attitude it has been measured using a disconfirmation paradigm,
which was intended to measure customer satisfaction and is therefore inconsistent
(Cronin and Taylor, 1992, 1994).
Cronin and Taylor (1992) also suggest that there is evidence (such as Bolton & Drew,
1991; Churchill & Surprenant, 1982; Mazis et al. 1975; Woodruff et al., 1983) that a
performance based measure of service quality would be more appropriate, meaning
that only perceptions should be measured. They developed the SERVPERF
instrument to do this. Avkiran (1999), Boulding et al. (1993), Brady et al. (2002)
Hahm et al. (1997), Lee et al. (2000) and McAlexander et al. (1994), have confirmed
the superiority of perception only measures of service quality. However it has been
argued that when measuring perceptions alone respondents may consider their
expectations in answering anyway (Lolosa et al., 1998).
SERVQUAL has also been criticised for focusing on process or functional quality, as
identified by Gronroos (1982). Cronin and Taylor (1992), Mangold and Babakus
(1991) and Richard and Allaway (1993) have argued that that outcome quality or
technical quality (Gronroos, 1982) is missing from SERVQUAL. However Higgins et
al. (1991) argued that technical quality is measured in the reliability, competence and
assurance dimensions. Sureschander et al. (2001) state that SERVQUAL lacks crucial
elements of service quality such as the core service, standardisation of service quality
and the image that a service firm may seek to create. Brady et al. (2002) believes that
measures of service quality should include the value of service and uncontrollable
factors such as emotions. This may be evidence to suggest that SERVQUAL
encapsulates only some aspects of service quality (Morison Coulthard, 2004).
22

Another criticism of SERVQUAL is that there is little evidence that consumers use
perceptions minus expectations to asses service quality (Buttle, 1996). Babakus and
Boller (1992) found that perceptions scores were the dominant contributor to the gap
score as there is a tendency for consumers to rate expectations high. It could be seen
as obvious that consumers will rate expectations as high since they are unlikely to
desire poor service quality. Iacobucci et al. (1994) believe that consumers’
expectations may not be clearly enough formed to be used as criteria for evaluation of
service quality. Teas (1993, 1994) has examined the meaning of the gaps. The same
gap score, for example –1, can be obtained in six different ways. Does each gap
constitute an equal perceived service quality? (Teas, 1993, 1994). Teas (1993, 1994)
also states that a high perceptions score (4, 5, 6 or 7) in a component that is not
considered essential, where expectations scores are 1, 2 or 3, creates a situation where
a company is rated highly for a service offering that is not important. Smith (1995)
supports this position.
The use of Likert scales in SERVQUAL has also been criticised (Morrison Coulthard,
2004). Molenaar (1982) reviewed the number of scale points used and concluded that
between 5 and 9 scale points should be used. Krosnick and Fabrigar (1997) and
Preston and Colman (2000) concur with this however Danaher and Haddrell (1996),
Brown et al. (1993) and Brady et al. (2002) believe that five point scales are superior
and Babakus and Mangold (1992b) advocate the use of a five point scale as this
reduces respondent frustration, increases response rate and response quality. The
labelling, strongly agree/disagree, of Likert scales has also been commented on. Smith
(1992) stated that points that are labelled in SERVQUAL, points 1 and 7, are likely to
23

be overused and Krosnick and Fabrigar (1997) believe labelling all points may reduce
bias. However Andrews (1984) concludes that labelling all points could result in
poorer data than labelling just the end points.
While there are many criticisms of SERVQUAL it is important to remember that has
been, and continues to be, one of the most widely used and important, models of
service quality and measurement (Asubonteng et al., 1996; Brown et al., 1993; Buttle,
1996; Grapentine, 1998; Lovelock et al., 1999). SERVQUAL (Parasuraman et al.
1988, 1991) has been applied to many industries including health care (Babakus and
Mangold, 1992; Bebko and Garg, 1995; Bowers et al., 1994; Clow et al., 1995; Curry
and Sinclair, 2002; Kilbourne et al., 2004).
When researching elderly consumer’s evaluation of the service quality of a day care
centre using a SERVQUAL questionnaire, Smith (1993) found elderly respondents
did not tick a box if they disagree with a statement; where verbal labels appeared on
the Likert scale respondents were unsure of its meaning and therefore did not answer;
elderly respondents had a tendency to rate service elements highly since they were
reliant on the service provider and because they have been used to poor conditions in
the past and therefore have lower expectations than other consumer groups; the
elderly have difficulty in answering questionnaires as a result of poor eyesight,
arthritis, other health related illnesses, shorter attention spans, confusion, a tendency
to become emotional and due to learning disabilities resulting in an inability to read.
To overcome these issues Smith (1993) suggested the use of structured interviews and
observation. However Hoinville (1983) believes that unstructured interviews should
24

be used, as elderly respondents are likely to have reduced concentration and
comprehension, although this will increase interviewer bias. Smith (1993) commented
on the problems of observation stating that it may be difficult to interpret behaviour,
especially when respondents may be suffering from physical and mental health
problems, although observation has advantages in addressing this consumer group as
they are more willing to discuss issues with “outsiders” (p18).
Smith (1993) also highlights the issue of friends and relatives who may be
gatekeepers (Hoinville, 1983) that restrict access to respondents by for example
answering on their behalf.
25

Hypotheses
• Respondent Home Care service users will rate Home Care’s service quality
highly.
• There will be no difference between male and female respondents in their
judgement of Home Care’s service quality in any dimension.
• The length of time respondent Home Care service users have used the service
for will not affect their judgement of Home Care’s service quality.
• Home Care employees will rate their service delivery highly.
Aim
• The main aim of this dissertation is to measure the level of service quality
provided by Home Care.
Objectives
• The dissertation will also evaluate possible reasons for Home Care’s
over/under performance of their service.
• The dissertation will examine links between classification data and response
data to further understand the level of service quality expected by different
groups based on geographical location and demographics of service users.
• The dissertation will also make recommendations as to possible areas for
improvement within Home Care.
• The dissertation will also make recommendations as to how Home Care can
improve its level of service quality.
26

Methodology The research took a descriptive path initially in order ‘to portray an accurate profile of
persons, events or situations’ (Robinson, 2002, p59) in terms of the level of service
quality delivered by Home Care. The research then became explanatory as it
attempted to identify the reasons for the levels of service quality being provided and
to identify relationships between variables (Saunders et al., 2007) in order to evaluate
the hypotheses. In order to meet the purposes of description and explanation the
research employed a survey strategy. This is deemed the most suitable approach for
descriptive and explanatory research, as it produced quantitative data that can be
analysed quantitatively using descriptive and inferential statistics, which can be
analysed to evaluate possible reasons for relationships between variables (Saunders et
al., 2007). Of the possible data collection methods used for a survey strategy,
structured observation, structured interviews, and questionnaires, observation is not
possible due to limited access granted for the study, it may have been time consuming
to carry out, financially expensive and require many ‘observers’, which are not
available. Therefore a structured interview and self-administered, delivery and
collection questionnaires were used. However in order to gain a full understanding of
Home Care a semi – structured interview was carried out with the manager of the
organisation.
This strategy is also convergent with the SERVQUAL model (Parasuraman et al.,
1988), which prescribes a questionnaire for measuring the consumers perceived and
expected service quality (gap 5). For the purpose of this research the questionnaire has
been adapted in order to increase reliability and validity, since in its present form
respondents may not have understood it (Smith, 1993). As Parasuraman et al.’s
27

(1988) questionnaire is considered valid and reliable (Babakus and Boller, 1992;
Babakus and Mangold, 1992; Bowers et al., 1994; Carman, 1990; Cronin and Taylor,
1992; Finn and Lamb, 1991; Headley and Miller, 1993; Lytle and Mokwa, 1992;
McAlexander et al., 1994; O’Connor et al., 1994; Taylor and Cronin, 1994), and as
they recommend that it is not altered radically, the main changes have been to the
language used, which has been simplified, in order to make it easy to understand. In
Parasuraman et al.’s (1988, 1991) original questionnaire they use a seven point Likert
scale, however this may confuse respondents (Smith, 1993). Therefore respondents
have been asked to state how strongly they agree or disagree with statements relating
to how they feel about the service provided and what they think the service should be
providing, by rating their opinions on a five point Likert scale (Danaher and Haddrell,
1996; Brown et al. 1993; Brady et al. 2002). This questionnaire has been pilot tested
by asking the manager and senior Home Care team for their evaluation of suitability
for Home Care service users. The questionnaire has also been given to people who
have received care from other providers, in order to test reliability and validity.
However Parasuraman et al. (1985) do not suggest methods for evaluating the other
service gaps (gaps 1, 2, 3 and 4) therefore it is necessary to consider methods for
evaluating of these gaps. Gap 1 measures ‘the difference between consumer
expectations and management perceptions of those expectations’ Parasuraman et al.
(1985, p44). Consumer expectations of Home Care’s service have been measured as
detailed above. Manager’s perceptions of consumer’s expectations of Home Care’s
service have been measured via a structured interview. This has been based around
the same SERVQUAL dimensions as those used for the consumers of Home Care’s
service – Tangibles, Reliability, Responsiveness, Assurance and Empathy
28

(Parasuraman et al. 1988, 1991). Statements in each service quality perceptual
dimension have been based around the same individual items, such as the quality of
equipment (tangibles), in order that the results are comparable. The manager has been
asked to rate what she believes consumers expect from Home Care’s service by rating
how strongly she agrees or disagrees with the statements provided on a five point
Likert scale. The interview questions were pilot tested by asking the manager to
evaluate the questions for suitability.
By using a structured interview there is high confidence that the correct person will
respond, the interviewer can ensure that statements are fully understood, therefore
increasing validity. However using a structured interview may lead to contamination
or distortion of the respondents answer by interviewer bias, where the way statements
are read or the non – verbal behaviour of the interviewer leads to interviewees
responding in a bias way (Saunders et al., 2007). However since this is a structured
interviews are standardised this will be kept to a minimum.
The results from the structured interview with the manager of Home Care have also
been compared to the service quality specification used by Home Care to measure gap
2 – the difference ‘between management perceptions of consumer expectations and
the firm’s service quality specification’ (Parasuraman et al., 1985). The service
specification has been analysed and evaluated under each of the SERVQUAL
dimensions.
The service quality specification, or quality standards (West Sussex County Council,
2003), has also been compared to the employees (care staff) perception of the service
29

they deliver in order to measure gap 3 ‘the gap between service quality specification
and actual service delivered’ Parasuraman et al. (1985). Where similarities exist
between the statements made in Home Care’s quality standards and statements used to
measure employees perception of the service quality (in the questionnaire) the
employees perception of service quality has been taken as representative of the level
of achievement of Home Care’s quality standards. The employee’s perception of the
service delivered has been ascertained through a delivery and collection
questionnaire, where respondents have been asked to rate how strongly they agree or
disagree with statements relating to service quality, on a five point Likert scale, in
terms of the five SERVQUAL dimensions. This has been pilot tested by asking the
senior Home Care team and manager to evaluate the suitability of the questions and
suggestions for any changes that may be necessary.
Gap 4 ‘the gap between actual service delivery and external communications about
the service’ (Parasuraman et al., 1985) has not been measured as Home Care service
users are referred to Home Care via social workers and Home Care does not pursue
external marketing activities, therefore this gap does not apply to Home Care.
The sampling method was census for the questionnaire to Home Care service users
and 240 questionnaires were sent out via Home Care carers; 11.25% responded. The
sample frame for questionnaires to Home Care carers was all those people who
worked for Home Care. The sampling method for this group was also census and 160
questionnaires were sent out in employees schedules of work with an accompanying
letter to explain what to do with them. The response rate for this group was 12.5%.
Quantitative techniques used were Chi Square tests to asses the null hypotheses –
30

there will be no difference between male and female respondents in their judgement
of Home Care’s service quality in any dimension and the length of time respondent
Home Care service users have used the service for will not affect their judgement of
Home Carers service quality.
Results
Demographics of Respondent Service Users
The age range of respondents was from 36 to 76+ years with one respondent stating,
without being asked, their age to be 95 years. Of the 27 respondent Home Care
service users 4% (or 1 respondent) were between 36 – 45 years old, 4% (1
respondent) were between 46 – 55 years old, 11% (3 respondents) were between 56 –
65 years old, 22% (6 respondents) were between 66 – 75 years old and 59% (16
respondents) were 76 years old plus (see appendix 4). 74% (20 respondents) of
respondent Home Care service users were females and 26% (7 respondents) were
males (see appendix 5). 9 respondent service users (33%) lived in Crawley, 4 (14.8%)
lived in Horsham, 3 (11%) lived in Billingshurst, 3 (11%) lived in Hassocks, 2 (7%)
lived in East Grinstead and 1 (3.7%) lived in each of the following: Southwater,
Steyning, Turners Hill, Crawley Down, Henfield and Hurstpierpoint (see appendix 6).
Respondent’s length of service use ranged from 2 weeks to 42 years. 30% (8
respondents) of respondents had used Home Care’s service for less than 1 year, 15%
(4 respondents) for 6 months to 1 year, 22% (6 respondents) for 1 year and 1 month to
2 years, 15% for 2 years 1 month to 6 years, 7% (2 respondents) for 6 years 1 month
to 12 years, 4% (1 respondent) for 12 years 1 month to 18 years, 0% for 18 years 1
month to 24 years and 7% (2 respondents) for 24 years plus (see appendix 7).
31

Demographics of Respondent Home Care Employees
The age range of respondent Home Care employees was from 25 to 75 years old. 5%
(1 respondent) was between 25 and 35 years old, 20% (4 respondents) were aged
between 36 and 45 years, 20% (4 respondents) were aged between 46 and 55 years,
45% (9 respondents) were aged between 56 and 65 years and 10% (2 respondents
were aged between 66 and 75 years (see appendix 8). All respondent employees were
female. 5% (1 respondent) of respondent employees were full time employees and
95% (19) were part time (see appendix 9). 35% (7 respondents) of respondent
employees were relief (employees that work when permanent staff are away due to
sickness of holiday), and 65% (13 respondents) were permanent (having fixed
contracted hours of work) (see appendix 10). The mean average years employees have
worked for Home Care was 14.85, the median was 15.25 and the mode was 31. The
manager was a female aged 46 – 55, working full time for approximately 3.5 years.
Gap 5 – Perceived Service Minus Expected Service
As discussed in the literature review SERVQUAL measures service quality by
subtracting the consumer’s expectations of an excellent service from their perceived
service (both rated by the consumer on a five point Likert scale) to produce a gap
score (Parasuraman et al., 1988; 1991). Appendix 11 shows graphically item scores.
The mean average gap score for all items measured (see appendix 12 &13 for items)
was –0.30 (or –6.35%) indicating that respondents felt the service quality offered by
Home Care was slightly below what they would expect from an excellent care service.
32

This means that the hypothesis that respondent Home Care service users will rate
Home Care’s service quality highly has been disproved.
When breaking the overall service quality down into the individual dimensions,
tangibility, reliability, responsiveness, assurance and empathy (Parasuraman et al.,
1988; 1991) (see appendix 14 for gap scores for each dimension), responsiveness had
the largest negative gap, -0.44, indicating that Home Care service users felt Home
Care employees were less willing to help them and provide a less prompt service than
an excellent care service would. However within the responsiveness dimension item
10 “staff of an excellent care service will tell service users exactly when they will
perform the service” had the largest negative gap of –0.64 indicating that service users
felt this aspect of the service was below their expectations of an excellent care
service.
The tangible dimension had the next largest negative gap of the 5 dimensions, -0.38,
indicating that respondent Home Care service users felt the quality of the physical
facilities, equipment, and appearance of personnel (Parasuraman et al., 1988; 1991)
was below what they expected from an excellent care service. However part of the
tangibles dimension is item 3 “staff will be of neat appearance”. This item had a
positive gap score of 0.07 indicating that respondents felt Home Care were exceeding
their expectations of an excellent care service. This may lead to the conclusion that
the other areas addressed by the tangibles dimension - that an excellent care service
has modern effective equipment, which is not out of place in their homes and satisfies
service users needs- are considered to be below the service users expectations of an
33

excellent care service. These items had negative gaps of –0.64, -0.32 and -0.64
respectively.
Reliability had the third largest negative gap of the dimensions, -0.37; meaning that
respondent service users felt that Home Care’s “ability to perform the promised
service dependably and accurately” (Parasuraman et al., 1988; 1991) below their
expectations of an excellent care service. However within the reliability dimension
item 9 “an excellent care service will insist on error free records” had the largest
negative gap score of all 22 items at –0.68, indicating that respondent service users
felt that Home Care’s service quality was below their expectations of an excellent
care service in this item more so than any other.
Empathy had the fourth largest negative gap score of –0.22. This shows that
respondent service users felt Home Care’s service quality was below their
expectations of an excellent care service, however to a lesser degree than the
dimension mentioned above. Of the 5 items incorporated in this dimension item 19
“an excellent care service will provide its services at a time convenient to service
users” had the largest negative gap of –0.64 indicating that respondent service users
felt this was an area Home Care could improve on.
Assurance scored the lowest negative gap score of –0.08 indicating that respondent
service users felt this was the area Home Care was offering service quality close to
what they would expect from an excellent care service. Within in this dimension the
largest negative gap score was –0.25 for item 15 “service users of an excellent care
service will feel safe in their dealings with staff” showing that respondent service
34

users felt Home Care’s service quality was below their expectations of an excellent
care service. However item 16 “staff of an excellent care service are polite to service
users” and item 17 “staff of an excellent care service will be able to answer questions
from service users” had positive gap scores of 0.04 and 0.07 respectively. This shows
that respondent service users felt Home Care was offering service quality that exceeds
their expectations of an excellent care service.
Chi Square Tests
The null hypothesis that there will be no difference between male and female
respondents in their judgment of Home Care’s service quality in any of the
SERVQUAL dimensions was tested using a Chi Square test (x2). Chi Square tests
were carried out for each dimension and for the overall service quality (see appendix
15). When testing for a relationship between gender and the tangible dimension x2 =
0.021560081. With a degree of freedom of 1 the critical value was 1.32 at a 75%
probability of a relationship meaning that the null hypothesis could be accepted as x2
was less than this meaning that there was no relationship between the variables (see
appendix 15). When testing for a relationship between gender and the reliability
dimension x2 = 0.02 and the degree of freedom was 1 meaning the critical value was
1.32 at 75% probability of a relationship. Since x2 = 0.02, and is therefore less than
the critical value of 1.32 the null hypothesis could be accepted as there is no
relationship between the variables (see appendix 15 for workings). When testing for a
relationship between gender and the responsiveness dimension x2 = 0.00480167. This
is less than the critical value, at 1 degree of freedom, of 1.32 at 75% probability of a
relationship indicating that there was no relationship between the variables and the
35

null hypothesis could be accepted. x2 = 0.07076587 when testing for a relationship
between gender and the assurance dimension. The degree of freedom was 1 resulting
in a critical value of 1.32 at 75% probability of a relationship. As x2 = 0.03521474 the
null hypothesis could be accepted since x2 was less than 1.32 indicating that there was
no relationship. x2 = 0.03521474 when testing for a relationship between gender and
the empathy dimension. The degree of freedom was 1 resulting in a critical value of
1.32 at 75% probability of a relationship. As x2 = 0.03521474 the null hypothesis
could be accepted since this is less than the critical value of 1.32 meaning that a
relationship was unlikely to exist.
The Chi Square test result for a relationship between perceived service quality and
gender was x2 = 0.31532774. The degree of freedom was 1 meaning a critical value of
1.32 at 75% probability of a relationship. Since x2 = 0.31532774 below the critical
value, 1.32, the null hypothesis was accepted as there was no relationship present.
A second Chi Square test was carried out to test the hypothesis that the length of time
respondent Home Care service users have used the service for will not affect their
judgement of Home Care’s service quality. The Chi Square test result (see appendix
16) for this was x2 = 0.162665419. The degree of freedom was 6 therefore the critical
value was 7.84 at 75% probability of a relationship. Since x2 = 0.162665419, less than
the critical value of 7.84 it is unlikely that a relationship exists between the variables.
Therefore the null hypothesis could be accepted.
36
Gap 3 – Service Quality Specification – Service Delivery Gap
Home Care’s service quality specification (Parasuraman, 1985) or Quality Standards
(West Sussex County Council, 2003) are a set of statements describing the intended
outcome of the service in different areas of operation. There are 27 standards in total,
which can be seen in appendix 17 however only 12 of them corresponded with the
items given in the questionnaires used to measure employee perceptions of service
quality (see appendix 18). The mean average of the employees’ perceptions of service
quality that corresponded with Home Care’s Quality Standards was 4.656 (out of a
possible 5). If Home Care’s employees believed they were delivering a service that
met their Quality Standards they would be expected to perceive Home Care’s service
quality as high, therefore scoring it as 5 on average (the highest possible score).
Therefore there was a gap between Quality Standards and service delivery (gap 3).
The lowest employee perception of service quality mean average score was 4 for
Quality Standard 22 “service user receive a consistent, well managed and planned
service”. This was related to items 7, 8 and 10 (see appendix 19). Although employee
perceptions of service quality were relatively low for these items (see appendix 18 &
20), items 8 and 10 were rated, on average, 4, indicating that employees felt this was
an area of the service that was not being performed well. The highest employee
perception of service quality scores related to Quality Standards 14, 15, 25 and 27,
which all received scores of 4.95 (see appendix 18); higher than the average by 0.29
indicating that employees felt service quality is high in these areas.
37

Gap 2 – Manager Perceptions of Consumer Expectations – Service Specification
Gap 2 refers to situations where managers understand consumer’s expectations but
“the perceived means to deliver to expectations… do not” (Parasuraman et al., 1985,
p45). In applying this to Home Care it was expected that managers perceptions of
consumer’s expectations would match or exceed consumers actual expectations but
consumers expectations would still not be met or exceeded resulting in a negative gap
score. Appendix 21 shows the difference between the manager’s perceptions of
service users expectations, service users expectations and gap scores derived from
service users perceptions of Home Care’s service minus their expectations of an
excellent service. The manager’s perceptions of service users expectations exceed
service users actual expectations for items 1, 3, 4, 15, 20 and 21. Of these item three
was the only one where service users gap scores were positive, 0.07, indicating that
Home Care were exceeding service users expectations of an excellent service. Items 1
and 4 had gap scores of –0.64 indicating that service users felt Home Care were not
meeting their expectations of an excellent care service; item 15 had a gap score of –
0.25 indicating that service users felt Home Care were offering service quality close
to their expectations; item 20 had a gap score of –0.04 indicating that Home Care
were very close to meeting their expectations and item 21 had a gap score of –0.07
also indicating that service users felt Home Care were offering a service close to their
expectations. Therefore the main areas were Home Care’s manager understands
service users expectations but cannot deliver to them are items 1, which relates to the
use of modern and effective equipment, and 4, which relates to the equipment
supplied satisfying service user needs (both relating to the tangible dimension). This
38

may correspond with the lack of acknowledgment of tangibles items in Home Care’s
Quality Standards.
Gap 1 – Consumers Expectations – Manager Perceptions of Consumer Expectations
As discussed in the literature review Parasuraman et al. (1985) stated that managers
may not always understand what constitutes high service quality to consumers, which
will have an impact on service quality as seen by consumers. Appendix ** shows
Home Care’s managers perception of consumers expectation and consumers
expectations. The first thing to note about this graph is that Home Care service users
clearly expected more from “an excellent care service” than the manager perceived
they would indicating that Parasuraman et al.’s (1985) hypothesis was correct. The
mean average for service users expectations was 4.72 however the mean average of
the manager’s perception of service users expectations was 4.23, which is 10.38%
lower. Therefore this is likely to have a negative impact on Home Care’s service
quality.
Conclusions and Recommendations
In conclusion most respondents were between 66 and 76 +, 81%, with 22% being
between 66 and 75 years and 59% being 76+ years, indicating that the majority of
service users fell into the older age ranges. 74% of respondents were females and
although respondents came from a wide geographical spread, 33% lived in Crawley.
67% had used Home Care for up to 2 years, with the 30% having used Home Care for
less than 1 year. 45% of respondent Home Care employees were aged between 55 and
66 years and 10% were aged 66 to 75 years indicating that the majority of employees
39

fell into the older age ranges. All respondent employees were female, 95% worked
part time and on average (mean) employees had worked for Home Care for 14.85
years indicating that employees tend to remain employed by Home Care for some
time.
The SERVQUAL analysis of service users perception – expectation gap scores
revealed that service users felt that the level of service quality delivered by Home
Care was lower, by –0.30 or –6.35%, than they would expect from an “excellent care
service”, therefore disproving the hypothesis that Home Care’s service users will rate
Home Care’s service quality highly. When breaking the overall service quality down
into individual dimensions responsiveness was had the largest negative gap score, -
0.44 indicating that Home Care should improve service quality by improving
communication with service users about their service, giving a prompt service, being
more willing to help service users and having more time with service users. When
taking into account the individual item scores within the responsiveness Home Care
should pay particular attention to improving communication with service user about
when they will receive their service as this item had the lowest negative gap score of –
0.64.
The tangible dimension had the next largest negative gap of the 5 dimensions at -0.38.
When examining the individual item scores Home Care should concentrate on
improving equipment so that it is modern, effective and meets the needs of service
users (these items, 1 and 4, received negative gap scores of –0.64).
40

The next largest negative gap score was –0.37 for reliability. The specific areas Home
care should concentrate on in this dimension are improving their record keeping,
which had the largest negative gap of all items at –0.68, and performing the service at
the time they promise to do so, which had a negative gap score of –0.61.
Empathy had a gap score of –0.22 indicating that Home Care was closer to service
users expectations in this dimension. However Home Care could improve this area by
providing service at a time convenient to service users; this item had a negative gap
score of –0.64. However this may not be possible due to time constraints and when
considering that it is likely that all service users might expect to receive their service
at the same time the human resource are probably not available.
Home Care have performed most closely to what service users expect in the assurance
dimension, which had a gap score of -0.08. Within this dimension Home Care should
improve service quality by making service users feel safer when dealing with staff;
this item had a gap score of –0.25.
Chi Square test results confirmed the null hypotheses that there would be no
difference between male and female respondents in their judgement of Home Care’s
service quality in any dimension and that the length of time respondent Home Care
service users have used the service for will not affect their judgement of Home Care’s
service quality.
Analysis of gap 3, the service quality specification to service delivery gap, showed
that there is a gap between the service quality specification and service delivery. This
41
is because Home Care employees mean average score, for items that corresponded
with statements in Home Care’s Quality Standards, was 4.656 and (making the
assumption that) if employees perceived they were delivering the standards they
would have scored them as 5 out of 5. However although this may be a cause of
reduced service quality (Parasuraman et al., 1985) it may be difficult to improve due
to the variability of employee performance, which is characteristic of services because
of inseparability, and heterogeneity (Hoffman & Bateson, 2002; Lovelock et al.,
1999; Palmer, 1994; Zeithaml & Bitner, 1996).
Analysis of gap 2, the gap between manager perceptions of consumer expectations
and the service specification, revealed that there might be areas of service quality that
where the manager understands service users expectations but does not have the
means to deliver to them. The main area this applies to is tangibles, which is not
mentioned at all in Home Care’s Quality Standards, and in specific the provision of
modern effective equipment that meets the needs of service users.
Examination of gap 1, the gap between the manager’s perceptions of service users
expectations and service users expectations, shows that the manager perceived
consumers would expect less from an excellent care service than they did (since the
managers perception of consumers expectation was 4.23, out of 5, compared to
consumers expectations score of 4.72, out of 5, on average. This may result in reduced
service quality through a poorly designed service quality specification, meaning that
Home Care would be aiming to achieve service quality at a lower level than what is
expected by consumers. However if the Home Care manager recognises that
42

consumers have high expectations, she could alter the specifications and improve
service quality.
43

Bibliography
Anderson, A.E., (1973), Consumer Dissatisfaction: The Effect of Disconfirmed
Expectancy on Perceived Product Performance, Journal of Marketing Research,
February
Asubonteng, P., McCleary, K.J. and Swan, J.E., (1996), SERVQUAL Revisited: A
Critical Review of Service Quality, The Journal of Services Marketing, (10:6), p62 –
81.
Avkiran, N.K. (1999), Quality Customer Service Demands Human Contact,
International Journal of Bank Marketing, (17:2), p61 – 71.
Babakus, E. & Boller, G.W., (1992), An Empirical Assessment of the SERVQUAL
Scale, Journal of Business Research, (24) p253 – 268.
Babakus, E. & Mangold, G.W., (1992b), Adapting the SERVQUAL Scale to Hospital
Services: An Empirical Investigation, Health Services Research, (26:6) p767 – 786.
Bateson, J.E, (1989), Managing Services Marketing, London, Dryden Press.
Bebko, C.P. & Garg, R.K. (1995), Perceptions of Responsiveness in Service Delivery,
Journal of Hospital Marketing , (9:2), p35 – 45.
44

Blackiston, G. H. (1988), Service Industries: a Renaissance in Quality, Executive
Excellence, (5:9), p9 – 10.
Bolton, R.N. & Drew, J.H., (1991), A Longitudinal Analysis of the Impact of Services
Changes on Consumer Attitudes, Journal of Marketing, (55) January, p1 – 9.
Boulding, W., Kalra, A., Staelin, R. & Zeithaml, V.A. (1993), A Dynamic Process
Model of Service Quality: from Expectations to Behavioural Intentions, Journal of
Marketing Research, (30), p7 – 27.
Bowers, M.R., Swan, J.E. & Koehler, W.F., (1994), What Attributes Determine
Quality and Satisfaction with Health Care Delivery?, Health Care Management
Review, (19:4) p 49 – 55.
Brandy, M.K., Cronin, J.J. & Brand, R.R. (2002), Performance Only Measures of
Service Quality: A Replication and Extension, Journal of Business Research, (55),
p17 – 31.
Brown, T.J., Churchill, G.A. & Peter, J.P. (1993), Improving the Measurement of
Service Quality, Journal of Retailing, (69:1), p127 – 139.
Buttle, F. (1996), SERVQUAL: Review, Critique, Research Agenda, European
Journal of Marketing, (30:1), p8 – 32.
45

Cardozo, R.N., (1965), An Experimental Study of Consumer Effort, Expectations and
Satisfaction, Journal of Marketing Research, August
Carman, J.M., (1990), Consumer Perceptions of Service Quality: An Assessment of
the SERVQUAL Dimensions, Journal of Retailing, (66:1) p33 – 55.
Chang, T.Z. & Chen, S.J. (1998), Market Orientation, Service Quality and Business
Profitability: A Conceptual Model and Empirical Evidence, Journal of Services
Marketing, (12:4) p246 – 264.
Churchill, G.A. & Surprenant, C. (1982) An Investigation into the Determinants of
Consumer Satisfaction, Journal of Marketing Research, (19) November, p491 – 504.
Clow, K.E., Fischer, A.K. & O’Bryan, D. (1995), Patient Expectations of Dental
Services, Journal of Health Care Marketing, (15:3), p23 – 31.
Cohen, J. & Goldberg, M.E., (1969), The Effects of Brand Familiarity and
Performance upon Post-Decision Product Evaluation, American Marketing
Association’s Workshop on Experimental Research in Consumer Behaviour
Cound, D.M., (1988), What Corporate Executives Think About Quality: The Results
of the 1987 Gallup Survey, Quality Progress, (21:2), p20 – 23.
Cravens, D.W., (1988), The Marketing of Quality, Incentive, (162:11), p26 – 34.
46

Creedon, J. (1988), Inside Mat Life’s Growth Strategy, Journal of Business Strategy,
(9:1)
Cronin, J.J. & Taylor, S.A. (1992), Measuring Service Quality: A Re-examination and
Extension, Journal of Marketing, (56) p55 – 68.
Curry, A. & Sinclair, E. (2002), Assessing the Quality Of Physiotherapy Services
Using SERVQUAL, International Journal of Health Care Quality Assurance, (15:5),
p197 – 205.
Danaher, P.J. & Haddrell, V. (1996), A Comparison of Question Scales used for
Measuring Customer Satisfaction, International Journal of Service Industry
Management, (7:4), p6 – 28.
Finn, D.W. & Lamb, C.W., (1991), An Evaluation of the SERVQUAL Scale in a
Retail Setting, Advances in Consumer Research, (18).
Gammie, A. (1992), Stop at Nothing in Search of Quality, Human Resources, (5),
spring, p35 – 38.
Grapentine, T. (1998), The History and Future of Service Quality Assessment,
Marketing Research, (10:4), p4 – 21.
Ginzberg, E. & Vojta, G. (1981), The Service Sector of the U.S. Economy, Scientific
America, (244) March, p31 – 39.
47

Gronroos, C., (1982), Strategic Marketing in the Service Sector, Helsingfors: Swedish
School of economics and Business Administration.
Gronroos, C. (2000), Service Management and Marketing a Customer Relationship
Management Approach, Chichester, John Wiley & Sons, Ltd, p45 – 96.
Gronroos, C. (2000b), Service Reflections: Service Marketing Comes of Age. In
Swartz, T.A. & Iacobucci, D. (eds), Handbook of Services Marketing & Management,
Thousand Oaks, CA: Sage Publications, p15.
Gummesson, E. (1987), Lip Service – A Neglected Area in Services Marketing,
Journal of Services Marketing, (1), p22 (referring to an unidentified source).
Gummesson, E. (1998), Productivity, Quality and Relationship Marketing in Service
Operations, International Journal of Contemporary Hospitality Management, (10:1),
p4 – 15.
Guru, C. (2003), Tailoring E-Service Quality through CRM, Managing Service
Quality, (13:6), p20 – 531.
Hahm, J., Chu, W. & Yoon, J.W. (1997), A Strategic Approach To Customer
Satisfaction in the Telecommunications Service Market, Computers and Industrial
Engineering, (33:3), p825 – 828.
48

Hallowell, R. (1996), The Relationships of Customer Satisfaction, Customer Loyalty
and Profitability: An Empirical Study, International Journal of Service Industry
Management, (7:4), p27 – 42.
Hansen, F. (1972), Consumer Choice Behaviour: A Cognitive Theory, New York, The
Free Press, p172.
Headley, D.E. & Miller, S.J., (1993), Measuring the Service Quality and its
Relationships to Future Consumer Behaviour, Journal of Health Care Marketing,
(13:4) p32 – 41.
Higgins, L.F., Ferguson, J.M. & Winston, J.M. (1991), Understanding and Assessing
Service Quality in Health Maintenance Organisations, Health Marketing Quarterly,
(9), p5 – 20.
Hoffman, K.D. & Bateson, J.E.G., (2002), Essentials of Services Marketing Concepts
Strategies and Cases, Orlando, Hardcourt, p27 – 51.
Hoinville, G. (1983), Carrying out Surveys among the Elderly: Some Problems of
Sampling and Interviewing, Journal of the Market Research Society, (25:3), p223 –
237.
Iacobucci, D., Grayson, K.A. & Ostrom, A.L. (1994), The Calculus of Service Quality
and Consumer Satisfaction: Theoretical and Empirical Differentiation and Integration.
49

In Swartz, T.A., Bowen, D.E. & Brown, S.W. eds, Advances in Services Marketing
and Management, Greenwich, CT: JAI Press, p1 – 68.
Kilbourne, W.E., Duffy, J.A., Duffy, M. & Giarchi, G. (2004), The applicability of
SERVQUAL in Cross – National Measurements of Health – Care Quality, Journal of
Services Marketing, (18:7), p524 – 533.
Koepp, S. (1987), Pul-eeze! Will Somebody Help Me?, Time, (February 2), p28 – 34.
Kotler, P. & Armstrong, G. (1991), Principles of Marketing, Englewood Cliffs, NJ,
Prentice – Hall.
Kotler, P. (1994), Marketing Management: Analysis, Planning, Implementation and
Control, Englewood Cliffs, N.J., Prentice – Hall, p470.
Krosnick, J.A. & Fabrigar, (1997), Designing Rating Scales for Effective
Management in Surveys. In Lyberg, L., Biemer, P. Collins, M. deLeeuw, E., Dippo,
C. Schwartz, N. & Trewin, D. eds, Survey Management and Process Quality, New
York, Wiley, p141 – 164.
Langevin, R.C., (1988), Service Quality: Essential Ingredients, Review of
Business,(9:3), p3 – 5.
Lasser, W.M., Manolis, C. & Winsor, R.D. (2000), Service Quality Perspectives and
Satisfaction in Private Banking, Journal of Services Marketing, (14:3), p244 – 271.
50

Lee, H., Lee, Y. & Yoo, D. (2000), The Determinants of Perceived Service Quality
and its Relationship with Satisfaction, Journal of Services Marketing, (14:2), p217 –
232.
Leonard, F.S. & Sasser, W.E., (1982), The Incline of Quality, Harvard Business
Review, (60:5), p163 – 171.
Lehtinen, U. & Lehtinen, J.R., (1982), Service Quality: A Study of Quality
Dimensions, Unpublished working paper, Helsinki: Service Management Institute,
Finland.
Lewin, K. et al. The Level of Aspiration in Hunt, J.M. ed (1944) Personality and
Behaviour Disorders, New York, Reynolds
Lewis, B.R., (1989), Quality in The Service Sector – A Review, International Journal
of Bank Marketing, (7:5)
Lewis, R.C. & Booms, B.H., (1983), The Marketing Aspects of Service Quality, in
Emerging Perspectives on Services Marketing, Berry, L., Shostack, G. & Upah, G.
eds, Chicago, American Marketing, p99 – 107.
Lolosa, S., Chandon, J-L. & Orsingher, C. (1998), An Empirical Study of
SERVQUAL’s Dimensionality, Service Industries Journal, (18:2), p16 – 44.
51

Lovelock, C., Vandermerwe, S. & Lewis, B. (1999), Service Marketing A European
Perspective, Harlow, Pearson Education Limited, p3 – 26 & p481 – 511.
Lytle, R.S. & Mokwa, M.P., (1992), Evaluating Health Care Quality: The Moderating
Role of Outcomes, Journal of Health Care Marketing, (12:1) p4 – 14.
Mangold, W.G. & Babakus, E. (1991) Service Quality: the Front Stage vs. the Back
Stage Perspective, Journal of Services Marketing, (5:4), p59 – 70.
Marshall. A. (1890), Principles of Marketing, London, Macmillan.
Mazis, M.B., Ahtola, O.T. & Klippel, R.E., (1975), A Comparison of Four Multi-
Attributed Models in the Prediction of Consumer Attitudes, Journal of Consumer
Research, (2) June, p38 – 52.
McAlexander, J.H., Kaldenberg, D.O. & Koeing, H.F., (1994), Service Quality
Measurement: Examination of Dental Practices Sheds More Light on the
Relationships between Service Quality, Satisfaction and Purchase Intentions in a
Health Care Setting, Journal of Health Care Marketing, (14:3) p34 – 40.
Molenaar, N.J. (1982), Response Effects in ‘Formal’ Characteristics of Questions. In
Dijkstra, W. & Van der Zouwen, J. eds, Response Behaviour and the Survey
Interview, New York, Academic Press.
52

Moore, C.D., (1987), Outclass the Competition with Service Distinction, Mortgage
Banking, (47:11)
Morrison Coulthard, L.J., (2004), Measuring Service Quality A Review and Critique
of Research using SERVQUAL, International Journal of Market Research, (46:4),
p479 – 497.
Newman, K. (2001), Interrogating SERVQUAL: A Critical Assessment of Service
Quality Measurement in a High Street Retail Bank, International Journal of Bank
Marketing, (19:3), p126 – 139.
O’Connor, S., Shewchuk, R.M. & Bowers, R.M., (1993), A Model of Service Quality
Perceptions and Health Care Consumer Behaviour, Journal of Health Care
Marketing.
Oliver, R.L., (1977), Effect of Expectation and Disconfirmation on Post – Exposure
Product Evaluations: An Alternative Interpretation, Journal of Applied Psychology,
August
Olshavsky, R.W. & Miller, J.A., (1972), Consumer Expectations, Product
Performance and Perceived Product Quality, Journal of Marketing Research,
February
Palmer, A. (1994), Principles of Services Marketing, Maidenhead, McGraw-Hill
Publishing Company, p1 – 7 & p173 – 190.
53

Parasuraman, A., Berry, L. L. & Zeithaml, V. A., (1985), A Conceptual Model of
Service Quality and its Implications for Future Research, Journal of Marketing, (49)
p41 – 50.
Parasuraman, A., Berry, L. L. & Zeithaml, V. A., (1988), SERVQUAL: A Multiple-
Item Scale for Measuring Consumer Perceptions of Service Quality, Journal of
Retailing, (64:1) p12 – 40.
Parasuraman, A., Berry, L. L. & Zeithaml, V. A., (1991), Refinement and
Reassessment of the SERVQUAL Scale, Journal of Retailing, (67:4) p420 – 450.
Parasuraman, A., Berry, L. L. & Zeithaml, V. A., (1994), Reassessment of
Expectations as a Comparison Standard in Measuring Service Quality: Implications
for Further Research, Journal of Marketing, (58) p111 – 124.
Preston, P.P. & Colman, A.M. (2000) Optimal Number of Response Categories in
Rating Scales: Reliability, Validity, Discriminating Power and Response Preferences,
Acta Psychologica, (104), p1 – 15.
Raphael, W. & Mandeville, J. (1979) Old People in Hospital, London, King Edwards
Hospital Fund.
Richard, M.D. & Allaway, A.W. (1993), Service Quality Attitudes and Choice
Behaviour, Journal of Service Marketing, (7:1), p59 – 68.
54

Robinson, C. (2002), Real World Research, Oxford, Blackwell, p59.
Sasser, W.E., Olsen, R.P. & Wyckoff, D.D., (1978), Management of Service
operations: Texts and Cases, Boston, Allyn and Bacon.
Saunders, M. & Lewis, P. & Thornhill, A. (2007), Research Methods for Business
Students, Harlow, Pearson Education Limited, p2 – 551.
Sherden, W.A., (1988), Gaining The Service Quality Advantage, Journal of Business
Strategy, (9:2), p 45 – 48.
Silvestro, R. & Cross, S. (2000), Applying Service Profit Chain in a Retail
Environment, International Journal of Service Industry Management, (11:3), p244 –
268.
Smith, A. (1977), The Wealth of Nations, Harmondsworth, Penguin, p430 (first
published 1779).
Smith A.M., (1993), Elderly Consumers’ Evaluations of Service Quality, Marketing
Intelligence and Planning, (11:4), p13 – 19.
Smith, A.M., (1995), Measuring Service Quality: Is SERVQUAL now Redundant?
Journal of Marketing Management, (11), p257 – 276.
55

Smith, R.A. & Houston, M.J., (1982) Script Based Evaluations of Satisfaction with
Services, in Emerging Perspectives on Services Marketing, Berry, L., Shostack, G. &
Upah, G. eds, Chicago, American Marketing, p59 – 62.
Shostack, G.L., (1977), Breaking Free from Product Marketing, Journal of Marketing,
(41), p73 – 80.
Stutely, M. (2003), Numbers Guide: The Essentials of Business Numeracy, London,
Bloomberg Press.
Sureshchandar, G.S., Rajendran, C. & Kamalanabhan, T.J., (2001), Customer
Perceptions of Service Quality: A Critique, Total Quality Management, (12), p111 –
124.
Sureshchandar, G.S., Rajendran, C. & Antharaman, R.N. (2002), The Relationship
Between Service Quality and Customer Satisfaction: a Factor Specific Approach,
Journal of Services Marketing, (16:4), p363 – 379.
Swan, J.E. & Combs, L.J., (1976), Product Performance and Consumer Satisfaction:
A New Concept, Journal of Marketing, April, p26.
Taylor, S.A. & Cronin, J.J., (1994) Modelling Patient Satisfaction and Service
Quality, Journal of Health Care Marketing, (14:1) p34 – 44.
56

Teas, R.K., (1993), Expectations, Performance Evaluation, and Consumers’
Perceptions of Quality, Journal of Marketing, (57) October, p18 – 34.
Teas, R.K. (1994), Expectations as a Comparison Standard in Measuring Service
Quality: An Assessment of a Re-Assessment, Journal os Marketing, (58), p132 – 139.
Webster, C. & Hung, L.C., (1994), Measuring Service Quality and Promotion
Decentring, The TQM Magazine, (6:5), p50 – 55.
Woodruff, R.B., Cadotte, E.R. & Jenkins, R.L. (1983), Modeling Consumer
Satisfaction Processes Using Experience – Based Norms, Journal of Marketing
Research, (20) August, p296 – 304.
World Bank, (1991) The Challenge of Development, World Development Report
1991, Oxford, Oxford University Press.
Wyckham, R.G., Fitzroy, P.T. & Mandry, G.D. (1975), Marketing of Services An
Evaluation of the Theory, European Journal of Services Marketing, (9:1), p59 – 67.
Zeithaml, V.A. (1981), How Consumer Evaluation Processes Differ between Goods
and Services, In Donnelly, J. & George, W. eds, Marketing of Services, Chicago,
American Marketing Association, p186 – 190.
Zeithaml, V.A. & Bitner, M.J. (1996), Services Marketing, Singapore, McGraw-Hill
Publishing Company, p5 – 23 & 116 – 132.
57

Service Quality Model (Appendix 1)
Source: Parasuraman, A., Berry, L.L. & Zeithaml, V.A., (1985) A conceptual Model of Service Quality and its Implications for Future Research, Journal of Marketing, (49), p44.
58

Definitions and Examples of Dimensions (Appendix 2)
Source: Parasuraman, A., Berry, L.L. & Zeithaml, V.A., (1985) A conceptual Model of Service Quality and its Implications for Future Research, Journal of Marketing, (49), p47.
59

SERVQUAL Dimensions (Appendix 3) Dimension Definition Items in scale Tangibles Physical facilities, equipment and appearance of
personnel. 4
Reliability Ability to perform the promised service dependably and accurately. 5
Responsiveness Willingness to help customers and provide prompt service. 4
Assurance Knowledge and courtesy of employees and their ability to inspire trust and confidence. 5
Empathy Caring, individualised attention the firm provides its customers. 4
Source: Adapted from Parasuraman et al. (1988).
Age of Respondent Service Users (Appendix 4)
4%
4%
11%
22%59%
36 - 4546 - 5556 - 6566 - 7576+
Gender of Service Users (Appendix 5)
74% 26%FemaleMales
60

Area of Residence of Respondent Service Users (Appendix 6)
0123456789
10
Crawley
Horsha
m
Southw
ater
Steynin
g
Billings
hurst
Hasso
cks
Turners
Hill
Crawley
Dow
n
Henfie
ld
Hurstpi
erpoin
t
East G
rinste
ad
Area
Num
ber o
f Ser
vice
Use
rs
Length of Service Use (Appendix 7)
30%
15%
15%
7%
4%7%
22%
Less 6 months6 months to 1 year1 Year 1 month to 2 years2 years 1 month to 6 years6 years 1 month to 12 years 12 years 1 month to 18 years18 years 1 month to 24 years24 yeas +
Age of Home Care Employees (Appendix 8)
0
2
4
6
8
10
16 - 24 25 - 35 36 - 45 46 - 55 56 - 65 66 - 75 75+Age
Num
ber o
f Em
ploy
ees
61

Number of Home Care Employees Working Full/ Part Time (Appendix 9)
0
5
10
15
20
Full Time Part Time
Num
ber o
f Em
ploy
ees
Number of Employees that have Relief/Permenant Contracts (Appendix 10)
02468
101214
Relief Permanent
Num
ber o
f Em
ploy
ees
Mean Average Gap Scores for Gap 5 - Perception minus Expectation = Service Quality (Appendix 11)
-0.80
-0.60
-0.40
-0.20
0.00
0.20
1 2 3 4 5 6 7 8 9 10 11 12 13 14 15 16 17 18 19 20 21 22
Item
Gap
Sco
re
62

Items Used to Measure Perceptions (Appendix 12)
1. Home Care has modern and effective equipment. 2. Equipment supplied by Home Care is not out of place in your home. 3. Home Care’s staff are of neat appearance. 4. The equipment supplied by Home Care satisfies your needs. 5. When Home Care promise to do something by a certain time, they keep their promise. 6. When you have a problem, Home Care will show a sincere interest in solving the problem. 7. Home Care performs the service right the first time. 8. Home Care provides their services at a time they promise to do so. 9. Home Care insists on error free records. 10. Home Care staff tell you exactly when they will perform the service. 11. Staff of Home Care gives prompt service to you. 12. Staff of Home Care are always willing to help you. 13. Staff of Home Care are never too busy to respond to your requests. 14. The behaviour of staff of Home Care instils confidence in you. 15. You feel safe in your dealings with Home Care staff. 16. Staff of Home Care are polite to you. 17. Staff of Home Care are able to answer questions from you. 18. Home Care gives you individual attention. 19.Home Care provides its services at times convenient to you. 20. Home Care has staff that give you personal attention. 21. Home Care has your best interests at heart. 22. The staff of Home Care understand your specific needs.
63

64
Items Used to Measure Perceptions of Home Care (Appendix 13)
1. An excellent care service will have modern and effective equipment. 2. Any equipment supplied by an excellent care service will not be out of place in the service users home. 3. Staff will be of neat appearance. 4. The equipment supplied by an excellent care service will satisfy the service users needs. 5. When an excellent care service promises to do something by a certain time, they keep their promise. 6. When service users have a problem, an excellent care service will show a sincere interest in solving the problem. 7. An excellent care service will perform the service right the first time. 8. An excellent care service will provide their services at a time they promise to do so. 9. An excellent care service will insist on error free records. 10. Staff of an excellent care service will tell service users exactly when they will perform the service. 11. Staff of an excellent care service will give prompt service to customers. 12. Staff of an excellent care service will always be willing to help service users. 13. Staff of an excellent care service will never be too busy to respond to customer requests. 14. The behaviour of staff of an excellent care service will instil confidence in service users. 15. Service users of an excellent care service will feel safe in their dealings with staff. 16. Staff of an excellent care service will be polite to service users. 17. Staff of an excellent care service will be able to answer questions from service users. 18. An excellent care service will give service users individual attention. 19. An excellent care service will provide its services at times convenient to service users. 20. An excellent care service will have staff that give service users personal attention. 21. An excellent care service will have service users best interests at heart. 22. The staff of an excellent care service will understand the specific needs of their service users.
Gap Scores for each Dimension (Appendix 14) Dimension Mean Average Gap Score Tangibles -0.38 Reliability -0.37 Responsiveness -0.44 Assurance -0.08 Empathy -0.22 Overall Perceived Service Quality -0.30

Chi Square Tests (Appendix15) Tangibles Obs Exp o-e o-e-.5 = A A2 A2/e Males 4.785714286 5 -0.214285714 -0.285714 0.08163249 0.016326498 Females 4.661764706 5 -0.338235294 -0.161765 0.02616792 0.005233583 0.021560081 x2 Reliability Obs Exp o-e o-e-.5 = A A2 A2/e Males 4.8 5 -0.2 -0.3 0.09 0.018 Females 4.6 5 -0.4 -0.1 0.01 0.002 0.02 x2 Responsiveness Obs Exp o-e o-e-.5 = A A2 A2/e Males 4.428571429 5 -0.571428571 0.071429 0.0051021 0.00102042 Females 4.6375 5 -0.3625 -0.1375 0.01890625 0.00378125 0.00480167 x2 Assurance Obs Exp o-e o-e-.5 = A A2 A2/e Males 4.928571429 5 -0.071428571 -0.428571 0.1836731 0.03673462 Females 4.9125 5 -0.0875 -0.4125 0.17015625 0.03403125 0.07076587 x2 Empathy Obs Exp o-e o-e-.5 = A A2 A2/e Males 4.771428571 5 -0.228571429 -0.271429 0.0736737 0.01473474 Females 4.82 5 -0.18 -0.32 0.1024 0.02048 0.03521474 x2 Percieved Service Quality Obs Exp o-e o-e-.5 = A A2 A2/e Males 4.821428571 5 -0.178571429 -0.321429 0.1033166 0.02066332 Femeles 4.733125 5 -0.266875 -0.233125 0.05434727 0.010869453 0.031532774 x2
65


67
Chi Square Test - Length of Service use will not affect Judgement of Service Quality (Appendix 16)
Length of service use
Number of Service Users
Obs Average Gap Score Exp o-e = A A2 A2/e
Less 6 months 8 4.9734375 5 -0.0265625 0.00070557 0.000141113 6 months to 1 year 4 4.7125 5 -0.2875 0.08265625 0.01653125 1 Year 1 month to 2 years 6 4.570833333 5 -0.429166667 0.18418403 0.036836806 2 years 1 month to 6 years 4 4.75 5 -0.25 0.0625 0.0125 6 years 1 month to 12 years 2 4.9125 5 -0.0875 0.00765625 0.00153125 12 years 1 month to 18 years 1 4.525 5 -0.475 0.225625 0.045125 18 years 1 month to 24 years 24 yeas + 2 4.5 5 -0.5 0.25 0.05 0.162665419x2

Quality Standards of Home Care (Appendix 17) User Focused Services
1. Current and potential service users and their relatives have access to comprehensive information, so that they can make informed decisions on whether the agency is able to meet their specific care needs.
2. The care needs and requirements of service users and their personal or family careers when appropriate are individually assessed before they are offered a personal domiciliary care service.
3. Service users, their relatives and representatives know that the agency providing their care service has the skills and competences required to meet their care needs.
4. Each service user has a written individual service contract or equivalent for the provision of care, with the agency, except employment agencies solely introducing workers.
5. Service users and their relatives or representatives know that their personal information is handled appropriately and that their personal confidence is respected.
6. Service users receive a flexible, consistent and reliable personal care service. Personal Care
7. The care needs, wishes, preferences and personal goals for each individual service user are recorded in their personal service user plan, except for employment agencies solely introducing workers.
8. Service users feel that they are treated with respect and valued as a person, and their right to privacy is upheld.
9. Service users are assisted to make their own decisions and control their own lives and are supported in maintaining their independence.
10. The agency’s policy and procedures on medication and health related activities protect service users and assists them to maintain responsibility for their own medication and to remain in their own home, even if they are unable to administer their medication themselves.
Protection
11. The health, safety and welfare of service users and care and support staff is promoted and protected.
12. The risk of accidents and harm happening to service users and staff in the provision of personal care is minimised.
13. The money and property of service users is protected at all times whilst providing the care service.
14. Service users are protected from abuse neglect and self harm. 15. Service users are protected and are safe in their home. 16. The health rights and best interests of service users are safe guarded by
maintaining a record of key events and activities undertaken in the home in relation to the provision of personal care.
68

Managers and Staff
17. The well – being, health and security of service users is protected by the agency’s policies and procedures on recruitment and selection of the staff.
18. Service user benefit from clarity of the staff roles and responsibilities. 19. Service users know that staff are appropriately trained to meet their personal
care needs. 20. The personal care of service users is provided by qualified and competent
staff. 21. Service users know and benefit from having staff who are supervised and
whose performance is appraised regularly. Organisation and Running of the Business
22. Service user receive a consistent, well managed and planned service. 23. The continuity of the service provided to service users is safe guarded by the
accounting and financial procedures of the agency. 24. The rights and best interests of service users are safeguarded by the agency
keeping accurate and up to date records. 25. The service users rights, health, and best interests are safeguarded by robust
policies and procedures which are consistently implemented and constantly monitored by the agency.
26. Service users and their relative or representatives are confident that their complaints will be listened to, taken seriously and acted upon.
27. The service is run in the best interests of the service users.
69

Gap between Service Specification (Quality Standards) and Managers Perceptions of Service User Expectations (Appendix 18) Quality Standard Questionnaire Item Employee
Perception Score out of 5 (mean average)
2.The care needs and requirements of service users and their personal or family careers when appropriate, are individually assessed before they are offered a personal domiciliary care service.
22. Employees understand service users specific needs.
4.65
6. Service users receive a flexible, consistent and reliable personal care service.
10. Service users are informed of exactly when staff will perform the service. 11. Employees provide prompt service. 12. Employees are always willing to help service users. 13. Employees are never too busy to respond to service users requests.
4.00 4.25 4.95 4.65 Av = 4.46
7. The care needs, wishes, preferences and personal goals for each individual service user are recorded in their personal service user plan.
9. Staff insist on error free records. 18. Employees give service users individual attention. 22. Employees understand service users specific needs.
4.25 5.00 4.65 Av = 4.63
8. Service users feel that they are treated with respect and valued as a person, and their right to privacy is upheld.
12. Employees are always willing to help service users. 13. Employees are never too busy to respond to service users requests. 16. Employees are polite to service users.
4.95 4.65 5.00 Av = 4.86
14. Service users are protected from abuse neglect and self -harm.
15. Employees make service users feel safe when caring for them. 4.95
15. Service user are protected and are safe in their home.
15. Employees make service users feel safe when caring for them. 4.95
16. The health, rights and best interests of service users are safe guarded by maintaining a record of key events and activities
9. Employees insist on error free records.
4.25
22. Service users receive a consistent, well managed and planned service.
7. Staff perform the service right the first time. 8. Staff provide care services at the time you are scheduled to. 10. Service users are informed of exactly when staff will perform the service.
4.25 4.00 4.00 Av = 4.08
70

24. The rights and best interests of service users are safeguarded by the agency keeping accurate and up to date records.
9. Staff insist on error free records.
4.25
25. The service users rights, health, and best interests are safeguarded by robust policies and procedures which are consistently implemented
21. Employees have service users best interests at heart.
4.95
26. Service users and their relative or representatives are confident that their complaints will be listened to, taken seriously and acted upon.
6. When service users have a problem, staff make every effort to help them. 4.90
27. The service is run in the best interests of the service users.
21. Employees have service users best interests at heart. 4.95
Items Used to Measure Home Care’s Employees Perception of Service Quality Delivered (Appendix 19)
1.The equipment you use is modern and effective. 2. Equipment supplied to service users is not out of place in their homes. 3. When working you are of neat appearance. 4. The equipment you use satisfies service users needs. 5. When you are scheduled to perform a task at a certain time you do. 6. When service users have a problem, you make every effort to help them. 7. You perform the service right the first time. 8. You provide care services at the time you are scheduled to. 9. You insist on error free records. 10. Service users are informed of exactly when you will perform the service. 11. You provide prompt service. 12. You are always willing to help service users. 13. You are never too busy to respond to service users requests. 14. You behave in a way that instils confidence in service users. 15. You make service users feel safe when caring for them. 16. You are polite to service users. 17. You are able to answer questions from service users within your boundaries. 18. You give service users individual attention. 19. You provide care services at times convenient to service users. 20. You give service users personal attention. 21. You have service users best interests at heart. 22. You understand service users specific needs.
71

Home Care's Employees Perceptions of Service Quality Delivered (Appendix 20)
0.00
1.00
2.00
3.00
4.00
5.00
6.00
1 2 3 4 5 6 7 8 9 10 11 12 13 14 15 16 17 18 19 20 21 22Items
Scor
e ou
t of 5
Managers perceptions of Consumers Expectations, Sevice Users Expectations and Gap between Service Users
Perceptions and Expectations (Appendix 21)
-1.00
0.00
1.00
2.00
3.00
4.00
5.00
6.00
1 2 3 4 5 6 7 8 9 10 11 12 13 14 15 16 17 18 19 20 21 22
Item
Scor
e
Gap between service userexpectations andperceptionsManagers Perception ofservice users expectation
Service user expectation(mean average)
72

Managers Perception of Service Users Expectation of an Excellent Care Service (Appendix 22)
0
1
2
3
4
5
6
1 2 3 4 5 6 7 8 9 10 11 12 13 14 15 16 17 18 19 20 21 22
Item
Rat
ing
on F
ive
Poin
t Lik
ert S
cale
ManagersPerception ofservice usersexpectation
Service userexpectation (meanaverage)
73

Questionnaire to Home Care Service Users (Appendix 23) Dear service user, My name is Michael Pasmore. I am a business student in my final year of study. As part of my studies I have to undertake a dissertation, which includes doing some research into a specific business problem. Therefore I have decided to research Home Care’s service quality, as assessed by you the service user. I have enclosed a short questionnaire, which I would be very grateful if you could complete. The questionnaire should take you approximately 5 minutes to fill in and full instructions are given at the top of each section. You do not have to complete the questionnaire if you do not want to, but it would be a great help to me if you could. Once you have completed the questionnaire hand it back to your carers who will pass it on to me. The cut off date for the questionnaires is Friday 3rd August. The information you provide will not be used for any commercial gain is anonymous and will only be viewed by myself, my tutors, and members of West Sussex District Council who are overseeing the research. I would like to take this opportunity to thank you for taking the time to read this letter and look forward to analysing any information you provide. Yours sincerely, Mike Pasmore.
74
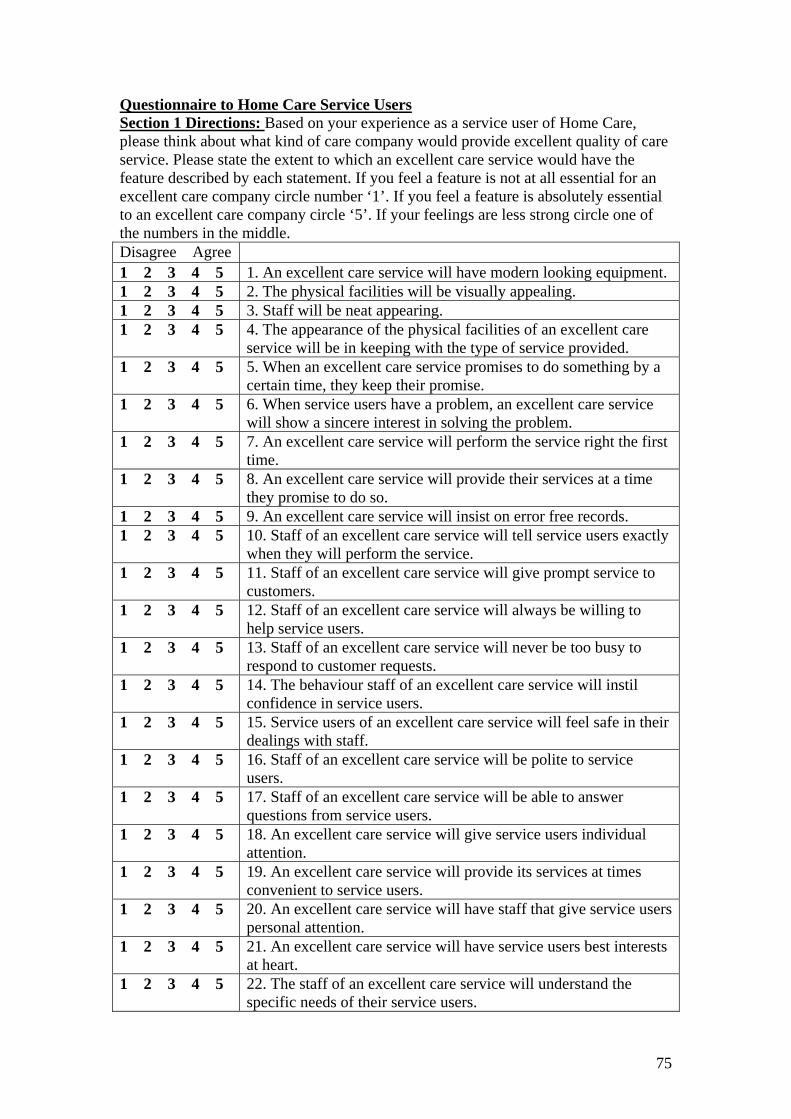
Questionnaire to Home Care Service Users Section 1 Directions: Based on your experience as a service user of Home Care, please think about what kind of care company would provide excellent quality of care service. Please state the extent to which an excellent care service would have the feature described by each statement. If you feel a feature is not at all essential for an excellent care company circle number ‘1’. If you feel a feature is absolutely essential to an excellent care company circle ‘5’. If your feelings are less strong circle one of the numbers in the middle. Disagree Agree 1 2 3 4 5 1. An excellent care service will have modern looking equipment. 1 2 3 4 5 2. The physical facilities will be visually appealing. 1 2 3 4 5 3. Staff will be neat appearing. 1 2 3 4 5 4. The appearance of the physical facilities of an excellent care
service will be in keeping with the type of service provided. 1 2 3 4 5 5. When an excellent care service promises to do something by a
certain time, they keep their promise. 1 2 3 4 5 6. When service users have a problem, an excellent care service
will show a sincere interest in solving the problem. 1 2 3 4 5 7. An excellent care service will perform the service right the first
time. 1 2 3 4 5 8. An excellent care service will provide their services at a time
they promise to do so. 1 2 3 4 5 9. An excellent care service will insist on error free records. 1 2 3 4 5 10. Staff of an excellent care service will tell service users exactly
when they will perform the service. 1 2 3 4 5 11. Staff of an excellent care service will give prompt service to
customers. 1 2 3 4 5 12. Staff of an excellent care service will always be willing to
help service users. 1 2 3 4 5 13. Staff of an excellent care service will never be too busy to
respond to customer requests. 1 2 3 4 5 14. The behaviour staff of an excellent care service will instil
confidence in service users. 1 2 3 4 5 15. Service users of an excellent care service will feel safe in their
dealings with staff. 1 2 3 4 5 16. Staff of an excellent care service will be polite to service
users. 1 2 3 4 5 17. Staff of an excellent care service will be able to answer
questions from service users. 1 2 3 4 5 18. An excellent care service will give service users individual
attention. 1 2 3 4 5 19. An excellent care service will provide its services at times
convenient to service users. 1 2 3 4 5 20. An excellent care service will have staff that give service users
personal attention. 1 2 3 4 5 21. An excellent care service will have service users best interests
at heart. 1 2 3 4 5 22. The staff of an excellent care service will understand the
specific needs of their service users.
75

Section 2 Directions: The following set of statements relate to your feelings about Home Care’s care service. For each statement please show the extent to which you believe Home Care has the feature described by the statement. Once again circling a ‘1’ means that you strongly disagree that Home Care has that feature and circling a ‘5’ means that you strongly agree. You may circle any of the numbers in the middle that show how strong your feelings are. Disagree Agree 1 2 3 4 5 1. Home Care has modern looking equipment. 1 2 3 4 5 2. Home Care’s physical facilities will be visually appealing. 1 2 3 4 5 3. Home Care’s staff will be neat appearing. 1 2 3 4 5 4. The appearance of the physical facilities of Home Care are in
keeping with the type of service provided. 1 2 3 4 5 5. When Home Care promise to do something by a certain time,
they keep their promise. 1 2 3 4 5 6. When you have a problem, Home Care will show a sincere
interest in solving the problem. 1 2 3 4 5 7. Home Care performs the service right the first time. 1 2 3 4 5 8. Home Care provides their services at a time they promise to do
so. 1 2 3 4 5 9. Home Care insists on error free records. 1 2 3 4 5 10. Home Care staff tells you exactly when they will perform the
service. 1 2 3 4 5 11. Staff of Home Care gives prompt service to you. 1 2 3 4 5 12. Staff of Home Care are always willing to help you. 1 2 3 4 5 13. Staff of Home Care are never too busy to respond to your
requests. 1 2 3 4 5 14. The behaviour staff of Home Care instils confidence in you. 1 2 3 4 5 15. You feel safe in your dealings with Home Care staff. 1 2 3 4 5 16. Staff of Home Care are polite to you. 1 2 3 4 5 17. Staff of Home Care are able to answer questions from you. 1 2 3 4 5 18. Home Care gives you individual attention. 1 2 3 4 5 19.Home Care provides its services at times convenient to you. 1 2 3 4 5 20. Home Care has staff that give you personal attention. 1 2 3 4 5 21. Home Care has your best interests at heart. 1 2 3 4 5 22. The staff of Home Care understand your specific needs. Please tick the appropriate box that applies to you. Gender: male female Age: 16 – 24 25 – 35 36 – 45 46 – 55 56 – 65 66 – 75 76+ Area you live in: Haywards Heath Burgess Hill Hassocks Crawley Horsham Length of time Home Care have provided a service to you: Less than 6 months 7 months to 1 year 1 to 2 years
76
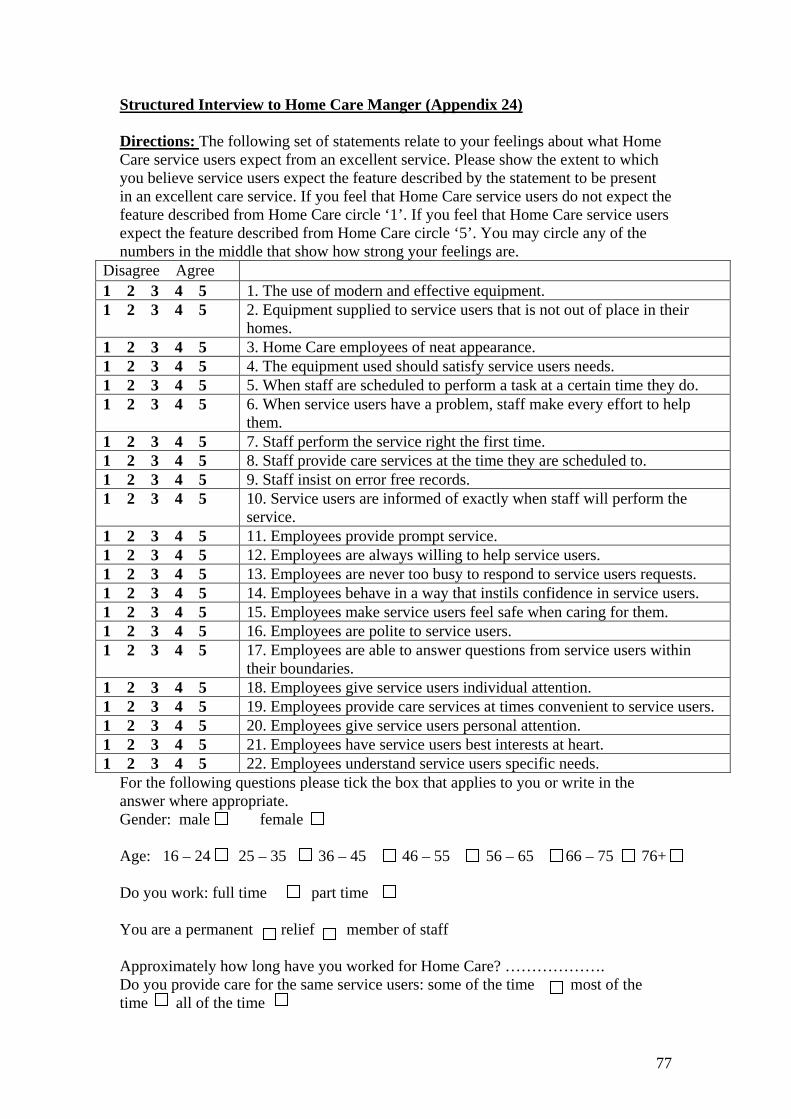
Structured Interview to Home Care Manger (Appendix 24) Directions: The following set of statements relate to your feelings about what Home Care service users expect from an excellent service. Please show the extent to which you believe service users expect the feature described by the statement to be present in an excellent care service. If you feel that Home Care service users do not expect the feature described from Home Care circle ‘1’. If you feel that Home Care service users expect the feature described from Home Care circle ‘5’. You may circle any of the numbers in the middle that show how strong your feelings are.
Disagree Agree 1 2 3 4 5 1. The use of modern and effective equipment. 1 2 3 4 5 2. Equipment supplied to service users that is not out of place in their
homes. 1 2 3 4 5 3. Home Care employees of neat appearance. 1 2 3 4 5 4. The equipment used should satisfy service users needs. 1 2 3 4 5 5. When staff are scheduled to perform a task at a certain time they do. 1 2 3 4 5 6. When service users have a problem, staff make every effort to help
them. 1 2 3 4 5 7. Staff perform the service right the first time. 1 2 3 4 5 8. Staff provide care services at the time they are scheduled to. 1 2 3 4 5 9. Staff insist on error free records. 1 2 3 4 5 10. Service users are informed of exactly when staff will perform the
service. 1 2 3 4 5 11. Employees provide prompt service. 1 2 3 4 5 12. Employees are always willing to help service users. 1 2 3 4 5 13. Employees are never too busy to respond to service users requests. 1 2 3 4 5 14. Employees behave in a way that instils confidence in service users. 1 2 3 4 5 15. Employees make service users feel safe when caring for them. 1 2 3 4 5 16. Employees are polite to service users. 1 2 3 4 5 17. Employees are able to answer questions from service users within
their boundaries. 1 2 3 4 5 18. Employees give service users individual attention. 1 2 3 4 5 19. Employees provide care services at times convenient to service users. 1 2 3 4 5 20. Employees give service users personal attention. 1 2 3 4 5 21. Employees have service users best interests at heart. 1 2 3 4 5 22. Employees understand service users specific needs.
For the following questions please tick the box that applies to you or write in the answer where appropriate. Gender: male female Age: 16 – 24 25 – 35 36 – 45 46 – 55 56 – 65 66 – 75 76+ Do you work: full time part time You are a permanent relief member of staff Approximately how long have you worked for Home Care? ………………. Do you provide care for the same service users: some of the time most of the time all of the time
77

Questionnaire to Home Care Employees (Appendix 25) Dear care assistant/senior, My name is Michael Pasmore. I am a business student in my final year of study. As part of my studies I have to undertake a dissertation, which includes doing some research into a specific business problem. Therefore I have decided to research Home Care’s service quality, as assessed by your service users and you. However I have a problem in distributing the questionnaires to the service users, as I do not have access to their names and addresses for reasons of confidentiality. For this reason I would really appreciate it if you could do the following:
• Give each service user a questionnaire (which will be enclosed with your weekly programs) if you think they have the ability to complete it.
• Collect the questionnaires as the service users complete them and hand them
in with your weekly time sheets. The cut off date for the collection of questionnaires is Friday 3rd of August. As well as the service users questionnaire I have printed a short questionnaire on the reverse of this letter, which I would be very grateful if you could complete. The questionnaire should take you approximately 5 minutes to fill in and full instructions are given at the top of each section. You do not have to complete the questionnaire or deliver and collect the service user questionnaires if you do not want to, but it would be a great help to me if you could. I would like to take this opportunity to thank you for taking the time to read this letter and look forward to analysing any information you provide. Yours sincerely, Mike Pasmore
78
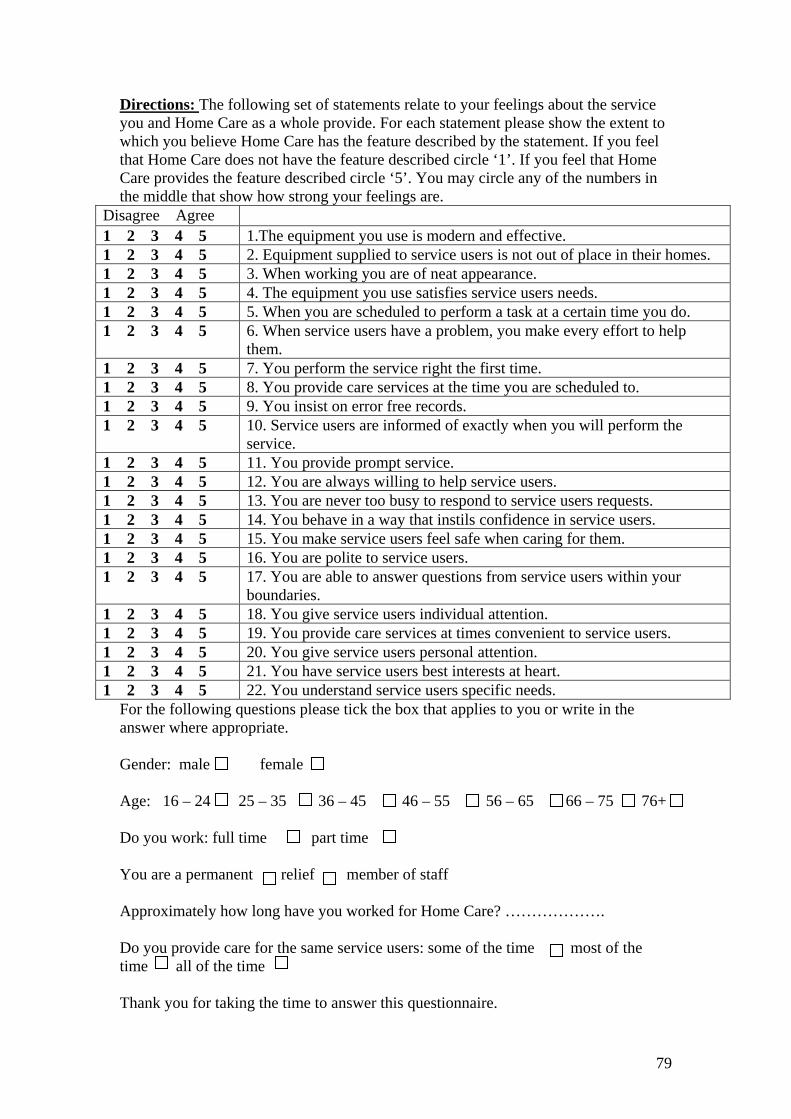
Directions: The following set of statements relate to your feelings about the service you and Home Care as a whole provide. For each statement please show the extent to which you believe Home Care has the feature described by the statement. If you feel that Home Care does not have the feature described circle ‘1’. If you feel that Home Care provides the feature described circle ‘5’. You may circle any of the numbers in the middle that show how strong your feelings are.
Disagree Agree 1 2 3 4 5 1.The equipment you use is modern and effective. 1 2 3 4 5 2. Equipment supplied to service users is not out of place in their homes. 1 2 3 4 5 3. When working you are of neat appearance. 1 2 3 4 5 4. The equipment you use satisfies service users needs. 1 2 3 4 5 5. When you are scheduled to perform a task at a certain time you do. 1 2 3 4 5 6. When service users have a problem, you make every effort to help
them. 1 2 3 4 5 7. You perform the service right the first time. 1 2 3 4 5 8. You provide care services at the time you are scheduled to. 1 2 3 4 5 9. You insist on error free records. 1 2 3 4 5 10. Service users are informed of exactly when you will perform the
service. 1 2 3 4 5 11. You provide prompt service. 1 2 3 4 5 12. You are always willing to help service users. 1 2 3 4 5 13. You are never too busy to respond to service users requests. 1 2 3 4 5 14. You behave in a way that instils confidence in service users. 1 2 3 4 5 15. You make service users feel safe when caring for them. 1 2 3 4 5 16. You are polite to service users. 1 2 3 4 5 17. You are able to answer questions from service users within your
boundaries. 1 2 3 4 5 18. You give service users individual attention. 1 2 3 4 5 19. You provide care services at times convenient to service users. 1 2 3 4 5 20. You give service users personal attention. 1 2 3 4 5 21. You have service users best interests at heart. 1 2 3 4 5 22. You understand service users specific needs.
For the following questions please tick the box that applies to you or write in the answer where appropriate. Gender: male female Age: 16 – 24 25 – 35 36 – 45 46 – 55 56 – 65 66 – 75 76+ Do you work: full time part time You are a permanent relief member of staff Approximately how long have you worked for Home Care? ………………. Do you provide care for the same service users: some of the time most of the time all of the time Thank you for taking the time to answer this questionnaire.
79