Embed Size (px)
Citation preview
1
Servicing Indigenous Job Seekers in Job Services Australia
EVALUATION OF JOB SERVICES AUSTRALIA 2009-2012
January 2012
2
For further information about this publication contact:
Employment Services Evaluation Section Labour Market Strategy Group Department of Education, Employment and Workplace Relations GPO Box 9880, CANBERRA ACT 2601
General: 1300 363 079 Switchboard: 13 33 97
Text telephone for the hearing impaired (TTY): FreeCall TM 1800 554 609
Website: Department of Education, Employment and Workplace Relations (http://www.deewr.gov.au/Employment/ResearchStatistics/ProgEval/Pages/Overview.aspx)
CC by 3.0
Commonwealth of Australia 2012
978-0-642-78421-6 – Servicing Indigenous Job Seekers in Job Services Australia (PDF)
978-0-642-78422-3 – Servicing Indigenous Job Seekers in Job Services Australia (DOCX)
With the exception of the Commonwealth Coat of Arms and where otherwise noted all material presented in this document is provided under a Creative Commons Attribution 3.0 Australia (http://creativecommons.org/licenses/by/3.0/au/) licence.
The details of the relevant licence conditions are available on the Creative Commons website (http://creativecommons.org/licenses/by/3.0/au/legalcode) (accessible using the links provided) as is the full legal code for the CC BY 3.0 AU licence.
The document must be attributed as Department of Education, Employment and Workplace Relations, 2012, Servicing Indigenous Job Seekers in Job Services Australia, DEEWR, Canberra.
3
Contents
List of Tables 5
List of Figures 7
1 Key Findings 7
The Indigenous population and labour force 8
Indigenous Australians in Job Services Australia 8
Participation in Job Services Australia 9
Outcomes of JSA Services 9
Supporting Indigenous Employment 10
2 Introduction 11
2.1 Scope of this report 11
2.2 Job Services Australia and Indigenous employment services 11
2.3 Closing the Gap 12
2.4 The role of Job Services Australia in Closing the Gap 12
3 The Indigenous Population and Labour Force 14
Key points 14
3.1 Population characteristics 14
3.2 Labour force participation 16
4 Indigenous Australians in Job Services Australia 22
Key points 22
4.1 Characteristics of Indigenous job seekers in Job Services Australia 22
Age and sex 23
Geographic location 26
Streams of assistance 28
Streaming of Indigenous job seekers 29
Geographic location and JSA streaming 31
Review of remote participation and employment services 33
4.2 Implications for JSA servicing 34
5 Participation in JSA services 35
Key points 35
5.1 Initial connection 35
5.2 Ongoing engagement 36
5.3 Supporting participation of Indigenous job seekers 38
5.4 Assistance provided 39
6 Outcomes of JSA assistance 46
Key points 46
6.1 Employment outcomes 47
6.2 Education and training outcomes 48
6.3 Leaving or changing income support 49
7 Supporting Indigenous Employment 51
4
Key points 51
7.1 Indigenous Employment Strategies 51
7.2 Service Level Agreements 56
7.3 Employer Attitudes 57
8 Conclusion 61
Appendix 1 63
Additional tables 63
Appendix 2 77
Regression analysis of initial connection with JSA services 77
Appendix 3 79
Notes on Econometric Estimation 79
References 80
5
List of Tables
Table 1: Labour market participation of Indigenous and non-Indigenous people aged 15-64 by sex, 2010 .............. 17
Table 2: Job seeker attendance at different types of engagement activities by Indigenous status (1 July 2009- 30 June 2010) (per cent) .................................................................................................................................................. 36
Table 3: Average EPF expenditure and number of transactions for Indigenous and non-Indigenous jobseekers in remote and non-remote areas to end November 2011 ............................................................................................. 40
Table 4: Transaction activity in various EPF categories and sub categories comparing for Indigenous and non-Indigenous job seekers as at 30 November 2011 ....................................................................................................... 41
Table 5: Labour market and education and training outcomes following JSA assistance Indigenous and non-Indigenous people, Stream and gender – year to June 2011 (per cent) ..................................................................... 48
Table 6: Income support and benefit related outcomes following JSA assistance Indigenous and non-Indigenous people, stream and gender – year to June 2011 (per cent) ........................................................................................ 50
Table 7: Numbers of Indigenous staff employed by JSA and NEIS providers .............................................................. 52
Table 8: Reported effect of employing Indigenous staff in service delivery roles ...................................................... 53
Table 9: Reported effect of having an IES on selected organisational outcomes ....................................................... 54
Table 10: Employment of Indigenous Australians ...................................................................................................... 57
Table 11: Change in number of Indigenous Australians employed in the last 12 months by whether organisation has formal policy for recruiting and employing Indigenous workers ................................................................................ 58
Table 12: Challenges to employing Indigenous staff reported by employers. Please refer to note 1 for more information. ................................................................................................................................................................ 59
Table A1.1: Age and sex composition of the Australian Indigenous and non-Indigenous populations, June 2006 (per cent) ............................................................................................................................................................................ 63
Table A1.2: Labour force participation rates for Indigenous and non-Indigenous people aged 15 to 64 years by state and territory, 2010 (per cent) ..................................................................................................................................... 63
Table A1.3 Unemployment rates for Indigenous and non-Indigenous people aged 15 to 64 years by state and territory, 2010 (per cent) ............................................................................................................................................ 64
Table A1.4: Indigenous labour force aged 15 to 64 years by geographic location, 2010 (‘000s) ............................... 64
Table A1.5: Non-Indigenous labour force aged 15 to 64 years by geographic location, 2010 (‘000s) ....................... 64
Table A1.6: Participation rates for Indigenous and non-Indigenous people aged 15 to 64 years by geographic location, 2010 (per cent) ............................................................................................................................................. 65
Table A1.7: Unemployment rates for Indigenous and non-Indigenous people aged 15 to 64 years by geographic location, 2010 (per cent) ............................................................................................................................................. 65
Table A1.8: Age and sex proportions of Indigenous JSA clients (November 2011) and the working age population for Aboriginal and Torres Strait Islander peoples (June 2006) (per cent) ................................................................... 66
Table A1.9: Age and sex proportions of non-Indigenous JSA clients (November 2011) and the working age population for non-Indigenous people (June 2006) (per cent) ................................................................................... 66
Table A1.10: Indigenous job seekers as a proportion of the total JSA caseload by unemployment duration, November 2011 (per cent) .......................................................................................................................................... 67
Table A1.11: Indigenous job seekers by unemployment duration, July 2009 to November 2011 (‘000s) ................. 67
Table A1.12: Non-Indigenous job seekers by unemployment duration, July 2009 to November 2011 (‘000s) ......... 68
Table A1.13: Indigenous job seekers in JSA, 2011, and the Indigenous working age population, 2006, by state and territory (‘000s) ........................................................................................................................................................... 69
6
Table A1.14: Indigenous job seekers in JSA, 2011 and the Indigenous working age population, 2006, by geographic location (‘000s) ........................................................................................................................................................... 69
Table A1.15: Indigenous job seekers in JSA by state and territory geographic location, 2011 (per cent) .................. 69
Table A1.16: Number of Indigenous job seekers by JSA Stream, July 2009 to November 2011 (‘000s) ..................... 70
Table A1.17: Number of non-Indigenous job seekers by JSA Stream, July 2009 to November 2011 (‘000s) ............. 71
Table A1.18: Distribution of JSCI scores for Indigenous and non-Indigenous job seekers, July 2009 to February 2011 (per cent) ..................................................................................................................................................................... 72
Table A1.19: Indigenous job seekers, distribution according to Stream of assistance and geographic location, November 2011 (per cent) .......................................................................................................................................... 73
(‘000s)Table A1.20: Non-Indigenous job seekers, distribution according to Stream of assistance and geographic location, November 2011 (per cent) ........................................................................................................................... 73
Table A1.21: Proportion of EPF expenditure and mean transaction amount across various EPF Purchase Categories for Indigenous job seekers .......................................................................................................................................... 74
Table A1.22: Proportion of EPF transactions across various EPF Purchase Categories, Indigenous and non-Indigenous job seekers (per cent) ............................................................................................................................... 75
Table A1.23: Ratio of outcome rates for Indigenous compared to non-Indigenous job seekers for selected outcomes, by Stream of assistance, year to June 2011 .............................................................................................. 75
Table A1.24: Employer attitudes to employing Indigenous Australians (per cent) .................................................... 76
Table A2.1: Regression analysis of initial connection with JSA services ..................................................................... 77
7
List of Figures
Figure 1: Age and gender composition of the Aboriginal and Torres Strait Islander population, 2006 ..................... 15
Figure 2: Age and gender composition of the non-Indigenous Australian population, 2006 ..................................... 15
Figure 3: Labour force participation rates for Indigenous and non-Indigenous people aged 15 to 64 years by state and territory, 2010 ...................................................................................................................................................... 18
Figure 4: Unemployment rates for Indigenous and non-Indigenous people aged 15 to 64 years by state and territory, 2010 ............................................................................................................................................................. 18
Figure 5: Indigenous labour force aged 15 to 64 years by geographic location, 2010 ............................................... 19
Figure 6: Non-Indigenous labour force aged 15 to 64 years by geographic location, 2010 ....................................... 19
Figure 7: Participation rates for Indigenous and non-Indigenous people aged 15 to 64 years by geographic location, 2010 ............................................................................................................................................................................ 20
Figure 8: Unemployment rates for Indigenous and non-Indigenous people aged 15 to 64 years by geographic location, 2010 ............................................................................................................................................................. 21
Figure 9: Age and sex proportions of Indigenous JSA clients (November 2011) and the working age population for Aboriginal and Torres Strait Islander peoples (June 2006) ......................................................................................... 23
Figure 10: Age and sex proportions of non-Indigenous JSA clients (November 2011) and the working age population for non-Indigenous people (June 2006) ................................................................................................... 24
Figure 11: Indigenous job seekers as a proportion of the total JSA caseload by unemployment duration, November 2011 ............................................................................................................................................................................ 25
Figure 12: Indigenous job seekers by unemployment duration, July 2009 to November 2011 (number) ................. 25
Figure 13: Non-Indigenous job seekers by unemployment duration, July 2009 to Nov 2011 (number) .................... 26
Figure 14: Indigenous job seekers in JSA, 2011, and the Indigenous working age population, 2006, by state and territory ....................................................................................................................................................................... 27
Figure 15: Indigenous job seekers in JSA, 2011 and the Indigenous working age population, 2006, by geographic location ....................................................................................................................................................................... 27
Figure 16: Indigenous job seekers in JSA by state and territory geographic location, 2011 ....................................... 28
Figure 17: Number of Indigenous job seekers by JSA Stream, July 2009 to November 2011 ..................................... 29
Figure 18: Number of non-Indigenous job seekers by JSA Stream, July 2009 to November 2011 ............................. 30
Figure 19: Distribution of JSCI scores for Indigenous and non-Indigenous job seekers, July 2009 to February 2011 31
Figure 20: Indigenous job seekers, distribution according to Stream of assistance and geographic location, November 2011 .......................................................................................................................................................... 32
Figure 21: Non-Indigenous job seekers, distribution according to Stream of assistance and geographic location, November 2011 .......................................................................................................................................................... 32
Figure 22: Proportion of EPF expenditure and mean transaction amount across various EPF Purchase Categories for Indigenous job seekers................................................................................................................................................ 42
Figure 23: Proportion of EPF transactions across various EPF Purchase Categories, Indigenous and non-Indigenous job seekers .................................................................................................................................................................. 42
Figure 24: Ratio of outcome rates for Indigenous compared to non-Indigenous job seekers for selected outcomes, by Stream of assistance, year to June 2011 ................................................................................................................ 47
Figure 25: Employer attitudes to employing Indigenous Australians (per cent) ........................................................ 60
8
1 Key Findings
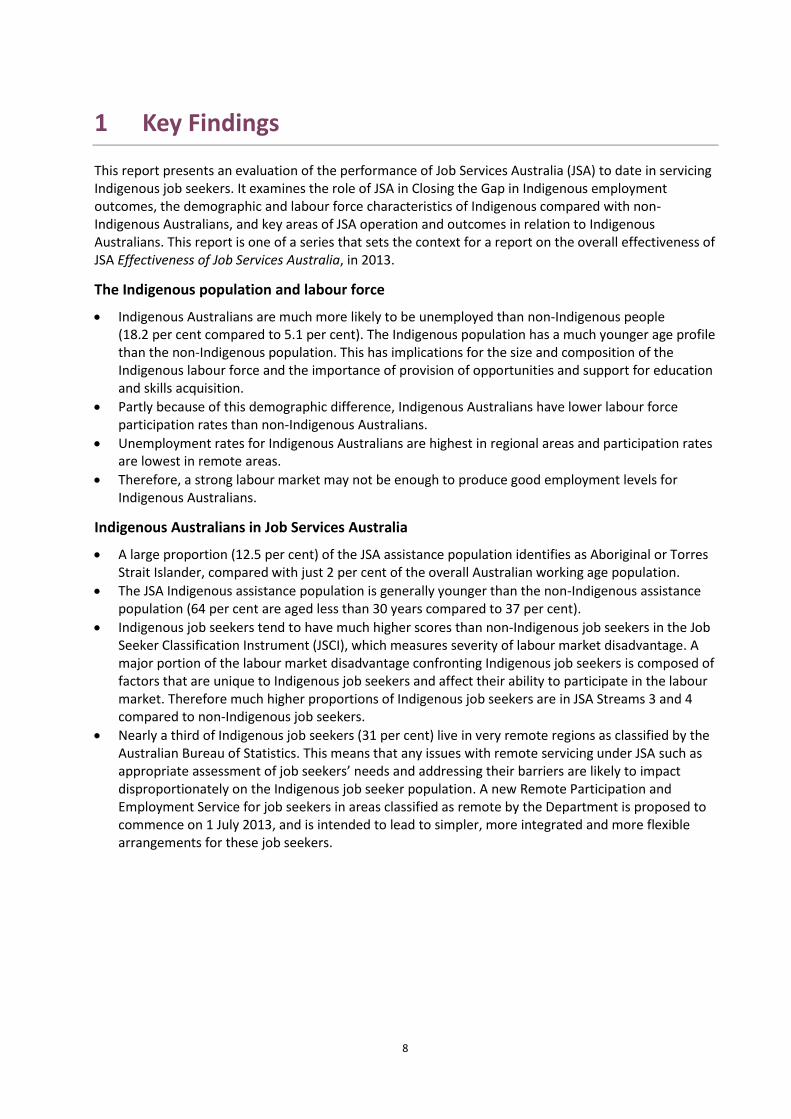
This report presents an evaluation of the performance of Job Services Australia (JSA) to date in servicing Indigenous job seekers. It examines the role of JSA in Closing the Gap in Indigenous employment outcomes, the demographic and labour force characteristics of Indigenous compared with non-Indigenous Australians, and key areas of JSA operation and outcomes in relation to Indigenous Australians. This report is one of a series that sets the context for a report on the overall effectiveness of JSA Effectiveness of Job Services Australia, in 2013.
The Indigenous population and labour force
Indigenous Australians are much more likely to be unemployed than non-Indigenous people (18.2 per cent compared to 5.1 per cent). The Indigenous population has a much younger age profile than the non-Indigenous population. This has implications for the size and composition of the Indigenous labour force and the importance of provision of opportunities and support for education and skills acquisition.
Partly because of this demographic difference, Indigenous Australians have lower labour force participation rates than non-Indigenous Australians.
Unemployment rates for Indigenous Australians are highest in regional areas and participation rates are lowest in remote areas.
Therefore, a strong labour market may not be enough to produce good employment levels for Indigenous Australians.
Indigenous Australians in Job Services Australia
A large proportion (12.5 per cent) of the JSA assistance population identifies as Aboriginal or Torres Strait Islander, compared with just 2 per cent of the overall Australian working age population.
The JSA Indigenous assistance population is generally younger than the non-Indigenous assistance population (64 per cent are aged less than 30 years compared to 37 per cent).
Indigenous job seekers tend to have much higher scores than non-Indigenous job seekers in the Job Seeker Classification Instrument (JSCI), which measures severity of labour market disadvantage. A major portion of the labour market disadvantage confronting Indigenous job seekers is composed of factors that are unique to Indigenous job seekers and affect their ability to participate in the labour market. Therefore much higher proportions of Indigenous job seekers are in JSA Streams 3 and 4 compared to non-Indigenous job seekers.
Nearly a third of Indigenous job seekers (31 per cent) live in very remote regions as classified by the Australian Bureau of Statistics. This means that any issues with remote servicing under JSA such as appropriate assessment of job seekers’ needs and addressing their barriers are likely to impact disproportionately on the Indigenous job seeker population. A new Remote Participation and Employment Service for job seekers in areas classified as remote by the Department is proposed to commence on 1 July 2013, and is intended to lead to simpler, more integrated and more flexible arrangements for these job seekers.
9
Participation in Job Services Australia
The physical environment service providers create is important in supporting the engagement of Indigenous job seekers. Job seekers report that they are more likely to engage with service providers who make them feel welcome as Aboriginal or Torres Strait Islander people.
Service providers report that employing Indigenous staff in service delivery roles is effective in improving their organisation’s ability to work with local Indigenous organisations and communities.
After controlling for Stream, geographic location, and other factors, in comparison to non-Indigenous job seekers, Indigenous job seekers:
o are 21 per cent less likely to attend their initial appointment.
o are 26 per cent less likely to attend engagement appointments.
Indigenous job seekers are therefore more likely to be subject to action under the JSA compliance framework. Any issues associated with the operation of compliance processes may impact disproportionately on Indigenous job seekers.
Expenditure through the Employment Pathway Fund (EPF) for Indigenous job seekers on the whole reflects the greater levels of disadvantage faced by them, with Indigenous job seekers receiving on average more assistance through the EPF than non-Indigenous job seekers. However while Indigenous job seekers in Streams 1 to 3 who receive assistance through the EPF receive, on average, more EPF than non-Indigenous job seekers, the reverse is true for those in Stream 4.
The proportion of EPF expenditure on Indigenous job seekers that is attributed to training and to outreach services is higher than for non-Indigenous job seekers, while the proportion spent on wage subsidies and reverse marketing is lower
Outcomes of JSA Services
Across all positive outcomes (employment, and education or training outcomes), Indigenous job seekers had a lower outcome rate than non-Indigenous job seekers.
However, for some outcome types Indigenous job seekers achieved better outcome rates than non-Indigenous job seekers.
Compared to non Indigenous job seekers, three months after leaving JSA assistance Indigenous job seekers:
o had higher rates of full-time employment in Streams 3 and 4
o had lower rates of part-time employment across all Streams
o had higher rates of unemployment across all Streams
o had higher rates of education and training outcomes in Streams 1 and 2, but lower rates
of education and training outcomes in Streams 3 and 4
o were less likely to have left the labour force
o were less likely to have left income support.
Indigenous men in Stream 3 achieved relatively strong off-benefit outcomes compared to non-Indigenous men in the same Stream.
10
Supporting Indigenous Employment
The number of Indigenous staff employed by JSA service providers increased, on average, by 1.1 staff members per organisation between 2009 and 2010. However, service providers could do more to use their Indigenous Employment Strategy (IES) effectively within their organisations.
Service providers report that employing Indigenous staff in service delivery roles helps their organisation to work with Indigenous clients, Indigenous communities, and improve outcomes for Indigenous job seekers.
Relationships between JSA and CDEP providers vary significantly across organisations. Service providers report that poor relationships can hamper their ability to effectively service job seekers.
11
2 Introduction
Job Services Australia (JSA) was introduced on 1 July 2009 to replace the previous employment service delivery model, Job Network. JSA provides a substantial proportion of the employment services used by Aboriginal and Torres Straits Islander people. A key objective of JSA is to help reduce the gap in employment outcomes between Aboriginal and Torres Strait Islander peoples and other Australians (DEEWR, 2008, 18).
2.1 Scope of this report
This report presents an evaluation of JSA’s performance to date in servicing Indigenous job seekers. It examines the role of JSA in Closing the Gap in Indigenous employment outcomes and the demographic and labour force characteristics of Indigenous compared with non-Indigenous Australians. The report also examines key areas of JSA operation and outcomes in relation to Indigenous Australians.
The report does not include systematic comparisons with previous employment service models, partly because the range of job seekers, and the variety of services offered inside JSA, is broader than the previous system.
A future report, Effectiveness of Job Services Australia, planned for 2013, will consider the broader effectiveness of JSA, including in servicing Indigenous Australians (DEEWR, 2009a).
2.2 Job Services Australia and Indigenous employment services
Job Services Australia, as specified in Employment Services Deed (ESD4) (DEEWR, 2009b) is the largest provider of employment services for Indigenous Australians. JSA providers and Community Development Employment Projects (CDEP) both play an important role in assisting Indigenous job seekers, working in partnership to develop a package of services for individual job seeker.
The Indigenous Employment Program (IEP), also administered by the Department, provides a range of tools to achieve employment and economic development for Indigenous Services. The IEP supports these objectives in a number of ways:
the IEP Employment Panel and the IEP Economic Development and Business Support Panel consist of organisations that can be contracted by the Department to assist in the provision of services under the IEP(DEEWR, 2011a); and
the Department also directly supports activities with employers, Indigenous businesses and organisations and Indigenous communities.
The JSA, CDEP and IEP provide parallel services for Indigenous job seekers. Under ESD4, JSA, CDEP and IEP providers are required to work in partnership to coordinate service delivery and maximise Indigenous work readiness and employment outcomes (DEEWR, 2009b, Clause 116).
Both the CDEP program and the IEP were reformed to coincide with the commencement of JSA in July 2009 to address Closing the Gap objectives.
Changes to CDEP include:
CDEP was removed from locations with established economies, and replaced by Job Services Australia as the main provider of employment services for Indigenous people. Individuals in these communities who were formerly paid wages under CDEP and are now instead receiving alternative income support benefits are no longer considered to be employed by the Australian Bureau of Statistics (ABS), unless they have commenced another form of paid employment.
The focus of the CDEP program in remote Indigenous communities was changed from directly providing employment to building the skills of participants to find jobs outside CDEP.
12
The CDEP funding model and program deliverables were changed to focus on outcomes in the specific areas of Work Readiness services and Community Development projects.
There is a new requirement for CDEP, JSA and Indigenous Employment Program (IEP) providers to work in partnership to provide greater support to Indigenous Australians in finding sustainable employment.
These reforms were supported by a jobs package, which allowed for the creation of around 2000 jobs in Government-funded service delivery and the establishment of 400 new traineeships and 60 ranger positions.
A variety of other programs and initiatives operate in the context of Indigenous employment services, including:
Other programs operated by the Department, including Disability Employment Services (DES), Jobs Fund, Jobs and Skills Expos, the New Enterprise Incentive Scheme (NEIS) and the Innovation Fund deliver employment assistance to Indigenous and other job seekers
Other Australian Government agency initiatives such as the Community Support Service run by the Department of Families, Housing, Community Services and Indigenous Affairs (FaHCSIA)
State and Territory Government programs
The Council of Australian Governments (COAG) National Partnership Agreement for Indigenous Economic Participation, signed in February 2009
The Australian Employment Covenant (AEC)
Aboriginal Employment Strategy Ltd
The Remote Enterprise Centre
Indigenous Business Australia.
2.3 Closing the Gap
“Closing the Gap” is a Council of Australian Governments initiative through the National Indigenous Reform Agreement, which aims to reduce the economic and social disparities between Aboriginal and Torres Strait Islander peoples and other Australians. The Closing the Gap agenda includes six specific and measurable targets across key areas of physical, social and economic wellbeing (FAHCSIA, 2010, 1-2):
1. Close the gap in life expectancy between Indigenous and non-Indigenous Australians within a generation.
2. Halve the gap in mortality rates for Indigenous children under five by 2018.
3. Ensure access to early childhood education for all Indigenous four year olds in remote communities by 2013.
4. Halve the gap in reading, writing and numeracy achievement for Indigenous children by 2018.
5. Halve the gap for Indigenous people aged 20-24 in Year 12 or equivalent attainment rates by 2020.
6. Halve the gap in employment outcomes between Indigenous and non-Indigenous Australians by 2018.
When Closing the Gap was announced, 53.8 per cent of Indigenous Australians aged 15 to 64 years were employed, compared to 75.0 per cent of non-Indigenous in the same age range, a gap of 21.2 percentage points. In order to achieve the target of halving the gap in employment outcomes by 2018, this disparity must be reduced to below 11 percentage points (FAHCSIA, 2010, 28 ).
2.4 The role of Job Services Australia in Closing the Gap
JSA was introduced with an expectation that, along with reforms to the Community Development Employment Projects (CDEP) and the Indigenous Employment Program (IEP), it would contribute to closing the gap in employment outcomes by providing effective employment services to Aboriginal and Torres Strait Islander people (DEEWR, 2011b).
13
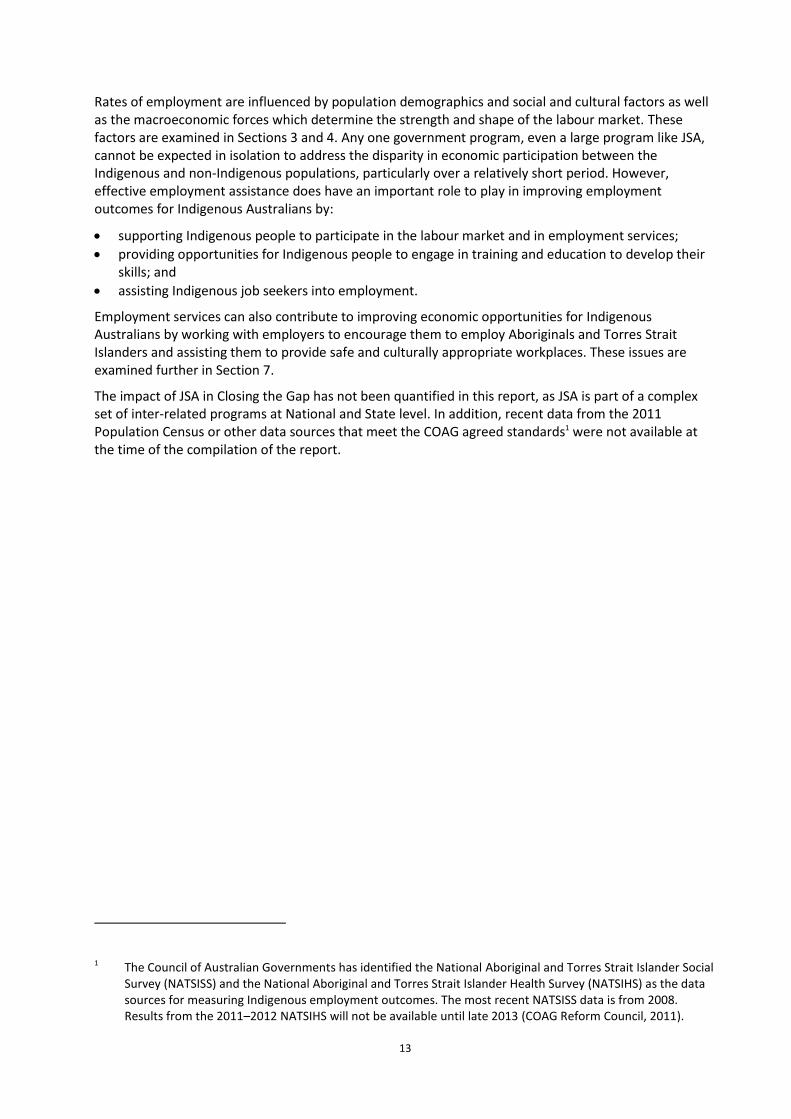
Rates of employment are influenced by population demographics and social and cultural factors as well as the macroeconomic forces which determine the strength and shape of the labour market. These factors are examined in Sections 3 and 4. Any one government program, even a large program like JSA, cannot be expected in isolation to address the disparity in economic participation between the Indigenous and non-Indigenous populations, particularly over a relatively short period. However, effective employment assistance does have an important role to play in improving employment outcomes for Indigenous Australians by:
supporting Indigenous people to participate in the labour market and in employment services;
providing opportunities for Indigenous people to engage in training and education to develop their skills; and
assisting Indigenous job seekers into employment.
Employment services can also contribute to improving economic opportunities for Indigenous Australians by working with employers to encourage them to employ Aboriginals and Torres Strait Islanders and assisting them to provide safe and culturally appropriate workplaces. These issues are examined further in Section 7.
The impact of JSA in Closing the Gap has not been quantified in this report, as JSA is part of a complex set of inter-related programs at National and State level. In addition, recent data from the 2011 Population Census or other data sources that meet the COAG agreed standards1 were not available at the time of the compilation of the report.
1 The Council of Australian Governments has identified the National Aboriginal and Torres Strait Islander Social
Survey (NATSISS) and the National Aboriginal and Torres Strait Islander Health Survey (NATSIHS) as the data sources for measuring Indigenous employment outcomes. The most recent NATSISS data is from 2008. Results from the 2011–2012 NATSIHS will not be available until late 2013 (COAG Reform Council, 2011).
14
3 The Indigenous Population and Labour Force
Key points
Indigenous Australians are much more likely to be unemployed than non-Indigenous people (18.2 per cent compared to 5.1 per cent).
The Indigenous population has a much younger age profile than the non-Indigenous population. This has implications for the size and composition of the Indigenous labour force and the importance of provision of opportunities and support for education and skills acquisition.
Indigenous Australians have lower labour force participation rates and higher unemployment rates than non-Indigenous Australians. Participation rates are lowest in remote areas, and unemployment rates are highest in regional areas, despite non-Indigenous unemployment being low in regional areas.
Therefore, a strong local labour market may not be enough to produce good employment rates for Indigenous Australians.
As the employment rate is influenced by population demographics and macro-economic forces, any evaluation of the contribution of JSA in improving Indigenous employment outcomes must take into account the differences in Indigenous and non-Indigenous population structures, geographic distributions and labour force participation rates.
This section examines the population structure and labour force participation characteristics of Aboriginal and Torres Strait Islander peoples and non-Indigenous Australians. It will mainly focus on people aged 15 to 64 years, the age span that is generally considered to be of working age (ABS, 2010). This is also the age range of almost all Aboriginal and Torres Strait Islander job seekers registered with JSA.
3.1 Population characteristics
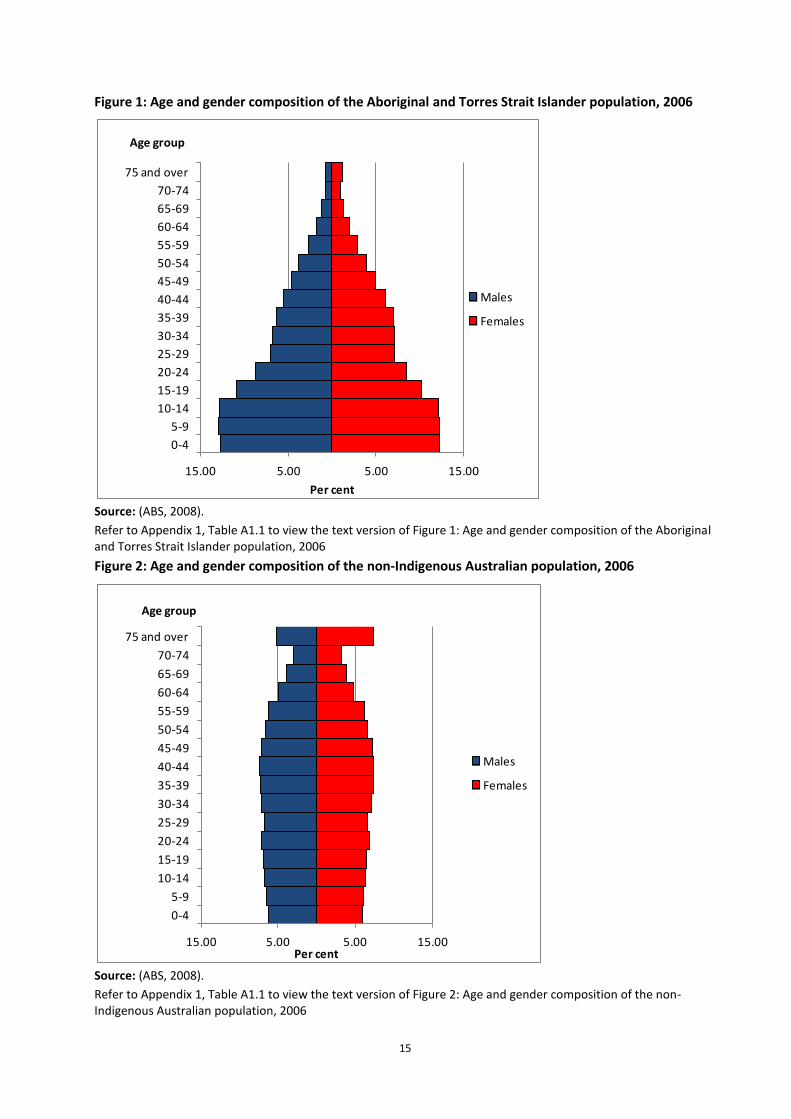
The Aboriginal and Torres Strait Islander population has a much younger age profile than the non-Indigenous Australian population2 (Figures 1 and 2, Table A1.1). A substantially higher proportion of the Aboriginal and Torres Strait Islander population is aged less than 30 years, compared with the non-Indigenous population. These differences in population age structure result in a smaller proportion of the Aboriginal and Torres Strait Islander population that is of working age, compared to the non-Indigenous population (59 per cent compared with 67 per cent, Table A1.1).
The younger age profile of the Indigenous population underlines the importance of encouraging and supporting education and skills acquisition opportunities as well as labour force participation of younger people in order to help close the gap in employment outcomes.
2 There are a number of estimates of the Aboriginal and Torres Strait Islander population available, including
experimental population data and population projections calculated by the Australian Bureau of Statistics (ABS, 2009) and by the Centre for Aboriginal Economic Policy Research (CAEPR) (Biddle and Taylor, 2009). In this section, estimates from the ABS for 2006 are used (ABS, 2008) as these are considered the most reliable estimates of both the Indigenous and non-Indigenous populations. The 2006 Census is the most recent Census for which detailed data is available.
15
Figure 1: Age and gender composition of the Aboriginal and Torres Strait Islander population, 2006
Source: (ABS, 2008).
Refer to Appendix 1, Table A1.1 to view the text version of Figure 1: Age and gender composition of the Aboriginal and Torres Strait Islander population, 2006
Figure 2: Age and gender composition of the non-Indigenous Australian population, 2006
Source: (ABS, 2008).
Refer to Appendix 1, Table A1.1 to view the text version of Figure 2: Age and gender composition of the non-Indigenous Australian population, 2006
15.00 5.00 5.00 15.00
0-4
5-9
10-14
15-19
20-24
25-29
30-34
35-39
40-44
45-49
50-54
55-59
60-64
65-69
70-74
75 and over
Per cent
Age group
Males
Females
15.00 5.00 5.00 15.00
0-4
5-9
10-14
15-19
20-24
25-29
30-34
35-39
40-44
45-49
50-54
55-59
60-64
65-69
70-74
75 and over
Per cent
Age group
Males
Females
16
3.2 Labour force participation
Reliable data on the Indigenous labour force are difficult to obtain owing to a number of statistical and methodological problems. In this section, results from the 2010 Labour Force Survey are used to describe the broad characteristics of the Indigenous labour force, as this is the most recent data source. However data in this section should be treated with some caution 3.
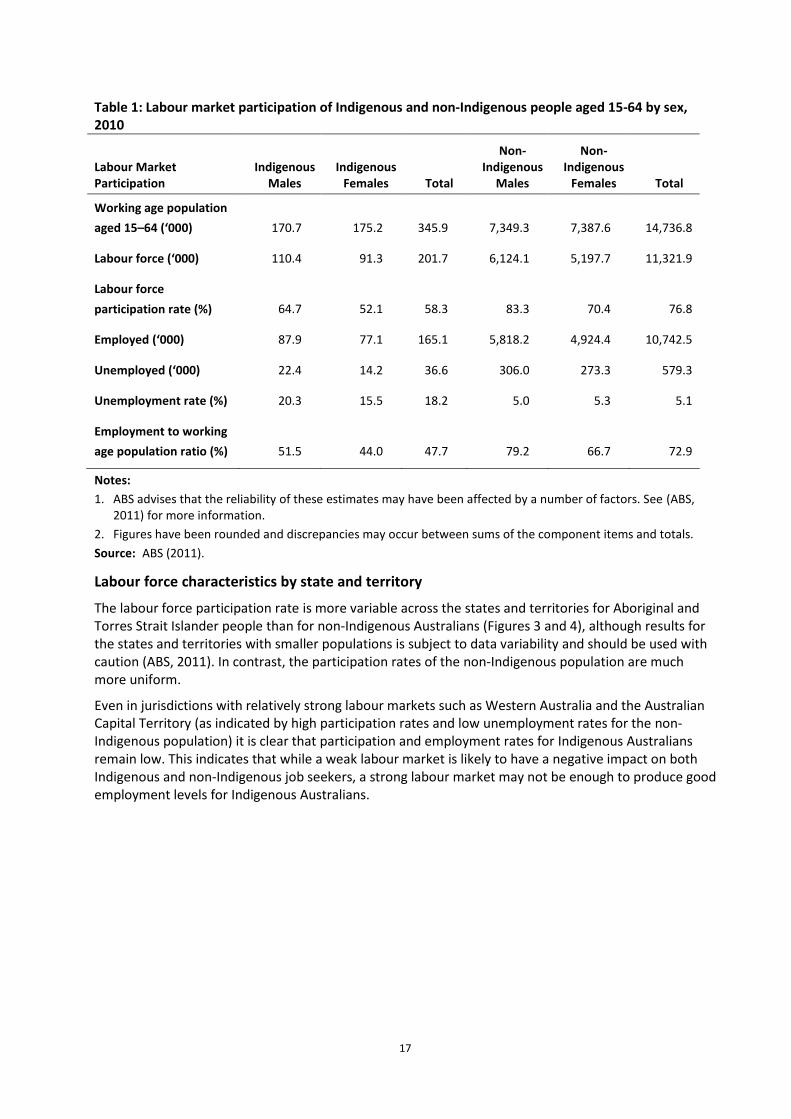
Indigenous Australians of working age have lower rates of participation in the labour market than non-Indigenous people in the same age range. In 2010, over 200 000 Aboriginal and Torres Strait Islander people or an estimated 58 per cent of those aged 15 to 64 years were participating in the labour market, compared with 77 per cent of non-Indigenous people (Table 1).
This could in part be due to the higher proportions of Aboriginal and Torres Strait Islander population in younger age groups that may still be engaged in education and training and therefore not in the labour force, although it should be noted that Indigenous school retention rates and higher education attainment rates are lower than those of non-Indigenous Australians (AIHW, 2011, 16). Lower participation rates may also be affected by higher rates of disability and disease in the Indigenous population that prevents or limits the labour force participation of many (AIHW, 2011). However, lower rates of participation by Indigenous Australians are also partly the result of the lack of employment and training opportunities in some labour markets and the lower skills levels of the Indigenous population, leading to discouraged job seekers leaving the labour force (AIHW, 2011, 19-21 -).
Of those who are participating in the labour force, Aboriginal and Torres Strait Islander people are much more likely than non-Indigenous people to be unemployed. In 2010, the overall unemployment rate for Indigenous Australians aged 15 to 64 was estimated at around 18 per cent, compared with 5.1 per cent for non-Indigenous Australians in the same age range (ABS, 2011). This varies considerably by state and territory, and by geographical location.
3 The Council of Australian Governments has identified the National Aboriginal and Torres Strait Islander Social
Survey (NATSISS) and the National Aboriginal and Torres Strait Islander Health Survey (NATSIHS) as the data sources for measuring Indigenous employment outcomes. The most recent NATSISS data is from 2008. Results from the 2011–2012 NATSIHS will not be available until late 2013 (COAG Reform Council, 2011).
17
Table 1: Labour market participation of Indigenous and non-Indigenous people aged 15-64 by sex, 2010
Labour Market Participation
Indigenous Males
Indigenous Females Total
Non-Indigenous
Males
Non-Indigenous
Females Total
Working age population
aged 15–64 (‘000) 170.7 175.2 345.9 7,349.3 7,387.6 14,736.8
Labour force (‘000) 110.4 91.3 201.7 6,124.1 5,197.7 11,321.9
Labour force
participation rate (%) 64.7 52.1 58.3 83.3 70.4 76.8
Employed (‘000) 87.9 77.1 165.1 5,818.2 4,924.4 10,742.5
Unemployed (‘000) 22.4 14.2 36.6 306.0 273.3 579.3
Unemployment rate (%) 20.3 15.5 18.2 5.0 5.3 5.1
Employment to working
age population ratio (%) 51.5 44.0 47.7 79.2 66.7 72.9
Notes:
1. ABS advises that the reliability of these estimates may have been affected by a number of factors. See (ABS, 2011) for more information.
2. Figures have been rounded and discrepancies may occur between sums of the component items and totals.
Source: ABS (2011).
Labour force characteristics by state and territory
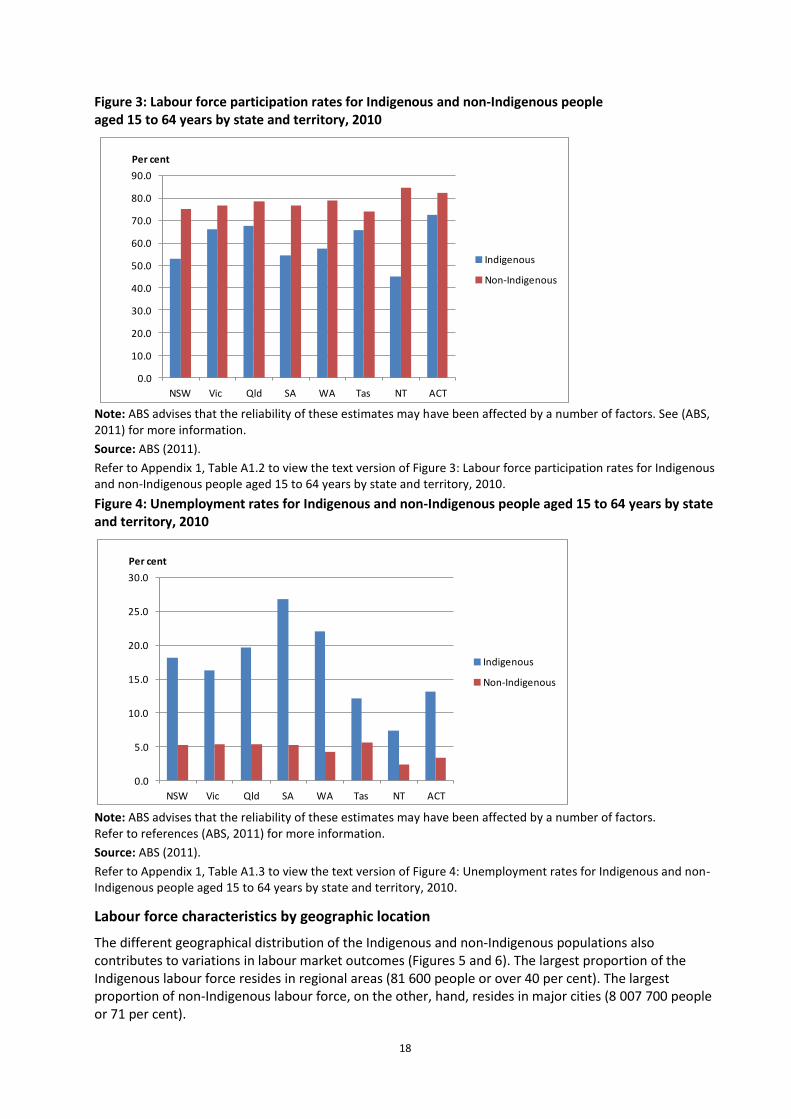
The labour force participation rate is more variable across the states and territories for Aboriginal and Torres Strait Islander people than for non-Indigenous Australians (Figures 3 and 4), although results for the states and territories with smaller populations is subject to data variability and should be used with caution (ABS, 2011). In contrast, the participation rates of the non-Indigenous population are much more uniform.
Even in jurisdictions with relatively strong labour markets such as Western Australia and the Australian Capital Territory (as indicated by high participation rates and low unemployment rates for the non-Indigenous population) it is clear that participation and employment rates for Indigenous Australians remain low. This indicates that while a weak labour market is likely to have a negative impact on both Indigenous and non-Indigenous job seekers, a strong labour market may not be enough to produce good employment levels for Indigenous Australians.
18
Figure 3: Labour force participation rates for Indigenous and non-Indigenous people aged 15 to 64 years by state and territory, 2010
Note: ABS advises that the reliability of these estimates may have been affected by a number of factors. See (ABS, 2011) for more information.
Source: ABS (2011).
Refer to Appendix 1, Table A1.2 to view the text version of Figure 3: Labour force participation rates for Indigenous and non-Indigenous people aged 15 to 64 years by state and territory, 2010.
Figure 4: Unemployment rates for Indigenous and non-Indigenous people aged 15 to 64 years by state and territory, 2010
Note: ABS advises that the reliability of these estimates may have been affected by a number of factors. Refer to references (ABS, 2011) for more information.
Source: ABS (2011).
Refer to Appendix 1, Table A1.3 to view the text version of Figure 4: Unemployment rates for Indigenous and non-Indigenous people aged 15 to 64 years by state and territory, 2010.
Labour force characteristics by geographic location
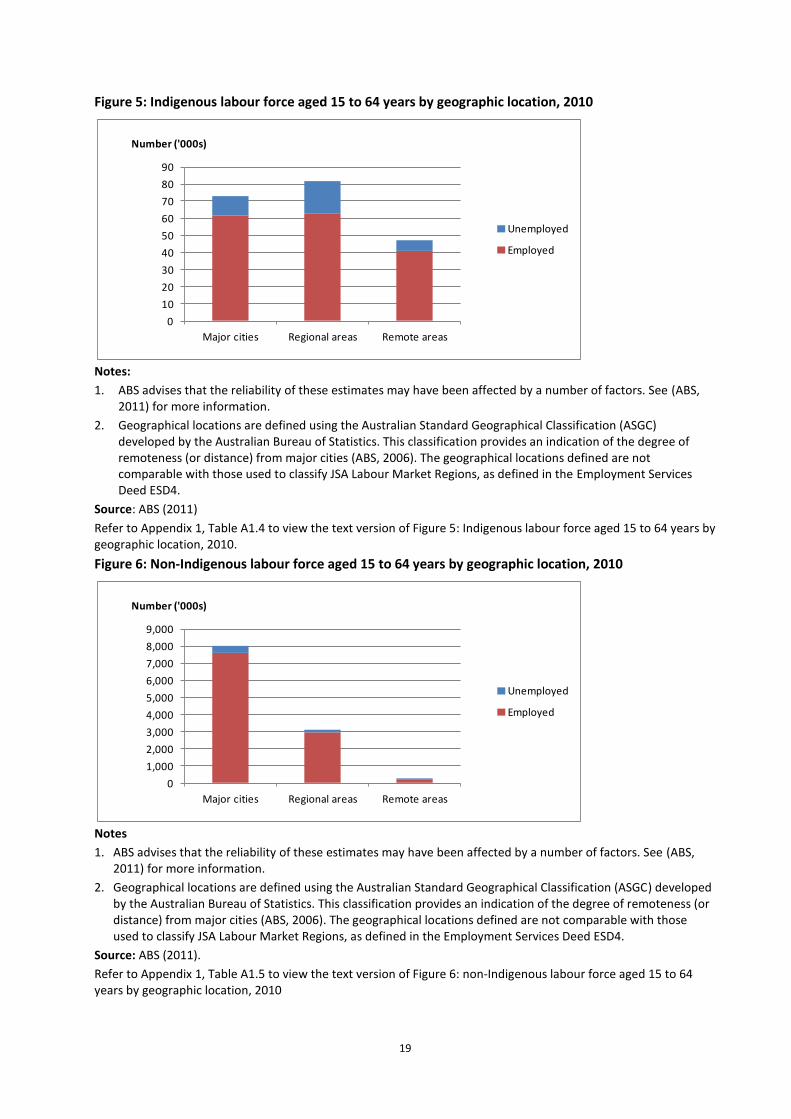
The different geographical distribution of the Indigenous and non-Indigenous populations also contributes to variations in labour market outcomes (Figures 5 and 6). The largest proportion of the Indigenous labour force resides in regional areas (81 600 people or over 40 per cent). The largest proportion of non-Indigenous labour force, on the other, hand, resides in major cities (8 007 700 people or 71 per cent).
0.0
10.0
20.0
30.0
40.0
50.0
60.0
70.0
80.0
90.0
NSW Vic Qld SA WA Tas NT ACT
Per cent
Indigenous
Non-Indigenous
0.0
5.0
10.0
15.0
20.0
25.0
30.0
NSW Vic Qld SA WA Tas NT ACT
Per cent
Indigenous
Non-Indigenous
19
Figure 5: Indigenous labour force aged 15 to 64 years by geographic location, 2010
Notes:
1. ABS advises that the reliability of these estimates may have been affected by a number of factors. See (ABS, 2011) for more information.
2. Geographical locations are defined using the Australian Standard Geographical Classification (ASGC) developed by the Australian Bureau of Statistics. This classification provides an indication of the degree of remoteness (or distance) from major cities (ABS, 2006). The geographical locations defined are not comparable with those used to classify JSA Labour Market Regions, as defined in the Employment Services Deed ESD4.
Source: ABS (2011)
Refer to Appendix 1, Table A1.4 to view the text version of Figure 5: Indigenous labour force aged 15 to 64 years by geographic location, 2010.
Figure 6: Non-Indigenous labour force aged 15 to 64 years by geographic location, 2010
Notes
1. ABS advises that the reliability of these estimates may have been affected by a number of factors. See (ABS, 2011) for more information.
2. Geographical locations are defined using the Australian Standard Geographical Classification (ASGC) developed by the Australian Bureau of Statistics. This classification provides an indication of the degree of remoteness (or distance) from major cities (ABS, 2006). The geographical locations defined are not comparable with those used to classify JSA Labour Market Regions, as defined in the Employment Services Deed ESD4.
Source: ABS (2011).
Refer to Appendix 1, Table A1.5 to view the text version of Figure 6: non-Indigenous labour force aged 15 to 64 years by geographic location, 2010
0
10
20
30
40
50
60
70
80
90
Major cities Regional areas Remote areas
Number ('000s)
Unemployed
Employed
0
1,000
2,000
3,000
4,000
5,000
6,000
7,000
8,000
9,000
Major cities Regional areas Remote areas
Number ('000s)
Unemployed
Employed
20
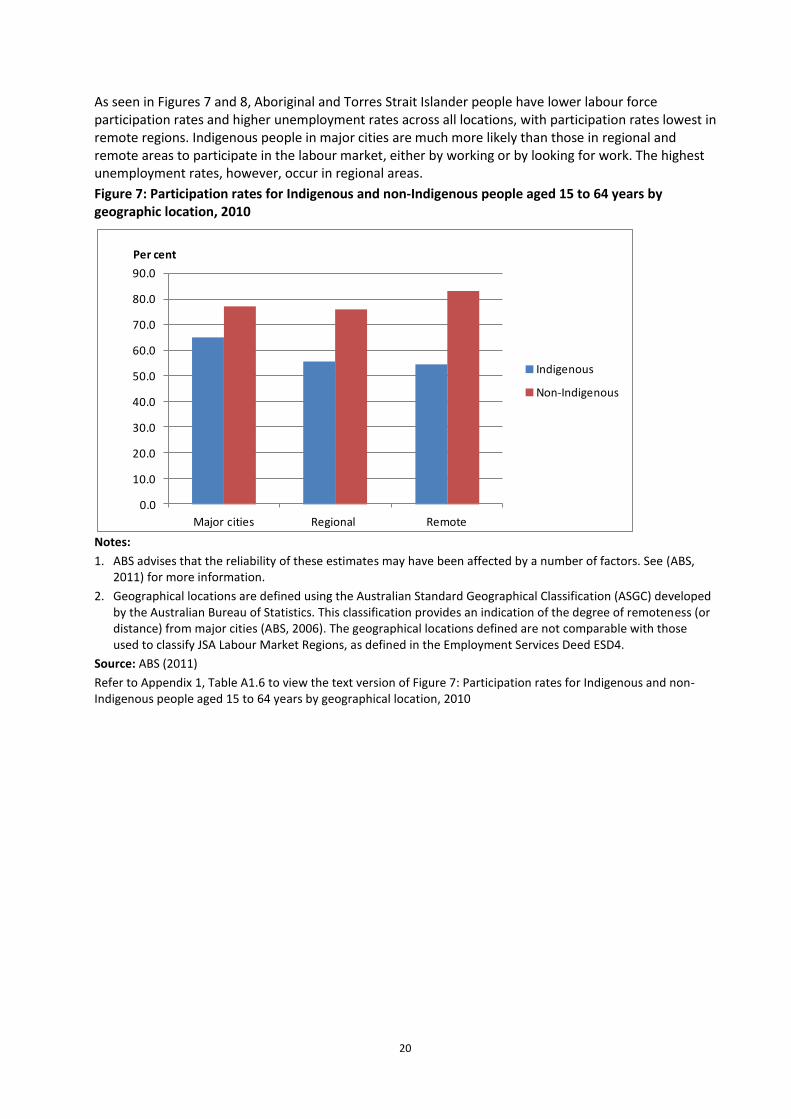
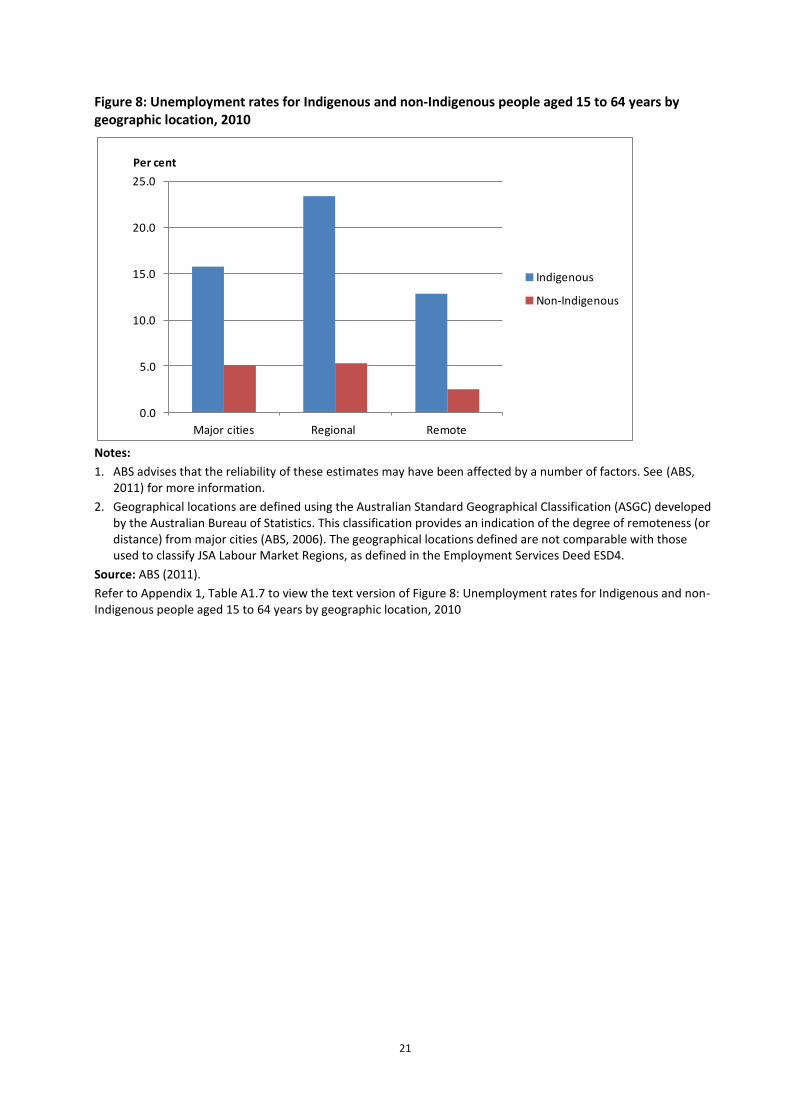
As seen in Figures 7 and 8, Aboriginal and Torres Strait Islander people have lower labour force participation rates and higher unemployment rates across all locations, with participation rates lowest in remote regions. Indigenous people in major cities are much more likely than those in regional and remote areas to participate in the labour market, either by working or by looking for work. The highest unemployment rates, however, occur in regional areas.
Figure 7: Participation rates for Indigenous and non-Indigenous people aged 15 to 64 years by geographic location, 2010
Notes:
1. ABS advises that the reliability of these estimates may have been affected by a number of factors. See (ABS, 2011) for more information.
2. Geographical locations are defined using the Australian Standard Geographical Classification (ASGC) developed by the Australian Bureau of Statistics. This classification provides an indication of the degree of remoteness (or distance) from major cities (ABS, 2006). The geographical locations defined are not comparable with those used to classify JSA Labour Market Regions, as defined in the Employment Services Deed ESD4.
Source: ABS (2011)
Refer to Appendix 1, Table A1.6 to view the text version of Figure 7: Participation rates for Indigenous and non-Indigenous people aged 15 to 64 years by geographical location, 2010
0.0
10.0
20.0
30.0
40.0
50.0
60.0
70.0
80.0
90.0
Major cities Regional Remote
Per cent
Indigenous
Non-Indigenous
21
Figure 8: Unemployment rates for Indigenous and non-Indigenous people aged 15 to 64 years by geographic location, 2010
Notes:
1. ABS advises that the reliability of these estimates may have been affected by a number of factors. See (ABS, 2011) for more information.
2. Geographical locations are defined using the Australian Standard Geographical Classification (ASGC) developed by the Australian Bureau of Statistics. This classification provides an indication of the degree of remoteness (or distance) from major cities (ABS, 2006). The geographical locations defined are not comparable with those used to classify JSA Labour Market Regions, as defined in the Employment Services Deed ESD4.
Source: ABS (2011).
Refer to Appendix 1, Table A1.7 to view the text version of Figure 8: Unemployment rates for Indigenous and non-Indigenous people aged 15 to 64 years by geographic location, 2010
0.0
5.0
10.0
15.0
20.0
25.0
Major cities Regional Remote
Per cent
Indigenous
Non-Indigenous
22
4 Indigenous Australians in Job Services Australia
Key points
A relatively large proportion (12.5 per cent) of the JSA assistance population identifies as Aboriginal or Torres Strait Islander, compared with just 2 per cent of the overall Australian working age population.
The JSA Indigenous assistance population is generally younger than the non-Indigenous (64 per cent aged less than 30 years compared to 37 per cent respectively).
Indigenous job seekers tend to have much higher scores than non-Indigenous job seekers in the Job Seeker Classification Instrument (JSCI), which measures severity of labour market disadvantage. A major portion of the labour market disadvantage confronting Indigenous job seekers is composed of factors that are unique to Indigenous job seekers and affect their ability to participate in the labour market. Therefore much higher proportions of Indigenous job seekers are in JSA Streams 3 and 4 compared to non-Indigenous job seekers.
Indigenous job seekers are more likely to be unemployed for longer durations than non-Indigenous job seekers.
Nearly a third of Indigenous job seekers (31 per cent) live in very remote regions as classified by the Australian Bureau of Statistics. This means that any issues with remote servicing under JSA are likely to impact disproportionately on the Indigenous job seeker population.
This section describes the JSA assistance population, and in particular the Indigenous component, and outlines some of the challenges that must be met in order to improve Indigenous employment outcomes.
4.1 Characteristics of Indigenous job seekers in Job Services Australia
At the end of November 2011, 89 000 people or about 12.5 per cent of all JSA job seekers identified as Aboriginal or Torres Strait Islander, compared with around 2 per cent of the overall Australian working age population4. The proportion of job seekers that identify as Aboriginal or Torres Strait Islander has increased from 10.7 per cent (around 87,300 job seekers) in June 2009, the last month of Job Network. The apparent discrepancy between the larger number of Indigenous job seekers in JSA and the ABS’s Labour Force Survey latest results (2010) estimates of unemployed Indigenous people can be explained by substantial differences between the criteria for eligibility to receive benefits in JSA and the Labour Force Survey definition of being unemployed. An important difference is that it is possible to be employed less than full-time and still be active in JSA whereas the Labour Force Survey classifies people as employed if they have worked for at least one hour in a reference week5. Aboriginal and Torres Strait Islander job seekers on the JSA caseload, the Indigenous assistance population, differ in several respects from those in the non-Indigenous assistance population. It has a higher proportion of younger job seekers, higher proportions of job seekers in regional and remote areas, and higher proportions of job seekers with vocational and non-vocational barriers to employment.
4 In this report, all job seekers who have been referred to Job Services Australia by the relevant dates are
included, regardless of whether they have commenced service or whether the requirement to provide Stream services to them has been suspended.
5 For further information on the differences between ABS data and DEEWR estimates of job seeker numbers, see (DEEWR, 2011c).
23
Age and sex
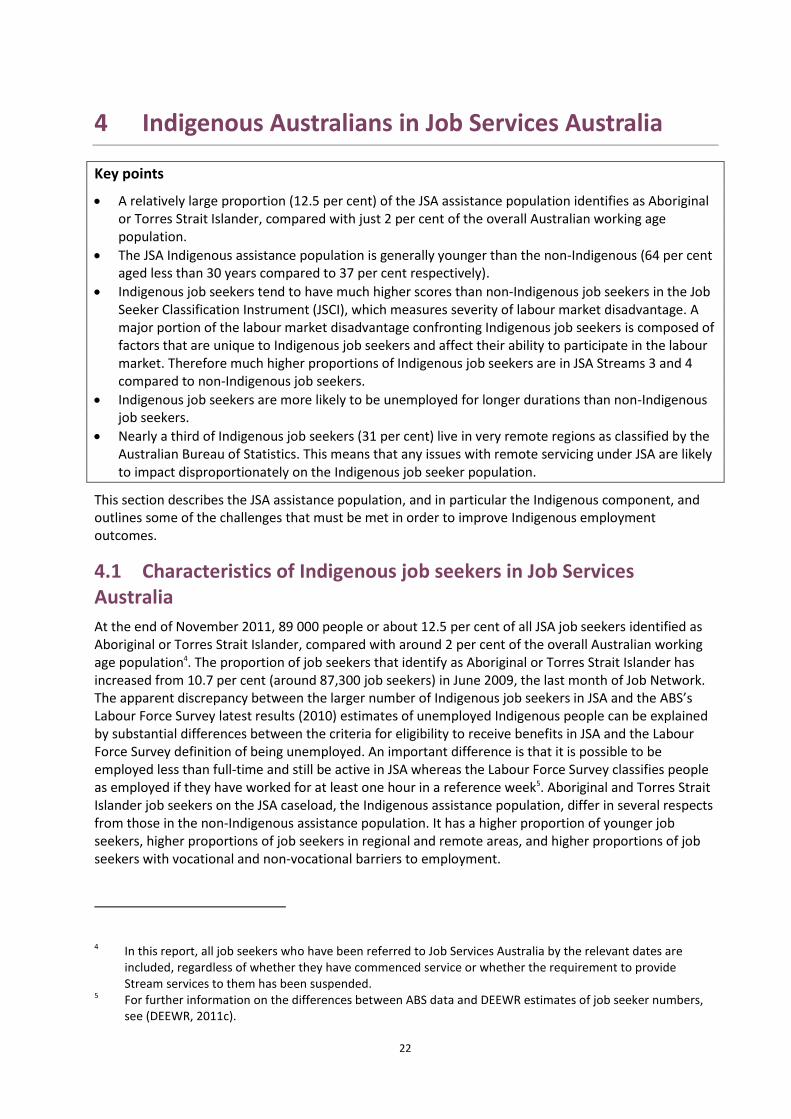
The JSA assistance population is generally younger than both the overall working age population and the non-Indigenous job seeker population. Both Indigenous and non-Indigenous young men are over-represented in the JSA population, but this is particularly marked for young Indigenous men. Young non-Indigenous women are also over-represented in the 20-24 year age group, while Indigenous women generally are under-represented. The older age groups (from 40-44 years for Indigenous people and 45-49 years for non-Indigenous people) are also generally under-represented in the JSA population (Figures 9 and 10).
Clearly, issues relating to the servicing of young people, and particularly young men, are likely to have a proportionately larger impact on Aboriginal and Torres Strait Islander job seekers than on the non-Indigenous JSA population.
Figure 9: Age and sex proportions of Indigenous JSA clients (November 2011) and the working age population for Aboriginal and Torres Strait Islander peoples (June 2006)
Note: Data presented represent the each age and sex group as a proportion of the total populations of JSA -Indigenous clients and the Indigenous working age population.
Source: (ABS, 2008); DEEWR administrative systems.
Refer to Appendix 1, Table A1.8 to view the text version of Figure 9: Age and sex proportions of Indigenous JSA clients (November 2011) and the working age population for Aboriginal and Torres Strait Islander peoples (June 2006)
0.0
2.0
4.0
6.0
8.0
10.0
12.0
15-19 20-24 25-29 30-34 35-39 40-44 45-49 50-54 55-59 60-64
Per cent
Indigenous female JSA Indigenous male JSA
Indigenous female pop Indigenous male pop
24
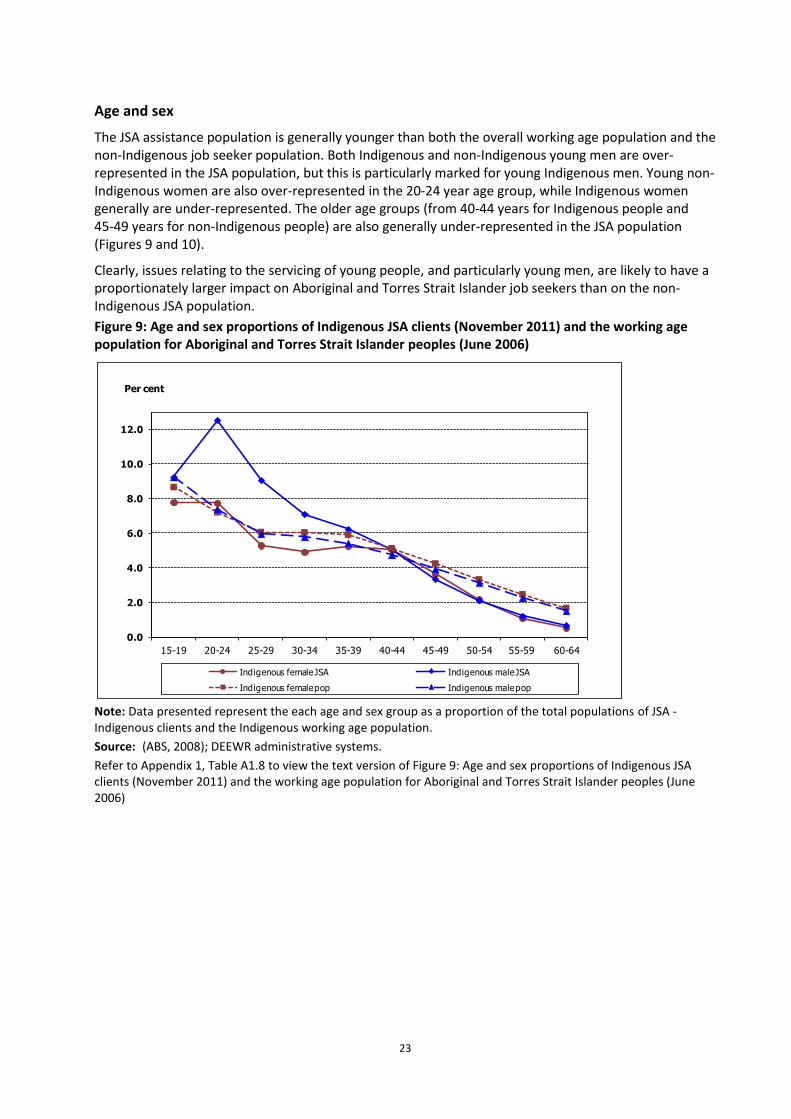
Figure 10: Age and sex proportions of non-Indigenous JSA clients (November 2011) and the working age population for non-Indigenous people (June 2006)
Note: Data presented represent the each age and sex group as a proportion of the total populations of JSA non-Indigenous clients and the non-Indigenous working age population.
Source: (ABS, 2008); DEEWR administrative systems.
Refer to Appendix 1, Table A1.9 to view the text version of Figure 10: Age and sex proportions of non-Indigenous JSA clients (November 2011) and the working age population for non-Indigenous people (June 2006)
The age and sex composition of the Indigenous JSA population is broadly similar to that of the previous employment service, Job Network (JN). One point of difference is that the proportions of female Indigenous and female non-Indigenous job seekers have increased over time. This is described more comprehensively in the separate evaluation report on the impact of the global economic downturn on JSA (DEEWR, 2011d).
Unemployment Duration
Indigenous job seekers are more likely to be unemployed for longer durations than non-Indigenous job seekers.
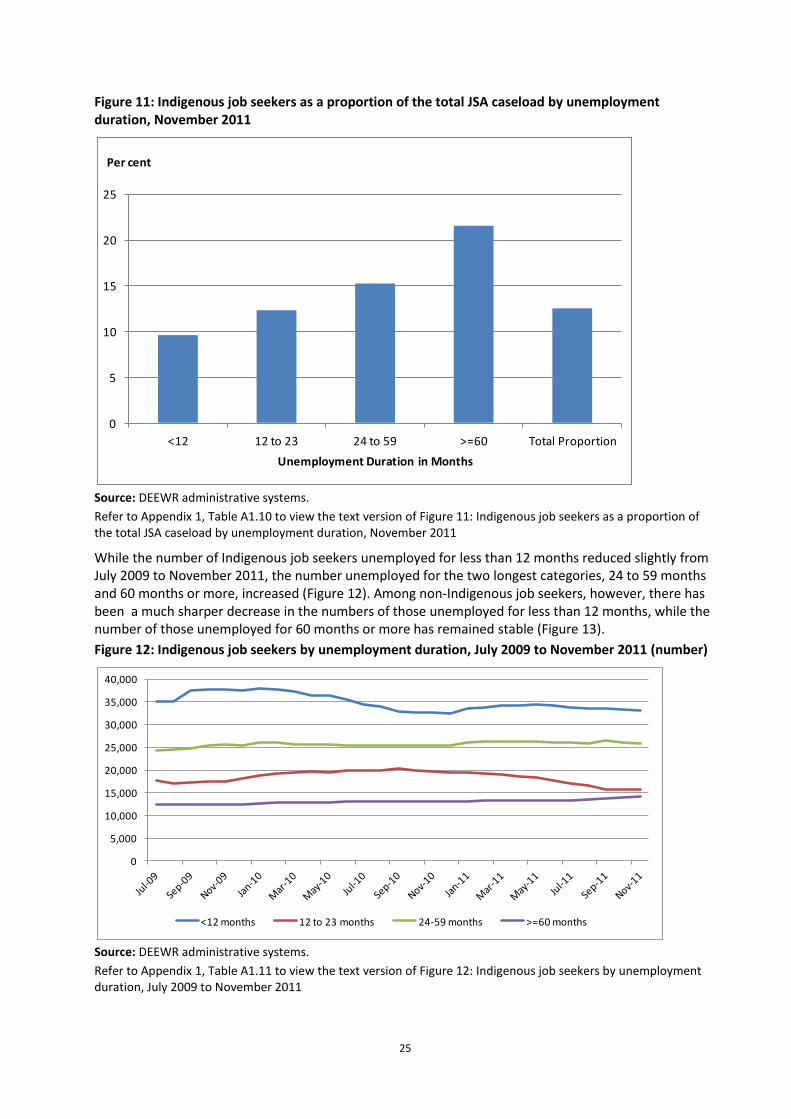
The proportion of Indigenous job seekers in the total job seeker caseload is higher among job seekers who have been unemployed for longer durations. While at the end of November 2011, Indigenous job seekers made up approximately 12.5 per cent of the JSA caseload, this proportion increases to 22 per cent for job seekers who have been unemployed for a period of 60 months or more. Conversely the proportion of Indigenous job seekers among job seekers who have been unemployed for less than 12 months is just below 10 per cent (Figure 11), and Indigenous job seekers comprise 7.2 per cent of initial referrals to JSA services from July 2009 to November 2011. The over-representation of Indigenous job seekers among the longer term unemployed further highlights the barriers faced by Indigenous job seekers in finding employment.
0.0
2.0
4.0
6.0
8.0
10.0
12.0
15-19 20-24 25-29 30-34 35-39 40-44 45-49 50-54 55-59 60-64
Per cent
Non-Indig female JSA Non-Indig male JSA
Non-Indig female pop Non-Indig male pop
25
Figure 11: Indigenous job seekers as a proportion of the total JSA caseload by unemployment duration, November 2011
Source: DEEWR administrative systems.
Refer to Appendix 1, Table A1.10 to view the text version of Figure 11: Indigenous job seekers as a proportion of the total JSA caseload by unemployment duration, November 2011
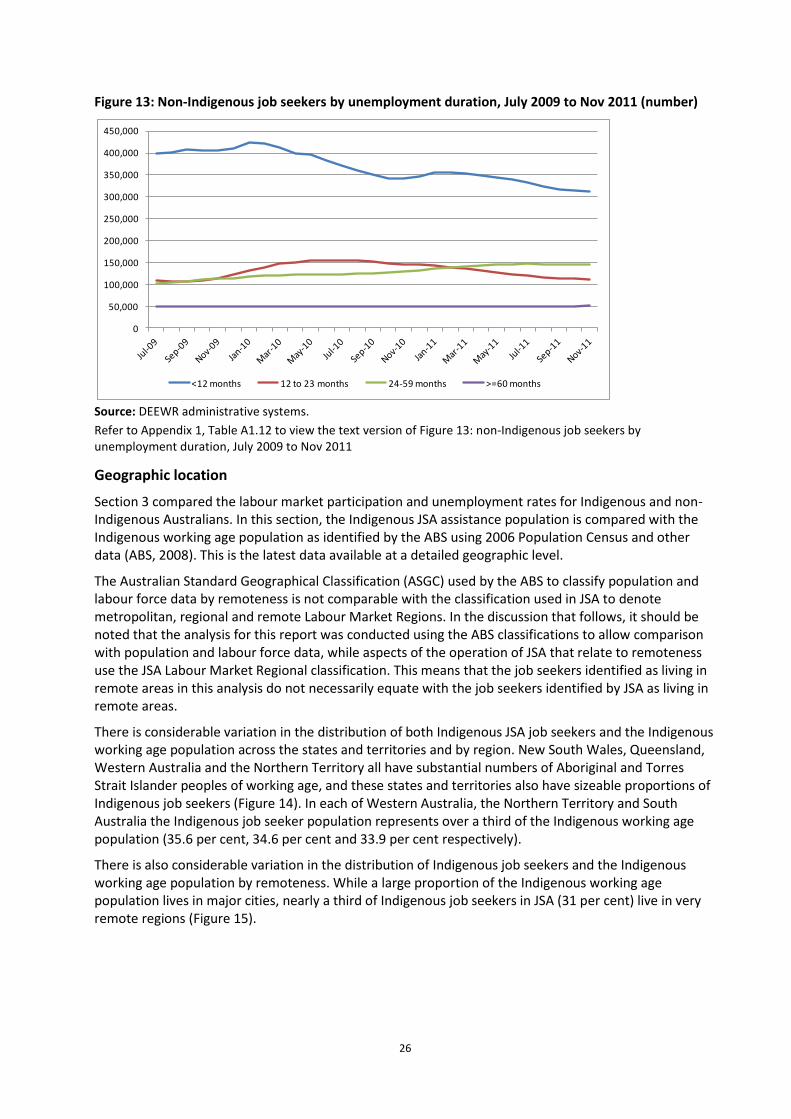
While the number of Indigenous job seekers unemployed for less than 12 months reduced slightly from July 2009 to November 2011, the number unemployed for the two longest categories, 24 to 59 months and 60 months or more, increased (Figure 12). Among non-Indigenous job seekers, however, there has been a much sharper decrease in the numbers of those unemployed for less than 12 months, while the number of those unemployed for 60 months or more has remained stable (Figure 13).
Figure 12: Indigenous job seekers by unemployment duration, July 2009 to November 2011 (number)
Source: DEEWR administrative systems.
Refer to Appendix 1, Table A1.11 to view the text version of Figure 12: Indigenous job seekers by unemployment duration, July 2009 to November 2011
0
5
10
15
20
25
<12 12 to 23 24 to 59 >=60 Total Proportion
Per cent
Unemployment Duration in Months
0
5,000
10,000
15,000
20,000
25,000
30,000
35,000
40,000
<12 months 12 to 23 months 24-59 months >=60 months
26
Figure 13: Non-Indigenous job seekers by unemployment duration, July 2009 to Nov 2011 (number)
Source: DEEWR administrative systems.
Refer to Appendix 1, Table A1.12 to view the text version of Figure 13: non-Indigenous job seekers by unemployment duration, July 2009 to Nov 2011
Geographic location
Section 3 compared the labour market participation and unemployment rates for Indigenous and non-Indigenous Australians. In this section, the Indigenous JSA assistance population is compared with the Indigenous working age population as identified by the ABS using 2006 Population Census and other data (ABS, 2008). This is the latest data available at a detailed geographic level.
The Australian Standard Geographical Classification (ASGC) used by the ABS to classify population and labour force data by remoteness is not comparable with the classification used in JSA to denote metropolitan, regional and remote Labour Market Regions. In the discussion that follows, it should be noted that the analysis for this report was conducted using the ABS classifications to allow comparison with population and labour force data, while aspects of the operation of JSA that relate to remoteness use the JSA Labour Market Regional classification. This means that the job seekers identified as living in remote areas in this analysis do not necessarily equate with the job seekers identified by JSA as living in remote areas.
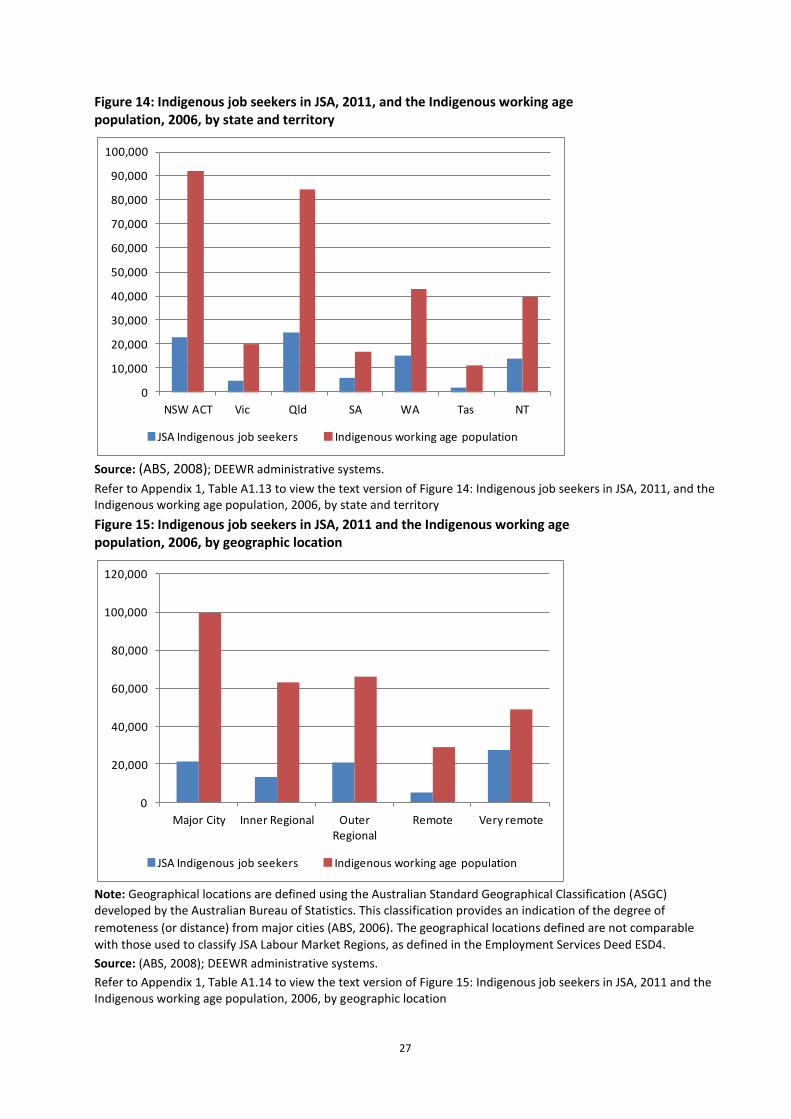
There is considerable variation in the distribution of both Indigenous JSA job seekers and the Indigenous working age population across the states and territories and by region. New South Wales, Queensland, Western Australia and the Northern Territory all have substantial numbers of Aboriginal and Torres Strait Islander peoples of working age, and these states and territories also have sizeable proportions of Indigenous job seekers (Figure 14). In each of Western Australia, the Northern Territory and South Australia the Indigenous job seeker population represents over a third of the Indigenous working age population (35.6 per cent, 34.6 per cent and 33.9 per cent respectively).
There is also considerable variation in the distribution of Indigenous job seekers and the Indigenous working age population by remoteness. While a large proportion of the Indigenous working age population lives in major cities, nearly a third of Indigenous job seekers in JSA (31 per cent) live in very remote regions (Figure 15).
0
50,000
100,000
150,000
200,000
250,000
300,000
350,000
400,000
450,000
<12 months 12 to 23 months 24-59 months >=60 months
27
Figure 14: Indigenous job seekers in JSA, 2011, and the Indigenous working age population, 2006, by state and territory
Source: (ABS, 2008); DEEWR administrative systems.
Refer to Appendix 1, Table A1.13 to view the text version of Figure 14: Indigenous job seekers in JSA, 2011, and the Indigenous working age population, 2006, by state and territory
Figure 15: Indigenous job seekers in JSA, 2011 and the Indigenous working age population, 2006, by geographic location
Note: Geographical locations are defined using the Australian Standard Geographical Classification (ASGC) developed by the Australian Bureau of Statistics. This classification provides an indication of the degree of
remoteness (or distance) from major cities (ABS, 2006). The geographical locations defined are not comparable
with those used to classify JSA Labour Market Regions, as defined in the Employment Services Deed ESD4.
Source: (ABS, 2008); DEEWR administrative systems.
Refer to Appendix 1, Table A1.14 to view the text version of Figure 15: Indigenous job seekers in JSA, 2011 and the Indigenous working age population, 2006, by geographic location
0
10,000
20,000
30,000
40,000
50,000
60,000
70,000
80,000
90,000
100,000
NSW ACT Vic Qld SA WA Tas NT
JSA Indigenous job seekers Indigenous working age population
0
20,000
40,000
60,000
80,000
100,000
120,000
Major City Inner Regional Outer Regional
Remote Very remote
JSA Indigenous job seekers Indigenous working age population
28
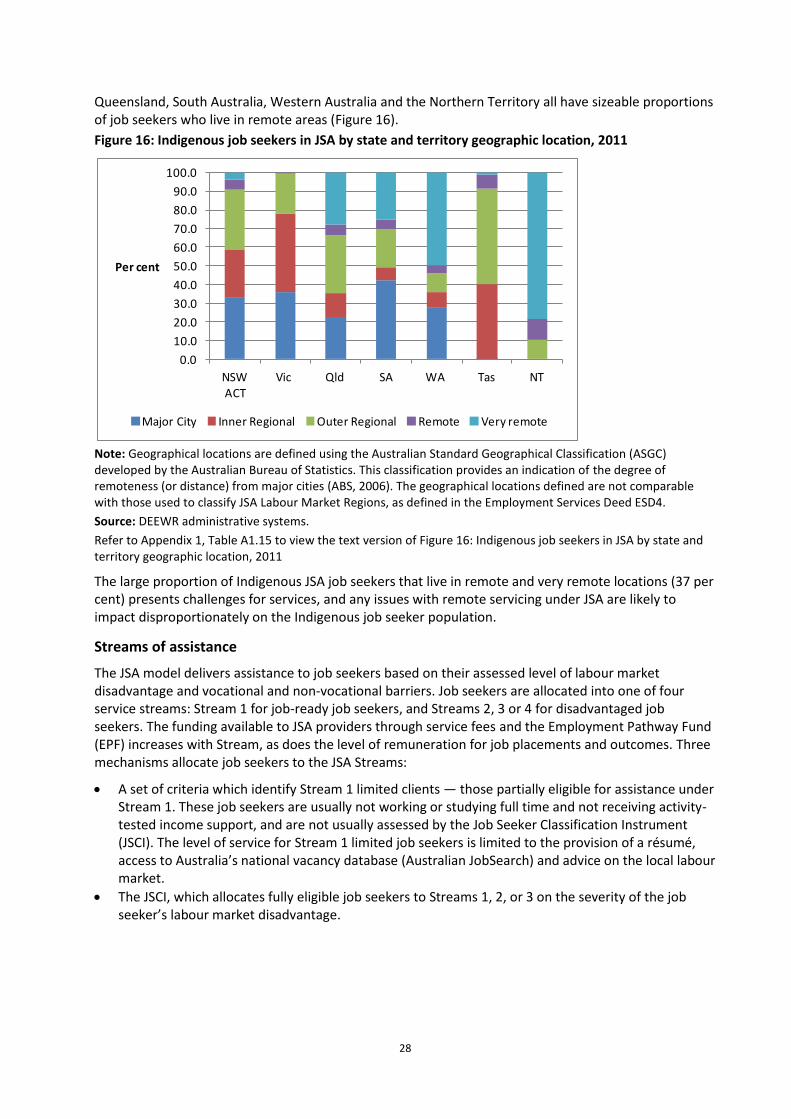
Queensland, South Australia, Western Australia and the Northern Territory all have sizeable proportions of job seekers who live in remote areas (Figure 16).
Figure 16: Indigenous job seekers in JSA by state and territory geographic location, 2011
Note: Geographical locations are defined using the Australian Standard Geographical Classification (ASGC) developed by the Australian Bureau of Statistics. This classification provides an indication of the degree of remoteness (or distance) from major cities (ABS, 2006). The geographical locations defined are not comparable with those used to classify JSA Labour Market Regions, as defined in the Employment Services Deed ESD4.
Source: DEEWR administrative systems.
Refer to Appendix 1, Table A1.15 to view the text version of Figure 16: Indigenous job seekers in JSA by state and territory geographic location, 2011
The large proportion of Indigenous JSA job seekers that live in remote and very remote locations (37 per cent) presents challenges for services, and any issues with remote servicing under JSA are likely to impact disproportionately on the Indigenous job seeker population.
Streams of assistance
The JSA model delivers assistance to job seekers based on their assessed level of labour market disadvantage and vocational and non-vocational barriers. Job seekers are allocated into one of four service streams: Stream 1 for job-ready job seekers, and Streams 2, 3 or 4 for disadvantaged job seekers. The funding available to JSA providers through service fees and the Employment Pathway Fund (EPF) increases with Stream, as does the level of remuneration for job placements and outcomes. Three mechanisms allocate job seekers to the JSA Streams:
A set of criteria which identify Stream 1 limited clients — those partially eligible for assistance under Stream 1. These job seekers are usually not working or studying full time and not receiving activity-tested income support, and are not usually assessed by the Job Seeker Classification Instrument (JSCI). The level of service for Stream 1 limited job seekers is limited to the provision of a résumé, access to Australia’s national vacancy database (Australian JobSearch) and advice on the local labour market.
The JSCI, which allocates fully eligible job seekers to Streams 1, 2, or 3 on the severity of the job seeker’s labour market disadvantage.
0.0
10.0
20.0
30.0
40.0
50.0
60.0
70.0
80.0
90.0
100.0
NSW ACT
Vic Qld SA WA Tas NT
Per cent
Major City Inner Regional Outer Regional Remote Very remote
29
The Employment Services Assessment (ESAt),6 which identifies a fully eligible job seeker’s non-vocational barriers to finding and maintaining employment, to determine whether they require assistance from Stream 4 or Disability Employment Services (DES).
As the funding available increases with Stream, factors which impede the accurate streaming of job seekers, and particularly of job seekers to Stream 4, will reduce the resources and rewards available for servicing these job seekers.
Streaming of Indigenous job seekers
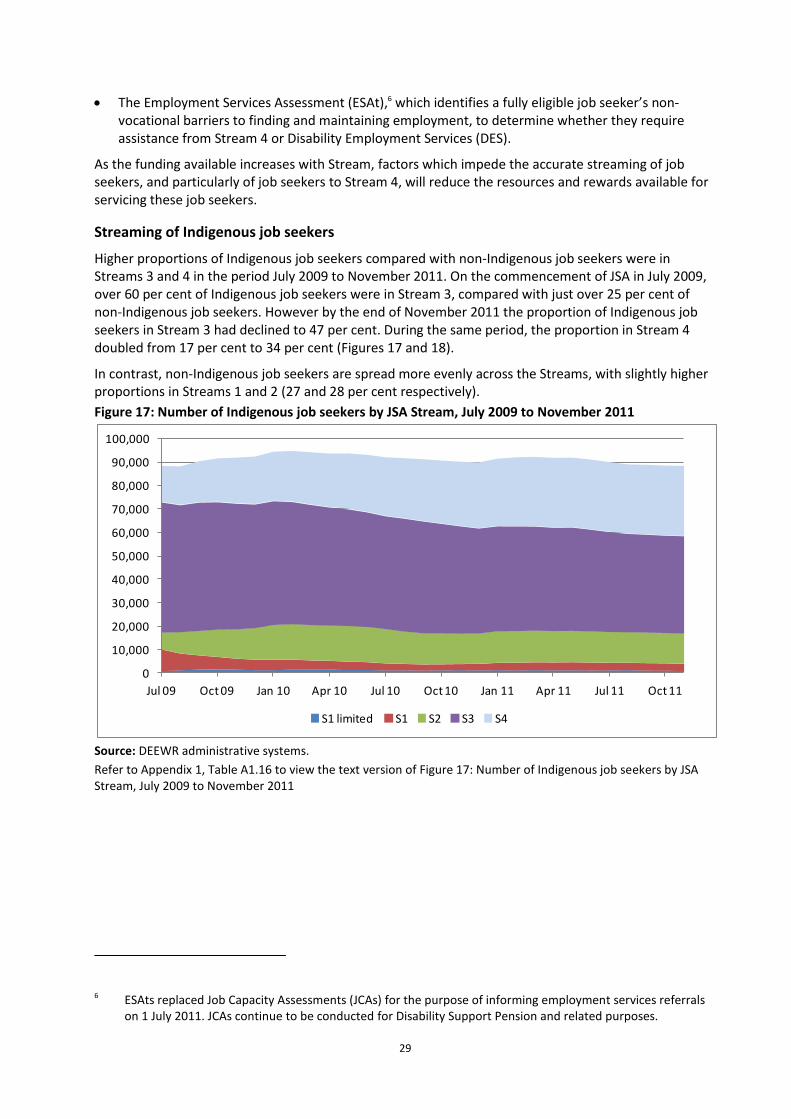
Higher proportions of Indigenous job seekers compared with non-Indigenous job seekers were in Streams 3 and 4 in the period July 2009 to November 2011. On the commencement of JSA in July 2009, over 60 per cent of Indigenous job seekers were in Stream 3, compared with just over 25 per cent of non-Indigenous job seekers. However by the end of November 2011 the proportion of Indigenous job seekers in Stream 3 had declined to 47 per cent. During the same period, the proportion in Stream 4 doubled from 17 per cent to 34 per cent (Figures 17 and 18).
In contrast, non-Indigenous job seekers are spread more evenly across the Streams, with slightly higher proportions in Streams 1 and 2 (27 and 28 per cent respectively).
Figure 17: Number of Indigenous job seekers by JSA Stream, July 2009 to November 2011
Source: DEEWR administrative systems.
Refer to Appendix 1, Table A1.16 to view the text version of Figure 17: Number of Indigenous job seekers by JSA Stream, July 2009 to November 2011
6 ESAts replaced Job Capacity Assessments (JCAs) for the purpose of informing employment services referrals
on 1 July 2011. JCAs continue to be conducted for Disability Support Pension and related purposes.
0
10,000
20,000
30,000
40,000
50,000
60,000
70,000
80,000
90,000
100,000
Jul 09 Oct 09 Jan 10 Apr 10 Jul 10 Oct 10 Jan 11 Apr 11 Jul 11 Oct 11
S1 limited S1 S2 S3 S4
30
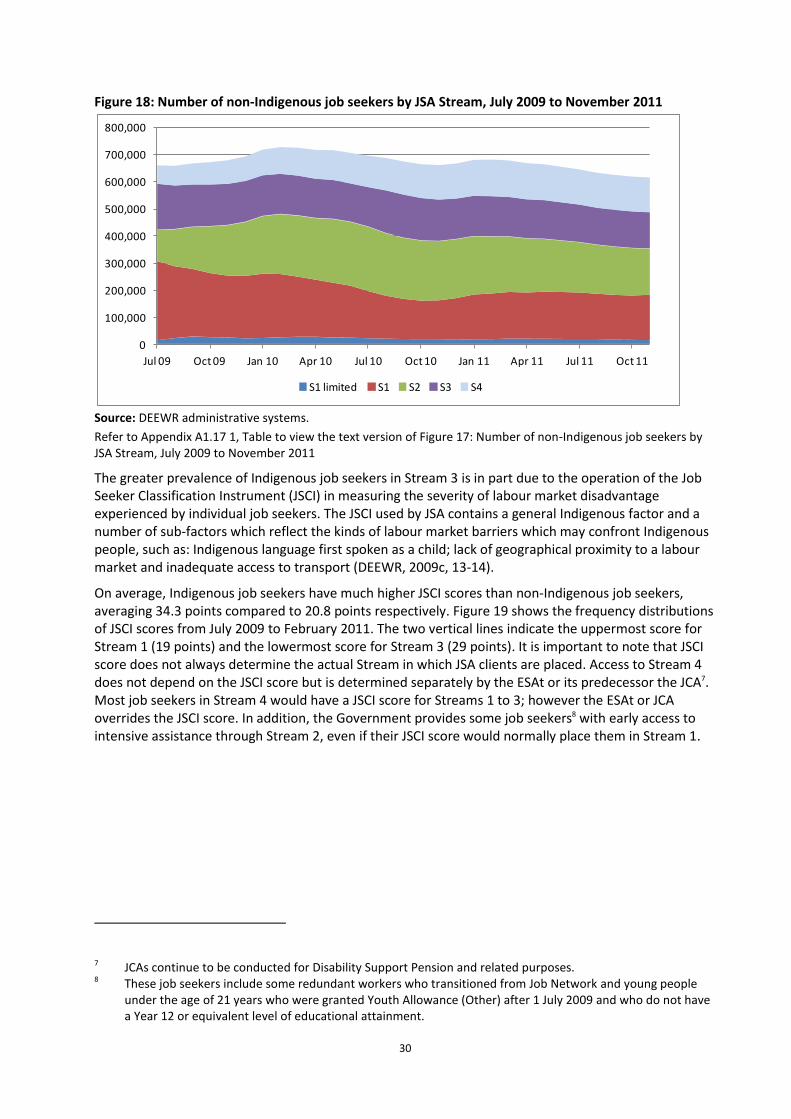
Figure 18: Number of non-Indigenous job seekers by JSA Stream, July 2009 to November 2011
Source: DEEWR administrative systems.
Refer to Appendix A1.17 1, Table to view the text version of Figure 17: Number of non-Indigenous job seekers by JSA Stream, July 2009 to November 2011
The greater prevalence of Indigenous job seekers in Stream 3 is in part due to the operation of the Job Seeker Classification Instrument (JSCI) in measuring the severity of labour market disadvantage experienced by individual job seekers. The JSCI used by JSA contains a general Indigenous factor and a number of sub-factors which reflect the kinds of labour market barriers which may confront Indigenous people, such as: Indigenous language first spoken as a child; lack of geographical proximity to a labour market and inadequate access to transport (DEEWR, 2009c, 13-14).
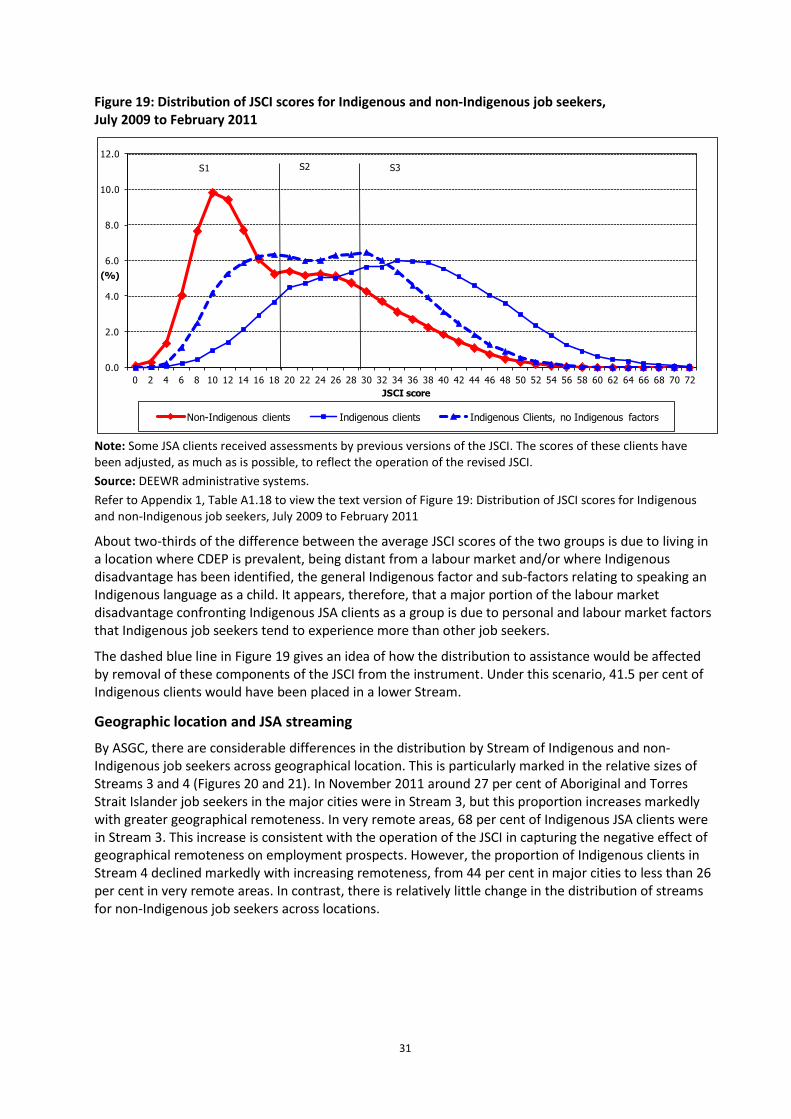
On average, Indigenous job seekers have much higher JSCI scores than non-Indigenous job seekers, averaging 34.3 points compared to 20.8 points respectively. Figure 19 shows the frequency distributions of JSCI scores from July 2009 to February 2011. The two vertical lines indicate the uppermost score for Stream 1 (19 points) and the lowermost score for Stream 3 (29 points). It is important to note that JSCI score does not always determine the actual Stream in which JSA clients are placed. Access to Stream 4 does not depend on the JSCI score but is determined separately by the ESAt or its predecessor the JCA7. Most job seekers in Stream 4 would have a JSCI score for Streams 1 to 3; however the ESAt or JCA overrides the JSCI score. In addition, the Government provides some job seekers8 with early access to intensive assistance through Stream 2, even if their JSCI score would normally place them in Stream 1.
7 JCAs continue to be conducted for Disability Support Pension and related purposes. 8 These job seekers include some redundant workers who transitioned from Job Network and young people
under the age of 21 years who were granted Youth Allowance (Other) after 1 July 2009 and who do not have a Year 12 or equivalent level of educational attainment.
0
100,000
200,000
300,000
400,000
500,000
600,000
700,000
800,000
Jul 09 Oct 09 Jan 10 Apr 10 Jul 10 Oct 10 Jan 11 Apr 11 Jul 11 Oct 11
S1 limited S1 S2 S3 S4
31
Figure 19: Distribution of JSCI scores for Indigenous and non-Indigenous job seekers, July 2009 to February 2011
Note: Some JSA clients received assessments by previous versions of the JSCI. The scores of these clients have been adjusted, as much as is possible, to reflect the operation of the revised JSCI.
Source: DEEWR administrative systems.
Refer to Appendix 1, Table A1.18 to view the text version of Figure 19: Distribution of JSCI scores for Indigenous and non-Indigenous job seekers, July 2009 to February 2011
About two-thirds of the difference between the average JSCI scores of the two groups is due to living in a location where CDEP is prevalent, being distant from a labour market and/or where Indigenous disadvantage has been identified, the general Indigenous factor and sub-factors relating to speaking an Indigenous language as a child. It appears, therefore, that a major portion of the labour market disadvantage confronting Indigenous JSA clients as a group is due to personal and labour market factors that Indigenous job seekers tend to experience more than other job seekers.
The dashed blue line in Figure 19 gives an idea of how the distribution to assistance would be affected by removal of these components of the JSCI from the instrument. Under this scenario, 41.5 per cent of Indigenous clients would have been placed in a lower Stream.
Geographic location and JSA streaming
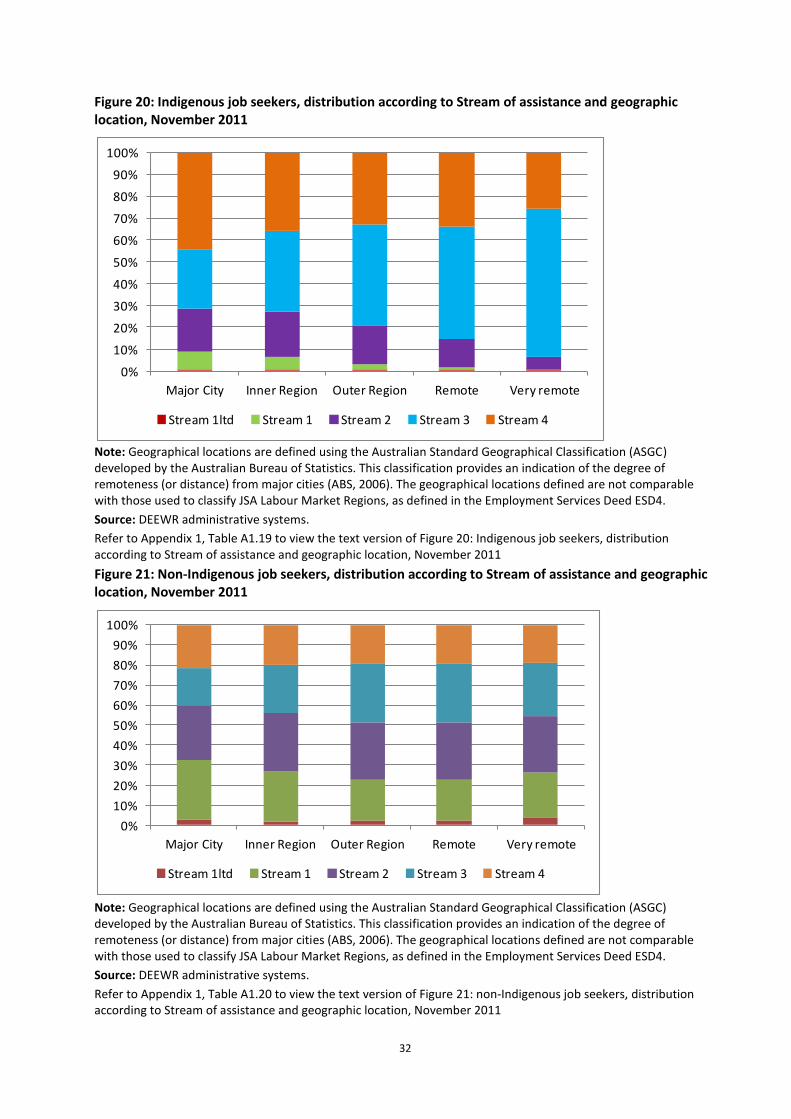
By ASGC, there are considerable differences in the distribution by Stream of Indigenous and non-Indigenous job seekers across geographical location. This is particularly marked in the relative sizes of Streams 3 and 4 (Figures 20 and 21). In November 2011 around 27 per cent of Aboriginal and Torres Strait Islander job seekers in the major cities were in Stream 3, but this proportion increases markedly with greater geographical remoteness. In very remote areas, 68 per cent of Indigenous JSA clients were in Stream 3. This increase is consistent with the operation of the JSCI in capturing the negative effect of geographical remoteness on employment prospects. However, the proportion of Indigenous clients in Stream 4 declined markedly with increasing remoteness, from 44 per cent in major cities to less than 26 per cent in very remote areas. In contrast, there is relatively little change in the distribution of streams for non-Indigenous job seekers across locations.
0.0
2.0
4.0
6.0
8.0
10.0
12.0
0 2 4 6 8 10 12 14 16 18 20 22 24 26 28 30 32 34 36 38 40 42 44 46 48 50 52 54 56 58 60 62 64 66 68 70 72
JSCI score
Non-Indigenous clients Indigenous clients Indigenous Clients, no Indigenous factors
S1 S2 S3
32
Figure 20: Indigenous job seekers, distribution according to Stream of assistance and geographic location, November 2011
Note: Geographical locations are defined using the Australian Standard Geographical Classification (ASGC) developed by the Australian Bureau of Statistics. This classification provides an indication of the degree of remoteness (or distance) from major cities (ABS, 2006). The geographical locations defined are not comparable with those used to classify JSA Labour Market Regions, as defined in the Employment Services Deed ESD4.
Source: DEEWR administrative systems.
Refer to Appendix 1, Table A1.19 to view the text version of Figure 20: Indigenous job seekers, distribution according to Stream of assistance and geographic location, November 2011
Figure 21: Non-Indigenous job seekers, distribution according to Stream of assistance and geographic location, November 2011
Note: Geographical locations are defined using the Australian Standard Geographical Classification (ASGC) developed by the Australian Bureau of Statistics. This classification provides an indication of the degree of remoteness (or distance) from major cities (ABS, 2006). The geographical locations defined are not comparable with those used to classify JSA Labour Market Regions, as defined in the Employment Services Deed ESD4.
Source: DEEWR administrative systems.
Refer to Appendix 1, Table A1.20 to view the text version of Figure 21: non-Indigenous job seekers, distribution according to Stream of assistance and geographic location, November 2011
0%
10%
20%
30%
40%
50%
60%
70%
80%
90%
100%
Major City Inner Region Outer Region Remote Very remote
Stream 1ltd Stream 1 Stream 2 Stream 3 Stream 4
0%
10%
20%
30%
40%
50%
60%
70%
80%
90%
100%
Major City Inner Region Outer Region Remote Very remote
Stream 1ltd Stream 1 Stream 2 Stream 3 Stream 4
33
The entry of job seekers to Stream 4 depends on the results of the ESAt or its predecessor, the JCA. These assessments measure vocational and non-vocational barriers to finding and maintaining employment and are required to place job seekers in Stream 4 services or, where appropriate, to refer them to Disability Employment Services (DES).
However, it can be more difficult for people who live in remote and very remote areas with restricted access to medical and mental health services to provide adequate documentation to have non-vocational barriers recognised through the ESAt or JCA. Analysis conducted by the Department indicates that this has been a factor in restricting access to Stream 4 for job seekers in remote areas. Though these issues impact on all people in remote and very remote areas, the differential distributions of Indigenous and non-Indigenous job seekers in remote areas suggest they have greater effect on Indigenous job seekers than non-Indigenous job seekers.
Other factors such as the higher proportion of Indigenous people in remote areas who do not speak English as a first language and the lack of the concept of ‘disability’ in some Aboriginal cultures may also lead to lower numbers of Indigenous job seekers reporting non-vocational barriers. This would contribute to the relatively low proportion of Indigenous job seekers in these areas who are placed in Stream 4 services compared to Stream 3.
From 1 July 2011, two types of ESAts were introduced, the Medical Condition ESAt and the Non-Medical Condition ESAt. Depending on the circumstances, a Non-Medical Condition ESAt can be extended to a Medical Condition ESAt by the assessor, where medical evidence is available at the time of the appointment. However this flexibility in the conduct of ESAts does not address the issue of restricted access to medical and mental health services in remote areas.
While an ESAt is generally conducted in a face-to-face interview and this is the preferred method, they may also be conducted by video or phone conferencing where geographic barriers prevent face-to-face interviews. It is possible for the reasons discussed above that ESAts which are not conducted face-to-face may not be as effective as those that are.
Review of remote participation and employment services
In the May 2011-12 Budget, the Australian Government announced a review of remote participation and employment services with a view that these arrangements should be simpler, more integrated and more flexible than current arrangements.
The Government undertook a comprehensive consultation process to inform the development of the new arrangements, which included the appointment of a Remote Participation and Employment Services Engagement Panel. Forty-two consultation forums were held with remote communities, service providers, key stakeholders and community leaders in August and September 2011. Over 1200 people attended the forums and 64 submissions were received.
34
4.2 Implications for JSA servicing
The issues discussed in this section suggest that employment assistance should respond to several broad characteristics of Indigenous JSA clients in order to help improve their long term employment prospects.
Assistance should address the job barriers which young men face. Both Indigenous and non-Indigenous young men are over represented among JSA clients compared to the age and gender composition of the respective populations.
There are high proportions of Indigenous job seekers in remote areas and substantial numbers of these face employment barriers. The review of remote participation and servicing arrangements may go some way to improving the delivery of appropriate services these job seekers. Nevertheless considerable challenges remain in this area.
35
5 Participation in JSA services
Key points
Service providers that create strong links with local Indigenous organisations and communities, who employ Indigenous staff, and provide cultural awareness training for staff find it easier to engage with Indigenous job seekers.
The environment the provider creates was found to be important in supporting the engagement of Indigenous job seekers.
In comparison to non-Indigenous job seekers, Indigenous job seekers, after controlling for stream, geographic location, and other factors:
are 21 per cent less likely to attend their initial appointment
are 26 per cent less likely to attend engagement appointments.
In comparison to non-Indigenous job seekers, Indigenous job seekers, without controlling for other factors:
are less likely by 11 percentage points to attend interviews with providers (summed over five interview types)
miss a much higher proportion of appointments for a reason deemed to be invalid by the service provider.
Therefore, Indigenous job seekers are more likely to be subject to action under the JSA compliance framework, and any issues associated with the operation of compliance processes may impact disproportionately on Indigenous job seekers.
Expenditure through the Employment Pathway Fund (EPF) for Indigenous job seekers on the whole reflects the greater levels of disadvantage faced by them, with Indigenous job seekers receiving on average more assistance through the EPF than non-Indigenous job seekers. However while Indigenous job seekers in Streams 1 to 3 who receive assistance through the EPF receive, on average, more EPF than non-Indigenous job seekers, the reverse is true for those in Stream 4.
Patterns of EPF expenditure also reflect the different challenges faced by Indigenous and non-Indigenous job seekers. The proportion of EPF expenditure on Indigenous job seekers attributed to training and outreach services is higher than that for non-Indigenous job seekers, while the proportion spent on wage subsidies and reverse marketing is lower.
5.1 Initial connection
Initial connection with JSA services refers to the process by which job seekers are referred to their JSA service provider and established as clients on that provider’s caseload. Job seekers cannot begin to benefit from services until this initial connection is achieved.
Logistic regression analysis9 of determinants of initial appointment attendance by job seekers showed that Indigenous job seekers were 21 per cent less likely to attend their initial appointment than non-Indigenous job seekers, when other job seeker characteristics are taken into account.
9 Logistic regression analysis isolates the influence of each determinant, holding everything else constant.
Whether a job seeker presented a valid or invalid reason for not attending their appointment was not included in the analysis, only whether they attended or not.
36
A further logistic regression analysis of determinants of initial appointment attendance10 was undertaken for Indigenous job seekers only, and results compared to those for all job seekers. This analysis showed that having access to their own transport (compared to relying on public or other private transport, or having no access to transport at all) was an even more important determinant of initial appointment attendance for Indigenous job seekers than for all job seekers. Indigenous job seekers with their own transport were 48 per cent more likely to attend their initial appointment compared to those who relied on public or other private transport, whereas analysis of all job seekers found that job seekers with their own transport were 26 per cent more likely to attend than other job seekers. Being contactable by telephone was also found to be an important determinant of initial appointment attendance for Indigenous job seekers compared to all job seekers. Indigenous job seekers who were contactable by phone were 24 per cent more likely to attend their initial appointment, compared with 16 per cent for all job seekers.
These results may in part be explained by the higher proportions of Indigenous job seekers in remote and very remote areas, as discussed in Section 4. In many remote communities there is no public transport, car and telephone ownership is rare and mail delivery restricted. In addition, correspondence in English from JSA providers may not always be well understood by its recipients.
5.2 Ongoing engagement
Engagement with JSA services means taking part in JSA services, and is measured in terms of attendance at appointments and various assessment and servicing activities. Engagement over the period of unemployment is vital if job seekers are to fully benefit from services available. After initial connection with their JSA service provider is established, job seekers are required to remain engaged with services through a range of activities, including the following types of engagement appointments: regular job seeker contacts, JSA in-house servicing appointments, JSA re-engagement appointments and skills assessments.
Logistic regression analysis of determinants of attendance at engagement appointments showed that Indigenous job seekers were 26 per cent less likely to attend than non-Indigenous job seekers, when other job seeker characteristics were taken into account. This result is consistent with findings from the evaluation of the Active Participation Model, which found that Indigenous job seekers participating in Intensive Support customised assistance were 32 per cent less likely than non-Indigenous participants to have attended 75 per cent or more of their appointments (DEEWR, 2007, 28).
A subsequent logistic regression analysis using only Indigenous job seekers showed that the determinants of ongoing engagement for Indigenous job seekers did not differ from those for all job seekers.
To complement the regression results, which take geographic region into account, Table 2 shows Indigenous and non-Indigenous attendance for different types of JSA engagement appointments. Indigenous job seekers attended 49 per cent of all appointments compared with 59 per cent for non-Indigenous job seekers. The proportion of all appointments missed for a valid reason was very similar for Indigenous and non-Indigenous job seekers at 18 per cent and 20 per cent respectively. However, the proportion of appointments missed for a reason deemed to be invalid by the service provider was much higher for Indigenous job seekers at 34 per cent, compared to 21 per cent for non-Indigenous job seekers.
Table 2: Job seeker attendance at different types of engagement activities by Indigenous status (1 July 2009- 30 June 2010) (per cent)
10 The complete estimates of the preferred logistic model are given in Appendix 2 and some technical notes
regarding the logistic regression procedure are given in Appendix 3.
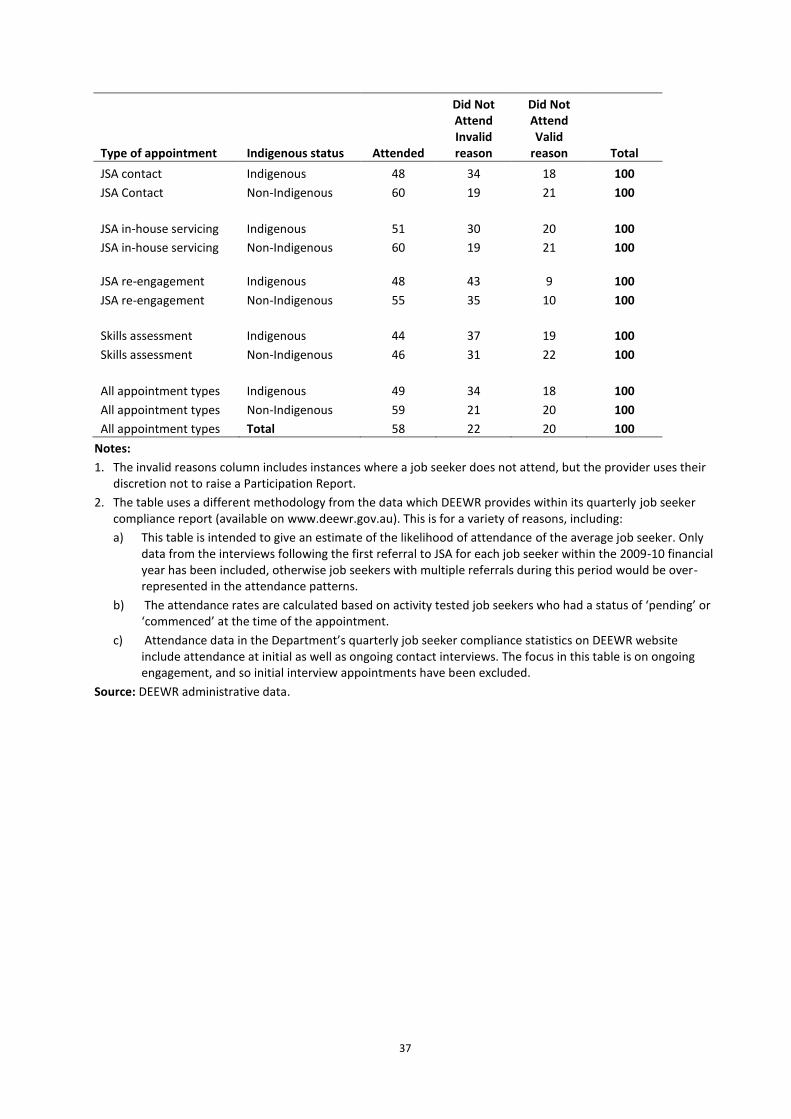
37
Type of appointment Indigenous status Attended
Did Not Attend Invalid reason
Did Not Attend Valid
reason Total
JSA contact Indigenous 48 34 18 100
JSA Contact Non-Indigenous 60 19 21 100
JSA in-house servicing Indigenous 51 30 20 100
JSA in-house servicing Non-Indigenous 60 19 21 100
JSA re-engagement Indigenous 48 43 9 100
JSA re-engagement Non-Indigenous 55 35 10 100
Skills assessment Indigenous 44 37 19 100
Skills assessment Non-Indigenous 46 31 22 100
All appointment types Indigenous 49 34 18 100
All appointment types Non-Indigenous 59 21 20 100
All appointment types Total 58 22 20 100
Notes:
1. The invalid reasons column includes instances where a job seeker does not attend, but the provider uses their discretion not to raise a Participation Report.
2. The table uses a different methodology from the data which DEEWR provides within its quarterly job seeker compliance report (available on www.deewr.gov.au). This is for a variety of reasons, including:
a) This table is intended to give an estimate of the likelihood of attendance of the average job seeker. Only data from the interviews following the first referral to JSA for each job seeker within the 2009-10 financial year has been included, otherwise job seekers with multiple referrals during this period would be over-represented in the attendance patterns.
b) The attendance rates are calculated based on activity tested job seekers who had a status of ‘pending’ or ‘commenced’ at the time of the appointment.
c) Attendance data in the Department’s quarterly job seeker compliance statistics on DEEWR website include attendance at initial as well as ongoing contact interviews. The focus in this table is on ongoing engagement, and so initial interview appointments have been excluded.
Source: DEEWR administrative data.
38
When attendance rates for specific appointment types were examined, Indigenous job seekers were found to have lower attendance rates by seven to twelve percentage points for each type of appointment, except for skills assessments where only a only a two percentage point difference was evident. Across all appointment types, the difference in attendance rates for Indigenous and non-Indigenous job seekers was largely accounted for by appointments missed for an invalid reason. This means that Indigenous job seekers are more likely to be subject to action under the JSA compliance framework than non-Indigenous job seekers, and therefore that any issues associated with the operation of compliance processes may impact disproportionately on Indigenous job seekers.
Improvements have been made to the JSA compliance framework since 2009-10. Changes applying to all job seekers were introduced in July 2011 to provide additional incentive to attend appointments, engage with their provider and participate fully in activities. Enhancements were announced in the 2011-12 Budget that are intended to further strengthen the compliance framework by focussing more attention on vulnerable job seekers who having difficulty meeting their participation requirements, to take effect from 1 July 2012. In addition, community-specific parameters for considering “reasonable excuse” for job seeker non-compliance are being trialled in two remote communities in 2011-12.
5.3 Supporting participation of Indigenous job seekers
As the above results show, engaging Indigenous job seekers with employment services and maintaining their participation over time is a challenge, and one that has persisted from Job Network into JSA. However, without effective participation and engagement Indigenous job seekers are not able to benefit fully from employment services.
There is evidence that some barriers impact more heavily on Indigenous job seekers than on non-Indigenous job seekers. In particular, lack of access to reliable transport and telephone services impedes Indigenous job seekers’ initial connection and establishment in JSA services. Barriers such as these also affect Indigenous job seekers’ job search and chances of achieving and sustaining work placements, particularly in rural and regional areas where employers often insist on workers having access to their own transport as a condition of employment.
Qualitative research undertaken with Indigenous job seekers by DEEWR in 2010 identified the importance of the environment created by JSA providers in supporting engagement with services. Job seekers stated they were more likely to engage with providers who made them feel welcome as Aboriginal or Torres Strait Islander people. There are some very simple methods providers can use to create a welcoming environment, such as displaying posters, stickers, flags, artwork or service commitments where they are visible from the entrance to the premises.
Providers whose staff were known and respected by local Indigenous communities find it easier to engage their Indigenous clients, regardless of whether the staff themselves are Indigenous. Employing Indigenous staff can also help to make Indigenous job seekers feel more comfortable, even when the job seeker was not working directly with the Indigenous employee. Having links to local Indigenous communities and a level of cultural competency among staff (through employing Indigenous staff members or cultural awareness training) could also assist providers to respond appropriately to Indigenous job seekers’ non-attendance at activities and appointments for cultural reasons.
However, the 2010 Survey of Employment Services Providers found that 62 per cent of full-time JSA provider sites did not have any Indigenous staff at the time of completing the survey, and interviews with providers undertaken by the Department in 2010 found little evidence that providers routinely provided staff with cultural awareness training. There is, therefore, potential to improve servicing of Indigenous job seekers and the efficacy of the compliance framework across the system by improving the overall cultural competency of provider staff, particularly at sites with a high proportion of Indigenous job seekers on their caseloads.
39
The design and delivery of specific activities is also important in determining Indigenous job seekers’ engagement. For example, in 2010 the Department commissioned qualitative research into the factors which influenced the level of engagement of Aboriginal and Torres Strait Islander people with work experience activities in regional and remote areas. This found that activities that effectively engaged Indigenous job seekers have one or more of the following characteristics:
They involve a variety of tasks and training ‘on-the-job’. This provides the opportunity for job seekers to explore the types of work that interest them and to develop practical skills. Hands-on, tactile activities such as construction and working with machinery were found to be very popular with young men. Shadowing other employees and ‘learning by doing’ were found to be very effective as ways to build skills and confidence.
They have a respected mentor or supervisor. Often it is the one-on-one relationship with a respected person in the workplace that keeps a job seeker engaged, rather than the nature of the activity itself. Mentors can also have a crucial role to play in supporting the job seeker if a work experience placement turns into paid employment.
They involve a sense of ownership, either through connecting the activity to the job seeker’s aspirations, or to the priorities of the local community. Projects where the benefits to the community are apparent (e.g. health, education, youth services) are popular.
They involve ‘import substitution’, whereby goods or services which previously have been imported into the community are replaced by local production. This develops a sense of pride among the participants and demonstrates benefit to the community.
They are connected with culture and maintaining cultural heritage through art, craft, music, working on the land, or looking after areas of cultural significance.
They are family or clan based. Many job seekers report they prefer group activities to working on tasks individually, and working with other family or clan members can help people feel safe, secure and comfortable.
They are seen to lead to ongoing work through developing the skills required for jobs that are available locally. Good jobs were seen to be those that provided steady pay and security and that were ongoing, rather than short term.11
They involve sport in some way. Activities that include a sporting component, such as using sport as an incentive to re-engage ‘at risk’ participants with vocational training, are often popular with young people.
5.4 Assistance provided
One of the tools that is available to assist job seekers in JSA is the Employment Pathway Fund (EPF), a flexible fund for use by providers to purchase assistance for job seekers on a needs basis. A similar fund existed under Job Network, known as Job Seeker Account (JSKA). Conceptually the funds are comparable, though the EPF can be used more flexibly because a wider range of assistance is able to be purchased and there is a greater emphasis on assisting job seekers to overcome non-vocational barriers to employment.
Employment Pathway Fund expenditure
The EPF is allocated to providers to enable the provision of specified forms of assistance to their clients. The amount of funding available to each provider depends on their clients’ characteristics, including their Stream of assistance and whether they reside in a remote area. There is no stipulation that a credit given for a particular jobseeker must be spent on that individual. Rather, the fund is designed to be
11 This can be very difficult to achieve in places with little or no ‘real’ labour market, and consequently these
locations may present the biggest challenge to engaging Indigenous people in assistance.
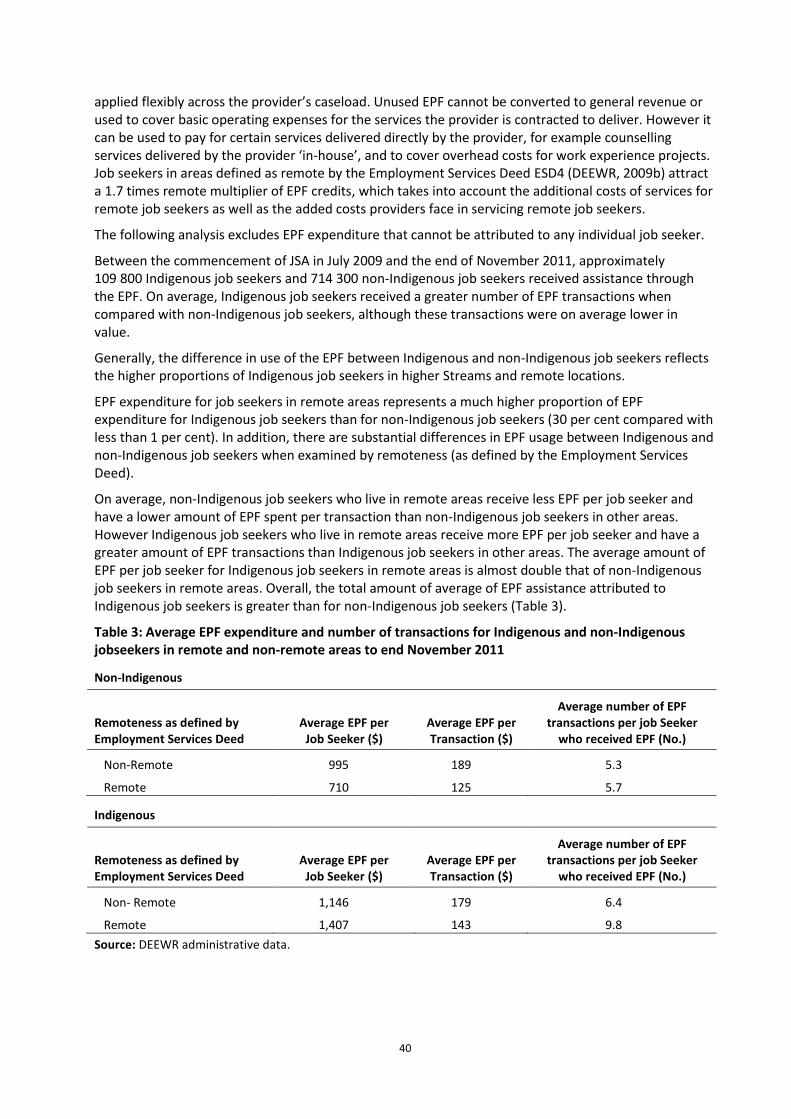
40
applied flexibly across the provider’s caseload. Unused EPF cannot be converted to general revenue or used to cover basic operating expenses for the services the provider is contracted to deliver. However it can be used to pay for certain services delivered directly by the provider, for example counselling services delivered by the provider ‘in-house’, and to cover overhead costs for work experience projects. Job seekers in areas defined as remote by the Employment Services Deed ESD4 (DEEWR, 2009b) attract a 1.7 times remote multiplier of EPF credits, which takes into account the additional costs of services for remote job seekers as well as the added costs providers face in servicing remote job seekers.
The following analysis excludes EPF expenditure that cannot be attributed to any individual job seeker.
Between the commencement of JSA in July 2009 and the end of November 2011, approximately 109 800 Indigenous job seekers and 714 300 non-Indigenous job seekers received assistance through the EPF. On average, Indigenous job seekers received a greater number of EPF transactions when compared with non-Indigenous job seekers, although these transactions were on average lower in value.
Generally, the difference in use of the EPF between Indigenous and non-Indigenous job seekers reflects the higher proportions of Indigenous job seekers in higher Streams and remote locations.
EPF expenditure for job seekers in remote areas represents a much higher proportion of EPF expenditure for Indigenous job seekers than for non-Indigenous job seekers (30 per cent compared with less than 1 per cent). In addition, there are substantial differences in EPF usage between Indigenous and non-Indigenous job seekers when examined by remoteness (as defined by the Employment Services Deed).
On average, non-Indigenous job seekers who live in remote areas receive less EPF per job seeker and have a lower amount of EPF spent per transaction than non-Indigenous job seekers in other areas. However Indigenous job seekers who live in remote areas receive more EPF per job seeker and have a greater amount of EPF transactions than Indigenous job seekers in other areas. The average amount of EPF per job seeker for Indigenous job seekers in remote areas is almost double that of non-Indigenous job seekers in remote areas. Overall, the total amount of average of EPF assistance attributed to Indigenous job seekers is greater than for non-Indigenous job seekers (Table 3).
Table 3: Average EPF expenditure and number of transactions for Indigenous and non-Indigenous jobseekers in remote and non-remote areas to end November 2011
Non-Indigenous
Remoteness as defined by Employment Services Deed
Average EPF per Job Seeker ($)
Average EPF per Transaction ($)
Average number of EPF transactions per job Seeker
who received EPF (No.)
Non-Remote 995 189 5.3
Remote 710 125 5.7
Indigenous
Remoteness as defined by Employment Services Deed
Average EPF per Job Seeker ($)
Average EPF per Transaction ($)
Average number of EPF transactions per job Seeker
who received EPF (No.)
Non- Remote 1,146 179 6.4
Remote 1,407 143 9.8
Source: DEEWR administrative data.
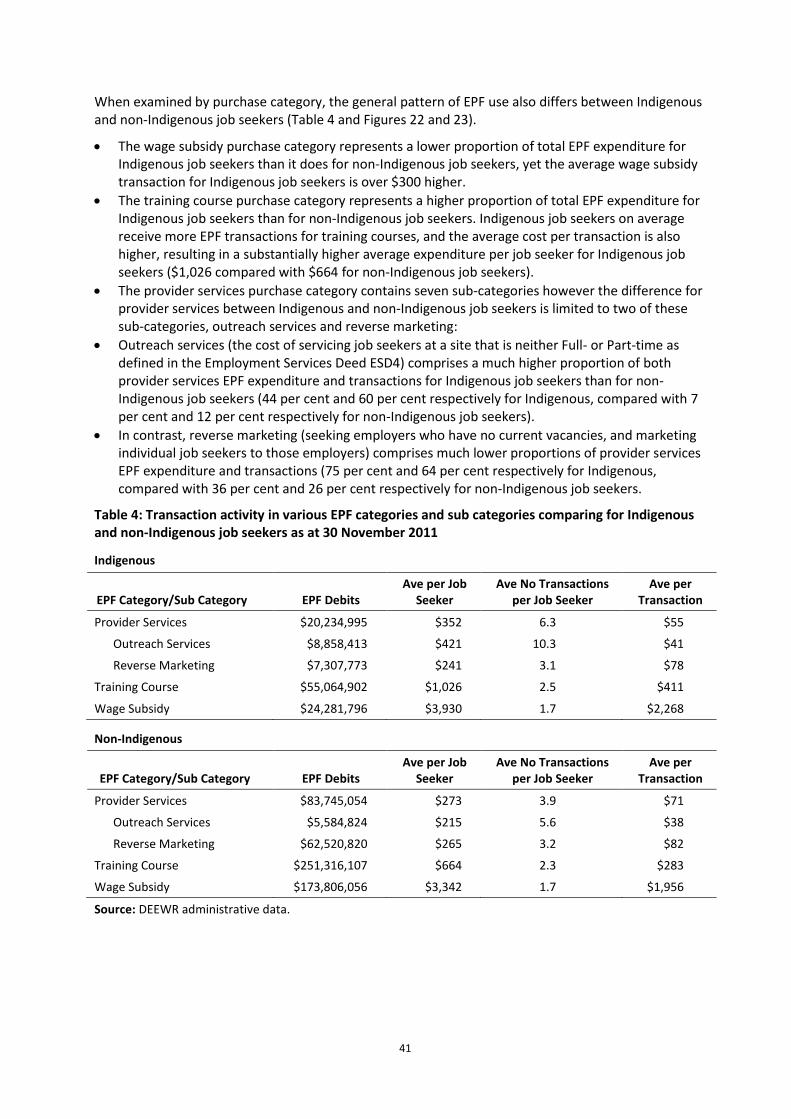
41
When examined by purchase category, the general pattern of EPF use also differs between Indigenous and non-Indigenous job seekers (Table 4 and Figures 22 and 23).
The wage subsidy purchase category represents a lower proportion of total EPF expenditure for Indigenous job seekers than it does for non-Indigenous job seekers, yet the average wage subsidy transaction for Indigenous job seekers is over $300 higher.
The training course purchase category represents a higher proportion of total EPF expenditure for Indigenous job seekers than for non-Indigenous job seekers. Indigenous job seekers on average receive more EPF transactions for training courses, and the average cost per transaction is also higher, resulting in a substantially higher average expenditure per job seeker for Indigenous job seekers ($1,026 compared with $664 for non-Indigenous job seekers).
The provider services purchase category contains seven sub-categories however the difference for provider services between Indigenous and non-Indigenous job seekers is limited to two of these sub-categories, outreach services and reverse marketing:
Outreach services (the cost of servicing job seekers at a site that is neither Full- or Part-time as defined in the Employment Services Deed ESD4) comprises a much higher proportion of both provider services EPF expenditure and transactions for Indigenous job seekers than for non-Indigenous job seekers (44 per cent and 60 per cent respectively for Indigenous, compared with 7 per cent and 12 per cent respectively for non-Indigenous job seekers).
In contrast, reverse marketing (seeking employers who have no current vacancies, and marketing individual job seekers to those employers) comprises much lower proportions of provider services EPF expenditure and transactions (75 per cent and 64 per cent respectively for Indigenous, compared with 36 per cent and 26 per cent respectively for non-Indigenous job seekers.
Table 4: Transaction activity in various EPF categories and sub categories comparing for Indigenous and non-Indigenous job seekers as at 30 November 2011
Indigenous
EPF Category/Sub Category EPF Debits Ave per Job
Seeker Ave No Transactions
per Job Seeker Ave per
Transaction
Provider Services $20,234,995 $352 6.3 $55
Outreach Services $8,858,413 $421 10.3 $41
Reverse Marketing $7,307,773 $241 3.1 $78
Training Course $55,064,902 $1,026 2.5 $411
Wage Subsidy $24,281,796 $3,930 1.7 $2,268
Non-Indigenous
EPF Category/Sub Category EPF Debits Ave per Job
Seeker Ave No Transactions
per Job Seeker Ave per
Transaction
Provider Services $83,745,054 $273 3.9 $71
Outreach Services $5,584,824 $215 5.6 $38
Reverse Marketing $62,520,820 $265 3.2 $82
Training Course $251,316,107 $664 2.3 $283
Wage Subsidy $173,806,056 $3,342 1.7 $1,956
Source: DEEWR administrative data.
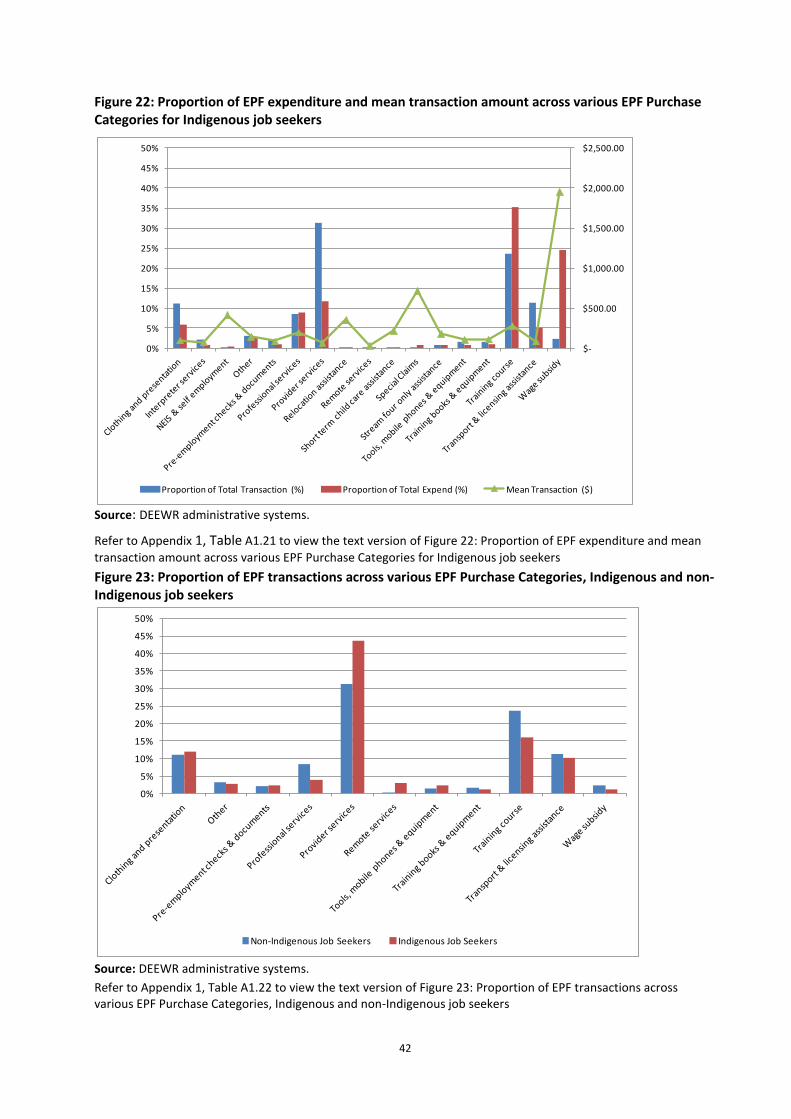
42
Figure 22: Proportion of EPF expenditure and mean transaction amount across various EPF Purchase Categories for Indigenous job seekers
Source: DEEWR administrative systems.
Refer to Appendix 1, Table A1.21 to view the text version of Figure 22: Proportion of EPF expenditure and mean
transaction amount across various EPF Purchase Categories for Indigenous job seekers
Figure 23: Proportion of EPF transactions across various EPF Purchase Categories, Indigenous and non-Indigenous job seekers
Source: DEEWR administrative systems.
Refer to Appendix 1, Table A1.22 to view the text version of Figure 23: Proportion of EPF transactions across various EPF Purchase Categories, Indigenous and non-Indigenous job seekers
$-
$500.00
$1,000.00
$1,500.00
$2,000.00
$2,500.00
0%
5%
10%
15%
20%
25%
30%
35%
40%
45%
50%
Proportion of Total Transaction (%) Proportion of Total Expend (%) Mean Transaction ($)
0%
5%
10%
15%
20%
25%
30%
35%
40%
45%
50%
Non-Indigenous Job Seekers Indigenous Job Seekers
43
The differences in the use of the EPF purchase categories and sub-categories between Indigenous and non-Indigenous job seekers should also be considered in the context of the different distribution of these populations across Streams. As discussed in section 4.1, higher proportions of Indigenous job seekers compared with non-Indigenous job seekers are in Streams 3 and 4, reflecting the higher vocational and non-vocational barriers to employment that Indigenous job seekers face. Similarly, over 80 per cent of EPF expenditure for Indigenous job seekers is attributed to job seekers in Streams 3 and 4, compared with less than 60 per cent of EPF expenditure for non-Indigenous job seekers.
On average, Indigenous job seekers who receive EPF assistance receive a greater aggregate amount of EPF assistance than non-Indigenous job seekers. When broken down into the Streams, this trend is evident in Streams 1 to 3, however the trend is reversed for Stream 4 with non-Indigenous job seekers receiving on average a greater amount of EPF assistance than Indigenous job seekers. This difference in Stream 4 is over $200 per job seeker, or approximately 18 per cent higher for non-Indigenous job seekers than Indigenous job seekers. Indigenous job seekers are generally over-represented in remote areas and, as discussed in Chapter 4, a proportion of Indigenous job seekers may be placed in Stream 3 rather than Stream 4. Of all job seekers who receive EPF assistance in a remote area, 81 per cent are Indigenous job seekers, which is 26 per cent of all Indigenous job seekers. In contrast, only 1 per cent of non-Indigenous job seekers who receive EPF assistance live in a remote area. The finding that the average EPF expenditure per Indigenous job seeker in Stream 3 is greater than that of Stream 4 supports the notion that remote Indigenous job seekers are over-represented in Stream 3. The ‘remote multiplier’ that remote job seekers attract may also influence this finding, as more EPF is available to service remote job seekers.
These differences in distribution by Stream and geographic location of Indigenous and non-Indigenous job seekers account for some of the differences in EPF expenditure between the two populations. For example, the low proportion of expenditure on reverse marketing for Indigenous job seekers may in part be attributable to the higher proportion of Indigenous job seekers in Streams 3 and 4 who may be less job-ready, and partly to the higher proportion in remote locations, where there is likely to be less employment opportunities. The flexibility of the EPF allows providers to consider more than just level of disadvantage when deciding at in how much and in what ways they assist clients. Qualitative research with Job Network providers found that in utilising the Job Seeker Account, providers focused on the cost of assistance relative to job seeker need and whether the expenditure would lead to a job placement and an outcome payment (DEEWR, 2007, 111). These qualitative findings are consistent with feedback from JSA providers gathered in 2010.
Evidence that Indigenous job seekers tend to receive greater assistance through the EPF may reflect a higher level of disadvantage requiring greater expenditure. It may also demonstrate a higher amount of EPF credits available for use through the remote multiplier and/or that Indigenous job seekers may be placed into higher Streams, thus attracting a greater amount of EPF credits for use. The difference in the overall pattern of EPF use between Indigenous and non-Indigenous job seekers reflects the higher proportion of Indigenous job seekers in remote areas, and perhaps a focus by JSA providers on engaging Indigenous job seekers in further training.
Training
Training Courses is the EPF purchase category that attracts the most expenditure. This is consistent with the emphasis given to training and skills development in the design of JSA (DEEWR, 2008, 18). Training courses accounted for 24 per cent of the total number of transactions and 35 per cent of the total dollar value of transactions made against the EPF for non-Indigenous JSA clients, and 16 per cent of the number of transactions and 40 per cent of the value of transactions for Indigenous job seekers. The average value of a training course per transaction (not per job seeker) is $283 in the case of non-Indigenous clients and $411 in the case of Indigenous clients. When broken down into remote and non-remote job seekers, for non-Indigenous job seekers the average training course transaction under the EPF was over $132 greater for remote job seekers. For Indigenous job seekers this difference increased
44
to $275. The location of the training course should not affect the average cost of training insofar as JSA providers using the EPF to send remote job seekers to the training, as this is covered under the remote services purchase category. It may however reflect an increased cost of training in remote areas generally and that the types of training courses run in remote areas are more expensive than non-remote areas. However this does not fully explain the general difference in the average cost of training courses under the EPF between Indigenous and non-Indigenous job seekers.
The 2010 Survey of Employment Service Providers asked JSA site managers about barriers to accessing training for Indigenous job seekers.12 All respondents who reported having at least one job seeker who identified as Aboriginal or Torres Strait Islander on the caseload (n=661) were asked; ‘in the past 6 months, have you tried and been unable to refer Indigenous job seekers to training courses for any reason?’. The majority of respondents (71 per cent) reported they had not had any trouble referring Indigenous job seekers to training. Of the 150 who did report having trouble, the major reasons given were: the job seeker had transport difficulties (n=103); the job seeker was unwilling to take part (n=102); suitable courses were not available in the local area (n=92); the job seeker was unable to attend for personal reasons (n=90); there were no places available in the course (n=103) (DEEWR, 2011e).
Wage subsidies
The most expensive form of EPF use per instance is wage subsidies. Similar to the training courses EPF purchase category, the average value of wage subsidies was higher for Indigenous job seekers ($2,268) than for non-Indigenous job seekers ($1,956). Wage subsidies are used comparatively rarely, representing 2 per cent or less of the number of EPF transactions made for both Indigenous and non-Indigenous job seekers.
Given the high costs of wage subsidies, it would make sense for providers to limit their use to cases with a strong likelihood of securing outcome payments that would not otherwise be realised. This is likely to be at least part of the reason why they are used sparingly. Despite the relatively infrequent use of wage subsidies, they account for the second largest portion of EPF expenditure: 18 per cent for Indigenous job seekers and 24 per cent for non-Indigenous job seekers.
A new wage subsidy initiative for the very long-term unemployed, Wage Connect, commenced on 1 January 2012 as part of the Australian Government’s Building Australia’s Future Workforce package. It includes 35 000 places available over four years.
Reverse marketing
Reverse marketing refers to the practice of service providers seeking employers who have no current vacancies, and marketing individual job seekers to those employers. As stated earlier there are quite considerable differences between Indigenous and non-Indigenous job seekers in terms of the proportion of reverse marketing expenditure within the provider services purchase category. This difference in proportion of expenditure translates into the overall proportion of EPF expenditure that is attributed to reverse marketing as reverse marketing makes up 9 per cent non-Indigenous and 5 per cent Indigenous EPF expenditure. It is a relatively inexpensive item under the EPF, with an average transaction value of approximately $80 for both Indigenous and non-Indigenous job seekers, yet it accounts for 20 per cent and 11 per cent of total EPF transactions for non-Indigenous and Indigenous job seekers respectively. The difference in the average amount of reverse marketing per job seeker between Indigenous and non-Indigenous job seekers is less than $25.
12 The Survey was a census of full-time provider sites conducted in June 2010, with a 72% response rate (n=683
JSA Stream Services providers).
45
This shows that while Indigenous job seekers receive proportionately less reverse marketing than non-Indigenous job seekers, when reverse marketing is used it is used in a similar way for both cohorts of job seekers. The proportional difference between the amounts of reverse marketing conducted may reflect the differing needs of Indigenous job seekers and the location of Indigenous job seekers, as mentioned previously in this chapter.
Outreach services
Expenditure on outreach services, an EPF purchase sub-category of provider services, is very different between Indigenous and non-Indigenous job seekers. As a total of EPF expenditure, outreach services accounts for 6 per cent of Indigenous EPF assistance but only 1 per cent of non-Indigenous EPF assistance. In terms of the proportion of total EPF transactions, outreach services accounts for 26 per cent of Indigenous EPF assistance and 4 per cent of non-Indigenous EPF assistance. The average EPF expenditure per transaction for outreach services is approximately $40 for both Indigenous and non-Indigenous job seekers.
Outreach services are generally provided in geographically remote areas. EPF expenditure attributed to outreach services are the costs associated with providing the service by the JSA provider such as, but not limited to transport, venue hire and staff travel time. The increased proportion of EPF transactions and expenditure attributed to Indigenous job seekers as outreach services reflects the increased representation of Indigenous job seekers in remote areas where Full-Time or Part-Time sites are not available or possibly commercially viable for JSA providers.
46
6 Outcomes of JSA assistance
Key points
Across all positive outcomes (employment, and education or training outcomes), Indigenous job seekers had a lower outcome rate than non-Indigenous job seekers.
However, for some outcome types Indigenous job seekers achieved better outcome rates than non-Indigenous job seekers.
Compared to non Indigenous job seekers, three months after leaving JSA assistance Indigenous job seekers:
o had higher rates of full-time employment in Streams 3 and 4
o had lower rates of part-time employment across all Streams
o had higher rates of unemployment across all Streams
o had higher rates of education and training outcomes in Streams 1 and 2, but lower rates
of education and training outcomes in Streams 3 and 4
o were less likely to have left the labour force
o were less likely to have left income support.
Indigenous men in Stream 3 achieved relatively strong off-benefit outcomes compared to non-Indigenous men in the same Stream.
Indigenous job seekers generally have lower outcomes rates than non-Indigenous job seekers in terms of education and employment outcomes or changes in income support. However there are some marked exceptions, mainly with job seekers in Streams 3 and 4 and with people aged 35 years or more.
Figure 24 relates Stream of assistance to the outcomes of Indigenous job seekers compared to non-Indigenous job seekers. This is expressed as the ratio of Indigenous outcome rates to non-Indigenous outcome rates. Generally, employment and education and training outcomes rates for all job seekers tend to decline with increasing Stream level, owing to the greater disadvantage faced by job seekers in higher streams. As this is true for both Indigenous and non-Indigenous job seekers, the ratio of the two should in theory remain constant across the streams. Any variation in the ratio therefore represents differential rates of outcomes achieved between Indigenous and non-Indigenous job seekers. A ratio value that is greater than one means that Indigenous people have higher outcome rates than non-Indigenous job seekers. Conversely, a value of less than one means that Indigenous job seekers have the lower outcome rates.
Two sets of outcomes are included:
Labour market activity and participation in education and training, as measured by the Department’s Post Program Monitoring (PPM) survey of job seekers.
Cessation of income support or change in the type of income support received three months after participation in JSA assistance, as recorded in administrative data.
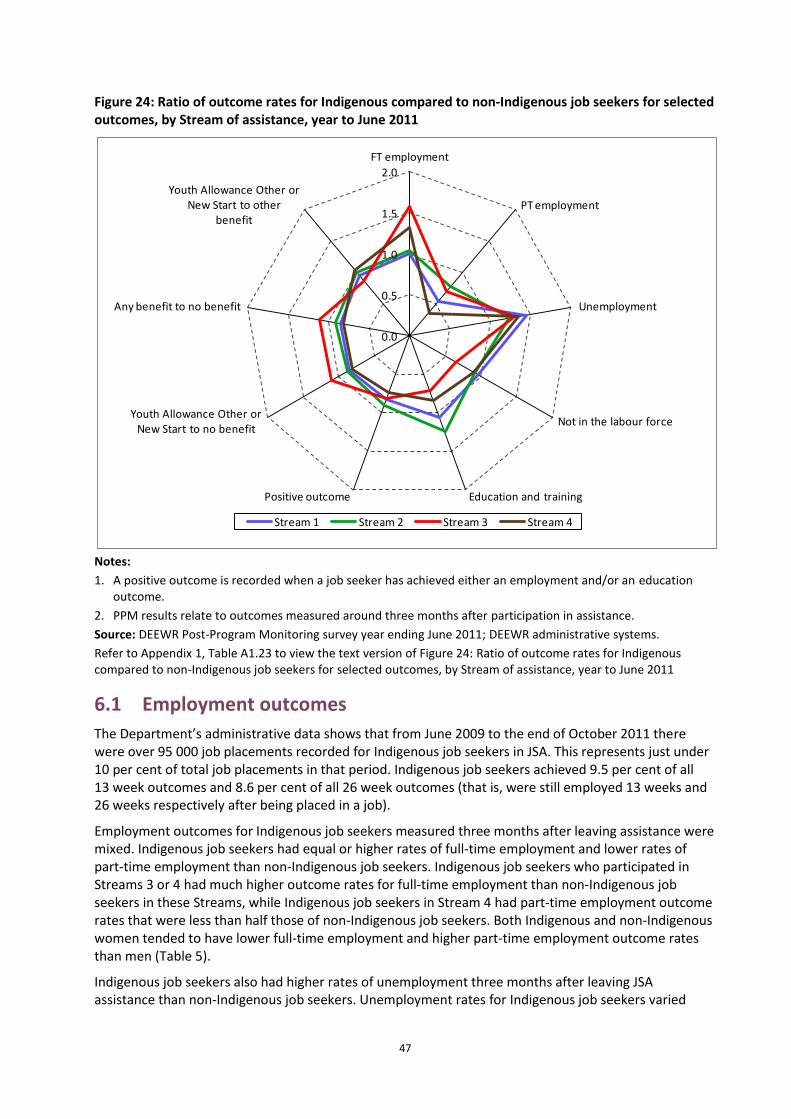
47
Figure 24: Ratio of outcome rates for Indigenous compared to non-Indigenous job seekers for selected outcomes, by Stream of assistance, year to June 2011
Notes:
1. A positive outcome is recorded when a job seeker has achieved either an employment and/or an education outcome.
2. PPM results relate to outcomes measured around three months after participation in assistance.
Source: DEEWR Post-Program Monitoring survey year ending June 2011; DEEWR administrative systems.
Refer to Appendix 1, Table A1.23 to view the text version of Figure 24: Ratio of outcome rates for Indigenous compared to non-Indigenous job seekers for selected outcomes, by Stream of assistance, year to June 2011
6.1 Employment outcomes
The Department’s administrative data shows that from June 2009 to the end of October 2011 there were over 95 000 job placements recorded for Indigenous job seekers in JSA. This represents just under 10 per cent of total job placements in that period. Indigenous job seekers achieved 9.5 per cent of all 13 week outcomes and 8.6 per cent of all 26 week outcomes (that is, were still employed 13 weeks and 26 weeks respectively after being placed in a job).
Employment outcomes for Indigenous job seekers measured three months after leaving assistance were mixed. Indigenous job seekers had equal or higher rates of full-time employment and lower rates of part-time employment than non-Indigenous job seekers. Indigenous job seekers who participated in Streams 3 or 4 had much higher outcome rates for full-time employment than non-Indigenous job seekers in these Streams, while Indigenous job seekers in Stream 4 had part-time employment outcome rates that were less than half those of non-Indigenous job seekers. Both Indigenous and non-Indigenous women tended to have lower full-time employment and higher part-time employment outcome rates than men (Table 5).
Indigenous job seekers also had higher rates of unemployment three months after leaving JSA assistance than non-Indigenous job seekers. Unemployment rates for Indigenous job seekers varied
0.0
0.5
1.0
1.5
2.0
FT employment
PT employment
Unemployment
Not in the labour force
Education and trainingPositive outcome
Youth Allowance Other or New Start to no benefit
Any benefit to no benefit
Youth Allowance Other or New Start to other
benefit
Stream 1 Stream 2 Stream 3 Stream 4
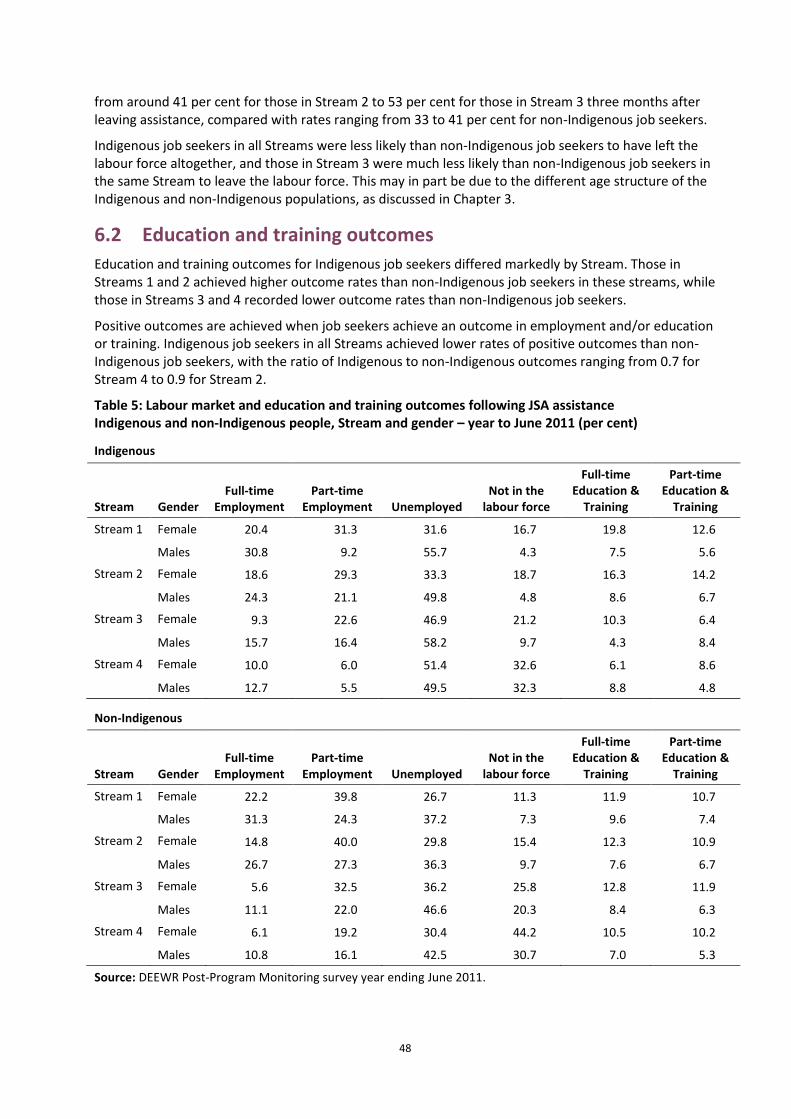
48
from around 41 per cent for those in Stream 2 to 53 per cent for those in Stream 3 three months after leaving assistance, compared with rates ranging from 33 to 41 per cent for non-Indigenous job seekers.
Indigenous job seekers in all Streams were less likely than non-Indigenous job seekers to have left the labour force altogether, and those in Stream 3 were much less likely than non-Indigenous job seekers in the same Stream to leave the labour force. This may in part be due to the different age structure of the Indigenous and non-Indigenous populations, as discussed in Chapter 3.
6.2 Education and training outcomes
Education and training outcomes for Indigenous job seekers differed markedly by Stream. Those in Streams 1 and 2 achieved higher outcome rates than non-Indigenous job seekers in these streams, while those in Streams 3 and 4 recorded lower outcome rates than non-Indigenous job seekers.
Positive outcomes are achieved when job seekers achieve an outcome in employment and/or education or training. Indigenous job seekers in all Streams achieved lower rates of positive outcomes than non-Indigenous job seekers, with the ratio of Indigenous to non-Indigenous outcomes ranging from 0.7 for Stream 4 to 0.9 for Stream 2.
Table 5: Labour market and education and training outcomes following JSA assistance Indigenous and non-Indigenous people, Stream and gender – year to June 2011 (per cent)
Indigenous
Stream Gender Full-time
Employment Part-time
Employment Unemployed Not in the
labour force
Full-time Education &
Training
Part-time Education &
Training
Stream 1 Females
20.4 31.3 31.6 16.7 19.8 12.6
T Males 30.8 9.2 55.7 4.3 7.5 5.6
Stream 2 Females
18.6 29.3 33.3 18.7 16.3 14.2
- Males 24.3 21.1 49.8 4.8 8.6 6.7
Stream 3 Females
9.3 22.6 46.9 21.2 10.3 6.4
- Males 15.7 16.4 58.2 9.7 4.3 8.4
Stream 4 Females
10.0 6.0 51.4 32.6 6.1 8.6
- Males 12.7 5.5 49.5 32.3 8.8 4.8
Non-Indigenous
Stream Gender Full-time
Employment Part-time
Employment Unemployed Not in the
labour force
Full-time Education &
Training
Part-time Education &
Training
Stream 1 Females
22.2 39.8 26.7 11.3 11.9 10.7
- Males 31.3 24.3 37.2 7.3 9.6 7.4
Stream 2 Females
14.8 40.0 29.8 15.4 12.3 10.9
- Males 26.7 27.3 36.3 9.7 7.6 6.7
Stream 3 Females
5.6 32.5 36.2 25.8 12.8 11.9
- Males 11.1 22.0 46.6 20.3 8.4 6.3
Stream 4 Females
6.1 19.2 30.4 44.2 10.5 10.2
Males 10.8 16.1 42.5 30.7 7.0 5.3
Source: DEEWR Post-Program Monitoring survey year ending June 2011.
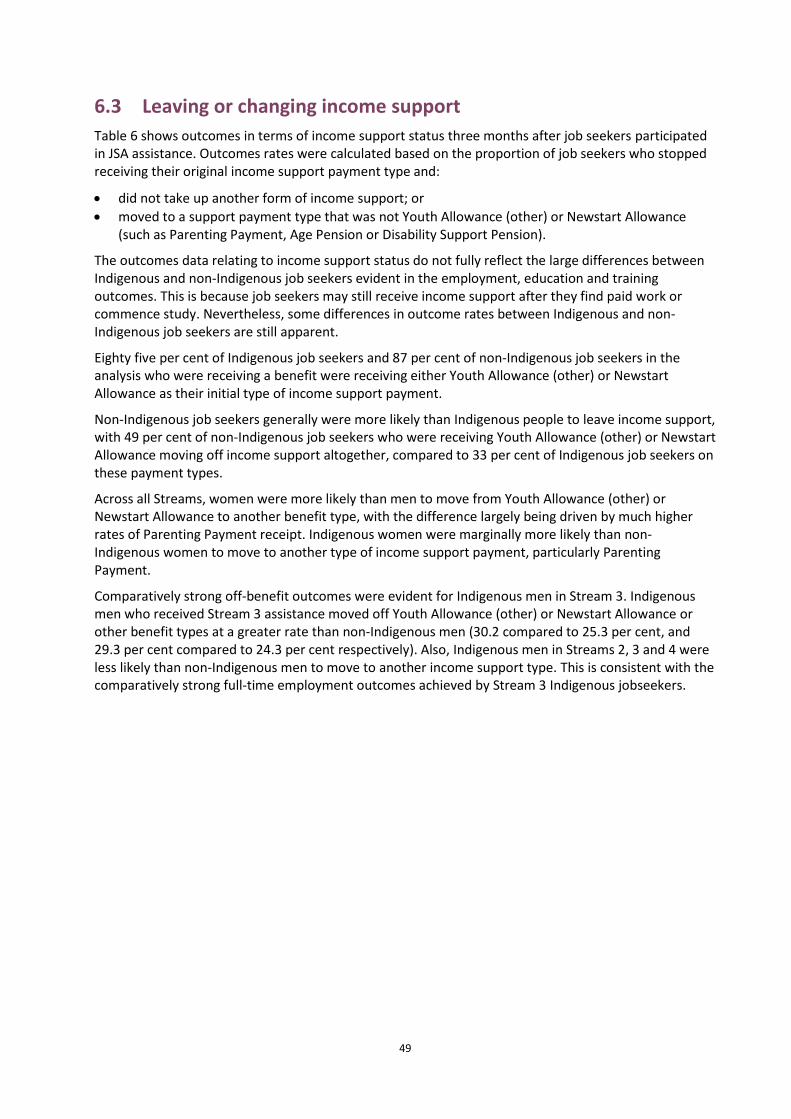
49
6.3 Leaving or changing income support
Table 6 shows outcomes in terms of income support status three months after job seekers participated in JSA assistance. Outcomes rates were calculated based on the proportion of job seekers who stopped receiving their original income support payment type and:
did not take up another form of income support; or
moved to a support payment type that was not Youth Allowance (other) or Newstart Allowance (such as Parenting Payment, Age Pension or Disability Support Pension).
The outcomes data relating to income support status do not fully reflect the large differences between Indigenous and non-Indigenous job seekers evident in the employment, education and training outcomes. This is because job seekers may still receive income support after they find paid work or commence study. Nevertheless, some differences in outcome rates between Indigenous and non-Indigenous job seekers are still apparent.
Eighty five per cent of Indigenous job seekers and 87 per cent of non-Indigenous job seekers in the analysis who were receiving a benefit were receiving either Youth Allowance (other) or Newstart Allowance as their initial type of income support payment.
Non-Indigenous job seekers generally were more likely than Indigenous people to leave income support, with 49 per cent of non-Indigenous job seekers who were receiving Youth Allowance (other) or Newstart Allowance moving off income support altogether, compared to 33 per cent of Indigenous job seekers on these payment types.
Across all Streams, women were more likely than men to move from Youth Allowance (other) or Newstart Allowance to another benefit type, with the difference largely being driven by much higher rates of Parenting Payment receipt. Indigenous women were marginally more likely than non-Indigenous women to move to another type of income support payment, particularly Parenting Payment.
Comparatively strong off-benefit outcomes were evident for Indigenous men in Stream 3. Indigenous men who received Stream 3 assistance moved off Youth Allowance (other) or Newstart Allowance or other benefit types at a greater rate than non-Indigenous men (30.2 compared to 25.3 per cent, and 29.3 per cent compared to 24.3 per cent respectively). Also, Indigenous men in Streams 2, 3 and 4 were less likely than non-Indigenous men to move to another income support type. This is consistent with the comparatively strong full-time employment outcomes achieved by Stream 3 Indigenous jobseekers.
50
Table 6: Income support and benefit related outcomes following JSA assistance Indigenous and non-Indigenous people, stream and gender – year to June 2011 (per cent)
Indigenous
Stream Gender
From Youth Allowance (other) or Newstart
Allowance to no benefit
From any benefit to no benefit
From Youth Allowance (other) or Newstart
Allowance to other benefit
Stream 1 Females 45.4 41.2 18.5
- Males 53.0 52.5 6.1
Stream 2 Females 39.2 37.0 20.8
- Males 48.7 48.3 6.8
Stream 3 Females 20.6 17.2 25.1
- Males 30.2 29.3 9.9
Stream 4 Females 14.2 12.4 36.4
- Males 29.0 28.0 16.2
Non-Indigenous
Stream Gender
From Youth Allowance (other) or Newstart
Allowance to no benefit
From any benefit to no benefit
From Youth Allowance (other) or Newstart
Allowance to other benefit
Stream 1 Females 57.2 53.1 14.0
- Males 61.4 60.9 7.1
Stream 2 Females 46.4 39.7 16.5
- Males 55.0 54.1 8.3
Stream 3 Females 22.1 18.0 21.9
- Males 25.3 24.3 15.1
Stream 4 Females 22.4 18.8 31.8
- Males 32.0 30.9 18.1
Source: DEEWR administrative systems.
51
7 Supporting Indigenous Employment
Key points
The number of Indigenous staff employed by service providers increased, on average, by 1.1 staff members per organisation between 2009 and 2010.
The majority of service provider organisations believe that employing Indigenous staff in service delivery roles is effective in improving their organisation’s ability to work with Indigenous clients, the Indigenous community, and in improving outcomes for Indigenous job seekers.
Service provider organisations could do more to communicate and effectively use their Indigenous Employment Strategy (IES) within their organisations.
Relationships between JSA and CDEP providers vary significantly across organisations. Service providers report that poor relationships can hamper their ability to effectively service job seekers.
The current Employment Services Deed, ESD4, contains a number of aspects designed to strengthen servicing for Indigenous job seekers and employment for Indigenous Australians. The Deed makes specific reference to:
Indigenous Employment Strategies — every organisation contracted to deliver services under the Deed is required to have in place an Indigenous Employment Strategy for their own organisation; and
Service Level Agreements with CDEP providers — every organisation which delivers JSA services in areas where CDEP is active is required to have a Service Level Agreement with the relevant CDEP provider or providers.
JSA providers are also expected to work with employers to service their needs, and to influence employer attitudes to improve employment prospects for Indigenous job seekers.
7.1 Indigenous Employment Strategies
ESD4 includes a requirement that all organisations contracted to supply JSA services must develop and implement an Indigenous Employment Strategy (IES), and that copies of this IES be made available to DEEWR on request.13 This requirement is in line with the Government’s commitment to improve employment outcomes for Indigenous Australians by encouraging demand for Indigenous labour through its procurement arrangements, and commitments to continue to improve servicing for Indigenous job seekers through mainstream employment services.
An IES is a corporate document which sets out an organisation’s commitment to, and procedures for, the recruitment and retention of Aboriginal and Torres Strait Islander staff. IES also contribute to the overall cultural competency of an organisation’s workforce. The exact form and content of the IES should be tailored to the organisation, though will generally include components such as:
an assessment of the organisation’s business needs
identification of the organisation’s stakeholders
how the organisation will attract new Aboriginal and Torres Strait Islander employees
how the organisation will retain Aboriginal and Torres Strait Islander employees
how the organisation will provide a culturally safe and appropriate environment for staff and clients
13 Exempting those organisations providing only National Harvest Labour Scheme services (DEEWR 2008a, p.
289).
52
how the organisation will work with the local Aboriginal and Torres Strait Islander communities and organisations
identification of the resources required for developing and implementing the IES, as well as the risks associated with not having one
procedures and timelines for both the development, implementation and monitoring of the IES.
By 2010, all organisations who were contracted to provide JSA services had reported to DEEWR that they were compliant with the contractual requirement to have an IES in place. DEEWR conducted a one-off survey of head offices of JSA and NEIS provider organisations via Account Managers in 2011 regarding the process of developing and maintaining their IES, the impact of the IES on their employment of Indigenous staff and their ability to deliver services. Ninety two out of the 149 JSA and NEIS provider organisations responded to the survey.
Provider organisations were asked how many Indigenous staff they employed at the beginning of the JSA contract, i.e. at 1 July 2009. Twenty-seven (29 per cent) reported they did not employ any Indigenous staff in their organisation at that time, 52 (56 per cent) employed between one and nine Indigenous staff, and the remaining 13 (14 per cent) employed more than 10 Indigenous staff. Provider organisations were also asked how many Indigenous staff they employed at 30 September 2010. Twenty-two (24 per cent) reported they did not employ any Indigenous staff, 51 (55 per cent) that they employed between one and nine Indigenous staff, and 19 (21 per cent) that they employed 10 or more Indigenous staff.
Table 7 shows descriptive statistics for the number of Indigenous staff employed in 2009 and 2010, and the change in the number of Indigenous staff employed by each organisation from 2009 to 2010.
Table 7: Numbers of Indigenous staff employed by JSA and NEIS providers
- Average
Standard Deviation
At 1 July 2009 4.6 7.4
At 30 September 2010 5.7 8.2
Source: DEEWR survey of JSA and NEIS provider organisations, 2011.
These figures show that the number of Indigenous staff employed by providers is variable across organisations and over time. While most provider organisations employed fewer than ten Indigenous staff at both points in time, some organisations employed significantly more than ten. Some organisations lost Indigenous staff between 2009 and 2010 despite having an IES in place, while others gained Indigenous staff. On average, however, organisations increased their employment of Indigenous staff by 1.1 staff members; with the average number of Indigenous staff employed increasing from 4.6 per organisation to 5.7. There was also a slight reduction in the number of organisations reporting they did not employ any Indigenous staff, from 27 to 22 over the period.
The survey also explored respondents’ opinions of the effect of their IES on their business at the organisational level. Tables 8 and 9 show some key results.
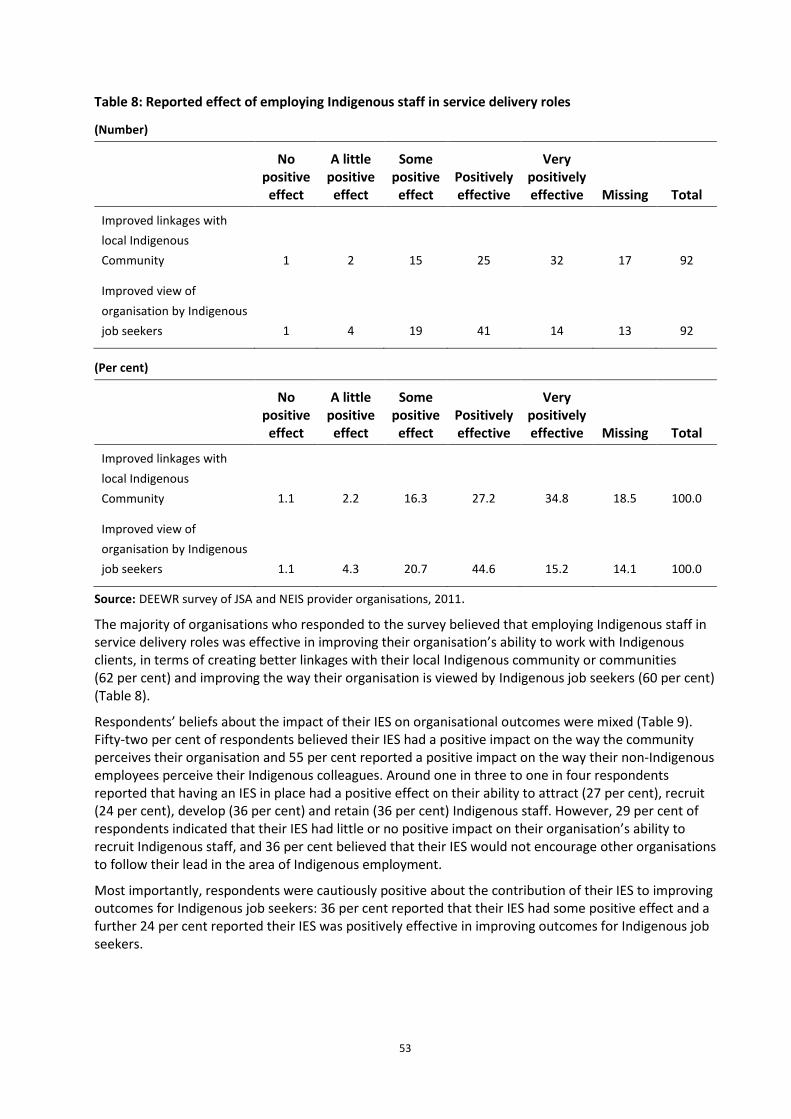
53
Table 8: Reported effect of employing Indigenous staff in service delivery roles
(Number)
-
No positive effect
A little positive effect
Some positive effect
Positively effective
Very positively effective Missing Total
Improved linkages with
local Indigenous
Community 1 2 15 25 32 17 92
Improved view of
organisation by Indigenous
job seekers 1 4 19 41 14 13 92
(Per cent)
-
No positive effect
A little positive effect
Some positive effect
Positively effective
Very positively effective Missing Total
Improved linkages with
local Indigenous
Community 1.1 2.2 16.3 27.2 34.8 18.5 100.0
Improved view of
organisation by Indigenous
job seekers 1.1 4.3 20.7 44.6 15.2 14.1 100.0
Source: DEEWR survey of JSA and NEIS provider organisations, 2011.
The majority of organisations who responded to the survey believed that employing Indigenous staff in service delivery roles was effective in improving their organisation’s ability to work with Indigenous clients, in terms of creating better linkages with their local Indigenous community or communities (62 per cent) and improving the way their organisation is viewed by Indigenous job seekers (60 per cent) (Table 8).
Respondents’ beliefs about the impact of their IES on organisational outcomes were mixed (Table 9). Fifty-two per cent of respondents believed their IES had a positive impact on the way the community perceives their organisation and 55 per cent reported a positive impact on the way their non-Indigenous employees perceive their Indigenous colleagues. Around one in three to one in four respondents reported that having an IES in place had a positive effect on their ability to attract (27 per cent), recruit (24 per cent), develop (36 per cent) and retain (36 per cent) Indigenous staff. However, 29 per cent of respondents indicated that their IES had little or no positive impact on their organisation’s ability to recruit Indigenous staff, and 36 per cent believed that their IES would not encourage other organisations to follow their lead in the area of Indigenous employment.
Most importantly, respondents were cautiously positive about the contribution of their IES to improving outcomes for Indigenous job seekers: 36 per cent reported that their IES had some positive effect and a further 24 per cent reported their IES was positively effective in improving outcomes for Indigenous job seekers.
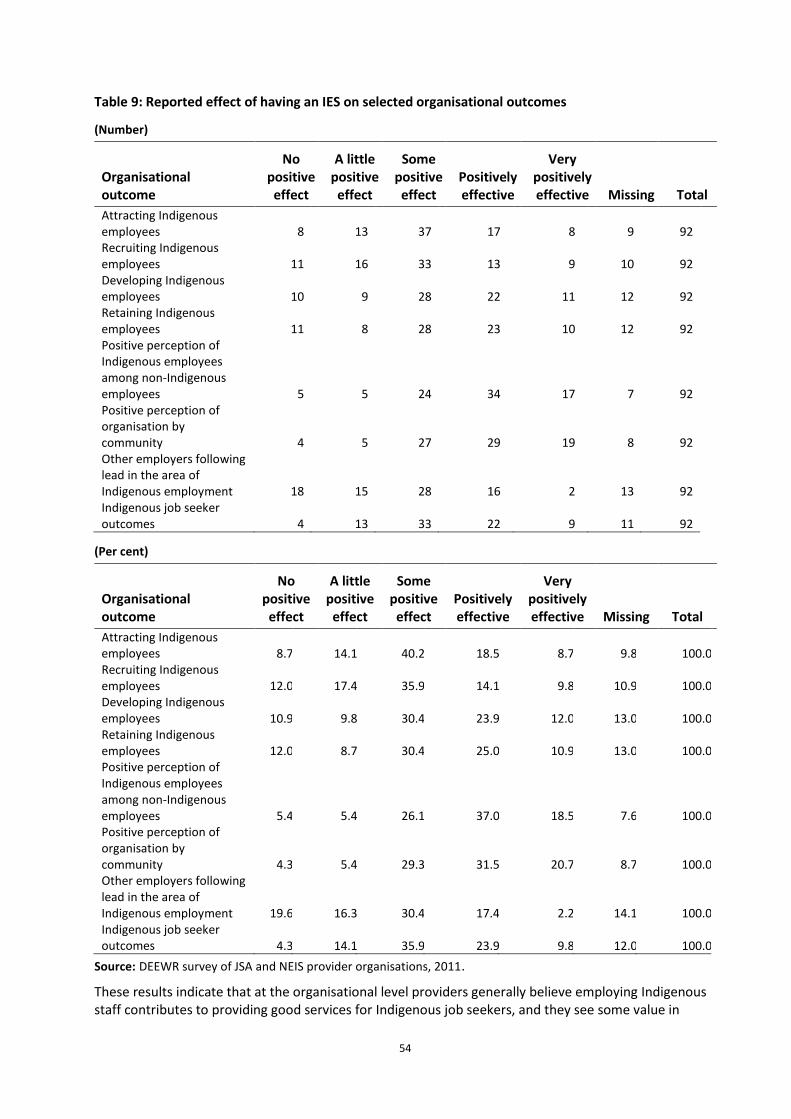
54
Table 9: Reported effect of having an IES on selected organisational outcomes
(Number)
Organisational outcome
No positive effect
A little positive effect
Some positive effect
Positively effective
Very positively effective Missing Total
Attracting Indigenous employees 8 13 37 17 8 9 92 Recruiting Indigenous employees 11 16 33 13 9 10 92 Developing Indigenous employees 10 9 28 22 11 12 92 Retaining Indigenous employees 11 8 28 23 10 12 92 Positive perception of Indigenous employees among non-Indigenous employees 5 5 24 34 17 7 92 Positive perception of organisation by community 4 5 27 29 19 8 92 Other employers following lead in the area of Indigenous employment 18 15 28 16 2 13 92 Indigenous job seeker outcomes 4 13 33 22 9 11 92
(Per cent)
Organisational outcome
No positive effect
A little positive effect
Some positive effect
Positively effective
Very positively effective Missing Total
Attracting Indigenous employees 8.7 14.1 40.2 18.5 8.7 9.8 100.0 Recruiting Indigenous employees 12.0 17.4 35.9 14.1 9.8 10.9 100.0 Developing Indigenous employees 10.9 9.8 30.4 23.9 12.0 13.0 100.0 Retaining Indigenous employees 12.0 8.7 30.4 25.0 10.9 13.0 100.0 Positive perception of Indigenous employees among non-Indigenous employees 5.4 5.4 26.1 37.0 18.5 7.6 100.0 Positive perception of organisation by community 4.3 5.4 29.3 31.5 20.7 8.7 100.0 Other employers following lead in the area of Indigenous employment 19.6 16.3 30.4 17.4 2.2 14.1 100.0 Indigenous job seeker outcomes 4.3 14.1 35.9 23.9 9.8 12.0 100.0
Source: DEEWR survey of JSA and NEIS provider organisations, 2011.
These results indicate that at the organisational level providers generally believe employing Indigenous staff contributes to providing good services for Indigenous job seekers, and they see some value in
55
having an IES as a mean of supporting Indigenous employment within their organisation. However, in order to be effective an IES must be closely linked to the organisation’s business processes and should be communicated to all staff, particularly those who are responsible for recruitment and direct management of staff.
The 2010 Survey of Employment Service Providers14 asked JSA site managers (n=683) about their organisation’s IES. Despite all organisations reporting to DEEWR that they met their contractual requirement to have an IES, only 309 (45 per cent) of site managers reported that their organisation had an IES in place, and a further 13 per cent believed that their organisation was in the process of developing an IES. A small proportion of respondents (4 per cent) said that their organisation did not have an IES and was not in the process of developing one. Thirty-eight per cent could not say whether or not their organisation had an IES or was in the process of developing one.
These findings are consistent with findings from site visits with JSA providers conducted in 2010. A small number of site managers and employment consultants were able to talk knowledgably about their corporate IES, but much more commonly staff reported only a vague awareness that an IES “should” or “probably” existed at the corporate level. These staff often reported that they had never seen a copy of the document, or if they had seen it did not feel it had relevance to how business is undertaken at their site.
It is unlikely that a corporate IES can be effective if key staff at the site level are unaware of its existence or its relevance to how they conduct business. Evidence of low awareness of corporate IESs among site managers suggests that provider organisations could improve the impact of their IES by strengthening internal communication and buy-in at the local level.
The 309 site managers who reported that their organisation had an IES in place were asked when it was implemented. Twenty eight per cent indicated it was in place prior to 2009, 39 per cent that it was implemented in 2009, and another 11 per cent in 2010. Twenty two per cent were unsure when the IES was implemented or did not respond to the question. These figures suggest that the requirement to have an IES as part of ESD4 increased the proportion of organisations contracted to deliver mainstream employment services which have one, though implementation may have taken longer than expected.
The majority of respondents whose sites employed at least one Indigenous member of staff reported that having Indigenous staff improves the quality of service they are able to provide to their Indigenous clients (77 per cent). However, opinions regarding whether having an IES led to more Indigenous staff being employed at the site were mixed. Of respondents whose sites employed at least one Indigenous staff member and who reported that their organisation had and IES, 42 per cent believed that the IES contributed to more Indigenous staff being employed, but 45 per cent believed that the same number of Indigenous staff would have been employed without the IES.
The requirement in ESD4 for organisations providing JSA services to have an IES was intended to achieve two benefits:
increase employment of Indigenous Australians by organisations contracted to deliver mainstream government employment services; and
to improve servicing for Indigenous job seekers.
Evidence is that the requirement did increase the proportion of organisations that have an IES in place. At both the corporate level and the site level, service providers recognise a link between employing Indigenous staff and their ability to service their Indigenous clients effectively. Opinions are more mixed regarding the effectiveness of having an IES as a means to increase Indigenous employment within service provider organisations, though on balance providers see having an IES as a positive step.
14 The Survey of Employment Service Providers is run annually by DEEWR.
56
Reported changes in the number of Indigenous staff employed by providers since 1 July 2009 were highly varied across organisations, but on average numbers increased by 1.1 staff members per organisation. There are potential gains to be made in the contribution IES make to the number of Indigenous staff employed by service providers and to their ability to provide effective services to Indigenous job seekers through organisations increasing awareness among staff at the site level and continuing to implement and refine their strategies.
7.2 Service Level Agreements
ESD4 requires that JSA providers must enter into Service Level and Partnership Agreements (SLAs) with the local Community Development Employment Program (CDEP) providers in locations where they are both operating. These SLAs are to set out how the organisations will work in partnership to coordinate service delivery and maximise Indigenous work readiness and employment outcomes ((DEEWR, 2009b, Clause 116). This requirement aims to reduce uncertainty and strengthen relationships between service providers, and ultimately to improve service quality for job seekers.
Qualitative research in remote areas undertaken in 2010 indicates that the relationship between JSA and CDEP providers varies significantly across locations. In some areas the relationship works well and providers collaborate to deliver services, which increases effectiveness. However, in other locations community members and staff report the relationships are not functional, with disagreements over roles and responsibilities hampering service delivery.
Feedback from areas where CDEP does not operate suggests that these issues are not confined to the relationship between CDEP and JSA providers. Feedback from IEP providers, Jobs Fund projects and Innovation Fund projects is that poor relationships with local JSA providers can severely hamper the success of projects and their ability to service clients effectively. In turn, JSA providers not being aware of programs and projects in their local area and not having a good working relationship with other providers reduces the opportunities available for them to service their clients, in particular to access training and work experience activities. For relationships to be successful is vital for organisations to have a shared understanding of project or program objectives, what sort of job seekers are suitable for referral, the roles and responsibilities of servicing while job seekers are participating in projects, and on how outcomes (particularly employment outcomes) will be attributed.
Formal agreements between organisations such as SLAs provide a useful tool for increasing understanding and reducing uncertainty in relationships between service providers, which contributes to improved service delivery. Service provision, particularly for Indigenous job seekers, may be improved by JSA providers strengthening and formalising their relationships with other organisations in their local areas, not just CDEP providers.
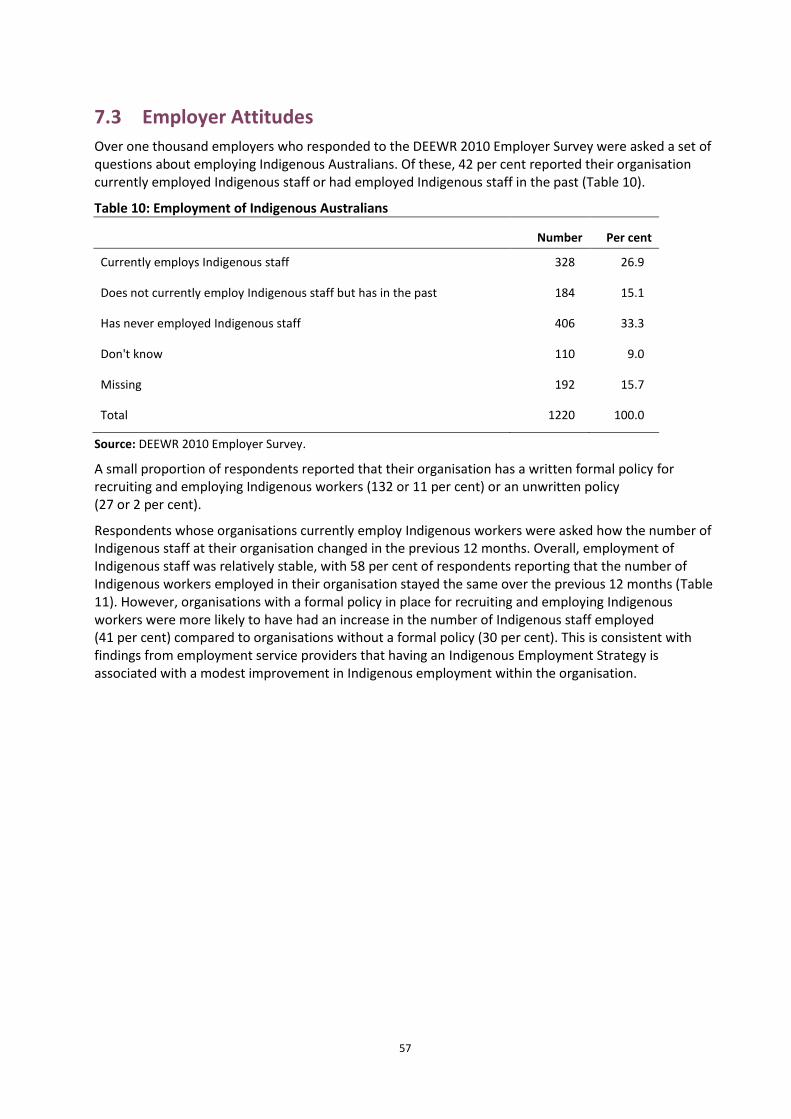
57
7.3 Employer Attitudes
Over one thousand employers who responded to the DEEWR 2010 Employer Survey were asked a set of questions about employing Indigenous Australians. Of these, 42 per cent reported their organisation currently employed Indigenous staff or had employed Indigenous staff in the past (Table 10).
Table 10: Employment of Indigenous Australians
- Number Per cent
Currently employs Indigenous staff 328 26.9
Does not currently employ Indigenous staff but has in the past 184 15.1
Has never employed Indigenous staff 406 33.3
Don't know 110 9.0
Missing 192 15.7
Total 1220 100.0
Source: DEEWR 2010 Employer Survey.
A small proportion of respondents reported that their organisation has a written formal policy for recruiting and employing Indigenous workers (132 or 11 per cent) or an unwritten policy (27 or 2 per cent).
Respondents whose organisations currently employ Indigenous workers were asked how the number of Indigenous staff at their organisation changed in the previous 12 months. Overall, employment of Indigenous staff was relatively stable, with 58 per cent of respondents reporting that the number of Indigenous workers employed in their organisation stayed the same over the previous 12 months (Table 11). However, organisations with a formal policy in place for recruiting and employing Indigenous workers were more likely to have had an increase in the number of Indigenous staff employed (41 per cent) compared to organisations without a formal policy (30 per cent). This is consistent with findings from employment service providers that having an Indigenous Employment Strategy is associated with a modest improvement in Indigenous employment within the organisation.
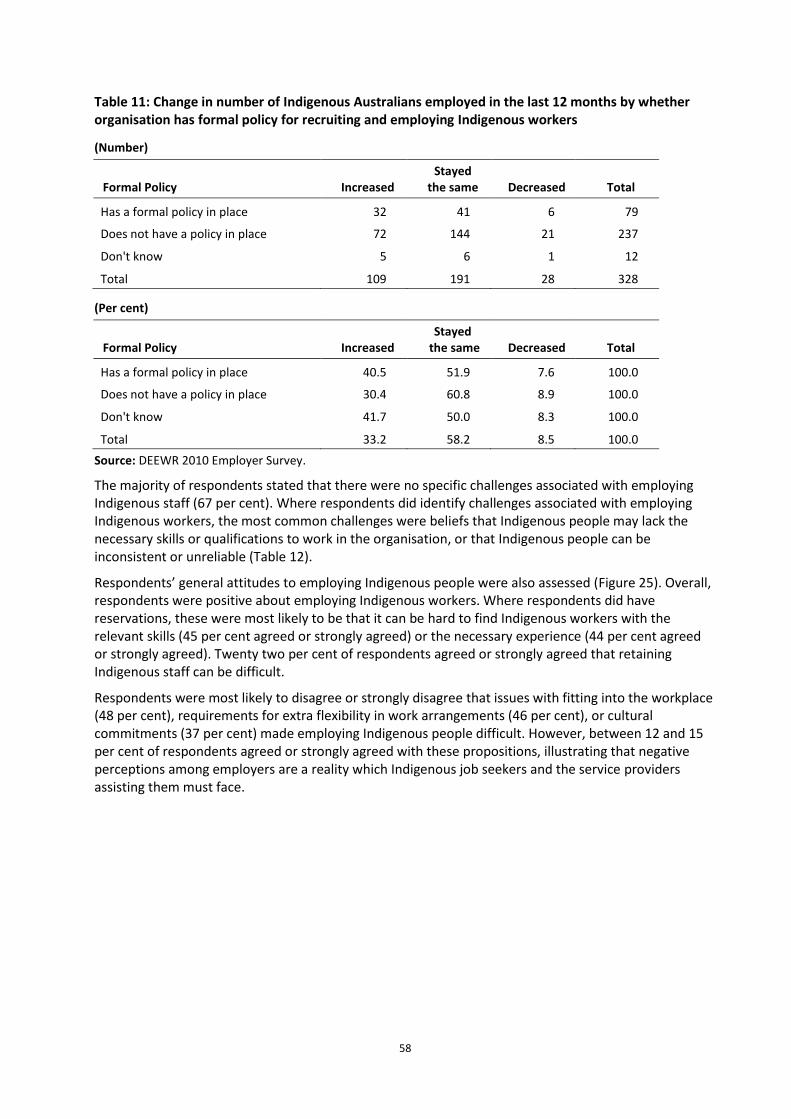
58
Table 11: Change in number of Indigenous Australians employed in the last 12 months by whether organisation has formal policy for recruiting and employing Indigenous workers
(Number)
Formal Policy Increased Stayed
the same Decreased Total
Has a formal policy in place 32 41 6 79
Does not have a policy in place 72 144 21 237
Don't know 5 6 1 12
Total 109 191 28 328
(Per cent)
Formal Policy Increased Stayed
the same Decreased Total
Has a formal policy in place 40.5 51.9 7.6 100.0
Does not have a policy in place 30.4 60.8 8.9 100.0
Don't know 41.7 50.0 8.3 100.0
Total 33.2 58.2 8.5 100.0
Source: DEEWR 2010 Employer Survey.
The majority of respondents stated that there were no specific challenges associated with employing Indigenous staff (67 per cent). Where respondents did identify challenges associated with employing Indigenous workers, the most common challenges were beliefs that Indigenous people may lack the necessary skills or qualifications to work in the organisation, or that Indigenous people can be inconsistent or unreliable (Table 12).
Respondents’ general attitudes to employing Indigenous people were also assessed (Figure 25). Overall, respondents were positive about employing Indigenous workers. Where respondents did have reservations, these were most likely to be that it can be hard to find Indigenous workers with the relevant skills (45 per cent agreed or strongly agreed) or the necessary experience (44 per cent agreed or strongly agreed). Twenty two per cent of respondents agreed or strongly agreed that retaining Indigenous staff can be difficult.
Respondents were most likely to disagree or strongly disagree that issues with fitting into the workplace (48 per cent), requirements for extra flexibility in work arrangements (46 per cent), or cultural commitments (37 per cent) made employing Indigenous people difficult. However, between 12 and 15 per cent of respondents agreed or strongly agreed with these propositions, illustrating that negative perceptions among employers are a reality which Indigenous job seekers and the service providers assisting them must face.
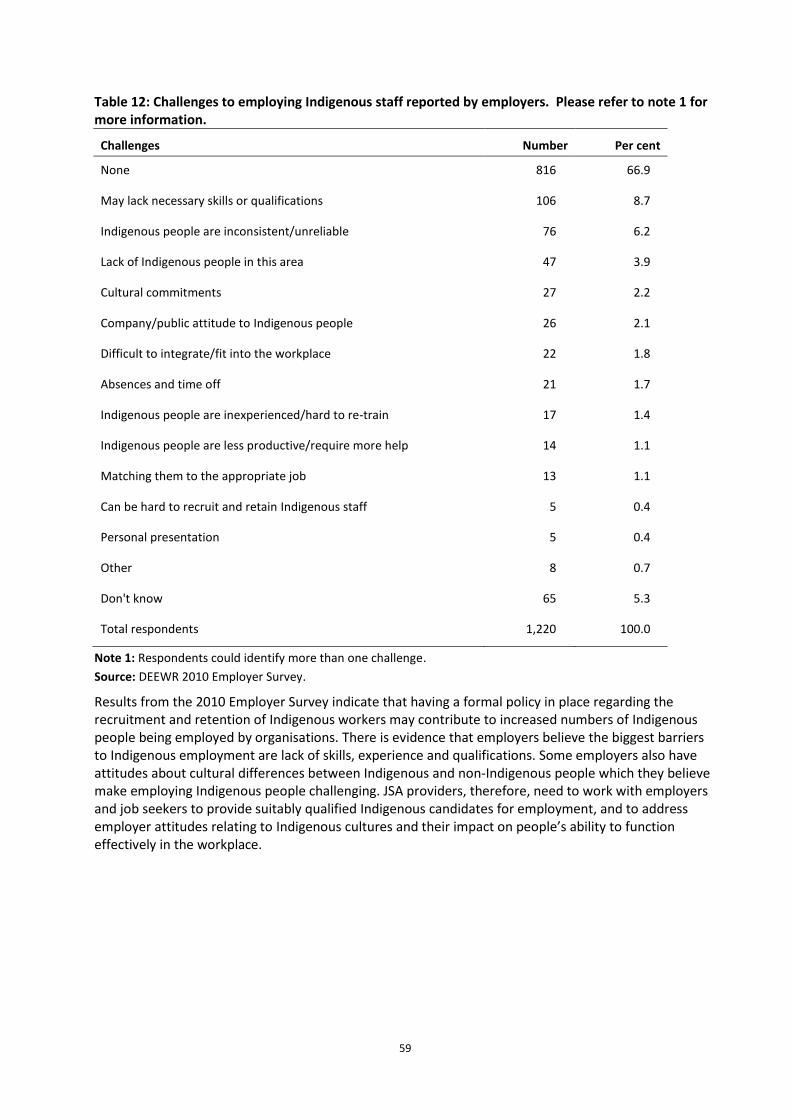
59
Table 12: Challenges to employing Indigenous staff reported by employers. Please refer to note 1 for more information.
Challenges Number Per cent
None 816 66.9
May lack necessary skills or qualifications 106 8.7
Indigenous people are inconsistent/unreliable 76 6.2
Lack of Indigenous people in this area 47 3.9
Cultural commitments 27 2.2
Company/public attitude to Indigenous people 26 2.1
Difficult to integrate/fit into the workplace 22 1.8
Absences and time off 21 1.7
Indigenous people are inexperienced/hard to re-train 17 1.4
Indigenous people are less productive/require more help 14 1.1
Matching them to the appropriate job 13 1.1
Can be hard to recruit and retain Indigenous staff 5 0.4
Personal presentation 5 0.4
Other 8 0.7
Don't know 65 5.3
Total respondents 1,220 100.0
Note 1: Respondents could identify more than one challenge.
Source: DEEWR 2010 Employer Survey.
Results from the 2010 Employer Survey indicate that having a formal policy in place regarding the recruitment and retention of Indigenous workers may contribute to increased numbers of Indigenous people being employed by organisations. There is evidence that employers believe the biggest barriers to Indigenous employment are lack of skills, experience and qualifications. Some employers also have attitudes about cultural differences between Indigenous and non-Indigenous people which they believe make employing Indigenous people challenging. JSA providers, therefore, need to work with employers and job seekers to provide suitably qualified Indigenous candidates for employment, and to address employer attitudes relating to Indigenous cultures and their impact on people’s ability to function effectively in the workplace.
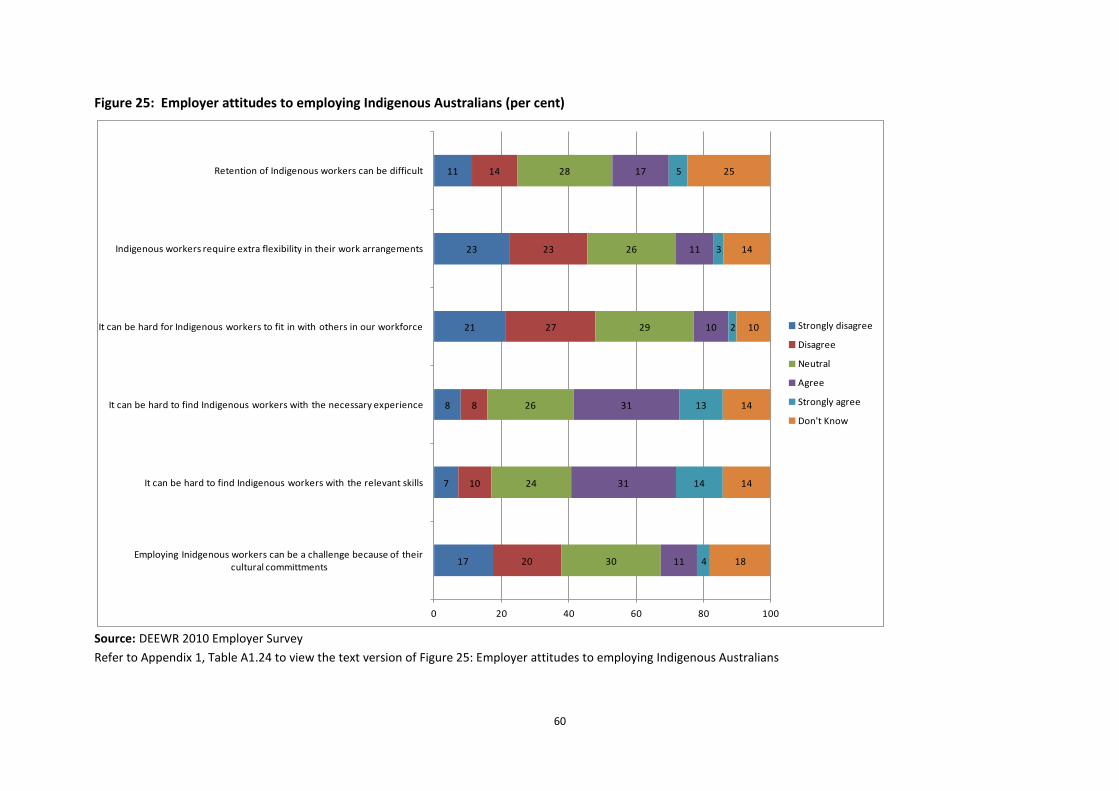
60
Figure 25: Employer attitudes to employing Indigenous Australians (per cent)
Source: DEEWR 2010 Employer Survey
Refer to Appendix 1, Table A1.24 to view the text version of Figure 25: Employer attitudes to employing Indigenous Australians
17
7
8
21
23
11
20
10
8
27
23
14
30
24
26
29
26
28
11
31
31
10
11
17
4
14
13
2
3
5
18
14
14
10
14
25
0 20 40 60 80 100
Employing Inidgenous workers can be a challenge because of their cultural committments
It can be hard to find Indigenous workers with the relevant skills
It can be hard to find Indigenous workers with the necessary experience
It can be hard for Indigenous workers to fit in with others in our workforce
Indigenous workers require extra flexibility in their work arrangements
Retention of Indigenous workers can be difficult
Strongly disagree
Disagree
Neutral
Agree
Strongly agree
Don't Know
61
8 Conclusion
More than 12 per cent of job seekers who receive assistance from JSA are Indigenous Australians, around six times the proportion of Indigenous people in the Australian working-age population overall. This report has examined the characteristics of the Indigenous labour force and of Indigenous job seekers in JSA; their participation and engagement in JSA; the assistance they have received; how successful this assistance has been; and some of the challenges identified in servicing Indigenous job seekers.
So far JSA has been reasonably successful in placing Indigenous people into employment, but not at a rate which will achieve the Closing the Gap target of halving the gap in employment outcomes between Indigenous and non-Indigenous Australians by 2018. Reliable data available to measure progress against this target will not be available until the release of detailed 2011 Population Census data.
Indigenous employment outcomes are influenced by many factors, including macroeconomic conditions, the demographic profile of the Indigenous population, and the effects of other Government and non-Government policies and services such as health, education and training and housing services. In this context, JSA alone cannot close the gap, in isolation from other labour market and social policy initiatives.
The Indigenous job seeker population is different in multiple ways from the non-Indigenous job seeker population. It has a larger component of young people and particularly of young men, highlighting the importance of the provision of effective and appropriate education and training opportunities to these job seekers.
A large proportion of Indigenous job seekers live in remote and very remote areas. Providing services and achieving education, training and employment outcomes in these areas presents a number of challenges. Service provision in this area has recently been under review, and a new Remote Participation and Employment Service is being considered in the context of the 2012-13 Budget, to commence on 1 July 2013.
Improvements have been made to the JSA compliance framework since 2009-10. Changes applying to all job seekers were introduced in July 2011 to provide additional incentive to attend appointments, engage with their provider and participate fully in activities. Enhancements were announced in the 2011-12 Budget that are intended to further strengthen the compliance framework by focussing more attention on vulnerable job seekers who having difficulty meeting their participation requirements, to take effect from 1 July 2012. In addition, community-specific parameters for considering “reasonable excuse” for job seeker non-compliance are being trialled in two remote communities in 2011-12.
Nearly half of Indigenous job seekers are in Stream 3, and a further 34 per cent are in Stream 4. This reflects the high levels of labour market disadvantage and vocational and non-vocational barriers that many Indigenous job seekers face. In addition, there is some evidence that the assessments required to place job seekers in Stream 4 are more difficult to implement in remote areas, potentially limiting the access of Indigenous job seekers to the higher levels of servicing available in this Stream.
JSA is delivering good results in terms of full-time employment outcomes for Indigenous people, particularly those in Stream 3, however Indigenous job seekers record lower part-time employment outcomes and higher unemployment rates than non-Indigenous job seekers. This
62
may in part be due to issues with transport and communications experienced by Indigenous job seekers in remote areas.
Education and training outcomes for Indigenous job seekers are also somewhat mixed, with higher outcomes than for non-Indigenous job seekers in Streams 1 and 2, but lower outcomes for Indigenous job seekers in Streams 3 and 4. Encouraging levels of remote educational commencement and achievement outcomes are also being recorded by Indigenous job seekers.
Compared to non-Indigenous people, Indigenous people show signs of weaker engagement with JSA services, despite the greater propensity of those who have not found work to remain unemployed rather than leave the labour market. There are a number of concrete ways in which JSA providers can help to boost positive outcomes for Indigenous job seekers. The quality and effectiveness of servicing could be improved by building better links with local Indigenous communities and other service providers; by fully utilising Indigenous Employment Strategies; and by improving the cultural competency of staff.
JSA providers can also assist Indigenous job seekers achieve employment outcomes by working with employers to better understand their skill needs so they are able to supply suitably qualified Indigenous candidates, and to address the negative attitudes some employers have towards employing Indigenous job seekers.
Several initiatives are currently being developed to improve the provision of employment-related services for Indigenous Australians, and these may address some of the issues with servicing Indigenous job seekers that have been identified in this report. These include changes to Job Services Australia for 2012-15 including: a stronger focus on improved cultural competence training for service provider staff; the new Indigenous Youth Careers Pathways Program; the Connections for Quality Project; and a review of Remote Participation and Employment Services. Other initiatives such as those announced in the Building Australia’s Future Workforce package, as well as changes in the wider policy context such as the Indigenous Opportunities Policy will also contribute to improved participation and employment outcomes for Indigenous Australians.
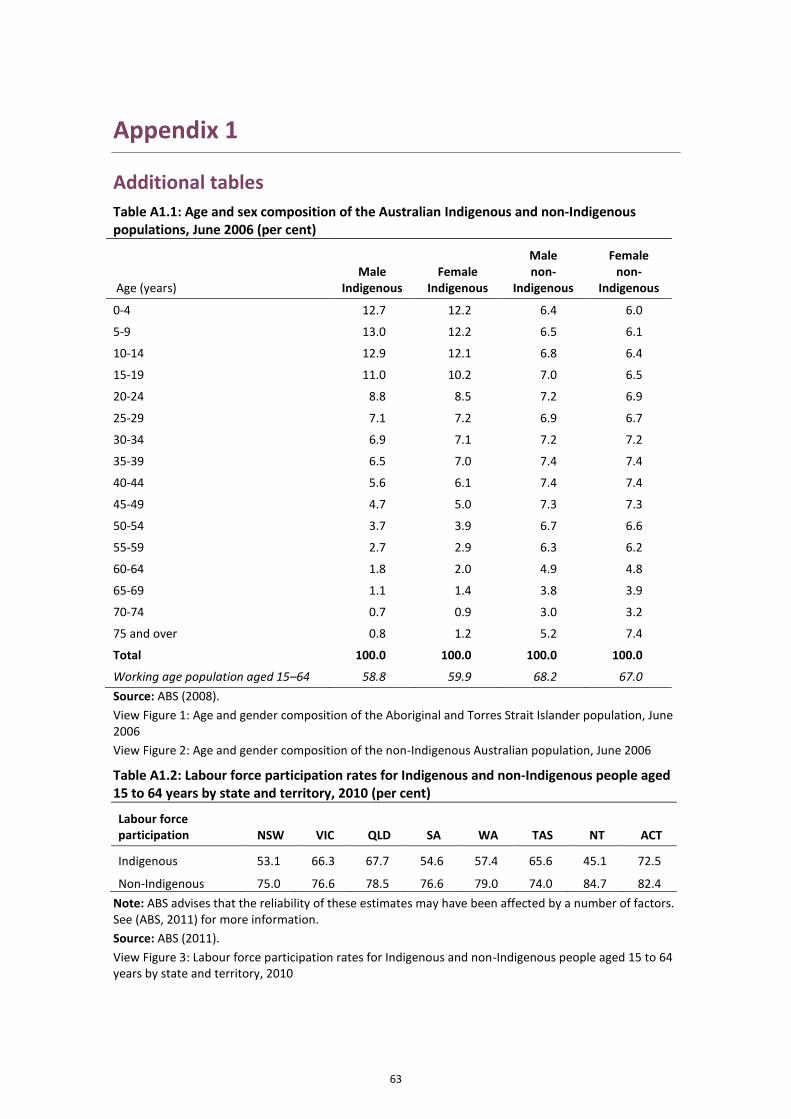
63
Appendix 1
Additional tables
Table A1.1: Age and sex composition of the Australian Indigenous and non-Indigenous populations, June 2006 (per cent)
Age (years) Male
Indigenous Female
Indigenous
Male non-
Indigenous
Female non-
Indigenous
0-4 12.7 12.2 6.4 6.0
5-9 13.0 12.2 6.5 6.1
10-14 12.9 12.1 6.8 6.4
15-19 11.0 10.2 7.0 6.5
20-24 8.8 8.5 7.2 6.9
25-29 7.1 7.2 6.9 6.7
30-34 6.9 7.1 7.2 7.2
35-39 6.5 7.0 7.4 7.4
40-44 5.6 6.1 7.4 7.4
45-49 4.7 5.0 7.3 7.3
50-54 3.7 3.9 6.7 6.6
55-59 2.7 2.9 6.3 6.2
60-64 1.8 2.0 4.9 4.8
65-69 1.1 1.4 3.8 3.9
70-74 0.7 0.9 3.0 3.2
75 and over 0.8 1.2 5.2 7.4
Total 100.0 100.0 100.0 100.0
Working age population aged 15–64 58.8 59.9 68.2 67.0
Source: ABS (2008).
View Figure 1: Age and gender composition of the Aboriginal and Torres Strait Islander population, June 2006
View Figure 2: Age and gender composition of the non-Indigenous Australian population, June 2006
Table A1.2: Labour force participation rates for Indigenous and non-Indigenous people aged 15 to 64 years by state and territory, 2010 (per cent)
Labour force participation NSW VIC QLD SA WA TAS NT ACT
Indigenous 53.1 66.3 67.7 54.6 57.4 65.6 45.1 72.5
Non-Indigenous 75.0 76.6 78.5 76.6 79.0 74.0 84.7 82.4
Note: ABS advises that the reliability of these estimates may have been affected by a number of factors. See (ABS, 2011) for more information.
Source: ABS (2011).
View Figure 3: Labour force participation rates for Indigenous and non-Indigenous people aged 15 to 64 years by state and territory, 2010
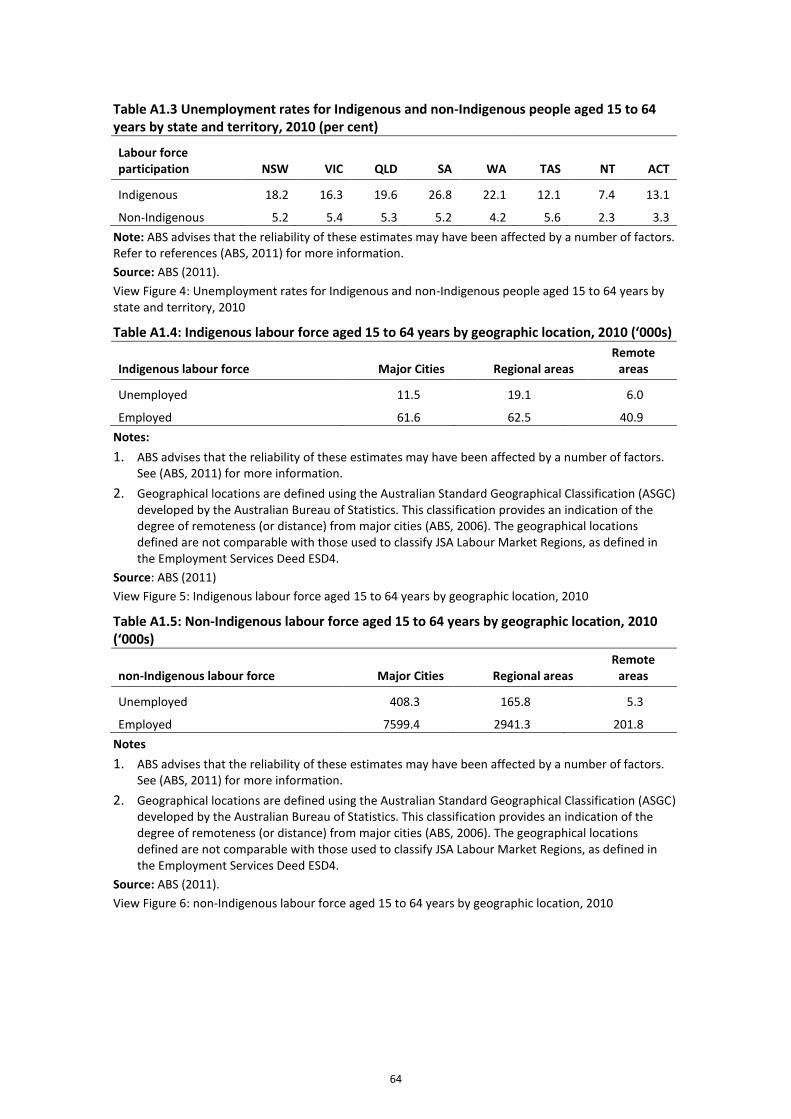
64
Table A1.3 Unemployment rates for Indigenous and non-Indigenous people aged 15 to 64 years by state and territory, 2010 (per cent)
Labour force participation NSW VIC QLD SA WA TAS NT ACT
Indigenous 18.2 16.3 19.6 26.8 22.1 12.1 7.4 13.1
Non-Indigenous 5.2 5.4 5.3 5.2 4.2 5.6 2.3 3.3
Note: ABS advises that the reliability of these estimates may have been affected by a number of factors. Refer to references (ABS, 2011) for more information.
Source: ABS (2011).
View Figure 4: Unemployment rates for Indigenous and non-Indigenous people aged 15 to 64 years by state and territory, 2010
Table A1.4: Indigenous labour force aged 15 to 64 years by geographic location, 2010 (‘000s)
Indigenous labour force Major Cities Regional areas Remote
areas
Unemployed 11.5 19.1 6.0
Employed 61.6 62.5 40.9
Notes:
1. ABS advises that the reliability of these estimates may have been affected by a number of factors. See (ABS, 2011) for more information.
2. Geographical locations are defined using the Australian Standard Geographical Classification (ASGC) developed by the Australian Bureau of Statistics. This classification provides an indication of the degree of remoteness (or distance) from major cities (ABS, 2006). The geographical locations defined are not comparable with those used to classify JSA Labour Market Regions, as defined in the Employment Services Deed ESD4.
Source: ABS (2011)
View Figure 5: Indigenous labour force aged 15 to 64 years by geographic location, 2010
Table A1.5: Non-Indigenous labour force aged 15 to 64 years by geographic location, 2010 (‘000s)
non-Indigenous labour force Major Cities Regional areas Remote
areas
Unemployed 408.3 165.8 5.3
Employed 7599.4 2941.3 201.8
Notes
1. ABS advises that the reliability of these estimates may have been affected by a number of factors. See (ABS, 2011) for more information.
2. Geographical locations are defined using the Australian Standard Geographical Classification (ASGC) developed by the Australian Bureau of Statistics. This classification provides an indication of the degree of remoteness (or distance) from major cities (ABS, 2006). The geographical locations defined are not comparable with those used to classify JSA Labour Market Regions, as defined in the Employment Services Deed ESD4.
Source: ABS (2011).
View Figure 6: non-Indigenous labour force aged 15 to 64 years by geographic location, 2010
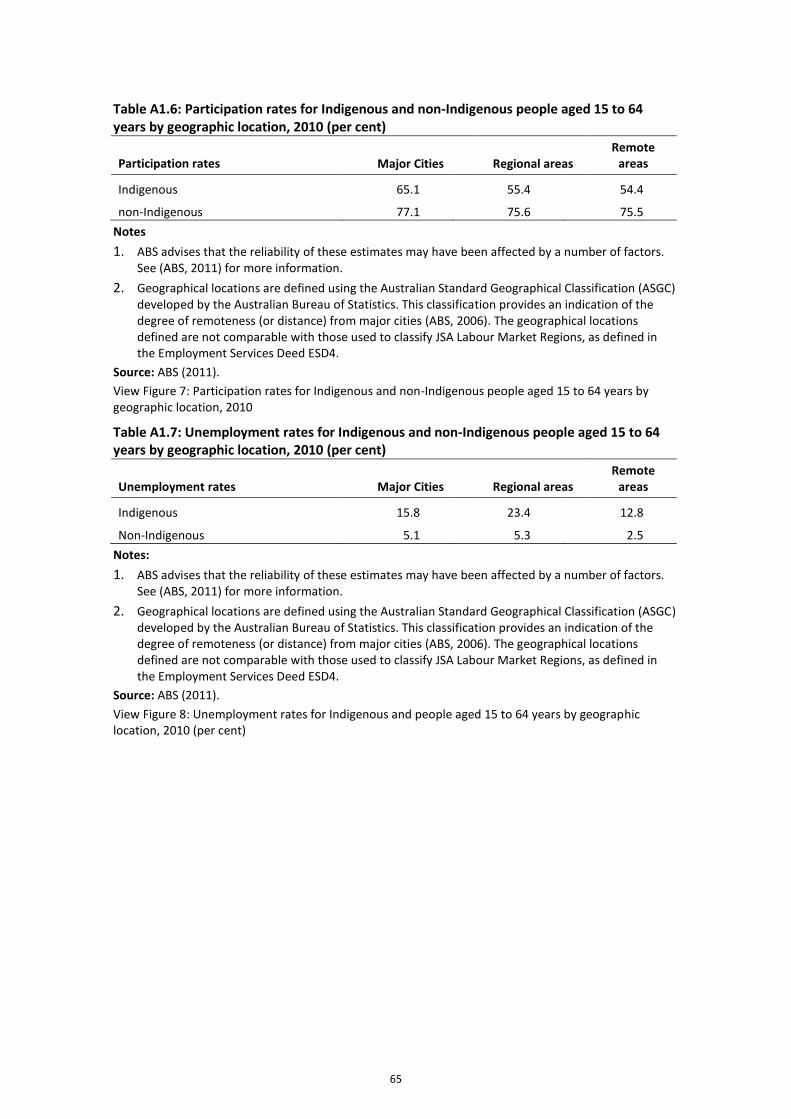
65
Table A1.6: Participation rates for Indigenous and non-Indigenous people aged 15 to 64 years by geographic location, 2010 (per cent)
Participation rates Major Cities Regional areas Remote
areas
Indigenous 65.1 55.4 54.4
non-Indigenous 77.1 75.6 75.5
Notes
1. ABS advises that the reliability of these estimates may have been affected by a number of factors. See (ABS, 2011) for more information.
2. Geographical locations are defined using the Australian Standard Geographical Classification (ASGC) developed by the Australian Bureau of Statistics. This classification provides an indication of the degree of remoteness (or distance) from major cities (ABS, 2006). The geographical locations defined are not comparable with those used to classify JSA Labour Market Regions, as defined in the Employment Services Deed ESD4.
Source: ABS (2011).
View Figure 7: Participation rates for Indigenous and non-Indigenous people aged 15 to 64 years by geographic location, 2010
Table A1.7: Unemployment rates for Indigenous and non-Indigenous people aged 15 to 64 years by geographic location, 2010 (per cent)
Unemployment rates Major Cities Regional areas Remote
areas
Indigenous 15.8 23.4 12.8
Non-Indigenous 5.1 5.3 2.5
Notes:
1. ABS advises that the reliability of these estimates may have been affected by a number of factors. See (ABS, 2011) for more information.
2. Geographical locations are defined using the Australian Standard Geographical Classification (ASGC) developed by the Australian Bureau of Statistics. This classification provides an indication of the degree of remoteness (or distance) from major cities (ABS, 2006). The geographical locations defined are not comparable with those used to classify JSA Labour Market Regions, as defined in the Employment Services Deed ESD4.
Source: ABS (2011).
View Figure 8: Unemployment rates for Indigenous and people aged 15 to 64 years by geographic location, 2010 (per cent)
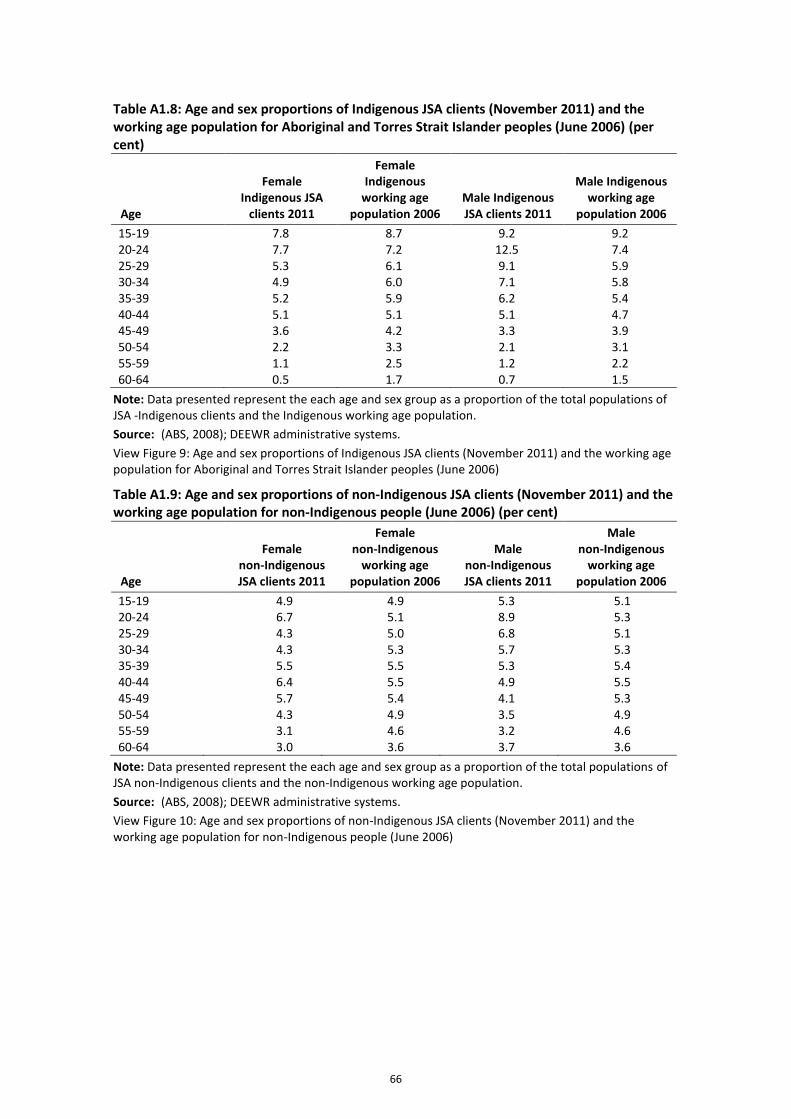
66
Table A1.8: Age and sex proportions of Indigenous JSA clients (November 2011) and the working age population for Aboriginal and Torres Strait Islander peoples (June 2006) (per cent)
Age
Female Indigenous JSA
clients 2011
Female Indigenous
working age population 2006
Male Indigenous JSA clients 2011
Male Indigenous working age
population 2006
15-19 7.8 8.7 9.2 9.2 20-24 7.7 7.2 12.5 7.4 25-29 5.3 6.1 9.1 5.9 30-34 4.9 6.0 7.1 5.8 35-39 5.2 5.9 6.2 5.4 40-44 5.1 5.1 5.1 4.7 45-49 3.6 4.2 3.3 3.9 50-54 2.2 3.3 2.1 3.1 55-59 1.1 2.5 1.2 2.2 60-64 0.5 1.7 0.7 1.5
Note: Data presented represent the each age and sex group as a proportion of the total populations of JSA -Indigenous clients and the Indigenous working age population.
Source: (ABS, 2008); DEEWR administrative systems.
View Figure 9: Age and sex proportions of Indigenous JSA clients (November 2011) and the working age population for Aboriginal and Torres Strait Islander peoples (June 2006)
Table A1.9: Age and sex proportions of non-Indigenous JSA clients (November 2011) and the working age population for non-Indigenous people (June 2006) (per cent)
Age
Female non-Indigenous JSA clients 2011
Female non-Indigenous
working age population 2006
Male non-Indigenous JSA clients 2011
Male non-Indigenous
working age population 2006
15-19 4.9 4.9 5.3 5.1 20-24 6.7 5.1 8.9 5.3 25-29 4.3 5.0 6.8 5.1 30-34 4.3 5.3 5.7 5.3 35-39 5.5 5.5 5.3 5.4 40-44 6.4 5.5 4.9 5.5 45-49 5.7 5.4 4.1 5.3 50-54 4.3 4.9 3.5 4.9 55-59 3.1 4.6 3.2 4.6 60-64 3.0 3.6 3.7 3.6
Note: Data presented represent the each age and sex group as a proportion of the total populations of JSA non-Indigenous clients and the non-Indigenous working age population.
Source: (ABS, 2008); DEEWR administrative systems.
View Figure 10: Age and sex proportions of non-Indigenous JSA clients (November 2011) and the working age population for non-Indigenous people (June 2006)
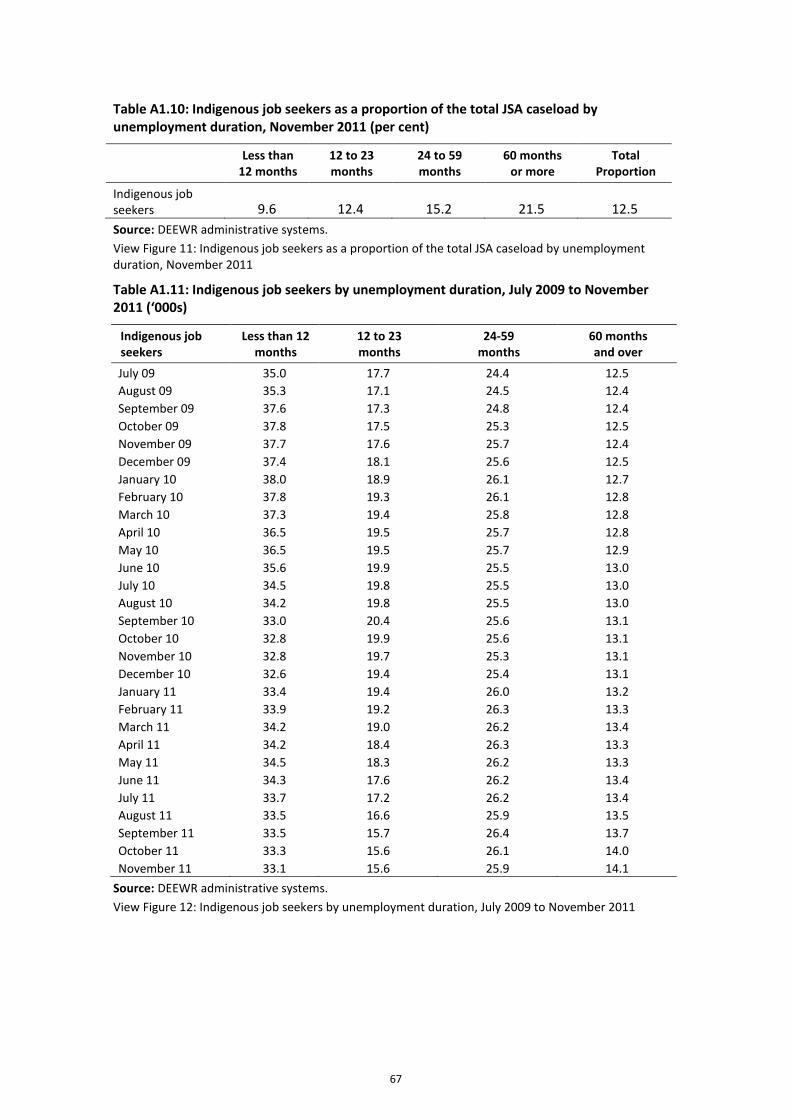
67
Table A1.10: Indigenous job seekers as a proportion of the total JSA caseload by unemployment duration, November 2011 (per cent)
- Less than
12 months 12 to 23 months
24 to 59 months
60 months or more
Total Proportion
Indigenous job seekers 9.6 12.4 15.2 21.5 12.5
Source: DEEWR administrative systems.
View Figure 11: Indigenous job seekers as a proportion of the total JSA caseload by unemployment duration, November 2011
Table A1.11: Indigenous job seekers by unemployment duration, July 2009 to November 2011 (‘000s)
Indigenous job seekers
Less than 12 months
12 to 23 months
24-59 months
60 months and over
July 09 35.0 17.7 24.4 12.5
August 09 35.3 17.1 24.5 12.4
September 09 37.6 17.3 24.8 12.4
October 09 37.8 17.5 25.3 12.5
November 09 37.7 17.6 25.7 12.4
December 09 37.4 18.1 25.6 12.5
January 10 38.0 18.9 26.1 12.7
February 10 37.8 19.3 26.1 12.8
March 10 37.3 19.4 25.8 12.8
April 10 36.5 19.5 25.7 12.8
May 10 36.5 19.5 25.7 12.9
June 10 35.6 19.9 25.5 13.0
July 10 34.5 19.8 25.5 13.0
August 10 34.2 19.8 25.5 13.0
September 10 33.0 20.4 25.6 13.1
October 10 32.8 19.9 25.6 13.1
November 10 32.8 19.7 25.3 13.1
December 10 32.6 19.4 25.4 13.1
January 11 33.4 19.4 26.0 13.2
February 11 33.9 19.2 26.3 13.3
March 11 34.2 19.0 26.2 13.4
April 11 34.2 18.4 26.3 13.3
May 11 34.5 18.3 26.2 13.3
June 11 34.3 17.6 26.2 13.4
July 11 33.7 17.2 26.2 13.4
August 11 33.5 16.6 25.9 13.5
September 11 33.5 15.7 26.4 13.7
October 11 33.3 15.6 26.1 14.0
November 11 33.1 15.6 25.9 14.1
Source: DEEWR administrative systems.
View Figure 12: Indigenous job seekers by unemployment duration, July 2009 to November 2011
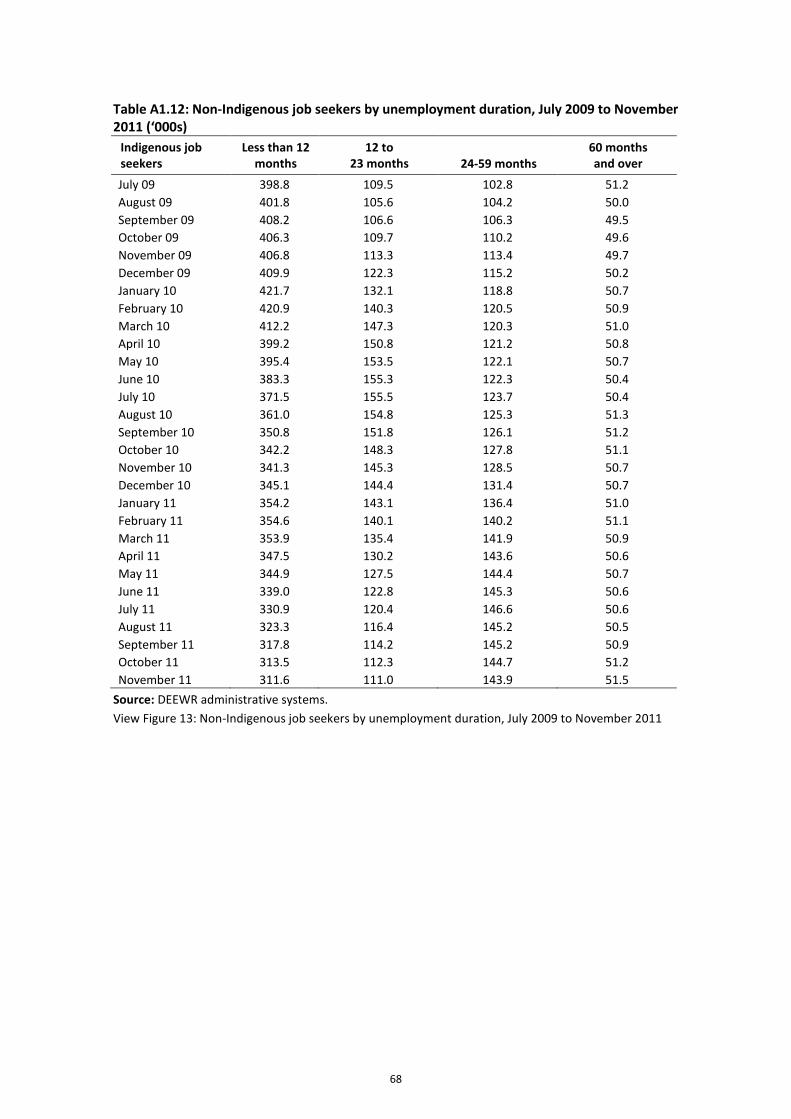
68
Table A1.12: Non-Indigenous job seekers by unemployment duration, July 2009 to November 2011 (‘000s)
Indigenous job seekers
Less than 12 months
12 to 23 months 24-59 months
60 months and over
July 09 398.8 109.5 102.8 51.2
August 09 401.8 105.6 104.2 50.0
September 09 408.2 106.6 106.3 49.5
October 09 406.3 109.7 110.2 49.6
November 09 406.8 113.3 113.4 49.7
December 09 409.9 122.3 115.2 50.2
January 10 421.7 132.1 118.8 50.7
February 10 420.9 140.3 120.5 50.9
March 10 412.2 147.3 120.3 51.0
April 10 399.2 150.8 121.2 50.8
May 10 395.4 153.5 122.1 50.7
June 10 383.3 155.3 122.3 50.4
July 10 371.5 155.5 123.7 50.4
August 10 361.0 154.8 125.3 51.3
September 10 350.8 151.8 126.1 51.2
October 10 342.2 148.3 127.8 51.1
November 10 341.3 145.3 128.5 50.7
December 10 345.1 144.4 131.4 50.7
January 11 354.2 143.1 136.4 51.0
February 11 354.6 140.1 140.2 51.1
March 11 353.9 135.4 141.9 50.9
April 11 347.5 130.2 143.6 50.6
May 11 344.9 127.5 144.4 50.7
June 11 339.0 122.8 145.3 50.6
July 11 330.9 120.4 146.6 50.6
August 11 323.3 116.4 145.2 50.5
September 11 317.8 114.2 145.2 50.9
October 11 313.5 112.3 144.7 51.2
November 11 311.6 111.0 143.9 51.5
Source: DEEWR administrative systems.
View Figure 13: Non-Indigenous job seekers by unemployment duration, July 2009 to November 2011
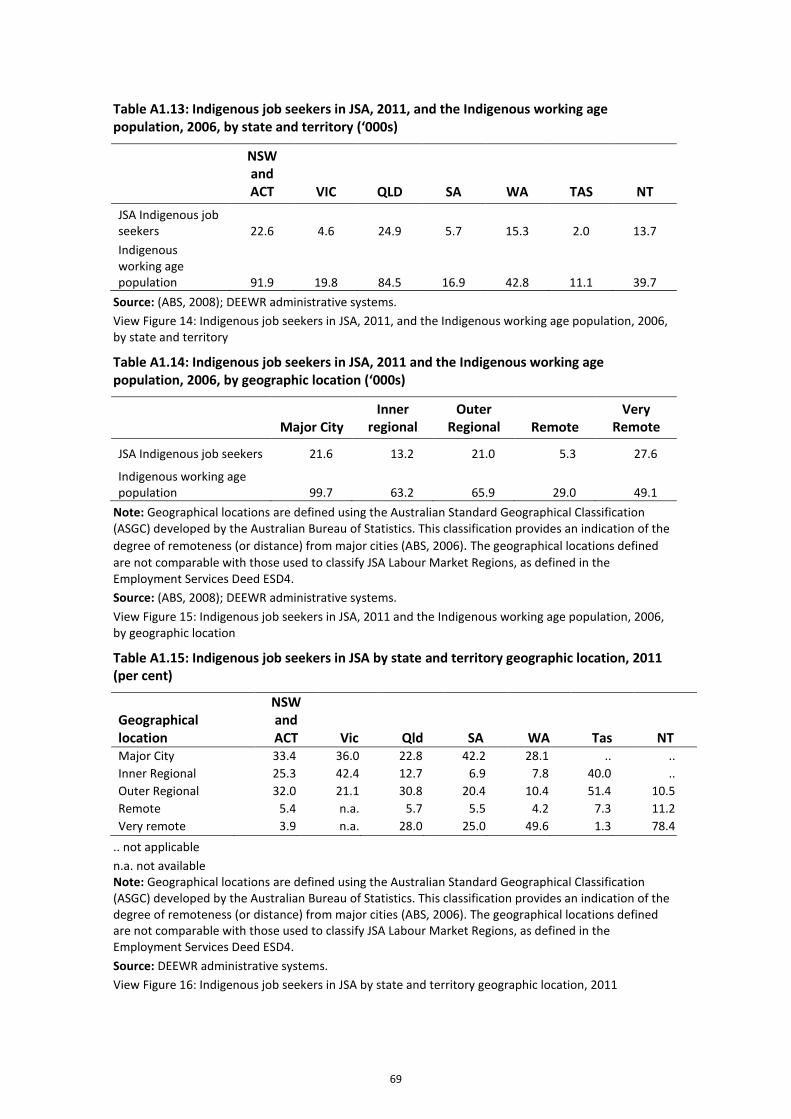
69
Table A1.13: Indigenous job seekers in JSA, 2011, and the Indigenous working age population, 2006, by state and territory (‘000s)
NSW and ACT VIC QLD SA WA TAS NT
JSA Indigenous job seekers 22.6 4.6 24.9 5.7 15.3 2.0 13.7
Indigenous working age population 91.9 19.8 84.5 16.9 42.8 11.1 39.7
Source: (ABS, 2008); DEEWR administrative systems.
View Figure 14: Indigenous job seekers in JSA, 2011, and the Indigenous working age population, 2006, by state and territory
Table A1.14: Indigenous job seekers in JSA, 2011 and the Indigenous working age population, 2006, by geographic location (‘000s)
- Major City Inner
regional Outer
Regional Remote Very
Remote
JSA Indigenous job seekers 21.6 13.2 21.0 5.3 27.6
Indigenous working age population 99.7 63.2 65.9 29.0 49.1
Note: Geographical locations are defined using the Australian Standard Geographical Classification (ASGC) developed by the Australian Bureau of Statistics. This classification provides an indication of the
degree of remoteness (or distance) from major cities (ABS, 2006). The geographical locations defined
are not comparable with those used to classify JSA Labour Market Regions, as defined in the Employment Services Deed ESD4.
Source: (ABS, 2008); DEEWR administrative systems.
View Figure 15: Indigenous job seekers in JSA, 2011 and the Indigenous working age population, 2006, by geographic location
Table A1.15: Indigenous job seekers in JSA by state and territory geographic location, 2011 (per cent)
Geographical location
NSW and ACT Vic Qld SA WA Tas NT
Major City 33.4 36.0 22.8 42.2 28.1 .. ..
Inner Regional 25.3 42.4 12.7 6.9 7.8 40.0 ..
Outer Regional 32.0 21.1 30.8 20.4 10.4 51.4 10.5
Remote 5.4 n.a. 5.7 5.5 4.2 7.3 11.2
Very remote 3.9 n.a. 28.0 25.0 49.6 1.3 78.4
.. not applicable
n.a. not available Note: Geographical locations are defined using the Australian Standard Geographical Classification (ASGC) developed by the Australian Bureau of Statistics. This classification provides an indication of the degree of remoteness (or distance) from major cities (ABS, 2006). The geographical locations defined are not comparable with those used to classify JSA Labour Market Regions, as defined in the Employment Services Deed ESD4.
Source: DEEWR administrative systems.
View Figure 16: Indigenous job seekers in JSA by state and territory geographic location, 2011
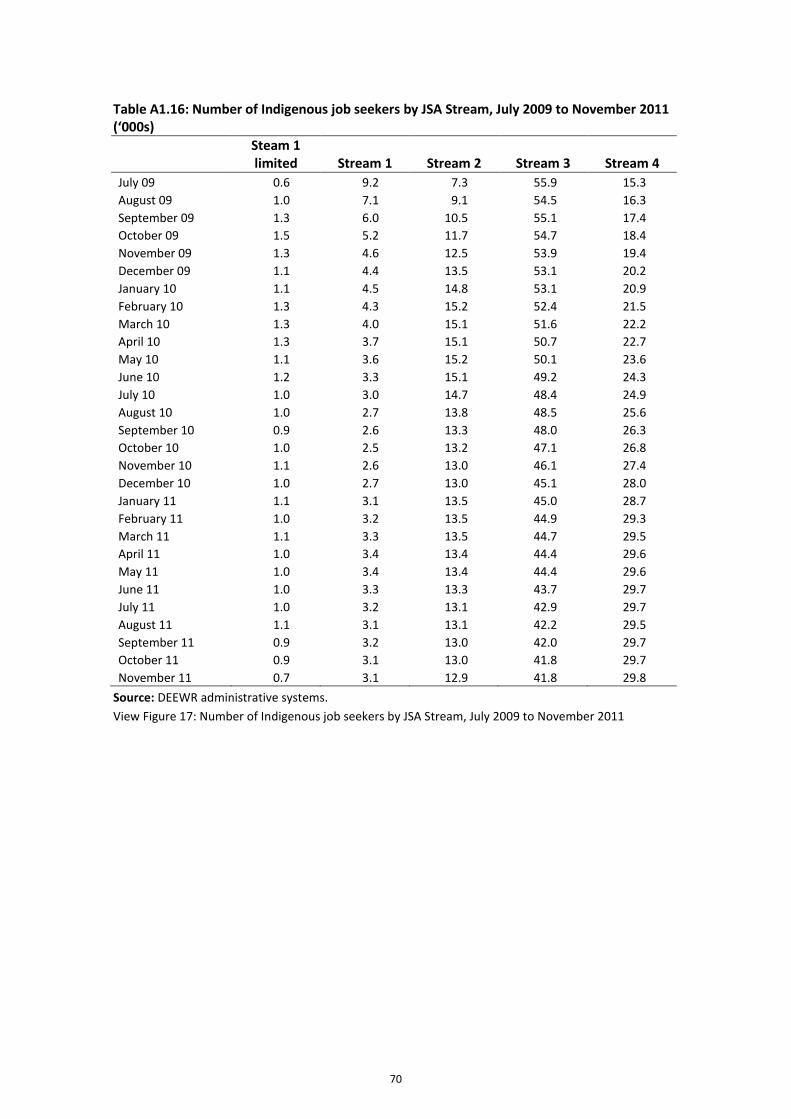
70
Table A1.16: Number of Indigenous job seekers by JSA Stream, July 2009 to November 2011 (‘000s)
- Steam 1 limited Stream 1 Stream 2 Stream 3 Stream 4
July 09 0.6 9.2 7.3 55.9 15.3
August 09 1.0 7.1 9.1 54.5 16.3
September 09 1.3 6.0 10.5 55.1 17.4
October 09 1.5 5.2 11.7 54.7 18.4
November 09 1.3 4.6 12.5 53.9 19.4
December 09 1.1 4.4 13.5 53.1 20.2
January 10 1.1 4.5 14.8 53.1 20.9
February 10 1.3 4.3 15.2 52.4 21.5
March 10 1.3 4.0 15.1 51.6 22.2
April 10 1.3 3.7 15.1 50.7 22.7
May 10 1.1 3.6 15.2 50.1 23.6
June 10 1.2 3.3 15.1 49.2 24.3
July 10 1.0 3.0 14.7 48.4 24.9
August 10 1.0 2.7 13.8 48.5 25.6
September 10 0.9 2.6 13.3 48.0 26.3
October 10 1.0 2.5 13.2 47.1 26.8
November 10 1.1 2.6 13.0 46.1 27.4
December 10 1.0 2.7 13.0 45.1 28.0
January 11 1.1 3.1 13.5 45.0 28.7
February 11 1.0 3.2 13.5 44.9 29.3
March 11 1.1 3.3 13.5 44.7 29.5
April 11 1.0 3.4 13.4 44.4 29.6
May 11 1.0 3.4 13.4 44.4 29.6
June 11 1.0 3.3 13.3 43.7 29.7
July 11 1.0 3.2 13.1 42.9 29.7
August 11 1.1 3.1 13.1 42.2 29.5
September 11 0.9 3.2 13.0 42.0 29.7
October 11 0.9 3.1 13.0 41.8 29.7
November 11 0.7 3.1 12.9 41.8 29.8
Source: DEEWR administrative systems.
View Figure 17: Number of Indigenous job seekers by JSA Stream, July 2009 to November 2011
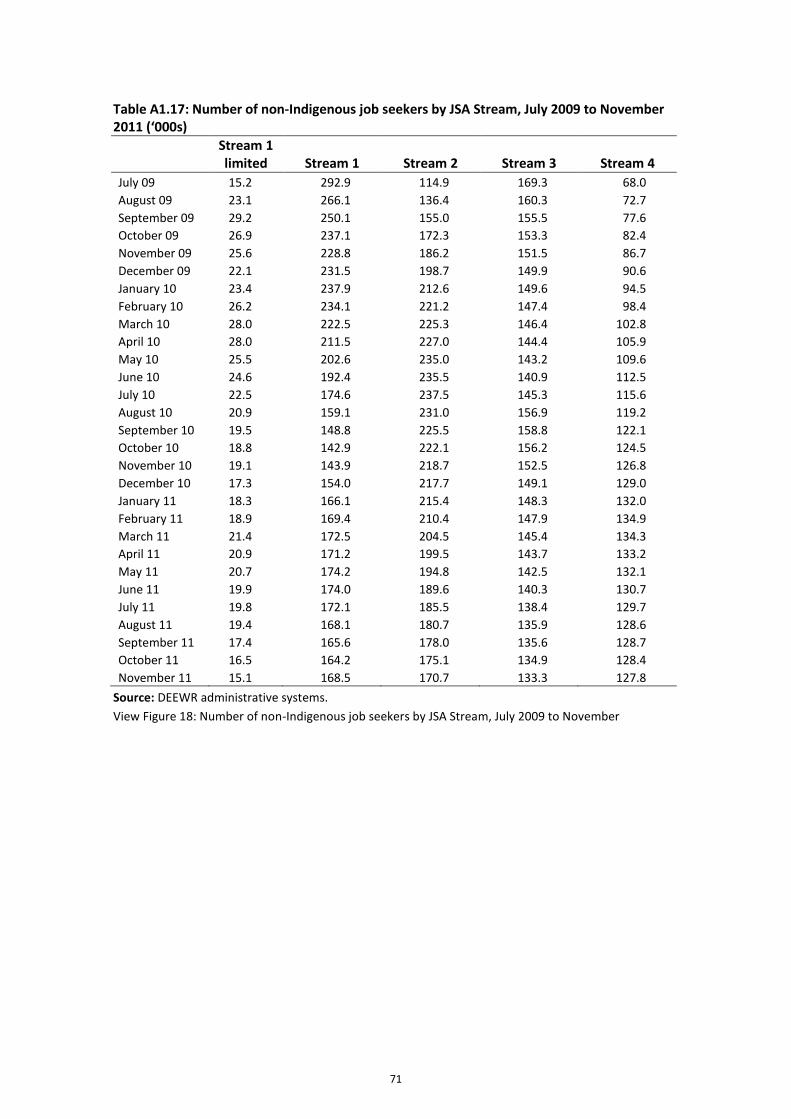
71
Table A1.17: Number of non-Indigenous job seekers by JSA Stream, July 2009 to November 2011 (‘000s)
- Stream 1 limited Stream 1 Stream 2 Stream 3 Stream 4
July 09 15.2 292.9 114.9 169.3 68.0
August 09 23.1 266.1 136.4 160.3 72.7
September 09 29.2 250.1 155.0 155.5 77.6
October 09 26.9 237.1 172.3 153.3 82.4
November 09 25.6 228.8 186.2 151.5 86.7
December 09 22.1 231.5 198.7 149.9 90.6
January 10 23.4 237.9 212.6 149.6 94.5
February 10 26.2 234.1 221.2 147.4 98.4
March 10 28.0 222.5 225.3 146.4 102.8
April 10 28.0 211.5 227.0 144.4 105.9
May 10 25.5 202.6 235.0 143.2 109.6
June 10 24.6 192.4 235.5 140.9 112.5
July 10 22.5 174.6 237.5 145.3 115.6
August 10 20.9 159.1 231.0 156.9 119.2
September 10 19.5 148.8 225.5 158.8 122.1
October 10 18.8 142.9 222.1 156.2 124.5
November 10 19.1 143.9 218.7 152.5 126.8
December 10 17.3 154.0 217.7 149.1 129.0
January 11 18.3 166.1 215.4 148.3 132.0
February 11 18.9 169.4 210.4 147.9 134.9
March 11 21.4 172.5 204.5 145.4 134.3
April 11 20.9 171.2 199.5 143.7 133.2
May 11 20.7 174.2 194.8 142.5 132.1
June 11 19.9 174.0 189.6 140.3 130.7
July 11 19.8 172.1 185.5 138.4 129.7
August 11 19.4 168.1 180.7 135.9 128.6
September 11 17.4 165.6 178.0 135.6 128.7
October 11 16.5 164.2 175.1 134.9 128.4
November 11 15.1 168.5 170.7 133.3 127.8
Source: DEEWR administrative systems.
View Figure 18: Number of non-Indigenous job seekers by JSA Stream, July 2009 to November
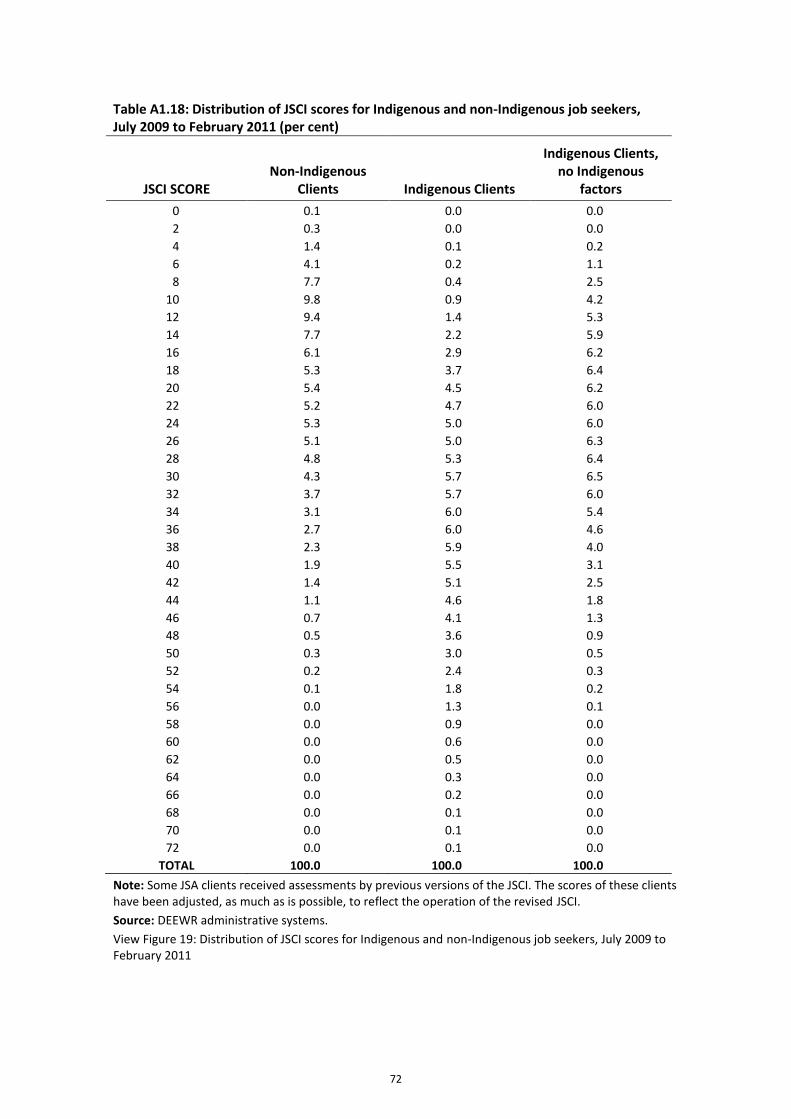
72
Table A1.18: Distribution of JSCI scores for Indigenous and non-Indigenous job seekers, July 2009 to February 2011 (per cent)
JSCI SCORE Non-Indigenous
Clients Indigenous Clients
Indigenous Clients, no Indigenous
factors
0 0.1 0.0 0.0
2 0.3 0.0 0.0
4 1.4 0.1 0.2
6 4.1 0.2 1.1
8 7.7 0.4 2.5
10 9.8 0.9 4.2
12 9.4 1.4 5.3
14 7.7 2.2 5.9
16 6.1 2.9 6.2
18 5.3 3.7 6.4
20 5.4 4.5 6.2
22 5.2 4.7 6.0
24 5.3 5.0 6.0
26 5.1 5.0 6.3
28 4.8 5.3 6.4
30 4.3 5.7 6.5
32 3.7 5.7 6.0
34 3.1 6.0 5.4
36 2.7 6.0 4.6
38 2.3 5.9 4.0
40 1.9 5.5 3.1
42 1.4 5.1 2.5
44 1.1 4.6 1.8
46 0.7 4.1 1.3
48 0.5 3.6 0.9
50 0.3 3.0 0.5
52 0.2 2.4 0.3
54 0.1 1.8 0.2
56 0.0 1.3 0.1
58 0.0 0.9 0.0
60 0.0 0.6 0.0
62 0.0 0.5 0.0
64 0.0 0.3 0.0
66 0.0 0.2 0.0
68 0.0 0.1 0.0
70 0.0 0.1 0.0
72 0.0 0.1 0.0
TOTAL 100.0 100.0 100.0
Note: Some JSA clients received assessments by previous versions of the JSCI. The scores of these clients have been adjusted, as much as is possible, to reflect the operation of the revised JSCI.
Source: DEEWR administrative systems.
View Figure 19: Distribution of JSCI scores for Indigenous and non-Indigenous job seekers, July 2009 to February 2011
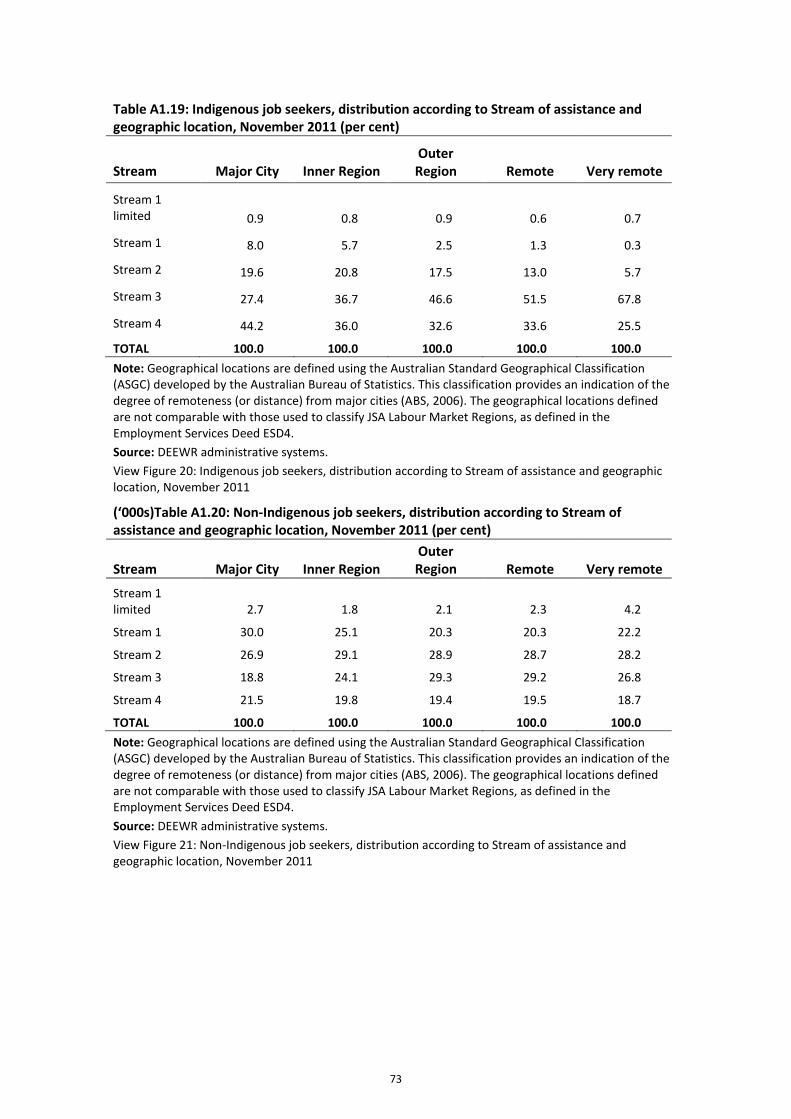
73
Table A1.19: Indigenous job seekers, distribution according to Stream of assistance and geographic location, November 2011 (per cent)
Stream Major City Inner Region Outer Region Remote Very remote
Stream 1 limited 0.9 0.8 0.9 0.6 0.7
Stream 1 8.0 5.7 2.5 1.3 0.3
Stream 2 19.6 20.8 17.5 13.0 5.7
Stream 3 27.4 36.7 46.6 51.5 67.8
Stream 4 44.2 36.0 32.6 33.6 25.5
TOTAL 100.0 100.0 100.0 100.0 100.0
Note: Geographical locations are defined using the Australian Standard Geographical Classification (ASGC) developed by the Australian Bureau of Statistics. This classification provides an indication of the degree of remoteness (or distance) from major cities (ABS, 2006). The geographical locations defined are not comparable with those used to classify JSA Labour Market Regions, as defined in the Employment Services Deed ESD4.
Source: DEEWR administrative systems.
View Figure 20: Indigenous job seekers, distribution according to Stream of assistance and geographic location, November 2011
(‘000s)Table A1.20: Non-Indigenous job seekers, distribution according to Stream of assistance and geographic location, November 2011 (per cent)
Stream Major City Inner Region Outer Region Remote Very remote
Stream 1 limited 2.7 1.8 2.1 2.3 4.2
Stream 1 30.0 25.1 20.3 20.3 22.2
Stream 2 26.9 29.1 28.9 28.7 28.2
Stream 3 18.8 24.1 29.3 29.2 26.8
Stream 4 21.5 19.8 19.4 19.5 18.7
TOTAL 100.0 100.0 100.0 100.0 100.0
Note: Geographical locations are defined using the Australian Standard Geographical Classification (ASGC) developed by the Australian Bureau of Statistics. This classification provides an indication of the degree of remoteness (or distance) from major cities (ABS, 2006). The geographical locations defined are not comparable with those used to classify JSA Labour Market Regions, as defined in the Employment Services Deed ESD4.
Source: DEEWR administrative systems.
View Figure 21: Non-Indigenous job seekers, distribution according to Stream of assistance and geographic location, November 2011
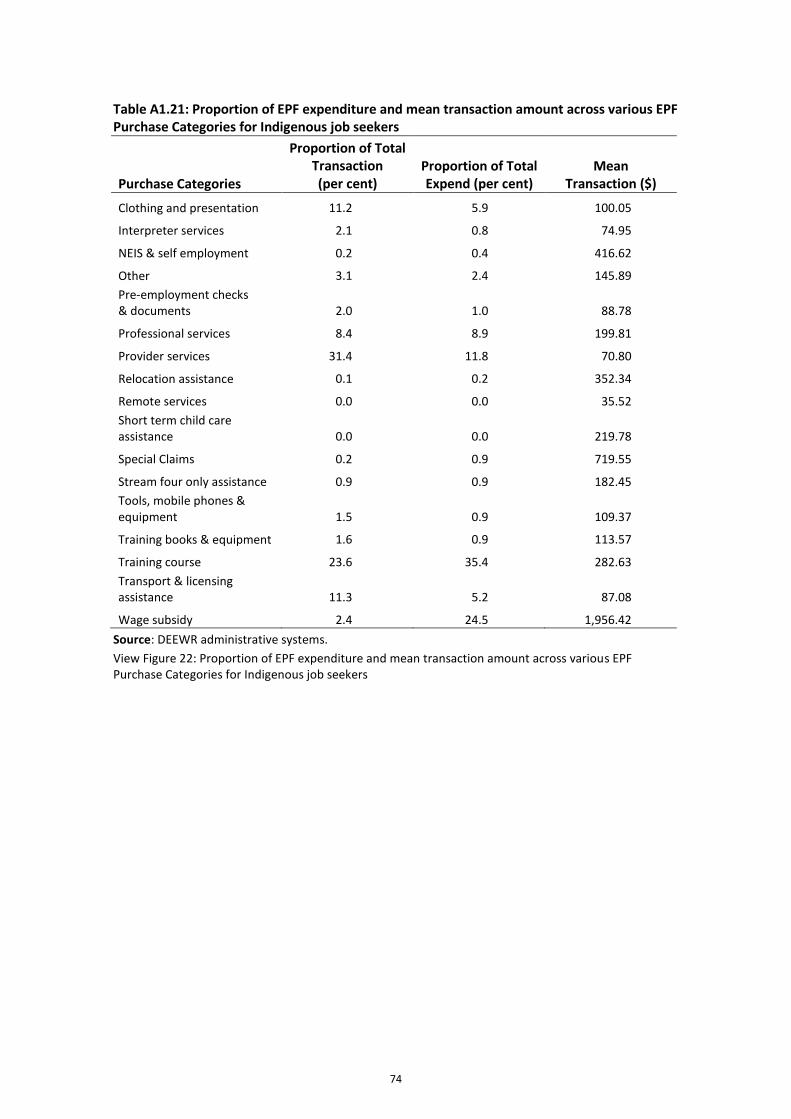
74
Table A1.21: Proportion of EPF expenditure and mean transaction amount across various EPF Purchase Categories for Indigenous job seekers
Purchase Categories
Proportion of Total Transaction (per cent)
Proportion of Total Expend (per cent)
Mean Transaction ($)
Clothing and presentation 11.2 5.9 100.05
Interpreter services 2.1 0.8 74.95
NEIS & self employment 0.2 0.4 416.62
Other 3.1 2.4 145.89
Pre-employment checks & documents 2.0 1.0 88.78
Professional services 8.4 8.9 199.81
Provider services 31.4 11.8 70.80
Relocation assistance 0.1 0.2 352.34
Remote services 0.0 0.0 35.52
Short term child care assistance 0.0 0.0 219.78
Special Claims 0.2 0.9 719.55
Stream four only assistance 0.9 0.9 182.45
Tools, mobile phones & equipment 1.5 0.9 109.37
Training books & equipment 1.6 0.9 113.57
Training course 23.6 35.4 282.63
Transport & licensing assistance 11.3 5.2 87.08
Wage subsidy 2.4 24.5 1,956.42
Source: DEEWR administrative systems.
View Figure 22: Proportion of EPF expenditure and mean transaction amount across various EPF Purchase Categories for Indigenous job seekers
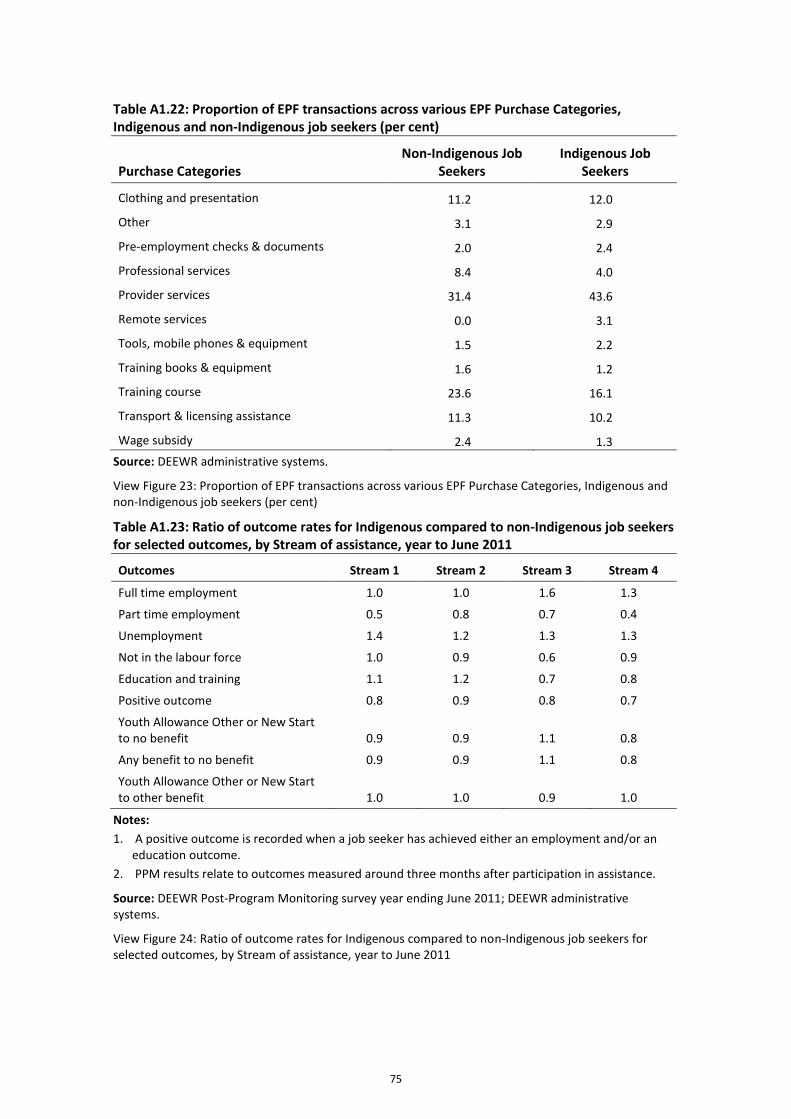
75
Table A1.22: Proportion of EPF transactions across various EPF Purchase Categories, Indigenous and non-Indigenous job seekers (per cent)
Purchase Categories Non-Indigenous Job
Seekers Indigenous Job
Seekers
Clothing and presentation 11.2 12.0
Other 3.1 2.9
Pre-employment checks & documents 2.0 2.4
Professional services 8.4 4.0
Provider services 31.4 43.6
Remote services 0.0 3.1
Tools, mobile phones & equipment 1.5 2.2
Training books & equipment 1.6 1.2
Training course 23.6 16.1
Transport & licensing assistance 11.3 10.2
Wage subsidy 2.4 1.3
Source: DEEWR administrative systems.
View Figure 23: Proportion of EPF transactions across various EPF Purchase Categories, Indigenous and non-Indigenous job seekers (per cent)
Table A1.23: Ratio of outcome rates for Indigenous compared to non-Indigenous job seekers for selected outcomes, by Stream of assistance, year to June 2011
Outcomes Stream 1 Stream 2 Stream 3 Stream 4
Full time employment 1.0 1.0 1.6 1.3
Part time employment 0.5 0.8 0.7 0.4
Unemployment 1.4 1.2 1.3 1.3
Not in the labour force 1.0 0.9 0.6 0.9
Education and training 1.1 1.2 0.7 0.8
Positive outcome 0.8 0.9 0.8 0.7
Youth Allowance Other or New Start to no benefit 0.9 0.9 1.1 0.8
Any benefit to no benefit 0.9 0.9 1.1 0.8
Youth Allowance Other or New Start to other benefit 1.0 1.0 0.9 1.0
Notes:
1. A positive outcome is recorded when a job seeker has achieved either an employment and/or an education outcome.
2. PPM results relate to outcomes measured around three months after participation in assistance.
Source: DEEWR Post-Program Monitoring survey year ending June 2011; DEEWR administrative systems.
View Figure 24: Ratio of outcome rates for Indigenous compared to non-Indigenous job seekers for selected outcomes, by Stream of assistance, year to June 2011
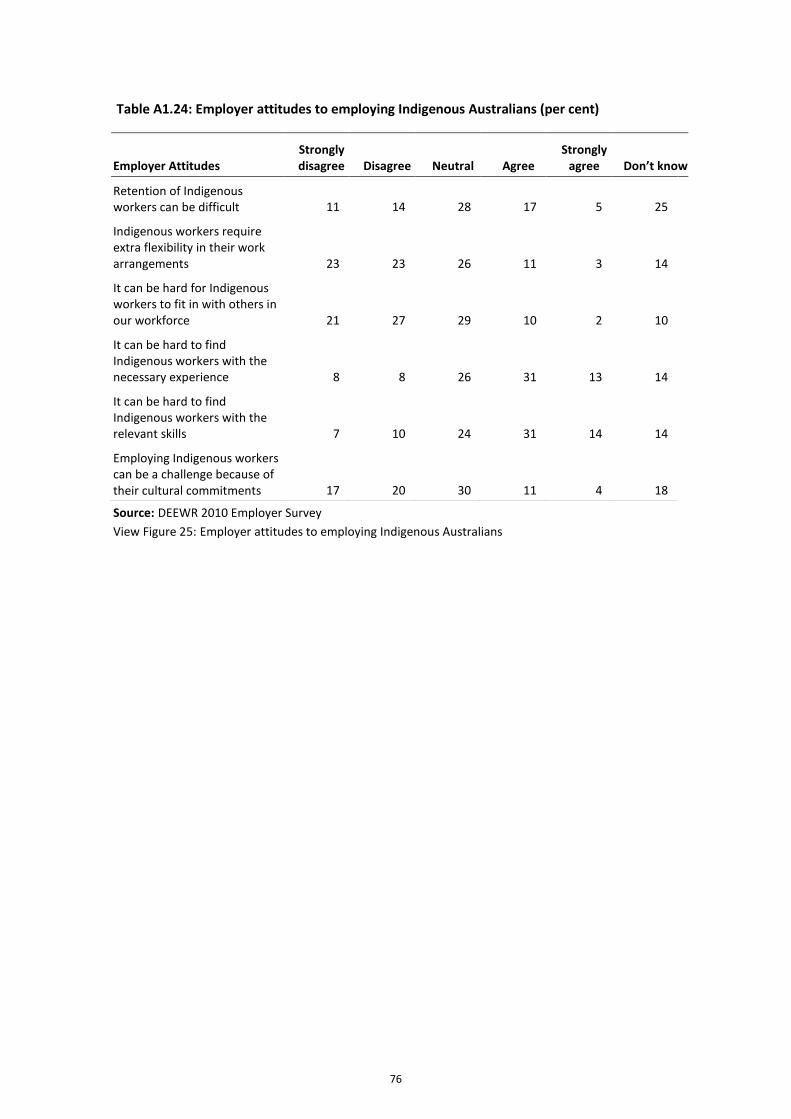
76
Table A1.24: Employer attitudes to employing Indigenous Australians (per cent)
Source: DEEWR 2010 Employer Survey
View Figure 25: Employer attitudes to employing Indigenous Australians
Employer Attitudes Strongly disagree Disagree Neutral Agree
Strongly agree Don’t know
Retention of Indigenous workers can be difficult 11 14 28 17 5 25
Indigenous workers require extra flexibility in their work arrangements 23 23 26 11 3 14
It can be hard for Indigenous workers to fit in with others in our workforce 21 27 29 10 2 10
It can be hard to find Indigenous workers with the necessary experience 8 8 26 31 13 14
It can be hard to find Indigenous workers with the relevant skills 7 10 24 31 14 14
Employing Indigenous workers can be a challenge because of their cultural commitments 17 20 30 11 4 18
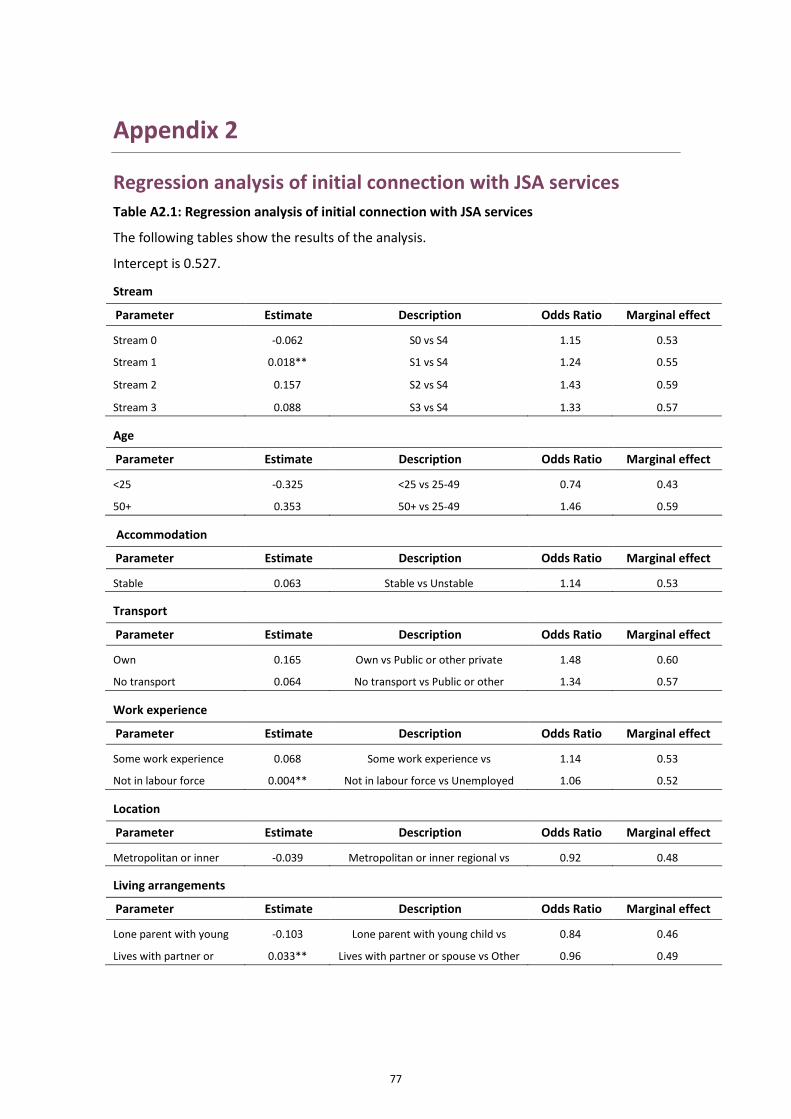
77
Appendix 2
Regression analysis of initial connection with JSA services
Table A2.1: Regression analysis of initial connection with JSA services
The following tables show the results of the analysis.
Intercept is 0.527.
Stream
Parameter Estimate Description Odds Ratio Marginal effect
Stream 0 -0.062 S0 vs S4 1.15 0.53
Stream 1 0.018** S1 vs S4 1.24 0.55
Stream 2 0.157 S2 vs S4 1.43 0.59
Stream 3 0.088 S3 vs S4 1.33 0.57
Age
Parameter Estimate Description Odds Ratio Marginal effect
<25 -0.325 <25 vs 25-49 0.74 0.43
50+ 0.353 50+ vs 25-49 1.46 0.59
Accommodation
Parameter Estimate Description Odds Ratio Marginal effect
Stable 0.063 Stable vs Unstable 1.14 0.53
Transport
Parameter Estimate Description Odds Ratio Marginal effect
Own 0.165 Own vs Public or other private 1.48 0.60
No transport 0.064 No transport vs Public or other
private
1.34 0.57
Work experience
Parameter Estimate Description Odds Ratio Marginal effect
Some work experience 0.068 Some work experience vs
Unemployed
1.14 0.53
Not in labour force 0.004** Not in labour force vs Unemployed 1.06 0.52
Location
Parameter Estimate Description Odds Ratio Marginal effect
Metropolitan or inner
regional
-0.039 Metropolitan or inner regional vs
outer, remote or very remote
0.92 0.48
Living arrangements
Parameter Estimate Description Odds Ratio Marginal effect
Lone parent with young
child
-0.103 Lone parent with young child vs
Other
0.84 0.46
Lives with partner or
spouse
0.033** Lives with partner or spouse vs Other 0.96 0.49
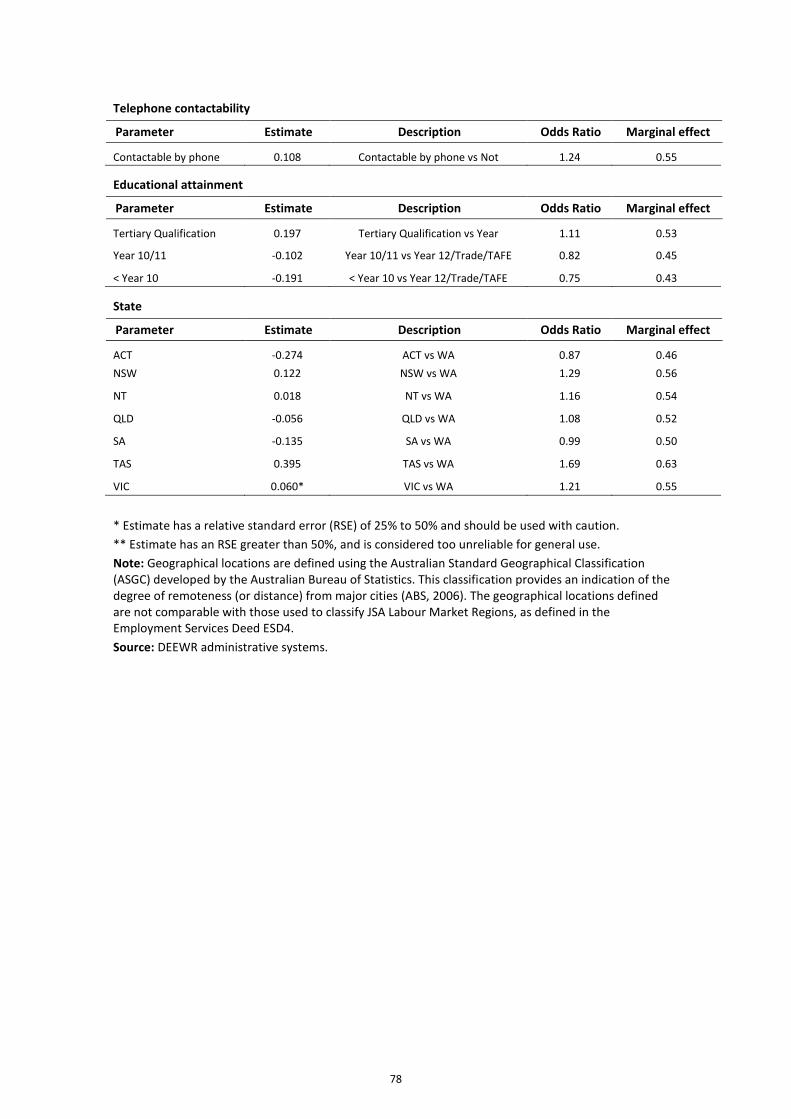
78
Telephone contactability
Parameter Estimate Description Odds Ratio Marginal effect
Contactable by phone 0.108 Contactable by phone vs Not
contactable by phone
1.24 0.55
Educational attainment
Parameter Estimate Description Odds Ratio Marginal effect
Tertiary Qualification 0.197 Tertiary Qualification vs Year
12/Trade/TAFE
1.11 0.53
Year 10/11 -0.102 Year 10/11 vs Year 12/Trade/TAFE 0.82 0.45
< Year 10 -0.191 < Year 10 vs Year 12/Trade/TAFE 0.75 0.43
State
Parameter Estimate Description Odds Ratio Marginal effect
ACT -0.274 ACT vs WA 0.87 0.46
NSW 0.122 NSW vs WA 1.29 0.56
NT 0.018 NT vs WA 1.16 0.54
QLD -0.056 QLD vs WA 1.08 0.52
SA -0.135 SA vs WA 0.99 0.50
TAS 0.395 TAS vs WA 1.69 0.63
VIC 0.060* VIC vs WA 1.21 0.55
* Estimate has a relative standard error (RSE) of 25% to 50% and should be used with caution.
** Estimate has an RSE greater than 50%, and is considered too unreliable for general use.
Note: Geographical locations are defined using the Australian Standard Geographical Classification (ASGC) developed by the Australian Bureau of Statistics. This classification provides an indication of the degree of remoteness (or distance) from major cities (ABS, 2006). The geographical locations defined are not comparable with those used to classify JSA Labour Market Regions, as defined in the Employment Services Deed ESD4.
Source: DEEWR administrative systems.
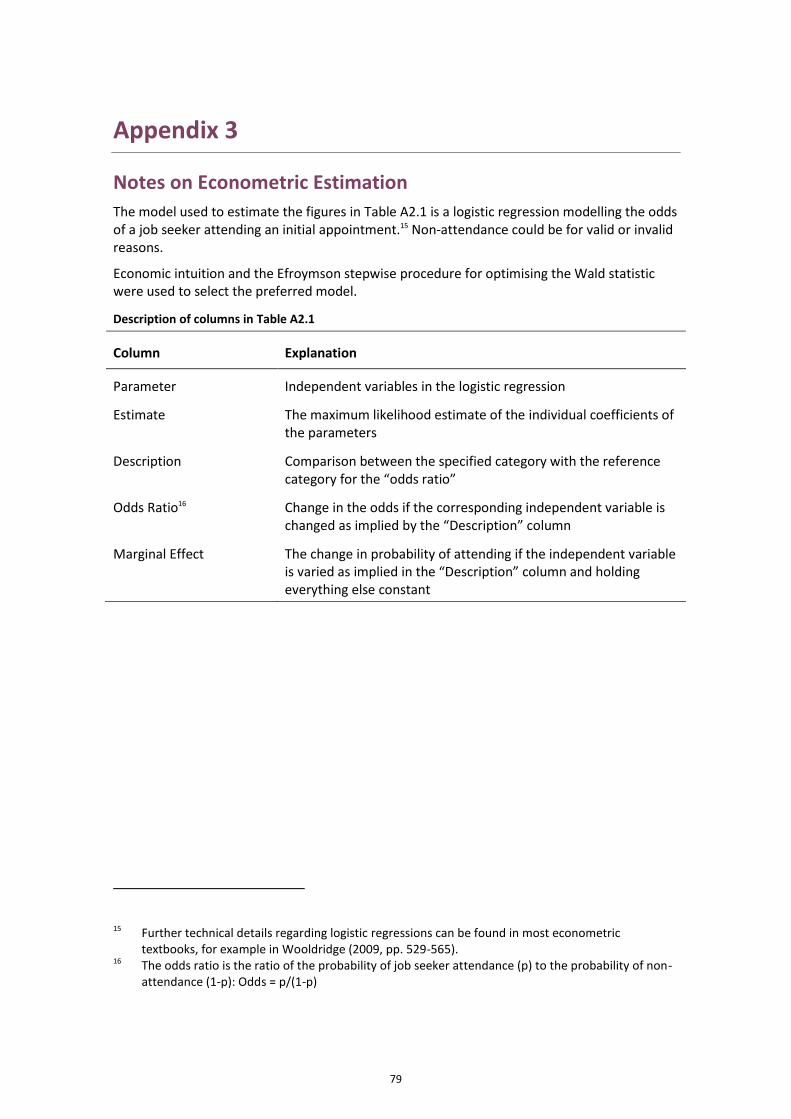
79
Appendix 3
Notes on Econometric Estimation
The model used to estimate the figures in Table A2.1 is a logistic regression modelling the odds of a job seeker attending an initial appointment.15 Non-attendance could be for valid or invalid reasons.
Economic intuition and the Efroymson stepwise procedure for optimising the Wald statistic were used to select the preferred model.
Description of columns in Table A2.1
Column Explanation
Parameter Independent variables in the logistic regression
Estimate The maximum likelihood estimate of the individual coefficients of the parameters
Description Comparison between the specified category with the reference category for the “odds ratio”
Odds Ratio16 Change in the odds if the corresponding independent variable is changed as implied by the “Description” column
Marginal Effect The change in probability of attending if the independent variable is varied as implied in the “Description” column and holding everything else constant
15 Further technical details regarding logistic regressions can be found in most econometric
textbooks, for example in Wooldridge (2009, pp. 529-565).
16 The odds ratio is the ratio of the probability of job seeker attendance (p) to the probability of non-attendance (1-p): Odds = p/(1-p)
80
References
ABS 2006. Statistical Geography Volume 1, Australian Standard Geographical Classification (ASGC). Canberra: Australian Bureau of Statistics (ABS). Cat. No. 1216.0.
ABS 2008. Experimental estimates of Aboriginal and Torres Strait Islander Australians, June 2006. Canberra: Australian Bureau of Statistics (ABS). Cat. No. 3238.0.055.001.
ABS 2009. Experimental Estimates and Projections, Aboriginal and Torres Strait Islander Australians 1991 to 2021. Canberra: Australian Bureau of Statistics (ABS). Cat. No. 3238.0.
ABS 2010. Population by Age and Sex, Australian States and Territories, June 2010. Canberra: Australian Bureau of Statistics (ABS). Cat. No. 3201.0.
ABS 2011. Labour Force Characteristics of Aboriginal and Torres Strait Islander Australians, Estimates from the Labour Force Survey, 2010. Canberra: Australian Bureau of Statistics (ABS). Cat. No. 6287.0.
AIHW 2011. THe Health and Welfare of Australia's Aboriginal and Torres Strait Islander People: an overview. Canberra: Australian Institute of Health and Welfare (AIHW).
Biddle, N. & Taylor, J. 2009. Indigenous Population Projections, 2006-31: Planning for Growth. Working Paper No.56/2009. Canberra: Centre for Aboriginal Economic Policy Research (CAEPR).
COAG Reform Council 2011. National Indigenous Reform Agreement: Performance report for 2009-10. Sydney: COAG Reform Council.
DEEWR 2007. Active Participation Model Evaluation July 2003-June 2006. Canberra: Department of Education, Employment and Workplace Relations (DEEWR).
DEEWR 2008. The Future of Employment Services in Australia: A Discussion Paper. Canberra: Department of Education, Employment and Workplace Relations (DEEWR).
DEEWR 2009a. Evaluation Strategy for Job Services Australia: 2009 to 2012. Canberra: Department of Education, Employment and Workplace Relations (DEEWR).
DEEWR 2009b. Department of Education, Employment and Workplace Relations Employment Services Deed, 2009-2012. Canberra: Department of Education, Employment and Workplace Relations (DEEWR).
DEEWR 2009c. Review of the Job Seeker Classification Instrument. Canberra: Department of Education, Employment and Workplace Relations (DEEWR).
DEEWR 2011a. Indigenous Employment Program 2009-12: Program Guidelines. Canberra. Department of Education, Employment and Workplace Relations (DEEWR).
DEEWR. 2011b. Employment Services Procurement: New Employment Services [Online]. Canberra: Department of Education, Employment and Workplace Relations (DEEWR) which is
available at the Department of Employment, Education and Workplace Relations website.
DEEWR 2011c. Labour Market and Related Payments: A monthly profile: December 2010. Department of Education, Employment and Workplace Relations (DEEWR).
81
DEEWR 2011d. The Impact of the Global Economic Downturn on Job Services Australia, July 2009 - January 2010. Canberra: Department of Education, Employment and Workplace Relations (DEEWR).
DEEWR 2011e. Survey of Employment Service Providers, 2010. Canberra: Department of Education, Employment and Workplace Relations (DEEWR).
FAHCSIA 2010. Closing the Gap - Prime Minister's Report 2010. Canberra: Department of Families, Housing, Community Services and Indigenous Affairs (FAHCSIA).