Embed Size (px)
Citation preview

SERVICE QUALITY IN ACADEMIC LIBRARIES: AN ANALYSIS OF LibQUAL+™
SCORES AND INSTITUTIONAL CHARACTERISTICS
by
KATHLEEN F. MILLER
B.A. State University of New York at Albany, 1979
M.L.S. State University of New York at Albany, 1981
A dissertation submitted in partial fulfillment of the requirements
for the Degree of Doctor of Education
in the Department of Educational Research, Technology, and Leadership
in the College of Education
at the University of Central Florida
Orlando, Florida
Spring Term
2008
Major Professor: William Bozeman

ii
© 2008 Kathleen F. Miller
iii
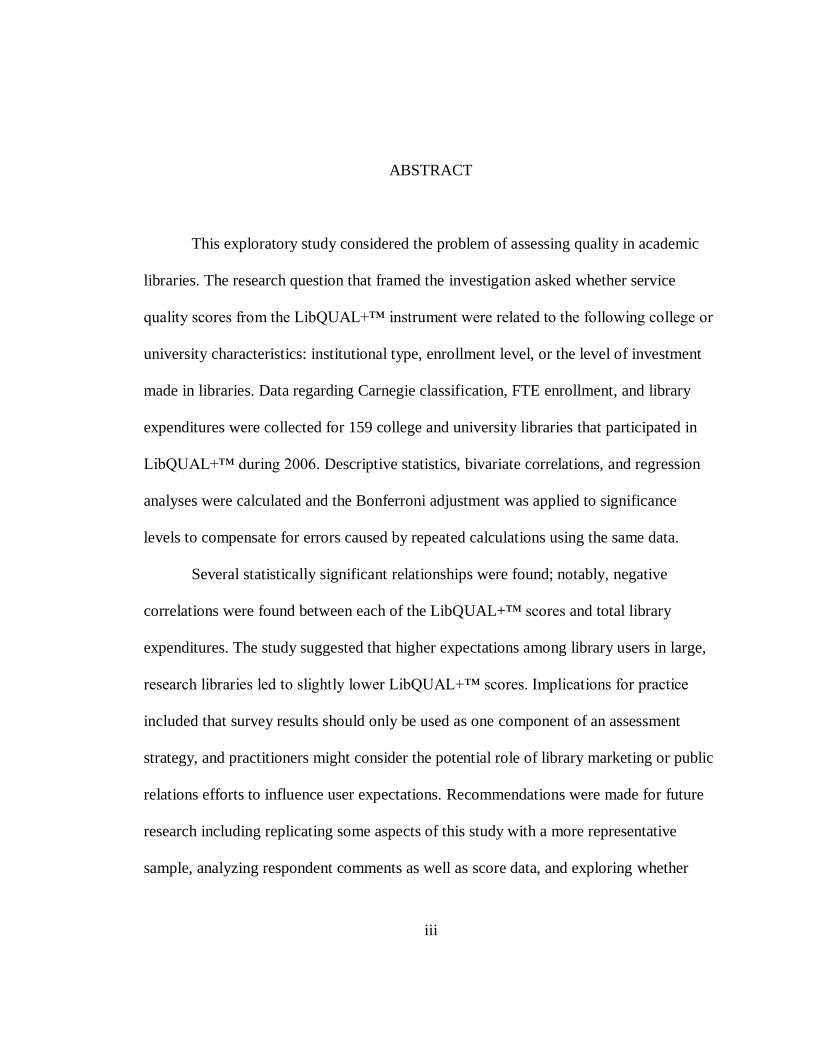
ABSTRACT
This exploratory study considered the problem of assessing quality in academic
libraries. The research question that framed the investigation asked whether service
quality scores from the LibQUAL+™ instrument were related to the following college or
university characteristics: institutional type, enrollment level, or the level of investment
made in libraries. Data regarding Carnegie classification, FTE enrollment, and library
expenditures were collected for 159 college and university libraries that participated in
LibQUAL+™ during 2006. Descriptive statistics, bivariate correlations, and regression
analyses were calculated and the Bonferroni adjustment was applied to significance
levels to compensate for errors caused by repeated calculations using the same data.
Several statistically significant relationships were found; notably, negative
correlations were found between each of the LibQUAL+™ scores and total library
expenditures. The study suggested that higher expectations among library users in large,
research libraries led to slightly lower LibQUAL+™ scores. Implications for practice
included that survey results should only be used as one component of an assessment
strategy, and practitioners might consider the potential role of library marketing or public
relations efforts to influence user expectations. Recommendations were made for future
research including replicating some aspects of this study with a more representative
sample, analyzing respondent comments as well as score data, and exploring whether

iv
there are reliable differences in results for different types of institutions or among groups
of respondents (students and faculty, or faculty by discipline).

v
To my parents, with love and gratitude

vi
ACKNOWLEDGMENTS
No dissertation is successfully completed without the assistance, patience, and
support of instructors, advisors, and colleagues. I am particularly grateful to Dr. William
Bozeman, who graciously stepped in as my advisor to supervise the final months of my
work at UCF and the preparation of this dissertation. I also wish to express my gratitude
to the members of my dissertation committee: Mr. Barry Baker, Dr. George Pawlas, and
Dr. Levester Tubbs. Each of them has generously offered his time, expertise,
encouragement, and advice to me throughout this project. Finally, I am indebted to Dr.
Jess House, for his advice and encouragement throughout my doctoral studies and for
helping me shape some vague ideas about library service quality into a successful
research proposal.

vii
TABLE OF CONTENTS
LIST OF FIGURES ........................................................................................................ ix LIST OF TABLES .......................................................................................................... x
CHAPTER ONE: INTRODUCTION .............................................................................. 1 Background .......................................................................................................... 1
Customer Satisfaction and Service Quality ........................................................... 3 Measuring Library Quality ................................................................................... 6
LibQUAL+™ ...................................................................................................... 8 Research Questions ............................................................................................ 12
Methodology ...................................................................................................... 15 Significance of the Study ................................................................................... 18
Summary ........................................................................................................... 19 CHAPTER TWO: REVIEW OF THE LITERATURE ................................................... 21
Customer Satisfaction and Service Quality ......................................................... 21 The Service-Based Economy.............................................................................. 23
SERVQUAL ...................................................................................................... 26 Library Quality Assessment ............................................................................... 29
LibQUAL+™ .................................................................................................... 32 Acting on LibQUAL+™ Data ............................................................................ 36
Validity and Reliability ...................................................................................... 39 Conceptual Framework ...................................................................................... 41
Significance of the Study ................................................................................... 42 Summary ........................................................................................................... 43
CHAPTER THREE: METHODOLOGY ....................................................................... 44 Definitions ......................................................................................................... 44
Variables ............................................................................................................ 45 Sample and Population ....................................................................................... 45
Limitations and Delimitations ............................................................................ 49 Data Acquisition ................................................................................................ 50
Statistical Analysis ............................................................................................. 51 Summary ........................................................................................................... 52
CHAPTER FOUR: DATA ANALYSIS ........................................................................ 53 Problem and Approach ....................................................................................... 53
Purpose and Design of the Study ........................................................................ 56 Methodology ...................................................................................................... 57
Results ............................................................................................................... 58 Summary ........................................................................................................... 77
CHAPTER FIVE: CONCLUSIONS AND DISCUSSION OF FINDINGS .................... 79 Statement of the Problem ................................................................................... 79

viii
Research Questions ............................................................................................ 82 Methodology ...................................................................................................... 83
Summary of Findings ......................................................................................... 85 Conclusions, Implications, and Recommendations ............................................. 89
Summary ........................................................................................................... 96 APPENDIX A: LibQUAL+ TM SURVEY INSTRUMENT ......................................... 98
APPENDIX B: SCATTERPLOTS: CORRELATIONS OF LIBQUAL+ TM SCORES
AND LIBRARY EXPENDITURES …………………………………………………...101
LIST OF REFERENCES ............................................................................................. 106

ix
LIST OF FIGURES
1. Expectancy Disconfirmation Theory .......................................................................... 23
2. LibQUAL+TM
Service Quality Assessment Factors .................................................... 42
3. Information Control Dimension Scores and Carnegie Basic Classification ................. 66 4. Library as Place Dimension Scores and Library Expenditures .................................... 70
B1. Service Affect Dimension and Total Library Expenditures .................................... 102
B2. Information Control Dimension Scores and Total Library Expenditures ................ 103
B3. Library as Place Dimension Scores and Total Library Expenditures ...................... 104
B4. Overall Scores and Total Library Expenditures ..................................................... 105
x
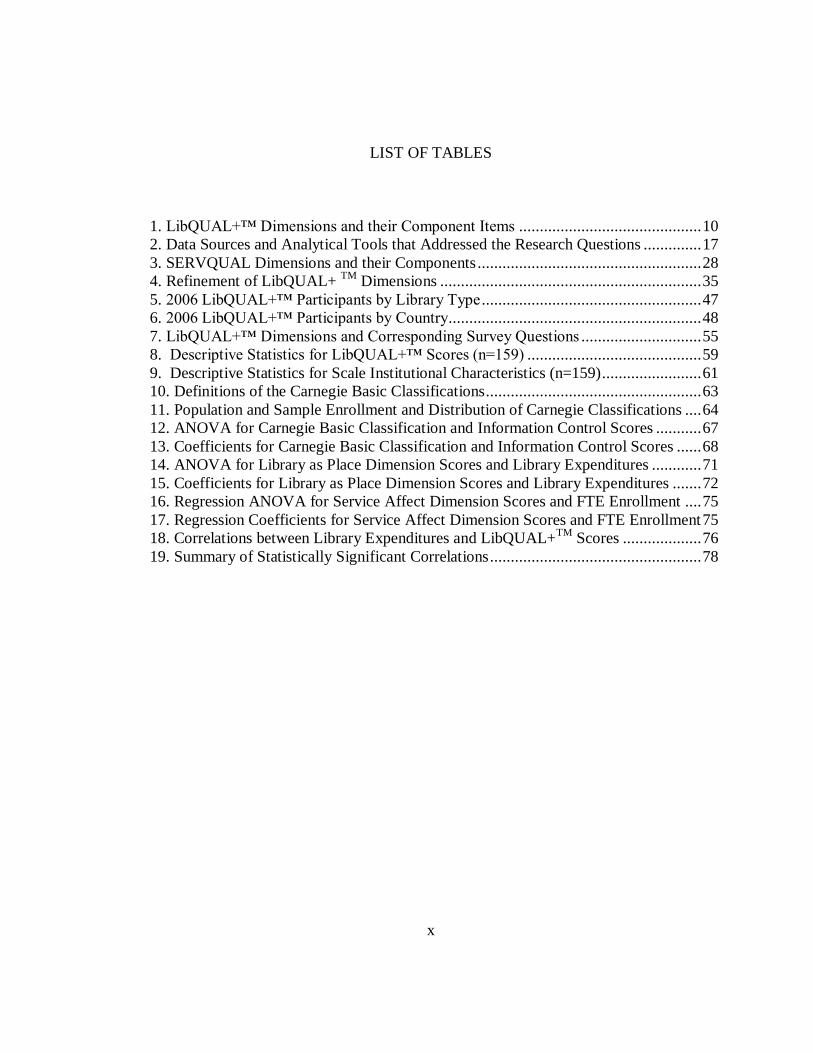
LIST OF TABLES
1. LibQUAL+™ Dimensions and their Component Items ............................................ 10
2. Data Sources and Analytical Tools that Addressed the Research Questions .............. 17
3. SERVQUAL Dimensions and their Components ...................................................... 28
4. Refinement of LibQUAL+ TM
Dimensions ............................................................... 35
5. 2006 LibQUAL+™ Participants by Library Type ..................................................... 47
6. 2006 LibQUAL+™ Participants by Country............................................................. 48
7. LibQUAL+™ Dimensions and Corresponding Survey Questions ............................. 55
8. Descriptive Statistics for LibQUAL+™ Scores (n=159) .......................................... 59
9. Descriptive Statistics for Scale Institutional Characteristics (n=159) ........................ 61
10. Definitions of the Carnegie Basic Classifications .................................................... 63
11. Population and Sample Enrollment and Distribution of Carnegie Classifications .... 64
12. ANOVA for Carnegie Basic Classification and Information Control Scores ........... 67
13. Coefficients for Carnegie Basic Classification and Information Control Scores ...... 68
14. ANOVA for Library as Place Dimension Scores and Library Expenditures ............ 71
15. Coefficients for Library as Place Dimension Scores and Library Expenditures ....... 72
16. Regression ANOVA for Service Affect Dimension Scores and FTE Enrollment .... 75
17. Regression Coefficients for Service Affect Dimension Scores and FTE Enrollment 75
18. Correlations between Library Expenditures and LibQUAL+TM
Scores ................... 76
19. Summary of Statistically Significant Correlations ................................................... 78

1
CHAPTER ONE: INTRODUCTION
This dissertation is a report of an exploratory study of service quality scores
obtained in 159 college and university libraries, and the relationships of those scores with
the following characteristics: institutional type, institutional size, or the level of
investment made in libraries. This first chapter will introduce the background of the
study, identify the problems that the research questions were intended to address,
describe the study‘s methodology, and outline its professional significance.
Background
Libraries exist to collect the record of human experience and to provide
intellectual and physical access to that record. For academic libraries in particular, there
is a responsibility to preserve scholarly communications as well as the primary resources
upon which scholarship often depends. During the past two decades, myriad challenges
and opportunities for libraries have been presented as a result of the rapid development
and deployment of information technologies. This environment has spurred librarians to
reconsider and redefine collections, services, organizational structure, the skill sets
required of library staff, and the attributes of library facilities. A task force of the
University of California Libraries recognized this state of change in libraries.
The continuing proliferation of formats, tools, services, and technologies has
upended how we arrange, retrieve, and present our holdings. Our users expect

2
simplicity and immediate reward and Amazon, Google, and iTunes are the
standards against which we are judged (University of California Libraries, 2005,
p. 7).
Library decision makers must therefore determine how to meet new and evolving
expectations for library services and materials. Clearly, libraries are operating from vastly
different assumptions about the ways in which they might best carry out their
responsibilities than they did a few, short years ago.
While library practice is changing, it remains based in a commitment to service.
Collections of books and other information resources without accompanying access tools,
instruction, or other library services are mere warehouses, not libraries. Librarians in all
types of libraries work to ensure that their organizations provide high quality service in
support of the goals of the library‘s parent institution. It would be rare indeed to discover
an academic library, for example, that did not consider service quality an important
aspect of carrying out its mission to support teaching, learning, and research in the
college or university in which it operates. But how do library administrators know
whether their libraries are meeting the new expectations of users or providing high
quality service?

3
Customer Satisfaction and Service Quality
In the for-profit sector, customer satisfaction measurement and management has
long been a common practice, and contemporary service quality assessment has its roots
in customer satisfaction measurement. During the past 40 years, the concept of customer
satisfaction has changed a number of times. From the corporate image studies of the
1960s to the total quality approach in Western economies in the late 1980s (which had
been embraced in Japan more than 40 years earlier), several approaches to customer
satisfaction led to the contemporary conceptual model of service quality (Crosby, 1993,
p. 389-392).
The first phase of customer satisfaction measurement took the form of corporate
image studies in the 1960s. Customer satisfaction and perception of quality were often
included indirectly in image surveys as questions about company characteristics such as
progressiveness or involvement in the community. The second phase saw the birth of
product quality studies beginning in the late 1960s. The primary measurement was the
adequacy–importance model that created an index of satisfaction to explain customer
attitudes. The index was created by ―summing (across attributes) measures of satisfaction
with product performance multiplied by measures of feature importance‖ (Crosby, 1993,
p. 390).
Beginning in the 1970s, a new phase was evidenced by some early customer
satisfaction studies that were implemented in regulated industries, notably by AT&T.

4
Without market-based performance indicators, monopolies sought to justify rate increases
by garnering favorable customer satisfaction measures. The 1980s marked the next major
evolution in thinking about customer satisfaction. The increased competition in the
American automobile market from foreign companies gave rise to syndicated automotive
studies, such as the J. D. Powers & Associates studies (Crosby, 1993, p. 391).
The current focus of customer satisfaction measurement can be traced most
directly to the 1980s, when the total quality movement captured the attention of
businesses in Western economies and businesses recognized the need for a model that
addressed the fundamental shift to a service-based, rather than product-based, economy.
There was no longer a specific, tangible product to assess, and businesses turned to
customer perceptions of whether their expectations were being met or exceeded (Crosby,
1993, p. 392).
The Gaps Model of Service Quality
The marketing research group of Parasuraman, Zeithaml, and Berry (1985)
developed an approach to customer satisfaction measurement in the 1980s called the
Gaps Model of Service Quality. The Gaps Model assessed customer satisfaction by
identifying the differences, or gaps, between customer expectations and customer
perceptions of service (Parasuraman et al., 1985; Parasuraman, Berry, & Zeithaml, 1991).
In this model, customer expectations are established by the customer, who defines the

5
minimum acceptable and the desired levels of service. The customer then describes his or
her perception of the level of service he or she received and the gap is thereby defined by
the difference between perceived level of service and desired level of service.
Hernon and Nitecki (2001) noted that service quality definitions vary across the
literature and are based on four underlying perspectives.
1. Excellence, which is often externally defined.
2. Value, which incorporates multiple attributes and is focused on benefit to the
recipient.
3. Conformance to specifications, which enables precise measurement, but
customers may not know or care about internal specifications.
4. Meeting or exceeding expectations, which is all-encompassing and applies to
all service industries (p. 690).
Most marketing and library science researchers, however, have focused on the
fourth perspective (Hernon & Nitecki, 2001), and the Gaps Model of Service Quality
uses that perspective as a framework to identify the gaps created when performance
either exceeds or falls short of meeting customer expectations. In fact, the Gaps Model
expands the fourth perspective to five, with the addition of ―gaps that may hinder an
organization from providing high quality service‖ (Hernon, 2002, p. 225).
In the Gaps Model customer expectations are viewed as subjective and based on
the extent to which customers believe a particular attribute is essential for an excellent
service provider. Customer perceptions are judgments about service performance.

6
Furthermore, expectations are not viewed as static; they are expected to change and
evolve over time. Hernon (2002) wrote that
the confirmation/disconfirmation process, which influences the Gaps Model,
suggests that expectations provide a frame of reference against which customers‘
experiences can be measured . . . customers form their expectations prior to
purchasing or using a product or service. These expectations become a basis
against which to compare actual performance (p. 225).
The measurement of service quality using the Gaps Model, therefore, focuses on
the interaction between customers and service providers and the difference, or gap,
between expectations about service provision and perceptions about how the service was
actually provided (Parasuraman et al., 1985; Parasuraman et al., 1991). The difference
between the minimum acceptable and the perceived levels of service is the adequacy
gap; larger adequacy gaps indicate better performance. The difference between the
desired and perceived levels of service is the superiority gap; ideally, these scores would
be identical so a perfect score is zero. As the superiority gap score gets further from
zero, either positive or negative, it indicates poorer performance.
Measuring Library Quality
The recent emphasis on assessment in higher education has affected every facet of
post-secondary institutions. Administrators in college and university libraries are no
exception; they need assessment tools that provide data for continuous improvement,

7
documentation of assessment, and evidence of the thoughtful use of assessment data for
accreditation organizations.
The traditional measure of academic library quality has been collection size. In
fact, many institutions still organize special events to commemorate the acquisition of a
library‘s millionth volume. Rather than providing a census of its collections, however, the
Middle States Commission on Higher Education now requires the institution to
demonstrate the ―availability and accessibility of adequate learning resources, such as
library and information technology support services, staffed by professionals who are
qualified by education, training, and experience to support relevant academic activities
(―Characteristics of excellence,‖ 2006, p. 43). Colleges and universities are therefore
required to determine adequacy without prescriptive measures such as volume counts or
numbers of professional staff. The other regional associations have similarly broad
statements, leaving librarians and institutional effectiveness staff to figure out a new
approach (Gratch-Lindauer, 2002, p. 15). This shift in the assessment of libraries has
been described as a ―move beyond the rearview mirror approach‖ (Crowe, 2003, ¶ 5) of
simply reporting what libraries acquired or how many users walked through the front
gates in a given year.
This emphasis on assessment for accountability has motivated librarians to seek
out more meaningful measures of quality. Rather than focusing solely on inputs such as
collection size or staffing level, the first new library measures were output measures that
sought to describe what libraries produced with their inputs. That is, in the 1990s
8
librarians began to report outputs such as the number of items borrowed or the number of
reference questions answered (Kyrillidou, 2002, pp. 43-44). Those measures alone,
however, still fell short of addressing whether library services were sufficient. As
colleges and universities created student learning outcomes beginning in the late 1990s,
librarians also created measures that were based on outcomes, or the extent to which
student and faculty contact with libraries affected them and contributed to the mission of
the university (Hernon, 2002; Kyrillidou, 2002). New instruments and protocols,
however, were needed for libraries to meet demands for accountability, measure service
quality, and generate data for effective library management.
LibQUAL+™
Service-based industries in the private sector began using an instrument called
SERVQUAL for assessing customer perceptions of service quality in the 1980s.
SERVQUAL was developed by Parasuraman et al. (1985) and grounded in their Gaps
Model of Service Quality. In 1995, 1997, and 1999, the Texas A&M University
Libraries, seeking a useful model for assessment, used a modified SERVQUAL
instrument. Their experience revealed the need for an adapted tool that would use the
Gaps Theory underlying SERVQUAL and better address the particular requirements of
libraries (Thompson, 2007). In 1999 the Association of Research Libraries (ARL)
partnered with Texas A&M University to develop, test, and refine the adapted

9
instrument. As a result of their collaboration, LibQUAL+™ was ―initiated in 2000 as an
experimental project for benchmarking perceptions of library service quality across 13
libraries‖ (Kyrillidou, 2006, p. 4). During 2006 the LibQUAL+™ survey was
administered in 298 institutions.
This study analyzed data collected from the two administrations of LibQUAL+™
during 2006. A description of the instrument will facilitate an understanding of the
investigation. With each administration, the LibQUAL+™ instrument was improved and
it is currently composed of 22 questions and a comment box (see the complete instrument
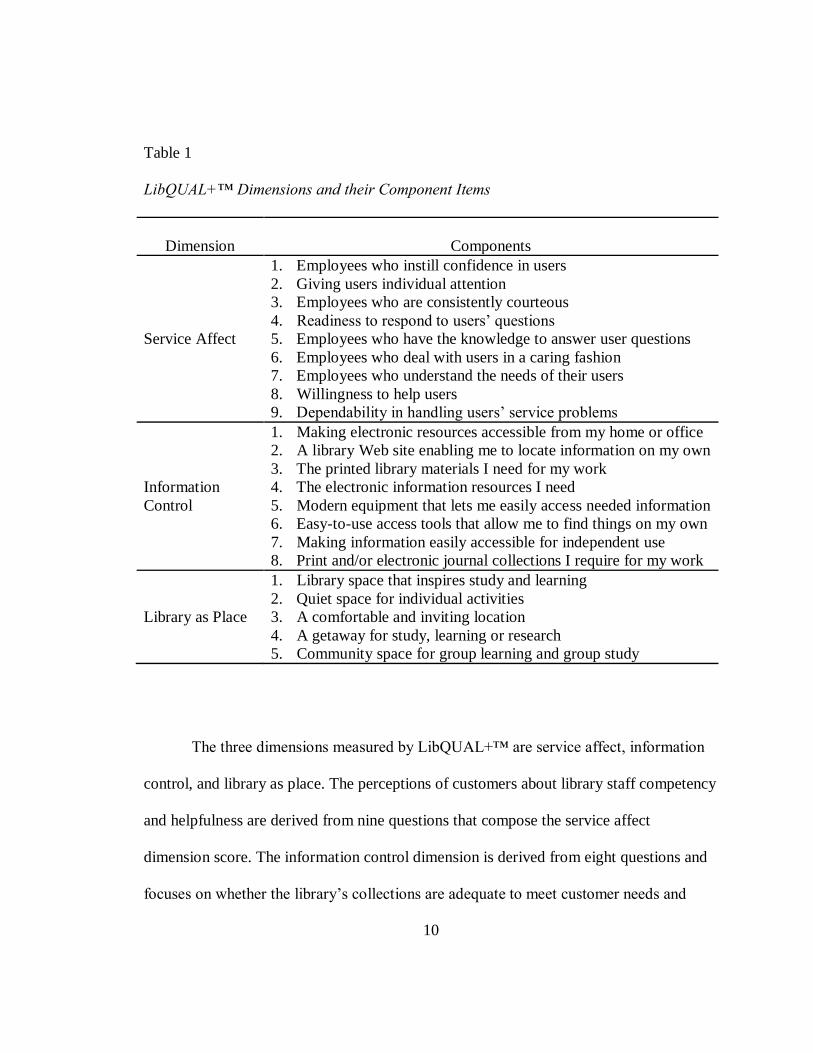
in Appendix A). As shown in Table 1, the results for each library include three dimension
scores derived from responses to the 22 questions. There is also an overall, weighted
score.
10
Table 1
LibQUAL+™ Dimensions and their Component Items
Dimension
Components
Service Affect
1. Employees who instill confidence in users
2. Giving users individual attention
3. Employees who are consistently courteous
4. Readiness to respond to users‘ questions
5. Employees who have the knowledge to answer user questions
6. Employees who deal with users in a caring fashion
7. Employees who understand the needs of their users
8. Willingness to help users
9. Dependability in handling users‘ service problems
Information
Control
1. Making electronic resources accessible from my home or office
2. A library Web site enabling me to locate information on my own
3. The printed library materials I need for my work
4. The electronic information resources I need
5. Modern equipment that lets me easily access needed information
6. Easy-to-use access tools that allow me to find things on my own
7. Making information easily accessible for independent use
8. Print and/or electronic journal collections I require for my work
Library as Place
1. Library space that inspires study and learning
2. Quiet space for individual activities
3. A comfortable and inviting location
4. A getaway for study, learning or research
5. Community space for group learning and group study
The three dimensions measured by LibQUAL+™ are service affect, information
control, and library as place. The perceptions of customers about library staff competency
and helpfulness are derived from nine questions that compose the service affect
dimension score. The information control dimension is derived from eight questions and
focuses on whether the library‘s collections are adequate to meet customer needs and

11
whether the collections are organized in a manner that enables self-reliance for library
users. Finally, the library as place dimension is derived from five questions that address
user perceptions regarding the facility‘s functionality and adequacy for academic
activities. All of the scores are scaled from 1 to 9 with 9 being the highest rating, so that
scores can be compared (Thompson, Cook, & Kyrillidou, 2006b).
Reliability and Validity
A number of studies have examined the LibQUAL+™ instrument for score
reliability (Cook, Heath, Thompson, & Thompson, 2001a; Cook, Heath, Thompson, &
Thompson, 2001b; Thompson, Cook, & Thompson, 2002) and validity (Thompson,
Cook, & Kyrillidou, 2006a). In a key study by Heath, Cook, Kyrillidou, and Thompson
(2002), validity coefficients replicated closely across different types of post-secondary
libraries, leading them to conclude that ―LibQUAL+™ scores may be valid in reasonably
diverse library settings” [italics original] (p. 38). This study explored that conclusion as
it relates to institutional size, institutional type, and level of investment by the institution
in its library.
Since 2000 LibQUAL+™ has been administered in every state except Alaska and
South Dakota (M. Davis, personal communication, May 16, 2007), and
12
. . . in various language variations in Canada, Australia, Egypt, England, France,
Ireland, Scotland, Sweden, the Netherlands, and the United Arab Emirates. The
2005 cycle saw administration in several South African universities. And the
summer of 2005 brought training in Greece (Thompson, Cook, & Kyrillidou,
2005, p. 517).
The instrument has consistently tested as psychometrically valid and the protocol has ―a
universality that crosses language and cultural boundaries at the settings where
LibQUAL+™ has been implemented to date‖ (Thompson et al., 2005, p. 517).
Research Questions
In this section, the research questions that framed the investigation are
enumerated and the underlying assumptions are explained. For this exploratory study of
2006 LibQUAL+™ scores, the overarching research question was whether, and to what
extent, LibQUAL+™ scores were related to the following college or university
characteristics: institutional type, institutional size, or the level of investment made in
libraries. Institutional type was represented by Carnegie basic classification, institutional
size was represented by 12-month FTE enrollment, and investment in libraries was
represented by annual library expenditures. An analysis of LibQUAL+™ scores and
these institutional characteristics was performed with data from 159 American colleges or
universities that participated in the 2006 administration of LibQUAL+™.
LibQUAL+™ results include scores for minimum, perceived, and desired levels
of service for each of the 22 items included in the survey. The scores are combined to

13
produce an adequacy gap and superiority gap for each question and for each of the three
dimensions. The adequacy gap is the difference between the minimum and perceived
scores, and the superiority gap is the difference between the desired and perceived scores.
Large adequacy gap scores indicate that respondents perceive services to exceed their
minimum expectations. A large superiority gap score, however, may indicate the library
is expending resources to provide a level of service beyond the level that its users desire.
In addition, superiority gap scores below zero indicate the library is not meeting its
customers‘ desired service level.
The following questions were designed to result in data that addressed the
research question.
1. What were the 2006 LibQUAL+™ scores for American college and
university libraries?
The central tendency of the LibQUAL+™ data, in terms of means and confidence
intervals, and shape of the distribution, or normality of kurtosis and skewness, was
anticipated to indicate that the sample was representative of the population.
2. What were the characteristics of the American college and university
libraries that administered LibQUAL+™ in 2006?
A description of the independent variables at the sample institutions was
anticipated to indicate a normal distribution and central tendency for data regarding
Carnegie classifications, enrollment, and library expenditures.

14
3. To what extent, if any, were scores for the information control dimension
related to institutional type as expressed by the Carnegie basic classification?
Libraries in research universities, unlike their counterparts in primarily
undergraduate institutions, are intended to support significant graduate programs and
research activity. In such libraries students and faculty will find rich, well-organized
collections. In contrast, libraries that support solely undergraduate work have collections
that support the curriculum but are not likely to have the resources required to support
faculty research. Information control dimension scores, therefore, were anticipated to be
related to institutional type.
4. To what extent, if any, are scores for the library as place dimension related to
library expenditures per FTE student?
Since building, maintaining, and updating library buildings, furnishings,
technology infrastructure, and equipment requires an ongoing investment of resources, it
was proposed that higher library expenditures would result in better facilities, appropriate
study spaces, and robust technology. Therefore, a relationship between scores for the
library as place dimension and library expenditures per student was anticipated.
5. To what extent, if any, are scores for service affect related to institutional size
as expressed by FTE enrollment?
Small institutions are commonly thought to foster more interpersonal contact
between students and faculty. Research in student engagement supports this idea and
indicates that student-faculty interaction at small colleges occurs more frequently and in

15
different ways than at large institutions. At small institutions students interact with
faculty daily ―through residence halls, faculty being on campus every day and having an
open door policy, an active advising system that usually involve[s] faculty rather than
staff advisors, a sense of egalitarianism between students and faculty, and ethic of care on
the part of faculty‖ (Kezar, 2006, p. 100). The high level of faculty-student interaction
typically found at small institutions was expected to be related to higher service affect
scores.
6. To what extent, if any, was institutional investment in the library, as
expressed by library expenditures, related to scores for each of the three
dimensions, or to overall LibQUAL+™ scores?
Finally, in addition to exploring the potential relationship between library
expenditures and scores for library as place, it might be argued that budgetary support for
the library is related to most aspects of library personnel, library operations, and library
collections. Therefore, higher expenditures were expected to be related to higher scores in
all of the LibQUAL+™ dimensions.
Methodology
In this section the data collection and analysis procedures that were followed in
the study are described. Data were collected and analyzed for the purpose of exploring
the potential relationships posed in the research questions.

16
Data Collection and Analysis
Of the 298 institutions that participated in the 2006 administrations of
LibQUAL+™ (ARL, 2006), institutional score reports for academic libraries (in co lleges
or universities) were selected for the sample if they used the American English version of
the survey, self-identified as colleges or universities, and were willing to make their score
reports available to other participants in the 2006 administration of LibQUAL+™. The
resulting sample was composed of score reports for 159 institutions.
The independent variables for the research questions were the institutional
characteristics that were investigated as potential correlates or predictors of
LibQUAL+™ scores. Institutional type was expressed by the Carnegie Basic
Classification, institutional size was expressed by FTE enrollment, and level of
investment in libraries was expressed by library expenditures. Published data related to
the independent variables were collected from the Academic Library Survey administered
biennially by the National Center for Educational Statistics (NCES) Library Statistics
Program, and from the Carnegie Foundation for the Advancement of Teaching. The
dependent variables in this investigation were the perceived scores for the three
dimensions of LibQUAL+™ and the overall, weighted LibQUAL+™ score.
The research questions that framed the investigation were addressed with
descriptive statistics, calculations of bivariate correlations (Spearman‘s rho), and
bivariate regression analyses. Table 2 summarizes the research questions, data sources,
and analytical tools that were employed to address each question.

17
Table 2
Data Sources and Analytical Tools that Addressed the Research Questions
Research Question
Data Source
Analytical
Tools
1. What were the 2006 LibQUAL+™
scores for American college and
university libraries?
LibQUAL+™ score reports
Descriptive
statistics
2. What were the characteristics of the
American college and university libraries
that administered LibQUAL+™ in 2006?
National Center for
Education Statistics (NCES)
Academic Library Survey
Descriptive
statistics
3. To what extent, if any, were scores for
the Information Control dimension
related to institutional type as expressed
by the Carnegie basic classification?
LibQUAL+™ scores,
Carnegie Basic Classification
Regression;
correlation
4. To what extent, if any, werere scores
for the library as place dimension related
to library expenditures per FTE student?
LibQUAL+™ score reports,
NCES
Regression;
correlation
5. To what extent, if any, were scores for
service affect related to institutional size
as expressed by FTE enrollment?
LibQUAL+™ scores, NCES
Regression;
correlation
6. To what extent, if any, is institutional
investment in the library, as expressed by
library expenditures, related to scores for
each of the three dimensions, or to overall
LibQUAL+™ scores?
LibQUAL+™ scores,
NCES
Regression;
correlation

18
Delimitations and Definitions
Service quality, in LibQUAL+™ and for the purposes of this investigation, is a
construct defined as ―the result of the consumer‘s comparison of expected service with
perceived service‖ (Parasuraman et al., 1985, p. 47). In contrast, product quality can be
―measured objectively by such indicators as durability and number of defects‖
(Parasuraman Zeithaml, & Berry, 1988, p. 13).
The sample of college and university score reports was limited to those
institutions that administered the American English version of the 2006 LibQUAL+™
survey. Since those institutions chose to administer the survey, it should be noted that the
sample was drawn from a self-selected subset of the population. This subset and the
sample may not be representative of the population of all American academic libraries.
Findings of the study cannot be generalized to institutions that administered the
survey in other languages, including British English. Furthermore, since the study
analyzed data related to college and university libraries, findings cannot be generalized to
other types of libraries.
Significance of the Study
The LibQUAL+™ survey is the first instrument that claims to have produced
national benchmarks for library service quality with reliability and validity. It has

19
provided academic librarians with data intended to inform service quality improvements
and meet the demands of assessment requirements. Consequently, LibQUAL+™ results
have been analyzed in a variety of ways to assess and improve library services, programs,
and facilities.
This study explored whether there were relationships among institutional size,
institutional type, level of investment in libraries, and LibQUAL+™ scores. These
research questions were posed because the answers were anticipated to offer a greater
understanding of the meaning of LibQUAL+™ scores. Furthermore, this analysis was
significant to the library profession because it added to librarians‘ understanding of
LibQUAL+™ results, extended librarians‘ knowledge of factors that are correlated with
the scores, and may have provided significant information for college and university
decision makers.
Summary
This chapter introduced the problem of meaningful assessment in academic
libraries, outlined the conceptual framework for the study, enumerated the research
question and sub-questions, described the methodology, and discussed the potential
significance of the study.
Chapter Two provides a review of the literature that guided the study. Chapters
Three and Four explain the investigation‘s methodology in more detail and describe the

20
results of the data analyses, respectively. Finally, Chapter Five contains a discussion of
the findings, conclusions, implications for practice, and recommendations for future
research. Chapter Five is followed by the List of References, Appendix A, which contains
a sample of the LibQUAL+™ instrument, and Appendix B, which includes scatterplots
for research question six.

21
CHAPTER TWO: REVIEW OF THE LITERATURE
Chapter One introduced the present study by describing the problem this
investigation was designed to address, outlining the study‘s methodology, and explaining
its professional significance. Chapter Two will examine the relevant literature and present
the conceptual framework underlying this investigation. The bodies of literature on
customer satisfaction measurement, service quality assessment, and the LibQUAL+™
protocol for library service quality assessment, provide the basis for this study.
Customer Satisfaction and Service Quality
Consumer satisfaction research ―matured into a respectable research stream‖
(Oliver & DeSarbo, 1988, p. 495) in the mid-1960s. Several approaches to customer
satisfaction have emerged since then that contributed to the conceptual model of service
quality used in contemporary measurement efforts (Crosby, 1993; Hernon, 2002).
From the corporate image studies and product quality studies beginning in the late
1960s, measurement approaches emerged based on customer expectations or values. The
adequacy–importance model, for example, was one such measurement that moved from
just measuring consumer satisfaction with product performance to enriching those
product performance measures with consumer values. It added ratings of the importance
of each product feature. The level of satisfaction with performance was then multiplied

22
by the product feature importance to create an index of consumer satisfaction (Crosby,
1993, p. 390; Cohen, Fishbein, & Athola, 1972, p. 459).
Expectancy Disconfirmation Theory
One of the primary areas of exploration in the emerging field of consumer
satisfaction research in the 1960s was from the perspective of expectancy disconfirmation
theory. Expectancy disconfirmation is a process theory that creates a framework for
examining the formation of customer expectations and the subsequent confirmation or
disconfirmation of those expectations through comparisons with product performance
(Oliver & DeSarbo, 1988). Consumers are thought to compare post-purchase
performance to their expectations prior to purchase ―using a ―better-than, worse-than
heuristic‖ (Oliver & DeSarbo, p. 495) to arrive at a judgment of simple confirmation if
the product performs as expected. If performance is better than anticipated, there is a
positive disconfirmation of the consumer‘s expectations; if the performance is worse than
anticipated, there is a negative disconfirmation (Figure 1).

23
Figure 1. Expectancy Disconfirmation Theory
The Service-Based Economy
In the 1980s, consumer satisfaction theorists and businesses alike began to realize
that, in terms of the gross national product and employment statistics, the economy in the
United States had become dominated by service industries (Crosby, 1993, p. 391). For
the purposes of customer satisfaction measurement, there was no longer just a physical
product to assess in terms of durability or number of defects. The commercial sector was
beginning to recognize the need for a new customer satisfaction model that addressed the
fundamental shift to a service-based economy and it turned to examining customer
perceptions of whether their expectations were being met (Crosby, p. 392).
High
Performance
Low
Positive
Disconfirmation
Simple
Confirmation
Simple
Confirmation
Negative
Disconfirmation
Low Expectations High

24
Total Quality Management
Crosby (1993) contends that the contemporary emphasis on quality is ―largely
attributable to the quality movement in business‖ ( p. 392) that took hold in the United
States in the mid-1980s. The success of foreign companies in the American market in the
late 1970s and the 1980s was unprecedented. The success of Japanese companies in
particular, such as Toyota and SONY, led many American companies to look at how the
Japanese had become so successful.
Since the end of World War II, Japanese companies had focused on quality and
embraced Total Quality Management (TQM). American companies subsequently looked
for ways to integrate TQM into their own organizations (Crosby, 1993, p. 392). TQM
requires every part of a company to be organized in terms of a single, integrated
philosophy encompassing quality through teamwork, productivity, customer
understanding, and customer satisfaction (Crosby; Ishikawa, 1984/1985, p. 37). A critical
perspective in TQM is that only the customer may judge quality (Crosby; Ishikawa). In a
paradigm where the customer judges quality, measuring customer satisfaction and
customer perceptions of quality, not just product performance, becomes significant.

25
The Gaps Model of Service Quality
As TQM became popular in the United States, the marketing researchers
Parasuraman et al. (1985, 1991) developed the Gaps Model of Service Quality. The Gaps
Model is based on the expectancy disconfirmation perspective with a focus on service
quality rather than product quality (Parasuraman et al.). In his review of quality
assessment, Hernon (2002) wrote that
―the confirmation/disconfirmation process, which influences the Gaps Model,
suggests that expectations provide a frame of reference against which customers'
experiences can be measured. . . . customers form their expectations prior to
purchasing or using a product or service. These expectations become a basis
against which to compare actual performance‖ (p.225).
The Gaps Model is described by Hernon (2002) as a way to measure customer
perceptions of service quality by identifying gaps, or differences, between customer
expectations and customer perceptions of service. In the Gaps Model, customer
expectations are viewed as subjective judgments based on the extent to which customers
believe a particular attribute is essential for an excellent service provider. Expectations
are affected by experience and are not expected to remain the same over time. In this
model, customer perceptions are the judgments about how well service was performed (p.
225).
To deploy the Gaps Model, a survey instrument is used and customers are asked
to define the minimum level of service they will accept and the level of service they

26
desire. Customers are then asked to describe their perceptions of the service that was
actually provided. The gaps between perceived performance level and customer-defined
desires or expectations can be used to identify and target areas for improvement
(Parasuraman et al. 1985).
Hernon‘s (2002) examination of the Gaps Model identifies five types of gaps
created by discrepancies between:
1. Customer expectations of service and management's perspective on
these expectations;
2. Service quality specifications and management's perspective of
customer expectations;
3. Service quality specifications and service delivery;
4. Service delivery and external communication to customers about that
delivery; and
5. Customers' expectation of service and perceived service delivery (p.
225).
The fifth type of gap, between customers' expectation of service and perceived
service delivery, is the one used by Parasuraman et al. (1985) in defining the framework
for SERVQUAL, the instrument they created to assess service quality in the for-profit
sector.
SERVQUAL
The SERVQUAL instrument is a multi-item scale that was developed to assess
customer perceptions of service quality in retail businesses (Parasuraman et al. 1988). It

27
is based in the Gaps Model of Service Quality, which is grounded in expectancy
disconfirmation theory.
Customers Define Quality
The SERVQUAL instrument was designed from data gathered in an exploratory
customer study by Parasuraman et al. (1985). The exploratory customer study conducted
focus-group interviews of customers in four distinct markets: retail banking, credit cards,
securities brokerage, and product repair and maintenance. The focus-groups were
designed to discover the elements that form the concept of service quality from the
customers‘ perspective. Using a focus-group methodology reflects the TQM focus on
quality as well as the precept that ―only customers judge quality; all other judgments are
essentially irrelevant‖ (Zeithaml, Parasuraman, & Berry, 1990, p. 16).
The definition of service quality that emerged from the customer focus groups
was ―the extent of discrepancy between customers‘ expectations or desires and their
perceptions‖ (Zeithaml, et al., p. 19). The investigators also found that ―the criteria used
by consumers [in all four markets] in assessing service quality fit into 10 potentially
overlapping dimensions . . . tangibles, reliability, responsiveness, communication,
credibility, security, competence, courtesy, understanding/knowing the consumer, and
access‖ (Parasuraman et al. 1985, p. 47).

28
Refining SERVQUAL
The first version of the SERVQUAL instrument was composed of 97 scale items
designed by Parasuraman et al. (1985) to gather data that would address those 10
dimensions. In the next phase of development, SERVQUAL was administered and data
were collected for the 97 items. The investigators performed a factor analysis and applied
reliability testing. Using Cronbach‘s alpha coefficient, with alpha values ranging from .72
to .83 across the 10 dimensions, the instrument was refined to 54 items (Parasuraman et
al. 1988, p.19). Factor analysis of the resulting 54 items changed the factor loadings,
suggesting reassignment of some items and deletion of others. Each time the factors were
changed, the factor analysis was repeated and this iterative process ultimately resulted in
22 items loading on five dimensions (Table 3).
Table 3
SERVQUAL Dimensions and their Components
Dimension
Components
Tangibles Physical facilities, equipment, and appearance of personnel
Reliability Ability to perform the promised service dependably and accurately
Responsiveness Willingness to help customers and provide prompt service
Assurance Knowledge and courtesy of employees and their ability to inspire
trust and confidence
Empathy Caring, individualized attention the firm provides to customers

29
The final five dimensions in SERVQUAL included three of the initial
dimensions: tangibles, reliability, and responsiveness, as well as two new, combined
dimensions: assurance and empathy (Parasuraman et al.1988, pp. 20-23).
Library Quality Assessment
Historically, academic library quality has been expressed in terms of collection
size. The ―ultimate goal of bringing together a perfectly customized collection of books
for the purposes of fulfilling users‘ needs‖ (Kyrillidou, 2002, p. 43) drove collection sizes
higher and led to assessing a library‘s quality by the ―magnitude of its resources‖
(Kyrillidou, p. 43). In this environment, libraries relied upon collecting statistics and
analyzing input measures.
Input measures, the financial, human, and material resources available to the
library organization, have been measured in some form by research libraries since 1908
(Kyrillidou, 2002). With the increasing emphasis on assessment and accountability,
coupled with the changes in libraries and library collections made possible by
information technology, librarians began to seek new measures of quality that would be
more meaningful.

30
From Inputs to Outcomes
In the first phase of seeking out new measures, librarians shifted from focusing
solely on what libraries had acquired, and developed measurement models beyond simple
inputs. In the 1990s, library measurement expanded to include output measures: the
activities that libraries produced from inputs, such as the number of items borrowed or
questions answered (Kyrillidou, 2002, p. 43). Library professional associations, including
the Association of Research Libraries (ARL) and the Association of College and
Research Libraries (ACRL), as well as the National Center for Education Statistics
(NCES) continue to collect collection- and activity-based data from academic libraries.
NCES maintains an academic library comparison tool on its website for the purpose of
comparing such data among institutions in the United States (Academic Libraries: 2004,
2006, November).
Input and output measures are useful yardsticks, but they do not capture the full
extent of the impact a library has on its institution. In its 1998 report, the ACRL Task
Force on Academic Library Outcomes Assessment captured the limitations of such
measures, noting that ―measurement of inputs, or the specification of quantities of them
by standards, is viewed by some [librarians] as a primitive, or at least insufficient way‖ of
assessing libraries (ACRL, section II, ¶ 5). The Task Force argued for libraries to develop
outcomes-based measures.

31
In the late 1990s the movement to hold schools, colleges, and universities
accountable for establishing and meeting outcomes was becoming formalized by
accreditation requirements and pressure from State legislatures for accountability
(Gratch-Lindauer, 2002). Educators had been using learning outcome measures for about
15 years at that time, but until the 1990s, most of them had not been required to use
formal outcome measures in accreditation reports or legislative budget requests (Gratch-
Lindauer).
Libraries tapped into this activity on campus and began to develop outcomes and
outcomes-based performance measures (Gratch-Lindauer, 1998). Library outcomes were
intended to measure ―the ways in which library users are changed as a result of their
contact with the library‘s resources and programs‖ (ACRL, 1998, section II, ¶ 2) as well
as document how libraries contribute to meeting institutional outcomes (Hernon, 2002;
Kyrillidou, 2002).
Service Quality from the User Perspective
It is only since the beginning of the 21st century that libraries have engaged in
directly measuring service quality from a user perspective (Kyrillidou, 2002, p. 43). As
recently as 2001 the library assessment literature did not, for the most part, consider
direct measurement of quality. For example, as late as 2001, Shim, McClure, and Bertot
observed, in a report on measures and statistics for ARL, that ―to accurately indicate the

32
success or quality of an academic library, measurement should be implemented at three
key levels: outcome level, use/capacity level (output), and resources level (input)‖ (2001,
section 3, ¶ 3). In other words, prominent library science researchers were still relying on
measures that assessed quality indirectly.
Of the measurement methods Shim, McClure, and Bertot (2001) identified, there
was no instrument or protocol for directly measuring service quality in a library, and
there was certainly no instrument to measure service quality across libraries for
benchmarking purposes. Pritchard (1996) offers a cogent description of the measurement
challenge that faced librarians.
The difficulty lies in trying to find a single model or set of simple indicators that
can be used by different institutions, and that will compare something across large
groups that is by definition only locally applicable—i.e., how well a library meets
the needs of its institution. Librarians have either made do with oversimplified
national data or have undertaken customized local evaluations of effectiveness,
but there has not been devised an effective way to link the two (section 2, ¶6).
As library practitioners and scholars worked to develop meaningful measures for
libraries, the need for reliable and meaningful assessment instruments intensified.
LibQUAL+™
In their quest to discover better measures, the Texas A&M University Libraries
turned to marketing research in the 1990s to identify instruments for measuring library
service quality. At that time the SERVQUAL instrument had been widely used in the

33
private sector for about 10 years; moreover, SERVQUAL‘s creators, Parasuraman et al.
(1985), were members of the Texas A&M University faculty (Thompson, 2007). The
Texas A&M University Libraries used SERVQUAL three times, in 1995, 1997, and
1999, to track perceptions of library service quality from samples of its library users.
Through that experience, the assessment team recognized that the instrument could be
improved for libraries by adapting it to address the concepts most critical to library
service and removing ―items not considered relevant by some library users (e.g., the attire
of service staff)‖ (Thompson, ¶ 2).
The Texas A&M University group approached ARL about working jointly to
adapt SERVQUAL for libraries and they collaborated to apply for a grant from the Fund
for the Improvement of Post-Secondary Education (FIPSE). The FIPSE award funded the
effort to develop a modified protocol, which they called LibQUAL+™.
Developing LibQUAL+™
ARL was poised to work on such a project as it had recently proposed the New
Measures Initiative. The New Measures Initiative was created by ARL‘s Statistics and
Measurement Committee and its Research Library Leadership and Management
Committee in October, 1999 at an ARL membership meeting (Blixrud, 2001). The new
measures were intended to assist libraries in moving away from data that just described a
library‘s inputs and outputs and towards data and programs that could ―help libraries

34
measure their performance over time both to benchmark with peers and to improve their
own operations‖ (Blixrud, p. 1).
The Initiative began with a focus on ―higher education outcomes assessment,
utility of service effectiveness measures across libraries, usage measures for electronic
resources, identification of cost drivers, and applying the results of an Interlibrary Loan
and Document Delivery Performance Measures cost study‖ (Blixrud, 2001, p. 3). As a
result, supporting and developing the LibQUAL+™ project was precisely the kind of
project in which the ARL New Measures Initiative was prepared to engage.
LibQUAL+™ was administered for the first time in 2000 across a group of 13
research libraries. Subsequently, the instrument was further modified and adapted, with
FIPSE support, to render it appropriate for other types of libraries such as those in smaller
colleges and public libraries (Thompson, 2007). Since then, LibQUAL+™ has been used
by an increasing number and widening variety of libraries each year to track user
perceptions of service quality. In 2006, 298 libraries, including public, community
college, business, and medical and law libraries, participated in LibQUAL+™, and more
than 176,000 individual responses were collected from those libraries for analysis (ARL,
2006).
As outlined in Table 4, the LibQUAL+™ instrument has been refined a number
of times and the current iteration, composed of 22 items that load on three dimensions,
has been administered since 2003 (Davis & Kyrillidou, 2007, slide 9).

35
Table 4
Refinement of LibQUAL+™ Dimensions
2000 2001 2002 2003-2007
No. of items 41 56 25 22
Dimensions
Affect of
Service
Affect of
Service
Affect of
Service
Affect of
Service
Library as Place Library as
Place
Library as
Place
Library as
Place
Reliability Reliability Personal
Control
Information
Control
Provision of
Physical
Collections
Self-Reliance Information
Access
Access to
Information
Access to
Information
In addition to the 22 scale items, LibQUAL+™ has a box for comments, and 100
ancillary items (see the complete instrument in Appendix A). Each participating library
may choose up to five of the ancillary items for inclusion in the institution‘s survey to
address local interests. These ancillary items do not contribute to the dimension scores.
The comment box has become an important source of qualitative data. About 40% of
respondents use the comment box, primarily to add detail to their answers and offer
suggestions to address problems (Thompson, Kyrillidou, & Cook, 2007).

36
Acting on LibQUAL+™ Data
A review of the LibQUAL+™ literature reveals a body of work that reports on the
decisions made and actions taken at individual libraries in response to LibQUAL+™
results. Such articles document how LibQUAL+™ is affecting practice in all types of
libraries, as well as how individual libraries are interpreting LibQUAL+™ results and
using the data to effect service quality improvements.
Several articles report applications and uses of LibQUAL+™ in libraries. The
vast majority of such articles report individual institutional LibQUAL+™ results and
point to the need for additional investigation of findings through complementary methods
such as focus groups. The most frequently reported specific use of LibQUAL+™ data is
linking them to a library planning process (Begay, Lee, Martin, & Ray; 2004; Shorb &
Driscoll, 2004; Haricombe & Boettcher, 2004). Another institution reported using the
data to redesign its public service units (Knapp, 2004), and another library found that its
LibQUAL+™ results helped identify some very distinct user groups, each with its own
set of needs and expectations (Peterson, Murphy, Holmgren, & Thibodeau, 2004).
Another segment of the practice-based research literature is aimed at exploring the
relationship between service quality and customer satisfaction. Examining one
institution‘s results, Heinrichs, Sharkey, and Lim (2005), for example, investigated the
influence of the LibQUAL+™ dimensions on aspects of user satisfaction at Wayne State
University. Multivariate regression analysis revealed a significant impact of the

37
dimensions on user satisfaction, and moderated regression showed the moderating impact
of demographic variables. The authors claimed their results could ―be used to alter
resource allocation expenditures to improve user satisfaction‖ (p. 248).
Interpreting LibQUAL+™ Results
There is also a growing body of scholarly work composed of studies that explore
the integrity of the LibQUAL+™ protocol and the meaning of LibQUAL+™ scores. A
number of validity and reliability tests have confirmed its integrity (Thompson, Cook, &
Thompson, 2002) and the analyses and interpretive frameworks that continue to emerge
for LibQUAL+™ results are adding to the knowledge base about the meaning of
LibQUAL+™ scores.
Thompson, Cook, and Kyrillidou (2005) analyzed the validity of the
LibQUAL+™ dimensions and total scores through an examination of their relationships
with self-reported outcomes scores and library satisfaction scores. The results suggested
that LibQUAL+™ scores primarily measure satisfaction rather than outcomes.
Thompson, Cook, and Kyrillidou (2006a, ¶ 9-10) have also identified several studies that
confirmed the integrity of LibQUAL+™ scores with a number of approaches including
structural equation modeling (Thompson, Cook, & Heath, 2003), reliability
generalization (Thompson & Cook, 2002), taxonometric analysis (Arnau, Thompson, &
Cook, 2001), and latent trait item response theory (Wei, Thompson & Cook, 2005).

38
Zones of Tolerance
One way of interpreting LibQUAL+™ scores uses zones of tolerance as a
framework. The zone of tolerance for an item is defined as the ―distance between
‗minimally-acceptable‘ and ‗desired‘ service levels‖ (Cook, Heath, & Thompson, 2003,
p. 116) for that item. Thompson et al. (2007) used the zones of tolerance framework in an
analysis of responses from 297,158 individuals, gathered from 2004 through 2006, to
explore ―how tolerant library users are with respect to the library services described in the
22 LibQUAL+™ core items (p. 3). The purpose of the study was to determine whether
there is a relationship between tolerance of deviation from desired performance and the
level of desirability assigned to the library service indicator by customers. That is, the
study asked whether people are less tolerant of deviation from performance for highly
desirable service indicators (Thompson et al., p. 5). The results indicated that the zone of
tolerance was stable across time within user groups and that the ―zones were not
uniformly narrower for items ranked either very high or very low in desirability‖ (p. 6).
LibQUAL+™ Score Norms
In another approach to interpretation, Cook, Heath, and Thompson (2002)
described using LibQUAL+™ norms tables or percentile ranks for service quality
benchmarking. An institution may choose to use the overall score norms for

39
benchmarking, select a subset of libraries to serve as a peer group for benchmarking, or
take a longitudinal approach by establishing performance goals and measuring itself
against its own score norms over time (p. 17).
In a related study, Thompson, Cook, and Kyrillidou (2006a) assert that
demonstrating stability in the LibQUAL+™ score norms helps library staff accept
benchmarking conclusions from LibQUAL+™ data. The study demonstrated the stability
of LibQUAL+™ score norms over five years (2001-2005) and across two language
versions of the survey, American English and British English. It is worth noting that, as
described previously in Table 4, the instrument underwent changes during this time
period as well.
Validity and Reliability
The LibQUAL+™ survey is the first assessment instrument that is claimed to
produce reliable and valid national benchmarks for library service quality. A number of
studies have supported the instrument‘s score reliability (e. g., Cook, Heath, Thompson,
& Thompson, 2001a; Cook, et al., 2001b; Thompson, Cook, & Thompson, 2002).
LibQUAL+™ has also consistently tested as psychometrically valid (Thompson, Cook,
& Kyrillidou, 2006a; Thompson, et al., 2005, p. 517).
Roszkowsli, Baky, and Jones (2005) criticized one aspect of validity by
examining LibQUAL+™ scores from a slightly different perspective. In a 2005

40
investigation, they analyzed data from 709 respondents at one institution that participated
in LibQUAL+™ during 2003. The study found that the perceived performance rating was
a more valid indicator of user satisfaction than the superiority gap score. This criticism of
the LibQUAL+™ protocol focused on the validity of the superiority gap score, which is
the difference between users‘ perceived and desired levels of performance. The
investigators argued that user-defined desired levels of performance are irrelevant and
only user perceptions of actual performance are valid measures of library service.
In a study by Heath, Cook, Kyrillidou, and Thompson (2002), validity
coefficients replicated closely across different types of post-secondary libraries, from
which they concluded that LibQUAL+™ scores may be valid in different types of library
settings (p. 38). The study described in this report investigates that conclusion by
exploring whether and to what extent there are relations between LibQUAL+™ scores
and the following key characteristics: institutional size, institutional type, and level of
investment by the institution in its library.
Only one study (Kyrillidou & Heath, 2004) was identified in the literature review
that specifically explored potential relationships between LibQUAL+™ scores and
institutional characteristics. However, this previous study used an earlier version of the
LibQUAL+™ instrument with four dimensions (rather than three dimensions) and used a
different set of institutional characteristics for the independent variables than those in the
present study. Kyrillidou and Heath (2004) found a ―moderate negative relation of the
ARL Membership Criteria Index with LibQUAL+™ scores‖ (p. 4). The ARL

41
Membership Criteria Index is composed of volumes held, gross volumes added, current
serials, total staff, and expenditures. In other words, the Index is composed of traditional
input and output measures of library quality. Kyrillidou and Heath concluded that
students and faculty members in libraries at large research institutions have higher
expectations for library collections, which results in lower LibQUAL+™ scores. The
negative relationship found between the ARL Membership Criteria Index and
LibQUAL+™ scores occurred, they asserted, because such library users ―are highly
skilled, have specialized and diverse information needs . . . [and] are clearly more
demanding and harder to please‖ than library users at other types of institutions
(Kyrillidou & Heath, 2004, p. 5).
Conceptual Framework
This literature review served as the basis for the conceptual framework underlying
this study. It is clear that demands for assessment are directed at post-secondary
institutions and their libraries by internal and external constituencies including governing
boards, state and federal agencies (in the case of publicly-funded institutions),
accreditation organizations, and administrators who need data for decision making. In
addition, library users bring expectations to the library about services and resources based
on their understanding of the institution as well as their experience and skill in using
libraries. Figure 2 illustrates the relationships among several concepts that constitute the

42
factors relevant to evaluating academic library service quality with the LibQUAL+™
survey.
Figure 2. LibQUAL+TM
Service Quality Assessment Factors
Significance of the Study
Librarians report to ARL that they have used the survey data to inform decision-
making, identify best practices, analyze service deficits, and allocate resources (Cook,
LibQUAL+TM
Scores
Service Affect
Library as Place
Information Control
Overall
Accreditation:
Regional, program,
and professional
organizations
Political:
State and Federal public
policy agencies
Internal:
Library administrators,
Provost, Fundraisers,
Governing Boards
Demands for Assessment
Institutional Characteristics
Carnegie Class
FTE enrollment
Library Expenditures User Expectations
Information needs
Skills
Experience
Library
Assessment

43
Heath, & Thompson, 2003). The exploration reported in this paper of whether, and to
what extent, there were relationships among institutional size, institutional type, level of
investment in libraries, and LibQUAL+™ scores, is significant because it provides a
greater understanding of the meaning of LibQUAL+™ results. A positive relationship
between library expenditures and LibQUAL+™ scores, for example, can be used as
evidence in a compelling case to upper-level administrators for an increase to the library
budget. A relationship between enrollment and service affect scores, on the other hand,
may not justify particular actions, but will increase understanding about some of the
factors that contribute to an institution‘s results on the service affect dimension. In the
case of a growing institution for example, it may alert administrators that when
enrollment rises above 5,000, service affect scores may dip because the institution has
reached a size that predictably affects user perceptions, not necessarily because the staff
is behaving differently.
Summary
Chapter Two contained the review of the relevant research and professional
literature that formed the foundation for this study. In addition, this chapter established
the conceptual framework for this investigation, and explained how this study extended
the scholarly conversation about the meaning of LibQUAL+™ assessment results. In
Chapter Three the methodology employed in this study will be described.

44
CHAPTER THREE: METHODOLOGY
Chapter Two presented the examination of the relevant literature and also
presented the conceptual framework for this investigation. In Chapter Three, the
methodology for this study will be described including definitions used in the study, how
the sample was selected, limitations and delimitations of the research design, data sources
and collection methods, and statistical analysis methods.
Definitions
The purpose of this study was to explore and expand on the current understanding
of the meaning of LibQUAL+™ scores in college and university libraries. Specifically,
this study addressed whether the scores were related to characteristics that express
institutional mission, institutional size, or level of investment in libraries.
The definition of service quality that underlies the LibQUAL+™ protocol is the
definition that was used in the present study. Service quality was defined as ―the result of
the consumer‘s comparison of expected service with perceived service‖ (Parasuraman et
al. 1985, p. 47).

45
Variables
The independent variables that were investigated for potential relationships with
LibQUAL+™ scores were institutional type, institutional size, and investment in
libraries. For this investigation, institutional type was defined as the classification
assigned by the Carnegie basic classification, institutional size was defined as 12-month
FTE enrollment, and institutional investment in libraries was defined as total annual
library expenditures.
The dependent variables in this investigation were the mean perceived scores for
the three dimensions of LibQUAL+™ (service affect, information control, and library as
place) and the overall, weighted LibQUAL+™ score.
Sample and Population
This study investigated potential relationships between institutional characteristics
and LibQUAL+™ scores in American colleges and universities. According to the
National Center for Education Statistics (NCES), the population of post-secondary,
degree-granting institutions that confer at least four-year degrees is 2,217 (2006, p. 24).
The sample of institutions for this investigation was a nonrandom, convenience sample.

46
Selecting the Sample
The sample was limited to an existing group of American college and university
libraries that opted to participate in the LibQUAL+™ survey during 2006. Furthermore,
institutional score reports were included in the sample only if all of the following
conditions were met.
1. The institution agreed to share its results.
2. The institution used the American English version of the survey.
3. The institution placed itself in the ―Colleges and Universities‖ category.
Selection of institutions for the sample began with institutional type. Of the 298
institutions, 216 institutions had self-identified as College or University libraries (Table
5).

47
Table 5
2006 LibQUAL+™ Participants by Library Type
Institution Type
No.
Academic Health Sciences 10
Academic Law 6
College or University 216
Community College 29
European Business 16
Family History 1
Hospital 1
National Health Service (England) 10
Public 4
Research Centers Libraries 1
State 3
University/TAFE 1
Total 298
In the next step, 55 participating institutions were removed from the sample because they
were from countries other than the United States (Table 6).

48
Table 6
2006 LibQUAL+™ Participants by Country
Country
No.
Australia 2
Canada 11
Denmark 2
Finland 4
France 2
Ireland 2
Netherlands 5
Norway 2
South Africa 8
Sweden 2
Switzerland 2
UK 34
USA 222
Total 298
Finally, two more libraries were removed from the sample because complete data
for this study could not be obtained. In both cases, the libraries participated in
LibQUAL+TM
as single institutions but did not report individual institutional statistics to
the NCES Academic Library Survey; NCES data were subsumed in the reports of a
parent institution.

49
Size and Representativeness
Of the 298 institutions that participated in the 2006 administration of
LibQUAL+™, the sample was composed of 159 institutions that met all of the selection
criteria. The resulting sample of 159 institutions is an adequate sample size since it is
generally considered acceptable to have a minimum of 30 cases in each group for a
correlational study (Gay & Airaisian, 2003, p. 312).
For an exploratory, goodness-of-fit analysis, a one-sample Kolmogorov-Smirnov
test was computed for the independent variables: library expenditures, FTE enrollment,
Carnegie basic classification, and library expenditures per FTE. The test results were
significant for all of the independent variables (000 - .005), which indicated that the
distribution was significantly different from a normal distribution. Since the distribution
did not meet the assumption of normality, the data analysis required nonparametric
procedures. The one-sample Kolmogorov-Smirnov test was also computed for the
dependent variables, which had distributions that were not significantly different from a
normal distribution.
Limitations and Delimitations
Since the sample of score reports included in the study is a convenience rather
than a random sample from a self-selected group of institutions, it may not be
representative of all academic libraries. In addition, the findings of this investigation

50
cannot be generalized to institutions that administered the survey in other languages,
including British English. Finally, since the study analyzed data related to college and
university libraries, findings cannot be generalized to other types of libraries.
Data Acquisition
The data analyzed in this study were originally collected and published by the
Association of Research Libraries (ARL), the Carnegie Foundation for the Advancement
of Teaching, and the National Center for Education Statistics (NCES). A number of
validity and reliability tests have confirmed the integrity of the LibQUAL+™ protocol
(Thompson, Cook, & Thompson, 2002).
Data were retrieved from the publications of these organizations to enable an
analysis designed to address whether, and to what extent, there were relationships
between LibQUAL+™ scores and the following characteristics of colleges and
universities: institutional type, institutional size, or level of investment in libraries. The
following research questions were posed as a framework for the study.
1. What were the 2006 LibQUAL+™ scores for American college and university
libraries?
2. What were the characteristics of the American college and university libraries
that administered LibQUAL+™ 2006?

51
3. To what extent, if any, were scores for the information control dimension related
to institutional type as expressed by the Carnegie basic classification?
4. To what extent, if any, were scores for the library as place dimension related to
library expenditures per FTE student?
5. To what extent, if any, were scores for service affect related to institutional size
as expressed by FTE enrollment?
6. To what extent, if any, was institutional investment in the library, as expressed by
library expenditures, related to scores for each of the three dimensions, or to
overall LibQUAL+™ scores?
The data for the dependent variables were LibQUAL+™ scores that were collected
for this study from the LibQUAL+™ score reports of libraries in the sample. The data for
the independent variable, ―institutional type‖ were collected from the Carnegie
Foundation‘s (2006) published basic classification of each institution. The library
expenditures and 12-month FTE enrollment data were obtained from the NCES
publication, Academic libraries: 2004 (2006, November).
Statistical Analysis
The first two questions were addressed by conducting descriptive statistics
procedures that summarized the distribution of LibQUAL+™ scores and institutional
characteristics for the libraries in the sample. Frequencies for all values of each variable

52
were determined; mean and median scores were calculated as measures of central
tendency. Variability was described by variance and standard deviation calculations, and
outliers were identified.
For the remaining four questions, correlations and regressions were performed to
discover whether, and to what extent, the relationships existed. Simple linear correlation,
(Pearson r), nonparametric correlation (Spearman‘s rho), and bivariate linear regression
were used to assess the potential relationships of the independent variables with the
dependent variables.
Summary
In this chapter the methodology of the study was described, definitions were
provided to clarify meaning, the sampling process was detailed, limitations and
delimitations of the study were noted, the sources of data were identified, and statistical
methods were described. In Chapter Four, the results of the investigation will be reported.

53
CHAPTER FOUR: DATA ANALYSIS
Chapter Three presented details of the methodology used in this study including
the sources and methods of data collection and the statistical procedures used to address
each of the research questions. Chapter Four will present a summary of the research
problem, the development of the LibQUAL+™ instrument, and the methods utilized in
this study. The major sections of this chapter will present the results of the data analyses
that were computed for each of the research questions.
Problem and Approach
The recent emphasis on assessment in higher education has prompted university
administrators, including library administrators, to develop new ways of evaluating
services and programs. Libraries are service-oriented organizations, yet the traditional
measure of academic library quality has been collection size. The emphasis on formal
assessment in recent years has motivated librarians to seek out more meaningful
measures of service quality. There is a need for assessment tools that produce data that
can be used to inform improvement, as well as document assessment practices for
accreditation organizations, funding agencies, and governing boards.

54
The LibQUAL+™ Instrument
In the 1990s, the Texas A&M University Libraries began using a survey
instrument called SERVQUAL, which had been designed to measure customer
perceptions of service quality in the private sector (Parasuraman et al. 1985). After
administering the instrument three times to assess library service quality, the Texas A&M
University Libraries entered into a partnership with the Association of Research Libraries
(ARL) to develop, test, and adapt the instrument for academic libraries. That
collaboration created the LibQUAL+™ survey, which was first administered in 2000 by
the ARL across 13 research libraries as an experimental project for benchmarking
perceptions of service quality (Kyrillidou, 2006, p. 4).
Since that first administration, the LibQUAL+™ survey has become an
increasingly popular tool. In 2006, there were 298 libraries that participated in
LibQUAL+™. The instrument has been improved and refined and it is currently
composed of 22 questions and a comment box. Each question is answered on a scale from
1 to 9, with 9 being the highest rating (Thompson, Cook, & Kyrillidou, 2006b). Table 7
shows how the responses to the 22 questions are grouped to measure three dimensions of
library service quality: service affect, information control, and library as place (see the
complete instrument in Appendix A).

55
Table 7
LibQUAL+™ Dimensions and Corresponding Survey Questions
Dimension Components (item #)
Service Affect Employees who instill confidence in users (1)
Giving users individual attention (4)
Employees who are consistently courteous (6)
Readiness to respond to users‘ questions (9)
Employees who have the knowledge to answer user questions (11)
Employees who deal with users in a caring fashion (13)
Employees who understand the needs of their users (15)
Willingness to help users (18)
Dependability in handling users‘ service problems (22)
Information
Control
Making electronic resources accessible from my home or office (2)
A library Web site enabling me to locate information on my own (5)
The printed library materials I need for my work (7)
The electronic information resources I need (10)
Modern equipment that lets me easily access needed information (14)
Easy-to-use access tools that allow me to find things on my own (16)
Making information easily accessible for independent use (19)
Print and/or electronic journal collections I require for my work (20)
Library as Place Library space that inspires study and learning (3)
Quiet space for individual activities (8)
A comfortable and inviting location (12)
A getaway for study, learning or research (17)
Community space for group learning and group study (21)
The service affect dimension is concerned with the perceptions of customers about
library staff competency and helpfulness; the information control dimension is concerned
with whether the library‘s collections are adequate to meet customer needs and organized
in a manner that enables self-reliance for library users; and the library as place dimension
is concerned with the library facility‘s functionality and adequacy for academic activities.
56
Purpose and Design of the Study
Considering the increasing level of participation in the LibQUAL+™ survey, and
the relatively small body of research about the meaning of LibQUAL+™ results, this
study was completed for the purpose of adding to the library profession‘s understanding
of the meaning of LibQUAL+™ scores. Previous research found that validity coefficients
for LibQUAL+™ replicated closely across different types of post-secondary libraries in
one study, leading the authors to conclude that ―LibQUAL+™ scores may be valid in
reasonably diverse library settings‖ [italics original] (Heath, Cook, Kyrillidou, &
Thompson, 2002, p. 38). This study explored an aspect of that conclusion by seeking to
determine whether institutional characteristics would impact LibQUAL+™ scores.
The data analysis was designed to address whether, and to what extent, there were
relationships between LibQUAL+™ scores and selected institutional characteristics of
American colleges and universities. Specifically, this study examined the following
institutional characteristics for potential relationships with the 2006 LibQUAL+™ scores.
1. Institutional type as defined by the Carnegie basic classification,
2. Institutional size as defined by 12-month FTE enrollment, and
3. Institutional investment in libraries, as defined by annual library
expenditures.

57
Methodology
The sample was composed of libraries in American colleges and universities that
conferred at least 4-year degrees and participated in LibQUAL+™ during 2006. This was
a sample of convenience that included a total of 298 participating libraries. Initially, 82
libraries were removed from the total sample of 298 libraries because they did not
identify themselves as libraries in colleges or universities. (The survey is also used by
public libraries, state libraries, hospital libraries, and other, specialized libraries.) From
the remaining 216 institutions in the sample, 55 additional participating institutions were
removed because they were from countries other than the United States. The remaining
161 libraries became the initial sample.
During the data collection phase of the study, two additional institutions were
removed from the sample because complete data required for this study could not be
obtained. In both cases, the libraries had participated in the LibQUAL+TM
survey as
independent institutions. However, during data collection it was discovered that neither
library reported statistics as an independent institution to the Academic Library Survey
administered by the National Center for Education Statistics (NCES). NCES data for
both of the libraries were subsumed in the reports provided to NCES by their parent
institutions. The remaining 159 libraries formed the final sample that was used in this
study.

58
The research questions that framed the study were addressed by using SPSS
(Statistical Package for the Social Sciences) for Windows to analyze the data. The
calculations produced descriptive statistics, calculations of bivariate correlations
(Spearman‘s rho), and bivariate regression analyses. The independent or predictor
variables were annual library expenditures, FTE enrollment, Carnegie basic
classification, and library expenditures per FTE.
The design of this study employed an approach that required multiple calculations
using the same set of variables. For this reason, the Bonferroni adjustment was applied to
the significance levels to reduce the chance of a Type I error. The conventional .05
significance level was divided by four to account for the four questions ( research
questions 3 through 6) that were addressed. Subsequently, data were accepted and
interpreted as statistically significant at the .013 level or lower (D. L. Hahs-Vaughn,
personal communication, September 19, 2007; StatSoft, 2007, glossary, sec. B).
Results
The results of this study are presented in detail in the following section. Results
are organized by the research questions and summarized at the end of this chapter.

59
Research Question One
Research question one asked, ―What were the 2006 LibQUAL+™ scores for
American college and university libraries?‖
To address this question, scores for each of the three LibQUAL+™ dimensions,
and for the overall, weighted LibQUAL+™ score, were analyzed and descriptive
statistics were calculated. Measures of central tendency and variability were computed
for the mean, perceived 2006 LibQUAL+™ scores for the 159 sample libraries. The
resulting values are summarized in Table 8.
Table 8
Descriptive Statistics for LibQUAL+™ Scores (n=159)
Service Affect Info Control Lib as Place Overall
M 7.17 6.89 7.11 7.10
Mdn 7.18 6.90 7.14 7.09
SD 0.28 0.49 0.32 0.28
Range 3.66 3.17 2.75 1.93
Skewness -0.25 -0.67 -2.25 -0.26
Kurtosis 1.32 1.56 12.36 1.20
Note: Scale is 1 through 9, with 1 being the lowest score.
A review of the results revealed that the mean scores for the sample institutions
were consistent with those reported by ARL for all colleges and universities that
participated in the survey (Association of Research Libraries, 2006, p. 1). The mean
scores for all of the responses (n = 113,122) in colleges and universities on a scale of 1 to

60
9, with one being the lowest score, were: 7.15 for service affect, 7.13 for information
control, 6.87 for library as place, and 7.08 for the overall score (ARL, 2006, p. 1).
The small differences between the mean scores in the sample and the mean scores
for all colleges and universities were within one standard deviation. Since the sample was
composed of nearly 74% of the colleges and universities that administered the survey,
this was not a surprising result.
The median and mean scores for the sample institutions were also very close to
one another, and all of the means were lower than the median scores. This indicated that
the distribution was slightly, negatively skewed. While a perfectly shaped distribution
would have skewness and kurtosis calculations of zero, the measures recorded for three
of the variables were within the absolute value of two (Table 8) and, therefore, within the
normal range (Lomax, 2001, p. 224). Skewness for the library as place dimension
variable, however, was measured beyond the normal range at -2.25, and kurtosis for the
library as place dimension variable was 12.36, which indicated that library as place
dimension scores did not have a normal distribution.
Research Question Two
Research question two asked, ―What were the characteristics of the American
college and university libraries that administered LibQUAL+™ in 2006?‖

61
To address this question, an analysis was conducted to produce descriptive
statistics for total library expenditures, 12-month FTE enrollment, and library
expenditures per FTE (the institutional characteristics that were scale measures). All of
the 159 institutions in the sample had valid scores for this analysis and no cases were
missing. Table 9 summarizes the results.
Table 9
Descriptive Statistics for Scale Institutional Characteristics (n=159)
Expenditures FTE $ per FTE
M $7,686,309.51 11,746.29 $615.60
Mdn $3,697,694.00 8,790.00 $458.05
S D $8,718,309.13 9,989.02 $507.38
Skewness 1.71 1.42 4.88
Kurtosis 2.61 1.75 37.41
Range $44,391,143.00 46,680.00 $4,927.00
Percentiles 10 $955,138.00 2,490.00 $259.87
20 $1,576,024.00 3655.00 $326.81
30 $2,327,108.00 4,762.00 $364.58
40 $2,709,323.00 6,362.00 $405.49
50 $3,697,694.00 8,790.00 $458.05
60 $5,023,144.00 10,981.00 $537.48
70 $8,862,921.00 13,923.00 $668.70
80 $13,711,449.00 18,896.00 $869.83
90 $21,544,004.00 28,298.00 $1,067.24
Note. $ per FTE = library expenditures per FTE.
The mean measures were greater than the medians for the institutional
characteristics described in Table 9, and the variables were, therefore, positively skewed.
The standard deviations for the institutional characteristic variables also indicated wide
ranges of data, and that was confirmed by the range figures.

62
This result was consistent with the values of the percentiles. For example, there
was a much greater difference between the 50th percentile for library expenditures and the
90th percentile for library expenditures ($21,544,004 - $3,697,694 = $17,846,310) than
there was for the difference between the 50th percentile value for library expenditures and
the 10th percentile value for library expenditures ($3,697,694 - $955,138 = $2,742,556).
These descriptive statistics indicated that the three institutional characteristic variables
described in Table 9 were not normally distributed in the sample.
The Carnegie basic classification also served as an institutional characteristic
variable; it was treated separately, however, because it was an ordinal variable. Unlike
the other independent variables, which had specific values on a known scale with a
specified zero, an ordinal variable indicates only whether a score is larger than or smaller
than other scores. A description of the Carnegie basic classifications that were used in
this study is presented in Table 10.

63
Table 10
Definitions of the Carnegie Basic Classifications
Category Description
1. Baccalaureate/Associate‘s 10% - 49% of undergrad degrees conferred =
bachelor‘s
2. Baccalaureate—diverse
programs
Institutions not in classification 1 or 3
3. Baccalaureate—Arts &
Sciences
50% - 100% of undergrad degrees conferred =
bachelor‘s and arts and sciences majors ≥ 50%
4. Master‘s—smaller programs 50 - 99 master‘s and < 20 doctorates conferred, Or
< 50 master‘s conferred, and majority enrollment
= grad/professional, and grad/professional >
undergrad degrees conferred
5. Master‘s—medium programs 100 - 199 master‘s degrees conferred
6. Master‘s—larger programs ≥ 200 master‘s degrees conferred
7. Doctoral/Research Universities Lowest level of research activity
8. Research Univ. (high res. act.) Middle level of research activity
9. Research Univ. (v. high res.
act.)
Highest level of research activity
Each classification was assigned a number from 1 through 9, with 1 being
assigned to those institutions that award the lowest-level degrees in the sample,
Baccalaureate/Associate‘s colleges. The complete list of Carnegie basic classifications
includes categories not presented here such as special focus institutions, tribal colleges,
and two-year degree-granting institutions.
Mean FTE enrollment for each of the Carnegie basic classifications used in the
analysis, distribution of the classifications across the population, and distribution among
those classifications for colleges and universities in the sample are presented in Table 11.

64
Table 11
Population and Sample Enrollment and Distribution of Carnegie Classifications
Classification
Mean
Enrollment
Sample Population
No. % No. %
1. Baccalaureate/Associate‘s Colleges 2,232 32 20 120 7
2. Baccalaureate—Diverse 1,655 27 17 360 21
3. Baccalaureate—Arts & Sciences 1,833 12 8 286 17
4. Master‘s—smaller programs 2,733 52 33 128 7
5. Master‘s—medium programs 3,893 16 10 190 11
6. Master‘s—larger programs 8,115 8 5 347 20
7. Doctoral/Research Universities 10,221 7 4 83 5
8. Research Univ. (high research activity) 16,444 3 2 103 6
9. Research Univ. (very high research activity) 24,638 2 1 96 6
Note. Sample n = 159; population n = 1,713
Taken together, the 76 institutions classified in categories 4 through 6, master‘s
programs, composed the largest group within the sample; 71 institutions were classified
in the baccalaureate group, and 12 institutions were classified as research universities.
The largest sub-group in the sample was composed of the 52 master‘s colleges with
smaller degree programs. In the sample, 87% of the institutions were classified in
categories 1 through 5; in the population, 88% of colleges and universities were classified
in categories 1 through 7.

65
Research Question Three
Research question three asked, ―To what extent, if any, were scores for the
information control dimension related to institutional type as expressed by the Carnegie
basic classification?‖
A bivariate correlation coefficient was computed for the two variables. Since the
Carnegie classification variable was an ordinal measure and neither of the variables met
the assumption of normal distribution, a nonparametric correlation was computed using
Spearman‘s rho. The Spearman‘s rho correlation coefficient was .392 with a two-tailed
significance test score of .000. This was a statistically significant, positive linear
correlation. A scatterplot was created to visually examine the relationship and an
interpolation line was added to clarify patterns between the variables (Figure 3).

66
Figure 3. Information Control Dimension Scores and Carnegie Basic Classification
The scatterplot confirmed the positive correlation between the scores for the
information control dimension and the Carnegie basic classification, but only for
Carnegie basic classifications 1 through 6, which included institutions in the
baccalaureate and master‘s program classifications. There was clearly, however, a drop in
information control dimension scores where the Carnegie basic classifications
Carnegie Basic Class
RU/VHRU/HDRUMastLgMastMMasSmBac A&S
Bac Diverse
Bac Assoc.
Info
Co
ntr
ol
9.00
8.00
7.00
6.00
5.00
4.00

67
differentiated among doctoral/ research institutions (7 and 8). Moreover, it was also clear
in the scatterplot that the sample included relatively few doctoral/research institutions,
hampering interpretation of findings regarding such institutions.
A bivariate linear regression was also computed for the information control
dimension scores and Carnegie basic classifications. The analysis of variance (ANOVA)
generated by the regression is presented in Table 12, which describes the sum of squares,
degrees of freedom, and mean squares for the variation in information control dimension
scores that was accounted for by the Carnegie basic classifications (Model 1).
Table 12
ANOVA for Carnegie Basic Classification and Information Control Scores
Model Sum of Squares df Mean
Square
F Sig.
1 Regression
Residual
Total
3.001
34.660
37.661
1
157
158
3.001
.221
13.595 .000
Since the regression model (Carnegie basic classification) produced a small sum
of squares (3.001) compared with the high residual sum of squares (34.660), Carnegie
basic classification did not account for most of the variation in information control
dimension scores. The critical test value for the F statistic for a probability of 0.01 is 6.8.
Since the calculated F statistic (13.595) is greater than the critical test value (6.8), the
regression is statistically significant at the 0.01 level. The significance value of the F

68
statistic was .000, indicating that the Carnegie basic classifications explained a
statistically significant portion of the variation in information control dimension scores.
Table 13
Coefficients for Carnegie Basic Classification and Information Control Scores
Model
Unstandardized
Coefficients
Standardized
Coefficients
t
Sig. B Std. Error Beta
1 (Constant)
Basic Class
6.641 .078
.282
85.660
3.687
.000
.000 .073 .020
The unstandardized coefficients (B) are those of the estimated regression model.
The estimated model was: information control dimension scores = 6.641 + .073 Carnegie
basic classification. Since t values well below -2 or above +2 are a guide for identifying
useful predictors, the t value for Carnegie basic classification, at 3.687, confirms that it
may be identified as a useful predictor.
Research Question Four
The fourth research question asked, ―To what extent, if any, were scores for the
library as place dimension related to library expenditures per FTE student?‖
A bivariate correlation coefficient was calculated for library as place dimension
scores and library expenditures per FTE using the Spearman‘s rho procedure. The
Spearman‘s rho correlation was -.053, with a significance level of .509, which indicated

69
that there was no correlation between library expenditures per FTE and library as place
scores.
Taking a different approach to exploring the potential link between library as
place scores and the investment that institutions make in their libraries, a Spearman‘s rho
correlation was calculated for library as place dimension scores and total library
expenditures. This computation resulted in a statistically significant (p = .009) negative
correlation of -.207. A scatterplot was created to visually examine the relationship
(Figure 4).

70
Figure 4. Library as Place Dimension Scores and Library Expenditures
An examination of the scatterplot indicated that the highest scores for the library
as place dimension were clustered in the libraries with the lowest expenditures. It also
appeared that the library as place dimension scores dropped slightly as library
expenditures increased.
Library Expenditures
$50,000,000.00$40,000,000.00
$30,000,000.00$20,000,000.00
$10,000,000.00$0.00
Lib
rary
as
Pla
ce
8.00
7.00
6.00
5.00

71
A bivariate linear regression was computed for the library as place dimension
scores and library expenditures. The ANOVA generated by the regression is presented in
Table 14, which describes the sum of squares, degrees of freedom, and mean squares for
the variation in library as place dimension scores that was accounted for by library
expenditures (Model 1).
Table 14
ANOVA for Library as Place Dimension Scores and Library Expenditures
Model Sum of Squares df Mean Square F Sig.
1 Regression
Residual
Total
.058
15.817
15.875
1
157
158
.058
.101
.574 .450
Since the regression model (library expenditures) produced a small sum of
squares (.058) compared with the high residual sum of squares (15.817), library
expenditures did not account for most of the variation in library as place dimension
scores. The critical test value for the F statistic for a probability of 0.01 is 6.8. Since the
calculated F statistic (.574) was less than the critical test value (6.8), the regression is not
statistically significant at the 0.01 level. The significance value of the F statistic was .450,
indicating that library expenditures failed to account for a statistically significant portion
of the variation in library as place dimension scores.

72
Table 15
Coefficients for Library as Place Dimension Scores and Library Expenditures
Model
Unstandardized
Coefficients
Standardized
Coefficients
t
Sig. B Std. Error Beta
1 (Constant)
Library
Expenditures
7.126 .034
-.060
212.061
-.758
.000
.450 -2.2E-009 .000
The unstandardized coefficients (B) presented in Table 15 are the coefficients of
the estimated regression model. The estimated model was: library as place dimension
scores = 7.126 - 2.2E-009 library expenditures. Since the significance value for the
predictor was .450, it was not statistically significant and not a useful predictor for library
as place dimension scores.
Research Question Five
Research question five asked, ―To what extent, if any, were scores for service
affect related to institutional size as expressed by FTE enrollment?‖ To determine
whether, and to what extent, there was a relationship between institutional size and scores
for the service affect dimension, a Spearman‘s rho correlation coefficient was calculated
for FTE enrollment and service affect dimension scores. The Spearman‘s rho correlation
resulted in a coefficient of -.377 and a significance level of .000, which revealed that, as

73
expected, there was a statistically significant, negative correlation between FTE and
service affect scores (StatSoft, Inc., 2007, glossary, sec. B).
A scatterplot was constructed to examine the relationship graphically (Figure 5).
As anticipated, the graphic confirmed that the highest scores for service affect were
clustered at the lowest enrollment levels; scores dropped as enrollment figures climbed,
particularly between about 5,000 and 10,000 FTE, and again between about 10,000 and
12,000 FTE.

74
Figure 5. Service Affect Dimension Scores and FTE Enrollment
Finally, a bivariate linear regression was computed for the service affect
dimension scores and FTE enrollment. The ANOVA generated by the regression is
presented in Table 16, which describes the sum of squares, degrees of freedom, and mean
squares for the variation in service affect dimension scores that was accounted for by
FTE enrollment (Model 1).
FTE
50,000.0040,000.0030,000.0020,000.0010,000.000.00
Serv
ice A
ffect
8.00
7.50
7.00
6.50
6.00
R Sq Linear = 0.092

75
Table 16
Regression ANOVA for Service Affect Dimension Scores and FTE Enrollment
Model Sum of Squares df Mean Square F Sig.
1 Regression
Residual
Total
1.21
11.044
12.164
1
157
158
1.121
.070
15.930 .000
Since the regression model produced a small sum of squares (1.21) compared
with the residual sum of squares (11.044), and the significance value was .000, this model
(FTE enrollment) accounted for a small, statistically significant variation in service affect
dimension scores. This confirmed that FTE enrollment explained a portion of the
variation in the service affect dimension scores. The unstandardized coefficients
presented in Table 17 are those of the estimated regression model.
Table 17
Regression Coefficients for Service Affect Dimension Scores and FTE Enrollment
Model
Unstandardized
Coefficients
Standardized
Coefficients
t
Sig. B Std. Error Beta
1 (Constant)
FTE Enrollment
7.271 .033
-.304
223.538
-3.991
.000
.000 -8.43E-006 .000
The estimated model was: service affect dimension scores = 7.271 - 8.43E-006 FTE
enrollment. Since the significance value for the predictor was .000, FTE enrollment was a

76
statistically significant predictor for service affect dimension scores. The t value (-3.991),
however, indicated that FTE enrollment alone would not be a useful predictor for service
affect dimension scores as it would only predict a small portion of the total variance.
Research Question Six
Research question six asked, ―To what extent, if any, is institutional investment in
the library, as expressed by library expenditures, related to scores for each of the three
dimensions, or to overall LibQUAL+™ scores?‖
Considering the non-normal distribution of the independent variable (library
expenditures) and the library as place dimension dependent variable, nonparametric
bivariate correlations were calculated for each LibQUAL+™ score and library
expenditures using Spearman‘s rho. The results are summarized in Table 18 (See
Appendix B for the bivariate scatterplots).
Table 18
Correlations between Library Expenditures and LibQUAL+TM
Scores (n=159)
Service Affect Info Control Library as Place Overall
Library Expenditures -.382 -.437 -.207 -.371
Sig. .000 .000 .009 .000

77
The correlation coefficients between library expenditures and each of the four
LibQUAL+™ scores were statistically significant (p = .000 to .009), negative
correlations. The strongest correlation was between library expenditures and information
control dimension scores, followed closely by the correlations for the service affect
dimension and overall scores. The three stronger correlations each had significance
levels of .000.
Summary
This chapter reported the detailed results of the statistical analyses that were
calculated to address the research questions posed in this study. The descriptive statistics
computed for the first two research questions indicated that the independent variables in
the sample did not meet the assumption of normal distribution. In addition, among the
dependent variables, the library as place dimension score did not meet the assumption of
normality.
Since the distribution of some variables was not normal, the methodology
included nonparametric tests such as Spearman‘s rho, which ranks data to create a normal
distribution. Spearman‘s rho was used to calculate the bivariate correlations required by
the research questions. Table 19 summarizes the statistically significant correlations that
were calculated for this study.

78
Table 19
Summary of Statistically Significant Correlations
R.Q. Dependent Variable Independent Variable Result
3. Information Control Dimension Carnegie basic class .392 .000
4. Library as Place Dimension Expenditures per FTE -.053 .509
5. Service Affect Dimension FTE enrollment -.377 .000
6. LibQUAL+™ Scores
Service Affect
Information Control Dimension
Library as Place
Overall
Expenditures
Expenditures
Expenditures
Expenditures
-.382
-.437
-.207
-.371
.000
.000
.009
.000
Note. R. Q. = Research Question.
The results of the data analyses in this exploratory study clearly indicated that
there were statistically significant relationships between the selected institutional
characteristics (FTE enrollment, Carnegie basic classification, library expenditures, and
expenditures per FTE), and LibQUAL+™ scores. The two strongest correlations were
with the scores for the information control dimension. Those correlations were with
library expenditures and with Carnegie basic classification, respectively.
Chapter Five, the final chapter of this dissertation, will present the conclusions of
this study, discuss the findings, make recommendations for future research, and address
the implications for practice.
79
CHAPTER FIVE: CONCLUSIONS AND DISCUSSION OF FINDINGS
Chapter Four presented the detailed results of the data analyses and Chapter Five
will present summaries of the problem identified in this research, the research questions
developed to frame the study, the methodology and the results. The major sections of this
chapter will present conclusions, a discussion of the findings, implications for practice,
and recommendations for future research.
Statement of the Problem
During the past two decades, libraries have experienced rapid changes tied to the
development of new information technologies. Technological developments have spurred
librarians to reconsider and redefine collections, services, organizational structure, the
skill sets required of library staff, and the attributes of library facilities. At the same time,
the recent emphasis on formal assessment in higher education has prompted library
decision makers to reconsider their assessment strategies and to develop more meaningful
assessment methods and measures for libraries (Gratch-Lindauer, 2002).
The traditional measure of academic library quality has been collection size
(Kyrillidou, 2002, p. 43); however, in recognition of the substantial changes in libraries
precipitated by information technology developments, accreditation organizations have
created different approaches to evaluating libraries. In light of the vast electronic
collections in academic libraries, the Middle States Commission on Higher Education, for

80
example, now requires institutions to demonstrate the ―availability and accessibility of
adequate learning resources, such as library and information technology support services,
. . . to support relevant academic activities (―Characteristics of excellence,‖ 2006, p. 43).
With a requirement described in this manner, colleges and universities are left to
determine what constitutes adequacy without any traditional, prescriptive measures such
as volume counts or numbers of professional staff. Such broad statements have left
librarians and institutional effectiveness staff to figure out a new approach to measuring
and determining library quality (Gratch-Lindauer, 2002, p. 15).
The search for meaningful assessment approaches and instruments has librarians
looking for tools that provide evaluative data and can serve as evidence for the thoughtful
use of assessment results; the LibQUAL+™ survey, which measures customer
perceptions of library service quality, is such a tool.
LibQUAL+™
The LibQUAL+™ survey is the first service quality assessment instrument
available to libraries that has been tested for reliability and validity (Thompson, 2007).
Based on a service quality instrument developed for the private sector, it was first
administered across a group of 13 research libraries as an experimental project in 2000
(Kyrillidou, 2006, p. 4). Since then, increasing numbers of librarians have turned to the
LibQUAL+™ survey for a quantitative assessment of service quality (see the complete

81
instrument in Appendix A). In 2006 there were 298 libraries that participated in the
survey (Association of Research Libraries, 2006, p. 1).
The three dimensions of service quality that are measured by the LibQUAL+™
instrument are the service affect dimension, which is the perception of customers about
library staff competency and helpfulness; the information control dimension, which is the
adequacy of library collections and technology for meeting user needs and the
organization of information resources for enabling self-reliance for library users; and the
library as place dimension, which is the facility‘s functionality and adequacy for
academic activities. There is also an overall score, which is a mean score that has been
weighted by the number of usable responses for each question in the survey (Thompson,
Cook, & Kyrillidou, 2006b).
LibQUAL+™ claims to have produced national benchmarks for library service
quality. It has, therefore, provided academic librarians with quantitative measures that
can be used to satisfy requirements for formal assessment. LibQUAL +™ results may be
used to measure libraries against the norms of the survey data, or to measure libraries
against their own scores in previous administrations of the survey.
One study suggests that validity coefficients for LibQUAL+™ replicated closely
across different types of post-secondary libraries, leading the authors to conclude that
―LibQUAL+™ scores may be valid in reasonably diverse library settings‖ [italics
original] (Heath, Cook, Kyrillidou, & Thompson, 2002, p. 38). This study explored an

82
aspect of that conclusion by seeking to determine whether institutional characteristics
would impact LibQUAL+™ scores.
Research Questions
This study sought to ascertain whether, and to what extent, scores from the
LibQUAL+™ survey were related to the following institutional characteristics:
institutional type, as defined by Carnegie basic classification, institutional size, as defined
by 12-month FTE enrollment, and the level of institutional investment in libraries, as
defined by library expenditures. The following six research questions were designed to
establish a framework for the study that would address specific aspects of the central
question: whether LibQUAL+™ scores were related to institutional characteristics.
1. What were the 2006 LibQUAL+™ scores for American college and university
libraries?
2. What were the characteristics of the American college and university libraries that
administered LibQUAL+™ in 2006?
3. To what extent, if any, were scores for the information control dimension related
to institutional type as expressed by the Carnegie basic classification?
4. To what extent, if any, were scores for the library as place dimension related to
library expenditures per FTE student?

83
5. To what extent, if any, were scores for the service affect dimension related to
institutional size as expressed by FTE enrollment?
6. To what extent, if any, is institutional investment in the library, as expressed by
library expenditures, related to scores for each of the three dimensions, or to overall
LibQUAL+™ scores?
Methodology
This section summarizes the methodology employed in this study including
selection of the sample, acquisition of the data, and methods of data analysis.
Sample
The sample of colleges and universities that was used in this investigation was a
nonrandom, convenience sample. It was limited to an existing group of American college
and university libraries that opted to participate in the LibQUAL+™ survey during 2006.
A total of 298 libraries participated in the 2006 survey. Beginning with that group, 82
libraries were removed from the sample because they did not identify themselves as
college or university libraries. An additional 55 libraries were removed from the sample
because they were from countries other than the United States. Finally, two more libraries
were removed from the sample because the complete data required for this study could

84
not be obtained. In both cases, the libraries participated in LibQUAL+TM as single
institutions but did not report individual institutional statistics to the NCES Academic
Library Survey; NCES data for the two libraries were subsumed in the reports of their
parent institutions. The remaining 159 libraries formed the final sample that was used in
this study.
Data Acquisition and Analysis
Data from the 2006 administration of LibQUAL+™ were culled from the
individual score reports prepared by the Association of Research Libraries for each
participating library. Annual library expenditures and 12-month FTE enrollment served
as institutional characteristic variables in the study; data for these variables were retrieved
from NCES publications. The values for the library expenditures per FTE variable were
calculated based on the NCES data. Data regarding Carnegie basic classifications, which
also served as an institutional characteristic variable in this study, were collected from
publications of the Carnegie Foundation for the Advancement of Teaching.
The collected data were analyzed using the Statistical Package for the Social
Sciences (SPSS) to explore the relationships among the variables as they were posed in
the research questions. Descriptive statistics were produced for each of the variables,
bivariate correlations were calculated using Spearman‘s rho, and bivariate regression
analyses were computed.

85
Summary of Findings
This section will present a summary of the findings of the data analyses that were
computed to address each of the research questions. The next section will discuss these
results, draw conclusions based upon the findings, note the implications of this study for
practitioners, and suggest future research on the topic.
Research Questions One and Two
The first two questions required descriptive statistics for the data composing the
values in each of the variables. All of the variables were expected to have a normal
distribution of data. However, as detailed in Chapter Four, the data for three of the four
LibQUAL+™ scores met the assumption of normal distribution and data for the fourth
score, the library as place dimension score, did not meet the normality assumption. The
data for all four institutional characteristic variables also failed to meet the assumption of
normal distribution.
Research Question Three
Research question three asked, ―To what extent, if any, were scores for the
information control dimension related to institutional type as expressed by the Carnegie

86
basic classification?‖ Libraries in research universities are intended and expected to
support significant graduate programs and research activity. In such libraries students and
faculty expect to find large, well-organized collections. In contrast, libraries that support
solely undergraduate work have collections that support the curriculum, but are not likely
to have the resources required to support faculty research. Information control dimension
scores, therefore, were anticipated to be related to institutional type.
A statistically significant Spearman‘s rho correlation confirmed the anticipated
result and indicated that the Carnegie basic classification had a positive relationship with
information control dimension scores. A bivariate linear regression indicated that
Carnegie basic classifications explained a small but statistically significant portion of the
variation in information control dimension scores. A scatterplot confirmed the positive
correlation between the scores for the information control dimension and the Carnegie
basic classification, but only for Carnegie basic classifications in the baccalaureate and
master‘s program classifications. There was clearly a drop in information control
dimension scores where the Carnegie basic classifications differentiated among doctoral/
research institutions. It was also clear in the scatterplot that the sample included relatively
few doctoral/research institutions, hampering interpretation of findings regarding such
institutions.

87
Research Question Four
Research question four asked, ―To what extent, if any, are scores for the Library
as Place dimension related to library expenditures per FTE enrollment?‖
Since building, maintaining, and updating library buildings, furnishings,
technology infrastructure, and equipment requires an ongoing investment of resources, it
was proposed that greater library expenditures per student (FTE enrollment) would result
in better facilities, appropriate study spaces, and robust technology, leading to higher
scores for the library as place dimension.
A Spearman‘s rho correlation was calculated using library expenditures per FTE
and no significant relationship was discovered. The correlation was re-calculated using
the total library expenditures variable and this computation resulted in a statistically
significant, negative correlation. A bivariate linear regression indicated that library
expenditures failed to account for a statistically significant portion of the variation in
library as place dimension scores.
Research Question Five
Research question five asked, ―To what extent, if any, were scores for service
affect related to institutional size as expressed by FTE enrollment?‖

88
Research in student engagement supports the idea that small institutions foster
more interpersonal contact between students and faculty, and student-faculty interaction
at small colleges occurs more frequently and in different ways than at large institutions
(Kezar, 2006, p. 100). The high level of faculty-student interaction typically found at
small institutions was expected to be related to higher service affect scores. As
anticipated, a Spearman‘s rho computation produced a statistically significant, negative
correlation between FTE enrollment and service affect dimension scores. A bivariate
linear regression confirmed that FTE enrollment would predict a small, statistically
significant portion of the total variance for service affect dimension scores.
Research Question Six
Research question six asked, ―To what extent, if any, is institutional investment in
the library, as expressed by library expenditures, related to scores for each of the three
dimensions, or to overall LibQUAL+™ scores?‖
Budgetary support for the library is related to most aspects of library operations
including human resources, technology infrastructure, and the development of library
collections. Therefore, higher expenditures were expected to be related to higher scores in
all of the LibQUAL+™ dimensions. An examination of the role of library expenditures
revealed that all of the LibQUAL+™ scores had statistically significant correlations with
library expenditures, and all of the correlations were negative. In fact, the correlations

89
between library expenditures and LibQUAL+™ scores represent the strongest
relationships identified in this study for each LibQUAL+™ score.
Conclusions, Implications, and Recommendations
On the basis of this study alone, all of the institutional factors that influence
LibQUAL+™ scores cannot be ascertained. From the results of this analysis, however, a
number of conclusions may be drawn that have implications for consideration by
practitioners. These conclusions also point to a number of potentially interesting
questions for future research.
Conclusions
The results of the data analyses in this exploratory study clearly indicated that
there were statistically significant relationships between the selected institutional
characteristics (FTE enrollment, Carnegie basic classification, library expenditures, and
expenditures per FTE), and LibQUAL+™ scores. The two strongest correlations were
with the scores for the information control dimension. Those correlations were with
library expenditures and with Carnegie basic classification, respectively.
All four of the LibQUAL+™ scores (service affect, information control, library
as place, and overall) were impacted, at least to some extent, by the institutional

90
characteristics considered in this study. Since the study found significant statistical
relationships between the institutional characteristics and each of the LibQUAL+™
scores, one may also conclude that knowing something about those characteristics for a
college or university may afford a better understanding of the LibQUAL+™ results
obtained in that institution‘s library. Because those statistically significant relationships
were found in this study, one might also conclude that some portion of the scores can be
attributed to institutional characteristics and the instrument may not measure only what it
was intended to measure.
Another conclusion one can begin to construct from the results of this study is that
library user expectations appear to play a critical role in user responses to the
LibQUAL+™ survey. Consider that one significant, though counterintuitive, result of
this study was a statistically significant, negative correlation between LibQUAL+™
scores and total library expenditures; for example, the more funding a library devoted to
acquiring information resources and creating the intellectual access tools needed for
using those resources, the lower its score for the information control dimension. While
initially surprising, this finding is consistent with the findings of a previous study in
which higher scores on the Association of Research Libraries‘ Membership Criteria
Index (Kyrillidou & Heath, 2004) were correlated with lower information control
dimension scores. A library‘s standing in the ARL Membership Index increases, in large
part, as the size of its collections increase, so larger collections were related to lower
information control dimension scores.

91
Kyrillidou and Heath (2004) interpreted that result as a reflection of the increased
expectations and demands of library users at research institutions. The idea that that
lower scores were the result of higher expectations might reasonably pertain to the
present study‘s finding that higher expenditures lead to lower information control
dimension scores. Since higher expenditures produce larger collections, and the largest
collections are in large research institutions, the conclusion that larger collections were
related to lower information control dimension scores may be interpreted as an indication
that those who use large research libraries simply have higher expectations of those
libraries than those who use other types of college or university libraries.
This conclusion may be an example of how the LibQUAL+™ survey scores
reflect the survey‘s foundation in the Gaps Model of Service Quality. The LibQUAL+™
survey was derived from the SERVQUAL instrument, which is based on the Gaps
Model of Service Quality. The Gaps Model assesses customer satisfaction and defines
service quality by identifying the differences, or gaps, between customer expectations
and customer perceptions of service (Parasuraman et al. 1985; Parasuraman et al. 1991).
Among the LibQUAL+™ dimension scores, those for the library as place
dimension had the lowest correlations with the institutional characteristics examined in
this study. Based solely on the results of this study, one might reasonably conclude that
there is only a weak relationship between library expenditures and library as place
dimension scores. An alternate interpretation of this finding, however, is that

92
improvements to library facilities are not adequately reflected in the variables selected for
this study.
Library facilities are built, expanded, and renovated on a periodic basis rather than
continually; the data for any single year, therefore, may simply be an inadequate base
from which to determine relationships between expenditures and library as place scores.
In addition, library construction, renovation, or expansion projects are frequently funded
in a capital projects budget that is separate and distinct from the institutional operating
budget. Similarly, technology acquisitions, upgrades, and replacements may be funded
from a central, institution-wide fund rather than within the library operating budget. With
those funding models, the full scope of investment in library facilities will never be
reflected in the annual library expenditures figures used in this study.
Service affect scores had a moderate, but statistically significant negative
correlation with FTE enrollment, as anticipated. Surprisingly, there was a slightly
stronger negative correlation between service affect and total library expenditures. One
explanation for this finding is that the expenditures may be a reflection of institutional
size, but that cannot be substantiated by the data available in the present study.
Only one previous study (Kyrillidou & Heath, 2004) was identified in the
literature review that specifically explored potential relationships between LibQUAL+™
scores and institutional characteristics. This previous study, however, used an earlier
version of the LibQUAL+™ survey instrument that had four dimensions (rather than the

93
current three dimensions), and used a different set of institutional characteristics for the
predictor variables than those selected for this study.
Implications for Practice
Since all four of the LibQUAL+™ scores were impacted to some extent by the
institutional characteristics considered in this study, the first implication for librarians to
consider is that LibQUAL+™ scores for their particular library may be affected by these
institutional characteristics. This insight may be useful as librarians design and
implement service quality improvements based on LibQUAL+™ results.
The LibQUAL+™ survey is a useful tool for assessing users‘ perceptions about
libraries and the second implication of this study for librarians to consider is that the
survey results should only be used as one component of an assessment strategy. Other
approaches or instruments must also be employed to elicit information about the
effectiveness of specific library collections, services, or programs; complementary
assessment information can then be considered along with the results from the
LibQUAL+™ survey for a fuller perspective about the library.
Finally, based on this study, library user expectations appear to play a critical role
in user responses to the LibQUAL+™ survey. User expectations are often based in
individual experiences with libraries; however, practitioners might consider the potential
role of library marketing or public relations efforts to influence user expectations.

94
Recommendations for Future Research
While it seems clear that there are relationships between institutional
characteristics and LibQUAL+™ scores, particularly between library expenditures and
LibQUAL+™ scores, the dearth of previous studies on this subject and the limitations of
the present study speak to the need for further investigation regarding these questions. If
some portion of LibQUAL+™ scores can be reliably predicted by institutional
characteristics, the validity of the instrument is a subject for future research.
The present study focused on the three LibQUAL+™ dimension scores and the
overall, weighted score. Future research might focus on an examination of the results
obtained from the comments box in LibQUAL+™. About 40% of all respondents choose
to add something in the comment box. The comments may support, contradict, or
explicate the numerical score results that were the focus of this study.
Further investigation of the relationship between information control dimension
scores and institutional type may provide insights into that relationship that were not
possible with the data used for the present study. A more reliable result is possible if a
more representative sample of institutions can be assembled.
The sample used in this analysis was a nonrandom, sample of convenience that
was drawn from a self-selected group: those libraries that opted to participate in
LibQUAL+™ in 2006. In addition to their differentiation from the population through
participation in the LibQUAL+™ survey, a review of the characteristics of the sample
institutions revealed that the sample libraries were not entirely representative of the total

95
population of American colleges and universities. For example, approximately 8% of the
sample was composed of doctoral degree-granting institutions, but among all
institutions, approximately 17% confer doctoral degrees. Conversely, master‘s degree-
granting institutions were somewhat overrepresented, composing about 48% of the
institutions in the sample as compared with about 38% of colleges and universities in the
population.
Related to the issue of a representative sample, future research might also
consider whether there are reliable differences among the results for different types of
institutions. If so, perhaps the instrument‘s scores should be adjusted to reflect that;
perhaps the survey should be adapted for other types of college and university libraries?
Future research might also consider an examination of the LibQUAL+™ scores
for each demographic sub-group within the pool of respondents. Is there a difference
between faculty responses and student responses? Are those differences the same at
different types of institutions? Are there differences among the academic disciplines? For
example, faculty members, who have used libraries and conducted research successfully,
are very likely to have a different view than students about whether collections meet their
needs and whether information resources are easily located. Similarly, faculty in the
humanities may use the library differently than faculty in mathematics; it would be
interesting to see whether that influences the way in which individual faculty members
respond to the LibQUAL+™ survey.

96
Summary
In this final chapter of the dissertation the research problem, research questions,
methodology, and results were summarized. The focus of the chapter, however, was
found in the sections that presented conclusions, discussed implications for practice, and
made recommendations for future research.
This study found statistically significant relationships between the institutional
characteristics selected for this study (Carnegie basic classification, FTE enrollment, and
library expenditures) and each of the four LibQUAL+™ scores. Based on the results of
the data analyses computed to address the research questions, several conclusions were
reached. First, each of the four LibQUAL+™ scores is affected by institutional
characteristics. A corollary is that knowing something about the institutional
characteristics of a college or university may afford a better understanding of the
LibQUAL+™ results obtained in that institution‘s library. Based on this study, one might
also conclude that if some portion of the scores can be attributed to institutional
characteristics, the instrument may not measure only what it was intended to measure.
Finally, this study supports the conclusion that library user expectations play an
important role in user responses to the LibQUAL+™ survey.
The implications for practitioners from this study include using the instrument as
one part of an overall assessment strategy; understanding the effect one‘s institutional

97
characteristics may have on scores, and considering the potential for library public
relations and marketing to impact user expectations.
The lack of previous studies on this subject, and the limitations of the present
study, suggest the need for future research. Such future investigations might include a
replication of this study with a more representative sample, an examination of the results
obtained from the comments box in LibQUAL+™, an exploration of the scores for each
demographic sub-group within the pool of respondents, or an analysis of whether there
are reliable differences predicted by institution type in LibQUAL+™ scores.

98
APPENDIX A
LibQUAL+ TM
SURVEY INSTRUMENT

99

100
[Questions 34 through 38 are used by each library to address local concerns.]
(Association of Research Libraries, 2007).

101
APPENDIX B
SCATTERPLOTS: CORRELATIONS OF LIBQUAL+ TM
SCORES AND LIBRARY
EXPENDITURES

102
Figure B1. Service Affect Dimension and Total Library Expenditures
$50,000,000.00$40,000,000.00$30,000,000.00$20,000,000.00$10,000,000.00$0.00
LibExp
8.00
7.50
7.00
6.50
6.00
Svc A
ffect

103
Figure B2. Information Control Dimension Scores and Total Library Expenditures
$50,000,000.00$40,000,000.00$30,000,000.00$20,000,000.00$10,000,000.00$0.00
LibExp
8.00
7.00
6.00
5.00
Info
Co
ntr
ol
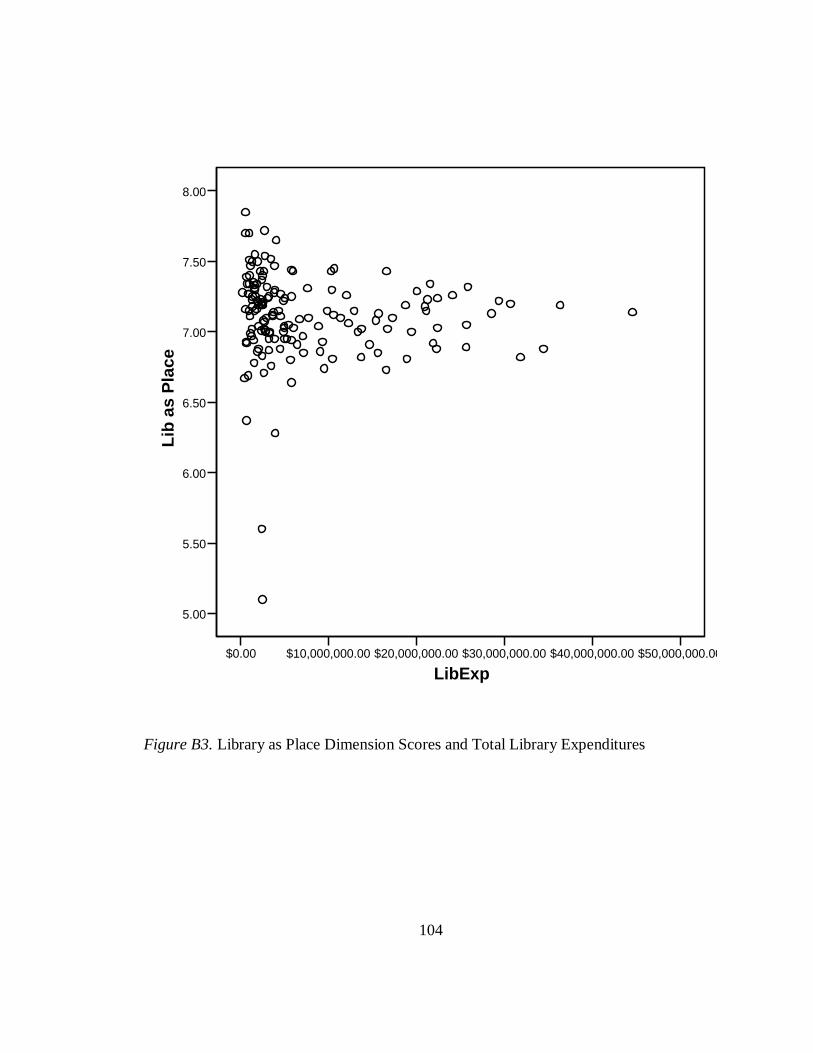
104
Figure B3. Library as Place Dimension Scores and Total Library Expenditures
$50,000,000.00$40,000,000.00$30,000,000.00$20,000,000.00$10,000,000.00$0.00
LibExp
8.00
7.50
7.00
6.50
6.00
5.50
5.00
Lib
as
Pla
ce

105
Figure B4. Overall Scores and Total Library Expenditures
$50,000,000.00$40,000,000.00$30,000,000.00$20,000,000.00$10,000,000.00$0.00
LibExp
8.00
7.50
7.00
6.50
6.00
Ov
era
ll

106
LIST OF REFERENCES
Arnau, R.C., Thompson, R.L., & Cook, C. (2001). Do different response formats change
the latent structure of responses?: An empirical investigation using taxonometric
analysis. Educational and Psychological Measurement, 61, 23-44.
Association of College and Research Libraries. (1998, June). Task force on academic
library outcomes assessment report. Retrieved June 15, 2007, from http://www
.ala.org/ala/acrl/ acrlpubs/whitepapers/taskforceacademic.htm
Association of Research Libraries. (2006). 2006 LibQUAL+™ survey highlights: Session
I & II: January – December. Retrieved June 13, 2007, from http://www.libqual
.org/Manage/ Results/Results_2006/index.cfm
Association of Research Libraries. (2007). Sample Screens from the LibQUAL+TM
Survey. Retrieved October 16, 2007 from http://www.libqual.org/Information/
Sample/index.cfm
Begay, W., Lee, D. R., Martin, J., & Ray, M. (1984). Quantifying qualitative data: Using
LibQUAL+™ comments for library-wide planning activities at the University of
Arizona. Journal of Library Administration, 40, 111-119.
Blixrud, J. (2001, August). The Association of Research Libraries statistics and
measurement program: From descriptive data to performance measures. Paper
presented at the 67th IFLA Council and General Conference, Boston, MA (Code
Number 034-135-E). Retrieved June 7, 2007 from http://www.ifla.org/IV/ifla67/
papers/034-135e.pdf
Carnegie Foundation for the Advancement of Teaching. (2006). Institutional Lookup
page for Carnegie Classifications. Retrieved June 17, 2007 from
http://www.carnegiefoundation .org/classifications/index.asp?key=782
Characteristics of excellence in higher education: Eligibility requirements and standards
for accreditation. (2006). Retrieved February 25, 2007, from the Middle States
Commission on Higher Education website http://www.msche.org/publications/
CHX06060320124919.pdf
Cohen, J. B., Fishbein, M., & Athola, O. T. (1972). The nature and uses of expectancy-
value models in consumer attitude research. Journal of Marketing Research, 9
456-460.

107
Cook, C. C. (2001). A mixed-methods approach to the identification and measurement of
academic library service quality constructs: LibQUAL+TM
. Dissertation Abstracts
International, 62(7), 2295A. Abstract retrieved June 17, 2007, from the ProQuest
Dissertations & Theses database.
Cook, C., Heath, F. & Thompson, B. (2002). Score norms for improving library service
quality: A LibQUAL+TM
study. portal: Libraries and the Academy, 2, 13-26.
Cook, C., Heath, F., & Thompson, B. (2003). Zones of tolerance in perceptions of library service
quality: A LibQUAL+ TM
study. portal: Libraries and the Academy, 3, 113-123.
Cook, C., Heath, F., Thompson, B., & Thompson, R.L. (2001a). LibQUAL+TM
: Service
quality assessment in research libraries. IFLA Journal 4, 264-268.
Cook, C., Heath, F., Thompson, B., & Thompson, R.L. (2001b). The search for new
measures: The ARL "LibQUAL+TM
" study--a preliminary report. portal:
Libraries and the Academy 1, 103-112.
Crosby, L. A. (1993). Measuring customer satisfaction. In E. E. Scheuing & W. F.
Christopher (Eds.), The service quality handbook (pp. 389-407). New York:
Amacom.
Crowe, W. J. (2003). The end of history? Reflections on a decade. ARL (226). Retrieved
October 17, 2006, from http://www.arl.org/newsltr/226/endofhistory.html
Davis, M. & Kyrillidou, M. (2007, January). LibQUAL+® 2007: An Introduction. Paper
presented at the Midwinter Meeting of the American Library Association, Seattle,
WA. Retrieved June 1, 2007, from http://www.libqual.org/documents/admin/
IntroductoryWorkshop.ppt
Gay, L. R., & Airasian, P. (2003). Educational research: Competencies for analysis and
applications (7th ed.). Upper Saddle River, NJ: Pearson Education.
Gratch-Lindauer, B. (1998). Defining and measuring the library's impact on campuswide
outcomes. College & Research Libraries, 59, 546-570.
Gratch-Lindauer, B. (2002). Comparing the regional accreditation standards: Outcomes
assessment and other trends. The Journal of Academic Librarianship 28, 14-25.
Haricombe, L. J., & Boettcher, B. J., (2004). Using LibQUAL+™ data in strategic
planning: Bowling Green State University. Journal of Library Administration, 40,
181-195.

108
Heath, F., Cook, C., Kyrillidou, M., & Thompson, B. (2002). ARL index and other
validity correlates of LibQUAL+™. portal: Libraries and the Academy 2, p. 27-
42.
Heinrichs, J. H., Sharkey, T., & Lim, J. (2005). Relative influence of the LibQUAL+™
dimensions on satisfaction: A subgroup analysis. College & Research Libraries,
66, 248-265.
Hernon, P. (2002). Quality: New directions in the research. The Journal of Academic
Librarianship 28, 224-231.
Hernon, P. & Nitecki, D. (2001). Service quality: A concept not fully explored. Library
Trends 49, 687-708.
Holton, B., Vaden, K., & O‘Shea, P. (2006). Academic Libraries: 2004. (NCES 2007-
301). U. S. Department of Education, Washington, DC: National Center for
Education Statistics. Retrieved June 13, 2007 from http://nces.ed.gov/pubs2007/
2007301.pdf
Ishikawa, K. (1985). What is quality control? (D. J. Lu, Trans.) Milwaukee, WI: Quality
Press. (Original work published 1984).
Kezar, A. J. (2006). The impact of institutional size on student engagement. NASPA
Journal (43)1, 87-114. Retrieved October 19, 2006, from http://publications
.naspa.org/naspajournal/vol43/iss1/art6
Knapp, A. (2004). We asked them what they thought, now what do we do? The use of
LibQUAL+™ data to redesign public services at the University of Pittsburgh.
Journal of Library Administration, 40, 157-171.
Kyrillidou, M. (2002). From input and output measures to quality and outcome measures,
or, from the user in the life of the library to the library in the life of the user. The
Journal of Academic Librarianship, 28, 42-46.
Kyrillidou, M. (2006). LibQUAL+™: A project from StatsQUAL™. In Association of
Research Libraries, 2006 survey results (pp. 4-5). Washington D.C.: Association
of Research Libraries.
Kyrillidou, M., & Heath, F. (2004). The starving research library user: Relationships
between library institutional characteristics and spring 2002 LibQUAL+TM
scores.
In F. M. Heath, M. Kyrillidou, & C. A. Askew (Eds.), Libraries act on their

109
LibQUAL+TM
findings: From data to action (pp. 1- 11). Binghamton, NY:
Haworth.
Lomax, R. G. (2001). An introduction to statistical concepts for education and
behavioral sciences. Mahwah, NJ: Lawrence Erlbaum Associates.
Oliver, R. L., & DeSarbo, W. S. (1988). Response determinants in satisfaction
judgments. Journal of Consumer Research, 14, 495-507.
Parasuraman, A., Berry, L. L., & Zeithaml, V. A. (1991). Refinement and reassessment
of the SERVQUAL Scale. Journal of Retailing 67, 420-450.
Parasuraman, A., Zeithaml, V. A., & Berry, L. L. (1985). A conceptual model of service
quality and its implications for future research. Journal of Marketing, 49(4) 41-
50.
Parasuraman, A., Zeithaml, V. A., & Berry, L. L. (1988). SERVQUAL: A multiple-item
scale for measuring consumer perceptions of service. Journal of Retailing, 64, 12-
40.
Peterson, R. Murphy, B. Holmgren, S. & Thibodeau, P. L. (2004). The LibQUAL+™
challenge: An academic medical center‘s perspective, Duke University. Journal
of Library Administration, 40, 83-98.
Pritchard, S. M. (1996). Determining quality in academic libraries. (Perspectives on
Quality in Libraries). Library Trends, 44, 572-595.
Roszkowsli, M. J., Baky, J. S., & Jones, D. B. (2005). So which score on the LibQual+™
tells me if library users are satisfied? Library & Information Science Research,
27, 424–439.
Shannon, D. M., & Davenport, M. A. (2001). Using SPSS to solve statistical problems: A
self-instruction guide. Upper Saddle River, NJ: Prentice-Hall.
Shim, W., McClure, C. R., & Bertot, J. C. (2001, December). Measures and statistics for
research library networked services: ARL e-metrics phase II report. ARL: A
bimonthly report, (no. 219). Retrieved June 5, 2007, from http://www.arl.org/
resources/pubs/br/br219/br219emetrics.shtml
Shorb, S. R., & Driscoll, L. (2004). LibQUAL+™ meets strategic planning at the
University of Florida. Journal of Library Administration, 40, 173-180.

110
StatSoft, Inc. (2007). Electronic Statistics Textbook. Retrieved September 1, 2007 from
http://www.statsoft.com/textbook/glosfra.html
Thompson, B. (2007). The origins/birth of LibQUAL+TM
. Retrieved May 25, 2007, from
http://www.libqual.org/About/Birth/index.cfm
Thompson, B., & Cook, C. (2002). Stability of the reliability of LibQUAL+TM
scores: A
"Reliability Generalization" meta-analysis study. Educational and Psychological
Measurement, 62, 735-743.
Thompson, B., Cook, C., & Heath, F. (2003). Structure of perceptions of service quality
in libraries: A LibQUAL+TM
study. Structural Equation Modeling, 10, 456-464.
Thompson, B., Cook, C., & Kyrillidou, M. (2005). Concurrent validity of LibQUAL+™
scores: What do LibQUAL+™ scores measure? Journal of Academic
Librarianship, 31, 517-522.
Thompson, B., Cook, C., & Kyrillidou, M. (2006a). Stability of library service quality
benchmarking norms across time and cohorts: A LibQUAL+TM
study. Paper
presented at the Asia-Pacific Conference of Library and Information Education
and Practice, Singapore, April 4-7, 2006. Retrieved June 10, 2007 from
http://www.coe.tamu.edu/~bthompson/libq2005.htm
Thompson, B., Cook, C., & Kyrillidou, M. (2006b). Using localized survey items to
augment standardized benchmarking measures: A LibQUAL+™ study. portal:
Libraries and the Academy 6, 219-231.
Thompson, B., Cook, C., & Thompson, R.L. (2002). Reliability and structure of
LibQUAL+TM
scores: Measuring perceived library service quality. portal:
Libraries and the Academy 2, 3-12.
Thompson, B., Kyrillidou, M., & Cook, C. & (2007). Library User‘s Service
expectations: A LibQUAL+®
study of the range of what users will tolerate.
Paper presented at the 7th Northumbria Conference on Performance Measurement
in Libraries and Information Services, Stellenbosch, South Africa, August 13,
2007.
United States Department of Education, National Center for Education Statistics,
Academic Libraries Survey (ALS), 2002.

111
University of California Libraries. (2005). Bibliographic services task force final report:
125 Rethinking how we provide bibliographic services for the University of
California. Retrieved February 22, 2007 from http://libraries
.universityofcalifornia.edu/sopag/BSTF/Final.pdf
Wei, Y., Thompson, B., & Cook, C. (2005). Scaling users' perceptions of library service
quality using Item Response Theory: A LibQUAL+TM
study. portal: Libraries
and the Academy, 5, 93-104.
Zeithaml, V., Parasuraman, A., & Berry, L. (1990). Delivering Quality Service:
Balancing customer perceptions and expectations. New York: Macmillan.