Embed Size (px)
Citation preview
7051
ISSN 2286-4822
www.euacademic.org
EUROPEAN ACADEMIC RESEARCH
Vol. II, Issue 5/ August 2014
Impact Factor: 3.1 (UIF)
DRJI Value: 5.9 (B+)
Service Quality and Customer Satisfaction:
Evidence from Pakistan Telecom Sector
UMM-E-AMEN
B.Com (Hons.)
Hailey College of Commerce
University of the Punjab, Lahore
Pakistan
BUSHRA ZULFIQAR M.A Economics
University of the Punjab, Lahore
Pakistan
MAJID ALI Assistant Professor
Hailey College of Commerce
University of the Punjab, Lahore
Pakistan
Abstract:
Modern technology shift has enlarged the competition domain
and broadened the choice of value-added services offered by the telecom
service providers. Telecom sector differs from other service sectors on
several grounds but the foremost is the customer switch out rate, which
is much higher in telecom sector than any other service sector. Cellular
companies need to enhance the quality of services to retain customers
for a longer period of time. The purpose of this study is to identify the
relationship between service quality and customer satisfaction in
telecom sector of Pakistan. Frequency, descriptive analysis, correlation
analysis and multiple regression analysis were applied on the data
and the results revealed that privacy, empathy, services offered and
reputation having the positive and significant relationship with
customer satisfaction while reliability, assurance and tangibility do
not have positive and significant relationship with customer
Umm-E-Amen, Bushra Zulfiqar, Majid Ali- Service Quality and Customer
Satisfaction: Evidence from Pakistan Telecom Sector
EUROPEAN ACADEMIC RESEARCH - Vol. II, Issue 5 / August 2014
7052
satisfaction in telecom sector within the region of Lahore, Pakistan.
The results also suggest to the telecommunication companies to
providing the better services to their customers while keeping the
variables used in this study.
Key words: Service quality, Customer satisfaction, Customer
perception, Customer expectations.
1. Introduction
It is desirous for every organization to have long life and
success. Various factors have potential to contribute to the
success of organization. It is not only the profit which adds to
the success of organization but it is also important to satisfy all
stakeholders. Among all stakeholders, customers are considered
most important. To retain and attract new customers is the life
blood of organizations. During last two decades, the service
oriented industry has become more popular and it has
comprised a prime area of the world economy. In the late 20th
century, three forces which are transport, television and
telecommunication, are considered as driving forces of economic
integration. Telecommunication services are viewed as a key
tool needed for the rapid growth and modernization of various
sectors of economy. Economy has to face various obstacles in
the absence of a sound telecom system.
Many companies related to telecommunication sector are
identifying, implementing and evaluating different marketing
strategies to retain and attract new customers. Quality and
customer satisfaction plays a vital role in the success,
profitability and survival of the organization. There is a direct
relation between quality and customer satisfaction as these two
concepts have been linked to customer behavioral intentions as
loyalty to that specific product, referral, and willingness to
spend for that product. (Olsen, 2002)
Umm-E-Amen, Bushra Zulfiqar, Majid Ali- Service Quality and Customer
Satisfaction: Evidence from Pakistan Telecom Sector
EUROPEAN ACADEMIC RESEARCH - Vol. II, Issue 5 / August 2014
7053
Competitive advantage through outstanding service
quality is an important weapon for the long life of business in
different sectors of industry and this trend is increasing day by
day. Restaurant is an important area but usually it is
neglected. However this industry has not been exempted from
the consideration of increased competition. The restaurant
industry is experiencing a dramatic transformation process in
Malaysia. (Kivela, Inbakaran, & Reece, 1999)
A study conducted by Reichheld & Sasser (1990) told
that close connection between customer retention and
profiability. According to Kaplan & Norton (2001), there is a
strong advocacy for taking customer retention as one of key
performance symbols.
In Pakistan, competition in cellular companies is very
tough as the number of players in this industry is few and they
can’t compromise on even a single element of performance. To
ascertain differentiation in the performance of companies,
quality is the most distinctive measure. This study aims to
enquire the relationship between service quality and customer
satisfaction in accordance with the elements of service quality
presented by (Parasuraman, Zeithaml, & Berry, 1988).
1.1 Objectives of the Study
1. To analyze the relationship between service quality and
customer satisfaction.
2. To analyze the developments and improvements
followed by the telecommunication sector to increase the
customers satisfaction.
3. To examine the satisfaction level of customers on the
basis of service quality provided by telecommunication
sector.
4. To examine the most influential variables in term of
service quality.
Umm-E-Amen, Bushra Zulfiqar, Majid Ali- Service Quality and Customer
Satisfaction: Evidence from Pakistan Telecom Sector
EUROPEAN ACADEMIC RESEARCH - Vol. II, Issue 5 / August 2014
7054
2. Literature Review
The telecom services are considered as a significant tool for
socio-economic development for any nation. Various sectors of
the economy require these support services for their rapid
growth and modernization. In the absence of a sound telecom
network system, an economy becomes disabling. The quality of
services is directly proportional to the customer satisfaction.
Loke, Taiwo, Salim, & Downe, (2011) used SERVQUAL
model for their study to check the influence of reliability,
empathy, responsiveness, tangible and assurance on customer
satisfaction. They used the regression analysis and the results
revealed that responsiveness, empathy, reliability and
assurance having positive relationship with customer
satisfaction. They also used t-test and show that there is a gap
between importance and perceived satisfaction. Parasuraman
and his companions developed a conceptual model regarding
service quality. They identified ten measures which are
tangible, reliability, responsiveness, competence, courtesy,
credibility, Security, access, communication, and understanding
the customer to measure service quality.
The study indicated that the variations between
expected performance and perceived performance of these ten
measures overall service quality. The limitation of this concept
is that it does not determine any particular service industry.
Later, this concept was revised and service quality was
perceived as “a global judgment, or attitude, related to the
superiority of the service” (Islam & Ali, 2011).
Ojo (2010) conducted study aimed at exploring the
relation between service quality and customer satisfaction with
a target on MTN (Mobile Telecommunication Network) Nigeria.
The population of his research consisted of 230 respondents and
research questions and objectives were formulated and tested.
Regression analysis and correlation coefficient were used in
testing their hypothesis. The study found positive relationship
between quality of services and customer satisfaction. The
Umm-E-Amen, Bushra Zulfiqar, Majid Ali- Service Quality and Customer
Satisfaction: Evidence from Pakistan Telecom Sector
EUROPEAN ACADEMIC RESEARCH - Vol. II, Issue 5 / August 2014
7055
researcher wrapped up the research with a recommendation
that the organizations should pay attention on quality of
services because of its impacts on customer satisfaction.
Organizations should appreciate suggestions from the
customers and should design new programmes to determine
quality of services and customer satisfaction.
2.1 Service Quality:
The term quality is defined by different people in different ways
as the definition of service quality may differ from situation to
situation or person to person. However the variance in the
definition of service quality is only in wording but typically the
concept is same. The definitions of service quality involve
determining whether the perceived service delivery meets the
expectations of customers or not. In this study the dimensions
which are taken as service quality are reliability, assurance,
tangibility, privacy, empathy, services offered and reputation.
2.1.1 Service quality Gap
A gap is defined as a variation or difference between perception
of customers about firm’s performance and customer’s
expectation.
Service Quality (SQ) = Customer’s Perception (P) – Customer’s
Expectations (E)
A comparison of Customer’s Expectation (E) regarding services
that should be offered by the organization versus Customer’s
Perceptions (P) about performance which is actually provided
by the service organization is termed as Service Quality (SQ).
Managing quality of services targets at the management
of gaps perceptions and expectations of customers. The
objective of the firm is to reduce the gap between customer’s
perceptions and expectation (Loke, Taiwo, Salim, & Downe,
2011).

Umm-E-Amen, Bushra Zulfiqar, Majid Ali- Service Quality and Customer
Satisfaction: Evidence from Pakistan Telecom Sector
EUROPEAN ACADEMIC RESEARCH - Vol. II, Issue 5 / August 2014
7056
2.2 Customer Satisfaction
Customer satisfaction can be defined as a personal feeling of a
customer of either contentment or disappointment found by
evaluation provided services by the organization to a specific
particular in relation to his expectations. Service providers pay
a great attention on customer satisfaction to achieve customer
retention. Customer satisfaction results in loyalty of customers.
High satisfaction of customers escorts to the repetition of
product purchase and visitation to stores. On the other hand
low customer’s satisfaction leads to complaining behavior (Loke,
Taiwo, Salim, & Downe, 2011).
Anderson, Fornell, & Lehmann (1994) found that service
industry is dependent on continual cycle of repurchare.
Therefore, customer’s retention demands hard work and efforts
by the organizations. Chen (2008) revealed that there is a
significant and positive effect of perceived value of services and
customer satisfaction on behavioral intentions to use that
product in future.
3 Conceptual Model and Development of Hypothesis
The variables of the model is borrowed from different studies
conducted in past. “Reliability”, “Assurance” and “Empathy” are
taken from (Ahmad, et al. 2010) while “Tangibility”,
“Reputation” and “Services offered” are taken from (Islam &
Ali, 2011) and the variable named “Privacy” is taken from the
(Sakhaei, Afshari, & Esmaili, 2013).

Umm-E-Amen, Bushra Zulfiqar, Majid Ali- Service Quality and Customer
Satisfaction: Evidence from Pakistan Telecom Sector
EUROPEAN ACADEMIC RESEARCH - Vol. II, Issue 5 / August 2014
7057
Figure 1 (Variables of model adopted from different studies)
Reliability------means to provide promised services.
Assurance-----refers to credibility, guarantee and
security to customers by organization’s employees using
their knowledge.
Tangibility-----define the physical attributes.
Privacy-------refers to state of being secure in terms of
personal data.
Empathy-----capacity to grasp and share feelings of
customers.
Services offered-----facilities offered by the organization.
Reputation---Good will and positive image among
customers and organization.
3.1 Hypothesis of study
On the bases of literature review the following hypothesis are
developed.
H0: There is no positive and significant relationship between
reliability and customer satisfaction in telecom sector.
H1: There is a positive and significant relationship between
reliability and customer satisfaction in telecom sector.
Customer Satisfaction (Dependent variable)

Umm-E-Amen, Bushra Zulfiqar, Majid Ali- Service Quality and Customer
Satisfaction: Evidence from Pakistan Telecom Sector
EUROPEAN ACADEMIC RESEARCH - Vol. II, Issue 5 / August 2014
7058
H0: There is no positive and significant relationship between
assurance and customer satisfaction in telecom sector.
H2: There is a positive and significant relationship between
assurance and customer satisfaction in telecom sector.
H0: There is no positive and significant relationship between
tangibility and customer satisfaction in telecom sector.
H3: There is a positive and significant relationship between
tangibility and customer satisfaction in telecom sector.
H0: There is no positive and significant relationship between
privacy and customer satisfaction in telecom sector.
H4: There is a positive and significant relationship between
privacy and customer satisfaction in telecom sector.
H0: There is no positive and significant relationship between
empathy and customer satisfaction in telecom sector.
H5: There is a positive relationship between empathy and
customer satisfaction in telecom sector.
H0: There is no positive and significant relationship between
services offered and customer satisfaction in telecom sector.
H6: There is a positive and significant relationship between
services offered and customer satisfaction in telecom sector.
H0: There is no relationship positive and significant between
reputation and customer satisfaction in telecom sector.
H7: There is a positive relationship between reputation and
customer satisfaction in telecom sector.
4. Methodology
This research is based on the primary data collected from youth
as majority of mobile users comprise youth. A structured
questionnaire was used for collection of data from Lahore and
Pakpattan Cities, as an instrument. A 5 point likert scale is
used to measure the willingness of respondents. This scale
includes 1 for strongly disagree, 2 for disagree, 3 for neutral, 4
for agree and 5 for strongly agree. Out of 120 respondents from
Lahore and Pakpattan were selected and 100 questionnaires
Umm-E-Amen, Bushra Zulfiqar, Majid Ali- Service Quality and Customer
Satisfaction: Evidence from Pakistan Telecom Sector
EUROPEAN ACADEMIC RESEARCH - Vol. II, Issue 5 / August 2014
7059
were received back as a response with a response rate 83%.
Questions in questionnaire was adopted from different studies
conducted in past which were suitable for measuring the
customer satisfaction in telecom sector.
5. Results and Interpretation
Demographic Variables
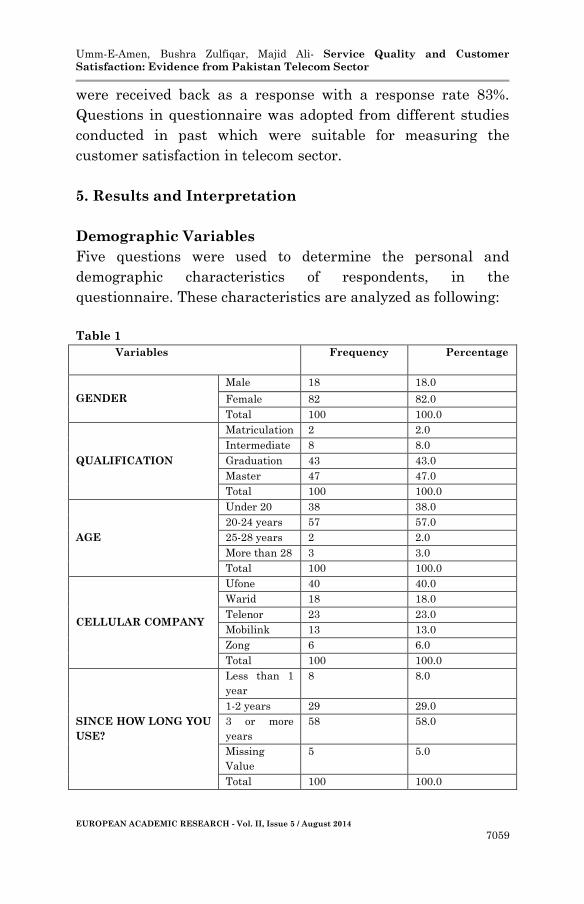
Five questions were used to determine the personal and
demographic characteristics of respondents, in the
questionnaire. These characteristics are analyzed as following:
Table 1
Variables Frequency Percentage
GENDER
Male 18 18.0
Female 82 82.0
Total 100 100.0
QUALIFICATION
Matriculation 2 2.0
Intermediate 8 8.0
Graduation 43 43.0
Master 47 47.0
Total 100 100.0
AGE
Under 20 38 38.0
20-24 years 57 57.0
25-28 years 2 2.0
More than 28 3 3.0
Total 100 100.0
CELLULAR COMPANY
Ufone 40 40.0
Warid 18 18.0
Telenor 23 23.0
Mobilink 13 13.0
Zong 6 6.0
Total 100 100.0
SINCE HOW LONG YOU
USE?
Less than 1
year
8 8.0
1-2 years 29 29.0
3 or more
years
58 58.0
Missing
Value
5 5.0
Total 100 100.0

Umm-E-Amen, Bushra Zulfiqar, Majid Ali- Service Quality and Customer
Satisfaction: Evidence from Pakistan Telecom Sector
EUROPEAN ACADEMIC RESEARCH - Vol. II, Issue 5 / August 2014
7060
Of 100 respondents, 82(82.0%) were female and 18(18.0%) were
male. Majority of respondents were found holding a master’s
level degree. Most of the respondents were between 20-24 years
old which shows that most of the respondents were young.
Majority of respondents (40%) were found using Ufone as
cellular company. 58% youngsters were using the related
cellular company since 3 or more years. SPSS version 15.0 was
used to analyze the data and the tests which were applied to
check the hypothesis of the study are as following: correlation
and multiple regressions analysis.
Descriptive Statistics
Table 2
Variables N Mean
Reliability 100 3.5150
Assurance 100 3.6200
Tangibility 100 3.3050
Privacy 100 3.4640
Empathy 100 3.4480
Services Offered 100 3.2860
Reputation 100 3.5125
Customer Satisfaction 100 3.5180
Valid N (list wise) 100
Table 2 shows the descriptive statistics including dependent
and independent variables of this research. Analysis revealed
that Reliability, Reputation and Customer satisfaction do have
the mean value 3.51which mean that the customers have
slightly agree with these services. While the Assurance having
the highest means value 3.62 which mean that customers have
also slightly agree with this service.

Umm-E-Amen, Bushra Zulfiqar, Majid Ali- Service Quality and Customer
Satisfaction: Evidence from Pakistan Telecom Sector
EUROPEAN ACADEMIC RESEARCH - Vol. II, Issue 5 / August 2014
7061
Correlations Analysis
Table 3
Variables 1 2 3 4 5 6 7 8
Reliability
Pearson
Correlation 1 .408(**) .567(**) .476(**) .627(**) .356(**) .482(**) .374(**)
Sig. (2-
tailed) .000 .000 .000 .000 .000 .000 .000
N 100 100 100 100 100 100 100 100
Tangibility
Pearson
Correlation .408(**) 1 .392(**) .430(**) .399(**) -.012 .309(**) .229(*)
Sig. (2-
tailed) .000 .000 .000 .000 .903 .002 .022
N 100 100 100 100 100 100 100 100
Assurance
Pearson
Correlation .567(**) .392(**) 1 .656(**) .481(**) .137 .362(**) .261(**)
Sig. (2-
tailed) .000 .000 .000 .000 .173 .000 .009
N 100 100 100 100 100 100 100 100
Privacy
Pearson
Correlation .476(**) .430(**) .656(**) 1 .459(**) .288(**) .491(**) .401(**)
Sig. (2-
tailed) .000 .000 .000 .000 .004 .000 .000
N 100 100 100 100 100 100 100 100
Empathy
Pearson
Correlation .627(**) .399(**) .481(**) .459(**) 1 .286(**) .376(**) .379(**)
Sig. (2-
tailed) .000 .000 .000 .000 .004 .000 .000
N 100 100 100 100 100 100 100 100
Services
Offered
Pearson
Correlation .356(**) -.012 .137 .288(**) .286(**) 1 .359(**) .277(**)
Sig. (2-
tailed) .000 .903 .173 .004 .004 .000 .005
N 100 100 100 100 100 100 100 100
Reputation
Pearson
Correlation .482(**) .309(**) .362(**) .491(**) .376(**) .359(**) 1 .527(**)
Sig. (2-
tailed) .000 .002 .000 .000 .000 .000 .000
N 100 100 100 100 100 100 100 100
Customer
Satisfaction
Pearson
Correlation .374(**) .229(*) .261(**) .401(**) .379(**) .277(**) .527(**) 1
Sig. (2-
tailed) .000 .022 .009 .000 .000 .005 .000
N 100 100 100 100 100 100 100 100
** Correlation is significant at the 0.01 level (2-tailed).
* Correlation is significant at the 0.05 level (2-tailed).
Table 3 shows the correlation analysis between variables.
Reliability shows the value r=.374 and p value=.000 which
means that there is weak positive and significant relationship

Umm-E-Amen, Bushra Zulfiqar, Majid Ali- Service Quality and Customer
Satisfaction: Evidence from Pakistan Telecom Sector
EUROPEAN ACADEMIC RESEARCH - Vol. II, Issue 5 / August 2014
7062
between reliability and customer satisfaction. Tangibility shows
the r=.229 and p value=.002 which means that there is very
weak positive and significant relationship between tangibility
and customer satisfaction. Assurance shows the r=.261 and p
value=.009 which also means that there is very weak positive
and significant relationship between assurance and customer
satisfaction. Privacy and empathy show the r=.401 and r=.379
with p value .000 and .000 respectively. Which mean both
privacy and empathy have weak positive and significant
relationship with customer satisfaction. Reputation and
Services offered have also positive and significant relationship
with customer satisfaction because r=.277, r=.527 and p
value=.005, p value= .000 respectively.
Model Summary
Table 4
Model R R Square Adjusted R
Square
Std. Error of
the Estimate
1 .578 .334 .283 .51629
Predictors: (Constant), reputation, tangibility, services Offered,
assurance, empathy, privacy, reliability
Table 4 shows the summary of the model which contains the
adjusted R square=.283 which is also called goodness of fit of
our model. R square=.283 shows that there is 28.3% variation
in depend variable customer satisfactionwith due to all
independent variables.
ANOVA (b)
Table 5
Model
Sum of
Squares
df Mean
Square
F Sig.
1 Regression 12.284 7 1.755 6.584 .000(a)
Residual 24.523 92 .267
Total 36.808 99

Umm-E-Amen, Bushra Zulfiqar, Majid Ali- Service Quality and Customer
Satisfaction: Evidence from Pakistan Telecom Sector
EUROPEAN ACADEMIC RESEARCH - Vol. II, Issue 5 / August 2014
7063
a Predictors: (Constant), reputation, tangibility, services offered, assurance,
empathy, privacy, reliability
b Dependent Variable: customer satisfaction
Table 5 shows the overall significant level of our model. F value
6.584>2 and p value .000<.001 which mean that our model is
statistically significant.
Coefficients (a)
Table 6
Model
Unstandardized
Coefficients
Standardized
Coefficients t Sig.
B
Std.
Error Beta B
Std.
Error
1 (Constant) 1.693 .396 4.271 .000
Reliability .047 .116 .052 .409 .684
Assurance -.101 .127 -.100 -.800 .426
Tangibility -.009 .084 -.011 -.104 .917
Privacy .140 .102 .173 1.369 .100
Empathy .139 .096 .165 1.441 .055
Services
offered .031 .081 .038 .384 .067
Reputation .282 .079 .380 3.595 .001
a Dependent Variable: customer satisfaction
Table 6 shows the beta coefficients and p values of the variables
individually. Reliability (β=.04, p<.684) which means that
Reliability is not significantly related with customer
satisfaction.Hence our first alternative research hypothesis H1
is rejected i.e. there is positive and significant relationship
between reliability and customer satisfaction. Assurance (β=- -
.101, p<.426) which is also not significantly related to customer
satisfaction. Hence H2 is also rejected i.e. there is positive and
significant relationship between assurance and customer
satisfaction. Tangibility (β= -.04, p<.684) which is also not
statistically significant. H3 is also rejected i.e. there is positive
and significant relationship between tangibility and customer
satisfaction. Our alternative hypothesis H4, H5, H6 and H7are
Umm-E-Amen, Bushra Zulfiqar, Majid Ali- Service Quality and Customer
Satisfaction: Evidence from Pakistan Telecom Sector
EUROPEAN ACADEMIC RESEARCH - Vol. II, Issue 5 / August 2014
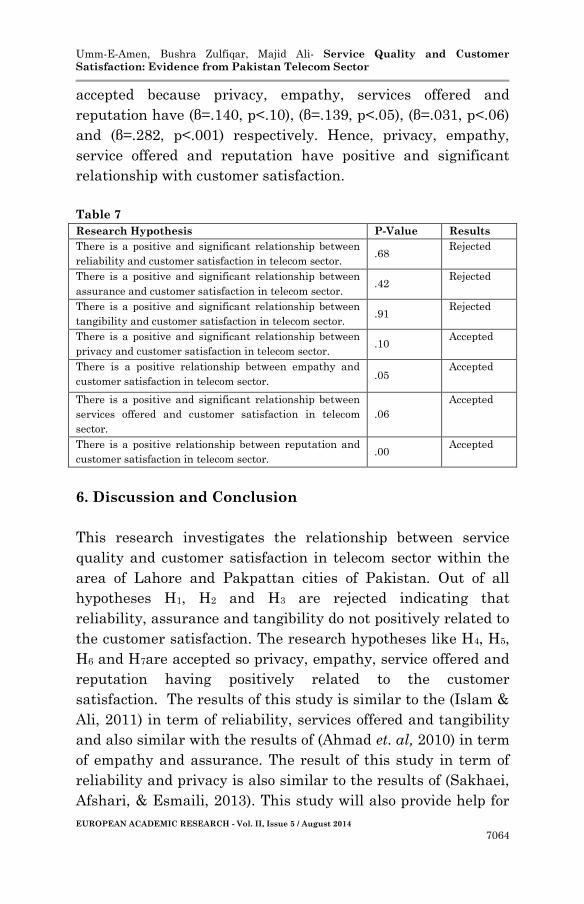
7064
accepted because privacy, empathy, services offered and
reputation have (β=.140, p<.10), (β=.139, p<.05), (β=.031, p<.06)
and (β=.282, p<.001) respectively. Hence, privacy, empathy,
service offered and reputation have positive and significant
relationship with customer satisfaction.
Table 7
Research Hypothesis P-Value Results
There is a positive and significant relationship between
reliability and customer satisfaction in telecom sector. .68
Rejected
There is a positive and significant relationship between
assurance and customer satisfaction in telecom sector. .42
Rejected
There is a positive and significant relationship between
tangibility and customer satisfaction in telecom sector. .91
Rejected
There is a positive and significant relationship between
privacy and customer satisfaction in telecom sector. .10
Accepted
There is a positive relationship between empathy and
customer satisfaction in telecom sector. .05
Accepted
There is a positive and significant relationship between
services offered and customer satisfaction in telecom
sector.
.06
Accepted
There is a positive relationship between reputation and
customer satisfaction in telecom sector. .00
Accepted
6. Discussion and Conclusion
This research investigates the relationship between service
quality and customer satisfaction in telecom sector within the
area of Lahore and Pakpattan cities of Pakistan. Out of all
hypotheses H1, H2 and H3 are rejected indicating that
reliability, assurance and tangibility do not positively related to
the customer satisfaction. The research hypotheses like H4, H5,
H6 and H7are accepted so privacy, empathy, service offered and
reputation having positively related to the customer
satisfaction. The results of this study is similar to the (Islam &
Ali, 2011) in term of reliability, services offered and tangibility
and also similar with the results of (Ahmad et. al, 2010) in term
of empathy and assurance. The result of this study in term of
reliability and privacy is also similar to the results of (Sakhaei,
Afshari, & Esmaili, 2013). This study will also provide help for
Umm-E-Amen, Bushra Zulfiqar, Majid Ali- Service Quality and Customer
Satisfaction: Evidence from Pakistan Telecom Sector
EUROPEAN ACADEMIC RESEARCH - Vol. II, Issue 5 / August 2014
7065
all cellular companies like Jaz, Ufone, Warid, Telenor and Zong
to improve their services according to the demands of their
customers. The model of this study can also be used for any
other sector to check the services especially in banking sector
due to the huge competition among all kinds of banks.
7. Limitations of the study
The sample size is very small due to the time constraints so the
results can be more significant if the sample size increased.
This study is conducted in Lahore and Pakpattan cities so the
results may be vary in other cities of the Pakistan due to the
difference in customs and traditions of the people. The data is
collected from only the youngsters so the results may be
different if the people included in the sample with different
ages.
REFERENCES
Ahmed, M. 2008. The Role of Microcredit in Poverty Alleviation.
Allama Iqbal Open University, Islamabad. Islamabad: Allama
Iqbal Open University Library.
Ahmad, I., Nawaz, M. M., Usman, A., Shaukat, M. Z., Ahmad, N., &
Iqbal, H. 2010. “Impact of Service Quality on Customers
Satisfaction: Empirical evidence from telecom sector of
Pakistan.” Interdisciplinary Journal of Contemporary
Research in Business 1(12): 98-113.
Akram, M. & Hussain, R. I. 2011. “The Role of Microfinance in
uplifting Income Level.” Interdisciplinary Journal of
Contemporary Research in Bus. II(11): 83-94.
Alam, K. 2012, March 14. Retrieved from The Express Tribune:
http://tribune.com.pk/story/349586/do-lenders-know-what-
microfinance-really-is/
Anderson, E. W., Fornell, C., & Lehmann, D. R. 1994. “Customer
satisfaction, market share,and profitability: findings from
Sweden.” Journal of Marketing 58: 53-66.

Umm-E-Amen, Bushra Zulfiqar, Majid Ali- Service Quality and Customer
Satisfaction: Evidence from Pakistan Telecom Sector
EUROPEAN ACADEMIC RESEARCH - Vol. II, Issue 5 / August 2014
7066
Bank, W. 2002. Globalization, Growth and Poverty: Building an
Inclusive World Economy. New York: Oxford University Press.
Charles, A., J., James, K., & Hamed, A. B. 2011. “Impact of
Microfinance on Poverty Alleviation in Nigeria: An Empirical
Investigation.” European Journal of Humanities and Social
Sciences 2(1): 97-111.
Chen, C. F. 2008. “Investigating structural relationships between
service quality, perceived value, satisfaction, and behavioral
intentions for air passengers: Evidence from Taiwan.”
Transportation Research. Part A 42: 709-717.
Ebimobowei, A., Sophia, J. M., & Wisdom, S. 2012. “An Analysis of
Microfinance and Poverty Reduction in Bayelsa State of
Nigeria.” Kuwait Chapter of Arabian Journal of Business and
Management Review 7: 38-57.
Faiza, G. 2012. Success Stories. Retrieved from Pakistan Microfinance
network:
http://www.microfinanceconnect.info/success_stories.php
Irobi, N. C. 2008. Microfinance and Poverty Alleviation. A Case of
Obazu Progressive Women Association Mbieri, Imo state –
Nigeria. 1-50.
Islam, S. U., & Ali, M. B. 2011. “Measuring Service Quality of Banks:
An Empirical Study.” Research Journal of Finance and
Accounting 2(4): 74-85.
Kaplan, R. S., & Norton, D. P. 2001. “The Strategy-focused
Organization: How Balanced Scorecard Companies Thrive in
the new Business Environment.” Harvard Business School
Press.
Kivela, J., Inbakaran, R., & Reece, J. 1999. “Consumer research in the
restaurant environment. Part 1: research design and
analytical methods.” International Journal of Contemporary
Hospitality Management 11(6): 269-286.
Latifee, I. H. 2000. “Microfinance and Poverty Reduction: Experiences
of Grameen Operation in Asia.” The Potential and Limitations
of Economic Initiatives in Grassroots Development –Current
Issues and Asian Experiences. pp. 1-11.
Loke, S. P., Taiwo, A. A., Salim, H. M., & Downe, A. G. 2011. “Service
quality and customer satisfaction in a telecommunication
service provider.” International proceedings of economics
development and research 11: 24-29.
Umm-E-Amen, Bushra Zulfiqar, Majid Ali- Service Quality and Customer
Satisfaction: Evidence from Pakistan Telecom Sector
EUROPEAN ACADEMIC RESEARCH - Vol. II, Issue 5 / August 2014
7067
Malik, A. K., Malki, I., & Imai, S. K. 2012. Microfinance and its role in
house hold poverty reduction: finding from Pakistan.
Manchester: Brooks world poverty institute.
Management, Oxford Policy. 2006. Poverty and Social Impact
Assessment: Pakistan Microfinance Policy.
Nabi, M., & Aima, A. 2012. “Availability and Awareness of
Microfinance in Jammu & Kashmir State.” International
Journal of Research in Commerce, Economics & Management
2(2): 40-48.
Nouman, M., Khan, F., & Khattak, A. H. 2010. “Availability of
Microfinance & Its Impact on Economic Growth: A Case Study
of Rural Areas of Khyber Pakhtunkhwa.” Journal of
Managerial Sciences IV(2): 190-200.
Ojo, O. 2010. “The relationship between service quality and customer
satisfaction in the telecommunication industry: evidence from
Nigeria.” BRAND (broad research in accounting, negotiation,
and distribution 1(1): 88-100.
Olsen, S. O. 2002. “Comparative evaluation and the relationship
between quality, satisfaction, and repurchase loyalty.”
Academy of Marketing Science 30(3): 240-249.
Parasuraman, A., Zeithaml, V. A., & Berry, L. L. 1988. “SERVQUAL:
A Multiple-Item Scale for Measuring Consumer Perceptions of
Service Quality.” Journal of Retailing 64(1): 12-40.
Reichheld, F. F., & Sasser, W. E. 1990. “Zero Defections: Quality
Comes to Services.” Harvard Business Review 68(5): 105–112.
Sakhaei, S. F., Afshari, A. J., & Esmaili, E. 2013. “The Impact of
Service Quality on Customer Satisfaction in Internet
Banking.” Journal of mathematics and computer 9: 33-40.
Saleem, M. A., Zaman, K. U., & Khattak, B. K. 2010. “Impact of Micro
finance in Raising the Living Standard of People of D.I.Khan.”
Journal of Managerial Sciences IV(1): 75-86.