Embed Size (px)
Citation preview
Page 1
Server Architectures:Processors and Memories
René J. ChevanceJanuary 2005
Page 2
© RJ Chevance
Forewordn This presentation belongs to a set of presentations about
server architectures. They are based on the following book:
Serveurs Architectures: Multiprocessors, Clusters, Parallel Systems, Web Servers, Storage Solutions
René J. ChevanceDigital Press December 2004 ISBN 1-55558-333-4
http://books. elsevier.com/
This book has been derived from the following one:
Serveurs multiprocesseurs, clusters et architectures parallèles
René J. ChevanceEyrolles Avril 2000 ISBN 2-212-09114-1
http://www.eyrolles.com/
The English version integrates a lot of updates as well as a new chapter on Storage Solutions.
Contact: www.chevance.com [email protected]

Page 2
Page 3
© RJ Chevance
Contentsn Introduction
è Processors and Memory (this document)o Semiconductors and microprocessorso Memory Hierarchyo Binary Compatibility – Java - Architecture Retargetingo Economic Aspects of Microprocessors
n Input/Outputn Evolution of Software Technologiesn Symmetric Multi-Processorsn Cluster and Massively Parallel Machinesn Data Storagen System Performance and Estimation Techniquesn DBMS and Server Architectures n High Availability Systemsn Selection Criteria and Total Cost of Possessionn Conclusion and Prospects
Page 4
© RJ Chevance
Processors and Memory

Page 3
Page 5
© RJ Chevance
Semiconductors and Microprocessorsn Evolution of Processor Performance
n Moore’s First Law:o Density of integrated circuits doubles every eighteen months
n Derivation: microprocessor performance doubles every eighteen monthsn Observation: microprocessor performance doubles every:
o ~22 monthso ~19 months according to the « Road Maps » of microprocessor vendors
0,1
1
10
100
1000
10000
1970 1975 1980 1985 1990 1995 2000
Per
form
ance
Super Ordinateur
Mainframe
Mini
Micro
Note: The performance numbers in the chartare givenas multiples of the processingcapability of a minicomputer of the endof the 1970’s. As can be seen on this chart,the growth of microprocessor performancefar outpaces that of the other types ofprocessor. It should be noted that thefigure plots raw performance, a measureof the intrinsic power of the processorsrather than reflecting the processingcapability available to actual applications
Page 6
© RJ Chevance
Semiconductorsn Moore’s Law illustrated
o Growth of the number of transistors in successive Intel processors (after Intel)
o Similar patterns can be observed for microprocessors from other vendors
1000
10000
100000
1000000
10000000
100000000
1000000000
Num
ber
of t
rans
isto
rs p
er c
hip
Pentium ProPentium
80486DX
80386DX
80286
8086
8080
4004
Pentium II Pentium III Xeon
Pentium 4

Page 4
Page 7
© RJ Chevance
Semiconductors(2)
1
10
100
1000
10000
1966 1976 1986 1996 2006
Year
Co
st o
f a
CM
OS
fab
($M
, 19
95) d
olla
rs 1
995
In October 2001, Intel announced that it had invested $2Bin the construction of a new fab at Chandler (Arizona).
This fab will construct chips on 8 inch wafers using a 0.13µ technology.Constructing the fab took 18 months and 4200 workers.
0,1
1
10
100
1940 1960 1980 2000 2020
Production Year
Feat
ure
size
(m
icro
ns)
For comparison, note that the diameter of a human hair is of the order of 70 µ (70 microns)
1
1 0
100
1940 1960 1980 2000 2020
Production Year
Ch
ip s
ize
(mm
)
If n is the minimum feature size:
• maximum frequency of operation varies as 1/n• maximum number of devices per unit areavariesas 1/n2.
Thus improvement in lithography has a potentialfor an 1/ n3 improvement in microprocessor capability.
Page 8
© RJ Chevance
Semiconductors(3)
n Evolution of the capacity of DRAM chipsand a 64-chip Memory System o Memory system built with 64 memory chips (excluding
chips for data integrity)
1
10
100
1000
10000
100000
1000000
10000000
1970 1975 1980 1985 1990 1995 2000 2005
Th
ou
san
ds
of
bit
s p
er M
emo
ry C
hip
1K bits
4K bits
16K bits
64K bits
256K bits1M bits
4M bits16M bits
64M bits
256M bits
512K bytes
2M bytes
8M bytes
32M bytes
128M bytes
512M bytes
2G bytes
Cap
acit
y o
f a 6
4-ch
ip M
emo
ry S
yste
m
1G bits 8G bytes

Page 5
Page 9
© RJ Chevance
Semiconductors(4)n Semiconductor Technology Projections
o DRAM Capacity Projections (Source: [ITR03])
o Microprocessor Characteristics Projection (source [ITR03])
DRAM Chip Capacity (Gbits)Production Dates
0
10
20
30
4050
6070
2001 2003 2005 2007 2009 2011 2013 2015 2017
2004 2006 2008 2010 2012 2016 2018Transistors (millions) 553 878 1393 2212 3511 8848 14405Total number of pins 1600 1936 2354 2782 3338 4702 5426Thermal Dissipation (W) 158 180 200 218 240 288 300On-chip Frequency (Mhz) 4171 3906 10972 15079 20065 39683 53207
Page 10
© RJ Chevance
Memory Hierarchyn Fact: Growing gap between memory chip access time and
processor cycle time
n Chip access time is just a part of memory access time e.g.
Evolution of the Ratio of Memory Chip Access Time to Microprocessor Cycle Time
0
20
40
60
80
100
120
1985 1990 1995 2000 2005
Mem
ory
Chi
p A
cces
s Ti
me
/Pro
cess
or C
ycle
Tim
e
Time to communicate the address on the bus
(20 ns)
Memory access time(100 ns)
Verification of data integrity with error detecting and correcting code (ECC)
(10 ns)
Time to communicate the data on the bus
(40 ns)Request the bus(10 ns)
DRAM refreshtime
(negligible)

Page 6
Page 11
© RJ Chevance
Memory Hierarchy[2]n Exploiting space-time locality properties
o if a piece of information is accessed, there is a high probability that it will be accessed again in the near future (temporal locality);
o if a piece of information is accessed, there is a high probability that nearby (in memory) information will be also accessed in the near future (spatial locality)
n Cache principle :maintaining, in a level of fast memory, the data which are most frequently accessed at a given moment (implemented in hardware for efficiency)
n Echange between memory levels on a granule basis (or cache block) e.g. 64 or 128 bytes
Add
ress
Time
Temporal Locality
Spa
tial
Lo
calit
y
Page 12
© RJ Chevance
Memory Hierarchy[3]n Levels of memory in a system
n Illustration of the differences between the characteristics of the various levels of the memory hierarchy
External cache Main Memory (Disk Cache)
Processor
SRAM cache
10-20 ns
DRAM Memory150 ns
Disk Cache
Internal cache(s)
1 ns (L1)4-16 ns (L2-L3)
Registers
0.1 ns
Disks
Secondary Memory(Tape Cache)
6 ms
Tape Library
10 s
Technology Typical Access Time Human Scale Approximate Capacity
Approximate Price ($/MB)
Processor Register 100ps 0.1 s 64 x 64 bits (part of microprocessor)
Integrated Cache L1: ~ 1ns L2-L3 4-16 ns depending on cache size
16 s fraction of a MB up to several MB
(part of microprocessor)
External cache 10-20 ns ~10-20 s 4-8 MB ~$10Main memory ~150 ns ~25 min >= 1GB $0.125Disk ~6 ms ~700 days > 70 GB/disk ~$0.005Tape (in a robot) ~10 s ~ 3200 years ~100GB/tape < $0.001

Page 7
Page 13
© RJ Chevance
Memory Hierarchy[4]
n Example of memory apparent access time (Level 1 and Level 2 caches, DRAM memory) assuming hit ratios of 95% et 98% (Level 1 and 2 respectively)
memory_apparent_access_time = 0.95 x 1 + 0.03 x 10 + 0.02 x 150 = 4.25 ns
n Cache design parameters:o Cache block sizeo Separate caches or unified cacheo Placement of blocks within a cache
l Fully Associativel Direct Mappedl Set Associative
o Virtual or physical addressing o Block replacement strategyo Write strategy (Write Through, Write Back)o Write to a missing blocko ….
n Cache coherency problems (see SMP)
Page 14
© RJ Chevance
Memory Hierarchy[5]n Problem: memory throughput demand from microprocessors is
growing faster than memory capabilitesn Organizations for the improvement of memory throughput:
n Design issues:o Wide memories: modularity, costo Interleaved memories: modularity
Processor
Cache
Bus
Memory
(a) - One word wide Memory
Bus
Processor
Cache
Memory
(b) - Multi-word Wide Memory
Processor
Bus
Memory Bank
0
Memory Bank
1
Memory Bank
2
Memory Bank 3
Cache
(c) - Interleaved Memory

Page 8
Page 15
© RJ Chevance
Memory Hierarchy[6]
n Synthesis
Cache Type and Properties
Level 1 and Level 2 External Disk cache External Storage Hierachy
Where it’s found internal to the processor between microprocessor and main memory
in memory on disk
Technology SRAM integrated into the microprocessor
SRAM DRAM Disk
What’s cached External cache or memory contents
DRAM contents Disk contents Contents of tape cartridges in a robot
CharacteristicsCapacity O(10 KB/100 KB) O(1 MB) O(100 MB) O(1 GB)Granule size O(10/100 B) O(100 B) O(10 KB) O(100 KB)Access time 3 ns 15 ns ~ 180 ns ~ 6 msbandwidth O(GB/s) O(GB/s) O(1 GB/s) O(100 MB/s)Who manages the cache
Hardware (internal to the microprocessor)
Hardware (internal to the microprocessor)
Software, either the Operating System, the file system or the DBMS
Software: the memory hierarchy manager
Remark: The notation O(N) means “of the order of N”; so that O(100 B), for example, means “of the order of 100 bytes - certainly more than 10, and certainly less than 1000”.
Page 16
© RJ Chevance
Microprocessors

Page 9
Page 17
© RJ Chevance
Microprocessorsn Several years ago, there was a strong debate about RISC
(Reduced Instruction Set Computer) and CISC (Complex Instruction Set Computer) approaches. Due to their larger market and the associated revenues, a CISC architecture (x86) was able to recover the intial performance gap with RISC architectures.
n Extension of IA-32 architecture to support 64 bits (both AMD and Intel) will extent the life of this architecture
n Symmetric Multiprocessors have specific requirements on processors:o Memory coherenceo Memory consistencyo Synchronization mechanisms
This will be discussed in the SMP presentation.
n Performance benchmarks will be discussed in the « System Performance and Estimation Techniques » presentation
Page 18
© RJ Chevance
Microprocessor Performancen Processor Performance Équation
Time/Task = Instructions/Task x Cycles/Instruction x Time/Cycle
o Contributing factorsl Instructions per Task:
¡ Choice of algorithm, optimizing compiler, …¡ Architecture suitability to support the application
l Cycles per instruction:¡ Optimizing compiler, architecture characteristics, architecture
implementation (or micro-architecture) with features like pipeline, superscalar , super-pipeline, out-of-order, multi-threading,....)
l Cycle time:¡ Technology, architecture characteristics, architecture implementation
n Performance improvement through parallelism. Two complementary approaches:
o At instruction level: ILP (Instruction Level Parallelism), simul taneous execution of instructions (decreasing the cycles/instruction component of the equation)
o At process/thread level: TLP (Thread Level Parallelism), simultaneous execution of several instruction flows

Page 10
Page 19
© RJ Chevance
Microprocessor Performance[2]
n ILP (Instruction Level Parallelism). According to measurements on current architectures, limited to 5 to 6 instructionso Possible ways to increase ILP:
l Creating a new ISA (Instruction Set Architecture) e.g. IA-64 (Itanium) from Intel/HP, VLIW (Very Large Instruction Word) such as Transmeta’sCrusoe
l Improving architecture implementation (micro-architecture). Note: such techniques apply both to existing ISA as well as to new ISAs¡ Out-of-order execution¡ Register renaming¡ Speculative execution¡ Branch prediction….
n TLP pour Thread Level Parallelism (improving system throughput)o Possible ways (non-exclusive)
l SMT - Simultaneous MulTithreading¡ Several threads are sharing the same processing resources (e.g. commuting
processing from one thread to another one once a thread is waiting for DRAM memory)
¡ Example: Pentium 4 (Hyperthreading)l MPC - MultiProcessor Chip (several processor cores on the same chip)
¡ Several independent processors (cores) one the samechip¡ Example : IBM’s Power5 which is a dual core chip, each processor being a 2-
way SMT
Page 20
© RJ Chevance
Microprocessor Performance[3)
n Limiting factors for microprocessor performance:o Data level dependencieso Branches:
l Unconditional branch (target instruction not present in the cache)
l Conditional branch:target instruction is determined by evaluation of a condition (this is an example of a data dependency)
o Waits caused by interactions with the memory hierarchy
o Sequential nature of the instruction flow imposed by many ISAs

Page 11
Page 21
© RJ Chevance
Micro-architectures
n Illustration of parallelism in a sequence of instructions
n Basic Pipelined Processor
Sequence 1 Sequence 2 load r1< -(r2) add r3< -r3+1 fpadd r5< -r6+r7
add r3<-r3+1 add r4<-r3+r2 store r4-> (r5)
Level of parallelism = 3 Level of parallelism = 1
Instruction fetch
Decode Execution
Write results
Successive instructions
Time in clock cycles
0 1 2 3 4 5 6 7 8 9 10
Issue rate = 1
Operation latency = 1
Required parallelism = 1
Potential throughput = 4 x unpipelined processor
Page 22
© RJ Chevance
Micro-architectures[2]n Illustration of (two simples cases of) conflicts in a pipeline
n Super-pipelinedo Improving the number of instructions executed per cycle
through increasing the number of stages in the pipeline
Instruction fetch
Decode Execution
Write results
Successive Instructions
Time in clock cycles
0 1 2 3 4 5 6 7 8 9 10
ii+1
i+2i+3
i+4
i+5i+6
i+8i+7
I+4 is using the result produced by i+3
I+5 is a conditional branch

Page 12
Page 23
© RJ Chevance
Micro-architectures[3]
n Superscalar
Instruction fetch
Decode Execution
Write results
SuccessiveInstructions
0 1 2 3 4 5 6 7 8 9
Time in clock cycles
Issue rate = N (2 here)
Operation latency = 1
Required parallelism = 2 (2 here)
Potential throughput = N x basic pipelined processor
Page 24
© RJ Chevance
Superpipeline/Superscalar Comparison
n Super-pipelinedo Moderate increase in chip complexityo Critical elements:
l Interfaces with caches and address translationl Need for storage elements (latches) in front of
each pipe stage
l Usually requires high frequencies to get high performance
n Superscalaro Increasing the degree of superscalarity
increases complexity super-linearly

Page 13
Page 25
© RJ Chevance
Very Long Instruction Word (VLIW)
n Principle: Architecture with instructions composed by several primitives operations able to be executed in parallel
n Primitive operations within an instruction are determined at compile time:o Microprocessor complexity, by comparison with a
superscalar implementation is decreased since parallelism is detected by the compiler
n Difficulties:o Compilers must extract enough parallelism from
source programs (otherwise instructions are composed mostly of no-operations (NOPs))
o Generated code must take into account the degree of parallelism supported by the processor. So, it is necessary to recompile programs or to use a binary translator (detrimental to performance)
Page 26
© RJ Chevance
VLIW(2)
n Exemple of a VLIW processor with 3 operations per instruction
n Few probant experiences for general purposecomputing:o Multiflow (out of business)o Source of inspiration for IA-64o Transmeta (IA-32 compatible)
0 1 2 3 4 5 6 7 8 9
SuccessiveInstructions
Instruction fetch
Decode Execution
Write results
Time in clock cycles

Page 14
Page 27
© RJ Chevance
Itanium
n ConceptP
erfo
rman
ce
CISC RISC
OOO SuperScalar
Time
�Complex, variable length instructions.�Sequencing done in hardware
�Simple, fixed length instructions�Sequencing done by compiler
�H/W detects implicit parallelism�H/W O-O-O scheduling & speculation�H/W renames 8-32 registers to 64+
EPICExplicitlyParallelInstructionComputing
ExplicitlyParallelInstructionComputing
Arch.Research
Source Intel/HP
Page 28
© RJ Chevance
Itanium(2)n EPIC Objectives
o Performance and the potential for continued performance improvement over a long period
o Software Compatibility:l IA-32 (direct support)l HP-PA (through code translation)
o Scalability: different implementations may have different levels of parallelism
o Large address spaceo Performance: EPIC addresses the following limiting
factors:l Branches (predication)l Memory latency (speculative load)l Instruction level parallelism:
¡ exhibited by the compilers¡ instructions are grouped in bundles (3 instructions) and a
descriptor tells the processor about instruction dependencies
Page 15
Page 29
© RJ Chevance
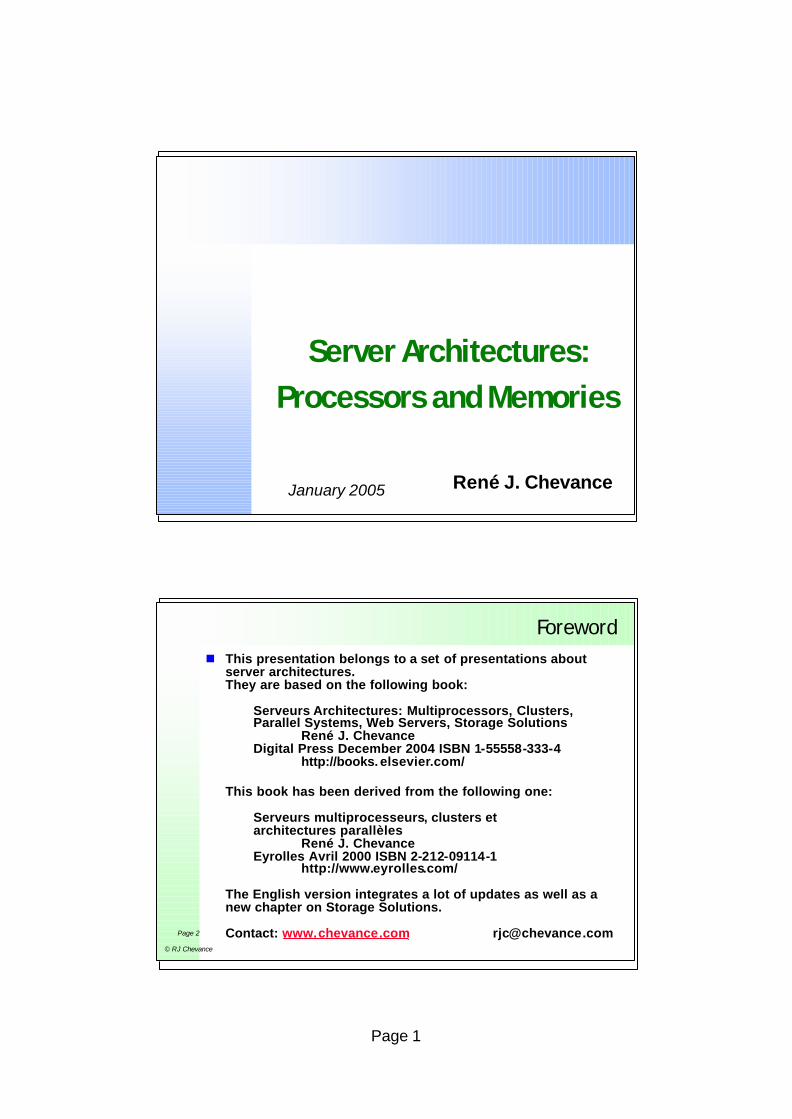
Performance improvement Techniquesn Overview of performance improvement techniques
(at single instruction flow level)o Speculative execution
l A guess is made about the outcome of a conditional branch and execution proceeds as if the guess were true; to handle the cases when the guess is wrong, the processor has resources which allow it, effectively, to backtrack and try again.
o Out of order execution and register renamingl Out of order is a technique which aims to minimize the
effects of inter-instruction data dependencies and waits caused by cache misses. Register renaming is a companion technique. A machine with out of order execution may execute instructions in an order quite different from that obtained by simple sequential execution of the program (although its internal mechanisms will ensure that the results it gets are the same as sequential execution would have provided, of course).
l Execution of instructions waiting for data is suspended and the execution continue with instructions which follows. Execution of suspended instructions is resumed when data is available
Page 30
© RJ Chevance
Performance improvement Techniques(2)n Out of order execution
n Register renaming
e1 : load r3, ….add r2,r3, ….….….
e2 : load r3, …sub r3,r4, …….
load r1<-xload r2<-yadd r3<-r6+r7load r16<-bstore r16->astore r3->zadd r8<-r1+r2
If we assume that either or both x and y are notpresent in the data cache, the microprocessor startsexecution of the following instructions before thememory hierarchy has delivered the values for thefirst two instructions
e1 : load ir17, ….add ir18,ir17, ….….….
e2 : load ir37, …sub ir37,ir21, …….
Original Instruction Sequence
Mapped sequence – the two sub-sequences can be executed in parallel
(architected registers are mapped to implementation registers
Register renaming extends the number of registers (at implementation level) providing capability for parallel execution in an instruction stream. This technique is particularly useful for CISCarchitectures where the number of architected registers is small .

Page 16
Page 31
© RJ Chevance
Performance improvement Techniques(3)n Branch prediction
o The microprocessor maintains a table (a cache) of most probable target instruction for each conditional branch. The microprocessor is then able to start excution of the probable target instruction without waiting for the test to decide. Of, course, in case of miss prediction, the microprocessor will have to « undo ».
n Dynamic Code Translationo Instructions are translated into simpler instructionso Examples:
l Intel Pentium Pro and follow-on l AMDl Transmeta’s Crusoe (IA-32 ⇒ VLIW)
n Trace cacheo Refinement on branch prediction technique: simply identify
sequences of instructions which are executed - omitting the branches - and cache the most frequent sequences (called traces, the cache being the trace cache)
Page 32
© RJ Chevance
Architecture Evolution Processn Looking at the historical record, processor
architectural evolution tends to develop as a repeating two-phase phenomenon - a stability phase being followed by a breakaway phaseo Stability phase:
l Concentration on implementation refinement while thearchitectures remain essentially unchanged
l Such an evolution does not change the established equilibrium
l Example: evolution of CISC at the beginning of the 80’s
n In parallel, technology evolution changes theequilibrium and led to a breakaway phase (non-homotetic evolutions):o Evolution of memory capacity and optimizing compilers
which led to RISC architectures
n In a breakaway phase, there is a flock of new ideas , as usual, the market will « make the selection »

Page 17
Page 33
© RJ Chevance
Processor-Memory-I/O Interconnect
n Connections in a generic system architectureProcessor& cache(s)
I/O Controller I/O Controller
or
Processor /System Controller Interconnect
SystemController
Processor& cache(s)
Processor& cache(s)
Interconnect to I/OControllers
Inte
rcon
nect
tom
agne
tic s
tora
ge
I/O Controller
Inte
rcon
nect
tosu
bsys
tem
s
LAN WAN
Memory
Bus or Cross Bar
I/O Bus e.g. PCi
e.g. Fibre Channel
e.g. ATA, SCSI
Note: These connections will be discussed in Input/Output and SMP presentations
Page 34
© RJ Chevance
Binary CompatibilityJava
Architecture Retargeting

Page 18
Page 35
© RJ Chevance
Binary Compatibility
n Levels of compatibility
Statically-linkedLibraries
Dynamically- linkedLibraries
SourceProgram
Compilersand
Linkers
Executable Program
OperatingSystem
APIApplication Programming
Interface
ABIApplication Binary
Interface
SALSystem Abstraction
Layer
Hardware
Page 36
© RJ Chevance
Binary Compatibility(2)n Binary compatibility is a consquence of:
o Processor architecture (Instruction Set Architecture)o OS-imposed addressing conventionso Interfaces between the application and the OS and with the
librarieso Conventions for data representation
n Binary level is the standard level for software distributionn Binary compatibility is an obstacle to the introduction of new
architectures and/or new OSesn An attempt to relieve the problems of binary compatibility: JAVA
(Sun)o Derived from C++o Generation of portable code (called byte code) to interpreted by
a virtual machine (JVM for Java Virtual Machine) independent from architectures
o Applications may be downloaded (over a network) on demand:l Applets (client side applications)l Servlets (server side applications)

Page 19
Page 37
© RJ Chevance
Binary Compatibility(3)n Differences between compilation and interpretation
Pre-compiler Interpreter[with helpfrom debugging system]
Development Environment
Editor
Execution Environment
SourceProgram
InterpretablePrograms
Other programs
Libraries Data Results
b) - Interpretation
a) - Compilation
Compiler Loader
Executing program
Development Environment
Editor Linker
Execution Environment
Debugging System
SourceProgram
Object Program
Staically -Linked
Libraries
Other ObjectPrograms
ExecutableProgram
Dynamically - linkedlibraries
Data Results
Page 38
© RJ Chevance
Binary Compatibility(4)
n Java : Write Once, Run Everywhere
Applicationsource code
Compilation
Application(Java Byte code)
Archiving(server level)
Application(Byte code)
Application loads on demand
Interpreter(Java Virtual Machine)
Operating System
Hardware
Compilation(JIT- Just In Time)
Application(binary)
OperatingSystem
Hardware
Application Creation Application Execution
Java ClassLibraries
Page 20
Page 39
© RJ Chevance
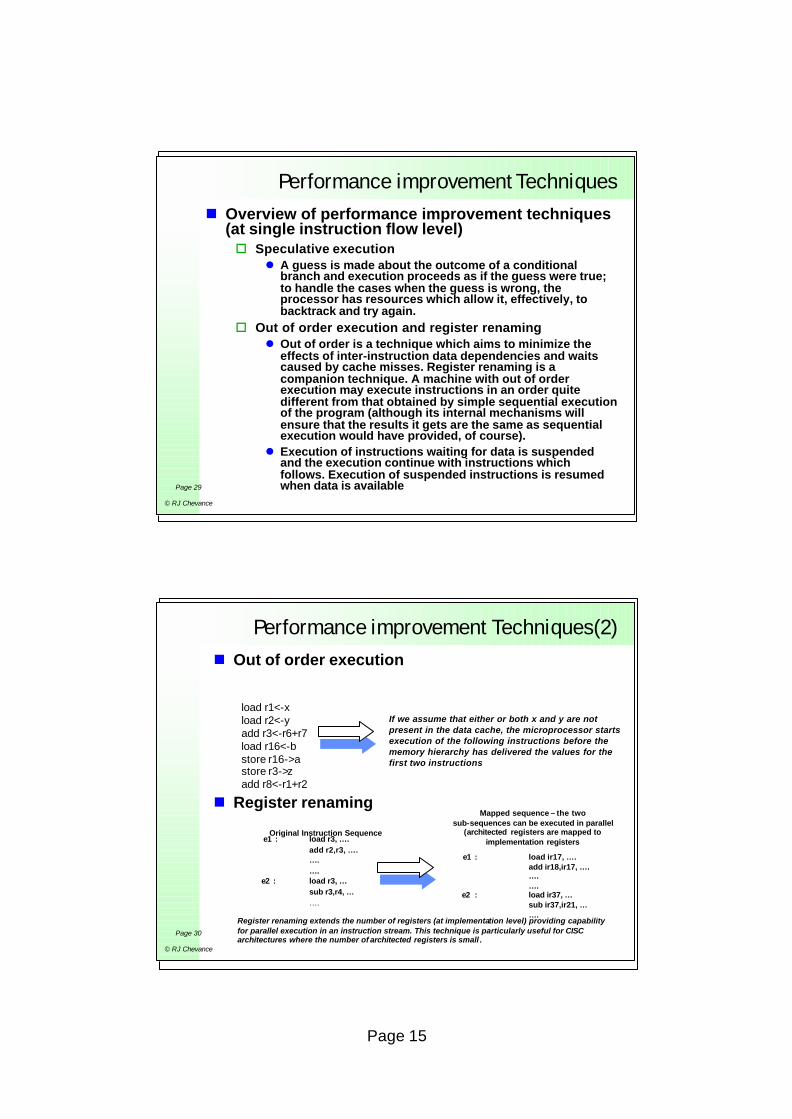
Architecture Retargeting
n The processing power of current microprocessors allows the support of aplications and OS developed for other architectures
n Several approaches have been used:o Retargeting compilers to a new architecture
l e.g. Tandem (proprietary to RISC),
o Emulationl Many proprietary architectures
o Binary Translation: static or dynamic (DOCT for Dynamic Object Code Translation)l IA-32 on RISC or on VLIW (Transmeta)l Proprietary architectures
Page 40
© RJ Chevance
Architecture Retargeting(2)
n Example of emulation: Bull’s DPS7000GCOS7 on IA-32Windows (Diane)
Application GCOSApplication GCOSApplication GCOSApplication GCOS
Application GCOSApplication GCOSGCOS ApplicationGCOS Application
GCOS7GCOS7
CP
UFi
rmw
are
CP
UFi
rmw
are
CP
UFi
rmw
are
CP
UFi
rmw
are
IOPIOP SAMSAM
Windows 2000Windows 2000
V70
00
ctrlctrl ctrlctrl
Intel Processors Intel Processors
High Speed Link GOS7/INTEROPHigh Speed Link GOS7/INTEROP
Win
dow
s A
pplic
atio
n
Services and Gateway INTEROP
Diane General Architecture

Page 21
Page 41
© RJ Chevance
Architecture Retargeting(3)n FX!32: IA-32 to RISC (Alpha)
o Because it is impossible for a static analysis to distinguish between code and data in an IA-32 binary, FX!32 uses a mixed approach:l Program execution begins in emulation mode, which makes it
possible to identify the portions of the program which are instructions
l Once the executable instructions are identified, they can be translated into directly-executable Alpha code
Transparency Agent
Server
Emulator and Execution
Library
Binary Translator
TranslatedImages
ExecutionProfiles
IA-32Image
Instruction SetDatabase
General diagram of FX!32
Page 42
© RJ Chevance
Economic Aspects of Microprocessors

Page 22
Page 43
© RJ Chevance
Economic Aspects of Microprocessors
n Evolution of the server market share for various architectures (Source Gartner 2003)
Notes:• By 2003: number of server units sold was 5.3 millions of which IA-32 based servers represented 1.4 million units (IDC)
• By 2003: server revenue was $45.7B (IDC)• PC market in 2004: 191.4 millions units and $132.8B ( ISuppli)• According to Intel, 1 billion x86 processors have been soldby april 2003 and about 2 billions will have been sold by 2008
Page 44
© RJ Chevance
Economic Aspects of Microprocessors[2]n 32-64 bit Microprocessor Market for embedded
applications
o 8 and 16 bit microprocessors dominates 32-64 bit microprocessors in terms of volumes
o Success on one market does not implies success in the other one
o The market for embedded microprocessors is expected to reach $8.6B by 2006 (inStat)
0
100
200
300
400
500
600
700
1996 1997 1998 1999 2000 2001 2002 2003
Un
its
sold
(m
illio
ns)
Processors for EmbeddedApplications
Processors for PC's
Page 23
Page 45
© RJ Chevance
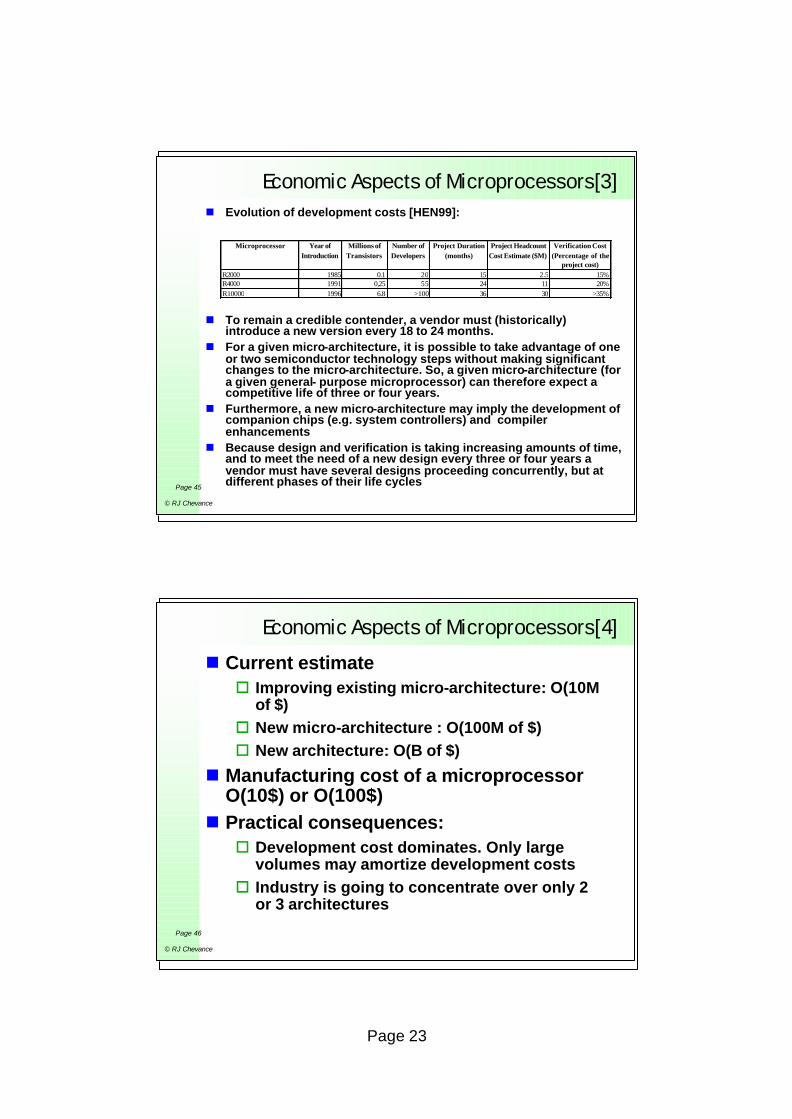
Economic Aspects of Microprocessors[3]n Evolution of development costs [HEN99]:
n To remain a credible contender, a vendor must (historically) introduce a new version every 18 to 24 months.
n For a given micro-architecture, it is possible to take advantage of one or two semiconductor technology steps without making significantchanges to the micro-architecture. So, a given micro-architecture (for a given general- purpose microprocessor) can therefore expect a competitive life of three or four years.
n Furthermore, a new micro-architecture may imply the development of companion chips (e.g. system controllers) and compiler enhancements
n Because design and verification is taking increasing amounts of time, and to meet the need of a new design every three or four years avendor must have several designs proceeding concurrently, but atdifferent phases of their life cycles
Microprocessor Year of Introduction
Millions of Transistors
Number of Developers
Project Duration (months)
Project Headcount Cost Estimate ($M)
Verification Cost (Percentage of the
project cost)R2000 1985 0.1 20 15 2.5 15%R4000 1991 0,25 55 24 11 20%R10000 1996 6.8 >100 36 30 >35%
Page 46
© RJ Chevance
Economic Aspects of Microprocessors[4]
n Current estimateo Improving existing micro-architecture: O(10M
of $)o New micro-architecture : O(100M of $)o New architecture: O(B of $)
n Manufacturing cost of a microprocessor O(10$) or O(100$)
n Practical consequences:o Development cost dominates. Only large
volumes may amortize development costso Industry is going to concentrate over only 2
or 3 architectures