Embed Size (px)
Citation preview
International Journal of
Molecular Sciences
Article
Serum Metabolomic Profiling IdentifiesCharacterization of Non-ObstructiveAzoospermic Men
Zhe Zhang 1, Yingwei Zhang 2, Changjie Liu 3, Mingming Zhao 3, Yuzhuo Yang 1, Han Wu 1,Hongliang Zhang 4, Haocheng Lin 1, Lemin Zheng 3,* and Hui Jiang 1,*
1 Department of Urology, Peking University Third Hospital, Beijing 100191, China;[email protected] (Z.Z.); [email protected] (Y.Y.); [email protected] (H.W.);[email protected] (H.L.)
2 Department of Nephrology, General Hospital of Jinan Military, Jinan 250000, China;[email protected]
3 The Institute of Cardiovascular Sciences, the Institute of Systems Biomedicine,School of Basic Medical Sciences, and Key Laboratory of Molecular Cardiovascular Sciences of Ministry ofEducation, Peking University Health Science Center, Beijing 100191, China; [email protected] (C.L.);[email protected] (M.Z.)
4 Department of Human Sperm Bank, Peking University Third Hospital, Beijing 100191, China;[email protected]
* Correspondence: [email protected] (L.Z.); [email protected] (H.J.);Tel.: +86-10-8280-5452 (L.Z.); +86-10-8226-6161 (H.J.)
Academic Editor: Ting-Li (Morgan) HanReceived: 9 November 2016; Accepted: 12 January 2017; Published: 25 January 2017
Abstract: Male infertility is considered a common health problem, and non-obstructive azoospermiawith unclear pathogenesis is one of the most challenging tasks for clinicians. The objective of thisstudy was to investigate the differential serum metabolic pattern in non-obstructive azoospermicmen and to determine potential biomarkers related to spermatogenic dysfunction. Serum samplesfrom patients with non-obstructive azoospermia (n = 22) and healthy controls (n = 31) were examinedusing high-performance liquid chromatography-tandem mass spectrometry (HPLC-MS/MS). Serummetabolomic profiling could differentiate non-obstructive azoospermic patients from healthy controlsubjects. A total of 24 metabolites were screened and identified as potential markers, many of whichare involved in energy production, oxidative stress and cell apoptosis in spermatogenesis. Moreover,the results showed that various metabolic pathways, including D-glutamine and D-glutamatemetabolism, taurine and hypotaurine metabolism, pyruvate metabolism, the citrate cycle andalanine, aspartate and glutamate metabolism, were disrupted in patients with non-obstructiveazoospermia. Our results indicated that the serum metabolic disorders may contribute to the etiologyof non-obstructive azoospermia. This study suggested that serum metabolomics could identifyunique metabolic patterns of non-obstructive azoospermia and provide novel insights into thepathogenesis underlying male infertility.
Keywords: non-obstructive azoospermia; metabolomic; serum; HPLC-MS/MS; biomarkers
1. Introduction
Infertility has become a major health problem, affecting 8%–15% of reproductive-age couplesworldwide, and half of these infertility cases are due to male factors [1]. Azoospermia is the most serioustype of male infertility and is mainly classified into obstructive azoospermia (OA) and non-obstructiveazoospermia (NOA) [2]. Most OA is caused by epydidimal duct obstruction or congenital bilateral
Int. J. Mol. Sci. 2017, 18, 238; doi:10.3390/ijms18020238 www.mdpi.com/journal/ijms

Int. J. Mol. Sci. 2017, 18, 238 2 of 14
absence of the vas deferens and exhibits normal spermatogenesis. Conversely, NOA generally resultsfrom idiopathic spermatogenic dysfunction of unknown etiology. NOA is the most challenging taskfor clinicians because even patients with severe oligospermia, asthenospermia, or OA could obtaina satisfactory outcome by assisted reproductive technology (ART), while patients with NOA rarely canfather their own genetic offspring. Moreover, the pathogenesis of NOA is still unclear. Therefore, it isimperative to investigate the molecular mechanism underlying NOA and seek a potential treatment.
The routine evaluations to diagnose male infertility include physical examination, semen analysis,endocrine detection and other additional tests such as sperm DNA fragmentation and geneticscreening [1]. Although there is an improvement in diagnostic methods, these methods still cannotsatisfy the demand of clinical diagnosis, and a substantial proportion of male infertility patients cannotdiscover a specific cause for their defect. With the development of systems biology, approaches havebeen applied to address the complexity underlying human diseases [3]. “Omics” analyses could providenovel insights at a molecular level into physiological and pathological statuses, including genomic,proteomic, to the metabolomic analyses, in a comprehensive biology fashion [4]. Recently, genomic andproteomic studies have revealed several potential etiologies and identified some potential biomarkers ofmale infertility. Metabolomics is an approach to detect a broad range of small molecules (metabolites) inbiological samples and provides a global biological fingerprint of metabolic signatures linking geneticand environmental factors within living organisms [5]. It may provide advantages that genomic andproteomic approaches do not have; thus, the assessment of metabolomics represents not only theend-product of gene/protein expression, but also the ultimate cellular signaling events resulting frominteraction between genome/proteome and environmental stimuli and is closer to the actual phenotype.
Recently, interest has increased in the metabolomics approach to characterize and decipher maleinfertility [6]. Oligozoospermic infertile men showed altered urinary metabolic profiles comparedwith the fertile control population, and this differentiation indicates that oligozoospermia may haveresulted from energy and antioxidative perturbations in spermatogenesis [7]. Serum metabolic analysisrevealed different metabolic activity patterns in a group of uncontrolled subjects with differentsperm concentrations and identified protein complement C3f as a potential biomarker [5]. Further,the metabolomics approach was used to detect testicular tissue of NOA, and the results revealed thatphosphocholine concentrations were significantly lower in Sertoli-cell-only testes compared with normalcases [8]. These studies indicate the potential of the metabolomics approach applied to the investigationof male infertility.
The serum metabolome can represent global functional changes of living organism, and serummetabolites were used to investigate etiologies and predict pathological states in numerous complexdisorders [9]. Previous study has demonstrated that serum metabolic changes are associatedwith oligozoospermic male infertility [5]. However, serum metabolomic profiles have not beenwell characterized in azoospermia to date. It is acknowledged that high-performance liquidchromatography-tandem mass spectrometry (HPLC-MS/MS) provides characteristics of accuracy,stability and sensitivity in metabolomics [10]. In the present study, we examined the metabolomicprofiles of serum samples from patients with NOA and fertile controls with a novel approach ofHPLC-MS/MS technology. Our study found unique serum metabolic characteristics in NOA comparedwith normal controls, which suggests that the disruption of metabolism may contribute to the etiologiesof NOA. Further studies with larger sample scale and more strict criteria to examine the metabolicstatus in azoospermia are warranted.
2. Results
2.1. Demographics of Study Participants
A total of 22 NOA patients and 31 normal control subjects were enrolled in this study. There wasno significant difference in terms of age between the infertile group and healthy controls. In the groupof infertile cases, patients with azoospermia were identified on biopsy as having maturation arrest(MA) or a Sertoli-cell only (SCO) histological state. The clinical features are shown in Table 1.

Int. J. Mol. Sci. 2017, 18, 238 3 of 14
Table 1. Clinical features and biopsy results of azoospermic patients and normal subjects.
Clinical Features NC NOA
Total number 31 22Age (Years, Mean ± SD) 28.1 ± 4.5 30.6 ± 4.3
Testosterone < 14 nmol/L NA 2FSH > 11.1 mIU/mL NA 9
Biopsy findings NAMaturation arrest 12Sertoli-cell only 10
Cytology findings NASpermatids or sperm 5
NA, not applicable; FSH, follicle stimulating hormone; NC: normal control; NOA: non-obstructive azoospermia.
2.2. Multivariate Statistical Analysis of Metabolic Profiles
The typical base peak chromatographic profiles showed a visible difference between NOA andnormal controls, and spectral peaks were labeled with their corresponding metabolites (Figure 1).To compare the metabolomes between azoospermia infertile and control groups, multivariate statisticalanalysis was performed. In the preliminary analysis of these data, the unsupervised principalcomponent analysis (PCA) was employed to explore clustering in the different groups. As shownin Figure 2A, although there was a small overlapping region between the azoospermic group andcontrol cases, a trend of separation was observed in the two groups (R2(X) = 0.588, Q2 = 0.115,4 components). Subsequently, the entire dataset was identified by a further supervised analysis ofpartial least squares-discriminant analysis (PLS-DA). The mode improved the clustering segregationbetween the two groups, and a distinct separation of azoospermia from the fertile cases was obtained(Figure 2B), and the performance parameters were as follows: R2(X) = 0.277, R2(Y) = 0.874, Q2 = 0.676,two components. The permutation test (100 random permutations) also revealed the PLS-DA methodwas reliable: the calculated R2 (explained variance) and Q2 (predictive ability of the model) valueswere lower than the original ones in the validation plot, and the regression line of Q2 intersected withthe ordinate axis was below zero (intercepts: R2 = (0.0, 0.287); Q2 = (0.0, −0.275)); and no overfittingdata was detected (Figure 2C).
1
Figure 1. Representative base peak intensity chromatographic profiles of healthy control subject (A);and non-obstructive azoospermic patients (B).

Int. J. Mol. Sci. 2017, 18, 238 4 of 14Int. J. Mol. Sci. 2017, 18, 238 4 of 14
Figure 2. Multivariate statistical analysis of serum metabolic profiling in patients with non-obstructive azoospermia (NOA) and normal controls (NC). (A) principal component analysis (PCA) score plot; (B) partial least squares-discriminant analysis (PLS-DA) score plot; (C) statistical validation of established PLS-DA model with permutation analysis (100 random permutations).
As shown in Figure 3A, an even clearer discriminative profile was observed in orthogonal partial least squares-discriminant analysis (OPLS-DA) score plot (R2(X) = 0.466, R2(Y) = 0.931, Q2 = 0.797, four components, p value of coefficient of variationanalysis of variance (CV ANOVA) = 1.28 × 10⁻¹¹), implying that the serum metabolic disruption was significant in the patients with NOA. However, there is no distinct segregation in the patients with different histology of MA and SCO. In addition, the 80% samples were used to build a training set of OPLS-DA, and the 20% samples remaining (test set) were subjected to the model. In addition, we found that all samples were correctly predicted in both the azoospermic infertile group and the healthy group (Figure3B).
Figure 3. Orthogonal partial least squares-discriminant analysis (OPLS-DA) of serum metabolites in NOA and NC. (A) OPLS-DA score plot; (B) t-predicted scatter plot of the test set. Green squares: training set of azoospermia; green circles: training set of healthy control; blue squares: test set of azoospermia; blue circles: test set of healthy control.
Figure 2. Multivariate statistical analysis of serum metabolic profiling in patients with non-obstructiveazoospermia (NOA) and normal controls (NC). (A) principal component analysis (PCA) score plot;(B) partial least squares-discriminant analysis (PLS-DA) score plot; (C) statistical validation ofestablished PLS-DA model with permutation analysis (100 random permutations).
As shown in Figure 3A, an even clearer discriminative profile was observed in orthogonal partialleast squares-discriminant analysis (OPLS-DA) score plot (R2(X) = 0.466, R2(Y) = 0.931, Q2 = 0.797,four components, p value of coefficient of variationanalysis of variance (CV ANOVA) = 1.28 × 10⁻¹¹),implying that the serum metabolic disruption was significant in the patients with NOA. However,there is no distinct segregation in the patients with different histology of MA and SCO. In addition,the 80% samples were used to build a training set of OPLS-DA, and the 20% samples remaining(test set) were subjected to the model. In addition, we found that all samples were correctly predictedin both the azoospermic infertile group and the healthy group (Figure 3B).
Int. J. Mol. Sci. 2017, 18, 238 4 of 14
Figure 2. Multivariate statistical analysis of serum metabolic profiling in patients with non-obstructive azoospermia (NOA) and normal controls (NC). (A) principal component analysis (PCA) score plot; (B) partial least squares-discriminant analysis (PLS-DA) score plot; (C) statistical validation of established PLS-DA model with permutation analysis (100 random permutations).
As shown in Figure 3A, an even clearer discriminative profile was observed in orthogonal partial least squares-discriminant analysis (OPLS-DA) score plot (R2(X) = 0.466, R2(Y) = 0.931, Q2 = 0.797, four components, p value of coefficient of variationanalysis of variance (CV ANOVA) = 1.28 × 10⁻¹¹), implying that the serum metabolic disruption was significant in the patients with NOA. However, there is no distinct segregation in the patients with different histology of MA and SCO. In addition, the 80% samples were used to build a training set of OPLS-DA, and the 20% samples remaining (test set) were subjected to the model. In addition, we found that all samples were correctly predicted in both the azoospermic infertile group and the healthy group (Figure3B).
Figure 3. Orthogonal partial least squares-discriminant analysis (OPLS-DA) of serum metabolites in NOA and NC. (A) OPLS-DA score plot; (B) t-predicted scatter plot of the test set. Green squares: training set of azoospermia; green circles: training set of healthy control; blue squares: test set of azoospermia; blue circles: test set of healthy control.
Figure 3. Orthogonal partial least squares-discriminant analysis (OPLS-DA) of serum metabolitesin NOA and NC. (A) OPLS-DA score plot; (B) t-predicted scatter plot of the test set. Green squares:training set of azoospermia; green circles: training set of healthy control; blue squares: test set ofazoospermia; blue circles: test set of healthy control.

Int. J. Mol. Sci. 2017, 18, 238 5 of 14
2.3. Identification of Potential Biomarkers in NOA
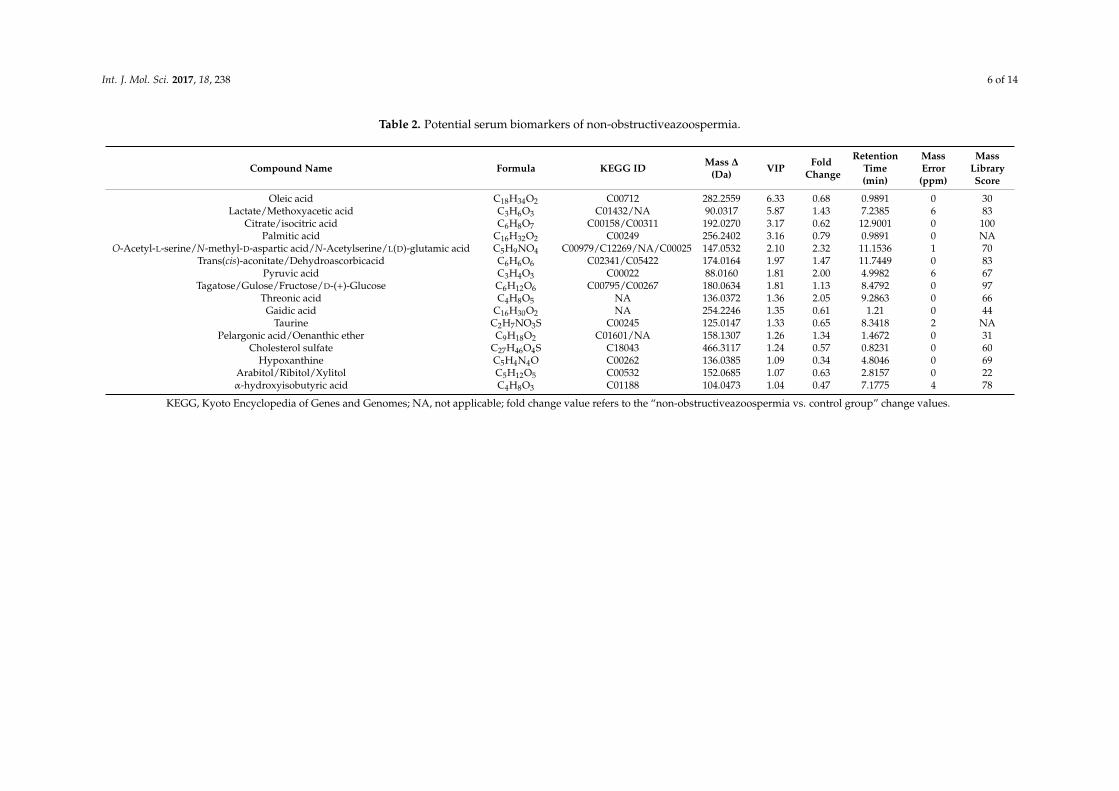
The distinct differentiation of azoospermia and healthy controls led us to identify potentialbiomarkers of metabolites that contributed to the metabolomic diversity in the two groups. First,variables (n = 36) with variable importance in the project (VIP) score >1 were introduced into thesuperset of biomarkers and used for subsequent analysis. Then, the number of candidate biomarkerswas decreased to 24 after qualifying condition of the jack-knifing confidence interval >0 (Figure S1).In addition, Student’s t-test was performed to test the statistical significance of these differential variables.Moreover, potential biomarkers were screened by the S-plot of the established OPLS-DA model, whichprovides visual prediction of principal component load information. The contribution of metabolitesto the class discrimination was determined by the distance from the biomarkers to the center of theS-plot. Variables with absolute p > 0.05 and p(corr) > 0.3 were selected as potential biomarkers with largecontributions (Figure S2). Finally, a total of 24 metabolites were identified and listed in Table 2.
2.4. Metabolic Pathway and Linkages Analysis of Metabolites in NOA
To determine the possible metabolic pathway that was disrupted in NOA, all the differentialmetabolites were analyzed by Metabolomics Pathway Analysis (MetPA), which is based on the KyotoEncyclopedia of Genes and Genomes (KEGG) Pathway Database. The impact value of metabolicpathway was computed by pathway enrichment and topology analysis. All disrupted metabolicpathway involved in azoospermia were listed in Table S1, and the top five potential pathways wereD-glutamine and D-glutamate metabolism, taurine and hypotaurine metabolism, pyruvate metabolism,the citrate cycle (TCA cycle) and alanine, aspartate and glutamate metabolism.
A heat map of hierarchical clustering analysis (HCA) was performed to investigate probablediscrepancies in the differential metabolite profiles between azoospermia and healthy controls.The clinical information was the major source of variance in the data, which indicated an absolutechange of metabolism in the two conditions. The metabolites displayed three different clusters(Figure 4). Every cluster presented a good separation of the metabolite trend between samplesfromazoospermia and healthy controls. The first cluster included cholesterol sulfate, taurine,hypoxanthine, isocitric acid, and citrate, which are involved in taurine and hypotaurine metabolism.The second cluster contained glucose, fructose myoinositol, aconitate, dehydroascorbic acid, glutamicacid, N-acetylserine, N-methyl-aspartic acid, threonic acid, pyruvic acid, methoxyacetic acid,and lactate, which are involved in glycolysis or gluconeogenesis. These compounds have higherlevels in healthy controls than in patients with azoospermia. A set of highly correlated sugars, namely,adonitol, arabitol, and xylitol, were included in the last cluster metabolites, which are involved inpentose andglucuronateinterconversions. In addition, hydroxyisobutyric acid, palmitic acid, oleic acid,and gaidic acid were also included, which take part in fatty acid metabolism. Those metabolites havehigher levels in azoospermia compared with healthy controls. To determine the relevance among themetabolites or the clusters, correlations in metabolites were investigated. The correlations betweenmetabolites of the different classes were similar to the results of HCA (Figure 5). The metabolites inthe second cluster are strongly correlated with each other (r values 0.48–0.73) and correlated withmetabolites in the third cluster inversely (r values −0.59–−0.25).
Int. J. Mol. Sci. 2017, 18, 238 6 of 14
Table 2. Potential serum biomarkers of non-obstructiveazoospermia.
Compound Name Formula KEGG ID Mass ∆
(Da) VIP FoldChange
RetentionTime(min)
MassError(ppm)
MassLibraryScore
Oleic acid C18H34O2 C00712 282.2559 6.33 0.68 0.9891 0 30Lactate/Methoxyacetic acid C3H6O3 C01432/NA 90.0317 5.87 1.43 7.2385 6 83
Citrate/isocitric acid C6H8O7 C00158/C00311 192.0270 3.17 0.62 12.9001 0 100Palmitic acid C16H32O2 C00249 256.2402 3.16 0.79 0.9891 0 NA
O-Acetyl-L-serine/N-methyl-D-aspartic acid/N-Acetylserine/L(D)-glutamic acid C5H9NO4 C00979/C12269/NA/C00025 147.0532 2.10 2.32 11.1536 1 70Trans(cis)-aconitate/Dehydroascorbicacid C6H6O6 C02341/C05422 174.0164 1.97 1.47 11.7449 0 83
Pyruvic acid C3H4O3 C00022 88.0160 1.81 2.00 4.9982 6 67Tagatose/Gulose/Fructose/D-(+)-Glucose C6H12O6 C00795/C00267 180.0634 1.81 1.13 8.4792 0 97
Threonic acid C4H8O5 NA 136.0372 1.36 2.05 9.2863 0 66Gaidic acid C16H30O2 NA 254.2246 1.35 0.61 1.21 0 44
Taurine C2H7NO3S C00245 125.0147 1.33 0.65 8.3418 2 NAPelargonic acid/Oenanthic ether C9H18O2 C01601/NA 158.1307 1.26 1.34 1.4672 0 31
Cholesterol sulfate C27H46O4S C18043 466.3117 1.24 0.57 0.8231 0 60Hypoxanthine C5H4N4O C00262 136.0385 1.09 0.34 4.8046 0 69
Arabitol/Ribitol/Xylitol C5H12O5 C00532 152.0685 1.07 0.63 2.8157 0 22α-hydroxyisobutyric acid C4H8O3 C01188 104.0473 1.04 0.47 7.1775 4 78
KEGG, Kyoto Encyclopedia of Genes and Genomes; NA, not applicable; fold change value refers to the “non-obstructiveazoospermia vs. control group” change values.

Int. J. Mol. Sci. 2017, 18, 238 7 of 14Int. J. Mol. Sci. 2017, 18, 238 7 of 14
Figure 4. Hierarchical cluster analysis heat map of differential serum metabolites between NOA and healthy controls. Red indicates up-regulation, and green indicates down-regulation. The columns and rows represent experimental serum samples and metabolites, respectively.
Figure 5. Heat map visualization of correlation analysis of differential metabolites. The colored dots indicate that the correlations between serum metabolites have statistical significance (p < 0.05). The red and blue dots represent positive and negative correlations, respectively.
Figure 4. Hierarchical cluster analysis heat map of differential serum metabolites between NOA andhealthy controls. Red indicates up-regulation, and green indicates down-regulation. The columns androws represent experimental serum samples and metabolites, respectively.
Int. J. Mol. Sci. 2017, 18, 238 7 of 14
Figure 4. Hierarchical cluster analysis heat map of differential serum metabolites between NOA and healthy controls. Red indicates up-regulation, and green indicates down-regulation. The columns and rows represent experimental serum samples and metabolites, respectively.
Figure 5. Heat map visualization of correlation analysis of differential metabolites. The colored dots indicate that the correlations between serum metabolites have statistical significance (p < 0.05). The red and blue dots represent positive and negative correlations, respectively.
Figure 5. Heat map visualization of correlation analysis of differential metabolites. The colored dotsindicate that the correlations between serum metabolites have statistical significance (p < 0.05). The redand blue dots represent positive and negative correlations, respectively.
Int. J. Mol. Sci. 2017, 18, 238 8 of 14
3. Discussion
In the present study, we attempted, for the first time, to investigate whether serum metabolomicpatterns can differentiate azoospermic patients from healthy controls with a novel approach ofhigh-performance liquid chromatography-tandem mass spectrometry (HPLC-MS/MS) technology.Our results found a unique serum metabolomic signature in NOA compared with control subjects,and a total of 24 potential biomarkers were identified, many of which are associated with energyproduction, oxidative stress and cell apoptosis in spermatogenesis. Moreover, various metabolicpathways involved in glycometabolism, lipid metabolism and amino acid metabolism were disruptedin the patients with NOA.
Metabolic regulation and energy support are essential for the normal process of spermatogenesis,yet such homeostasis may be disrupted in NOA [11,12]. Our results showed a perturbation of thecitrate cycle in the patients with NOA, where the concentrations of both citrate and isocitric acid aresignificantly decreased in the infertile cases compared with normal controls, while the amounts oflactate and pyruvic acid were increased. Similar to what we have observed, metabolomic analysisof urinary sample also revealed disrupted citrate cycles in normozoospermic infertile men [13].Hamamah et al. examined the levels of citrate, lactate, glycerylphosphorylethanolamine (GPE) andglycerylphosphorylcholine (GPC) in human seminal plasma by 1H nuclear magnetic resonance,and they found that the concentrations of citrate, lactate and GPC are lower in patients withazoospermia than in healthy controls [14]. Single nucleotide polymorphisms of two genes encodingkey enzymes in thecitrate cycle, namely, the succinate dehydrogenase subunits and citrate synthasegene, may be associated with impaired spermatogenesis [15]. We hypothesize that disorder of enzymesrelated to the citrate cycle may be a potential cause of male infertility. The concentration of palmiticacid was found to be decreased in the serum of azoospermic patients compared with healthy subjects.Palmitic acid is one of the most abundant saturated fatty acids in spermatozoa [16]. Andersen et al.reported that there is a positive correlation between the level of palmitic acid in spermatozoa and totalsperm count, suggesting its important role in the productionof sperm [17]. These findings indicate thata disorder of palmitic acid contributes to impaired spermatogenesis and may be a potential target forazoospermia treatment. However, the regulation of energy production involves numerous metabolicpathways and its biological interpretation remains tricky, so further investigation is needed.
Oxidative stress, as a result of an imbalance between reactive oxygen species (ROS) andantioxidants, has long been considered a possible cause of male infertility [18,19]. Although normallevels of ROS are required for germ cell proliferation, meiosis and maturation, excessive ROS candeteriorate physiological processes and cause male infertility. Current studies have found increasedlevels of ROS in 30%–80% of infertile men [20,21]. Agarwal et al. reported that ROS values in semenare potential biomarkers in diagnosing male factors with a specificity of 68.8% and a sensitivityof 93.8% [22]. Our metabolomic profiles indicated that several metabolites involved in antioxidativeactions decreased in NOA compared with fertile cases. Taurine, also named 2-aminoethanesulfonicacid, is the most abundant free amino acid in many tissues. As an effective free radical scavenger,taurine acts as an antioxidant primarily through both reduction of superoxide production by theelectron transport chain and reversal of decreased antioxidant enzyme activity caused by ROSduring spermatogenesis [23]. It has been demonstrated that taurine supplement could elevatetesticular antioxidation, improve sperm quality, and increase the levels of luteinizing hormone (LH)and testosterone in physiological and pathological conditions [24]. In addition, taurine signalinginitiates meiotic activity of germ cells by up-regulation of Spo11a expression in spermatogenesis [25].These findings suggest that oxidative stress may contribute to impaired spermatogenesis and maybe present in the pathogenesis of azoospermia. In addition, we found that the serum methoxyaceticacid level was significantly increased in azoospermia compared with normal controls. Methoxyaceticacid is a metabolite of ethylene glycolmonomethoxy ether in vivo and exhibits obvious reproductivetoxicity [26,27]. It is reported that methoxyacetic acid induces spermatocyte apoptosis by increasingacetylation of core histones and protein kinase activity in testis germ cells. We speculate that

Int. J. Mol. Sci. 2017, 18, 238 9 of 14
an excessive concentration of methoxyacetic acid may be one of the reasons for spermatogenicdysfunction in azoospermic patients.
Besides acting as crucial nutrients in the energy metabolism, amino acids and other metabolitesare important signaling molecules in the regulation of complex physiological process duringspermatogenesis [28]. Alterations of several amino acid metabolisms and sulfur metabolisms wereobserved in the metabolomic profiles of NOA and normal subjects. Glutamate is an abundant freeamino acid in cellular metabolism and is involved in the synthesis of other amino acids, proteinsand nucleotides [29]. Here, we found that the concentration of glutamic acid is increased in infertileserum samples. Similarly, Zhang and his colleagues reported that the level of glutamine and glutamatewere also elevated in asthenozoospermia compared with healthy controls [30]. However, the specificmechanism underlying disorders of glutamate metabolism is unclear and must be further investigated.Sulfonated metabolites provide substantial compounds for many endogenous molecules such ashormones and neurotransmitters, and cholesterol sulfate is the most important sterol sulfate in humanplasma [31]. In the male reproductive tract, cholesterol sulfate maintains arelatively high concentrationand plays a crucial role in sperm maturation [32]. Our results showed that cholesterol sulfate issignificantly decreased in the group of azoospermia. It has been found that hydrolysis of cholesterolsulfate could result in sperm membrane destabilization; therefore, dysregulated cholesterol sulfonationmay be present in the pathogenesis of azoospermia.
Spermatogenesis is a complicated and orchestrated process of germ cells’ self-renewal anddifferentiation, from spermatogonia developing into haploid spermatozoa through meiosis, and bothgenetic and environmental alterations can affect this process. There is increasing evidence thatshows that energy metabolism and reproductive function are intimately related and metabolicregulation is important for spermatogenesis [33]. Germ cells require an adequate amount ofenergy substrates and nutritional support, such as carbohydrates, amino acids, lipids and vitamins;otherwise, their proliferation, differentiation and survival will suffer [12]. Studies have shownthat in men, brief periods of fasting and extreme exercise reduce the level of LH and testosteroneby suppression of the reproductive axis and therefore alter male reproductive function [34].In addition, metabolism-related hormones play critical roles in the interaction between metabolismand reproduction. Thyroid hormones stimulate testicular amino accumulation, and enhance glucosetransport and gamma-glutamyltranspeptidase production in Sertoli cells; leptin-deficient miceexhibit impaired spermatogenesis, accompanied byincreased germ cell apoptosis, and alterationof proapoptotic genes expression within the testis [35,36]. Metformin improves insulin resistance inpatients with metabolic syndrome, accompanied by a significant increase of serum androgen levelsand sperm levels and activity, which also indicates that metabolic homeostasis is crucial for malereproduction [37]. Our study found that the disruption of metabolic pathways, including the citratecycle and glutamate and taurine metabolism, at least partially contributed to the etiologies of NOA.
It is noteworthy that there are several limitations in the present study. One is that the sample sizeof NOA was relatively small. Although some metabolic disorders have been found in these patientswith NOA, further research with a larger sample scale isrequired to verify this potential pathogenesis.Moreover, the inter-individual metabolic variability of subjects was not well controlled becausebodily metabolic activity is susceptible to various factors including environment, lifestyles and diets.Accordingly, to eliminate the influence of these confounding factors, studies with more strict criteria ofsubject selection and controlled animal model are needed. In the study with untargeted investigation,although some metabolites, such as lactate, taurine, and cholesterol sulfate, were confirmed bycomparing their raw MS/MS with the available standards, some isomers cannot be differentiated dueto the same retention time. Further studies with multiple reaction monitoring (MRM) methods todetect the interesting metabolites in azoospermia are warranted.Finally, the metabolomics profilespresent only the downstream alterations of this disease, and thus, it is better to continue to studyintegrated genomics and proteomics to obtain a comprehensive understanding of etiology and themolecular mechanism of male infertility.

Int. J. Mol. Sci. 2017, 18, 238 10 of 14
4. Materials and Methods
4.1. Study Design and Participant Recruitment
The study was approved by the Ethical Committee of Peking University Third Hospital (PUTH,2015-0065) and conducted according to the Helsinki Declaration. The patients with NOA were enrolledfrom the Reproductive Center of PUTH, and healthy controls were from the Human Sperm Bankof PUTH. Every subject was fully informed of the purpose of the study and provided informedconsent before the research. All subjects are ethnically Han Chinese. NOA is defined as no spermdetected after three examinations without obstruction in the reproductive tract. To eliminate theinfluence of other confounders that may affect fecundity and metabolism, the exclusive criterion arepresented as follows: (1) subjects with malformation, trauma, tumor or infection in the reproductivesystem; (2) subjects with history of varicocele, cryptorchidism, orchitis, epididymitis, vas deferensor ejaculatory duct obstruction; (3) subjects with chromosome abnormality or Y chromosomemicrodeletions; and (4) subjects with metabolic disorders such as diabetes and hepatic disease,occupational exposure to the agents, and other known factors related to male infertility and metabolism.The healthy subjects recruited from the Human Sperm Bank of PUTH had normal physical andreproductive functionin accordance with the World Health Organization (WHO) fifth edition spermparameters:sperm volume ≥1.5 mL, sperm concentration ≥15 × 106/mL, progressive sperm ≥32%,and normal morphology ≥4%.
4.2. Serum Collection and Preparation
The blood samples from both NOA and healthy controls were centrifuged at 2000× g for 10 min,and then the obtained serum samples were stored at −80 ◦C immediately. Fifty-microliter serumsamples were aliquoted to a 1.5-mL Eppendorf tube and mixed with 200 µL of methanol. Protein in thesamples was precipitated by vortexing for 1 min and then incubated at −80 ◦C for 8 h, and then thesupernatant was recovered following centrifugation at 14,000× g at 4 ◦C for 10 min. The supernatantwas dried using a SpeedVac (Thermo Fisher, San Jose, CA, USA) with no heat.
4.3. HPLC-MS/MS Analysis
Untargeted metabolites screening wasperformed on Q ExactiveOrbitrap mass spectrometer (MS)with HPLC according to the calibrated manufacturer’s guidelines. A Bridged Ethylene Hybrid(BEH) Amide column was used in negative mode in LC. Mobile phase A was prepared with 10 mMammonium acetate in 95% acetonitrile. The pH was adjusted to 9.0 using an ammonium hydroxidesolution. Mobile phase B was prepared with 10mM ammonium acetate in 50% acetonitrile, and thepH was adjusted to 9.0 with ammonium hydroxide solution. The column temperature was 35 ◦C.The elution solution was 5% B (A:B; 95:5, by volume) for 2 min followed by a linear gradient up to45% B for the next 6 min, up to 85% for the next 10 min, and up to 95% for the next 1 min, where it washeld for 2 min before it was returned to 5% B for 2.1 min. The flow rate was 250 µL/min of phase B.
The HPLC system was coupled to a Q ExactiveOrbitrap mass spectrometer (Thermo Fisher,San Jose, CA, USA) equipped with a heated electrospray ionization (HESI) probe. The spray voltagewas set to 2.5 kV, whereas the capillary temperature was held at 320 ◦C. The sheath gas flow was set to35 units and the auxiliary gas set to 10 units. These conditions were held at negative ionization modeacquisitions. Resolution of 70,000 and 17,500 was used in MS and MS/MS acquisition respectively.One precursor scanned followed by 10 MS/MS spectra were performed; 30% + 50% of normalizedcollision dissociation was applied in the experiment. The same LC conditions and buffers were usedfor all MS experiments, and the scan range was between m/z 80 and 1200. The duty cycle(s) is 1.2 s.External mass calibration was performed before experiment. Serum samples were randomized in thesequence and metabolites were profiled by single injection including with 53 pool samples, 3 blanks,and 5 quality control (QC) samples throughout the analysis. The coefficient of variation (CV) ofmetabolites for the same QC samples were less than 10%.
Int. J. Mol. Sci. 2017, 18, 238 11 of 14
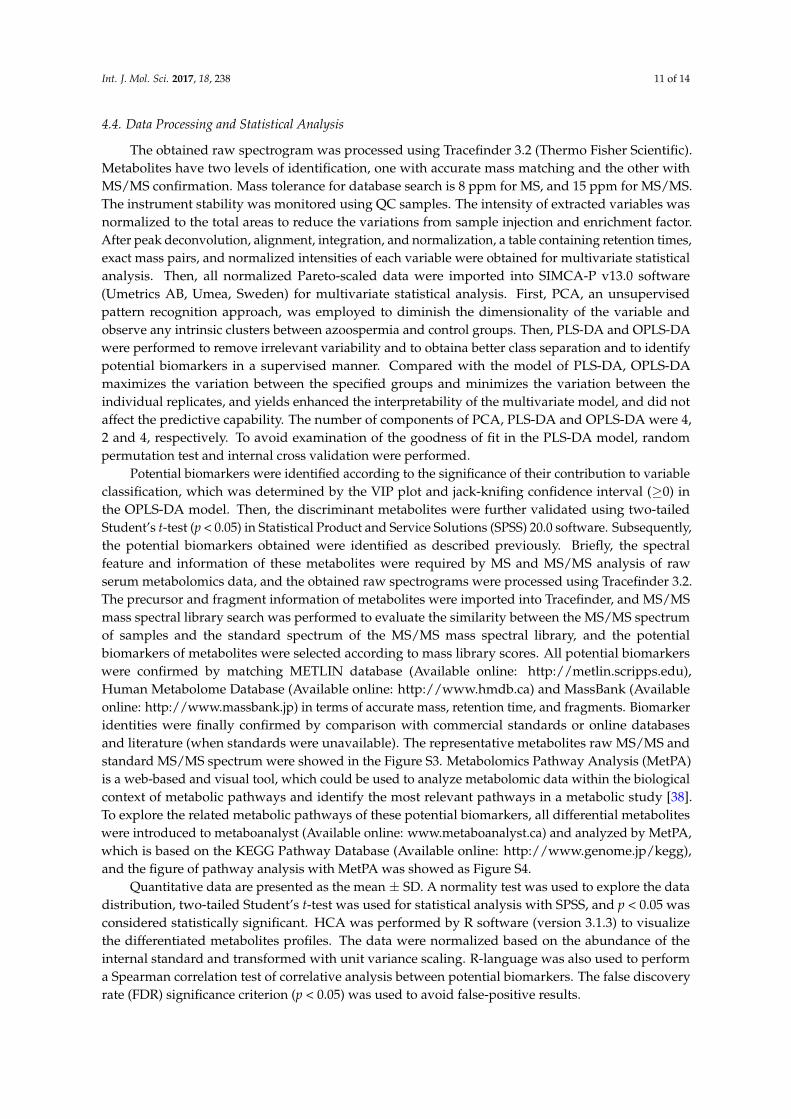
4.4. Data Processing and Statistical Analysis
The obtained raw spectrogram was processed using Tracefinder 3.2 (Thermo Fisher Scientific).Metabolites have two levels of identification, one with accurate mass matching and the other withMS/MS confirmation. Mass tolerance for database search is 8 ppm for MS, and 15 ppm for MS/MS.The instrument stability was monitored using QC samples. The intensity of extracted variables wasnormalized to the total areas to reduce the variations from sample injection and enrichment factor.After peak deconvolution, alignment, integration, and normalization, a table containing retention times,exact mass pairs, and normalized intensities of each variable were obtained for multivariate statisticalanalysis. Then, all normalized Pareto-scaled data were imported into SIMCA-P v13.0 software(Umetrics AB, Umea, Sweden) for multivariate statistical analysis. First, PCA, an unsupervisedpattern recognition approach, was employed to diminish the dimensionality of the variable andobserve any intrinsic clusters between azoospermia and control groups. Then, PLS-DA and OPLS-DAwere performed to remove irrelevant variability and to obtaina better class separation and to identifypotential biomarkers in a supervised manner. Compared with the model of PLS-DA, OPLS-DAmaximizes the variation between the specified groups and minimizes the variation between theindividual replicates, and yields enhanced the interpretability of the multivariate model, and did notaffect the predictive capability. The number of components of PCA, PLS-DA and OPLS-DA were 4,2 and 4, respectively. To avoid examination of the goodness of fit in the PLS-DA model, randompermutation test and internal cross validation were performed.
Potential biomarkers were identified according to the significance of their contribution to variableclassification, which was determined by the VIP plot and jack-knifing confidence interval (≥0) inthe OPLS-DA model. Then, the discriminant metabolites were further validated using two-tailedStudent’s t-test (p < 0.05) in Statistical Product and Service Solutions (SPSS) 20.0 software. Subsequently,the potential biomarkers obtained were identified as described previously. Briefly, the spectralfeature and information of these metabolites were required by MS and MS/MS analysis of rawserum metabolomics data, and the obtained raw spectrograms were processed using Tracefinder 3.2.The precursor and fragment information of metabolites were imported into Tracefinder, and MS/MSmass spectral library search was performed to evaluate the similarity between the MS/MS spectrumof samples and the standard spectrum of the MS/MS mass spectral library, and the potentialbiomarkers of metabolites were selected according to mass library scores. All potential biomarkerswere confirmed by matching METLIN database (Available online: http://metlin.scripps.edu),Human Metabolome Database (Available online: http://www.hmdb.ca) and MassBank (Availableonline: http://www.massbank.jp) in terms of accurate mass, retention time, and fragments. Biomarkeridentities were finally confirmed by comparison with commercial standards or online databasesand literature (when standards were unavailable). The representative metabolites raw MS/MS andstandard MS/MS spectrum were showed in the Figure S3. Metabolomics Pathway Analysis (MetPA)is a web-based and visual tool, which could be used to analyze metabolomic data within the biologicalcontext of metabolic pathways and identify the most relevant pathways in a metabolic study [38].To explore the related metabolic pathways of these potential biomarkers, all differential metaboliteswere introduced to metaboanalyst (Available online: www.metaboanalyst.ca) and analyzed by MetPA,which is based on the KEGG Pathway Database (Available online: http://www.genome.jp/kegg),and the figure of pathway analysis with MetPA was showed as Figure S4.
Quantitative data are presented as the mean ± SD. A normality test was used to explore the datadistribution, two-tailed Student’s t-test was used for statistical analysis with SPSS, and p < 0.05 wasconsidered statistically significant. HCA was performed by R software (version 3.1.3) to visualizethe differentiated metabolites profiles. The data were normalized based on the abundance of theinternal standard and transformed with unit variance scaling. R-language was also used to performa Spearman correlation test of correlative analysis between potential biomarkers. The false discoveryrate (FDR) significance criterion (p < 0.05) was used to avoid false-positive results.
Int. J. Mol. Sci. 2017, 18, 238 12 of 14
5. Conclusions
In this study, we examined the metabolomics characterization of NOA using HPLC-MS/MS toevaluate their differentiations in terms of metabolites and metabolic pathways. Metabolic patterns ofserum samples from infertile and fertile men were demonstrated to be markedly different and reflectedthe complex networks of metabolic alteration in patients with NOA. Several potential metaboliteswere identified that are closely associated with energy production, oxidative stress and cell apoptosisin spermatogenesis. Biosynthesis and metabolism of these metabolites may contribute to the etiologiesof azoospermia. Our findings suggested that serum metabolomics fingerprinting could providea promising screening approach to identify unique metabolic patterns of NOA, and eventually aidetiological diagnosis and therapy intervention. Further studies with larger samples and more strictcriteria are required to reveal the pathological mechanism underlying male infertility.
Supplementary Materials: Supplementary materials can be found at www.mdpi.com/1422-0067/18/2/238/s1.
Acknowledgments: This work was support by the Peking University 985 Clinical Hospital Cooperation Programto Hui Jiang, and National Science Foundation of China (No.81322005, 81370235). We would also like tothank all staff of the key laboratory of assisted reproduction of the Peking University Third Hospital andTsinghua University-National Protein Science Facility (Beijing) Metabolomics Center for sample collection andHPLC-MS/MS analysis.
Author Contributions: Hui Jiang, Lemin Zheng and Zhe Zhang conceived and designed the experiments;Yingwei Zhang, Changjie Liu and Mingming Zhao performed the experiments; Yuzhuo Yang, Han Wu andHongliang Zhang analyzed the data and contribute sample collection; Zhe Zhang and Haocheng Lin wrotethe paper.
Conflicts of Interest: The authors declare no conflict of interest.
Abbreviations
ART Assisted Reproductive TechnologyFDR False Discovery RateGPC GlycerylphosphorylcholineGPE GlycerylphosphorylethanolamineHCA Hierarchical Clustering AnalysisHPLC-MS/MS High-Performance Liquid Chromatography-tandem Mass SpectrometryLH Luteinizing HormoneMA Maturation ArrestNOA Non-obstructiveAzoospermiaOA Obstructive AzoospermiaOPLS-DA Orthogonal Partial Least Squares-Discriminant AnalysisPCA Principal Component AnalysisPLS-DA Partial Least Squares-Discriminant AnalysisROS Reactive Oxygen SpeciesVIP Variable Importance in the Project
References
1. The Practice Committee of the American Society for Reproductive Medicine. Diagnostic evaluation of theinfertile male: A committee opinion. Fertil. Steril. 2015, 103, e18–e25.
2. Tournaye, H.; Krausz, C.; Oates, R.D. Concepts in diagnosis and therapy for male reproductive impairment.Lancet Diabetes Endocrinol. 2016. [CrossRef]
3. Tebani, A.; Abily-Donval, L.; Afonso, C.; Marret, S.; Bekri, S. Clinical Metabolomics: The New MetabolicWindow for Inborn Errors of Metabolism Investigations in the Post-Genomic Era. Int. J. Mol. Sci. 2016, 17,1167. [CrossRef] [PubMed]
4. Robles, A.I.; Harris, C.C. Integration of multiple “OMIC” biomarkers: A precision medicine strategy for lungcancer. Lung Cancer 2016. [CrossRef] [PubMed]
5. Courant, F.; Antignac, J.P.; Monteau, F.; Le Bizec, B. Metabolomics as a potential new approach forinvestigating human reproductive disorders. J. Proteome Res. 2013, 12, 2914–2920. [CrossRef] [PubMed]

Int. J. Mol. Sci. 2017, 18, 238 13 of 14
6. Kovac, J.R.; Pastuszak, A.W.; Lamb, D.J. The use of genomics, proteomics, and metabolomics in identifyingbiomarkers of male infertility. Fertil. Steril. 2013, 99, 998–1007. [CrossRef] [PubMed]
7. Zhang, J.; Huang, Z.; Chen, M.; Xia, Y.; Martin, F.L.; Hang, W.; Shen, H. Urinary metabolome identifiessignatures of oligozoospermic infertile men. Fertil. Steril. 2014. [CrossRef] [PubMed]
8. Aaronson, D.S.; Iman, R.; Walsh, T.J.; Kurhanewicz, J.; Turek, P.J. A novel application of 1H magneticresonance spectroscopy: Non-invasive identification of spermatogenesis in men with non-obstructiveazoospermia. Hum. Reprod. 2010, 25, 847–852. [CrossRef] [PubMed]
9. Uchiyama, K.; Yagi, N.; Mizushima, K.; Higashimura, Y.; Hirai, Y.; Okayama, T.; Yoshida, N.; Katada, K.;Kamada, K.; Handa, O.; et al. Serum metabolomics analysis for early detection of colorectal cancer.J. Gastroenterol. 2016. [CrossRef] [PubMed]
10. Shackleton, C. Clinical steroid mass spectrometry: A 45-year history culminating in HPLC-MS/MS becomingan essential tool for patient diagnosis. J. Steroid Biochem. Mol. Biol. 2010, 121, 481–490. [CrossRef] [PubMed]
11. Boussouar, F.; Benahmed, M. Lactate and energy metabolism in male germ cells. Trends Endocrinol. Metab.2004, 15, 345–350. [CrossRef] [PubMed]
12. Rato, L.; Alves, M.G.; Socorro, S.; Duarte, A.I.; Cavaco, J.E.; Oliveira, P.F. Metabolic regulation is importantfor spermatogenesis. Nat. Rev. Urol. 2012, 9, 330–338. [CrossRef] [PubMed]
13. Zhang, J.; Mu, X.; Xia, Y.; Martin, F.L.; Hang, W.; Liu, L.; Tian, M.; Huang, Q.; Shen, H. Metabolomic analysisreveals a unique urinary pattern in normozoospermic infertile men. J. Proteome Res. 2014, 13, 3088–3099.[CrossRef] [PubMed]
14. Hamamah, S.; Seguin, F.; Barthelemy, C.; Akoka, S.; Le Pape, A.; Lansac, J.; Royere, D. 1H nuclear magneticresonance studies of seminal plasma from fertile and infertile men. J. Reprod. Fertil. 1993, 97, 51–55.[CrossRef] [PubMed]
15. Bonache, S.; Martinez, J.; Fernandez, M.; Bassas, L.; Larriba, S. Single nucleotide polymorphisms in succinatedehydrogenase subunits and citrate synthase genes: Association results for impaired spermatogenesis.Int. J. Androl. 2007, 30, 144–152. [CrossRef] [PubMed]
16. Tavilani, H.; Doosti, M.; Abdi, K.; Vaisiraygani, A.; Joshaghani, H.R. Decreased polyunsaturated andincreased saturated fatty acid concentration in spermatozoa from asthenozoospermic males as comparedwith normozoospermic males. Andrologia 2006, 38, 173–178. [CrossRef] [PubMed]
17. Andersen, J.M.; Ronning, P.O.; Herning, H.; Bekken, S.D.; Haugen, T.B.; Witczak, O. Fatty acid compositionof spermatozoa is associated with BMI and with semen quality. Andrology 2016, 4, 857–865. [CrossRef][PubMed]
18. Guerriero, G.; Trocchia, S.; Abdel-Gawad, F.K.; Ciarcia, G. Roles of reactive oxygen species in thespermatogenesis regulation. Front. Endocrinol. 2014, 5, 56. [CrossRef] [PubMed]
19. Ko, E.Y.; Sabanegh, E.S., Jr.; Agarwal, A. Male infertility testing: Reactive oxygen species and antioxidantcapacity. Fertil. Steril. 2014, 102, 1518–1527. [CrossRef] [PubMed]
20. Mayorga-Torres, B.J.; Camargo, M.; Cadavid, A.P.; du Plessis, S.S.; Cardona Maya, W.D. Are oxidative stressmarkers associated with unexplained male infertility? Andrologia 2016. [CrossRef] [PubMed]
21. Tremellen, K. Oxidative stress and male infertility—A clinical perspective. Hum. Reprod. Update 2008, 14,243–258. [CrossRef] [PubMed]
22. Agarwal, A.; Sharma, R.K.; Sharma, R.; Assidi, M.; Abuzenadah, A.M.; Alshahrani, S.; Durairajanayagam, D.;Sabanegh, E. Characterizing semen parameters and their association with reactive oxygen species in infertilemen. Reprod. Biol. Endocrinol. 2014, 12, 33. [CrossRef] [PubMed]
23. Yang, J.; Zong, X.; Wu, G.; Lin, S.; Feng, Y.; Hu, J. Taurine increases testicular function in aged rats byinhibiting oxidative stress and apoptosis. Amino Acids 2015, 47, 1549–1558. [CrossRef] [PubMed]
24. Yang, J.; Wu, G.; Feng, Y.; Lv, Q.; Lin, S.; Hu, J. Effects of taurine on male reproduction in rats of differentages. J. Biomed. Sci. 2010, 17, S9. [CrossRef] [PubMed]
25. Higuchi, M.; Miura, C.; Iwai, T.; Miura, T. Trypsin regulates meiotic initiation in the Japanese eel(Anguilla japonica) by promoting the uptake of taurine into germ cells during spermatogenesis. Biol. Reprod.2013, 89, 58. [CrossRef] [PubMed]
26. Jindo, T.; Wine, R.N.; Li, L.H.; Chapin, R.E. Protein kinase activity is central to rat germ cell apoptosisinduced by methoxyacetic acid. Toxicol. Pathol. 2001, 29, 607–616. [CrossRef] [PubMed]
27. Wade, M.G.; Kawata, A.; Williams, A.; Yauk, C. Methoxyacetic acid-induced spermatocyte death is associatedwith histone hyperacetylation in rats. Biol. Reprod. 2008, 78, 822–831. [CrossRef] [PubMed]

Int. J. Mol. Sci. 2017, 18, 238 14 of 14
28. Dai, Z.; Wu, Z.; Hang, S.; Zhu, W.; Wu, G. Amino acid metabolism in intestinal bacteria and its potentialimplications for mammalian reproduction. Mol. Hum. Reprod. 2015, 21, 389–409. [CrossRef] [PubMed]
29. Spitzer, S.; Volbracht, K.; Lundgaard, I.; Karadottir, R.T. Glutamate signalling: A multifaceted modulatorof oligodendrocyte lineage cells in health and disease. Neuropharmacology 2016, 110, 574–585. [CrossRef][PubMed]
30. Zhang, X.; Diao, R.; Zhu, X.; Li, Z.; Cai, Z. Metabolic characterization of asthenozoospermia using nontargetedseminal plasma metabolomics. Clin. Chim. Acta 2015, 450, 254–261. [CrossRef] [PubMed]
31. Strott, C.A.; Higashi, Y. Cholesterol sulfate in human physiology: What’s it all about? J. Lipid Res. 2003, 44,1268–1278. [CrossRef] [PubMed]
32. Langlais, J.; Zollinger, M.; Plante, L.; Chapdelaine, A.; Bleau, G.; Roberts, K.D. Localization of cholesterylsulfate in human spermatozoa in support of a hypothesis for the mechanism of capacitation. Proc. Natl. Acad.Sci. USA 1981, 78, 7266–7270. [CrossRef] [PubMed]
33. Alves, M.G.; Rato, L.; Carvalho, R.A.; Moreira, P.I.; Socorro, S.; Oliveira, P.F. Hormonal control of Sertoli cellmetabolism regulates spermatogenesis. Cell. Mol. Life Sci. 2013, 70, 777–793. [CrossRef]
34. Trumble, B.C.; Brindle, E.; Kupsik, M.; O’Connor, K.A. Responsiveness of the reproductive axis to a singlemissed evening meal in young adult males. Am. J. Hum. Biol. 2010, 22, 775–781. [CrossRef]
35. Silva, F.R.; Leite, L.D.; Barreto, K.P.; D’Agostini, C.; Zamoner, A. Effect of 3,5,3′-triiodo-L-thyronine onamino acid accumulation and membrane potential in Sertoli cells of the rat testis. Life Sci. 2001, 69, 977–986.[CrossRef]
36. Crown, A.; Clifton, D.K.; Steiner, R.A. Neuropeptide signaling in the integration of metabolism andreproduction. Neuroendocrinology 2007, 86, 175–182. [CrossRef] [PubMed]
37. Morgante, G.; Tosti, C.; Orvieto, R.; Musacchio, M.C.; Piomboni, P.; de Leo, V. Metformin improves semencharacteristics of oligo-terato-asthenozoospermic men with metabolic syndrome. Fertil. Steril. 2011, 95,2150–2152. [CrossRef] [PubMed]
38. Xia, J.; Wishart, D.S. MetPA: A web-based metabolomics tool for pathway analysis and visualization.Bioinformatics 2010, 26, 2342–2344. [CrossRef] [PubMed]
© 2017 by the authors; licensee MDPI, Basel, Switzerland. This article is an open accessarticle distributed under the terms and conditions of the Creative Commons Attribution(CC BY) license (http://creativecommons.org/licenses/by/4.0/).