Embed Size (px)
Citation preview

Series
www.thelancet.com Vol 387 January 30, 2016 475
Breastfeeding 1
Breastfeeding in the 21st century: epidemiology, mechanisms, and lifelong effectCesar G Victora, Rajiv Bahl, Aluísio J D Barros, Giovanny V A França, Susan Horton, Julia Krasevec, Simon Murch, Mari Jeeva Sankar, Neff Walker, Nigel C Rollins, for The Lancet Breastfeeding Series Group*
The importance of breastfeeding in low-income and middle-income countries is well recognised, but less consensus exists about its importance in high-income countries. In low-income and middle-income countries, only 37% of children younger than 6 months of age are exclusively breastfed. With few exceptions, breastfeeding duration is shorter in high-income countries than in those that are resource-poor. Our meta-analyses indicate protection against child infections and malocclusion, increases in intelligence, and probable reductions in overweight and diabetes. We did not find associations with allergic disorders such as asthma or with blood pressure or cholesterol, and we noted an increase in tooth decay with longer periods of breastfeeding. For nursing women, breastfeeding gave protection against breast cancer and it improved birth spacing, and it might also protect against ovarian cancer and type 2 diabetes. The scaling up of breastfeeding to a near universal level could prevent 823 000 annual deaths in children younger than 5 years and 20 000 annual deaths from breast cancer. Recent epidemiological and biological findings from during the past decade expand on the known benefits of breastfeeding for women and children, whether they are rich or poor.
Introduction“In all mammalian species the reproductive cycle comprises both pregnancy and breast-feeding: in the absence of latter, none of these species, man included, could have survived”, wrote paediatrician Bo Vahlquist in 1981.1 3 years earlier, Derek and Patrice Jelliffe in their classic book Breast Milk in the Modern World2 stated that “breast-feeding is a matter of concern in both industrialised and developing countries because it has such a wide range of often underappreciated consequences”.3 The Jelliffes anticipated that breastfeeding would be relevant to “present-day interest in the consequences of infant nutrition on subsequent adult health”.3 These statements were challenged by the American Academy of Pediatrics, which in its 1984 report on the scientific evidence for breastfeeding stated that “if there are benefits associated with breast-feeding in populations with good sanitation, nutrition and medical care, the benefits are apparently modest”.4
In the past three decades, the evidence behind breastfeeding recommendations has evolved markedly (appendix p 3). Results from epidemiological studies and growing knowledge of the roles of epigenetics, stem cells, and the developmental origins of health and disease lend strong support to the ideas proposed by Vahlquist and the Jelliffes. Never before in the history of science has so much been known about the complex importance of breastfeeding for both mothers and children.
Here, in the first of two Series papers, we describe present patterns and past trends in breastfeeding throughout the world, review the short-term and long-term health consequences of breastfeeding for the child and mother, estimate potential lives saved by scaling up breastfeeding, and summarise insights into how
breastfeeding might permanently shape individuals’ life course. The second paper in the Series5 covers the determinants of breastfeeding and the effectiveness of promotion interventions. It discusses the role of breast-feeding in HIV transmission and how knowledge about this issue has evolved in the past two decades, and examines the lucrative market of breastmilk substitutes, the environmental role of breastfeeding, and its economic implications. In the context of the post-2015 development agenda, the two articles document how essential breastfeeding is for building a better world for future generations in all countries, rich and poor alike.
Lancet 2016; 387: 475–90
This is the first in a Series of two papers about breastfeeding
*Members listed at the end of the paper
International Center for Equity in Health, Post-Graduate Programme in Epidemiology, Federal University of Pelotas, Pelotas, Brazil (Prof C G Victora MD, Prof A J D Barros MD, G V A França PhD); Department of Maternal, Newborn, Child and Adolescent Health (MCA), WHO, Geneva, Switzerland (R Bahl MD, N C Rollins); Department of Economics, University of Waterloo, ON, Canada (Prof S Horton PhD); Data and Analytics Section, Division of Data, Research, and Policy, UNICEF, New York, NY, USA (J Krasevec MSc); University Hospital Coventry and Warwickshire, Coventry, UK (Prof S Murch PhD); WHO Collaborating Centre for Training and Research in Newborn Care, All India Institute of Medical Sciences (AIIMS), New Delhi, India (M J Sankar DM); and Institute for International Programs, Bloomberg School of Public Health, Baltimore, MD, USA (N Walker PhD)
Correspondence to: Prof Cesar G Victora, International Center for Equity in Health, Post-Graduate Programme in Epidemiology, Federal University of Pelotas, Pelotas, RS, 96020, Brazil [email protected]
See Online for appendix
Search strategy and selection criteria
We obtained information about the associations between breastfeeding and outcomes in children or mothers from 28 systematic reviews and meta-analyses, of which 22 were commissioned for this review. See appendix pp 23–30 for the databases searched and search terms used. We reviewed the following disorders for young children: child mortality; diarrhoea incidence and admission to hospital; lower respiratory tract infections incidence, prevalence, and admission to hospital; acute otitis media; eczema; food allergies; allergic rhinitis; asthma or wheezing; infant growth (length, weight, body-mass index); dental caries; and malocclusion. For older children, adolescents, and adults, we did systematic reviews for systolic and diastolic blood pressure; overweight and obesity; total cholesterol; type 2 diabetes; and intelligence. For mothers, we did systematic reviews covering the following outcomes: lactational amenorrhoea; breast and ovarian cancer; type 2 diabetes; post-partum weight change; and osteoporosis.

Series
476 www.thelancet.com Vol 387 January 30, 2016
Breastfeeding indicators and data sources for this reviewWHO has defined the following indicators for the study of feeding practices of infants and young children:6 early initiation of breastfeeding (proportion of children born in the past 24 months who were put to the breast within an hour of birth); exclusive breastfeeding under 6 months (proportion of infants aged 0–5 months who are fed exclusively with breastmilk. This indicator is based on the diets of infants younger than 6 months during the 24 h before the survey [to avoid recall bias], not on the proportion who are exclusively breastfed for the full 6-month period); continued breastfeeding at 1 year (proportion of children aged 12–15 months who are fed breastmilk); and continued breastfeeding at 2 years (proportion of children aged 20–23 months who are fed breastmilk).
Because few high-income countries report on the aforementioned indicators, we calculated additional indicators to allow global comparisons: ever breastfed (infants reported to have been breastfed, even if for a short period); breastfed at 6 months (in high-income countries, the proportion of infants who were breastfed from birth to 6 months or older; in low-income and middle-income countries [LMICs] with standardised surveys, the proportion of infants aged 4–7 months [median age of 6 months] who are breastfed); and breastfed at 12 months (in high-income countries, the proportion of children breastfed for 12 months or longer;
in LMICs, the proportion of children aged 10–13 months [median age of 12 months] who are breastfed).
For this review, we used the last three, additional indicators for comparisons between high-income countries and LMICs only. Otherwise, we reported on the standard international indicators (appendix p 4).
For LMICs, we reanalysed national surveys done since 1993, including Demographic and Health Surveys, Multiple Indicator Cluster Surveys, and others (appendix pp 5–12). Nearly all surveys had response rates higher than 90% and used standardised questionnaires and indicators.
For all high-income countries with 50 000 or more annual births, we did systematic reviews of published studies and the grey literature and contacted local researchers or public health practitioners when data from a particular country were not available or when there was ambiguity (appendix pp 13–17). Information about breastfeeding from national samples was not available from many countries. Although 27 out of 35 countries had some information about breastfeeding at a national level, response rates were often in the 50–70% range, indicators were rarely standardised, and recall periods tended to be long. We used administrative or other data when surveys were not available. If necessary, we estimated the proportion of infants breastfed at 12 months on the basis of information available for breastfeeding at 6 months and vice versa. We calculated time trends using multilevel linear regression models (hierarchical mixed models) that take into account that two or more surveys were included in the analyses for each country. We explored departures from linearity with fractional polynomial regression models.7 In all analyses, we weighted country data by their populations of children younger than 2 years of age (see appendix pp 18–22 for statistical methods).
We did systematic searches of the published literature, and, when possible, meta-analyses for outcomes postulated to be associated with breastfeeding (appendix pp 23–30). These systematic reviews and meta-analyses were specially commissioned by WHO to provide background information for this Series.
We used the Lives Saved Tool8 to predict how many deaths of children younger than 5 years would be prevented if breastfeeding patterns as of 2013 were scaled up in the 75 countries that are part of the Countdown to 2015 effort,9 which account for more than 95% of all such deaths worldwide. We assumed that 95% of children younger than 1 month and 90% of those younger than 6 months would be exclusively breastfed, and that 90% of those aged 6–23 months would be partly breastfed. We applied the relative risks for the protection against all infectious causes of death obtained from our new meta-analyses10 to all infectious causes of death in children younger than 2 years, and also to the 15% of deaths caused by complications of prematurity that occur after the first week of life
Key messages
• Childrenwhoarebreastfedforlongerperiodshavelowerinfectious morbidity and mortality, fewer dental malocclusions, and higher intelligence than do those who are breastfed for shorter periods, or not breastfed. This inequality persists until later in life. Growing evidence also suggests that breastfeeding might protect against overweight and diabetes later in life.
• Breastfeedingbenefitsmothers.Itcanpreventbreastcancer, improve birth spacing, and might reduce a woman’s risk of diabetes and ovarian cancer.
• High-incomecountrieshaveshorterbreastfeedingduration than do low-income and middle-income countries. However, even in low-income and middle-income countries, only 37% of infants younger than 6 months are exclusively breastfed.
• Thescalingupofbreastfeedingcanpreventanestimated823 000 child deaths and 20 000 breast cancer deaths every year.
• Findingsfromstudiesdonewithmodernbiologicaltechniques suggest novel mechanisms that characterise breastmilk as a personalised medicine for infants.
• Breastfeedingpromotionisimportantinbothrichandpoor countries alike, and might contribute to achievement of the forthcoming Sustainable Development Goals.
For the Demographic and Health Surveys see http://www.measuredhs.com/aboutsurveys/
dhs/start.cfm
For the Multiple Indicator Cluster Surveys see http://mics.
unicef.org/surveys

Series
www.thelancet.com Vol 387 January 30, 2016 477
(appendix pp 31–36). We also estimated the potential number of deaths from breast cancer that could have been prevented by extending the duration of breastfeeding (appendix pp 37–38).
Epidemiology: levels and trendsWe obtained complete information about 127 of the 139 LMICs (appendix pp 5–12), accounting for 99% of children from such countries. For high-income countries, we obtained data for 37 of 75 countries, but for several countries, only a subset of the indicators were available (appendix pp 13–17): these data should, therefore, be interpreted with caution.
Globally, the prevalence of breastfeeding at 12 months is highest in sub-Saharan Africa, south Asia, and parts of Latin America (figure 1). In most high-income countries, the prevalence is lower than 20% (appendix pp 13–17). We noted important differences—eg, between the UK (<1%) and the USA (27%), and between Norway (35%) and Sweden (16%).
We assessed breastfeeding indicators according to country income groups (figure 2). Information about early initiation or exclusive or continued breastfeeding at 2 years was not available for most high-income countries. We noted a strong inverse correlation (Pearson’s r=–0·84; p<0·0001; appendix p 39) between breastfeeding at 6 months and log gross domestic product per person; our regression analyses showed that for each doubling in the gross domestic product per head, breastfeeding prevalence at 12 months decreased by ten percentage points.
Most mothers in all country groups started breastfeeding; only three countries (France, Spain, and the USA) had rates below 80% for ever breastfeeding. However, early
initiation was low in all settings, as was exclusive breastfeeding (figure 2). Breastfeeding at 12 months was widespread in low-income and lower-middle-income settings, but uncommon elsewhere.
Except for early initiation, prevalence of all indicators decreased with increasing national wealth. Low-income countries had a high prevalence of breastfeeding at all ages, but the rates of initiation and exclusive breastfeeding are unsatisfactory even in these countries.
Surprisingly, most national level breastfeeding indicators were not strongly correlated (appendix p 39). We found only a moderate correlation (Pearson’s r=0·54) between exclusive and continued breastfeeding at 1 year in LMICs. Although the prevalence of
Figure 1: Global distribution of breastfeeding at 12 monthsData are from 153 countries between 1995 and 2013.
0
Percentage of children who receive any breastmilk at 12 months of age (%)
10 20 30 40 50 60 70 80 90 100No data
Figure 2: Breastfeeding indicators by country income group in 2010Data are from national surveys that used standard indicators, and were weighted by national populations of children under 2 years. Data for up to 153 countries.
Early initiationof breastfeeding
Everbreastfed
Exclusive breastfeedingat 0–5 months
Breastfeedingat 6 months
Breastfeedingat 12 months
Continued breastfeeding20–23 months
0 20 40 60 80 100Percentage of children
Low income Lower-middle income Upper-middle income High income

Series
478 www.thelancet.com Vol 387 January 30, 2016
continued breastfeeding was high throughout west and central Africa, rates of exclusive breastfeeding varied widely (figure 3). Countries from eastern and southern Africa tended to have on average lower rates of continued breastfeeding but higher rates of exclusive breastfeeding than did those in west Africa. In Latin America and the Caribbean, and in central and eastern Europe and the Commonwealth of Independent States, both indicators tended to be lower than in Africa. South Asian countries had high rates of both indicators whereas countries in the Middle East and north Africa had lower rates. Countries from east Asia and the Pacific region had moderate to high prevalence of both indicators.
In children younger than 6 months in LMICs, 36·3 million (63%) were not exclusively breastfed at the time of the most recent national survey. The corresponding percentages were 53% in low-income countries, 61% in lower-middle-income countries, and 63% in upper-middle-income countries. In children aged 6–23 months in LMICs, 64·8 million (37%) were not receiving any breastmilk at the time of the most recent national survey, with corresponding rates of 18% in low-income, 34% in lower-middle-income, and 55% in upper-middle-income countries. 101·1 million children in LMICs were not breastfed according to international recommendations.
In most LMICs, data were available from several surveys over time, making it possible to explore time trends both at the national level and for children in the poorest and richest 20% of families. Our analyses were restricted to surveys for which breakdown of
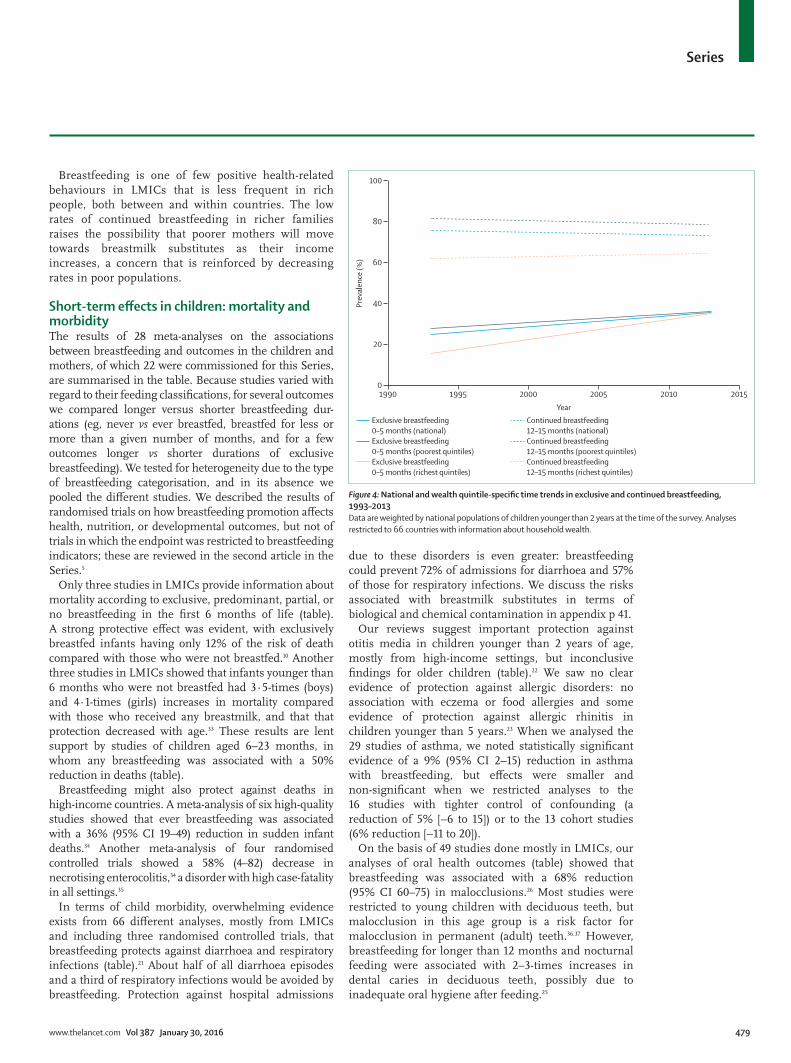
breastfeeding indicators by wealth quintiles was possible (214 surveys for exclusive and 217 for continued breastfeeding; appendix pp 18–22), accounting for 83% of the total 2010 population of children younger than 2 years of age in LMICs. We reported linear trends because there was no evidence of departures from linearity. Exclusive breastfeeding rates increased slightly from 24·9% in 1993 to 35·7% in 2013 (figure 4). In the richest 20% of families, the increase was much steeper, whereas the poorest 20% followed the general trend. Continued breastfeeding at 1 year (12–15 months) dropped slightly at the global level (from 76·0% to 73·3%), partly due to a decline among the poorest 20% in each country (figure 4).
Epidemiology: within-country inequalitiesWe analysed 98 surveys from LMICs to investigate within-country inequalities according to wealth quintile (appendix p 40). Wealth-related inequalities in exclusive breastfeeding were small but disparities in continued breastfeeding rates were consistent: poorer people tend to breastfeed for longer than their richer counterparts in all country groupings, but especially in middle-income countries. Similar results based on 33 countries have been reported elsewhere.11
Our review of studies from high-income countries showed that high-income, better-educated women breast-feed more commonly than do those in low-income groups with fewer years of formal education.12–20 Breastfeeding initiation in the USA was more common in mothers with lower education up until the 1960s, but the social gradient has since reversed.4
Figure 3: The relation between exclusive breastfeeding at 0–5 months and continued breastfeeding at 12–15 months, by regionDatapoints are countries (values from the most recent survey from 117 countries, 2000–13) and are coloured according to their region. The shaded ellipses include at least 80% of the points in each region.
0 20 40 60 80 1000
20
40
60
100
80
Cont
inue
d br
east
feed
ing
at 1
2–15
mon
ths (
%)
Exclusive breastfeeding at 0–5 months (%)
Central and eastern Europe and theCommonwealth of Independent StatesEast Asia and PacificEastern and southern AfricaLatin America and the CaribbeanMiddle East and north AfricaSouth AsiaWest and central Africa
Series
www.thelancet.com Vol 387 January 30, 2016 479
Breastfeeding is one of few positive health-related behaviours in LMICs that is less frequent in rich people, both between and within countries. The low rates of continued breastfeeding in richer families raises the possibility that poorer mothers will move towards breastmilk substitutes as their income increases, a concern that is reinforced by decreasing rates in poor populations.
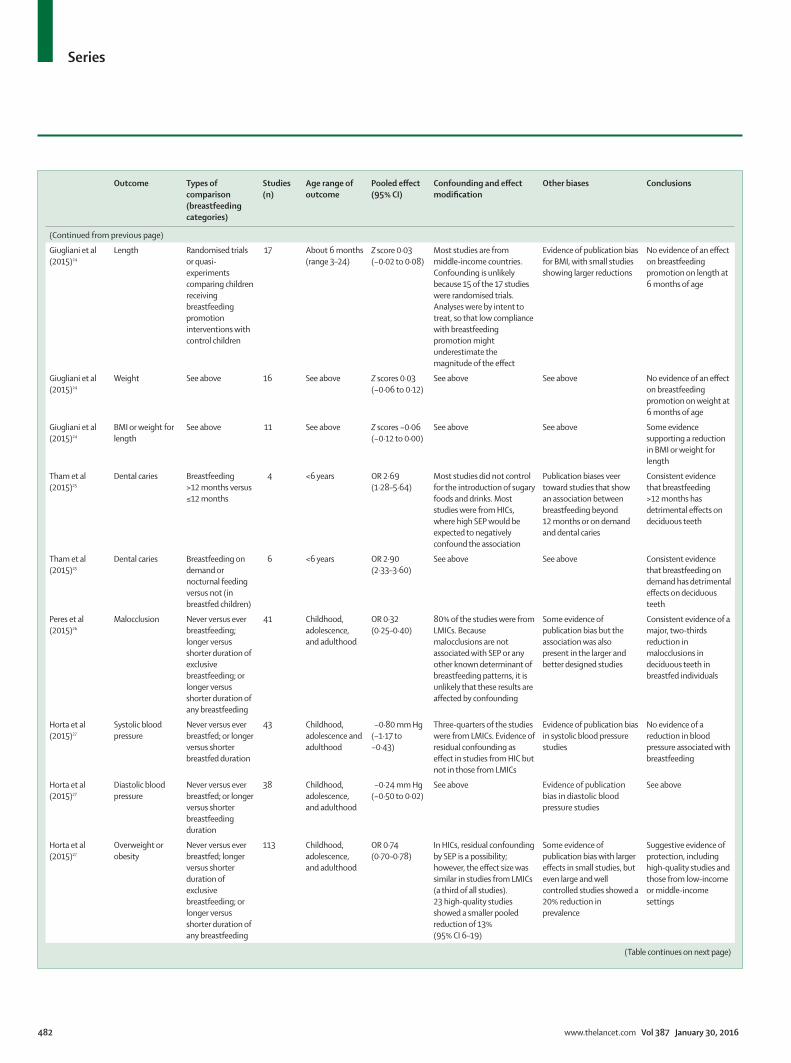
Short-term effects in children: mortality and morbidityThe results of 28 meta-analyses on the associations between breastfeeding and outcomes in the children and mothers, of which 22 were commissioned for this Series, are summarised in the table. Because studies varied with regard to their feeding classifications, for several outcomes we compared longer versus shorter breastfeeding dur-ations (eg, never vs ever breastfed, breastfed for less or more than a given number of months, and for a few outcomes longer vs shorter durations of exclusive breastfeeding). We tested for heterogeneity due to the type of breastfeeding categorisation, and in its absence we pooled the different studies. We described the results of randomised trials on how breastfeeding promotion affects health, nutrition, or developmental outcomes, but not of trials in which the endpoint was restricted to breastfeeding indicators; these are reviewed in the second article in the Series.5
Only three studies in LMICs provide information about mortality according to exclusive, predominant, partial, or no breastfeeding in the first 6 months of life (table). A strong protective effect was evident, with exclusively breastfed infants having only 12% of the risk of death compared with those who were not breastfed.10 Another three studies in LMICs showed that infants younger than 6 months who were not breastfed had 3·5-times (boys) and 4·1-times (girls) increases in mortality compared with those who received any breastmilk, and that that protection decreased with age.33 These results are lent support by studies of children aged 6–23 months, in whom any breastfeeding was associated with a 50% reduction in deaths (table).
Breastfeeding might also protect against deaths in high-income countries. A meta-analysis of six high-quality studies showed that ever breastfeeding was associated with a 36% (95% CI 19–49) reduction in sudden infant deaths.34 Another meta-analysis of four randomised controlled trials showed a 58% (4–82) decrease in necrotising enterocolitis,34 a disorder with high case-fatality in all settings.35
In terms of child morbidity, overwhelming evidence exists from 66 different analyses, mostly from LMICs and including three randomised controlled trials, that breastfeeding protects against diarrhoea and respiratory infections (table).21 About half of all diarrhoea episodes and a third of respiratory infections would be avoided by breastfeeding. Protection against hospital admissions
due to these disorders is even greater: breastfeeding could prevent 72% of admissions for diarrhoea and 57% of those for respiratory infections. We discuss the risks associated with breastmilk substitutes in terms of biological and chemical contamination in appendix p 41.
Our reviews suggest important protection against otitis media in children younger than 2 years of age, mostly from high-income settings, but inconclusive findings for older children (table).22 We saw no clear evidence of protection against allergic disorders: no association with eczema or food allergies and some evidence of protection against allergic rhinitis in children younger than 5 years.23 When we analysed the 29 studies of asthma, we noted statistically significant evidence of a 9% (95% CI 2–15) reduction in asthma with breastfeeding, but effects were smaller and non-significant when we restricted analyses to the 16 studies with tighter control of confounding (a reduction of 5% [−6 to 15]) or to the 13 cohort studies (6% reduction [−11 to 20]).
On the basis of 49 studies done mostly in LMICs, our analyses of oral health outcomes (table) showed that breastfeeding was associated with a 68% reduction (95% CI 60–75) in malocclusions.26 Most studies were restricted to young children with deciduous teeth, but malocclusion in this age group is a risk factor for malocclusion in permanent (adult) teeth.36,37 However, breastfeeding for longer than 12 months and nocturnal feeding were associated with 2–3-times increases in dental caries in deciduous teeth, possibly due to inadequate oral hygiene after feeding.25
Figure 4: National and wealth quintile-specific time trends in exclusive and continued breastfeeding, 1993–2013Data are weighted by national populations of children younger than 2 years at the time of the survey. Analyses restricted to 66 countries with information about household wealth.
1990 1995 2000 2005 2010 20150
20
40
60
80
100
Prev
alen
ce (%
)
YearExclusive breastfeeding 0–5 months (national)Exclusive breastfeeding 0–5 months (poorest quintiles)Exclusive breastfeeding 0–5 months (richest quintiles)
Continued breastfeeding 12–15 months (national)Continued breastfeeding 12–15 months (poorest quintiles)Continued breastfeeding 12–15 months (richest quintiles)

Series
480 www.thelancet.com Vol 387 January 30, 2016
Information about breastfeeding and child growth was derived from 17 studies, including 15 randomised controlled trials, mostly from middle-income countries.24 Attained weight and length at about 6 months did not differ, but there was a small reduction (Z score −0·06 [95% CI –0·12 to 0·00]) in body-mass index (BMI) or bodyweight for length in children whose mothers received the breastfeeding promotion intervention compared with those whose mothers did not receive the promotion intervention (table).
Long-term effects in children: obesity, non-communicable diseases, and intelligenceWe updated existing meta-analyses38 on the associations between breastfeeding and outcomes related to non-communicable diseases (table). Most studies are from high-income settings. Based on all 113 studies identified, longer periods of breastfeeding were associated with a 26% reduction (95% CI 22–30) in the odds of overweight or obesity.27 The effect was consistent across income classifications. The only breastfeeding promotion trial
Outcome Types of comparison (breastfeeding categories)
Studies (n)
Age range of outcome
Pooled effect (95% CI)
Confounding and effect modification
Other biases Conclusions
Effects on children, adolescents, or adults according to breastfeeding pattern
Sankar et al (2015)10
Mortality due to infectious diseases
Exclusive versus predominant
3 <6 months OR 0·59 (0·41–0·85)
All studies from LMICs, where confounding by SEP would probably underestimate the effect of breastfeeding. Confounder-adjusted studies showed similar effects
Studies that avoided reverse causation (breastfeeding stopped because of illness) showed similar effects. No evidence of publication bias but very few studies available
Consistent evidence of major protection. Few studies used the four breastfeeding categories in young infants, but evidence from other studies comparing any versus no breastfeeding is very consistent
Sankar et al (2015)10
Mortality due to infectious diseases
Exclusive versus partial
3 <6 months OR 0·22 (0·14–0·34)
See above See above See above
Sankar et al (2015)10
Mortality due to infectious diseases
Exclusive versus none
2 <6 months OR 0·12 (0·04–0·31)
See above See above See above
Sankar et al (2015)10
Mortality due to infectious diseases
Any versus none 9 6–23 months OR 0·48 (0·38–0·60)
See above See above See above
Horta et al (2013)21
Diarrhoea incidence
More versus less breastfeeding (eg, exclusive vs non-exclusive; predominant vs partial; partial vs none; any breastfeeding vs no breastfeeding)
15 <5 years RR 0·69 (0·58–0·82)
Most studies were from LMICs, where confounding would probably underestimate an effect. Confounder-adjusted studies showed similar effects. Three RCTs of breastfeeding promotion (not included in the meta-analysis) showed protection against diarrhoea morbidity (pooled OR 0·69 [0·49–0·96])
Few studies that allowed for reverse causation also showed protection. Publication bias is unlikely toexplainthefindingsbecause results from large and small studies were similar
Strong evidence of major protection against diarrhoea morbidity and admissions to hospital, particularly in young infants, based on a large number of studies
Horta et al (2013)21
Diarrhoea incidence
See above 23 <6 months RR 0·37 (0·27–0·50)
See above See above See above
Horta et al (2013)21
Diarrhoea incidence
See above 11 6 months to 5 years
RR 0·46 (0·28–0·78)
See above See above See above
Horta et al (2013)21
Admission to hospital for diarrhoea
See above 9 <5 years RR 0·28 (0·16–0·50)
See above See above See above
Horta et al (2013)21
Lower respiratory infections (incidence or prevalence)
See above 16 <2 years RR 0·68 (0·60–0·77)
Most studies were from LMICs, where confounding would probably underestimate the effect of breastfeeding. Confounder-adjusted studies showed similar effects
Studies that avoided reverse causation showed similar effects. No evidence of publication bias
Strong evidence of a reduction in severe respiratory infections in breastfed children, based on a large number of studies
Horta et al (2013)21
Admissions to hospitals for respiratory infections
See above 17 <2 years RR 0·43 (0·33–0·55)
The only available RCT showed an RR of 0·85 (0·57–1·27),anon-significantreduction in admissions to hospital
See above See above
(Table continues on next page)

Series
www.thelancet.com Vol 387 January 30, 2016 481
that reported on this outcome did not detect an association; in this trial, the investigators reported important early differences between inter vention and comparison groups in terms of exclusive breastfeeding, but at 12 months of age only 19% of children in the intervention group and 11% of children in the comparison
group were breastfed.39,40 A 2005 meta-analysis41 of breastfeeding and mean BMI included 36 articles of which 11 included adjustment for socioeconomic status, maternal smoking, and maternal BMI; their pooled effect did not suggest an association with breastfeeding. In our review,27 23 high-quality studies with sample sizes of
Outcome Types of comparison (breastfeeding categories)
Studies (n)
Age range of outcome
Pooled effect (95% CI)
Confounding and effect modification
Other biases Conclusions
(Continued from previous page)
Bowatte et al (2015)22
Acute otitis media More versus less breastfeeding (ever vs never; exclusive breastfeeding at 6 months vs not exclusive breastfeeding at 6 months; any breastfeeding for ≥3–4 months vs <3–4 months)
11 ≤2 years OR 0·67 (0·62–0·72)
Egger’s test for small study effects showed weak evidence for publication bias (p=0·360)
Consistent evidence of reduction in acute otitis mediaduringthefirst2 years of life associated with longer durations of breastfeeding, based on 11 studies. No evidence of protection after 2 years
Bowatte et al (2015)22
Acute otitis media See above 5 >2 years OR 1·21 (0·60–2·45)
Most studies were done in HICs. Several studies did not adjust for important confounders
High heterogeneity (I=84%)amongthefivestudies of children older than 2 years
See above
Lodge et al (2015)23
Eczema More versus less breastfeeding (ever vs never; exclusive breastfeeding at 6 months vs not exclusive breastfeeding at 6 months; any breastfeeding for ≥3–4 months vs <3–4 months)
17 ≤2 years OR 0·95 (0·85–1·07)
About a third of the studies were from LMICs, and results are similar to those from HICs. Few studies in young children account for reverse causation. Several studies did not adjust for essential confounders
Some evidence of publication bias, with smaller pooled effect sizes in larger studies
No evidence of an association between breastfeeding and eczema
Lodge et al (2015)23
Ezcema See above 20 >2 years OR 1·09 (0·99–1·20)
See above See above See above
Lodge et al (2015)23
Food allergies See above 10 ≤5 years OR 1·07 (0·90–1·26)
See above The ten studies on food allergy in children ≤5 years were highly heterogeneous (I=88%)
No evidence of an association between breastfeeding and food allergies
Lodge et al (2015)23
Food allergies See above 4 >5 years OR 1·08 (0·73–1·26)
See above See above See above
Lodge et al (2015)23
Allergic rhinitis See above 5 ≤5 years OR 0·79 (0·63–0·98)
See above See above Possible protection against allergic rhinitis in children <5 years, basedononlyfivestudies
Lodge et al (2015)23
Allergic rhinitis See above 9 >5 years OR 1·05 (0·99–1·12)
See above See above No evidence for those older than 5 years
Lodge et al (2015)23
Asthma or wheezing
See above 29 5–18 years OR 0·91 (0·85–0·98)
The protective effect of asthma was smaller and not significantin16studieswiththorough control for confounders (OR 0·95 [0·85–1·06]) and in the 13 cohort studies (OR 0·94 [0·80–1·11]). There were too few studies to estimate association with asthma in adults
See above Inconclusive evidence for the association between breastfeeding and the risk of asthma or wheezing
(Table continues on next page)
Series
482 www.thelancet.com Vol 387 January 30, 2016
Outcome Types of comparison (breastfeeding categories)
Studies (n)
Age range of outcome
Pooled effect (95% CI)
Confounding and effect modification
Other biases Conclusions
(Continued from previous page)
Giugliani et al (2015)24
Length Randomised trials or quasi-experiments comparing children receiving breastfeeding promotion interventions with control children
17 About 6 months (range 3–24)
Z score 0·03 (−0·02 to 0·08)
Most studies are from middle-income countries. Confounding is unlikely because 15 of the 17 studies were randomised trials. Analyses were by intent to treat, so that low compliance with breastfeeding promotion might underestimate the magnitude of the effect
Evidence of publication bias for BMI, with small studies showing larger reductions
No evidence of an effect on breastfeeding promotion on length at 6 months of age
Giugliani et al (2015)24
Weight See above 16 See above Z scores 0·03 (−0·06 to 0·12)
See above See above No evidence of an effect on breastfeeding promotion on weight at 6 months of age
Giugliani et al (2015)24
BMI or weight for length
See above 11 See above Z scores −0·06 (−0·12 to 0·00)
See above See above Some evidence supporting a reduction in BMI or weight for length
Tham et al (2015)25
Dental caries Breastfeeding >12 months versus ≤12 months
4 <6 years OR 2·69 (1·28–5·64)
Most studies did not control for the introduction of sugary foods and drinks. Most studies were from HICs, where high SEP would be expected to negatively confound the association
Publication biases veer toward studies that show an association between breastfeeding beyond 12 months or on demand and dental caries
Consistent evidence that breastfeeding >12 months has detrimental effects on deciduous teeth
Tham et al (2015)25
Dental caries Breastfeeding on demand or nocturnal feeding versus not (in breastfed children)
6 <6 years OR 2·90 (2·33–3·60)
See above See above Consistent evidence that breastfeeding on demand has detrimental effects on deciduous teeth
Peres et al (2015)26
Malocclusion Never versus ever breastfeeding; longer versus shorter duration of exclusive breastfeeding; or longer versus shorter duration of any breastfeeding
41 Childhood, adolescence, and adulthood
OR 0·32 (0·25–0·40)
80% of the studies were from LMICs. Because malocclusions are not associated with SEP or any other known determinant of breastfeeding patterns, it is unlikely that these results are affected by confounding
Some evidence of publication bias but the association was also present in the larger and better designed studies
Consistent evidence of a major, two-thirds reduction in malocclusions in deciduous teeth in breastfed individuals
Horta et al (2015)27
Systolic blood pressure
Never versus ever breastfed; or longer versus shorter breastfed duration
43 Childhood, adolescence and adulthood
−0·80 mm Hg (−1·17 to −0·43)
Three-quarters of the studies were from LMICs. Evidence of residual confounding as effect in studies from HIC but not in those from LMICs
Evidence of publication bias in systolic blood pressure studies
No evidence of a reduction in blood pressure associated with breastfeeding
Horta et al (2015)27
Diastolic blood pressure
Never versus ever breastfed; or longer versus shorter breastfeeding duration
38 Childhood, adolescence, and adulthood
−0·24 mm Hg (−0·50 to 0·02)
See above Evidence of publication bias in diastolic blood pressure studies
See above
Horta et al (2015)27
Overweight or obesity
Never versus ever breastfed; longer versus shorter duration of exclusive breastfeeding; or longer versus shorter duration of any breastfeeding
113 Childhood, adolescence, and adulthood
OR 0·74 (0·70–0·78)
In HICs, residual confounding by SEP is a possibility; however, the effect size was similar in studies from LMICs (a third of all studies). 23 high-quality studies showed a smaller pooled reduction of 13% (95% CI 6–19)
Some evidence of publication bias with larger effects in small studies, but even large and well controlled studies showed a 20% reduction in prevalence
Suggestive evidence of protection, including high-quality studies and those from low-income or middle-income settings
(Table continues on next page)

Series
www.thelancet.com Vol 387 January 30, 2016 483
Outcome Types of comparison (breastfeeding categories)
Studies (n)
Age range of outcome
Pooled effect (95% CI)
Confounding and effect modification
Other biases Conclusions
(Continued from previous page)
Horta et al (2015)27
Total cholesterol Never versus ever breastfed; or longer versus shorter breastfeeding duration
46 Childhood, adolescence, and adulthood
−0·01 mmol/L (−0·05 to 0·02)
No evidence of heterogeneity with nearly all studies showing small effects. Three-quarters of the studies were from HICs
No evidence of an association
No evidence of an association
Horta et al (2015)27
Type 2 diabetes Never versus ever breastfed; longer versus shorter duration of exclusive breastfeeding; or longer versus shorter duration of any breastfeeding
11 Childhood, adolescence, and adulthood
OR 0·65 (0·49–0·86)
Only two of 11 studies were from LMICs; these studies showed 14% reduction; residual confounding might have affected HIC studies
Few available studies; no evidence of publication bias
Restricted evidence of protection, based on 11 studies
Horta et al (2015)28
Intelligence Never versus ever breastfed; or longer versus shorter breastfeeding duration
16 Childhood, adolescence, and adulthood
IQ points: 3·44 (2·30–4·58)
In HICs (14 of the 16 studies), residual confounding by SEP was a possibility; however, the effect was also present in two studies from LMICs. One high-quality RCT showed a statistically significantincrease in IQ of more than 7 points
Some evidence of publication bias with larger effects in small studies, but even large studies showed an effect. Nine studies with adjustment for maternal IQ showed difference of 2·62 points (1·25–3·98)
Consistent effect of about 3 IQ points in observational studies; also present a large RCT on this topic
Effects on women who breastfed
Chowdhury et al (2015)29
Lactational amenorrhoea
Highest versus lowest duration of breastfeeding
13 Women (<1 year post partum)
RR 1·17 (1·04–1·32)
Most studies were from LMICs. Residual confounding unlikely. Strongest effects when exclusive or predominant breastfeeding are compared with partial (RR 1·21) or no breastfeeding (RR 1·23)
No evidence of publication bias
Consistent effect on prolonging lactational amenorrhoea, especially for exclusive or predominant breastfeeding
Chowdhury et al (2015)29
Breast cancer Highest versus lowest duration of breastfeeding
76 Adult women OR 0·81 (0·77–0·86)
Three-quarters of the studies were from HICs. Parity reduces the risk of breast cancer and is also associated with greater lifetime breastfeeding duration. Most studies did not adjust appropriately for parity and therefore tended to exaggerate effect size. A thoroughly adjusted pooled analysis of 47 studies shows an OR of 0·96 for each 12 months of breastfeeding30
Some evidence of publication bias but the association was also present in the larger and better designed studies
Consistent protective effect of breastfeeding against breast cancer in 47 well designed studies, of a 4·3% reduction per 12 months of breastfeeding in the better controlled studies
Chowdhury et al (2015)29
Ovarian cancer Highest versus lowest duration of breastfeeding
41 Adult women OR 0·70 (0·64–0·75)
Only six studies from LMICs. Confounding by parity might affect the results but socioeconomic confounding isunlikely.Studieswithfineadjustment for parity and exclusion of nulliparous women showed less protection with an OR of 0·82 (0·75–0·89)
Some evidence of publication bias, with smaller pooled effect sizes in the 22 studies with samples larger than 1500 women (OR 0·76 [0·69–0·84])
Suggestive evidence of a protective effect of breastfeeding
Chowdhury et al (2015)29
Osteoporosis (distal radius)
Highest versus lowest duration of breastfeeding
4 Adult women SDS −0·132 (−0·260 to –0·003)
All studies from HICs. High heterogeneity in the distal radius analyses with the largest study showing no association and smaller studies showing protection
Not assessed because of small number of studies
Insufficient evidence
(Table continues on next page)
Series
484 www.thelancet.com Vol 387 January 30, 2016
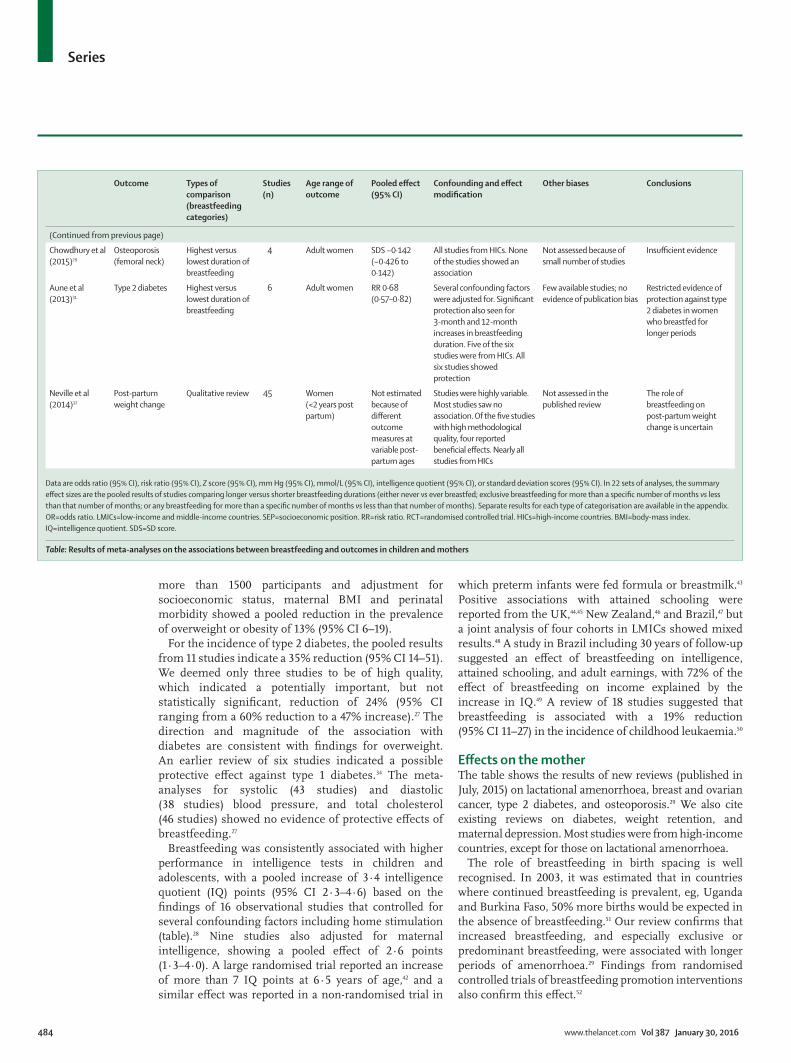
more than 1500 participants and adjustment for socioeconomic status, maternal BMI and perinatal morbidity showed a pooled reduction in the prevalence of overweight or obesity of 13% (95% CI 6–19).
For the incidence of type 2 diabetes, the pooled results from 11 studies indicate a 35% reduction (95% CI 14–51). We deemed only three studies to be of high quality, which indicated a potentially important, but not statistically significant, reduction of 24% (95% CI ranging from a 60% reduction to a 47% increase).27 The direction and magnitude of the association with diabetes are consistent with findings for overweight. An earlier review of six studies indicated a possible protective effect against type 1 diabetes.34 The meta-analyses for systolic (43 studies) and diastolic (38 studies) blood pressure, and total cholesterol (46 studies) showed no evidence of protective effects of breastfeeding.27
Breastfeeding was consistently associated with higher performance in intelligence tests in children and adolescents, with a pooled increase of 3·4 intelligence quotient (IQ) points (95% CI 2·3–4·6) based on the findings of 16 observational studies that controlled for several confounding factors including home stimulation (table).28 Nine studies also adjusted for maternal intelligence, showing a pooled effect of 2·6 points (1·3–4·0). A large randomised trial reported an increase of more than 7 IQ points at 6·5 years of age,42 and a similar effect was reported in a non-randomised trial in
which preterm infants were fed formula or breastmilk.43 Positive associations with attained schooling were reported from the UK,44,45 New Zealand,46 and Brazil,47 but a joint analysis of four cohorts in LMICs showed mixed results.48 A study in Brazil including 30 years of follow-up suggested an effect of breastfeeding on intelligence, attained schooling, and adult earnings, with 72% of the effect of breastfeeding on income explained by the increase in IQ.49 A review of 18 studies suggested that breastfeeding is associated with a 19% reduction (95% CI 11–27) in the incidence of childhood leukaemia.50
Effects on the motherThe table shows the results of new reviews (published in July, 2015) on lactational amenorrhoea, breast and ovarian cancer, type 2 diabetes, and osteoporosis.29 We also cite existing reviews on diabetes, weight retention, and maternal depression. Most studies were from high-income countries, except for those on lactational amenorrhoea.
The role of breastfeeding in birth spacing is well recognised. In 2003, it was estimated that in countries where continued breastfeeding is prevalent, eg, Uganda and Burkina Faso, 50% more births would be expected in the absence of breastfeeding.51 Our review confirms that increased breastfeeding, and especially exclusive or predominant breastfeeding, were associated with longer periods of amenorrhoea.29 Findings from randomised controlled trials of breastfeeding promotion interventions also confirm this effect.52
Outcome Types of comparison (breastfeeding categories)
Studies (n)
Age range of outcome
Pooled effect (95% CI)
Confounding and effect modification
Other biases Conclusions
(Continued from previous page)
Chowdhury et al (2015)29
Osteoporosis (femoral neck)
Highest versus lowest duration of breastfeeding
4 Adult women SDS −0·142 (−0·426 to 0·142)
All studies from HICs. None of the studies showed an association
Not assessed because of small number of studies
Insufficient evidence
Aune et al (2013)31
Type 2 diabetes Highest versus lowest duration of breastfeeding
6 Adult women RR 0·68 (0·57–0·82)
Several confounding factors wereadjustedfor.Significantprotection also seen for 3-month and 12-month increases in breastfeeding duration. Five of the six studies were from HICs. All six studies showed protection
Few available studies; no evidence of publication bias
Restricted evidence of protection against type 2 diabetes in women who breastfed for longer periods
Neville et al (2014)32
Post-partum weight change
Qualitative review 45 Women (<2 years post partum)
Not estimated because of different outcome measures at variable post-partum ages
Studies were highly variable. Most studies saw no association.Ofthefivestudieswith high methodological quality, four reported beneficialeffects.Nearlyallstudies from HICs
Not assessed in the published review
The role of breastfeeding on post-partum weight change is uncertain
Data are odds ratio (95% CI), risk ratio (95% CI), Z score (95% CI), mm Hg (95% CI), mmol/L (95% CI), intelligence quotient (95% CI), or standard deviation scores (95% CI). In 22 sets of analyses, the summary effect sizes are the pooled results of studies comparing longer versus shorter breastfeeding durations (either never vseverbreastfed;exclusivebreastfeedingformorethanaspecificnumberofmonthsvs less thanthatnumberofmonths;oranybreastfeedingformorethanaspecificnumberofmonthsvs less than that number of months). Separate results for each type of categorisation are available in the appendix. OR=odds ratio. LMICs=low-income and middle-income countries. SEP=socioeconomic position. RR=risk ratio. RCT=randomised controlled trial. HICs=high-income countries. BMI=body-mass index. IQ=intelligence quotient. SDS=SD score.
Table: Results of meta-analyses on the associations between breastfeeding and outcomes in children and mothers

Series
www.thelancet.com Vol 387 January 30, 2016 485
Evidence exists of a robust inverse association between breastfeeding and breast cancer (table). The largest individual-level analysis on this topic included about 50 000 patients with cancer from 47 studies,30 which is about half those included in our meta-analysis. Each 12-month increase in lifetime breast feeding was associated with a reduction of 4·3% (95% CI 2·9–6·8) in the incidence of invasive breast cancer. This analysis included thorough adjustment parity and other confounders; nulliparous women were excluded. The results did not vary substantially according to menopausal status. Our meta-analysis suggests a higher magnitude of protection, but when restricted to the 14 studies with fine adjustment for parity and exclusion of nulliparous women, the reduction comparing longer versus shorter breastfeeding durations was 7% (95% CI 3–11).29
The meta-analysis of 41 studies on breastfeeding and ovarian cancer shows a 30% reduction associated with longer periods of breastfeeding (95% CI 25–36). Confounding by parity might affect the results but socio-economic confounding is unlikely because socioeconomic status is only weakly associated with ovarian cancer incidence. The pooled reduction, based on studies with fine adjustment for parity and exclusion of nulliparous women, was 18% (14–42).29 We also reviewed the evidence on osteoporosis, finding no evidence of an association between breastfeeding and bone mineral density in the four studies available (table).29
A meta-analysis of six cohort studies on type 2 diabetes showed an odds ratio of 0·68 (95% CI 0·57–0·82).31 In view of this finding, an association could be predicted with overweight, but a review of 54 articles on the possible role of breastfeeding on post-partum weight change was inconclusive.32 Few studies are available for the long-term association between nursing and adiposity. After the review of studies on overweight and breastfeeding was published, an analysis of 740 000 British women with long-term follow-up showed that mean BMI was 1% lower for every 6 months that the woman had breastfed.53 A qualitative review of 48 studies showed clear associations between breastfeeding and reduced mat-ernal depression,54 but it is more likely that depression affects breastfeeding than the opposite.
Estimating lives saved for children and mothersThe Lives Saved Tool8 estimates that 823 000 annual deaths would be saved in 75 high-mortality LMICs in 2015 if breastfeeding was scaled up to near universal levels. This corresponds to 13·8% of the deaths of children under 2 years of age. For preventable deaths, 87% would have occurred in infants younger than 6 months due to a combination of high death rates and low prevalence of exclusive breastfeeding.
We also estimated the potential effect of breastfeeding on breast cancer mortality (appendix pp 31–37). Using the estimates of protection from the pooled study, we estimate
that existing global rates of breastfeeding avert 19 464 annual breast cancer deaths compared with a scenario in which no women breastfed (table).30 The low-income regions with long breastfeeding durations (Africa and south Asia) account for 58% of currently prevented deaths, despite only accounting for 36% of the global population included in this analysis. We also estimate that an additional 22 216 lives per year would be saved by increasing breastfeeding duration from present levels to 12 months per child in high-income countries and 2 years per child in LMICs. We cannot model the same effect in all countries given the differences in data availability and the fact that very few children in high-income countries are breastfed for longer than 12 months. Latin America, central and eastern Europe, the Commonwealth of Independent States, and high-income countries would benefit most because of their higher incidence of breast cancer and also shorter breastfeeding durations at present.
ConclusionsThe fact that the reproductive cycle includes breastfeeding and pregnancy1 has been largely neglected by medical practice, leading to the assumption that breastmilk can be replaced with artificial products without detrimental consequences. This neglect is particularly important in high-income countries, where fewer than one in every five children are breastfed by the age of 12 months. For each doubling in national gross domestic product per person, breastfeeding prevalence at 12 months decreases by 10 percentage points.
Findings from epidemiology and biology studies substantiate the fact that the decision to not breastfeed a child has major long-term effects on the health, nutrition, and development of the child and on women’s health. Possibly, no other health behaviour can affect such varied outcomes in the two individuals who are involved: the mother and the child. Findings from immunology, epigenetic, microbiome, and stem-cell studies done over the past two decades that elucidate potential mechanisms through which breastfeeding can improve outcomes will probably be followed by other, even more exciting dis-coveries on the exquisite personalised medicine provided by human milk (panel).
Our global analyses show that more than 80% of neonates receive breastmilk in nearly all countries. However, only about half begin breastfeeding within the first hour of life, even though such a recommendation was issued by WHO more than 25 years ago.70 Because 60% of the world’s children are now delivered by skilled assistants,9 further promotion of early initiation is possible. In most countries, rates of exclusive breastfeeding are well below 50%, and the correlation with the duration of any breastfeeding is only moderate. This finding signals the need to tailor breastfeeding support strategies to specific patterns recorded in each country. In the poorest countries, late initiation and low rates of exclusive breastfeeding are the main challenges. In middle-income and high-income
Series
486 www.thelancet.com Vol 387 January 30, 2016
countries, short overall duration of breastfeeding is an additional challenge.
Our time-trend analyses show that, for LMICs as a whole, exclusive breastfeeding has increased by about
0·5 percentage points per year since 1993, reaching 35% in 2013. In 2012, the 56th World Health Assembly set as a target for 2025 to “increase the rate of exclusive breastfeeding in the first 6 months up to at least 50%”.71
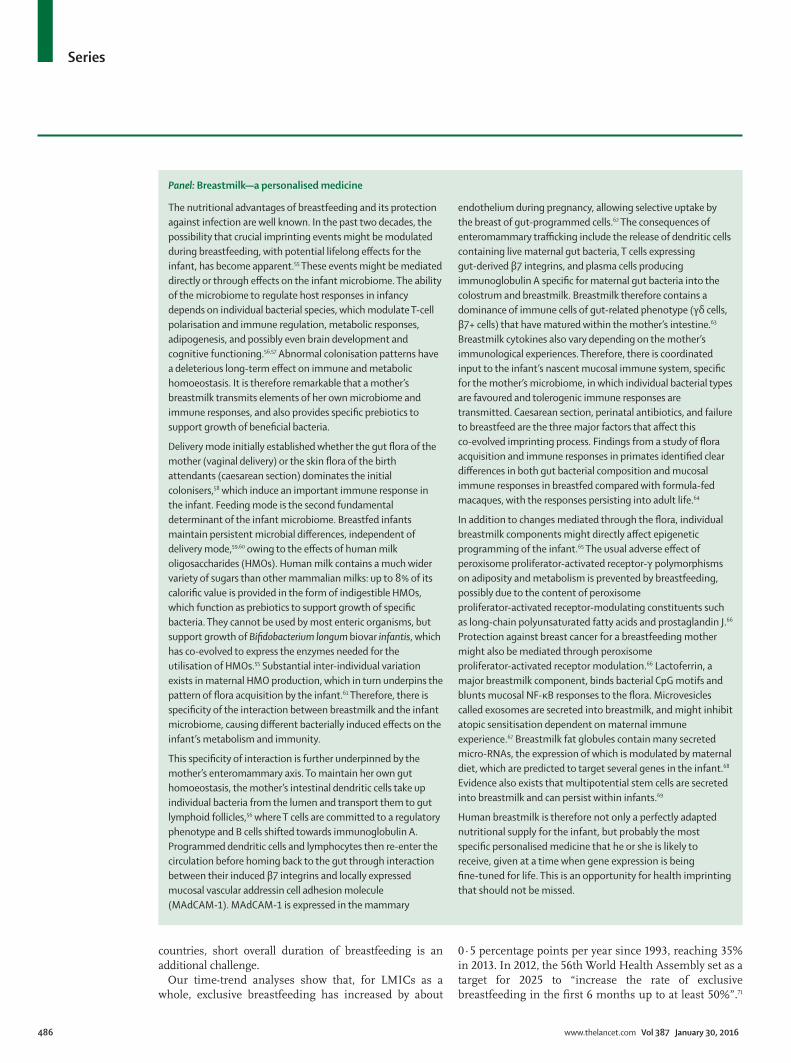
Panel: Breastmilk—a personalised medicine
The nutritional advantages of breastfeeding and its protection against infection are well known. In the past two decades, the possibility that crucial imprinting events might be modulated during breastfeeding, with potential lifelong effects for the infant, has become apparent.55 These events might be mediated directly or through effects on the infant microbiome. The ability of the microbiome to regulate host responses in infancy depends on individual bacterial species, which modulate T-cell polarisation and immune regulation, metabolic responses, adipogenesis, and possibly even brain development and cognitive functioning.56,57 Abnormal colonisation patterns have a deleterious long-term effect on immune and metabolic homoeostasis. It is therefore remarkable that a mother’s breastmilk transmits elements of her own microbiome and immuneresponses,andalsoprovidesspecificprebioticstosupportgrowthofbeneficialbacteria.
Delivery mode initially established whether the gut flora of the mother (vaginal delivery) or the skin flora of the birth attendants (caesarean section) dominates the initial colonisers,58 which induce an important immune response in the infant. Feeding mode is the second fundamental determinant of the infant microbiome. Breastfed infants maintain persistent microbial differences, independent of delivery mode,59,60 owing to the effects of human milk oligosaccharides (HMOs). Human milk contains a much wider variety of sugars than other mammalian milks: up to 8% of its calorificvalueisprovidedintheformofindigestibleHMOs,whichfunctionasprebioticstosupportgrowthofspecificbacteria. They cannot be used by most enteric organisms, but support growth of Bifidobacterium longum biovar infantis, which has co-evolved to express the enzymes needed for the utilisation of HMOs.55 Substantial inter-individual variation exists in maternal HMO production, which in turn underpins the pattern of flora acquisition by the infant.61 Therefore, there is specificityoftheinteractionbetweenbreastmilkandtheinfantmicrobiome, causing different bacterially induced effects on the infant’s metabolism and immunity.
Thisspecificityofinteractionisfurtherunderpinnedbythemother’s enteromammary axis. To maintain her own gut homoeostasis, the mother’s intestinal dendritic cells take up individual bacteria from the lumen and transport them to gut lymphoid follicles,56 where T cells are committed to a regulatory phenotype and B cells shifted towards immunoglobulin A. Programmed dendritic cells and lymphocytes then re-enter the circulation before homing back to the gut through interaction between their induced β7 integrins and locally expressed mucosal vascular addressin cell adhesion molecule (MAdCAM-1). MAdCAM-1 is expressed in the mammary
endothelium during pregnancy, allowing selective uptake by the breast of gut-programmed cells.62 The consequences of enteromammary trafficking include the release of dendritic cells containing live maternal gut bacteria, T cells expressing gut-derived β7 integrins, and plasma cells producing immunoglobulinAspecificformaternalgutbacteriaintothecolostrum and breastmilk. Breastmilk therefore contains a dominance of immune cells of gut-related phenotype (γδ cells, β7+ cells) that have matured within the mother’s intestine.63 Breastmilk cytokines also vary depending on the mother’s immunological experiences. Therefore, there is coordinated inputtotheinfant’snascentmucosalimmunesystem,specificfor the mother’s microbiome, in which individual bacterial types are favoured and tolerogenic immune responses are transmitted. Caesarean section, perinatal antibiotics, and failure to breastfeed are the three major factors that affect this co-evolved imprinting process. Findings from a study of flora acquisitionandimmuneresponsesinprimatesidentifiedcleardifferences in both gut bacterial composition and mucosal immune responses in breastfed compared with formula-fed macaques, with the responses persisting into adult life.64
In addition to changes mediated through the flora, individual breastmilk components might directly affect epigenetic programming of the infant.65 The usual adverse effect of peroxisome proliferator-activated receptor-γ polymorphisms on adiposity and metabolism is prevented by breastfeeding, possibly due to the content of peroxisome proliferator-activated receptor-modulating constituents such as long-chain polyunsaturated fatty acids and prostaglandin J.66 Protection against breast cancer for a breastfeeding mother might also be mediated through peroxisome proliferator-activated receptor modulation.66 Lactoferrin, a major breastmilk component, binds bacterial CpG motifs and blunts mucosal NF-κB responses to the flora. Microvesicles called exosomes are secreted into breastmilk, and might inhibit atopic sensitisation dependent on maternal immune experience.67 Breastmilk fat globules contain many secreted micro-RNAs, the expression of which is modulated by maternal diet, which are predicted to target several genes in the infant.68 Evidence also exists that multipotential stem cells are secreted into breastmilk and can persist within infants.69
Human breastmilk is therefore not only a perfectly adapted nutritional supply for the infant, but probably the most specificpersonalisedmedicinethatheorsheislikelytoreceive, given at a time when gene expression is being fine-tunedforlife.Thisisanopportunityforhealthimprintingthat should not be missed.

Series
www.thelancet.com Vol 387 January 30, 2016 487
To achieve this goal would need a doubling of the recent annual increase, to more than 1 percentage point a year in the next decade, which is already the rate for the richest 20% of people. In view of the benefits of exclusive breastfeeding and of present achievements by leading countries, could a more ambitious target not be aimed for? The Assembly did not set a goal for continued breastfeeding.
In terms of inequalities, our findings show that breastfeeding is one of the few positive health behaviours that is more prevalent in poor than in rich countries. They also show that poor women breastfeed for longer than rich women in LMICs, whereas in high-income countries the pattern is reversed. These results suggest that breastfeeding patterns are contributing to reducing the health gaps between rich and poor children in LMICs, which would be even greater in the absence of breastfeeding.
In LMICs, there are no inequalities between rich and poor mothers in exclusive breastfeeding rates. Findings from our time-trend analyses suggest that this is because rich mothers are adopting exclusive breastfeeding at a much faster rate than are poor mothers—only 20 years ago, the poorer mothers had substantially higher rates of exclusive breastfeeding. Continued breastfeeding is still more common in poor mothers than in wealthy mothers, but rates seem to be dropping among these while remaining stable in rich mothers. Protecting breastfeeding in the world’s poorest populations is therefore a major priority.
Our systematic reviews emphasise how important breastfeeding is for all women and children, irrespective of where they live and of whether they are rich or poor. Appropriate breastfeeding practices prevent child morbidity due to diarrhoea, respiratory infections, and otitis media. Where infectious diseases are common causes of death, breastfeeding provides major protection, but even in high-income populations it lowers mortality from causes such as necrotising enterocolitis and sudden infant death syndrome. Available evidence shows that breastfeeding enhances human capital by increasing intelligence. It also helps nursing women by preventing breast cancer. Additionally, our review suggests likely effects on overweight and diabetes in breastfed children, and on ovarian cancer and diabetes in mothers. The only harmful consequence of breast-feeding we detected was an increase in tooth decay in children breastfed for more than 12 months. In view of the many benefits of breastfeeding, this observation should not lead to discontinuation of breastfeeding but rather to improved oral hygiene.
Findings from our systematic reviews are restricted by the observational nature of most of the available data for breastfeeding and by the limitations of meta-analyses.72,73 Experimental data are scarce because breastfeeding promotion activities must be highly effective to change feeding patterns to an extent that leads to a measurable
effect on short-term and long-term outcomes. Moreover, confounding can occur because breastfeeding is associated with higher socioeconomic position in high-income countries. Our reviews included subanalyses of studies with tight control for confounding. Whenever possible, we also did separate analyses of studies from LMICs, because poor individuals tend to breastfeed for longer than rich people in these countries (appendix p 40), an association that is reversed in high-income countries. Interpretation of associations is also affected by the fact that non-breastfed infants receive different diets in different countries—eg, animal milk in most poor societies and formula in middle-income and high-income populations. The association between breastfeeding and overweight, for example, is probably affected by the diet of infants who are not breastfed.
No consensus exists about whether or not breastfeeding can protect against a child’s later risk of overweight or diabetes,34,38,41 largely because of potential residual con-founding. Although the evidence is not as strong as it is for infections or intelligence, we argue that the evidence linking breastfeeding with protection from later overweight or diabetes is growing. Findings from our meta-analyses showed that the association persisted when restricted to only high-quality studies, and also when restricted to studies from only low-income and middle-income settings. The association seems to be specific—eg, we noted no effect on blood pressure or blood lipid concentrations, for which confounding patterns are similar. Finally, findings from randomised trials of breastfeeding promotion in infancy indicate a reduction in adiposity.
The scaling up of breastfeeding practices to almost universal levels is estimated to prevent 823 000 annual deaths, or 13·8% of all deaths of children younger than 24 months in the 75 Countdown to 20159 countries. The target of 95% of all infants younger than 6 months having exclusive breastfeeding is ambitious because at present the highest national prevalences are 85% in Rwanda and 76% in Sri Lanka. We also used a target of 90% for any breastfeeding from 6–23 months, but five countries already have levels that are above this target (Nepal, Rwanda, Ethiopia, Burundi, and Guinea). We acknowledge that these targets are ambitious, but the estimates show the potential for lives saved if mothers and children adhered to international recommendations. Despite differences in methods, our estimates about potential lives saved are consistent with those from the 2013 Lancet Nutrition Series (804 000 deaths)74 but higher than those from the 2010 Global Burden of Disease study (540 000 deaths),75 in which the assumptions and methods were not sufficiently detailed to understand the reasons for the discrepancy. Breast feeding is potentially one of the top interventions for reducing under-5 mortality, and the modest changes in breastfeeding rates since 2000 have contributed to the fact that most LMICs did not reach the fourth Millennium Development Goal,

Series
488 www.thelancet.com Vol 387 January 30, 2016
to reduce under-5 mortality by two-thirds.76 We show that increasing exclusive breastfeeding should be among the top priorities for reducing infant deaths.
As an example of the potential to save women’s lives, we estimated that present rates of breastfeeding prevent almost 20 000 annual deaths from breast cancer, and an additional 20 000 are preventable by scaling up breastfeeding practices (appendix). To achieve its full effect, breastfeeding should continue up to the age of 2 years. Protection against mortality and morbidity from infectious diseases extends well into the second year of life—eg, breastfeeding prevents half of deaths caused by infections in children aged 6–23 months. Protection against otitis media, a common childhood illness throughout the world, also extends to 2 years and possibly beyond. Findings from studies of overweight and obesity show that longer durations of breastfeeding are associated with lower risk, as do studies of IQ showing a clear dose–response association with duration. Breast cancer is reduced by lifetime duration of breastfeeding in women, with a 6% reduction for every 12 months.50 Findings from ethnographical research show that total duration of breastfeeding ranges between 2 and 4 years in most traditional societies,77 and our review of the literature lends support to international recommendations about the total duration of breastfeeding, in both high-income and low-income countries.
Data availability for breastfeeding patterns shows an unusual distribution. Health authorities and researchers in high-income countries seem to neglect breastfeeding to such an extent that most of these countries are unable to report on reliable, standardised indicators. This situation contrasts sharply with the high quality of data for breastfeeding in LMICs, as a consequence of the regular conduct of standardised surveys such as the Demographic and Health Surveys and Multiple Indicator Cluster Surveys.
Our findings show how essential the protection, promotion, and support of breastfeeding is for the achievement of many of the newly launched Sustainable Development Goals by 2030. Breastfeeding is clearly relevant to the third sustainable goal, which includes not only maternal and child health but also non-communicable diseases such as breast cancer and diabetes as well as overweight and obesity. It is also relevant to the second goal (on nutrition). The effect of breastfeeding on intelligence and on human capital is relevant to the fourth goal (education), the first goal (poverty), and the eighth goal (inclusive economic growth). Finally, by helping close the gap between rich and poor, breastfeeding can contribute to goal number ten—reducing inequalities.ContributorsCGV and NCR had the idea for the paper. CGV was the primary author. The other co-authors contributed specific sections: SM (biological mechanisms), SH (breast cancer cases averted), NW (child lives saved), MJS (meta-analysis on child mortality), and RB (early initiation of breastfeeding). AJDB, GVAF, and JK collected and analysed the data. All authors revised the draft report and approved the final version.
The Lancet Breastfeeding Series GroupAustralia K Allen (Royal Children’s Hospital, Parkville, VIC), S Dharmage, C Lodge (University of Melbourne, Parkville, VIC), K G Peres (University of Adelaide, Adelaide, SA); India N Bhandari, R Chowdhury, B Sinha, S Taneja (Society for Applied Studies, New Delhi); Brazil Elsa Giugliani (Universidade Federal do Rio Grande do Sul, Porto Alegre), B Horta, F Maia, C L de Mola (Universidade Federal de Pelotas, Rio Grande do Sul); Vietnam N Hajeebhoy (Alive and Thrive, Hanoi); USA C Lutter (Pan American Health Organization, Washington, DC), E Piwoz (Bill & Melinda Gates Foundation, Seattle, WA); Norway J C Martines (University of Bergen, Bergen); South Africa L Richter (University of the Witwatersrand, Durban).
Declaration of interestsSH has received grants from WHO during the conduct of the study, and SM has received personal fees from Nutricia and Mead Johnson, outside the submitted work. NCR has received grants from the Bill & Melinda Gates Foundation during the conduct of the study. CGV, RB, AJDB, GVAF, JK, MJS, and NW declare no competing interests.
AcknowledgmentsThis review was supported by a grant from the Bill & Melinda Gates Foundation to WHO. CGV is the recipient of a Wellcome Trust Senior Investigator Award. The funders of the study had no role in study design, data collection, data analysis, data interpretation, or writing of the paper.
References1 Vahlquist B. Introduction. Contemporary patterns of breast-feeding
Report of the WHO Collaborative Study on Breast-feeding. Geneva: World Health Organization, 1981.
2 Jelliffe DB, Jelliffe EFP. Human milk in the modern world. Oxford: Oxford University Press, 1978.
3 Jelliffe DB, Jelliffe EFP. Human milk in the modern world [letter]. BMJ 1978; 2: 1573.
4 Task Force on the Assessment of the Scientific Evidence Relating to Infant-Feeding Practices and Infant Health. Report of the task force on the assessment of the scientific evidence relating to infant-feeding practices and infant health. Pediatrics 1984; 74: 579–762.
5 Rollins NC, et al. Lancet Breastfeeding Series: Why invest, and what it will take to improve breastfeeding practices in less than a generation. Lancet 2016; 387: 491–504.
6 World Health Organization. Indicators for assessing infant and young child feeding practices. Part I: definition. Geneva: World Health Organization, 2008.
7 Royston P, Sauerbrei W. Multivariable model-building: a pragmatic approach to regression analysis based on fractional polynomials for modelling continuous variables. Chichester: Wiley, 2008.
8 Walker N, Tam Y, Friberg IK. Overview of the Lives Saved Tool (LiST). BMC Public Health 2013; 13 (suppl 3): S1.
9 Requejo JH, Bryce J, Barros AJ, et al. Countdown to 2015 and beyond: fulfilling the health agenda for women and children. Lancet 2015; 385: 466–76.
10 Sankar MJ, Sinha B, Chowdhury R, et al. Optimal breastfeeding practices and infant and child mortality. A systematic review and meta-analysis. Acta Paediatr 2015; published online Aug 7. DOI:10.1111/apa.13147.
11 Roberts TJ, Carnahan E, Gakidou E. Can breastfeeding promote child health equity? A comprehensive analysis of breastfeeding patterns across the developing world and what we can learn from them. BMC Med 2013; 11: 254.
12 Berger-Achituv S, Shohat T, Garty BZ. Breast-feeding patterns in Central Israel. Isr Med Assoc J 2005; 7: 515–19.
13 Häggkvist AP, Brantsæter AL, Grjibovski AM, Helsing E, Meltzer HM, Haugen M. Prevalence of breast-feeding in the Norwegian Mother and Child Cohort Study and health service-related correlates of cessation of full breast-feeding. Public Health Nutr 2010; 13: 2076–86.
14 Jones JR, Kogan MD, Singh GK, Dee DL, Grummer-Strawn LM. Factors associated with exclusive breastfeeding in the United States. Pediatrics 2011; 128: 1117–25.
15 Kohlhuber M, Rebhan B, Schwegler U, Koletzko B, Fromme H. Breastfeeding rates and duration in Germany: a Bavarian cohort study. Br J Nutr 2008; 99: 1127–32.
Series
www.thelancet.com Vol 387 January 30, 2016 489
16 Labbok M, Taylor E. Achieving exclusive breastfeeding in the united states: findings and recommendations. Washington, DC: United States Breastfeeding Committee, 2008.
17 Ministere des Solidarites de la Sante et de la Famille, Institut National de la Sante, Institut National de la Sante et la Recherche Medicale. Enquete Nationale Perinatale 2003. Paris: MSSF, 2005.
18 Oakley LL, Henderson J, Redshaw M, Quigley MA. The role of support and other factors in early breastfeeding cessation: an analysis of data from a maternity survey in England. BMC Pregnancy Childbirth 2014; 14: 88.
19 Al-Sahab B, Lanes A, Feldman M, Tamim H. Prevalence and predictors of 6-month exclusive breastfeeding among Canadian women: a national survey. BMC Pediatr 2010; 10: 20.
20 Almquist-Tangen G, Strömberg U, Holmén A, et al. Influence of neighbourhood purchasing power on breastfeeding at four months of age: a Swedish population-based cohort study. BMC Public Health 2013; 13: 1077.
21 Horta BL, Victora CG. Short-term effects of breastfeeding: a systematic review of the benefits of breastfeeding on diarhoea and pneumonia mortality. Geneva: World Health Organization, 2013.
22 Bowatte G, Tham R, Allen KJ, et al. Breastfeeding and childhood acute otitis media: a systematic review and meta-analysis. Acta Paediatr Suppl 2015; 104: 85–95.
23 Lodge CJ, Tan DJ, Lau M, et al. Breastfeeding and asthma and allergies: a systematic review and meta-analysis. Acta Paediatr Suppl 2015; 104: 38–53.
24 Giugliani EJ, Horta BL, de Mola CL, Lisboa BO, Victora CG. Effect of breastfeeding promotion interventions on child growth: a systematic review and meta-analyses. Acta Paediatr Suppl 2015; 104: 20–29.
25 Tham R, Bowatte G, Dharmage SC, et al. Breastfeeding and the risk of dental caries: a systematic review and meta-analysis. Acta Paediatr Suppl 2015; 104: 62–84.
26 Peres KG, Cascaes AM, Nascimento GG, Victora CG. Effect of breastfeeding on malocclusions: a systematic review and meta-analysis. Acta Paediatr Suppl 2015; 104: 54–61.
27 Horta BL, de Mola CL, Victora CG. Long-term consequences of breastfeeding on cholesterol, obesity, systolic blood pressure, and type-2 diabetes: systematic review and meta-analysis. Acta Paediatr Suppl 2015; 104: 30–37.
28 Horta BL, de Mola CL, Victora CG. Breastfeeding and intelligence: systematic review and meta-analysis. Acta Paediatr Suppl 2015; 104: 14–19.
29 Chowdhury R, Sinha B, Sankar MJ, et al. Breastfeeding and maternal health outcomes: a systematic review and meta-analysis. Acta Paediatr Suppl 2015; 104: 96–113.
30 Collaborative Group on Hormonal Factors in Breast Cancer. Breast cancer and breastfeeding: collaborative reanalysis of individual data from 47 epidemiological studies in 30 countries, including 50 302 women with breast cancer and 96973 women without the disease. Lancet 2002; 360: 187–95.
31 Aune D, Norat T, Romundstad P, Vatten LJ. Breastfeeding and the maternal risk of type 2 diabetes: a systematic review and dose-response meta-analysis of cohort studies. Nutr Metab Cardiovasc Dis 2014; 24: 107–15.
32 Neville CE, McKinley MC, Holmes VA, Spence D, Woodside JV. The relationship between breastfeeding and postpartum weight change—a systematic review and critical evaluation. Int J Obes (Lond) 2014; 38: 577–90.
33 WHO Collaborative Study Team on the Role of Breastfeeding on the Prevention of Infant Mortality. Effect of breastfeeding on infant and child mortality due to infectious diseases in less developed countries: a pooled analysis. Lancet 2000; 355: 451–55.
34 Ip S, Chung M, Raman G, et al. Breastfeeding and maternal and infant health outcomes in developed countries. Rockville, MD, USA: Agency for Healthcare Research and Quality, 2007.
35 Holman RC, Stoll BJ, Curns AT, Yorita KL, Steiner CA, Schonberger LB. Necrotising enterocolitis hospitalisations among neonates in the United States. Paediatr Perinat Epidemiol 2006; 20: 498–506.
36 Onyeaso CO, Isiekwe MC. Occlusal changes from primary to mixed dentitions in Nigerian children. Angle Orthod 2008; 78: 64–69.
37 Peres KG, Peres MA, Thomson WM, Broadbent J, Hallal PC, Menezes AB. Deciduous-dentition malocclusion predicts orthodontic treatment needs later: findings from a population-based birth cohort study. Am J Orthod Dentofacial Orthop 2015; 147: 492–98.
38 Horta BL, Victora CG. Long-term effects of breastfeeding: a systematic review. Geneva: World Health Organization, 2013.
39 Kramer MS, Chalmers B, Hodnett ED, et al, and the PROBIT Study Group (Promotion of Breastfeeding Intervention Trial). Promotion of Breastfeeding Intervention Trial (PROBIT): a randomized trial in the Republic of Belarus. JAMA 2001; 285: 413–20.
40 Kramer MS, Matush L, Vanilovich I, et al, and the PROBIT Study Group. Effects of prolonged and exclusive breastfeeding on child height, weight, adiposity, and blood pressure at age 6.5 y: evidence from a large randomized trial. Am J Clin Nutr 2007; 86: 1717–21.
41 Owen CG, Martin RM, Whincup PH, Davey-Smith G, Gillman MW, Cook DG. The effect of breastfeeding on mean body mass index throughout life: a quantitative review of published and unpublished observational evidence. Am J Clin Nutr 2005; 82: 1298–307.
42 Kramer MS, Aboud F, Mironova E, et al, and the Promotion of Breastfeeding Intervention Trial (PROBIT) Study Group. Breastfeeding and child cognitive development: new evidence from a large randomized trial. Arch Gen Psychiatry 2008; 65: 578–84.
43 Lucas A, Morley R, Cole TJ, Lister G, Leeson-Payne C. Breast milk and subsequent intelligence quotient in children born preterm. Lancet 1992; 339: 261–64.
44 Richards M, Hardy R, Wadsworth ME. Long-term effects of breast-feeding in a national birth cohort: educational attainment and midlife cognitive function. Public Health Nutr 2002; 5: 631–35.
45 Martin RM, Goodall SH, Gunnell D, Davey Smith G. Breast feeding in infancy and social mobility: 60-year follow-up of the Boyd Orr cohort. Arch Dis Child 2007; 92: 317–21.
46 Horwood LJ, Fergusson DM. Breastfeeding and later cognitive and academic outcomes. Pediatrics 1998; 101: E9.
47 Victora CG, Barros FC, Horta BL, Lima RC. Breastfeeding and school achievement in Brazilian adolescents. Acta Paediatr 2005; 94: 1656–60.
48 Horta BL, Bas A, Bhargava SK, et al, and the COHORTS group. Infant feeding and school attainment in five cohorts from low- and middle-income countries. PLoS One 2013; 8: e71548.
49 Victora CG, Horta BL, de Mola CL, et al. Association between breastfeeding and intelligence, educational attainment, and income at 30 years of age: a prospective birth cohort study from Brazil. Lancet Glob Health 2015; 3: e199–e205.
50 Amitay EL, Keinan-Boker L. Breastfeeding and childhood leukemia incidence: a meta-analysis and systematic review. JAMA Pediatr 2015; 169: e151025.
51 Becker S, Rutstein S, Labbok MH. Estimation of births averted due to breast-feeding and increases in levels of contraception needed to substitute for breast-feeding. J Biosoc Sci 2003; 35: 559–74.
52 Kramer MS, Kakuma R. Optimal duration of exclusive breastfeeding. Cochrane Database Syst Rev 2012; 8: CD003517.
53 Bobrow KL, Quigley MA, Green J, Reeves GK, Beral V. Persistent effects of women’s parity and breastfeeding patterns on their body mass index: results from the Million Women Study. Int J Obes (Lond) 2013; 37: 712–17.
54 Dias CC, Figueiredo B. Breastfeeding and depression: a systematic review of the literature. J Affect Disord 2015; 171: 142–54.
55 Gura T. Nature’s first functional food. Science 2014; 345: 747–49.56 Hooper LV, Littman DR, Macpherson AJ. Interactions between the
microbiota and the immune system. Science 2012; 336: 1268–73.57 Mayer EA, Knight R, Mazmanian SK, Cryan JF, Tillisch K.
Gut microbes and the brain: paradigm shift in neuroscience. J Neurosci 2014; 34: 15490–96.
58 Dominguez-Bello MG, Costello EK, Contreras M, et al. Delivery mode shapes the acquisition and structure of the initial microbiota across multiple body habitats in newborns. Proc Natl Acad Sci USA 2010; 107: 11971–75.
59 Azad MB, Konya T, Maughan H, et al. Gut microbiota of healthy Canadian infants: profiles by mode of delivery and infant diet at 4 months. CMAJ 2013; 185: 385–94.
60 Yatsunenko T, Rey FE, Manary MJ, et al. Human gut microbiome viewed across age and geography. Nature 2012; 486: 222–27.

Series
490 www.thelancet.com Vol 387 January 30, 2016
61 De Leoz ML, Kalanetra KM, Bokulich NA, et al. Human milk glycomics and gut microbial genomics in infant feces show a correlation between human milk oligosaccharides and gut microbiota: a proof-of-concept study. J Proteome Res 2015; 14: 491–502.
62 Bourges D, Meurens F, Berri M, et al. New insights into the dual recruitment of IgA+ B cells in the developing mammary gland. Mol Immunol 2008; 45: 3354–62.
63 Latuga MS, Stuebe A, Seed PC. A review of the source and function of microbiota in breast milk. Semin Reprod Med 2014; 32: 68–73.
64 Ardeshir A, Narayan NR, Mendez-Lagares G, et al. Breast-fed and bottle-fed infant rhesus macaques develop distinct gut microbiotas and immune systems. Sci Transl Med 2014; 6: 252ra120.
65 Verduci E, Banderali G, Barberi S, et al. Epigenetic effects of human breast milk. Nutrients 2014; 6: 1711–24.
66 Verier C, Meirhaeghe A, Bokor S, et al, and the Healthy Lifestyle in Europe by Nutrition in Adolescence (HELENA) Study Group. Breast-feeding modulates the influence of the peroxisome proliferator-activated receptor-gamma (PPARG2) Pro12Ala polymorphism on adiposity in adolescents: the Healthy Lifestyle in Europe by Nutrition in Adolescence (HELENA) cross-sectional study. Diabetes Care 2010; 33: 190–96.
67 Torregrosa Paredes P, Gutzeit C, Johansson S, et al. Differences in exosome populations in human breast milk in relation to allergic sensitization and lifestyle. Allergy 2014; 69: 463–71.
68 Munch EM, Harris RA, Mohammad M, et al. Transcriptome profiling of microRNA by Next-Gen deep sequencing reveals known and novel miRNA species in the lipid fraction of human breast milk. PLoS One 2013; 8: e50564.
69 Hassiotou F, Hartmann PE. At the dawn of a new discovery: the potential of breast milk stem cells. Adv Nutr 2014; 5: 770–78.
70 World Health Organization. Protecting, promoting and supporting breast-feeding: the special role of maternity services. A Joint WHO/UNICEF Statement. Geneva: World Health Organization, 1989.
71 World Health Organization. Essential Nutrition actions: improving maternal, newborn, infant and young child health and nutrition. Geneva: World Health Organization, 2013.
72 Greenland S. Can meta-analysis be salvaged? Am J Epidemiol 1994; 140: 783–87.
73 Bailar JC 3rd. The promise and problems of meta-analysis. N Engl J Med 1997; 337: 559–61.
74 Black RE, Victora CG, Walker SP, et al, and the Maternal and Child Nutrition Study Group. Maternal and child undernutrition and overweight in low-income and middle-income countries. Lancet 2013; 382: 427–51.
75 Lim SS, Vos T, Flaxman AD, et al. A comparative risk assessment of burden of disease and injury attributable to 67 risk factors and risk factor clusters in 21 regions, 1990–2010: a systematic analysis for the Global Burden of Disease Study 2010. Lancet 2012; 380: 2224–60.
76 Requejo J, Bryce J, Victora CG, and the Countdown to 2015 writing team. Countdown to 2015 and beyond: fulfilling the health agenda for women and children. New York: UNICEF and the World Health Organization, 2014.
77 Dettwyler KA. A time to wean: the hominid blueprint for the natural age of weaning in modern human populations. In: Macadam PS, Dettwyller KA, eds. Breastfeeding: biocultural perspectives. New York: Walter de Gruyter, Inc; 1995: 39–73.

Supplementary appendixThis appendix formed part of the original submission and has been peer reviewed. We post it as supplied by the authors.
Supplement to: Victora CG, Bahl R, Barros AJD, et al, for The Lancet Breastfeeding Series Group. Breastfeeding in the 21st century: epidemiology, mechanisms, and lifelong effect. Lancet 2016; 387: 475–90.

Webappendix Lancet Breastfeeding Series paper 1 Page 2
Index to the supplementary webappendix Webappendix 1. Brief history of breastfeeding recommendations ............................................. 3
Webappendix 2. Breastfeeding definitions ................................................................................... 4
Webappendix 3. Data sources and estimates: countries with standardized surveys (mostly low and middle income countries) ...................................................................................................... 5
Webappendix 4. Data sources and estimates: countries without standardized surveys (mostly high-income countries) ............................................................................................................... 13
Webappendix 5: Statistical methods .......................................................................................... 18
Weighting ................................................................................................................................ 18
Time trends ............................................................................................................................. 18
Estimation of missing breastfeeding estimates at specific ages ............................................. 20
Continued breastfeeding at 12 months for LMICs .............................................................. 20
Any breastfeeding at 6 and 12 months for HICs ................................................................. 21
Webappendix 6. Systematic review – search terms ................................................................... 23
Search terms ........................................................................................................................... 23
Effects on children, adolescents or adults according to bf pattern .................................... 23
Effects on women who breastfed ....................................................................................... 30
Webappendix 7. LiST methods and assumptions ....................................................................... 31
General Overview of the Lives Saved Tool (LiST) .................................................................... 31
Background and history ...................................................................................................... 31
Theoretical approach and basic modelling structure of LiST .............................................. 31
Age structure within LiST .................................................................................................... 32
Links to other modules in Spectrum ................................................................................... 32
Source of assumptions and process of updating LiST ......................................................... 33
Creating a projection scenario in LiST ................................................................................. 33
Methods and Assumptions of the LiST Analyses ..................................................................... 34
Countries ............................................................................................................................. 34
LiST Assumptions ................................................................................................................. 34
Breastfeeding and mortality risk ......................................................................................... 34
Relative risks ........................................................................................................................ 35
Scenarios ............................................................................................................................. 36
Final LiST Models ................................................................................................................. 36
Webappendix 8. Breast cancer estimates ................................................................................... 37
Webappendix 9. Ecological correlation matrix ........................................................................... 39
Webappendix 10. Within country inequalities in exclusive and continued breastfeeding. ....... 40
Webappendix 11. Risks associated with breastmilk substitutes................................................. 41
Webappendix 12. Acknowledgments ......................................................................................... 42
References ................................................................................................................................... 43

Webappendix Lancet Breastfeeding Series paper 1 Page 3
Webappendix 1. Brief history of breastfeeding recommendations Virtually all women are able to fully nourish their infants through BF.1, 2 For example, over 95%
of rural mothers in most countries in Sub-Saharan Africa currently nurse their one year old
children. BF, either by the biological mother or less commonly by a wet nurse, was universal
until the mid 1800’s when the development of the feeding bottle and of condensed milk
offered mothers the option of not breastfeeding.3 In the early 1900’s, epidemiological studies
were already showing high mortality rates among non-breastfed infants.4, 5 Bottle feeding
became increasingly common, and by the 1970’s breastfeeding was the exception rather than
the rule in middle and high-income settings.6
Breastfeeding recommendations evolved with time. While the expression “exclusive BF” was in
common use in the early 1980’s7, it failed to recognize that many if not most young infants
received non-nutritive fluids such as water and herbal teas in addition to breastmilk.8 In the
late 1980’s, exclusive BF was redefined when research documented the risks of giving fluids to
breastfed infants9-11 while others showed that even in hot climates breastfed babies had no
need for additional water.12 Since 1989, the World Health Organization recommends that
mothers should initiate BF “within a half-hour of birth”13 and in 1990 the landmark Innocenti
Declaration recommended that breastmilk alone was sufficient to nurture infants up to 4-6
months of life, and that breastfeeding should be continued until “2 years or beyond”. 14 In
2001, the recommended duration of exclusive breastfeeding was extended from 4-6 months to
6 months 15 based on a systematic review of the evidence. 16, 17 In 2001, the recommended
duration of exclusive breastfeeding was extended from 4-6 months to 6 months.15 Although –
particularly in European circles – there is still debate on this issue, 18-20 a recent meta-analysis
concluded that “the available evidence demonstrates no apparent risks in recommending, as a
general policy, exclusive breastfeeding for the first six months of life in both developing and
developed-country settings”. 17

Webappendix Lancet Breastfeeding Series paper 1 Page 4
Webappendix 2. Breastfeeding definitions The following indicators were included in the analyses, using internationally agreed upon definitions:21 - Early initiation of BF: proportion of children born in the last 24 months who were put to
the breast within one hour of birth; - Exclusive BF under 6 months: proportion of infants 0–5 months of age who are fed
exclusively with breast milk; - Continued BF at 1 year (12-15 months): proportion of children 12–15 months of age who
are fed breast milk; - Continued BF at 2 years (20-23 months): proportion of children 20-23 months of age who
are fed breast milk. Feeding practices were defined as follows:22
Indicator Permitted to Receive
Exclusive Breastfeeding Breast milk from mother or wet nurse or expressed breast milk
NO other liquids or solids except vitamin drops or syrups, mineral supplements, or prescribed medicines
Predominant Breastfeeding
Breast milk from mother or wet nurse or expressed breast milk
Water and water-based drinks
NO food-based fluid with the exception of fruit juice and sugar water
Vitamin drops or syrups, mineral supplements, or prescribed medicines
Partial Breastfeeding Breast milk from mother or wet nurse or expressed breast milk
Any other liquids or non-liquids, including both milk and non-milk products
No Breastfeeding Formula, animal’s milk and/or solid, semisolid or soft food
NO breast milk
Any Breastfeeding Breast milk from mother or wet nurse or expressed breast milk
Includes children exclusively, predominantly, fully or partially breastfed
Because few high-income countries (HICs) report on the above indicators, we calculated the following additional indicators to allow global comparisons: - Ever BF: infants reported to have been breastfed, even if for a short period; for LMICs, this
refers to children born in the 2 years before the survey; for HICs, the reference age groups vary from country to country.
- BF at 6 months: in HICs, the proportion of infants who were breastfed for 6 months or longer; in LMICs with standardized surveys, the proportion of infants aged 4-7 full months (midpoint 6 months) who are breastfed.
- BF at 12 months: in HICs, the proportion breastfed for 12 months or longer; in LMICs, the proportion of 10 to 13-month old children (midpoint 12 months) who are breastfed.
These three indicators are not included in the standard, internationally recommended indicators. They were only used exclusively for comparisons between HICs and LMICs. Otherwise, we report on the standard indicators.

Webappendix Lancet Breastfeeding Series paper 1 Page 5
Webappendix 3. Data sources and estimates: countries with standardized surveys (mostly low and middle income countries) Nationally representative surveys are available for the vast majority of low and middle-income countries (LMICs). The surveys include Demographic and Health Surveys or DHS (http://www.measuredhs.com/aboutsurveys/dhs/start.cfm), Multiple Indicator Cluster Surveys or MICS (http://mics.unicef.org) and a few other national surveys. We obtained the original datasets from 127 surveys, and reanalyzed them using the standard international definitions. Table 3.1 shows the most recent survey from each country, which was included in the analyses.
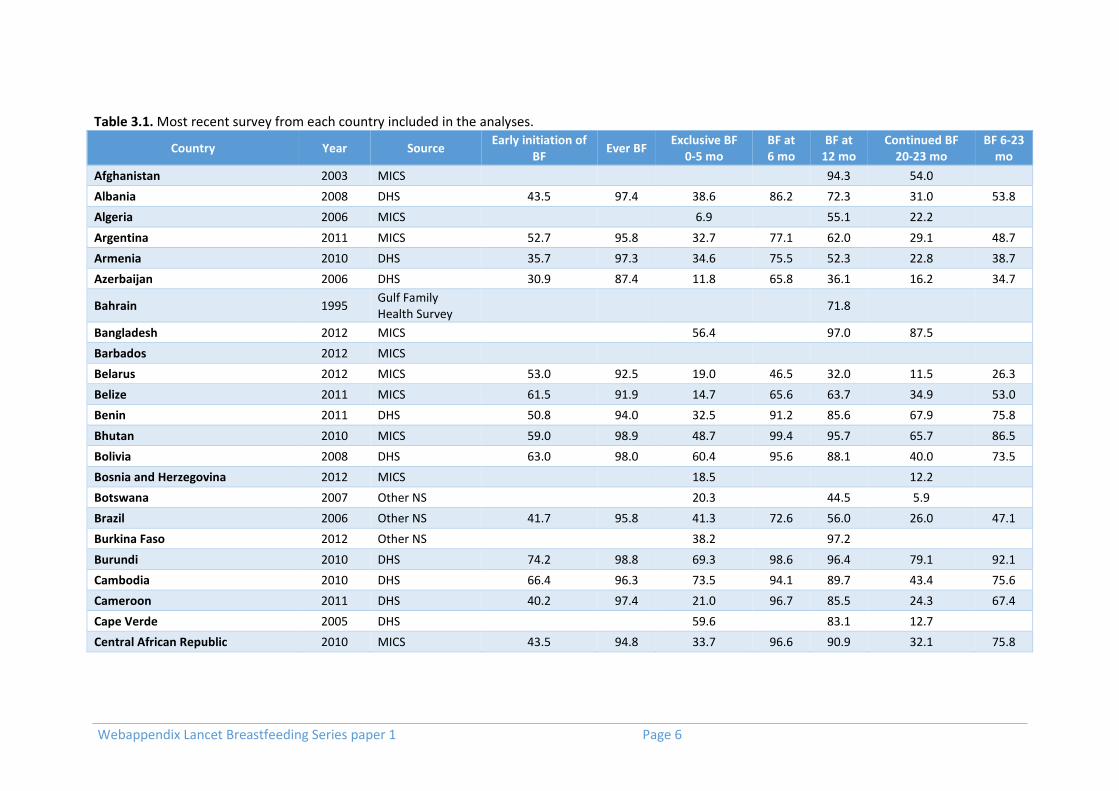
Webappendix Lancet Breastfeeding Series paper 1 Page 6
Table 3.1. Most recent survey from each country included in the analyses.
Country Year Source Early initiation of
BF Ever BF
Exclusive BF 0-5 mo
BF at 6 mo
BF at 12 mo
Continued BF 20-23 mo
BF 6-23 mo
Afghanistan 2003 MICS 94.3 54.0
Albania 2008 DHS 43.5 97.4 38.6 86.2 72.3 31.0 53.8
Algeria 2006 MICS 6.9 55.1 22.2
Argentina 2011 MICS 52.7 95.8 32.7 77.1 62.0 29.1 48.7
Armenia 2010 DHS 35.7 97.3 34.6 75.5 52.3 22.8 38.7
Azerbaijan 2006 DHS 30.9 87.4 11.8 65.8 36.1 16.2 34.7
Bahrain 1995 Gulf Family Health Survey
71.8
Bangladesh 2012 MICS 56.4 97.0 87.5
Barbados 2012 MICS
Belarus 2012 MICS 53.0 92.5 19.0 46.5 32.0 11.5 26.3
Belize 2011 MICS 61.5 91.9 14.7 65.6 63.7 34.9 53.0
Benin 2011 DHS 50.8 94.0 32.5 91.2 85.6 67.9 75.8
Bhutan 2010 MICS 59.0 98.9 48.7 99.4 95.7 65.7 86.5
Bolivia 2008 DHS 63.0 98.0 60.4 95.6 88.1 40.0 73.5
Bosnia and Herzegovina 2012 MICS 18.5 12.2
Botswana 2007 Other NS 20.3 44.5 5.9
Brazil 2006 Other NS 41.7 95.8 41.3 72.6 56.0 26.0 47.1
Burkina Faso 2012 Other NS 38.2 97.2
Burundi 2010 DHS 74.2 98.8 69.3 98.6 96.4 79.1 92.1
Cambodia 2010 DHS 66.4 96.3 73.5 94.1 89.7 43.4 75.6
Cameroon 2011 DHS 40.2 97.4 21.0 96.7 85.5 24.3 67.4
Cape Verde 2005 DHS 59.6 83.1 12.7
Central African Republic 2010 MICS 43.5 94.8 33.7 96.6 90.9 32.1 75.8

Webappendix Lancet Breastfeeding Series paper 1 Page 7
Table 3.1. Most recent survey from each country included in the analyses. (continued) Country Year Source Early initiation of
BF Ever BF Exclusive BF
0-5 mo BF at 6 mo
BF at 12 mo
Continued BF 20-23 mo
BF 6-23 mo
Chad 2010 MICS 28.7 95.6 3.4 95.9 90.4 59.1 83.0
China 2008 Other NS 41.0 27.6 76.2 46.2 9.1
Colombia 2010 DHS 63.6 97.0 42.9 88.5 62.0 32.5 55.3
Comoros 2012 DHS 34.1 93.5 12.1 95.4 79.4 56.7 73.1
Congo, Dem. Rep. 2013 DHS 52.4 98.2 47.6 97.3 95.6 66.3 87.5
Congo, Rep. 2011 DHS 24.0 94.9 20.5 93.3 86.2 17.0 60.9
Costa Rica 2011 MICS 59.6 97.0 32.5 90.7 50.6 27.5 49.1
Cote d'Ivoire 2011 DHS 31.3 96.6 12.1 95.9 92.1 38.1 76.2
Croatia 1996 MICS
Cuba 2010 MICS 76.7 98.1 48.6 70.8 30.9 17.1 29.0
Djibouti 2006 MICS 54.9 88.4 1.3 84.9 55.0 18.4 49.3
Dominican Republic 2013 DHS 6.7 43.0 14.4
Ecuador 2013 Encuesta Nacional de Salud y Nutrición
77.5 18.9
Egypt, Arab Rep. 2014 DHS 39.7 85.5 20.4
El Salvador 2008 FESAL 31.4 80.0 54.0
Equatorial Guinea 2011 DHS 60.4
Eritrea 2010 Eritrean Population and Health Survey
68.7 96.3 72.8
Ethiopia 2011 DHS 52.1 97.5 97.6 97.3 92.7
Fiji 2004 Other NS 39.8
Gabon 2012 DHS 32.7 90.3 6.0 81.1 60.5 3.9 41.3
Gambia, The 2013 DHS 46.8 98.7 42.2

Webappendix Lancet Breastfeeding Series paper 1 Page 8
Table 3.1. Most recent survey from each country included in the analyses. (continued) Country Year Source Early initiation of
BF Ever BF Exclusive BF
0-5 mo BF at 6 mo
BF at 12 mo
Continued BF 20-23 mo
BF 6-23 mo
Georgia 2009 Other NS 54.8 44.7 16.6
Ghana 2011 MICS 45.9 98.9 45.7 98.8 95.2 37.4 78.4
Guatemala 2008 ENSMI 49.6 84.4 46.2
Guinea 2012 DHS 16.6 98.3 20.5 97.7 94.9 66.0 90.3
Guinea-Bissau 2010 MICS 38.3 97.8 64.9
Guyana 2009 DHS 61.0 93.7 33.2 83.9 65.7 49.3 63.9
Haiti 2012 DHS 46.8 96.8 39.7 95.3 90.7 30.8 72.0
Honduras 2012 DHS 31.2 76.8 43.3
India 2005 DHS 23.3 97.3 46.4 97.6 91.8 72.7 86.8
Indonesia 2012 DHS 49.5 96.0 41.5 88.5 78.0 55.3 73.3
Iran, Islamic Rep. 2010 Other NS 53.1 88.8 51.0
Iraq 2011 MICS 42.8 92.2 19.6 74.9 57.9 22.7 47.3
Jamaica 2011 MICS 64.7 95.4 23.8 83.3 57.9 31.2 48.2
Jordan 2012 DHS 18.6 93.1 22.7 75.2 54.8 12.9 41.6
Kazakhstan 2010 MICS 67.8 96.4 31.8 85.4 63.0 26.1 49.7
Kenya 2008 DHS 56.1 97.6 31.9 99.3 89.4 53.6 80.9
Kiribati 2009 Other NS 69.0 92.1 81.7
Korea, Dem. Rep. 2012 National Nutrition Survey
68.9 83.8 21.5
Kuwait 1996 Gulf Family Health Survey
28.1
Kyrgyz Republic 2012 DHS 84.1 98.8 56.1 96.5 79.6 37.0 69.8
Lao PDR 2011 MICS 39.1 95.6 40.4 90.2 79.4 40.0 67.0
Lesotho 2009 DHS 50.4 92.6 53.5 85.4 79.8 35.1 66.4
Liberia 2013 DHS 61.4 98.0 55.2 97.6 95.2 44.2 79.6

Webappendix Lancet Breastfeeding Series paper 1 Page 9
Table 3.1. Most recent survey from each country included in the analyses. (continued) Country Year Source Early initiation of
BF Ever BF Exclusive BF
0-5 mo BF at 6 mo
BF at 12 mo
Continued BF 20-23 mo
BF 6-23 mo
Macedonia, FYR 2011 MICS 21.0 93.9 23.0 70.1 43.3 12.8 37.5
Madagascar 2012 Other NS 41.9 92.5 83.1
Malawi 2014 MICS 70.2 98.3 74.5
Malaysia 1996 National Health and Morbidity Survey
29.0
Maldives 2009 DHS 60.5 98.2 47.8 92.9 84.5 68.9 78.5
Mali 2012 DHS 58.1 97.3 32.9 95.4 94.1 73.0 86.5
Marshall Islands 2007 Other NS 31.3 71.6 53.1
Mauritania 2011 MICS 26.9 89.5 35.5
Mauritius 2002 Other NS 21.0
Mexico 2012 ENSN 14.4 43.7 14.1
Moldova 2012 MICS 36.4 57.0 12.2
Mongolia 2013 MICS 47.1 87.5 52.6
Montenegro 2013 MICS 16.8 31.2 9.0
Morocco 2003 DHS 48.2 95.6 31.0 81.8 66.0 14.7 48.9
Mozambique 2011 DHS 77.2 97.3 41.1 97.7 93.0 51.6 82.5
Myanmar 2009 MICS 23.6 94.0 65.4
Namibia 2013 DHS 48.5 72.1 21.0
Nauru 2007 NRU 67.2 75.1 64.9
Nepal 2011 DHS 44.6 98.2 69.6 99.5 95.4 92.6 95.3
Nicaragua 2006 ENDESA 30.6 75.3 42.9
Niger 2012 DHS 53.2 98.8 23.3 98.6 95.8 50.2 85.8
Nigeria 2013 DHS 33.4 98.1 17.4 95.5 88.7 35.3 74.4

Webappendix Lancet Breastfeeding Series paper 1 Page 10
Table 3.1. Most recent survey from each country included in the analyses. (continued) Country Year Source Early initiation of
BF Ever BF Exclusive BF
0-5 mo BF at 6 mo
BF at 12 mo
Continued BF 20-23 mo
BF 6-23 mo
Oman 2000 Other NS 96.8
Pakistan 2012 DHS 18.4 94.5 37.8 87.6 80.5 56.1 74.8
Panama 1995 MICS 25.0 42.3 21.2
Papua New Guinea 2006 PNG Demographic and Health Survey
56.1 92.5 71.6
Paraguay 2008 ENDSSR 24.4 45.8 14.3
Peru 2013 DHS 72.3 85.3 53.8
Philippines 2013 DHS 49.8 93.8 77.8 61.5 40.9
Qatar 1998 Gulf Family Health Survey 40.1
Romania 2004 Other NS 15.8
Rwanda 2010 DHS 71.7 98.7 84.9 99.1 95.7 83.5 92.8
Sao Tome and Principe 2008 DHS 43.4 98.4 51.4 99.6 95.8 20.0 68.2
Senegal 2012 DHS 32.1 98.5 37.5 99.5 99.4 47.1 85.7
Serbia 2014 MICS 12.8 32.0 8.9
Sierra Leone 2013 DHS 54.3 97.4 32.0 94.7 87.8 47.9 79.8
Solomon Islands 2007 DHS 73.7 88.9 67.4
Somalia 2006 MICS 26.3 93.2 9.1 86.5 61.0 35.4 57.1
South Africa 2003 DHS 8.3 73.7 30.6
South Sudan 2010 MICS 45.1 87.4 38.0
Sri Lanka 2006 DHS 75.8 94.8 83.9
St. Lucia 2012 MICS 49.6 95.5 67.7 52.4 42.5
Sudan 2010 MICS 41.0 91.5 40.1

Webappendix Lancet Breastfeeding Series paper 1 Page 11
Table 3.1. Most recent survey from each country included in the analyses. (continued) Country Year Source Early initiation of BF Ever BF Exclusive BF 0-5 mo BF at 6 mo BF at 12 mo Continued BF
20-23 mo BF 6-23
mo
Suriname 2010 MICS 44.7 90.4 2.8 63.9 37.0 14.9 27.5
Swaziland 2010 MICS 54.5 90.9 44.1 83.3 66.5 10.7 46.7
Syrian Arab Republic 2009 PAP 42.6 64.2 24.9
Tajikistan 2012 DHS 49.9 98.7 34.3 92.2 82.3 49.5 72.8
Tanzania 2010 DHS 45.5 97.1 49.9 97.6 95.8 51.0 83.5
Thailand 2012 MICS 12.3 40.4 17.8
Timor-Leste 2009 DHS 80.2 98.1 51.5 97.5 81.9 33.4 69.8
Togo 2013 DHS 57.4 96.2 61.7
Tonga 2012 Other NS 52.2 58.2 30.3
Trinidad and Tobago 2006 MICS 41.2 89.0 61.5 42.1 35.1
Tunisia 2011 MICS 39.9 96.6 8.5 78.0 53.7 19.1 45.0
Turkey 2008 DHS 41.6 74.2 21.6
Turkmenistan 2000 DHS 13.0 81.8 26.9
Tuvalu 2007 DHS 34.7 62.5 50.6
Uganda 2011 MICS 52.7 98.3 62.1 97.0 91.8 45.8 78.7
Ukraine 2012 MICS 65.7 95.4 19.7 87.0 44.1 22.0 39.6
Uzbekistan 2006 MICS 67.1 97.3 26.7 96.0 83.7 37.9 68.6
Vanuatu 2007 MICS 71.9 90.7 39.9 95.3 79.4 31.6 67.9
Vietnam 2014 MICS 24.3 73.2 21.8
West Bank and Gaza 2010 MICS 61.5 95.8 28.8 91.2 67.3 13.2 47.7
Yemen, Rep. 2013 DHS 10.3 78.2 45.3
Zambia 2013 DHS 72.5 94.7 41.8
Zimbabwe 2014 MICS 41.0 89.0 17.1

Webappendix Lancet Breastfeeding Series paper 1 Page 12
Some available surveys from LMICs were not used, either because of data quality concerns (e.g. Afghanistan 2010 MICS) or because they were not nationally representative (Angola 2001 MICS and Lebanon 2009 MICS). Blank cells in the above table refer to indicators that were not collected in a given survey, or for which there were local questionnaire adaptations that did not allow the internationally standardized indicator to be calculated.
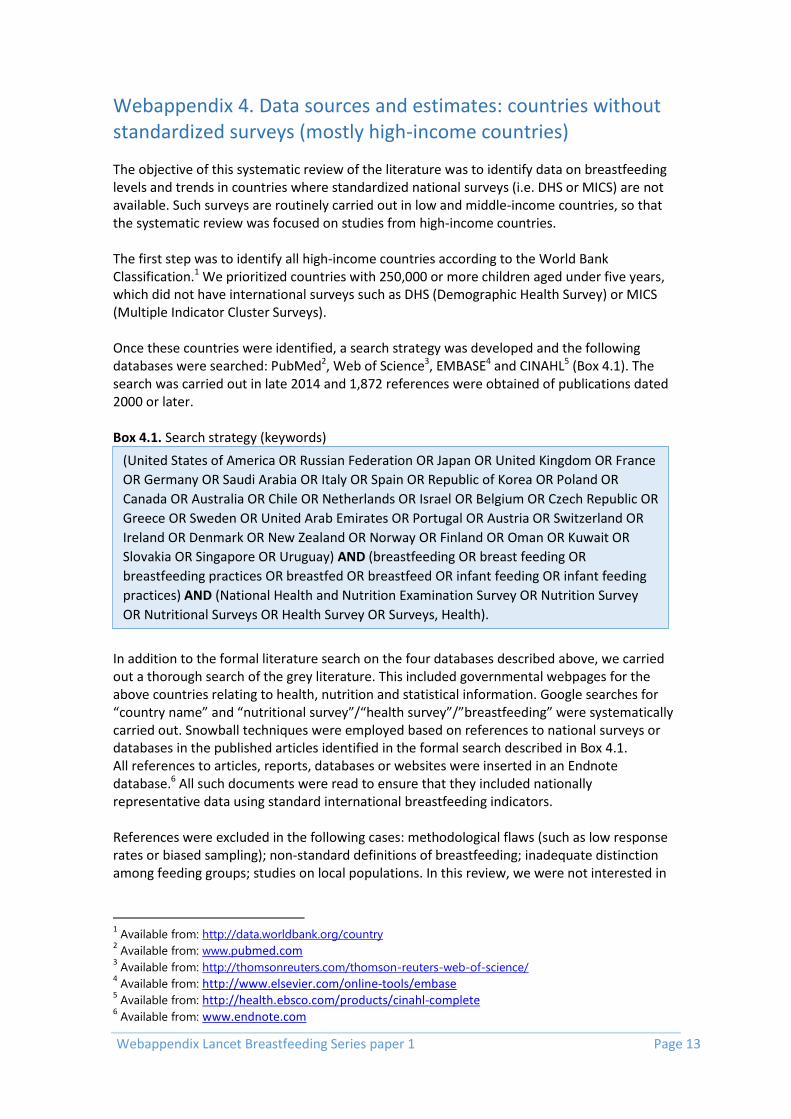
Webappendix Lancet Breastfeeding Series paper 1 Page 13
Webappendix 4. Data sources and estimates: countries without standardized surveys (mostly high-income countries)
The objective of this systematic review of the literature was to identify data on breastfeeding levels and trends in countries where standardized national surveys (i.e. DHS or MICS) are not available. Such surveys are routinely carried out in low and middle-income countries, so that the systematic review was focused on studies from high-income countries. The first step was to identify all high-income countries according to the World Bank Classification.1 We prioritized countries with 250,000 or more children aged under five years, which did not have international surveys such as DHS (Demographic Health Survey) or MICS (Multiple Indicator Cluster Surveys). Once these countries were identified, a search strategy was developed and the following databases were searched: PubMed2, Web of Science3, EMBASE4 and CINAHL5 (Box 4.1). The search was carried out in late 2014 and 1,872 references were obtained of publications dated 2000 or later. Box 4.1. Search strategy (keywords)
In addition to the formal literature search on the four databases described above, we carried out a thorough search of the grey literature. This included governmental webpages for the above countries relating to health, nutrition and statistical information. Google searches for “country name” and “nutritional survey”/“health survey”/”breastfeeding” were systematically carried out. Snowball techniques were employed based on references to national surveys or databases in the published articles identified in the formal search described in Box 4.1. All references to articles, reports, databases or websites were inserted in an Endnote database.6 All such documents were read to ensure that they included nationally representative data using standard international breastfeeding indicators. References were excluded in the following cases: methodological flaws (such as low response rates or biased sampling); non-standard definitions of breastfeeding; inadequate distinction among feeding groups; studies on local populations. In this review, we were not interested in
1 Available from: http://data.worldbank.org/country
2 Available from: www.pubmed.com
3 Available from: http://thomsonreuters.com/thomson-reuters-web-of-science/
4 Available from: http://www.elsevier.com/online-tools/embase
5 Available from: http://health.ebsco.com/products/cinahl-complete
6 Available from: www.endnote.com
(United States of America OR Russian Federation OR Japan OR United Kingdom OR France
OR Germany OR Saudi Arabia OR Italy OR Spain OR Republic of Korea OR Poland OR
Canada OR Australia OR Chile OR Netherlands OR Israel OR Belgium OR Czech Republic OR
Greece OR Sweden OR United Arab Emirates OR Portugal OR Austria OR Switzerland OR
Ireland OR Denmark OR New Zealand OR Norway OR Finland OR Oman OR Kuwait OR
Slovakia OR Singapore OR Uruguay) AND (breastfeeding OR breast feeding OR
breastfeeding practices OR breastfed OR breastfeed OR infant feeding OR infant feeding
practices) AND (National Health and Nutrition Examination Survey OR Nutrition Survey
OR Nutritional Surveys OR Health Survey OR Surveys, Health).

Webappendix Lancet Breastfeeding Series paper 1 Page 14
specific studies on factors affecting breastfeeding duration, nor on breastfeeding promotion or support policies or programs or impact of breastfeeding on health. The main difficulty we faced was the variability in the terminology and indicators related to breastfeeding (see Table 4.1).
Table 4.1. Different classifications of breastfeeding (BF) used in the reviewed literature. The top line represents the World Health Organization classification.
Exclusive BF
Predominant BF Partial No BF
BF + Water BF + Tea BF + Food BF + Milk No BF
Only breast (natural) milk (regardless of non-milk foods) Mixed Milk
Any BF
After the review of the literature was completed, we identified countries with limited or no information, and wrote to investigators from such countries to inquire about additional sources of data that we may have failed to detect. The following countries were contacted:
Canada
Czech Republic
Denmark
Germany
Ireland
Italy
Japan
Korea
New Zealand
Norway
Russia
Saudi Arabia
Spain
Switzerland
United Kingdom In most cases, the investigators who were contacted reanalyzed national datasets to produce the estimates that we needed. Figure 4.1 shows that 94 publications/data sources were selected for identifying the following indicators for breastfeeding (BF): early initiation of BF; exclusive BF (< 4 months and < 6 months); ever BF; any BF at 6 and 12 months. Results are available in Table 4.2. It is important to note that for many countries, only a few of the required indicators are presented. For example, definitions of “exclusive BF” varied so markedly from country to country that we opted not to present them. Of the 34 high income countries with 50,000 or more annual births, we were unable to obtain national information for following countries: Belgium, Israel, Kuwait, Poland, Portugal, Slovakia, and United Arab Emirates.

Webappendix Lancet Breastfeeding Series paper 1 Page 15
Figure 4.1. Literature review procedure, showing the number of articles/records identified.
Records identified through database searching (n=1.872)
Additional records identified through other sources (n=59)
Records excluded- imprecise measurement of breastfeeding; inadequate distinction among feeding groups e specific studies on factors affecting breastfeeding duration; breastfeeding promotion or support policies or
programs or impact of breastfeeding on health (n=1.837)
Studies included: nationally representative surveys carried out since 2000, using standard WHO breastfeeding indicators. (n=94)

Webappendix Lancet Breastfeeding Series paper 1 Page 16
Table 4.2. Results from the systematic review of the literature on BF practices in high-income countries.
Country Publication
date Reference
period Ever BF
Early initiation
of BF
Any BF at age 6
mo
Any BF at age 12 mo
Data source Response
rate Source
Australia 2011 2010 92 NA 56 30 National survey 56% Australian Institute of Health and Welfare, 2011
23
Austria 2009 2006 93 80 42* 16 National survey 16% Schlögel, 2009 24
Canada 2013 2011-12 89 NA 30* 9 National survey 72% Gionet, 2013 25
Chile 2012 2011-12 95 NA 41 21 Health records 95% Atalah,2004 26
Czech Republic 2013 2005 96 NA 42* 16 Health records NA OECD, 2013 27
and 12mo from personal communication (Dagmar Schneidrová)
Denmark 2014 2013 NA NA 13 3* Health records NA Statens Serum Institut, 2014 28
Finland 2012 2010 92 NA 58 34 National survey NA Uusitalo, 2012 29
France 2012-13 2012-13 63 NA 23 9 National survey 35% Institut de Veille Sanitaire, 2014 30
Germany 2014 2009-12 82 NA 50* 23 National survey 67% von der Lippe, 2015 31
and personal communication (Elena von der Lippe)
Greece 2007-08 2007-08 88 27 22 6 National survey 66% Institute of Child Health, 2009 32
Ireland Republic 2014 2012 55 2* National cohort 69% Growing Up in Ireland
Italy 2013 2013 86 94 46 19 National survey NA Italian National Institute of Statistics, 2013 33
Japan 2009 2009 95 NA 63* 60 National survey NA Personal communication (Naho Morizaki)
Netherlands 2009 2006-08 NA 75 32 11* National survey 54% Statistics Netherlands, 2009 34

Webappendix Lancet Breastfeeding Series paper 1 Page 17
Table 4.2. Results from the systematic review of the literature on BF practices in high-income countries. (continued)
Country Publication
date Reference
period Ever BF
Early initiation
of BF
Any BF at age 6
mo
Any BF at age 12 mo
Data source Response
rate Source
New Zealand 2014 2006 NA NA 60 44 National survey NA New Zealand Ministry of Health, 2014 35
and personal communication (Riz Firestone)
Norway 2014 2013 95 NA 71 35 National survey NA Norway Helsedirektoratet, 2014 36
Oman 2013 2007-11 NA 85 15* 95 National survey NA UNICEF, 2013 37
Republic of Korea
2013 2012 88 NA 61 46 National survey NA Chung 38
and personal communication (Chong-Woo Bae)
Russian Federation
2015 2013 96 NA 36 20 Health records NA Personal communication (Elena Keshishian) based on pediatric records (range 18-22% by region)
Saudi Arabia 2005 2004-05 92 23 10 2 National survey NA El Mouzan, 2009 39
Singapore 2014 2011 96 NA 42 19* National survey NA Singapore Goverment, 2014 40
Spain 2013 2011 77 NA 47 23* National survey 71% Gobierno de España, 2013 41
Sweden 2012 2010 98 NA 52 16 National survey NA Official Statistics of Sweden, 2012 42
Switzerland 2010 2003 94 NA 62 28 National survey 74% Merten, 2005 43
United Kingdom
2004 2005-10 81 74 34 0.5 National survey 35% McAndrew, 2012 44
United States of America
2011 2011 79 NA 49 27 National survey 60% CDC, 2014 45
Uruguay 2011 2011 98 59 64* 45 National survey of facility users
97% Ministerio de Salud Pública, 2011 46
*Estimates modelled using fractional polynomial regression (BF at 6 months modeled from BF at 12 months and vice-versa). NA = not available

Webappendix Lancet Breastfeeding Series paper 1 Page 18
Webappendix 5: Statistical methods
Weighting The paper presents in Figures 2, 4 and 5 averages of breastfeeding rates at global level, and by UN regions and World Bank country income classification. In each of the analyses we calculated averages for the relevant estimates using only available data weighted by the size of population of children under two years of age in 2010. This year was selected because it was the median for the most recent surveys for the countries in study. The source for population estimates was the Population Division, Department of Economic and Social Affairs, United Nations (http://esa.un.org/wpp/Excel-Data/population.htm).
Time trends Time trends for breastfeeding were estimated at national level and for the poorest and richest wealth quintiles. We used two indicators: exclusive breastfeeding for children 0-5 months of age and continued breastfeeding at 12 months of age (based on survey data for children 12-15 months). The inclusion criteria for surveys were:
1. All surveys for which the national and respective quintile-specific estimates were available were considered for inclusion in the analysis
2. The estimates of the resulting set of surveys went through a vetting process by Unicef, and those based on non-standard definitions or on data that were considered low quality were excluded.
3. Surveys with unweighted national sample size < 50 for a given indicator were excluded for the respective indicator. Surveys were not dropped only based on sample size for quintile-specific estimates.
4. After applying the previous rules, we excluded countries who had less than 2 surveys, and those where the time between 1st and last surveys was less than 3 years.
After applying these criteria, we included 66 countries and 214 surveys for the exclusive breastfeeding trend. For continued breastfeeding, we included 67 countries and 217 surveys. Table 5.1 presents the surveys used in the breastfeeding trend analysis. The trends were estimated using multilevel linear regression models (hierarchical mixed models) that take into account that countries contribute with two or more surveys for the analysis. This allow us to estimate a trend that will, in a way, average country level trends over time. As countries differ widely in population size, the estimates were weighted by population size of children under the age of two years. We used estimates from the Population Division, Department of Economic and Social Affairs, United Nations (http://esa.un.org/wpp/Excel-Data/population.htm). Under-two population estimates are available at five year intervals, and we used estimates from the year closest to the starting date of the survey. We started by fitting straight line models, and explored departures from linearity using fractional polynomial models. For all six models fitted, we found the polynomial models did not improve on the linear fits. We, thus, present the results of the linear fits for exclusive breastfeeding for children 0-5 months and continued breastfeeding for age 12 at national level and for the extreme wealth quintiles in Table 5.2. The coefficients of the models obtained can be interpreted as average annual change in percentage points of breastfeeding.
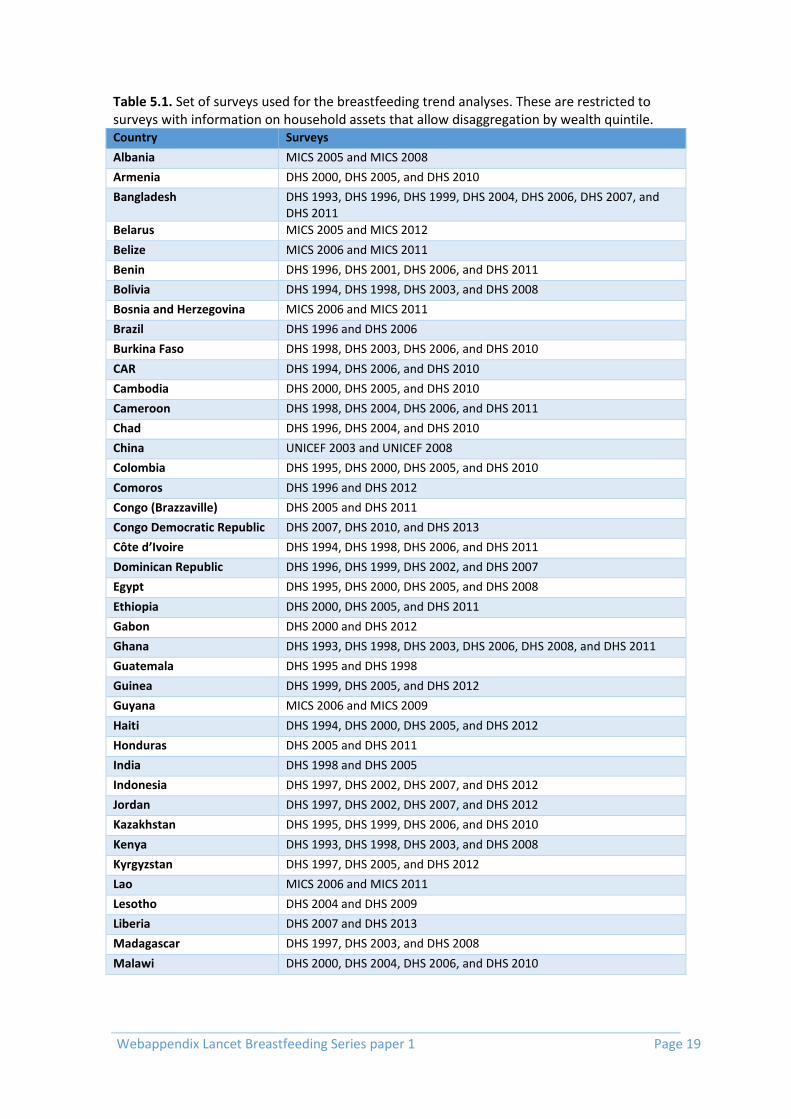
Webappendix Lancet Breastfeeding Series paper 1 Page 19
Table 5.1. Set of surveys used for the breastfeeding trend analyses. These are restricted to surveys with information on household assets that allow disaggregation by wealth quintile. Country Surveys
Albania MICS 2005 and MICS 2008
Armenia DHS 2000, DHS 2005, and DHS 2010
Bangladesh DHS 1993, DHS 1996, DHS 1999, DHS 2004, DHS 2006, DHS 2007, and DHS 2011
Belarus MICS 2005 and MICS 2012
Belize MICS 2006 and MICS 2011
Benin DHS 1996, DHS 2001, DHS 2006, and DHS 2011
Bolivia DHS 1994, DHS 1998, DHS 2003, and DHS 2008
Bosnia and Herzegovina MICS 2006 and MICS 2011
Brazil DHS 1996 and DHS 2006
Burkina Faso DHS 1998, DHS 2003, DHS 2006, and DHS 2010
CAR DHS 1994, DHS 2006, and DHS 2010
Cambodia DHS 2000, DHS 2005, and DHS 2010
Cameroon DHS 1998, DHS 2004, DHS 2006, and DHS 2011
Chad DHS 1996, DHS 2004, and DHS 2010
China UNICEF 2003 and UNICEF 2008
Colombia DHS 1995, DHS 2000, DHS 2005, and DHS 2010
Comoros DHS 1996 and DHS 2012
Congo (Brazzaville) DHS 2005 and DHS 2011
Congo Democratic Republic DHS 2007, DHS 2010, and DHS 2013
Côte d’Ivoire DHS 1994, DHS 1998, DHS 2006, and DHS 2011
Dominican Republic DHS 1996, DHS 1999, DHS 2002, and DHS 2007
Egypt DHS 1995, DHS 2000, DHS 2005, and DHS 2008
Ethiopia DHS 2000, DHS 2005, and DHS 2011
Gabon DHS 2000 and DHS 2012
Ghana DHS 1993, DHS 1998, DHS 2003, DHS 2006, DHS 2008, and DHS 2011
Guatemala DHS 1995 and DHS 1998
Guinea DHS 1999, DHS 2005, and DHS 2012
Guyana MICS 2006 and MICS 2009
Haiti DHS 1994, DHS 2000, DHS 2005, and DHS 2012
Honduras DHS 2005 and DHS 2011
India DHS 1998 and DHS 2005
Indonesia DHS 1997, DHS 2002, DHS 2007, and DHS 2012
Jordan DHS 1997, DHS 2002, DHS 2007, and DHS 2012
Kazakhstan DHS 1995, DHS 1999, DHS 2006, and DHS 2010
Kenya DHS 1993, DHS 1998, DHS 2003, and DHS 2008
Kyrgyzstan DHS 1997, DHS 2005, and DHS 2012
Lao MICS 2006 and MICS 2011
Lesotho DHS 2004 and DHS 2009
Liberia DHS 2007 and DHS 2013
Madagascar DHS 1997, DHS 2003, and DHS 2008
Malawi DHS 2000, DHS 2004, DHS 2006, and DHS 2010

Webappendix Lancet Breastfeeding Series paper 1 Page 20
Table 5.1. Set of surveys used for the breastfeeding trend analyses. These are restricted to surveys with information on household assets that allow disaggregation by wealth quintile. (continued) Country Surveys
Mali DHS 1995, DHS 2001, DHS 2006, and DHS 2012
Mongolia MICS 2005 and MICS 2010
Mozambique DHS 1997, DHS 2003and DHS 2011
Namibia DHS 2000 and DHS 2006
Nepal DHS 1996, DHS 2001, DHS 2006, and DHS 2011
Nicaragua DHS 1997 and DHS 2001
Niger DHS 1998, DHS 2006, and DHS 2012
Nigeria DHS 2003, DHS 2007, DHS 2008, DHS 2011 and DHS 2013
Pakistan DHS 2006 and DHS 2012
Peru DHS 1996, DHS 2000, DHS 2004, DHS 2005, DHS 2006, DHS 2007, DHS 2008, DHS 2009, DHS 2010, DHS 2011, and DHS 2012
Philippines DHS 1993, DHS 1998, DHS 2003, DHS 2008, and DHS 2013
Rwanda DHS 2000, DHS 2005, and DHS 2010
Senegal DHS 1997, DHS 2005, DHS 2010, and DHS 2012
Serbia MICS 2005 and MICS 2010
Sierra Leone MICS 2005, MICS 2008, MICS 2010, and MICS 2013
Suriname MICS 2006 and MICS 2010
Swaziland DHS 2006 and DHS 2010
Tajikistan MICS 2005 and MICS 2012
Tanzania DHS 1996, DHS 1999, DHS 2004, and DHS 2010
Togo DHS 1998, DHS 2006, and DHS 2010
Turkey DHS 1993, DHS 1998, and DHS 2003
Uganda DHS 1995, DHS 2006, and DHS 2011
Ukraine MICS 2005, MICS 2007, and MICS 2012
Uzbekistan DHS 1996 and DHS 2006
Vietnam DHS 1997, DHS 2002, DHS 2006, and DHS 2010
Zambia DHS 1996, DHS 2001, and DHS 2007
Zimbabwe DHS 1994, DHS 1999, DHS 2005, DHS 2009, and DHS 2010
Table 5.2. Model coefficients for the breastfeeding trend analyses.
Level of analysis Number of
countries/surveys
Average annual change
(pct points) P value
Exclusive breastfeeding for
children 0-5 months
National 66/214
0.54 <0.001 Q1 (poorest) 0.43 0.043 Q5 (richest) 0.98 <0.001
Continued breastfeeding for
children at 12 months
National 67/217
-0.13 0.149 Q1 (poorest) -0.14 0.200 Q5 (richest) 0.12 0.339
Estimation of missing breastfeeding estimates at specific ages Continued breastfeeding at 12 months for LMICs Different sources of information on breastfeeding use different ways to estimate continued breastfeeding at 12 months. From survey data, the usual approach is to estimate BF for

Webappendix Lancet Breastfeeding Series paper 1 Page 21
children aged 12-15 months of age, instead of using only children that are exactly 12 months old. This is done mostly to guarantee sample sizes big enough for fair precision of the estimates. However, as this is a period of rapid weaning, the inclusion of older children can produce underestimates. For surveys where data is available, we recalculated breastfeeding prevalence for children age 10-13, so that enough sample was available and the age midpoint was 12 months. For countries where data was not available, and estimates were obtained from reports, these were usually based on children aged 12-15 months. To avoid using different reference age groups in our analyses we developed a model to predict breastfeeding at 10-13 months from estimates of breastfeeding at 12-15. For this model, we used all DHS and MICS surveys phase 3 onwards with data on breastfeeding – 181 DHS, 71 MICS and 3 from other sources. Breastfeeding at 10-13 and at 12-15 months was estimated for all these surveys. Logit transforms of both estimates were used in a fractional polynomials ordinary least squares model using the fracpoly subcommand in Stata 13. Logit transforms were used to avoid estimating predicted values outside the 0-100 range, given many surveys had rates very close to 100%. From 44 possible models, we selected the best fitting one that included the powers 1 and ½. The model presented an R² of 96%. Figure 5.1 shows the final predictive model used, with values back transformed to their original scale.
Figure 5.1. Predictive model to estimate breastfeeding at age 10-13 from breastfeeding at 10-15 months.
Any breastfeeding at 6 and 12 months for HICs Our world map of breastfeeding presents the proportion of children receiving any breastfeeding at 12 months of age. Data on breastfeeding from HICs is limited, and for several countries only BF at 6 months or at 12 months is available. In order to complete the data for the map, we needed estimates at 12 months for as many countries as possible. Thus, we used
020
40
60
80
10
0
BF
at 1
0-1
3 m
o (
%)
0 20 40 60 80 100
BF 12-15 mo (%)
Observed data points Predictive model

Webappendix Lancet Breastfeeding Series paper 1 Page 22
data from HICs that had data for both ages to derive a predictive model for BF at 12 from BF at 6 months. The countries that contributed data for this model are listed in Table 5.3. The best predictive model was selected using fractional polynomials ordinary least squares models using the fracpoly subcommand in Stata 13. From 44 possible models, we selected the best fitting one that included the powers 3 and 3 again (applied to the logarithm of the predictor). The model presented an R² of 81%. Figure 5.2 shows the final predictive model used, with values back transformed to their original scale. A similar approach using the same data points was used to estimate BF at 6 months from BF at 12, in order to complete Table 4.2.
Table 5.3. Sources of data for predicting breastfeeding at 12 months from breastfeeding at 6 months for HICs.
Country Year
Australia 2010
Belgium 2003-07
Chile 2011-12
Finland 2010
France 2012-13
Greece 2007-08
Italy 2013
Luxembourg 2008
Norway 2013
Republic of Korea 2012
Russian Federation 2014
Saudi Arabia 2004-05
Sweden 2010
Switzerland 2003
United States of America 2011
Figure 5.2. Predictive model to estimate breastfeeding at age 12 from breastfeeding at 6 months in HICs.
USA
RUS
FRA
SAU
ITA
KOR
AUS
CHL
BELGRC
SWE
CHE
NORFIN
LUX
01
02
03
04
05
0
An
y B
F a
t 12
mo (
%)
0 20 40 60 80
Any BF at 6 mo (%)
Any BF at 12 mo (%) Predicted BF at 12 mo (%)

Webappendix Lancet Breastfeeding Series paper 1 Page 23
Webappendix 6. Systematic review – search terms
Search terms Effects on children, adolescents or adults according to bf pattern Neonatal, Infant, and Child Mortality Rates
Database Search terms
PUBMED #1 (("breast feeding"[MeSH Terms] OR ("breast"[All Fields] AND "feeding"[All Fields]) OR "breast feeding"[All Fields] OR "breastfeeding"[All Fields]) OR ("breast feeding"[MeSH Terms] OR ("breast"[All Fields] AND "feeding"[All Fields]) OR "breast feeding"[All Fields])) OR "human milk"[All Fields] OR "breast milk"[All Fields] OR ("exclusive breastfeeding"[All Fields] OR "exclusive breast feeding"[All Fields]) OR continuation[All Fields] OR continuing[All Fields] OR continued[All Fields] OR "stopping"[All Fields] OR stopped[All Fields] OR stop[All Fields] #2 ("mortality"[Subheading] OR "mortality"[All Fields] OR "mortality"[MeSH Terms]) OR ("infant mortality"[MeSH Terms] OR ("infant"[All Fields] AND "mortality"[All Fields]) OR "infant mortality"[All Fields] OR ("neonatal"[All Fields] AND "mortality"[All Fields]) OR "neonatal mortality"[All Fields]) OR ("infant mortality"[MeSH Terms] OR ("infant"[All Fields] AND "mortality"[All Fields]) OR "infant mortality"[All Fields]) OR ("child mortality"[MeSH Terms] OR ("child"[All Fields] AND "mortality"[All Fields]) OR "child mortality"[All Fields]) #3 ("pneumonia"[MeSH Terms] OR "pneumonia"[All Fields]) OR ("diarrhoea"[All Fields] OR "diarrhea"[MeSH Terms] OR "diarrhea"[All Fields]) OR ("sepsis"[MeSH Terms] OR "sepsis"[All Fields]) OR ("infection"[MeSH Terms] OR "infection"[All Fields] OR "infections"[All Fields]) OR (preterm[All Fields] OR ("infant, premature"[MeSH Terms] OR ("infant"[All Fields] AND "premature"[All Fields]) OR "premature infant"[All Fields] OR "prematurity"[All Fields])) OR ("malnutrition"[MeSH Terms] OR "malnutrition"[All Fields]) #4 (Addresses[ptyp] OR Autobiography[ptyp] OR Bibliography[ptyp] OR Biography[ptyp] OR pubmed books[filter] OR Case Reports[ptyp] OR Congresses[ptyp] OR Consensus Development Conference[ptyp] OR Directory[ptyp] OR Duplicate Publication[ptyp] OR Editorial[ptyp] OR Festschrift[ptyp] OR Guideline[ptyp] OR In Vitro[ptyp] OR Interview[ptyp] OR Lectures[ptyp] OR Legal Cases[ptyp] OR News[ptyp] OR Newspaper Article[ptyp] OR Personal Narratives[ptyp] OR Portraits[ptyp] OR Retracted Publication[ptyp] OR Twin Study[ptyp] OR Video-Audio Media[ptyp]) #1 AND (#2 OR #3) #5 NOT #4

Webappendix Lancet Breastfeeding Series paper 1 Page 24
Diarrhea incidence/hospitalization, lower respiratory infections incidence/prevalence and respiratory infections hospitalization
Database Search terms
MEDLINE Mortality: Infant mortality; pneumonia AND mortality; pneumonia and death; respiratory infection AND mortality; respiratory infection and death; lower respiratory tract infection and mortality; lower respiratory tract infection and death; diarrhea AND mortality; diarrhea AND death. Hospitalization: hospitalization; AND infant OR childhood; AND pneumonia OR respiratory infection OR lower respiratory tract infection OR diarrhea Incidence/prevalence: infant OR childhood; AND pneumonia OR respiratory infection OR lower respiratory tract infection OR diarrhea
Acute otitis media Database Search terms
PUBMED #1 "Breast Feeding"[Mesh] #2 "Milk, Human"[Mesh] #3 Breast[All Fields] AND Feed*[All Fields] #4 Breast-fe*[All Fields] #5 Infant fe* [All Fields] #6 Infant nutrition* [All Fields] #7 #1 OR #2 OR #3 OR #4 OR #5 OR #6 #8 “Otitis Media” [Mesh] #9 Otitis media[All Fields] #10 Middle ear infection[All Fields] #11 #8 OR #9 OR #10 #12 #7 AND #11 #13 animals [mh] NOT humans [mh] #14 #12 NOT #13
EMBASE #1 exp breast feeding/ #2 exp breast milk/ #3 Breast AND Feed* #4 Breast-fe*.mp. #5 Infant fe*.mp. #6 Infant nutrition*.mp. #7 1 OR 2 OR 3 OR 4 OR 5 OR 6 #8 exp otitis media/ #9 exp ear infection/ #10 otitis media.mp. #11 middle ear infection.mp. #12 8 OR 9 OR 10 OR 11 #13 7 AND 12 #14 limit 13 to human
CINAHL #1 "Breast Feeding" #2 "Milk, Human" #3 Breast AND Feed* #4 Breast-fe* #5 Infant fe* #6 Infant nutrition* #7 S1 OR S2 OR S3 OR S4 OR S5 OR S6 #8 “Otitis Media” #9 Otitis media #10 Middle ear infection #11 S8 OR S9 OR S10 #12 S7 AND S11 **For S12 select the ‘edit’ option – tick limit option ‘Human’

Webappendix Lancet Breastfeeding Series paper 1 Page 25
Allergic disease Database Search terms
PUBMED #1 "Breast Feeding"[Mesh] #2 "Milk, Human"[Mesh] #3 Breast[All Fields] AND Feed*[All Fields] #4 Breast-fe*[All Fields] #5 Infant fe* [All Fields] #6 Infant nutrition* [All Fields] #7 #1 OR #2 OR #3 OR #4 OR #5 OR #6 #8 “Asthma”[Mesh] #9 "Respiratory Sounds"[Mesh] #10 Wheez*[All Fields] #11 #8 OR #9 OR #10 #12 "Eczema"[Mesh] #13 "Dermatitis, Atopic"[Mesh] #14 atopic eczema* [All Fields] #15 #12 OR #13 OR #14 #16 "Rhinitis, Allergic, Seasonal"[Mesh] #17 "Rhinitis, Allergic, Perennial"[Mesh] #18 Allergic rhinitis [All fields] #19 Hay fever [All fields] #20 #16 OR #17 OR #18 OR #19 #21 "Food Hypersensitivity"[Mesh] #22 Food allerg*[All Fields] #23 Food hypersensit*[All Fields] #24 #21 OR #22 OR #23 #25 #7 AND (#11 OR #15 OR #20 OR #24) #26 animals [mh] NOT humans [mh] #27 #25 NOT #26
EMBASE #1 exp breast feeding/ #2 exp breast milk/ #3 Breast AND Feed* #4 Breast-fe*.mp. #5 Infant fe*.mp. #6 Infant nutrition*.mp. #7 1 OR 2 OR 3 OR 4 OR 5 OR 6 #8 exp asthma/ #9 exp wheezing/ #10 wheez*.mp. #11 8 OR 9 OR 10 #12 exp eczema/ #13 exp atopic dermatitis/ #14 atopic eczema*.mp. #15 12 OR 13 OR 14 #16 exp allergic rhinitis/ #17 allergic rhinitis.mp. #18 hay fever.mp. #19 16 OR 17 OR 18 #20 exp food allergy/ #21 food allerg*.mp. #22 food hypersensit*.mp. #23 20 OR 21 OR 22 #24 7 AND (11 OR 15 OR 19 OR 23) #25 limit 24 to human
CINAHL #1 "Breast Feeding"

Webappendix Lancet Breastfeeding Series paper 1 Page 26
#2 "Milk, Human" #3 Breast AND Feed* #4 Breast-fe* #5 Infant fe* #6 Infant nutrition* #7 S1 OR S2 OR S3 OR S4 OR S5 OR S6 #8 “Asthma” #9 “Wheezing” #10 Wheez* #11 S8 OR S9 OR S10 #12 “Eczema” #13 "Dermatitis, Atopic" #14 atopic eczema* #15 S12 OR S13 OR S14 #16 "Rhinitis, Allergic, Seasonal” #17 "Rhinitis, Allergic, Perennial” #18 Allergic rhinitis #19 Hay fever #20 S16 OR S17 OR S18 OR S19 #21 "Food Hypersensitivity" #22 Food allerg* #23 Food hypersensit* #24 S21 OR S22 OR S23 #25 S7 AND (S11 OR S15 OR S20 OR S24) **For S24 select the ‘edit’ option – tick limit option ‘Human’
Infant nutrition (length / weight / BMI or weight/length) Database Search terms
PUBMED "Breast Feeding"[Mesh] AND ((Clinical Trial[ptyp] OR Clinical Trial, Phase III[ptyp] OR Controlled Clinical Trial[ptyp] OR Evaluation Studies[ptyp] OR Meta-Analysis[ptyp] OR Multicenter Study[ptyp] OR Randomized Controlled Trial[ptyp]) AND ("2006/01/01"[PDAT] : "2014/22/12"[PDAT]))
SCIELO 2006 or 2007 or 2008 or 2009 or 2010 or 2011 or 2012 or 2013 or 2014 [Ano de publicação] and aleitamento or breastfeeding or breastfeeding intervention or breastfeeding counseling or aleitamento materno or amamentação [Assunto] and peso or weight or altura or lenght or hight or indice de massa corporal or body mass index or hemoglobina or anemia or estado nutricional or medidas antropométricas or nutritional status or haemoglobin or ferro or anaemia or deficiência de ferro or iron deficiency [Todos os índices]
LILACS "ENSAIO CLINICO" or "ENSAIO CLINICO CONTROLADO" or "ENSAIO CLINICO CONTROLADO ALEATORIO" or "ENSAIO CLINICO FASE III" or "ESTUDOS DE AVALIACAO" or "METANALISE" or "REVISAO" [Tipo de publicação] and ( "ALEITAMENTO" or "ALEITAMENTO materno" ) or "amamentacao" [Descritor de assunto] and peso or weight or altura or length or hight or indice de massa corporal or body mass index or hemoglobina or anemia or estado nutricional or medidas antropométricas or nutritional satus or haemoglobin or ferro or anaemia or deficiência de ferro or iron deficiency [Palavras]
COCHRANE tw:(aleitamento materno AND (instance:"regional") AND ( collection:("02-cochrane"))) AND (instance:"regional") AND ( mj:("Aleitamento Materno") AND type_of_study:("systematic_reviews") AND limit:("Humans"))
EMBASE breastfeeding OR 'breastfeeding promotion' OR 'breast feeding' AND ([controlled clinical trial]/lim OR [randomized controlled trial]/lim OR [meta analysis]/lim) AND [article]/lim AND [humans]/lim NOT [medline]/lim AND [2006-2014]/py

Webappendix Lancet Breastfeeding Series paper 1 Page 27
Dental caries Database Search terms
PUBMED #1 "Breast Feeding"[Mesh] #2 "Milk, Human"[Mesh] #3 Breast[All Fields] AND Feed*[All Fields] #4 Breast-fe*[All Fields] #5 Infant fe* [All Fields] #6 Infant nutrition* [All Fields] #7 #1 OR #2 OR #3 OR #4 OR #5 OR 6 #8 Dental caries (MeSH) #9 Tooth decay #10 “Early childhood caries” #11 “Nursing bottle caries” #12 #8 OR #9 OR #10 OR #11 #13 animals [mh] NOT humans [mh] #14 #7 AND #12 #15 #14 NOT #13
EMBASE #1 'breast feeding'/exp #2 'breast milk'/exp #3 Breast AND Feed* #4 Breast-fe* #5 Infant fe* #6 Infant nutrition* #7 #1 OR #2 OR #3 OR #4 OR #5 OR 6 #8 'dental caries'/exp #9 Tooth decay #10 “Early childhood caries” #11 “Nursing bottle caries” #12 #8 OR #9 OR #10 OR #11 #13 [animals]/lim NOT [humans]/lim #14 #7 AND #12 #15 #14 NOT #13
CINAHL #1 "Breast Feeding" #2 "Milk, Human" #3 Breast AND Feed* #4 Breast-fe* #5 Infant fe* #6 Infant nutrition* #7 S1 OR S2 OR S3 OR S4 OR S5 OR S6 #8 dental caries #9 tooth decay #10 early childhood caries #11 nursing bottle caries #12 S8 OR S9 OR S10 OR S11 #13 S7 AND S12 **For #13 limit to ‘Human’

Webappendix Lancet Breastfeeding Series paper 1 Page 28
Malocclusion Database Search terms
PUBMED (“Breast Feeding” OR “Bottle Feeding” OR “Infant Formula” OR “Milk, Human” OR “Weaning” OR “Breastfeeding” OR “Predominant Breastfeeding” OR “Continuing Breastfeeding” OR “Continued Breastfeeding” OR “Breastfed” OR “Breastfeed” OR “Formula milk” OR “Formula feed”) AND (“Malocclusion” OR “Openbite” OR “Overbite” OR “Malocclusion, Angle Class III” OR “Malocclusion, Angle Class II” OR “Malocclusion, Angle Class I” OR “Overjet” OR “Cross bite” OR “Canine relationship” OR “Molar relationship” OR “Deep bite” OR “Foster & Hamilton” OR “Dental Aesthetic Index”)
SCOPUS TITLE-ABS-KEY ("Breast Feeding" OR "Breastfeeding" OR "Breast feeding" OR "Predominant Breastfeeding" OR "Continuing Breastfeeding" OR "Continued Breastfeeding" OR "Breastfed" OR "Breastfeed" OR "Bottle Feeding" OR "Bottle Feed" OR "Bottle fed" OR "Infant Formula" OR "Milk, Human" OR "Human Milk" OR "Formula milk" OR "Formula feed" OR "Formula fed" OR "Weaning") AND TITLE-ABS-KEY ("Malocclusion" OR "Openbite" OR "Overbite" OR "Overjet" OR "Open bite" OR "Over bite" OR "Cross bite" OR "Crossbite" OR "Over jet" OR "Openbite" OR "Canine relationship" OR "Molar relationship" OR "Deep bite" OR "Malocclusion, Angle Class III" OR "Malocclusion, Angle Class II" OR "Malocclusion, Angle Class I" OR "Foster & Hamilton" OR "Dental Aesthetic Index")
EMBASE AND WEB OF KNOWLEDGE
("Breast Feeding" OR "Breastfeeding" OR "Breast feeding" OR "Predominant Breastfeeding" OR "Continuing Breastfeeding" OR "Continued Breastfeeding" OR "Breastfed" OR "Breastfeed" OR "Bottle Feeding" OR "Bottle Feed" OR "Bottle fed" OR "Infant Formula" OR "Milk, Human" OR "Human Milk" OR "Formula milk" OR "Formula feed" OR "Formula fed" OR "Weaning") AND ("Malocclusion" OR "Openbite" OR "Overbite" OR "Overjet" OR "Open bite" OR "Over bite" OR "Cross bite" OR "Crossbite" OR "Over jet" OR "Openbite" OR "Canine relationship" OR "Molar relationship" OR "Deep bite" OR "Malocclusion, Angle Class III" OR "Malocclusion, Angle Class II" OR "Malocclusion, Angle Class I" OR "Foster & Hamilton" OR "Dental Aesthetic Index")
SCIELO AND LILACS
(tw: ("Breast Feeding" OR "Breastfeeding" OR "Breast feeding" OR "Predominant Breastfeeding" OR "Continuing Breastfeeding" OR "Continued Breastfeeding" OR "Breastfed" OR "Breastfeed" OR "Bottle Feeding" OR "Bottle Feed" OR "Bottle fed" OR "Infant Formula" OR "Milk, Human" OR "Human Milk" OR "Formula milk" OR "Formula feed" OR "Formula fed" OR "Weaning") AND tw: ("Malocclusion" OR "Openbite" OR "Overbite" OR "Overjet" OR "Open bite" OR "Over bite" OR "Cross bite" OR "Crossbite" OR "Over jet" OR "Openbite" OR "Canine relationship" OR "Molar relationship" OR "Deep bite" OR "Malocclusion, Angle Class III" OR "Malocclusion, Angle Class II" OR "Malocclusion, Angle Class I" OR "Foster & Hamilton" OR "Dental Aesthetic Index"))
Blood pressure Database Search terms
PUBMED (breastfeeding OR "breast feeding" OR breastfed OR breastfeed OR “bottle feeding” OR “bottle fed” OR “bottle feed” OR “infant feeding” OR “human milk” OR “formula milk” OR “formula feed” OR “formula fed” OR weaning) AND ("blood pressure" or hypertension or "systolic blood pressure" or "diastolic blood pressure")

Webappendix Lancet Breastfeeding Series paper 1 Page 29
Overweight and/or obesity Database Search terms
PUBMED (breastfeeding OR "breast feeding" OR breastfed OR breastfeed OR “bottle feeding” OR “bottle fed” OR “bottle feed” OR “infant feeding” OR “human milk” OR “formula milk” OR “formula feed” OR “formula fed” OR weaning) AND (overweight or obesity or "body mass index" or growth or weight or height or "child growth")
Total cholesterol
Database Search terms
PUBMED (breastfeeding OR "breast feeding" OR breastfed OR breastfeed OR “bottle feeding” OR “bottle fed” OR “bottle feed” OR “infant feeding” OR “human milk” OR “formula milk” OR “formula feed” OR “formula fed” OR weaning) AND (cholesterol or LDL or HDL or triglycerides or "blood lipids")
Type-2 diabetes Database Search terms
PUBMED (breastfeeding OR "breast feeding" OR breastfed OR breastfeed OR “bottle feeding” OR “bottle fed” OR “bottle feed” OR “infant feeding” OR “human milk” OR “formula milk” OR “formula feed” OR “formula fed” OR weaning) AND (diabetes or glucose or glycemia)
Intelligence Database Search terms
PUBMED (breastfeeding OR "breast feeding" OR breastfed OR breastfeed OR “bottle feeding” OR “bottle fed” OR “bottle feed” OR “infant feeding” OR “human milk” OR “formula milk” OR “formula feed” OR “formula fed” OR weaning) AND (schooling or development or intelligence)
Interventions to promote breastfeeding Database Search terms
PUBMED #1 (Breastfeeding OR Breast Feeding OR (Exclusive AND Breastfeeding [All Fields]) OR (Continued AND Breast feeding [All Fields]) OR Lactation OR Human Milk OR Breast Milk [MeSH Majr]) #2 (Counseling OR Peer OR education OR health education OR (intervention[All Fields]) OR family practice OR support OR Groups OR health worker OR physician [MeSH terms]) #3 (Social media OR social networking OR mass media OR health campaigns OR (group AND meeting [All Fields]) OR health promotion OR community health services OR community health care OR community participation OR community networks [MeSH terms]) #4 (BFHI [All Fields] OR (Baby Friendly Hospital [All Fields]) OR Rooming in OR Perinatal Care OR Comprehensive health care OR Primary care OR health services OR Hospital OR Facility OR health care system OR health program[MeSH terms]) #5 ((Infant food Marketing [All Fields]) OR (Code of Marketing [All Fields]) OR (Infant milk substitutes [All Fields]) OR (Breast milk substitutes [All Fields]) OR Policy OR Legislations OR law [MeSH terms]) #6 (Addresses[ptyp] OR Autobiography[ptyp] OR Bibliography[ptyp] OR Biography[ptyp] OR pubmed books[filter] OR Case Reports[ptyp] OR Congresses[ptyp] OR Consensus Development Conference[ptyp] OR Directory[ptyp] OR Duplicate Publication[ptyp] OR Editorial[ptyp] OR Festschrift[ptyp] OR Guideline[ptyp] OR In Vitro[ptyp] OR Interview[ptyp] OR Lectures[ptyp] OR Legal Cases[ptyp] OR News[ptyp] OR Newspaper Article[ptyp] OR Personal Narratives[ptyp] OR Portraits[ptyp] OR Retracted Publication[ptyp] OR Twin Study[ptyp] OR Video-Audio Media[ptyp]) #7 «#1 AND (#2 OR #3 OR #4 OR #5)» #8 «#7 NOT #6»

Webappendix Lancet Breastfeeding Series paper 1 Page 30
Effects on women who breastfed Database Search terms
-PUBMED #1 Breastfeeding OR Breast Feeding OR Lactation OR Human Milk OR Breast Milk #2 Women OR Maternal OR Postpartum OR puerperal OR postnatal OR Birth OR gestation Diabetes OR (Breast AND (Cancer OR carcinoma OR tumor OR malignancy)) OR (Ovarian OR Ovary AND (Cancer OR carcinoma OR tumor OR malignancy)) OR (depression OR Blues OR psychosis) OR (Amenorrhea OR Contraception) OR (Osteoporosis OR Bone mineral density) OR Weight OR BMI OR body mass index #3 (Addresses[ptyp] OR Autobiography[ptyp] OR Bibliography[ptyp] OR Biography[ptyp] OR pubmed books[filter] OR Case Reports[ptyp] OR Congresses[ptyp] OR Consensus Development Conference[ptyp] OR Directory[ptyp] OR Duplicate Publication[ptyp] OR Editorial[ptyp] OR Festschrift[ptyp] OR Guideline[ptyp] OR In Vitro[ptyp] OR Interview[ptyp] OR Lectures[ptyp] OR Legal Cases[ptyp] OR News[ptyp] OR Newspaper Article[ptyp] OR Personal Narratives[ptyp] OR Portraits[ptyp] OR Retracted Publication[ptyp] OR Twin Study[ptyp] OR Video-Audio Media[ptyp]) #4 #1 AND #2 AND #3 #1 #5 NOT #4

Webappendix Lancet Breastfeeding Series paper 1 Page 31
Webappendix 7. LiST methods and assumptions In this section of the web annex we present two pieces related to the LiST analyses presented in the paper. The first section provides a brief overview and background of the Lives Saved Tool. More details on the models and previous use are available at the LiST web site (www.livessavedtool.org). The second section then presents explicit details of the methods used in the analyses and also provides a link to the country-specific models that were used in the analyses. These models which include all of the country-specific information can be downloaded and run to reproduce the analyses presented in the main text.
General Overview of the Lives Saved Tool (LiST)7
Background and history The Lives Saved Tool (LiST) has been developed over the past 10 years. The initial version of the software was developed as part of the work for the Child Survival Series in Lancet in 2003.47 The purpose of the program was to estimate the impact that scaling up community-based interventions would have on under-five mortality 48, but the program had a very limited demographic capability. - Starting from this initial point the software was expanded first to handle a new set of interventions that focused more on facility-based care with the primary impact being on neonatal mortality.49, 50 The model was then improved to handle populations and cohorts and to include wasting and stunting as risk factors as part of the work for the Lancet Nutrition Series.51 At about the same time, the Bill & Melinda Gates foundation provided on-going support to the further development and maintenance of the software as part of the work of the Child Health and Epidemiology Reference Group (CHERG). At that point, the software was shifted into the free and publicly available Spectrum software package, to take advantage of the demographic capabilities in that software and to provide links to the AIM module that had been developed to estimate the impact of HIV/AIDS.52 Since that time LiST has expanded its scope to look at the impact of interventions on birth outcomes and stillbirths 53, maternal mortality, and incidence of pneumonia and diarrhea 54 as well as neonatal and child mortality.
Theoretical approach and basic modelling structure of LiST The Lives Saved tool has been characterized as a linear, mathematical model that is deterministic.55 It describes fixed relationships between inputs and outputs that will produce the same outputs each time one runs the model. In List the primary inputs are coverage of interventions and the outputs are changes in population level of risk factors (such as wasting or stunting rates, birth out comes such a prematurity or size at birth) and cause-specific mortality (neonatal, child mortality 1-59m, maternal mortality and stillbirths). The relationship between an input (change in intervention coverage) with one or more outputs is specified in terms of the effectiveness of the intervention in reducing the probability of that outcome. The outcome can be cause-specific mortality or a risk factor. The overarching assumption in LiST is that mortality rates and cause of death structure will not change except in response to changes in coverage of interventions. The model assumes that changes in distal variables such as increase in per capita income or mothers’ education will affect mortality by increasing coverage of interventions or reducing risk factors. Currently there are around 70 separate interventions within LiST. These interventions have an impact on stillbirths, neonatal mortality, mortality in children 1-59 months, maternal mortality
7 This overview document is based on a paper by N Walker, Y Tam and I Friberg.

Webappendix Lancet Breastfeeding Series paper 1 Page 32
or risk factors within the model. Interventions can be linked to multiple outcomes, with some interventions linked to multiple causes of death and risk factors. A key feature of LiST is that it allows one to look at the impact of scaling up coverage of multiple interventions simultaneously, instead of a single intervention and one cause as is done in many natural history models. There are several structural features about the model that must be considered in order to estimates the impact of scaling up coverage of multiple interventions and changes in risk factors on mortality. First, the effectiveness or efficacy of an intervention must be described in terms of reduction in cause-specific mortality rather than in overall mortality. With cause-specific estimates of efficacy we can then compute the combined impact of interventions. Within LiST, efficacy of an intervention is defined in terms of the reduction of a cause of death or risk factor. When there is a single intervention the calculation of impact is simple as one has change in coverage times the efficacy of the intervention and this is applied to the cause specific mortality. For example if we have 10,000 diarrhea deaths in children aged 1-59 months and we introduce a new vaccine that would be 50% effective in reducing diarrhea mortality. If we have coverage of 50% we would then reduce diarrhea mortality to 7,500 (10000 – (10,000 *.5 * .5)). When there is a second or a third intervention, the same approach is followed except that the second diarrhea intervention would be applied to the residual diarrhea deaths. So if the second new diarrhea intervention is also 50% effective and coverage reaches 50% we would then reduce diarrhea mortality to 5,626. By using cause-specific efficacy and applying each intervention to the residual deaths after the previous intervention we ensure that we are not double counting impact of interventions.
Age structure within LiST LiST has a fairly simple age structure within the model that serves as a pseudo cohort. The age periods in LiST include pregnancy, 0-1 month, 1-5m, 6-11, 12-23 and 24-59. Within the model impact at one age period has a cascading effect of what happens at the next. For example, if we scale up interventions that have an impact of neonatal mortality, more children will survive that period and then be exposed to the risk of death in the 1-59 month period. So the number of deaths in this period will increase, but the rate of mortality will remain the same. These time periods are also linked to the impact of sub-optimal breastfeeding on mortality. For pregnancy, neonatal and 1-59 months there is a fixed cause of death structure in the base year (during pregnancy it is period of stillbirths). There is also a mortality rate that is applied to the age period. Within the 1-59 month period it is adjusted to reflect the higher mortality at earlier ages. Interventions within LiST can have an impact on one or more age periods.
Links to other modules in Spectrum The Lives Saved Tool is a linked module within the Spectrum program. Currently LiST is linked directly to three other modules in Spectrum. A required linkage in Spectrum is between LiST and the demographic module, DemProj. DemProj is a fully functioning demographic package that allows users to define populations via inputs on age-specific fertility, migration, population structure by age and sex, and other factors. The software contains the most recent population projections from the United Nations Population Division for 192 countries. When using LiST, users select a country, base year and end year and then LiST automatically loads in the population projection for that time period. Users can then use this as the population projection or they can use DemProj to update or alter as they deem appropriate. FamPlan is a second module within Spectrum that is linked to LiST. FamPlan was developed to estimate the impact of scaling up family planning on fertility. As with the other modules, when

Webappendix Lancet Breastfeeding Series paper 1 Page 33
one selects a country the most recent information on family planning, contraceptive prevalence, unmet need for contraception and contraceptive method mix is loaded. The user can then create scenarios where one reduces unmet need, increase contraceptive use and changes the contraceptive method mix. By changing these parameters in FamPlan several outputs change when it feeds into LiST as inputs. First, if one changes contraceptive prevalence then there is an impact on fertility. When a user specifies changes in FamPlan, this overrides the predicted fertility assumptions and alters assumptions about abortion from DemProj and passes this new information to LiST. For example, if one scales up contraceptive prevalence to very high rates in a country with low contraceptive use, then the number of births will decrease and therefore the number of under-five and maternal deaths predicted by LiST will decrease. A third linked package is the AIDS Impact Module, AIM, which is used to estimate the impact of HIV/AIDS on mortality. This module has been developed under the auspices of UNAIDS and the UNAIDS reference group on modeling and estimates.56 This module describes the epidemic curve in terms of incidence for each country. The module also has coverage of interventions (e.g., treatment, prevention of mother-to-child transmission) and uses the information to estimate prevalence and mortality by age and sex. Estimating the impact of interventions to reduce AIDS mortality in children in not done in LiST, rather the calculations are done in AIM and then passed to LiST. Within Spectrum, when one selects a country it will automatically load in the most recent country-specific AIM module developed by UNAIDS and the national AIDS program.57 As with other modules in Spectrum, the user can override the standard AIM inputs and can scale up interventions and change the epidemic curve to develop new scenarios for the future. This module then passes to LiST mortality due to AIDS to the LiST module.
Source of assumptions and process of updating LiST The development of the Lives Saved Tool has been under the guidance of the Child Health Epidemiology Reference Group (CHERG) of WHO and UNICEF. CHERG, along with its institutional sponsors, has developed rules of evidence to decide what interventions should be included in the model as well as how to develop the estimates of efficacy and effectiveness used in the model.58 While the assumptions used within LiST are drawn from various sources, most of the assumptions about efficacy and effectiveness of interventions come from a series of journal supplements. Previously three supplements containing over 70 articles have been published.59-61 The set of assumptions and their sources can be found at the LiST website (www.livessavedtool.org). The CHERG also supports efforts to compare the estimates that come from LiST to measured changes in intervention coverage and mortality. There have been several studies that have compared measured changes in mortality to LiST estimates of mortality change looking at different sets of interventions in different countries. For example, one study compared LiST estimates to measured reduction in neonatal mortality in community trials in South Asia.62 Another study looked at community trials that focus on the scale up of use of insecticide treated nets (ITNs) in sub-Saharan Africa.63 A third compared measured and estimated mortality for a community trial in Mozambique.64 In all of these studies there was close agreement between the estimates of mortality from LiST based on coverage changes and the measured reductions in mortality. Additional studies doing comparisons of LiST have been published in the LiST journal supplements.59-61
Creating a projection scenario in LiST The basic process to create a projection scenario is fairly simple. First, one must select a baseline year for a country (or region, district or any other area one choses). In that baseline

Webappendix Lancet Breastfeeding Series paper 1 Page 34
year the country must be described in terms of a five broad sets of variables: mortality, exposure, risk factors, intervention coverage and demography. For mortality one must specific the neonatal, 1-59 month, stillbirth rates and maternal mortality rates, as well as the proportional causes of mortality (or stillbirths). Exposure variables include such factors as exposure to falciparum, level of deficiency of vitamin A and zinc, and percent of the population living in poverty. Risk factors include stunting and wasting rates by age, birth outcomes, breastfeeding patterns and diarrhea and pneumonia incidence. Coverage of interventions must be provided for all intervention in LiST in the baseline year. Finally, for LiST to operate basic demographic information must be provided including population structure by age and sex as well as age-specific fertility. Fortunately LiST allows readers to automatically load in this information for 90 low- and middle-income countries for any year from 2000 to 2011, where the information are typically compiled from large surveys such as DHS or MICS. Once one selects the country and base year, the information is automatically loaded into the program but the user can change any values if they have better data or if they would like to modify the population to reflect a region smaller than the national. Once a baseline year is set for a country, the user can then create a projection scenario by scaling up coverage of a single or multiple interventions over a time period. For example, one could look at the impact of scaling up vitamin A supplementation from its current level of coverage of 50% in 2013 to 95% coverage in 2015. Or one could develop a treatment scenario where one scale up coverage of treatment for diarrhea with ORS, antibiotics for pneumonia and treatment for malaria with ACT from current levels of coverage to 90% by 2018. Once one has created a scale up scenario, LiST then re-computes all of the inputs used in the base year based on the impact of the interventions in the scale up scenario. The levels of mortality, cause of deaths structure and levels of risk factors will be recomputed and applied to the new population structure that reflects not only the changes in DemProj but also any changes in intervention coverage from the LiST model and changes made in the FamPlan and AIM modules.
Methods and Assumptions of the LiST Analyses
Countries The LiST analyses of the impact of increased appropriate breastfeeding practices were performed on the 75 countdown countries. We restricted the analyses to these 75 countries as we had estimates and data available to have good baseline models in LiST. These countries are responsible for over 95% of global under-five deaths.
LiST Assumptions For all 75 countdown countries we created a baseline model for the year 2013. We chose 2013 as our baseline year as this is the last year for which we have country-specific estimates of mortality in children, which includes neonatal, infant and under-five mortality.65 For the other assumptions in LiST we used the standard data sources and assumptions, with the exception of changes to the linkages between breastfeeding practices and cause-specific mortality risk.
Breastfeeding and mortality risk In the standard version of LiST we treat sub-optimal breastfeeding as a risk factor. We characterize breastfeeding by type and age of the child.

Webappendix Lancet Breastfeeding Series paper 1 Page 35
For children under the age of six months, we specify the percent of children who are exclusively breastfed, predominantly breast fed, partial breastfed and not breast fed. We stratify these patterns of breastfeeding into two periods: under one month and 1-5 months. Using exclusive breastfeeding as the standard, we then have relative risks for cause-specific mortality for each of the three sub-optimal feeding practices. For children aged six months to 2 years we specify the percent of children who are continuing to beast feed and those who do not. Here we stratify this into two age groups, 6-11 months and 12-23 months. The continued breastfeeding is the standard and we have higher relative risks for cause-specific mortality for the no breastfeeding group for both periods. For all age periods our estimates of breastfeeding practices are from the most recent household surveys for each country. In LiST, under-five mortality is divided into two age periods (under one month and 1 to 59 months). For each of these periods we have estimates of cause-specific mortality. For the neonatal period there are 8 causes: N-diarrhea, N-pneumonia, N-sepsis, N-asphyxia, N-prematurity, N-tetanus, N-congenital abnormalities, and N-other. In the period 1-59 months we have 9 causes of death: diarrhea, pneumonia, meningitis, measles, malaria, pertussis, AIDS, Injury and other. In the standard version of LiST we only have increased relative risks for diarrhea and pneumonia, in both the neonatal and 1-59 month period. These causes of deaths are those categories used by WHO in their most recent estimates of cause-specific under-five mortality.66 For the analyses presented here we created links and relative risks between sub-optimal breastfeeding and all additional causes. In the neonatal period we added links between breastfeeding and sepsis, prematurity and neonatal other. For the period 1-59 months we added links between breastfeeding and meningitis, measles, malaria, pertussis and other.
Relative risks For the relative risk associated with different breastfeeding practices we used the results of a meta-analysis.67 These risks were applied to all of the causes listed above with the exception of N-other, N-prematurity and Other (1-59m). Table 7.1 shows the risks by age periods.
Table 7.1. Relative risks of breastfeeding practices by age of child.
Breastfeeding Practice
Less than 1 month
1 to 6 months 6 to 12 months 12 to 24 months
Exclusive 1.0 1.0 1.0 1.0
Predominant 1.7 1.7 _ _
Partial 4.56 4.56 _ _
None 8.60 8.60 2.09 2.09
For N-other, N-prematurity and Other (1-59m) we had to make adjustments to the relative risks. For N-other and other (1-59m) we had to adjust the relative risks to reflect the percentage of other deaths that were due to infectious diseases. For each country we obtained estimates of the percent of other causes for both the neonatal and 1-59 month periods and the relative risks were altered to reflect and impact on the percentage of other deaths that were due to infectious diseases. While these estimates were country specific, overall (all countries) the median percent of neonatal other due to infectious diseases was 84% while in the other 1-59 period it was 15.3%.

Webappendix Lancet Breastfeeding Series paper 1 Page 36
For N-prematurity we also made an adjustment. The key here is that we assumed that breastfeeding would have little impact on early deaths due to prematurity, but once a premature child had survived for the first few days, averting infectious via breastfeeding would have a strong impact. We used an estimate of 15% of premature deaths occurring after the first week of life and it was to those deaths we applied the relative risks.
Scenarios We used a simple scenario for estimating the impact of improved breast feeding practices on mortality. For each of the 75 countdown countries we created a baseline for the year 2013. This included the most recent estimate of breastfeeding practices. Then in the year 2014 we scaled up breastfeeding practices to the rates shown in Table 7.2. If a country had a current rate higher than the scale up values we did not change the rates. Table 7.2. Scaled rates of breast feeding by age of child.
Less than 1 month
1 to 6 months 6 to 12 months 12 to 24 months
Exclusive 95% 90% 90% 90%
Predominant 3% 5% _ _
Partial 1% 3% _ _
None 1% 2% 10% 10%
Final LiST Models The estimates of the impact of scaling up breast feeding on mortality were run using LiST version 5.25 beta 1. This version of the software along with the country specific models can be downloaded at (www.livedsavedtool.org).
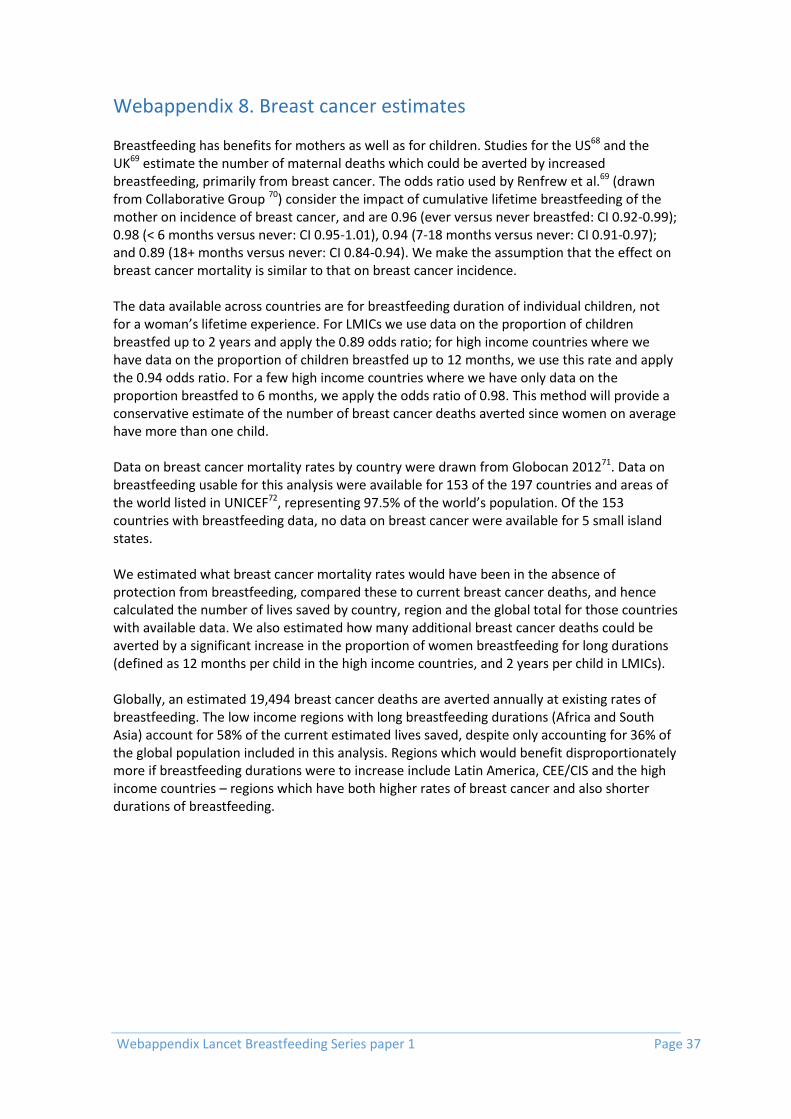
Webappendix Lancet Breastfeeding Series paper 1 Page 37
Webappendix 8. Breast cancer estimates Breastfeeding has benefits for mothers as well as for children. Studies for the US68 and the UK69 estimate the number of maternal deaths which could be averted by increased breastfeeding, primarily from breast cancer. The odds ratio used by Renfrew et al.69 (drawn from Collaborative Group 70) consider the impact of cumulative lifetime breastfeeding of the mother on incidence of breast cancer, and are 0.96 (ever versus never breastfed: CI 0.92-0.99); 0.98 (< 6 months versus never: CI 0.95-1.01), 0.94 (7-18 months versus never: CI 0.91-0.97); and 0.89 (18+ months versus never: CI 0.84-0.94). We make the assumption that the effect on breast cancer mortality is similar to that on breast cancer incidence. The data available across countries are for breastfeeding duration of individual children, not for a woman’s lifetime experience. For LMICs we use data on the proportion of children breastfed up to 2 years and apply the 0.89 odds ratio; for high income countries where we have data on the proportion of children breastfed up to 12 months, we use this rate and apply the 0.94 odds ratio. For a few high income countries where we have only data on the proportion breastfed to 6 months, we apply the odds ratio of 0.98. This method will provide a conservative estimate of the number of breast cancer deaths averted since women on average have more than one child. Data on breast cancer mortality rates by country were drawn from Globocan 201271. Data on breastfeeding usable for this analysis were available for 153 of the 197 countries and areas of the world listed in UNICEF72, representing 97.5% of the world’s population. Of the 153 countries with breastfeeding data, no data on breast cancer were available for 5 small island states. We estimated what breast cancer mortality rates would have been in the absence of protection from breastfeeding, compared these to current breast cancer deaths, and hence calculated the number of lives saved by country, region and the global total for those countries with available data. We also estimated how many additional breast cancer deaths could be averted by a significant increase in the proportion of women breastfeeding for long durations (defined as 12 months per child in the high income countries, and 2 years per child in LMICs). Globally, an estimated 19,494 breast cancer deaths are averted annually at existing rates of breastfeeding. The low income regions with long breastfeeding durations (Africa and South Asia) account for 58% of the current estimated lives saved, despite only accounting for 36% of the global population included in this analysis. Regions which would benefit disproportionately more if breastfeeding durations were to increase include Latin America, CEE/CIS and the high income countries – regions which have both higher rates of breast cancer and also shorter durations of breastfeeding.

Webappendix Lancet Breastfeeding Series paper 1 Page 38
Table 8.1. Breastfeeding and breast cancer cases averted, by region and global total.
Region % of global population (excludes countries
missing data)
Number of breast cancer deaths
averted at current bf
rates
% of global breast cancer deaths
averted at current bf
rates
Number of breast cancer
deaths potentially averted at higher bf
rates
% of global breast cancer deaths averted
Eastern and Southern Africa
6.4 1452 7.4 813 3.7
West and Central Africa
6.3 1264 6.5 1436 6.5
MENA (Middle East and North Africa)
6.3 853 4.4 1655 7.4
South Asia 23.8 8651 44.4 1861 8.4
East Asia and Pacific
29.2 2990 15.3 6535 29.4
Latin America and Caribbean
8.7 1266 6.5 2917 13.1
CEE/CIS 5.7 417 2.1 1991 9.0
High-income countries
13.6 2602 13.4 5008 22.5
World 10.0 19494 10.0 22216 10.0
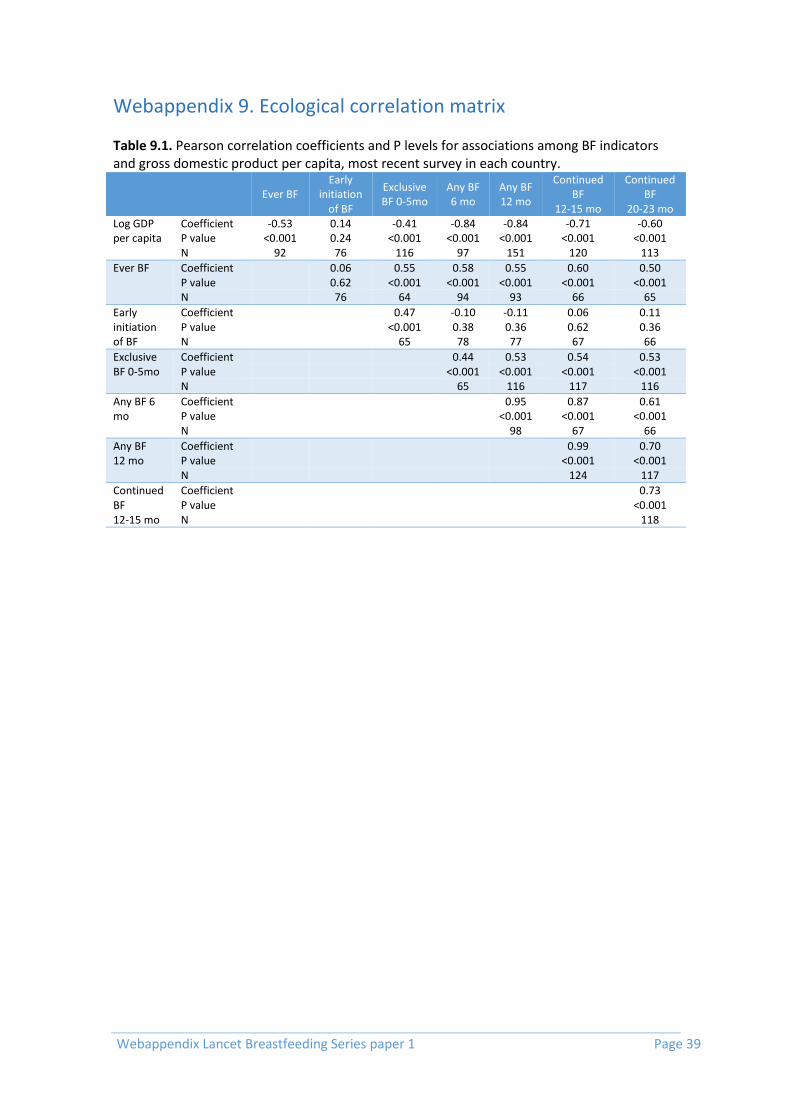
Webappendix Lancet Breastfeeding Series paper 1 Page 39
Webappendix 9. Ecological correlation matrix Table 9.1. Pearson correlation coefficients and P levels for associations among BF indicators and gross domestic product per capita, most recent survey in each country.
Ever BF
Early initiation
of BF
Exclusive BF 0-5mo
Any BF 6 mo
Any BF 12 mo
Continued BF
12-15 mo
Continued BF
20-23 mo Log GDP per capita
Coefficient -0.53 0.14 -0.41 -0.84 -0.84 -0.71 -0.60 P value <0.001 0.24 <0.001 <0.001 <0.001 <0.001 <0.001 N 92 76 116 97 151 120 113
Ever BF Coefficient
0.06 0.55 0.58 0.55 0.60 0.50 P value
0.62 <0.001 <0.001 <0.001 <0.001 <0.001
N
76 64 94 93 66 65
Early initiation of BF
Coefficient
0.47 -0.10 -0.11 0.06 0.11 P value
<0.001 0.38 0.36 0.62 0.36
N
65 78 77 67 66
Exclusive BF 0-5mo
Coefficient
0.44 0.53 0.54 0.53 P value
<0.001 <0.001 <0.001 <0.001
N
65 116 117 116
Any BF 6 mo
Coefficient
0.95 0.87 0.61 P value
<0.001 <0.001 <0.001
N
98 67 66
Any BF 12 mo
Coefficient
0.99 0.70 P value
<0.001 <0.001
N
124 117
Continued BF 12-15 mo
Coefficient
0.73 P value
<0.001
N
118

Webappendix Lancet Breastfeeding Series paper 1 Page 40
Webappendix 10. Within country inequalities in exclusive and continued breastfeeding.
Figure 10.1. Wealth related inequalities in exclusive BF 0-5 mo and continued BF 12-15 months by country income groupings. Values are mean percentages by wealth quintile in 127 LMICs.
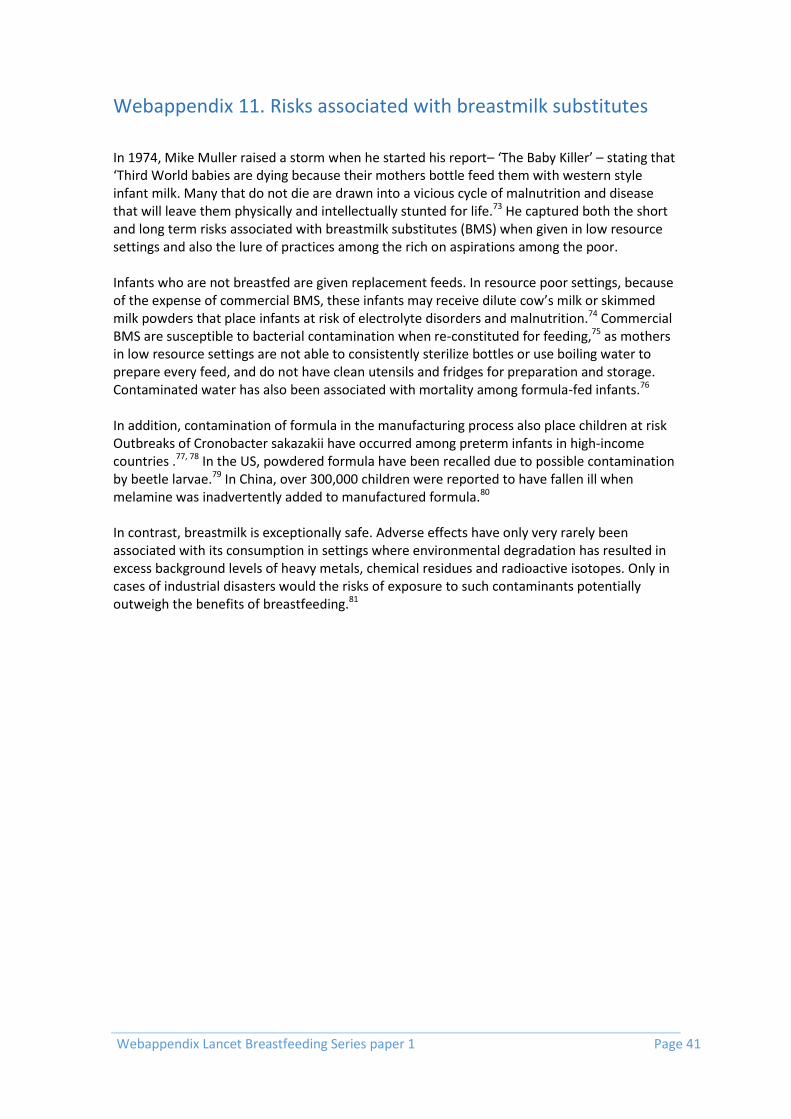
Webappendix Lancet Breastfeeding Series paper 1 Page 41
Webappendix 11. Risks associated with breastmilk substitutes
In 1974, Mike Muller raised a storm when he started his report– ‘The Baby Killer’ – stating that ‘Third World babies are dying because their mothers bottle feed them with western style infant milk. Many that do not die are drawn into a vicious cycle of malnutrition and disease that will leave them physically and intellectually stunted for life.73 He captured both the short and long term risks associated with breastmilk substitutes (BMS) when given in low resource settings and also the lure of practices among the rich on aspirations among the poor. Infants who are not breastfed are given replacement feeds. In resource poor settings, because of the expense of commercial BMS, these infants may receive dilute cow’s milk or skimmed milk powders that place infants at risk of electrolyte disorders and malnutrition.74 Commercial BMS are susceptible to bacterial contamination when re-constituted for feeding,75 as mothers in low resource settings are not able to consistently sterilize bottles or use boiling water to prepare every feed, and do not have clean utensils and fridges for preparation and storage. Contaminated water has also been associated with mortality among formula-fed infants.76 In addition, contamination of formula in the manufacturing process also place children at risk Outbreaks of Cronobacter sakazakii have occurred among preterm infants in high-income countries .77, 78 In the US, powdered formula have been recalled due to possible contamination by beetle larvae.79 In China, over 300,000 children were reported to have fallen ill when melamine was inadvertently added to manufactured formula.80 In contrast, breastmilk is exceptionally safe. Adverse effects have only very rarely been associated with its consumption in settings where environmental degradation has resulted in excess background levels of heavy metals, chemical residues and radioactive isotopes. Only in cases of industrial disasters would the risks of exposure to such contaminants potentially outweigh the benefits of breastfeeding.81

Webappendix Lancet Breastfeeding Series paper 1 Page 42
Webappendix 12. Acknowledgments
Name Affiliation / Country
Anna-Kristin Brettschneider Robert Koch-Institut / Germany
Chong-Woo Bae Kyung Hee University Hospital at Gangdong / Korea
Colin W Binns Curtin University / Australia
Dagmar Schneidrová Charles University / Czech Republic
Elena Keshishian Ministry of Health/Russia
Elena von der Lippe Robert Koch-Institut / Germany
Emla Fitzsimons British Cohort Study and the Millennium Cohort Study / UK
Heather Joshi British Cohort Study and the Millennium Cohort Study / UK
Lawrence Grummer-Strawn World Health Organization / Switzerland
Li Liu Johns Hopkins University / USA
Lida Lhotska International Baby Food Action Network/Switzerland
Naho Morisaki National Center for Child Health and Development / Japan
Rintaro Mori National Center for Child Health and Development / Japan
Robert Black Johns Hopkins University / USA
Teresita González de Cossío National Institute of Public Health / Mexico
Victor Huo China Pediatric Association / China
Vincent van Hees Newcastle University / UK

Webappendix Lancet Breastfeeding Series paper 1 Page 43
References 1. Laurence RA, Laurence RM. Breastfeeding: A Guide for the Medical Profession. 7th ed: Elsevier, 2011. 2. Committee on Nutritional Status During Pregnancy and Lactation. Nutrition during lactation. Washington, DC Institute of Medicine, National Academy of Science., 1991. 3. Stevens EE, Patrick TE, Pickler R. A History of Infant Feeding. The Journal of Perinatal Education. 2009;18(2):32-9. http://www.ncbi.nlm.nih.gov/pmc/articles/PMC2684040/. 4. Morabia A, Rubenstein B, Victora CG. Epidemiology and Public Health in 1906 England: Arthur Newsholme's Methodological Innovation to Study Breastfeeding and Fatal Diarrhea. Am J Public Health. 2013. http://www.ncbi.nlm.nih.gov/entrez/query.fcgi?cmd=Retrieve&db=PubMed&dopt=Citation&list_uids=23678939. 5. Newman G. Infant mortality: a social problem. London: Methuen, 1906. 6. World Health Organization. Contemporary patterns of breast-feeding. Report of the WHO Collaborative Study on Breast-feeding. Geneva: World Health Organization, 1981. 7. Feachem RG, Koblinsky MA. Interventions for the control of diarrhoeal diseases among young children: promotion of breast-feeding. Bulletin of the World Health Organization. 1984;62(2):271-91. 8. Labbok M, Krasovec K. Toward consistency in breastfeeding definitions. Studies in family planning. 1990:226-30. 9. Victora CG, Smith PG, Vaughan JP, Nobre LC, Lombardi C, Teixeira AM, et al. Evidence for protection by breast-feeding against infant deaths from infectious diseases in Brazil. Lancet. 1987;2(8554):319-22. http://www.ncbi.nlm.nih.gov/htbin-post/Entrez/query?db=m&form=6&dopt=r&uid=2886775. 10. Popkin BM, Adair L, Akin JS, Black R, Briscoe J, Flieger W. Breast-feeding and diarrheal morbidity. Pediatrics. 1990;86(6):874-82. 11. Brown KH, Black RE, Lopez de Romana G, Creed de Kanashiro H. Infant-feeding practices and their relationship with diarrheal and other diseases in Huascar (Lima), Peru. Pediatrics. 1989;83(1):31-40. 12. Goldberg NM, Adams E. Supplementary water for breast-fed babies in a hot and dry climate--not really a necessity. Archives of disease in childhood. 1983;58(1):73-4. 13. World Health Organization. Protecting, promoting and supporting breast-feeding: the special role of maternity services. A Joint WHO/UNICEF Statement. . Geneva: World Health Organization, 1989. 14. Innocenti Declaration, editor On the protection, promotion and support of breastfeeding. World Alliance for Breastfeeding Action WHO/UNICEF Meeting; 1990: Taylor & Francis. 15. World Health Organization. Report of the expert consultation of the optimal duration of exclusive breastfeeding, Geneva, Switzerland, 28-30 March 2001. 2001. 16. Kramer MS, Kakuma R. The optimal duration of exclusive breastfeeding. Protecting Infants through Human Milk: Springer; 2004. p. 63-77. 17. Kramer MS, Kakuma R. Optimal duration of exclusive breastfeeding. The Cochrane database of systematic reviews. 2012;8:Cd003517. 18. Agostoni C, Braegger C, Decsi T, Kolacek S, Koletzko B, Michaelsen KF, et al. Breast-feeding: A commentary by the ESPGHAN Committee on Nutrition. J Pediatr Gastroenterol Nutr. 2009;49(1):112-25. 19. Cattaneo A, Williams C, Pallas-Alonso CR, Hernandez-Aguilar MT, Lasarte-Velillas JJ, Landa-Rivera L, et al. ESPGHAN's 2008 recommendation for early introduction of complementary foods: how good is the evidence? Matern Child Nutr. 2011;7(4):335-43.
Webappendix Lancet Breastfeeding Series paper 1 Page 44
20. Fewtrell M, Wilson DC, Booth I, Lucas A. Six months of exclusive breast feeding: how good is the evidence?2011. 21. World Health Organization. Indicators for assessing infant and young child feeding practices. Part I: definition. Geneva: World Health Organization., 2008. http://www.who.int/maternal_child_adolescent/documents/9789241596664/en/. 22. World Health Organization. Indicators for assessing infant and young child feeding practices : conclusions of a consensus meeting held 6–8 November 2007 in Washington D.C., USA. Geneva: WHO Press, 2008. 23. Australian Institute of Health and Welfare. 2010 Australian National Infant Feeding Survey: Indicator results. Canberra: AIHW, 2011. 24. Schlögel R, Esberger M. Säuglingsernährung heute: Struktur- und Beratungsqualität an den Geburtenkliniken in Österreich Ernährung von Säuglingen im ersten Lebensjahr. Wien: Bundesministerium für Gesundheit, 2009. http://bmg.gv.at/cms/home/attachments/2/8/5/CH1101/CMS1384785444563/kurzfassung_saeuglingsernaehrung_heute_druckversion_08_2009.pdf (accessed January 2, 2015). 25. Gionet L. Breastfeeding trends in Canada Ottawa, Ontario: Statistics Canada, 2013. . http://www.statcan.gc.ca/pub/82-624-x/2013001/article/11879-eng.pdf (accessed January 20, 2015). 26. Atalah S E, Castillo L C, Reyes A C. Efectividad de un programa nacional de fomento de la lactancia materna en Chile 1993-2002. Archivos Latinoamericanos de Nutrición. 2004;54(4):374-79. http://www.scielo.org.ve/scielo.php?script=sci_arttext&pid=S0004-06222004000400002&nrm=iso. 27. OECD (Organisation for Economic Co-operation and Development). Breastfeeding rate, family database OECD. Paris: OECD, 2013. http://www.oecd.org/els/soc/oecdfamilydatabase.htm (accessed January 7, 2015). 28. Statens Serum Institut. Varighed af fuld amning. Copenhaguen: SSI, 2014. http://www.ssi.dk/Sundhedsdataogit/Registre%20og%20kliniske%20databaser/De%20nationale%20sundhedsregistre/Graviditet%20fodsler%20born/Bornedatabasen.aspx. 29. Uusitalo L, Nyberg H, Pelkonen M, Sarlio-Lähteenkorva S, Hakulinen-Viitanen T, Virtanen S. Imeväisikäisten ruokinta Suomessa vuonna 2010. Helsinki: THL (National Institute for Health and Welfare), 2012. http://www.thl.fi/documents/10531/95751/Raportti%202012%208.pdf (accessed January 12, 2015). 30. Institut de Veille Sanitaire. Durée de l’allaitement maternel en France (Épifane 2012-2013). Bulletin Épidémiologique Hebdomadaire. 2014;27(7):1. http://www.invs.sante.fr/beh/2014/27/2014_27_2.html. 31. von der Lippe E, Brettschneider A-K, Gutsche J, Poethko-Müller C. Einflussfaktoren auf Verbreitung und Dauer des Stillens in Deutschland: Ergebnisse der KiGGS-Studie – Erste Folgebefragung (KiGGS Welle 1). Bundesgesundheitsbl. 2014;57:849-59. 32. Institute of Child Health (Ινστιτούτο Υγείας του Παιδιού). National Study about frequency and duration of breastfeeding in Greece Athens: ICH, 2009. http://www.nsph.gr/files/011_Ygeias_Paidiou/Ereunes/Ekthesi_Ethnikhs_Meleths_Thilasmou.pdf (accessed December 17, 2014). . 33. Italian National Institute of Statistics. Pregnancy, childbirth and breastfeeding in Italy. Roma: ISTAT, 2013. http://www.istat.it/en/archive/141520. 34. Statistics Netherlands. Statistical Yearbook of the Netherlands. Voorburg: CBS, 2009. http://www.cbs.nl/en-GB/menu/publicaties/boeken/statistisch-jaarboek/archief/2014/statistical-yearbook-of-the-netherlands-2014-pub.htm (accessed December 10, 2014). 35. New Zealand Ministry of Health, National Breastfeeding Advisory Committee. Protecting, Promoting and Supporting Breastfeeding in New Zealand: A review of the context of breastfeeding in New Zealand, and of the evidence for successful interventions supporting

Webappendix Lancet Breastfeeding Series paper 1 Page 45
breastfeeding. Wellington: NZ, 2014. http://www.health.govt.nz/publication/national-strategic-plan-action-breastfeeding-2008-2012 (accessed January 7, 2015). . 36. Norway Helsedirektoratet, Statistisk sentralbyrå (SSB). Amming og spedbarns kosthold: Landsomfattende undersøkelse 2013. Oslo: Helsedirektoratet, 2014. https://helsedirektoratet.no/Lists/Publikasjoner/Attachments/273/Amming-og-spedbarns-kosthold-landsomfattende-undersokelse-2013-IS-2239.pdf (accessed January 11, 2015). 37. UNICEF (United Nations Children's Fund). Improving child nutrition: the achievable imperative for global progress. New York: Unicef, 2013. http://www.unicef.org/gambia/Improving_Child_Nutrition_-_the_achievable_imperative_for_global_progress.pdf (accessed December 2, 2014). . 38. Chung SH, Kim HR, Choi YS, Bae CW. Trends of breastfeeding rate in Korea (1994-2012): comparison with OECD and other countries. J Korean Med Sci. 2013;28(11):1573-80. http://www.ncbi.nlm.nih.gov/pubmed/24265518. 39. El Mouzan MI, Al Omar AA, Al Salloum AA, Al Herbish AS, Qurachi MM. Trends in infant nutrition in Saudi Arabia: compliance with WHO recommendations. Annals of Saudi medicine. 2009;29(1):20-3. http://www.ncbi.nlm.nih.gov/pmc/articles/PMC2813620/?report=printable. 40. Singapore Goverment, Health Promotion Board. National Breastfeeding Survey 2001 & 2011. Singapure: HPB, 2014. http://data.gov.sg/Metadata/SGMatadata.aspx?id=0416080000000013925O&mid=111170&t=TEXTUAL (accessed January 12, 2015). 41. Gobierno de España, Ministerio de Sanidad, Servicios Sociales e Igualdad. Encuesta Nacional de Salud de España 2011/12. Madrid: MS, 2013. https://www.msssi.gob.es/estadEstudios/estadisticas/encuestaNacional/encuesta2011.htm (accessed February 27, 2015). 42. Official Statistics of Sweden, Statistics Health and Medical Care. Breast-feeding and smoking habits among parents of infants born in 2010. Stockholm: OSS, 2012. http://www.socialstyrelsen.se/Lists/Artikelkatalog/Attachments/18809/ (accessed September 30, 2014). 43. Merten S, Dratva J, Ackermann-Liebrich U. Do baby-friendly hospitals influence breastfeeding duration on a national level? Pediatrics. 2005;116(5):e702-8. http://www.ncbi.nlm.nih.gov/pubmed/16263985. 44. McAndrew F, Thompson J, Fellows L, Large A, Speed M, Renfrew MJ. Infant Feeding Survey 2010. Leeds: The Health and Social Care Information Centre, 2012. http://www.hscic.gov.uk/catalogue/PUB08694 (accessed December 18, 2014). 45. CDC (Centers for Disease Control and Prevention). Breastfeeding among U.S. children born 2001–2011, CDC National Immunization Survey. Atlanta, GA: CDC, 2014. http://www.cdc.gov/breastfeeding/ (accessed September 16, 2014). 46. Ministerio de Salud Pública (MSP), Ministerio de Desarrollo Social (MIDES), RUANDI (Red Uruguaya de Apoyo a la Nutrición y Desarrollo Infantil), UNICEF (United Nations Children's Fund). Encuesta nacional sobre estado nutricional, prácticas de alimentación y anemia: en niños menores de dos años, usuarios de servicios de salud de los subsectores público y privado del Uruguay. Montevideo: RUANDI, 2011. http://www.socialstyrelsen.se/Lists/Artikelkatalog/Attachments/18809/ (accessed September 30, 2014). 47. The Lancet. Child Survival 2015 [cited 2015 March 23]. Available from: http://www.thelancet.com/series/child-survival. 48. Jones G, Steketee RW, Black RE, Bhutta ZA, Morris SS, Bellagio Child Survival Study G. How many child deaths can we prevent this year? Lancet. 2003;362(9377):65-71. http://www.ncbi.nlm.nih.gov/pubmed/12853204. 49. Darmstadt GL, Bhutta ZA, Cousens S, Adam T, Walker N, de Bernis L, et al. Evidence-based, cost-effective interventions: how many newborn babies can we save? Lancet. 2005;365(9463):977-88. http://www.ncbi.nlm.nih.gov/pubmed/15767001.

Webappendix Lancet Breastfeeding Series paper 1 Page 46
50. Darmstadt GL, Walker N, Lawn JE, Bhutta ZA, Haws RA, Cousens S. Saving newborn lives in Asia and Africa: cost and impact of phased scale-up of interventions within the continuum of care. Health policy and planning. 2008;23(2):101-17. http://www.ncbi.nlm.nih.gov/pubmed/18267961. 51. Bhutta ZA, Ahmed T, Black RE, Cousens S, Dewey K, Giugliani E, et al. What works? Interventions for maternal and child undernutrition and survival. Lancet. 2008;371(9610):417-40. http://www.ncbi.nlm.nih.gov/pubmed/18206226. 52. Stover J, McKinnon R, Winfrey B. Spectrum: a model platform for linking maternal and child survival interventions with AIDS, family planning and demographic projections. International journal of epidemiology. 2010;39 Suppl 1:i7-10. http://www.ncbi.nlm.nih.gov/pubmed/20348129. 53. Pattinson R, Kerber K, Buchmann E, Friberg IK, Belizan M, Lansky S, et al. Stillbirths: how can health systems deliver for mothers and babies? Lancet. 2011;377(9777):1610-23. http://www.ncbi.nlm.nih.gov/pubmed/21496910. 54. Bhutta Z, Das J, Walker N, Rizvi A, Campbell H, Rudan I, et al. Interventions to address diarrhoea and pneumonia deaths equitably: what works and at what cost? The Lancet. in press. 55. Garnett GP, Cousens S, Hallett TB, Steketee R, Walker N. Mathematical models in the evaluation of health programmes. Lancet. 2011;378(9790):515-25. http://www.ncbi.nlm.nih.gov/pubmed/21481448. 56. UNAIDS. The UNAIDS Reference Group on Estimates, Modelling and Projections, 2015 [cited 2015 March 23]. Available from: http://www.epidem.org/. 57. UNAIDS. UNAIDS Report on the Global AIDS epidemic - 2012. Geneva The Joint United Nations Programme on HIV/AIDS, 2012. 58. Walker N, Fischer-Walker C, Bryce J, Bahl R, Cousens S, Effects CRGoI. Standards for CHERG reviews of intervention effects on child survival. International journal of epidemiology. 2010;39 Suppl 1:i21-31. http://www.ncbi.nlm.nih.gov/pubmed/20348122. 59. Steinglass R, Cherian T, Vandelaer J, Klemm RD, Sequeira J. Development and use of the Lives Saved Tool (LiST): a model to estimate the impact of scaling up proven interventions on maternal, neonatal and child mortality. International journal of epidemiology. 2011;40(2):519-20. http://www.ncbi.nlm.nih.gov/pubmed/21036879. 60. Fox MJ, Martorell R, Broek Nvd, Walker N. Technical inputs, enhancements and applications of the Lives Saved Tool (LiST): BMC Public Health; 2011 [cited 2015 March 23]. Available from: http://www.biomedcentral.com/bmcpublichealth/supplements/11/S3. 61. Walker N. The Lives Saved Tool in 2013: new capabilities and applications: BMC Public Health; 2013 [cited 2015 March 23]. Available from: http://www.biomedcentral.com/bmcpublichealth/supplements/13/S3. 62. Friberg IK, Bhutta ZA, Darmstadt GL, Bang A, Cousens S, Baqui AH, et al. Comparing modelled predictions of neonatal mortality impacts using LiST with observed results of community-based intervention trials in South Asia. International journal of epidemiology. 2010;39 Suppl 1:i11-20. http://www.ncbi.nlm.nih.gov/pubmed/20348113. 63. Larsen DA, Friberg IK, Eisele TP. Comparison of Lives Saved Tool model child mortality estimates against measured data from vector control studies in sub-Saharan Africa. BMC Public Health. 2011;11(Suppl 3):S34. 64. Ricca J, Prosnitz D, Perry H, Edward A, Morrow M, Ernst P, et al. Comparing estimates of child mortality reduction modelled in LiST with pregnancy history survey data for a community-based NGO project in Mozambique. BMC Public Health. 2011;11 Suppl 3:S35. http://www.ncbi.nlm.nih.gov/pubmed/21501454. 65. The UN Inter-agency Group for Child Mortality Estimation. Child Mortality Estimates 2015 [cited 2015 March 23]. Available from: http://www.childmortality.org/. 66. Liu L, Oza S, Hogan D, Perin J, Rudan I, Lawn JE, et al. Global, regional, and national causes of child mortality in 2000-13, with projections to inform post-2015 priorities: an

Webappendix Lancet Breastfeeding Series paper 1 Page 47
updated systematic analysis. Lancet. 2015;385(9966):430-40. http://www.ncbi.nlm.nih.gov/pubmed/25280870. 67. Sankar J et al. Systematic review of breastfeeding and child mortality. Acta Paediatrica. in press. 68. Bartick MC, Stuebe AM, Schwarz EB, Luongo C, Reinhold AG, Foster EM. Cost analysis of maternal disease associated with suboptimal breastfeeding. Obstetrics and gynecology. 2013;122(1):111-9. 69. Renfrew MJ, McCormick FM, Wade A, Quinn B, Dowswell T. Support for healthy breastfeeding mothers with healthy term babies. The Cochrane database of systematic reviews. 2012;5:CD001141. 70. Collaborative Group on Hormonal Factors in Breast Cancer. Breast cancer and breastfeeding: collaborative reanalysis of individual data from 47 epidemiological studies in 30 countries, including 50302 women with breast cancer and 96973 women without the disease. Lancet. 2002;360(9328):187-95. 71. IARC (International Agency for Research on Cancer). Globocan 2012: estimated cancer incidence, mortality and prevalence worldwide in 2012 2012 [cited 2014 Sep 26]. Available from: http://globocan.iarc.fr/Pages/online.aspx (accessed September, 2014). 72. UNICEF (United Nations Children's Fund). State of the World’s Children. New York: UNICEF, 2012. 73. Muller M. The baby killer: a War on Want investigation into the promotion and sale of powdered baby milks in the Third World. http://www.waronwant.org/past-campaigns/baby-milk (last accessed 10 March 2015) London: War on Want; 1974. Available from: http://www.waronwant.org/past-campaigns/baby-milk (accessed March, 10 2015). 74. Bruce RC, Kliegman RM. Hyponatremic seizures secondary to oral water intoxication in infancy: association with commercial bottled drinking water. Pediatrics. 1997;100(6):E4. http://www.ncbi.nlm.nih.gov/pubmed/9374582. 75. Andresen E, Rollins NC, Sturm AW, Conana N, Greiner T. Bacterial contamination and over-dilution of commercial infant formula prepared by HIV-infected mothers in a Prevention of Mother-to-Child Transmission (PMTCT) Programme, South Africa. Journal of tropical pediatrics. 2007;53(6):409-14. http://www.ncbi.nlm.nih.gov/pubmed/18063653. 76. Creek TL, Kim A, Lu L, Bowen A, Masunge J, Arvelo W, et al. Hospitalization and mortality among primarily nonbreastfed children during a large outbreak of diarrhea and malnutrition in Botswana, 2006. Journal of acquired immune deficiency syndromes. 2010;53(1):14-9. http://www.ncbi.nlm.nih.gov/pubmed/19801943. 77. Centers for Disease Control Prevention. Enterobacter sakazakii infections associated with the use of powdered infant formula: Tennessee, 2001. MMWR Morbidity and mortality weekly report. 2002;51(14):297-300. http://www.ncbi.nlm.nih.gov/pubmed/12002167. 78. Centers for Disease Control Prevention. Cronobacter species isolation in two infants - New Mexico, 2008. MMWR Morbidity and mortality weekly report. 2009;58(42):1179-83. http://www.ncbi.nlm.nih.gov/pubmed/19875980. 79. U.S. Department of Health and Human Services, U.S. Food and Drug Administration (FDA). Abbott Voluntarily Recalls Certain Similac® Brand Powder Infant Formulas That Did Not Meet Its Quality Standards Silver Spring, MD FDA; 2013. Available from: http://www.fda.gov/Safety/Recalls/ucm226885.htm (accessed March 10, 2015). 80. New York Times. Melamine: China Tainted Baby Formula Scandal New York: NYT; 2015. Available from: http://topics.nytimes.com/top/reference/timestopics/subjects/m/melamine/index.html (accessed March 10, 2015). 81. Cattaneo A. Infant and Young Child Feeding and Chemical Residues. Geneva: International Baby Food Action Network (IBFAN). ; 2013.


![[Maternity protection book series] 4-3. Breastfeeding](https://img.dokumen.tips/doc/110x75/568bd9bd1a28ab2034a82fd8/maternity-protection-book-series-4-3-breastfeeding.jpg)