Embed Size (px)
Citation preview
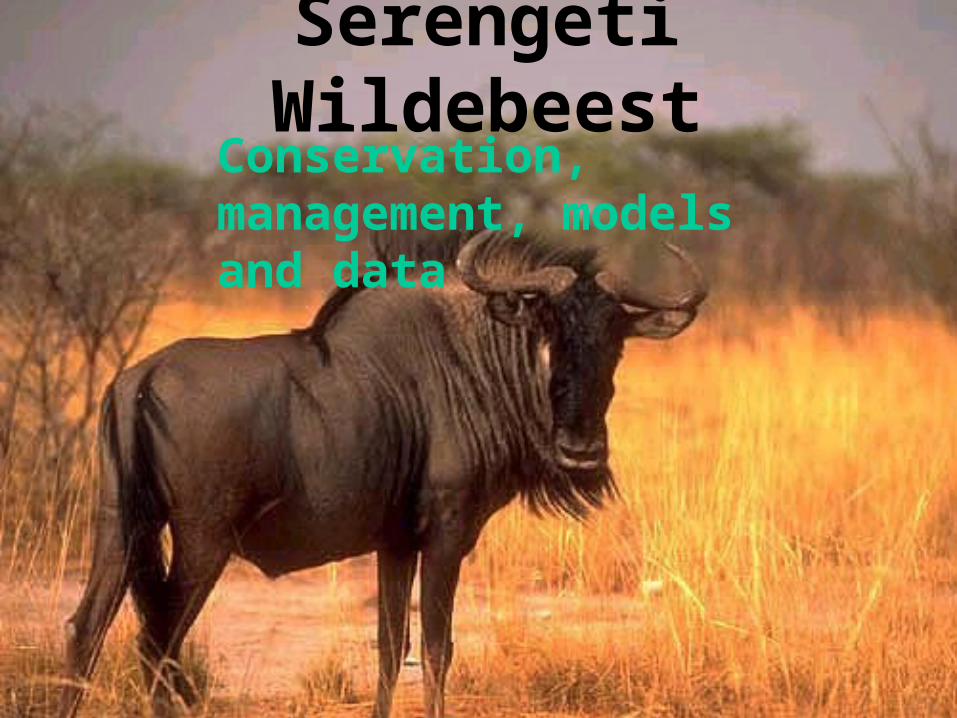
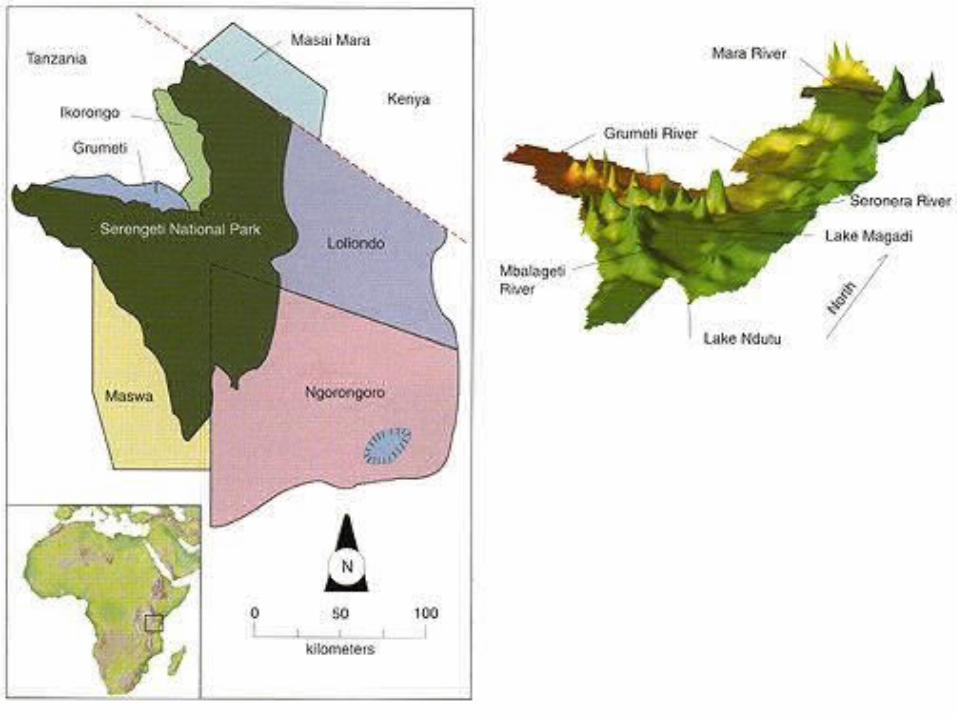
Serengeti WildebeestConservation, management, models and data

Introduction to ecosystem
• World Heritage Site #1
• Home to the largest migratory mammal populations in the world, the highest mammalian biodiversity, and equal diversity among birds
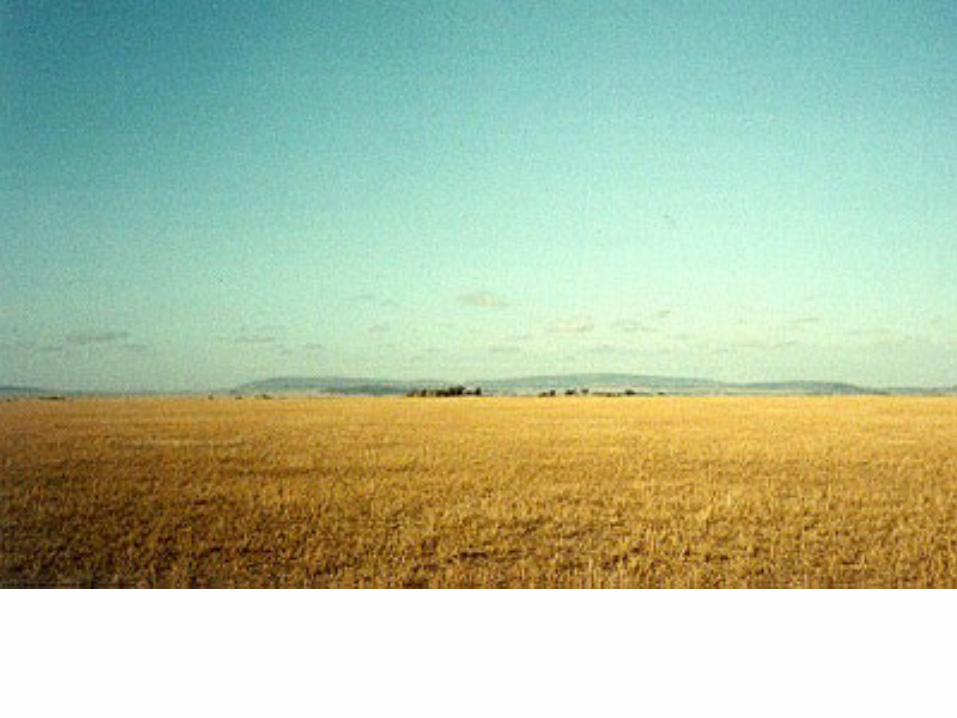
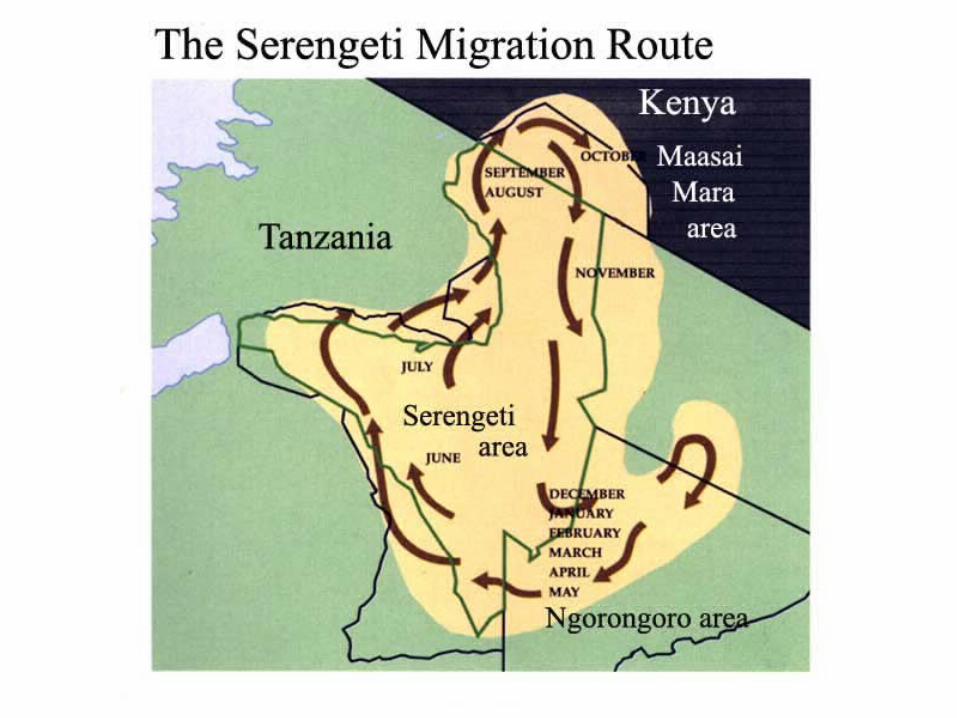
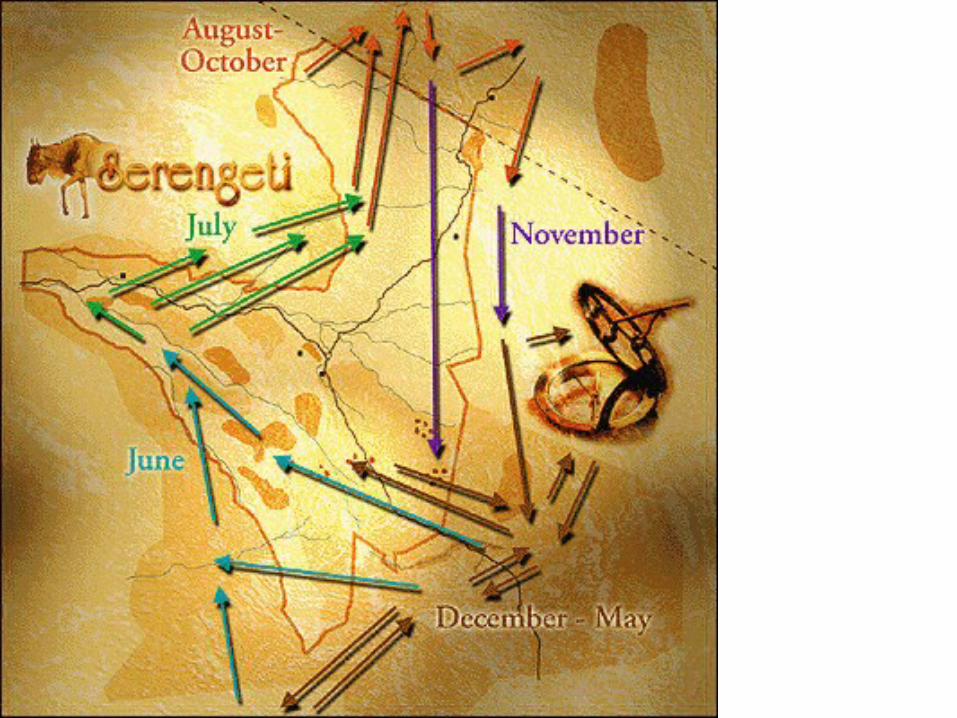
• The regions - rainfall


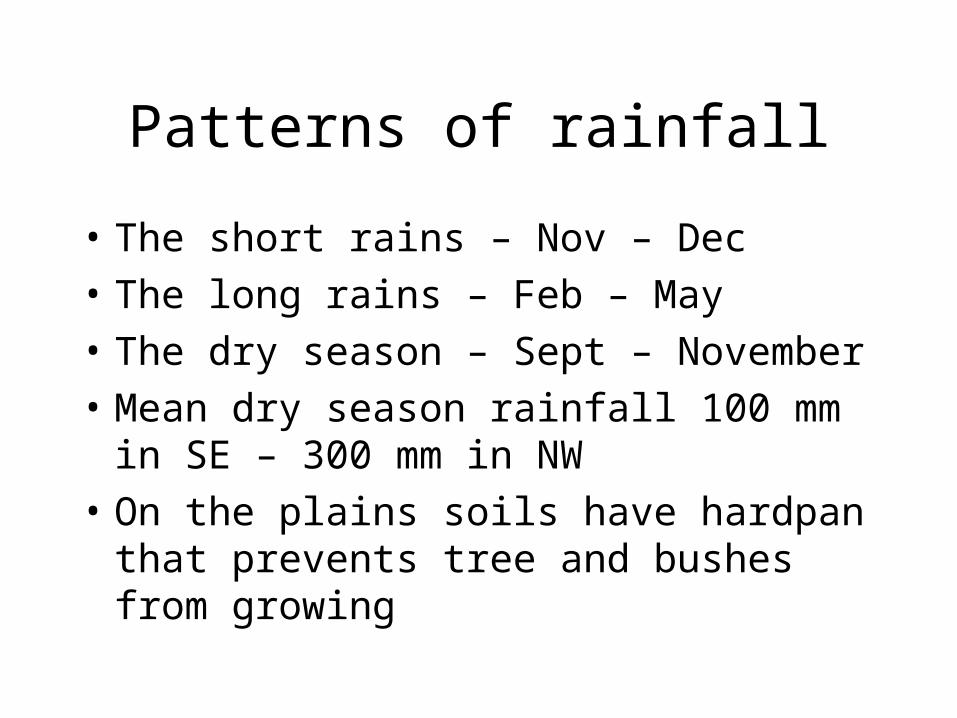
Patterns of rainfall
• The short rains – Nov – Dec
• The long rains – Feb – May
• The dry season – Sept – November
• Mean dry season rainfall 100 mm in SE – 300 mm in NW
• On the plains soils have hardpan that prevents tree and bushes from growing
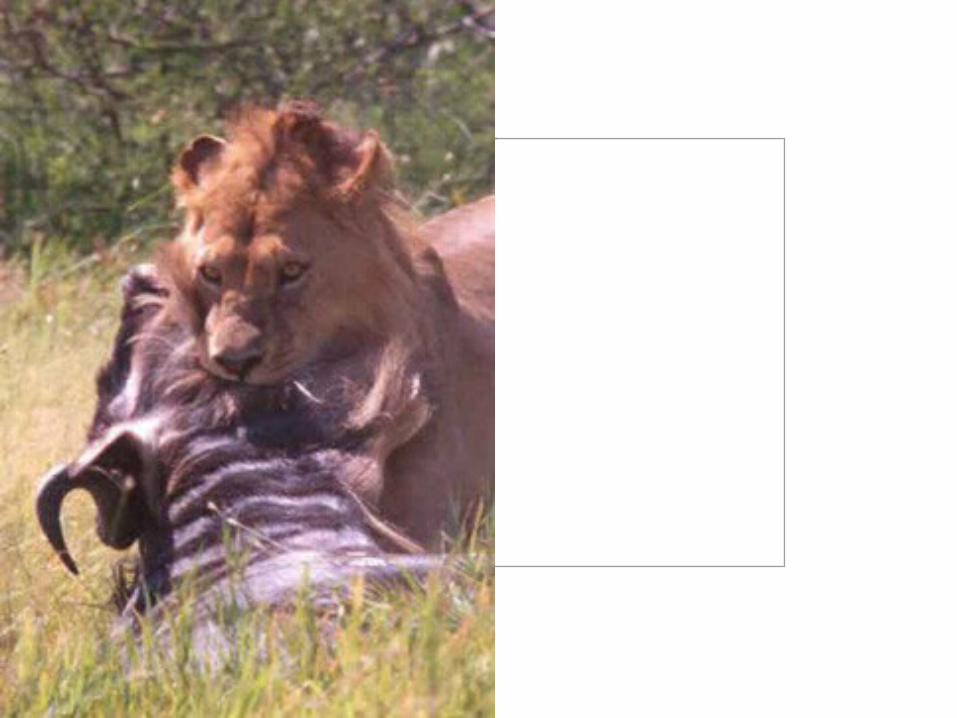

Wildebeest life history
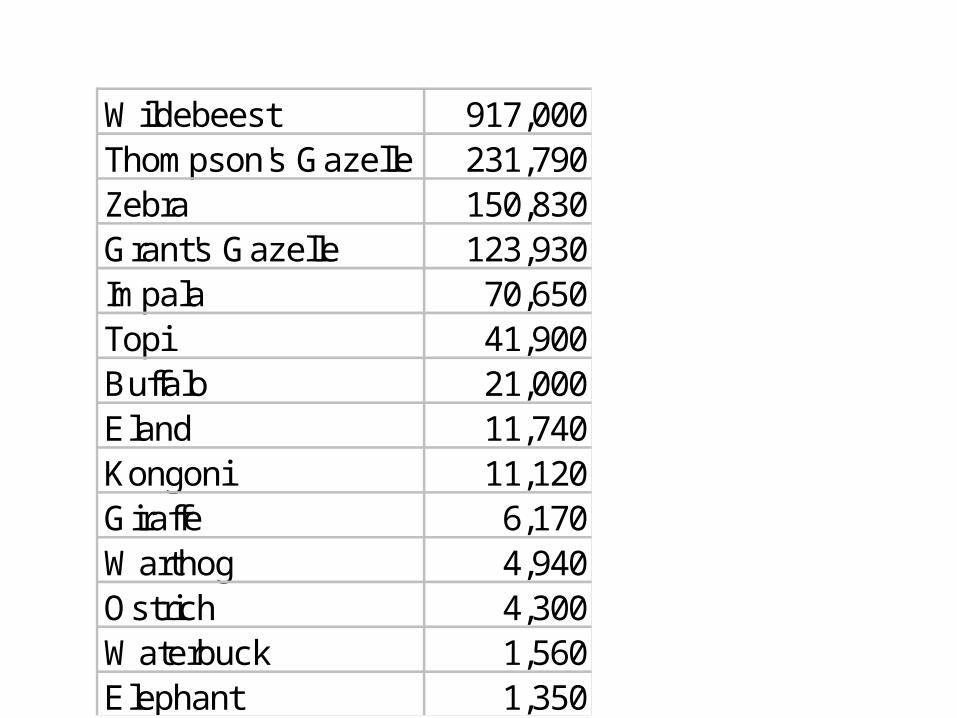
Wildebeest 917,000Thompson's Gazelle 231,790Zebra 150,830Grant's Gazelle 123,930Impala 70,650Topi 41,900Buffalo 21,000Eland 11,740Kongoni 11,120Giraffe 6,170Warthog 4,940Ostrich 4,300Waterbuck 1,560Elephant 1,350
Types of data
• Census
• Rainfall
• Mortality
• Grass production
What do do with limited data
• 1977 situation– Wildebeest– Wildebeest and predators

Population and rainfall data
0
200
400
600
800
1000
1200
1400
1600
1960
1963
1966
1969
1972
1975
1978
1981
1984
1987
History of wildebeest
• Rinderpest
• Rains 1977 situation
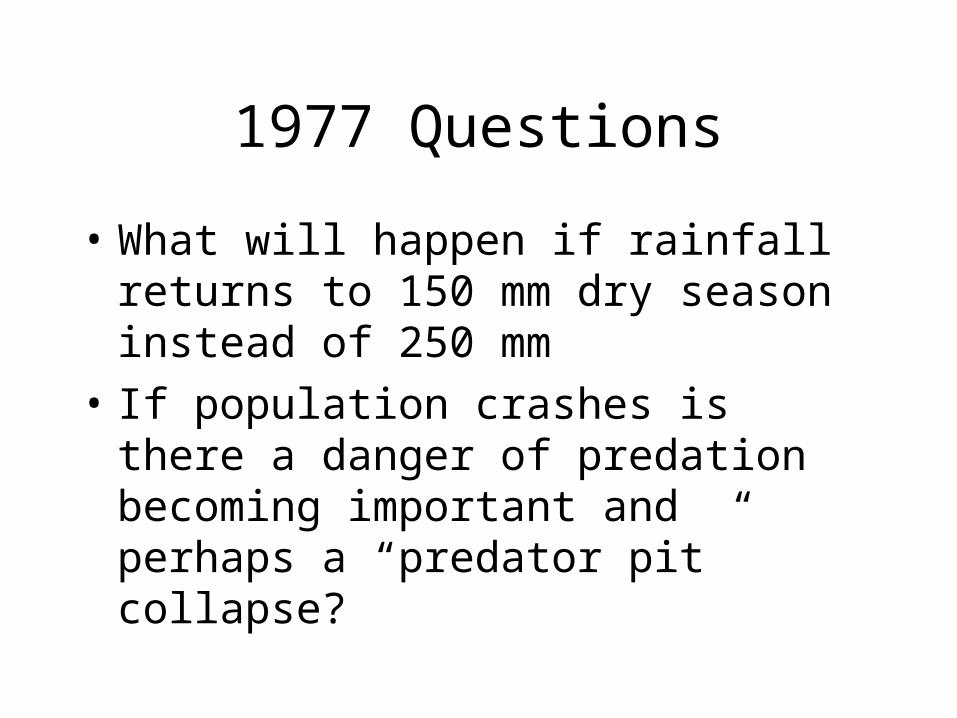
1977 Questions
• What will happen if rainfall returns to 150 mm dry season instead of 250 mm
• If population crashes is there a danger of predation becoming important and perhaps a “predator pit” collapse?
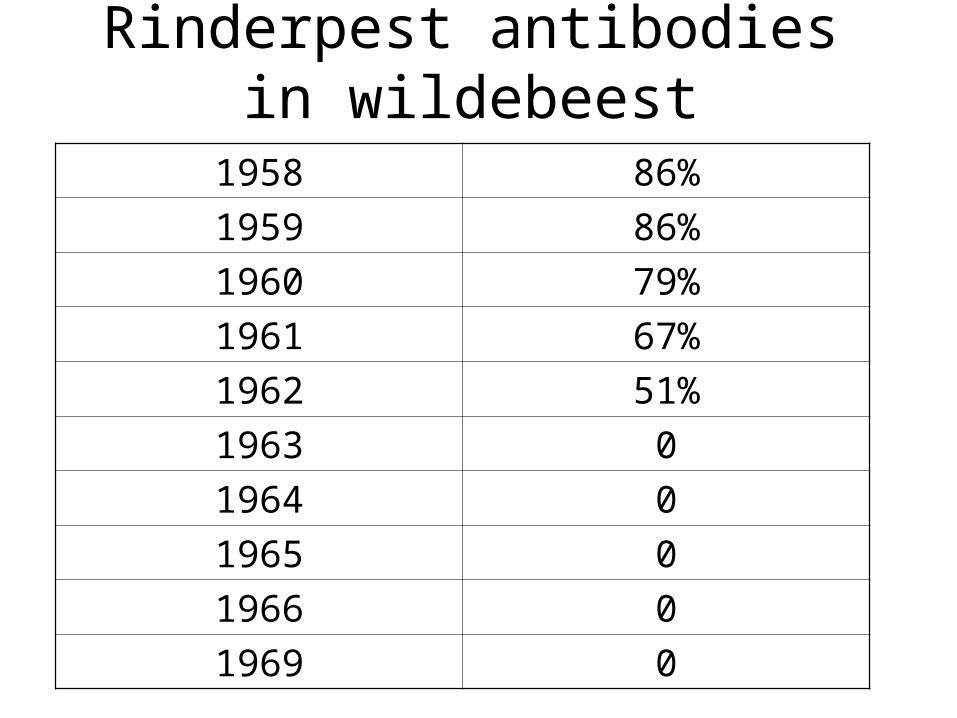
Rinderpest antibodies in wildebeest
1958 86%
1959 86%
1960 79%
1961 67%
1962 51%
1963 0
1964 0
1965 0
1966 0
1969 0
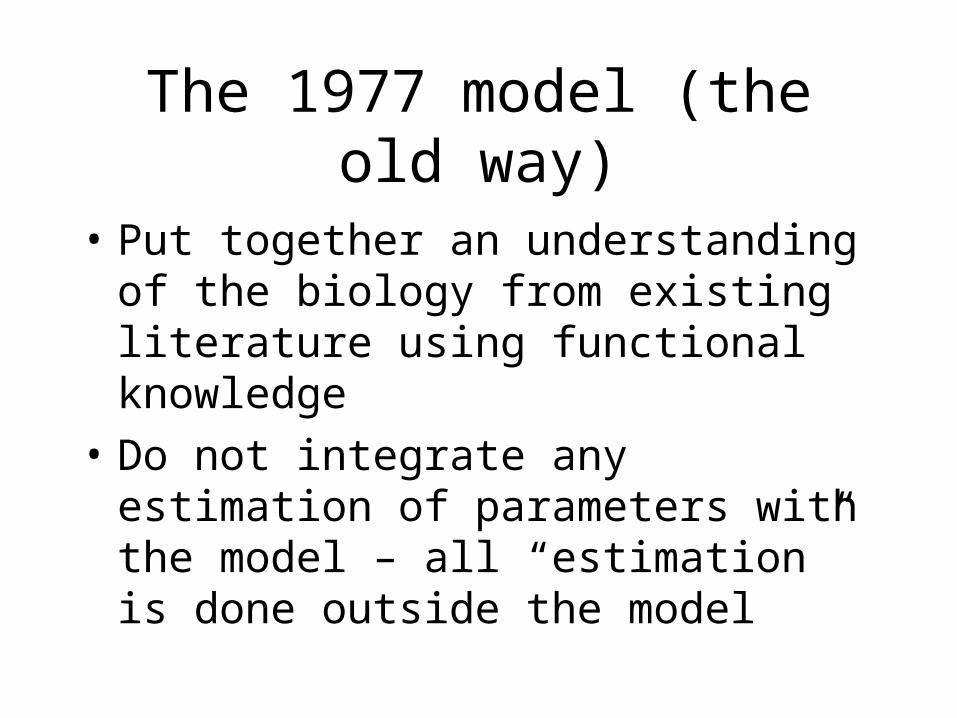
The 1977 model (the old way)
• Put together an understanding of the biology from existing literature using functional knowledge
• Do not integrate any estimation of parameters with the model – all “estimation” is done outside the model
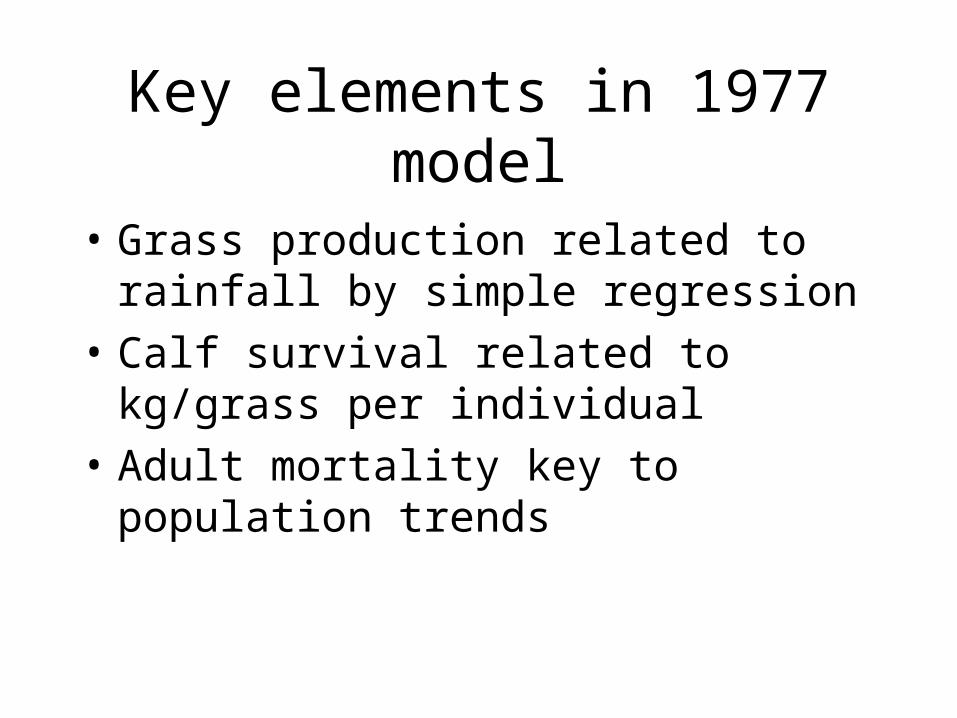
Key elements in 1977 model
• Grass production related to rainfall by simple regression
• Calf survival related to kg/grass per individual
• Adult mortality key to population trends
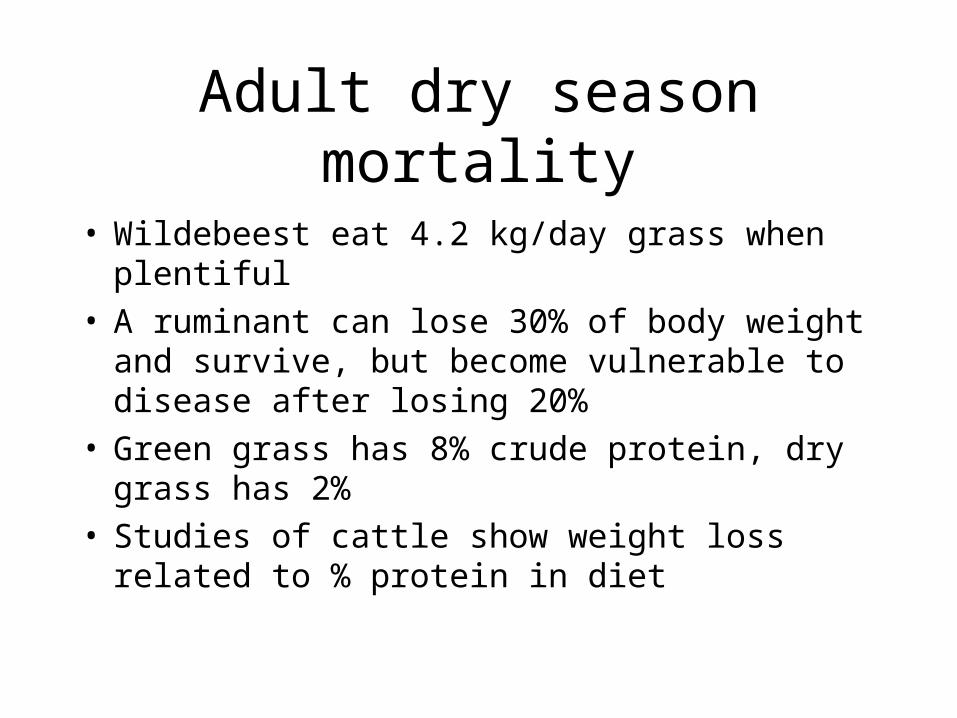
Adult dry season mortality
• Wildebeest eat 4.2 kg/day grass when plentiful• A ruminant can lose 30% of body weight and
survive, but become vulnerable to disease after losing 20%
• Green grass has 8% crude protein, dry grass has 2%
• Studies of cattle show weight loss related to % protein in diet
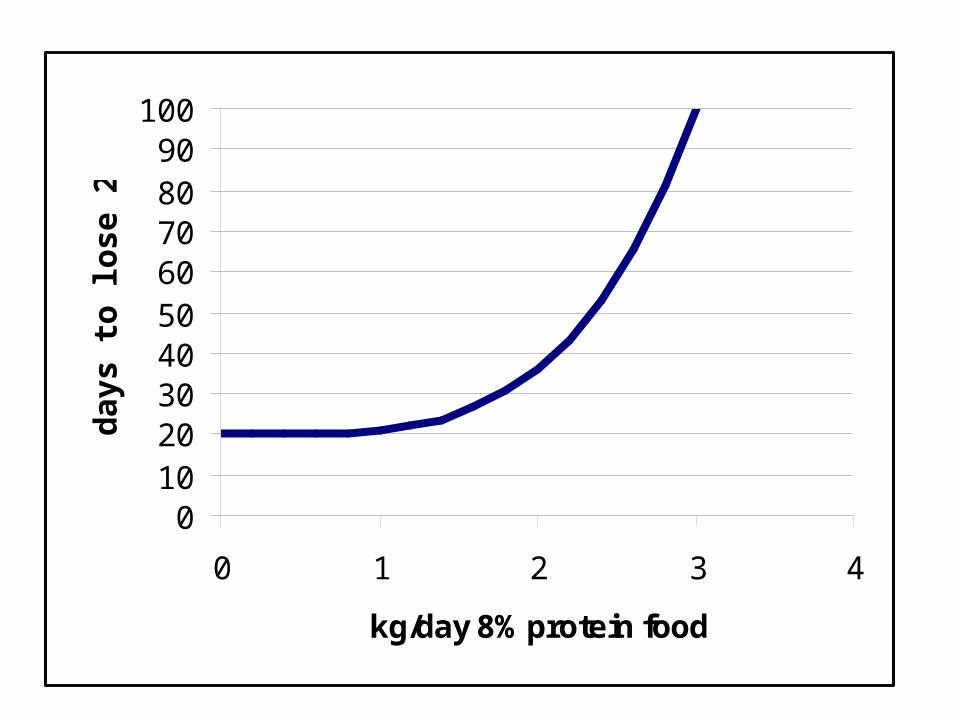
0102030405060708090
100
0 1 2 3 4
kg/day 8% protein food
da
ys
to
los
e 2
0%
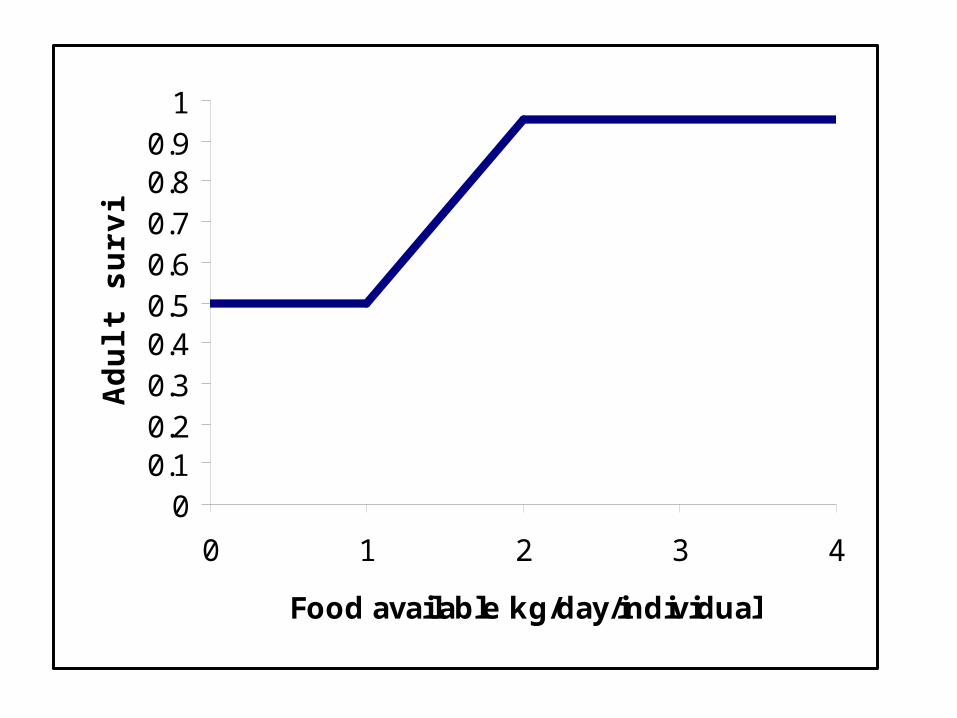
00.10.20.30.40.50.60.70.80.9
1
0 1 2 3 4
Food available kg/day/individual
Ad
ult
su
rviv
al
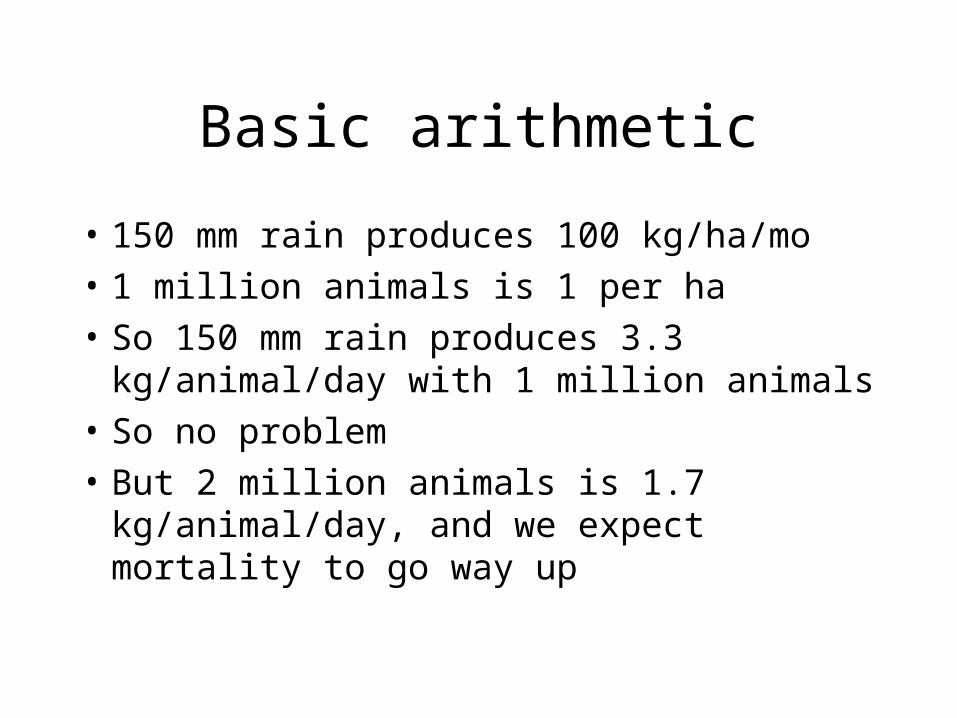
Basic arithmetic
• 150 mm rain produces 100 kg/ha/mo
• 1 million animals is 1 per ha
• So 150 mm rain produces 3.3 kg/animal/day with 1 million animals
• So no problem
• But 2 million animals is 1.7 kg/animal/day, and we expect mortality to go way up
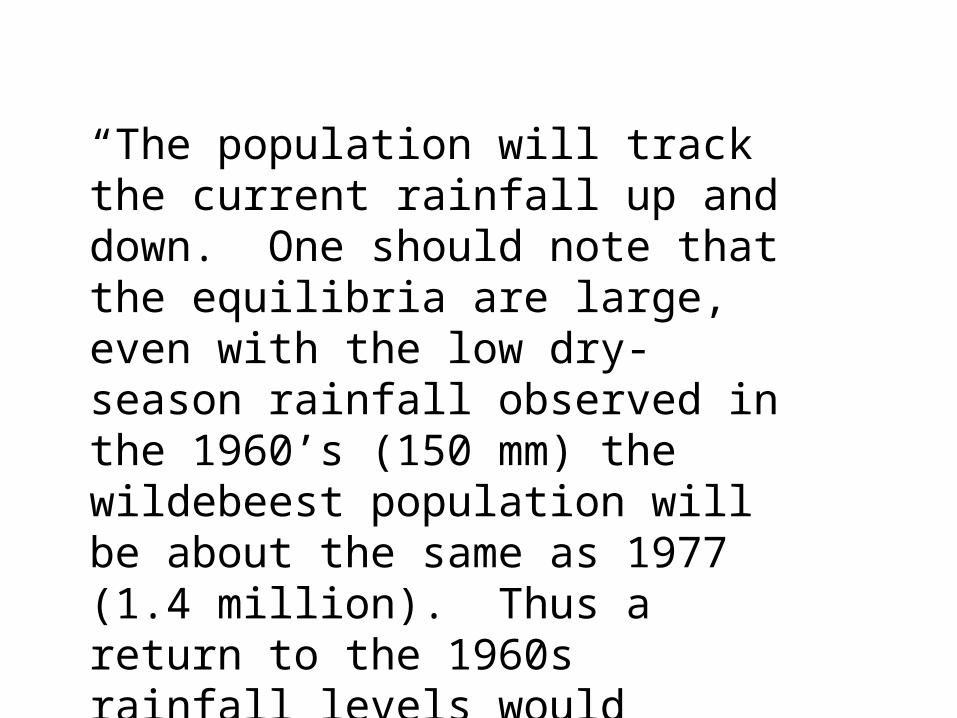
“The population will track the current rainfall up and down. One should note that the equilibria are large, even with the low dry-season rainfall observed in the 1960’s (150 mm) the wildebeest population will be about the same as 1977 (1.4 million). Thus a return to the 1960s rainfall levels would possibly not lead to a catastrophic decline at 1977 levels.”
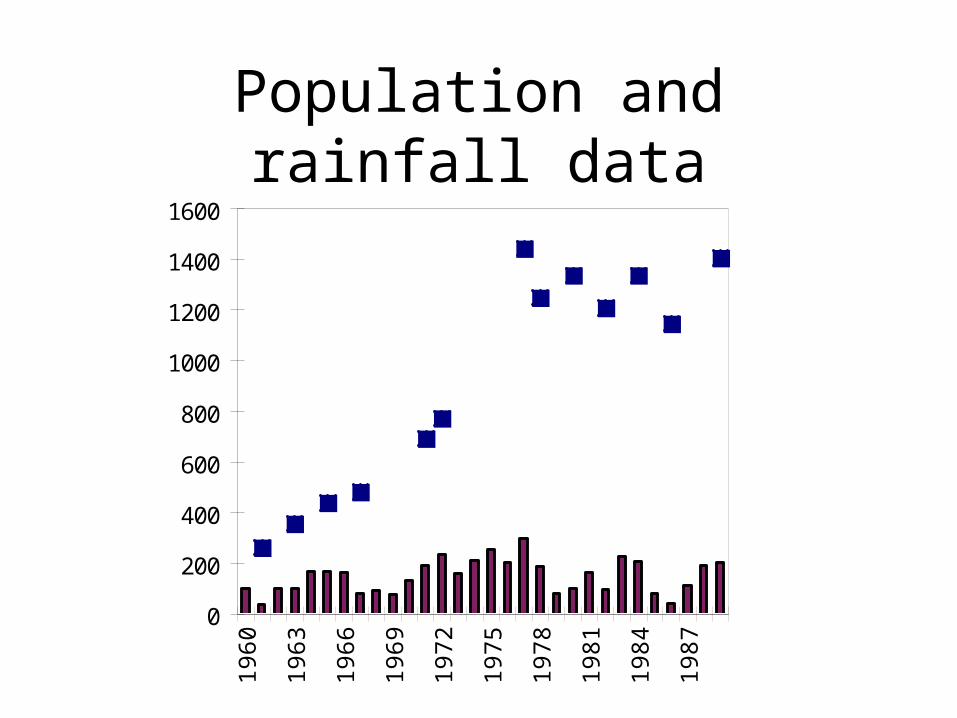
Population and rainfall data
0
200
400
600
800
1000
1200
1400
1600
1960
1963
1966
1969
1972
1975
1978
1981
1984
1987
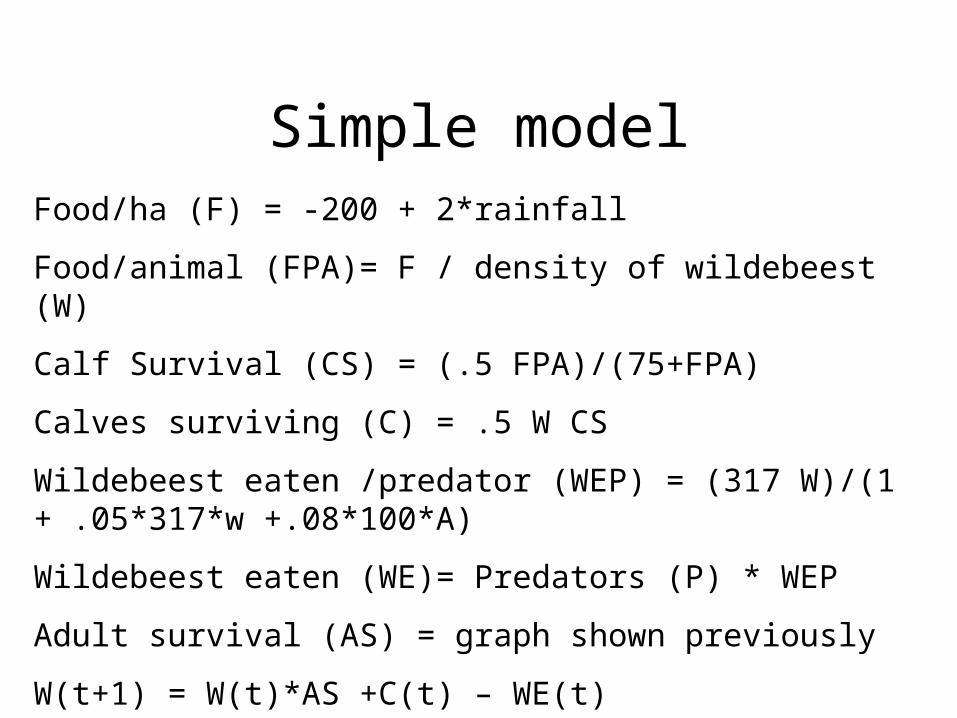
Simple modelFood/ha (F) = -200 + 2*rainfall
Food/animal (FPA)= F / density of wildebeest (W)
Calf Survival (CS) = (.5 FPA)/(75+FPA)
Calves surviving (C) = .5 W CS
Wildebeest eaten /predator (WEP) = (317 W)/(1 + .05*317*w +.08*100*A)
Wildebeest eaten (WE)= Predators (P) * WEP
Adult survival (AS) = graph shown previously
W(t+1) = W(t)*AS +C(t) – WE(t)
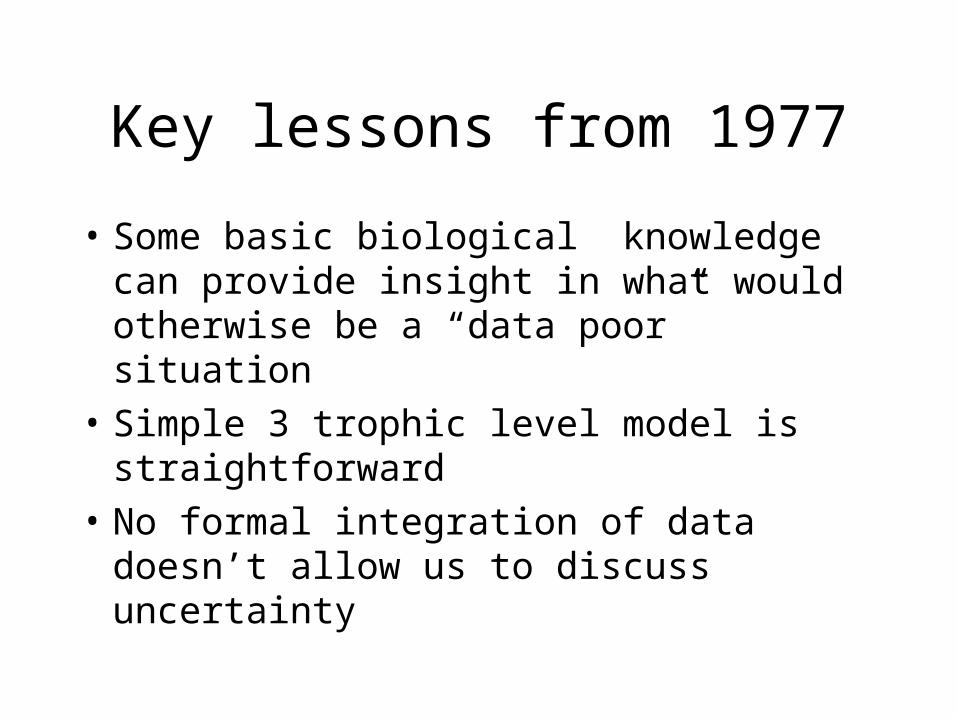
Key lessons from 1977
• Some basic biological knowledge can provide insight in what would otherwise be a “data poor” situation
• Simple 3 trophic level model is straightforward
• No formal integration of data doesn’t allow us to discuss uncertainty
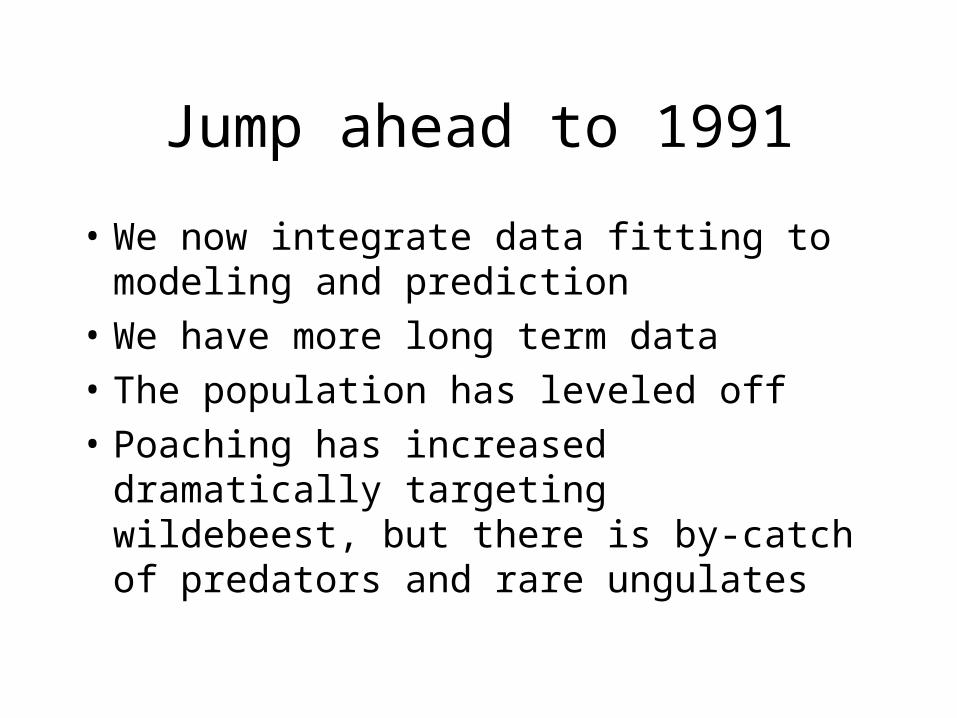
Jump ahead to 1991
• We now integrate data fitting to modeling and prediction
• We have more long term data
• The population has leveled off
• Poaching has increased dramatically targeting wildebeest, but there is by-catch of predators and rare ungulates
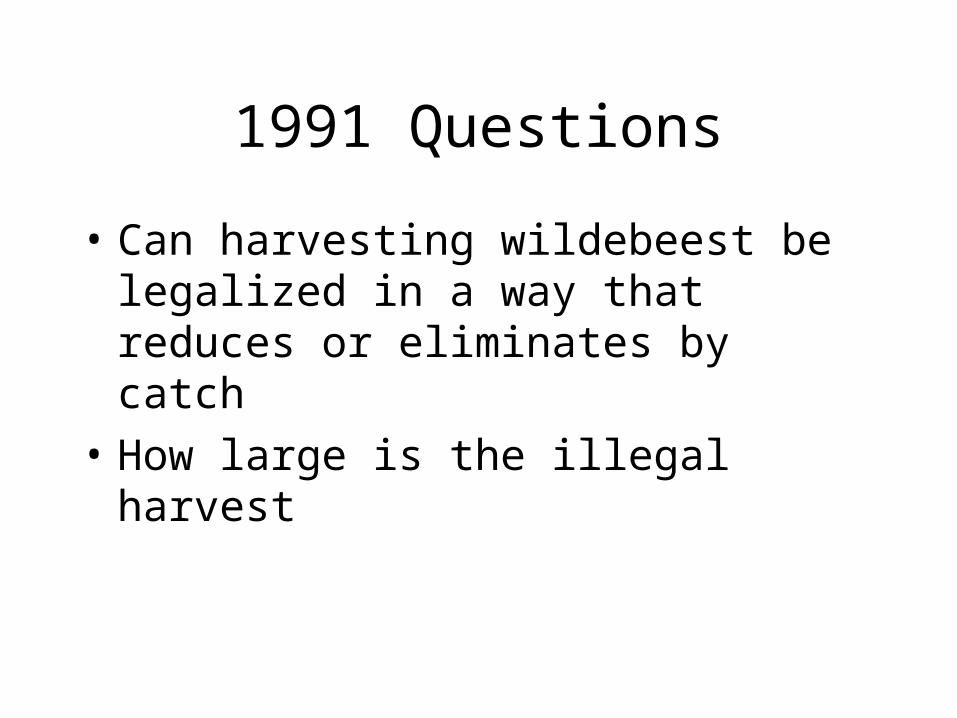
1991 Questions
• Can harvesting wildebeest be legalized in a way that reduces or eliminates by catch
• How large is the illegal harvest
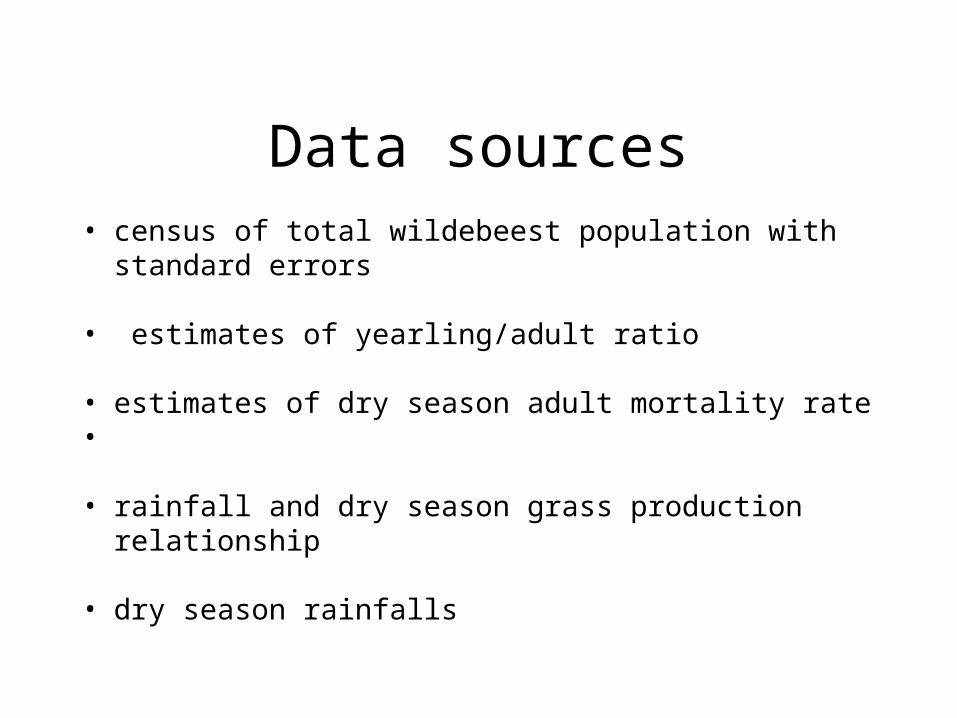
Data sources• census of total wildebeest population with standard errors
• estimates of yearling/adult ratio
• estimates of dry season adult mortality rate•
pregnancy rates
• rainfall and dry season grass production relationship
• dry season rainfalls
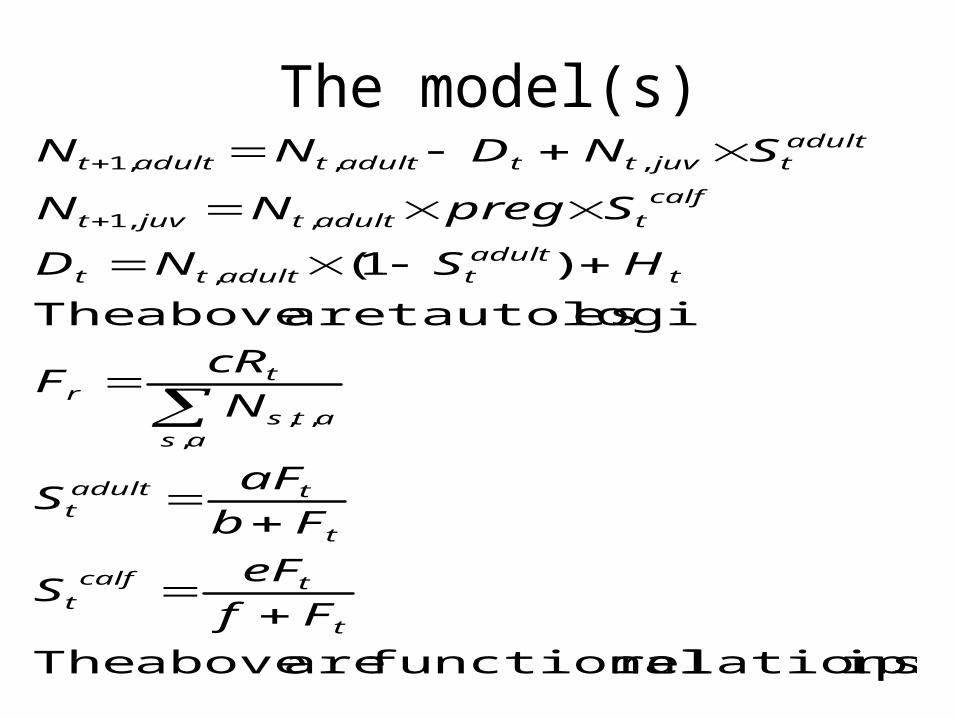
The model(s)
ipsrelationsh functional are above The
es tautologiare above The
)1(
,,,
,
,,1
,,,1
t
tcalft
t
tadultt
asats
tr
tadulttadulttt
calftadulttjuvt
adulttjuvttadulttadultt
Ff
eFS
Fb
aFS
N
cRF
HSND
SpregNN
SNDNN
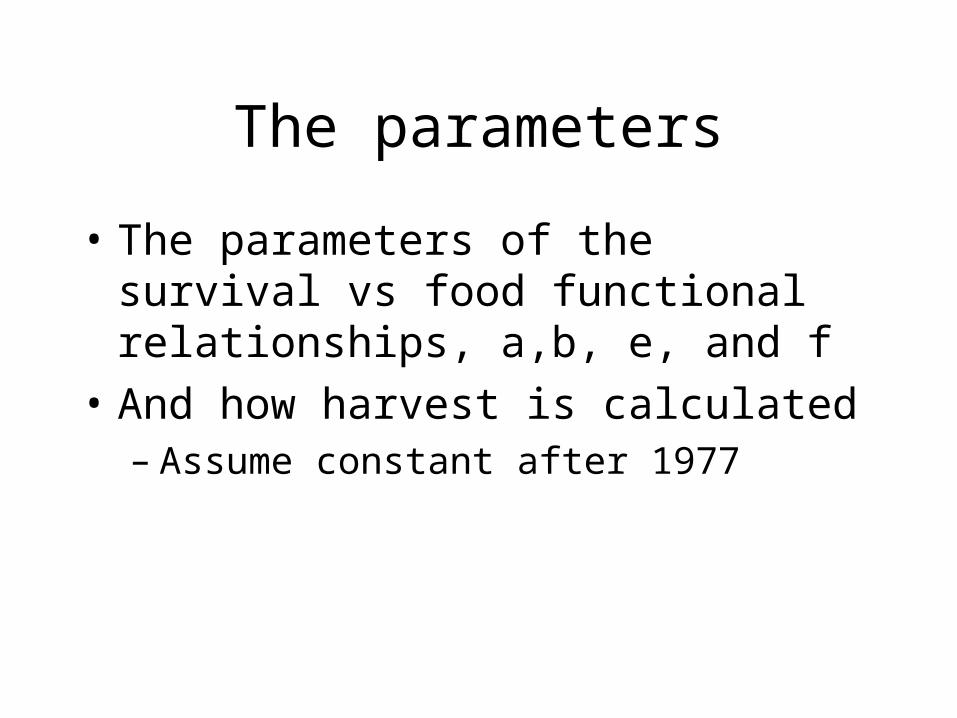
The parameters
• The parameters of the survival vs food functional relationships, a,b, e, and f
• And how harvest is calculated– Assume constant after 1977
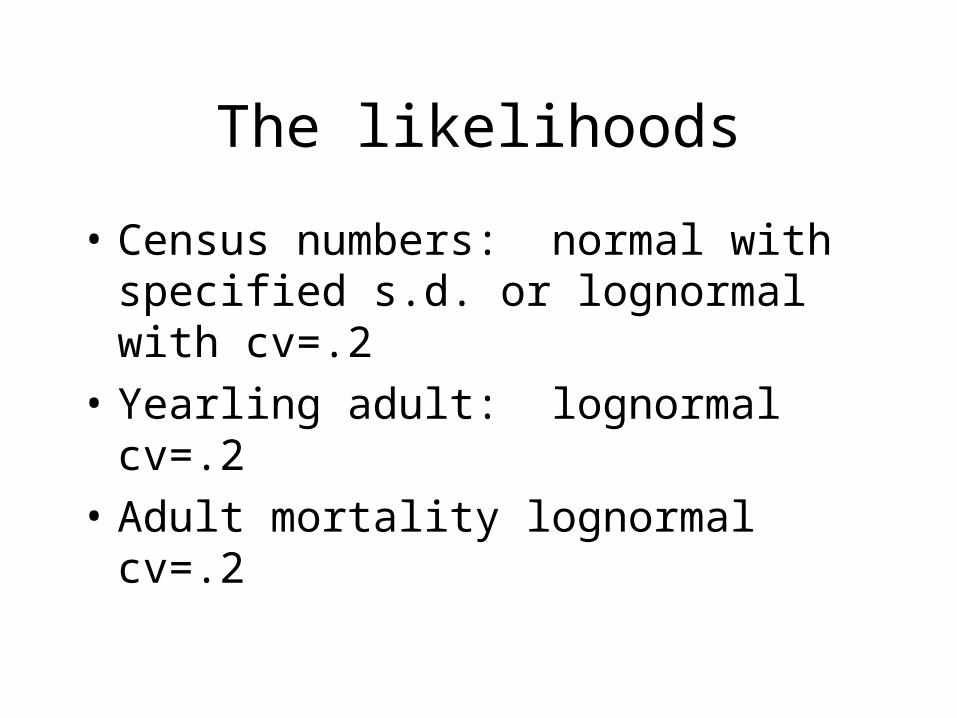
The likelihoods
• Census numbers: normal with specified s.d. or lognormal with cv=.2
• Yearling adult: lognormal cv=.2
• Adult mortality lognormal cv=.2
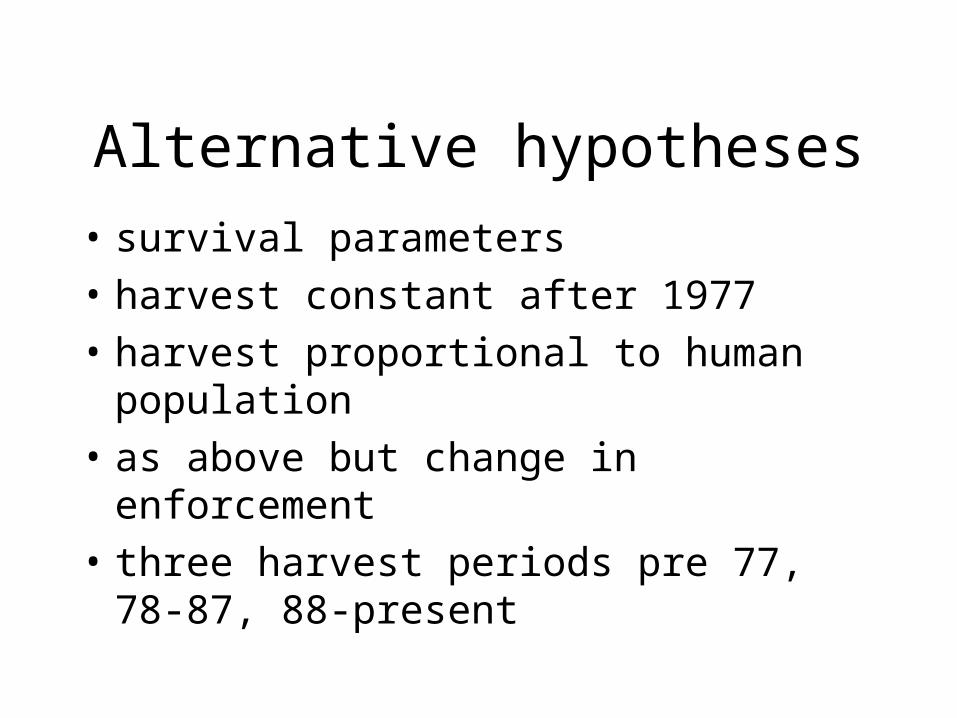
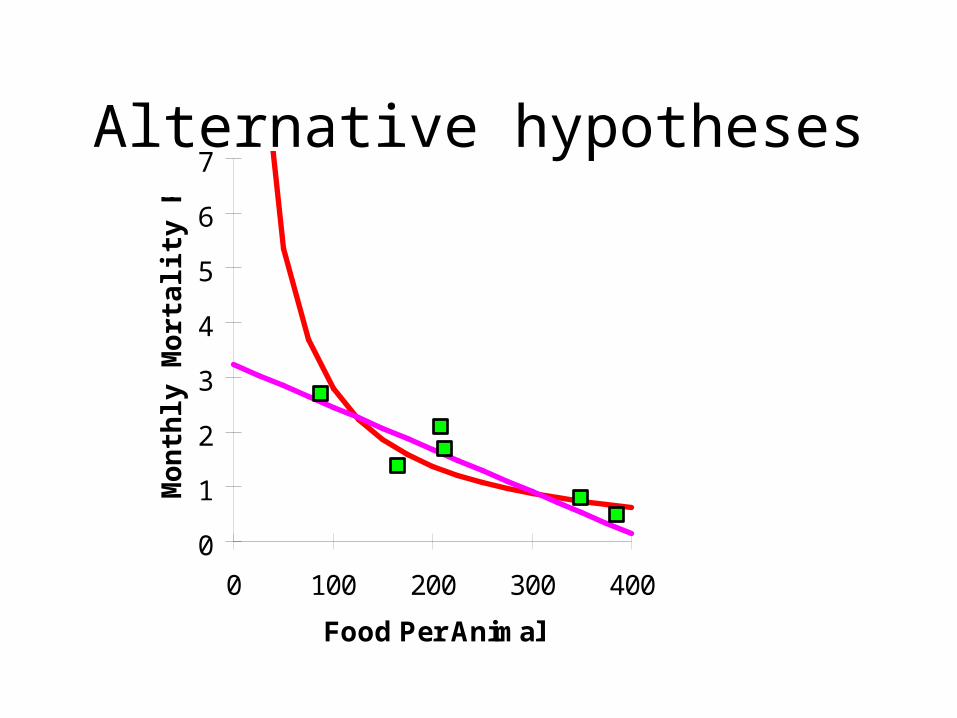
Alternative hypotheses
• survival parameters
• harvest constant after 1977
• harvest proportional to human population
• as above but change in enforcement
• three harvest periods pre 77, 78-87, 88-present
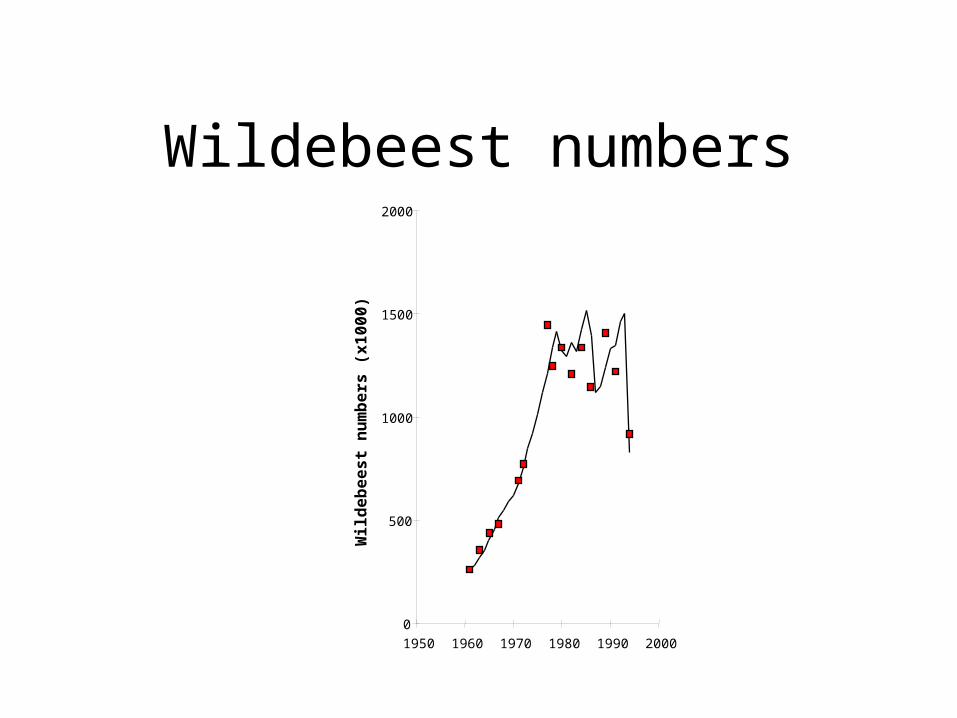
Wildebeest numbers
0
500
1000
1500
2000
1950 1960 1970 1980 1990 2000
Wild
eb
eest
nu
mb
ers
(x1
00
0)
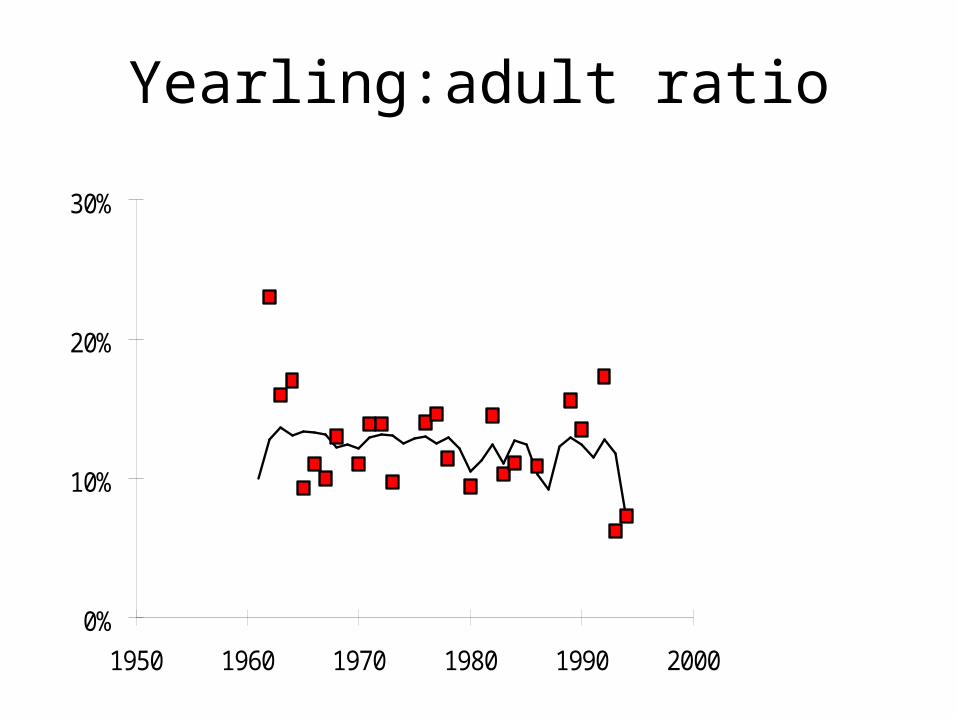
Yearling:adult ratio
0%
10%
20%
30%
1950 1960 1970 1980 1990 2000
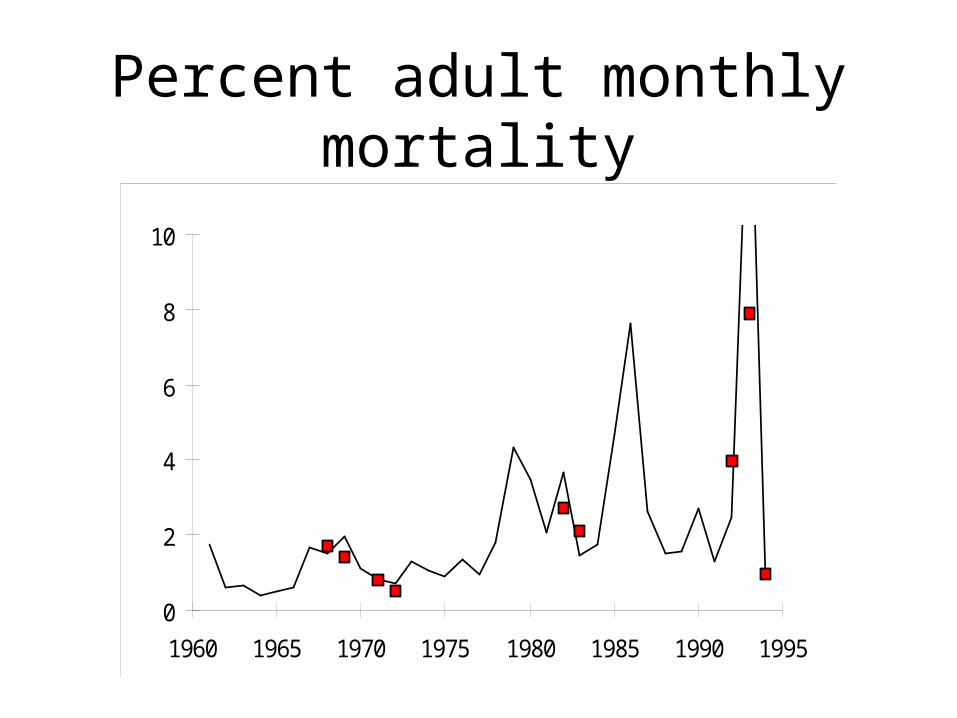
Percent adult monthly mortality
0
2
4
6
8
10
1960 1965 1970 1975 1980 1985 1990 1995
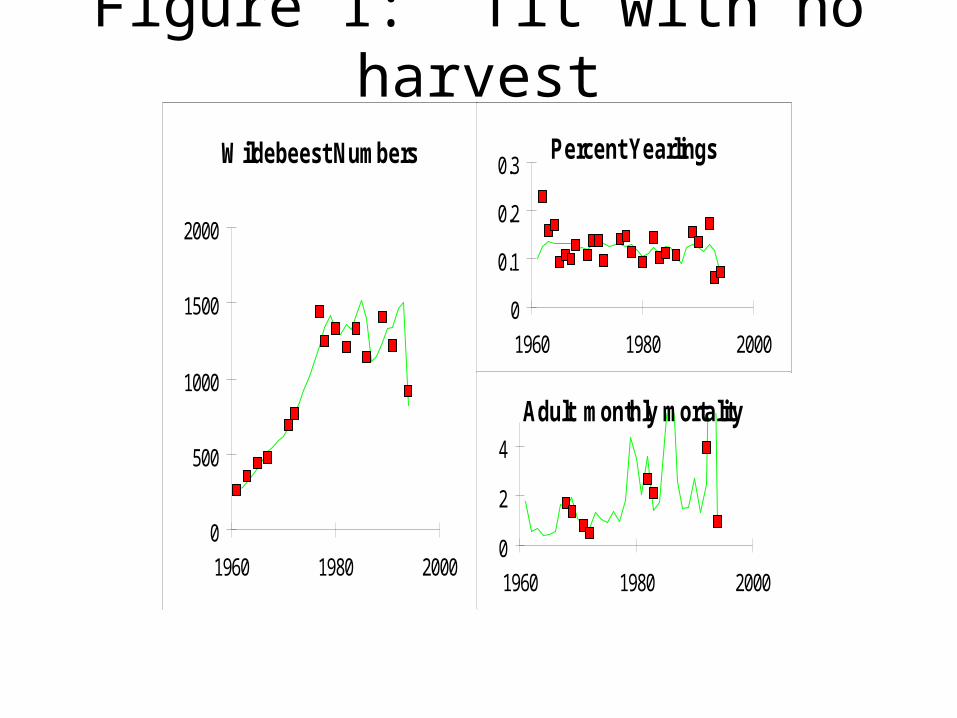
Figure 1: fit with no harvestWilde be e s t Numbe rs
0
500
1000
1500
2000
1960 1980 2000
Pe rce nt Ye arlings
0
0.1
0.2
0.3
1960 1980 2000
Adult monthly mortality
0
2
4
1960 1980 2000
Wilde be e s t Numbe rs
0
500
1000
1500
2000
1960 1980 2000
Pe rce nt Ye arlings
0
0.1
0.2
0.3
1960 1980 2000
Adult monthly mortality
0
2
4
1960 1980 2000
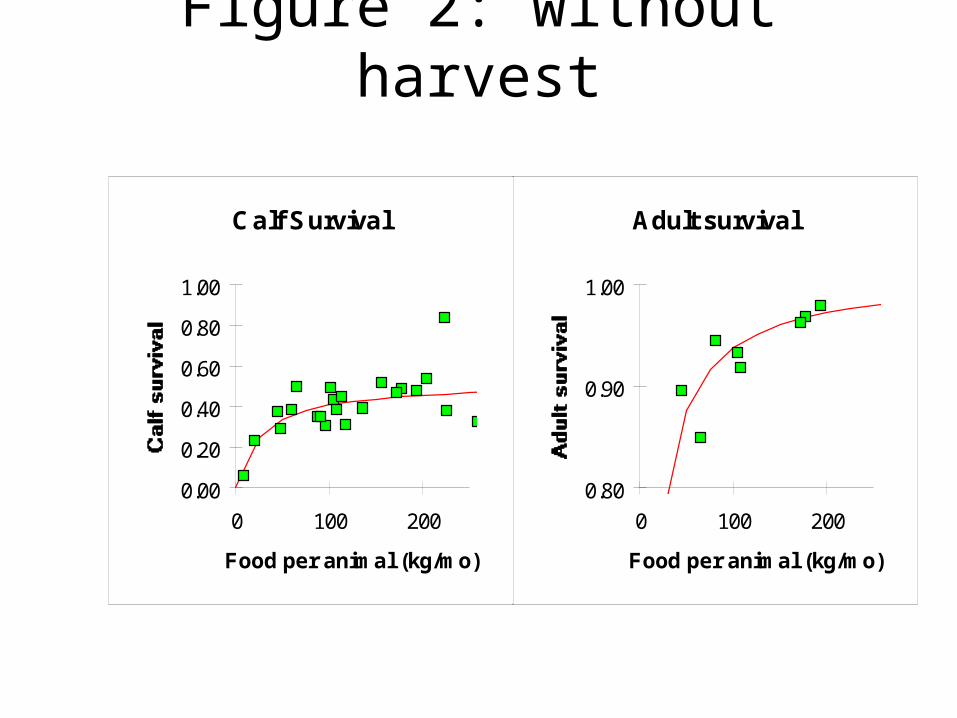
Figure 2: without harvest
Adult s urvival
0.80
0.90
1.00
0 100 200
Food pe r animal (kg/mo)
Calf S urvival
0.00
0.20
0.40
0.60
0.80
1.00
0 100 200
Food pe r animal (kg/mo)
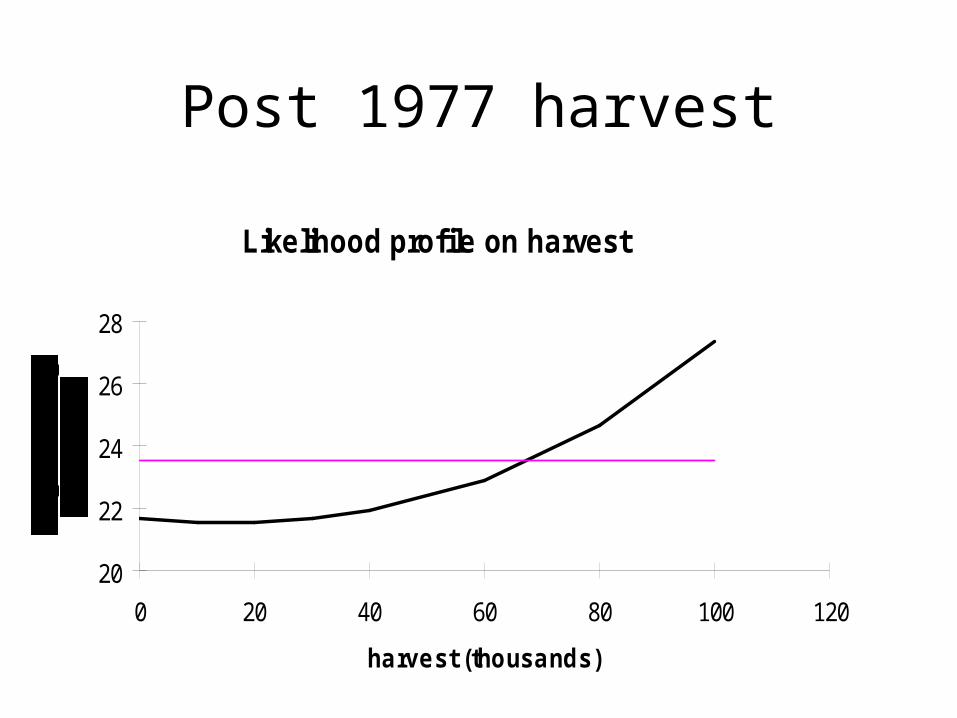
Post 1977 harvest
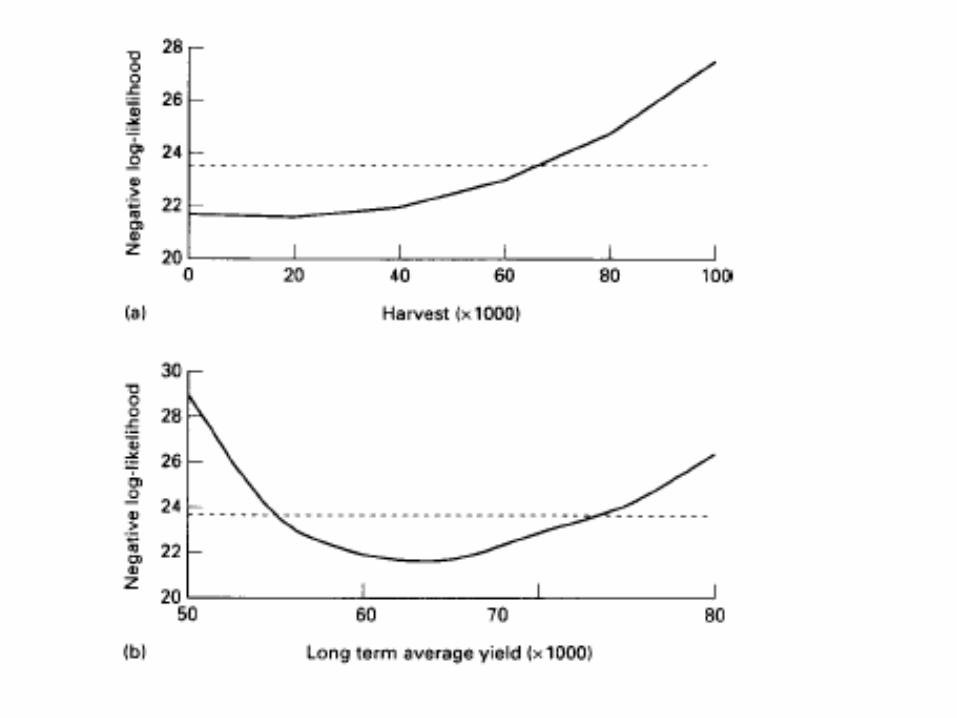
Like liho o d pro file on harve s t
20
22
24
26
28
0 20 40 60 80 100 120
ha rve s t (tho us a nd s )
0
1
2
3
4
5
6
7
0 100 200 300 400
Food Per Animal
Mon
thly
Mort
ality
Rate
Alternative hypotheses
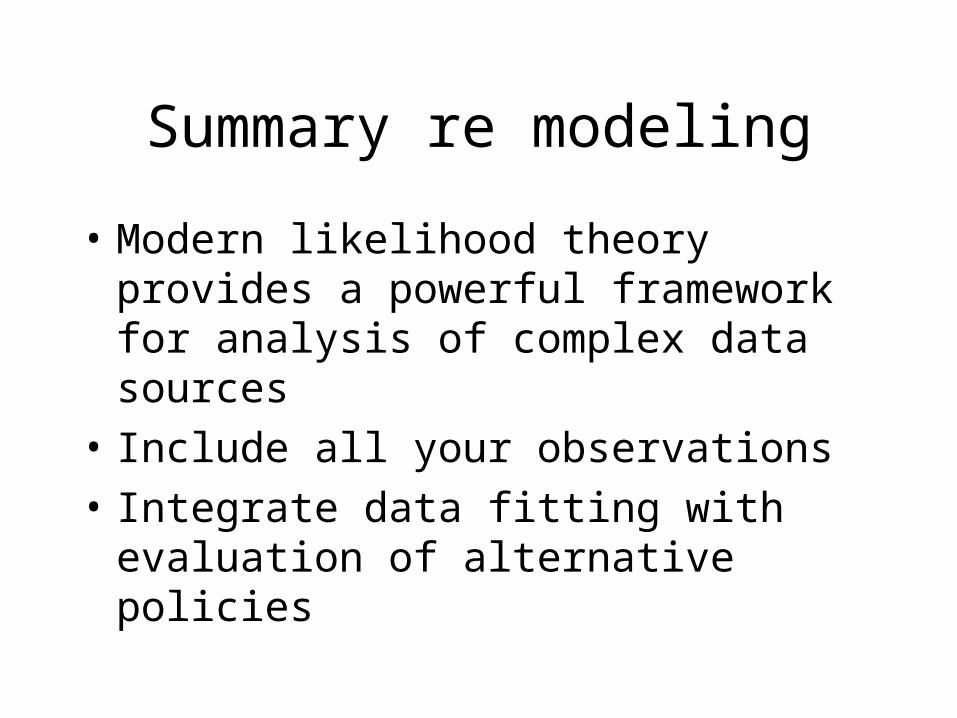
Summary re modeling
• Modern likelihood theory provides a powerful framework for analysis of complex data sources
• Include all your observations
• Integrate data fitting with evaluation of alternative policies
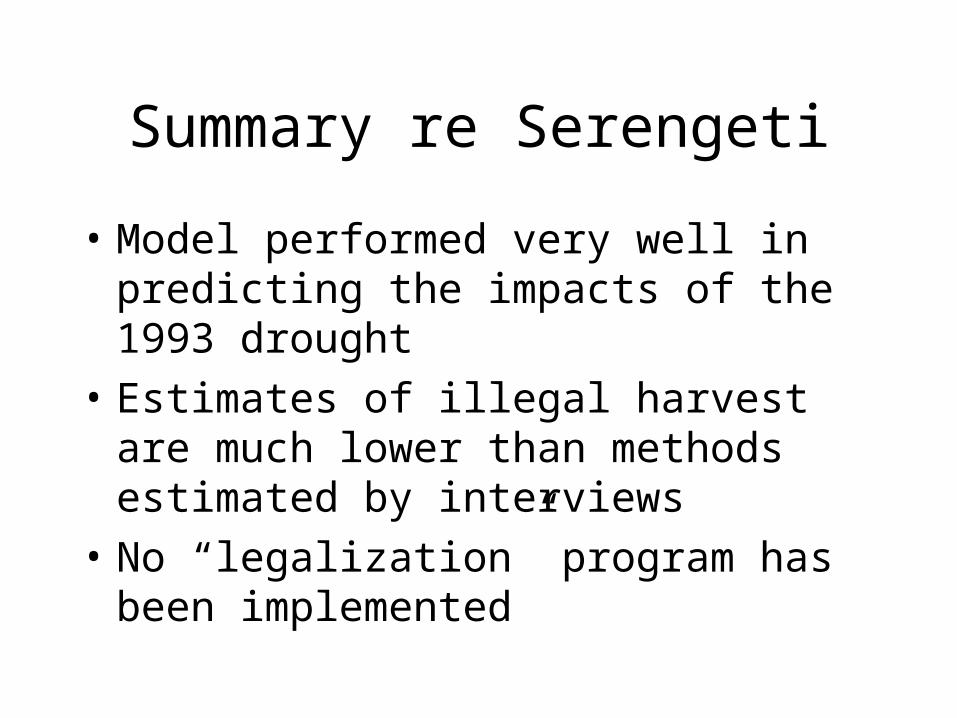
Summary re Serengeti
• Model performed very well in predicting the impacts of the 1993 drought
• Estimates of illegal harvest are much lower than methods estimated by interviews
• No “legalization” program has been implemented
Publications
• Hilborn, R. and A.R.E. Sinclair. 1979. A simulation of the wildebeest population, other ungulates and their predators. pps 287-309 In: Serengeti: Dynamics of an Ecosystem. A.R.E. Sinclair and M. Norton-Griffiths, eds. University of Chicago Press.
• Mduma, S.A.R., Hilborn, R. & Sinclair, A.R.E. 1998. Limits to exploitation of Serengeti wildebeest and implications for its management. Dynamics of tropical communities, the 37th Symposium of the British Ecological Society (eds D.M. Newbery, H.B., H.H.T. Prins & N.D. Brown) pp. 243-265. Blackwell Science, Oxford.