Embed Size (px)
Citation preview

ARWIN EGIONAL PECIALISED ETEOROLOGICAL ENTRED R S M C
ISSN 1321 - 4233
SEPTEMBER 2010, VOL 29 No 9© PUBLISHED BY THE AUSTRALIAN BUREAU OF METEOROLOGY 2010

DARWIN TROPICAL DIAGNOSTIC STATEMENT
September 2010
ISSUED BY NORTHERN TERRITORY CLIMATE SERVICE CENTRE
SUMMARY The La Niña pattern has continued to develop during the month of September. Since April, negative SST anomalies have been observed across the central and eastern equatorial Pacific with warm SST anomalies now confined to the tropical western Pacific. Sub-surface temperatures remain well below average across most of the central and eastern Pacific Ocean, with broad areas up to 4 oC below normal. The Southern Oscillation Index (SOI) has remained positive since April. Four tropical storms and one Typhoon were analysed in the RSMC analysis area in September. INDICES
Troup’s Southern Oscillation Index (SOI) for September 2010 +25 5-month mean (centred upon July) +15 Darwin mean MSL pressure for September 2010 1010.8 hPa Pressure anomaly (1933 – 1992 mean) - 1.2 hPaTahiti mean MSL pressure for September 2010 1017.3 hPa Pressure anomaly (1933 – 1992 mean) 2.9 hPa
Time series of Troup’s SOI:
Year Jan Feb Mar Apr May Jun Jul Aug Sep Oct Nov Dec 2008 + 14 + 21 + 12 + 4 - 4 + 5 + 2 + 9 + 14 + 13 + 17 + 13
2009 + 9 + 15 0 +9 - 5 - 2 + 2 - 5 + 4 -15 -7 -7
2010 -10 -14 -11 +15 +10 +2 +21 +19 +25 The above table presents monthly values of the SOI from 2008 to date. Fig.1 shows the monthly SOI and its five-month running mean for the past ten years. The monthly SOI value reached +25, the highest monthly value since November 1973 (31.6). It was also the highest September SOI value since 1917 (28.6 in September 1917). The SOI has now remained in positive territory for six consecutive months. During this period it has tracked in double figures for all months except June. The five-month mean SOI increased slightly from +13 in August to +15.
1

TROPICAL CYCLONES (TC) [Fig. 2] Five tropical cyclones were analysed in the RSMC area during the month of September, two of them reached Typhoon intensity. In addition, two more cyclones formed at the end of August and persisted during first few days of September. The comparative long-term means for tropical cyclone formation in September are 5.3 tropical storms (3.2 typhoons) for the north-western Pacific Ocean, 0.5 for the South Pacific and South Indian Oceans combined and 0.5 for the North Indian Ocean including the Bay of Bengal. Typhoon Kompasu (also appeared in the August DTDS) Beginning early on the 28th, an area of low pressure, located northwest of Guam, began to organize into a tropical depression. The system experienced low vertical windshear and was located over a sea surface that was near 30 ºC. These favourable conditions allowed for the intensification of the storm, which got named “Glenda” by the Philippine Atmospheric Geophysical and Astronomical Services Administration (PAGASA). On the morning of the 29th the north-westward moving storm upgraded to a tropical storm. A short time later the Japan Meteorological Agency (JMA) named the storm “Kompasu”, a Japanese word meaning “Compass”. Kompasu continued to intensify as it moved northwest over very warm water. On the 30th Kompasu rapidly intensified to a typhoon reaching maximum wind speeds of 80 knots at 00 UTC on the 31st making it the strongest typhoon of the season to date. Typhoon Kompasu slammed Japan’s southern island of Okinawa. The storm’s eye was over Nago on Okinawa Island at 5:45 p.m. local time on the 31st. Kompasu may have been accelerated toward the northwest due to interaction with tropical storm Namtheun. On September 1st Kompasu entered the Yellow Sea with sustained winds of 75 knots, and weakened as it curved to the northeast and made landfall near North Korea’s southern boarder causing loss of life and severe damage to property. South Korean media reported that Kompasu was the strongest tropical storm to hit the Seoul metropolitan area in 15 years (Possibly referring to Typhoon Faye and tropical storm Janis which both clobbered Seoul in 1995). Kompasu weakened to a tropical storm while over the Korean Peninsula, and then entered the Sea of Japan on the 2nd of September. Severe Tropical Storm Lionrock (also appeared in the August DTDS) Lionrock began as a low pressure system to the east of the Philippine Islands. The low pressure system became a tropical storm on the 28th of August as it meandered to the northwest. Lionrock stalled in the South China Sea for about three days. The maximum wind speed of 50 knots occurred at 06 UTC on the 30th of August. On the 31st Lionrock began to move north due to a Fujiwhara interaction with tropical storm Namtheun. Lionrock made landfall shortly after 00 UTC on the 2nd of February near the city of Shantou on the east coast of Guangdong Provence, China. Tropical Storm Malou A low pressure system in the Philippine Sea that formed within the monsoon trough, intensified as Tropical Storm Malou on the 3rd. It moved northwest while intensifying. It changed its direction to north on the 4th and began to recurve on the 6th and drifted towards
2

the northeast. It made landfall on the north-western coast of Japan on the 8th. It soon weakened over land and became a tropical low on the 9th. Tropical Storm Malou produced heavy rainfall and flash flooding in several areas of Japan. Tropical Storm Meranti A tropical low formed to the southeast of Taiwan on the 6th. Favourable weak vertical wind shear and warm sea surface temperatures helped the system to intensify further to became a tropical storm on the 8th and move north into the Taiwan Strait. It made landfall on the 10th over mainland China. It quickly weakened to a tropical depression again as it moved farther inland on the 11th. Media reports indicate Tropical Storm Meranti caused loss of life and widespread damage in Hong Kong due to torrential rains and severe lightening. Typhoon Fanapi A low was analysed in the Philippine Sea within the monsoon trough on the 14th. It remained quasi stationary in the area while intensifying. It became a tropical storm on the 16th and further intensified to a typhoon on the same day. It drifted north initially but later took a northwest direction. It headed straight towards Taiwan and made landfall on September 19th. Typhoon Fanapi rapidly weakened over land, turned southwest and later northeast while moving across Taiwan. It emerged in to the Formosa Strait of the South China Sea on the 20th as a tropical storm. It moved east northeast, made landfall over mainland China on the 20th, and then weakened to a low on the 21st over land. Typhoon Fanapi caused extensive damage in Taiwan. Typhoon Malakas A low that formed on September 20th in the north-western Pacific within the monsoon trough intensified on the 21st to Tropical Storm Malakas, a name meaning “strong” or “powerful” in Filipino. With favourable seas surface temperatures and vertical windshear, the system continued to intensify. It moved initially to northwest and then changed the course to north on the 23rd. It intensified to Typhoon strength on the 24th while moving north. It intensified further and moved north northeast, out of the RSMC area and merged into an extra tropical frontal system later. SEA SURFACE TEMPERATURE (SST) [Figs. 3a, 3b] Sea surface temperatures over the western and central equatorial Pacific regions continued to cool during September, with cooler than average temperatures extending from east of the International Date Line to the American continent. Warm temperature anomalies have now expanded over most of the western tropical Pacific, the Maritime Continent and the Philippine Sea. Sub surface temperatures across the equatorial Pacific remained well below average with some areas in the central Pacific up to 4 °C below the norm. Most of the tropical Indian Ocean remained warmer than normal. El Niño and Southern Oscillation indices for the Pacific Ocean remained consistent with La Niña conditions.
3

MEAN SEA LEVEL PRESSURE (MSLP) [Figs. 4a, 4b] Negative MSLP anomalies persisted over the Indian Ocean, apart from the far south eastern Indian Ocean, where strong positive anomalies prevailed. Positive MSLP anomalies generally extended over the remainder of the RSMC area. Subtropical ridge in the north-western Pacific remained stronger than normal. Strong positive anomalies prevailed over southwest Australia, and the subtropical ridge over the north Pacific was also stronger than normal. The strong high pressure anomalies to the south west of Australia may be associated with a strong positive Southern Annular Mode which has contributed to drought conditions in southwest Western Australia. 850hPa FLOW [Figs. 5a, 5b] The eastern tropical RSMC area was dominated by stronger than normal low-level easterly winds in September. Easterly flow over the equatorial Pacific (between 120° E and 170° E) remained 5 ms-1 above the long-term mean, consistent with the La Niña conditions. This is a similar pattern to the previous two months, but the affected area has shifted west and extends into the Philippine Islands. Stronger than normal easterlies across Australia’s Top End pulled air from a warm ocean to the east which aided to the warmest September on record for Darwin. Patches of 5 ms-1 stronger than normal westerly flow persisted in the equatorial Indian Ocean, consistent with the MSLP anomalies for the month. 200hPa FLOW [Figs 6a, 6b] A comparison of the upper and lower level winds (Figs. 5 and 6) indicates weaker than normal return flow along the equator and a very weak (or non-existent) divergence pattern. This also may have been evident in the weak and rather disorganized Madden-Julian Oscillation (MJO) throughout September. The wind vector analysis (Fig. 6a) indicates strong upper-level East winds over the equatorial Indian Ocean without much activity in the western Pacific. The anomaly chart (Fig 6b) suggests that the easterlies over the equatorial pacific are weaker than normal. There is also indication of a stronger than normal south easterly component to the upper level winds near the exit region of the strong southern-hemisphere upper level jet near 20° S and 170° E. OUT-GOING LONG-WAVE RADIATION (OLR) [Figs 7a, 7b] Negative OLR anomalies persisted over much of the tropical areas within the RSMC during the month. September marks the beginning of a transitional season, in terms of rainfall and the positioning of the ITCZ. Therefore, the monsoon trough that had lingered over the northern hemisphere tropics in the beginning of the month has begun a shift southward. This southward shift brought enhanced convection across Indonesia in the latter part of the month. The near equatorial trough in the southern hemisphere was active between 100° E and 140° E. A negative phase of the Indian Ocean Dipole induced higher values of OLR to the immediate northwest of the Australian Continent, and allowed for enhanced cloudiness over central Australia. As expected during La Niña conditions, the western tropical Pacific in general and the equatorial western Pacific in particular recorded strong positive OLR anomalies. These positive anomalies are more enhanced, and stretch farther
4

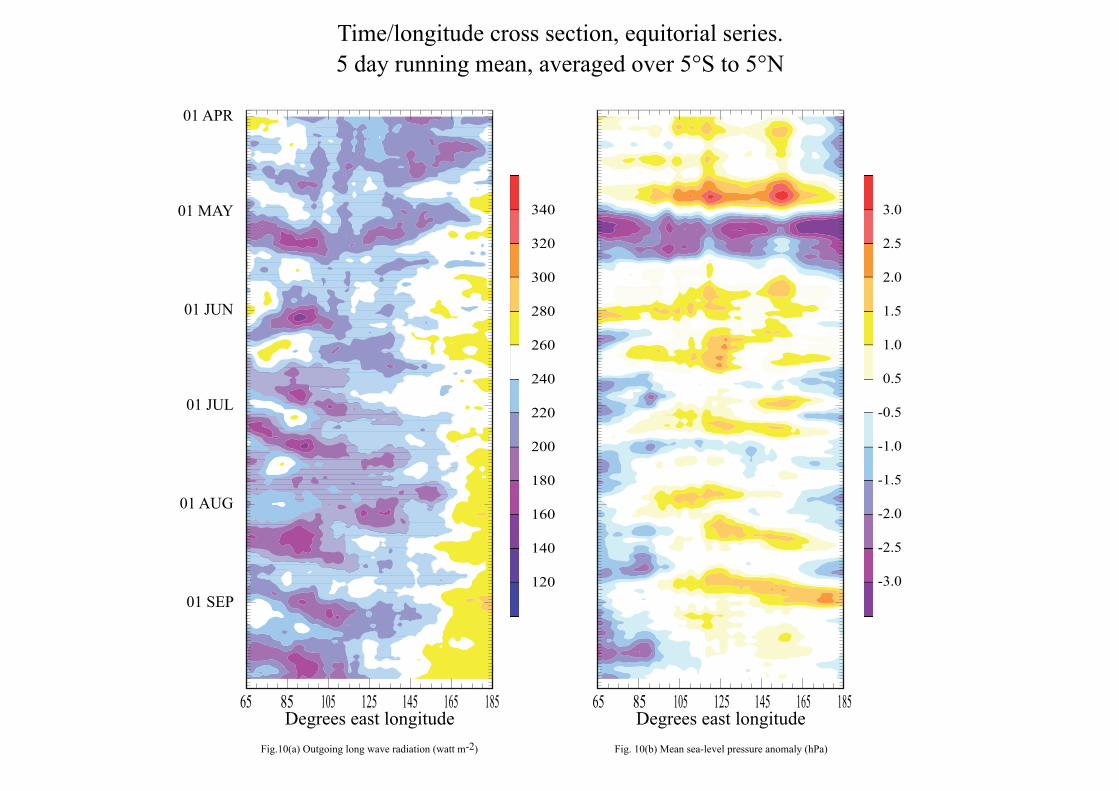
850 hPa WIND COMPONENTS AT DARWIN [Figs. 8a, 8b] Darwin’s low-level meridional winds remained close to the mean seasonal winds throughout September. The few exceptions occurred on the 3rd of September as deviations from the seasonal mean reached +3.8 knots and on the 24th of September when the southerly component to the mean wind was 4.9 knots stronger than normal. The zonal wind at Darwin maintained an eastward component throughout the month, with anomalously strong easterlies during the second week of the month, and weaker than normal easterlies around the 18th and 19th of the month. INTRA-SEASONAL VARIATIONS [Figs. 9, 10, 11] Due to the prevailing cool SST pattern in the central and eastern equatorial Pacific, convection remained heavily suppressed, allowing for higher OLR in these regions during July, August and September. The strong convective events in the north-western tropics throughout June, July, and August began to wane near mid-September as the monsoon trough began its southerly retreat bringing above normal rainfall to large areas throughout Indonesia and the southern Maritime Continent. The Indian Ocean Dipole (IOD) is in a strong negative phase (warmer than normal SST’s in the eastern Indian Ocean), evidenced in negative pressure anomalies in the southern hemisphere tropics near 90° E. The MJO signal remained weak during September.
Fig. 1 SOUTHERN OSCILLATION INDEX 2000 – 2010 Monthly SOI (bars) and 5-month running mean SOI (Red line).
5

Fig. 2 OPERATIONAL TRACKS OF CYCLONES; FAMAPI, MALAKAS, MALOU, MERANTI FOR SEPTEMBER 2010.
40°N
30°N
20°N
110°E 120°E 130°E 150°E140°E 160°E
23/5522/40
21/3521
25/75
240675
24/70
08
11
100040
09/35
21
19/80180085 17/70
16/50
15
Meranti
Malakas
Fanapi
09
03
03/35
Malou
04/35
05/40
060045
07/45
08/35
20/50
10°N
Severe tropical cyclone/typhoon
Tropical cyclone/stormLow Pressure SystemDD/ff
DDHHff
wind at 00 UTC (knots)date
max wind (knots)time (UTC)date

Fig.3(a) SEA SURFACE TEMPERATURE, September 2010.
Fig.3(b) SEA SURFACE TEMPERATURE ANOMALY, September 2010. Fig.4(b) MEAN SEA LEVEL PRESSURE ANOMALY, September 2010.Contour interval 1 hPa. Heavy line represents zero anomaly.
Fig.4(a) MEAN SEA LEVEL PRESSURE, September 2010.Isobar interval 2.5 hPa
30N
EQ
30S
40N
20N
EQ
20S
40S
40N
20N
EQ
20S
40S
90E 120E 150E 80E 100E 120E 140E 160E 180E
80E 100E 120E 140E 160E 180E
30N
EQ
30S
90E 120E 150E
No Data
- 0 .5
4.0
3.0
2.0
1.0
0.5
- 4 .0
- 3 .0
- 2 .0
- 1 .0
7.0
6.0
5.0
4.0
3.0
2.0
1.0
0
-1.0
-2.0
-3.0
-4.0
-5.0
-6.0
-7.0
hPa
°C
26
31
30
29
28
27
18
20
22
24
°C

Arrow length indicates relative magnitude. Anomalies > 5 ms-1 are shaded.Fig.5(b) 850 hPa WIND ANOMALY, September 2010.
80E 100E 120E 140E 160E 180
40N
20N
EQ
20S
40S
Arrow length indicates relative magnitude. Isotachs at 5ms-1 intervals are shaded.Fig.5(a) 850 hPa VECTOR WIND ANALYSIS, September 2010.
80E 100E 120E 140E 160E 180
40N
20N
EQ
20S
40S

Arrow length indicates relative magnitude. Anomalies > 5 ms-1 are shaded.Fig.6(b) 200 hPa WIND ANOMALY, September 2010.
80E 100E 120E 140E 160E 180
40N
20N
EQ
20S
40S
Arrow length indicates relative magnitude. Isotachs at 10ms-1 intervals are shaded.Fig.6(a) 200 hPa VECTOR WIND ANALYSIS, September 2010.
80E 100E 120E 140E 160E 180
40N
20N
EQ
20S
40S

Contour interval 10 watt m-2.Fig.7(b) OUTGOING LONG WAVE RADIATION ANOMALY, September 2010.
80E 100E 120E 140E 160E 180
40N
20N
EQ
20S
40S
Contour interval 20 watt m-2.Fig.7(a) OUTGOING LONG WAVE RADIATION, September 2010.
80E 100E 120E 140E 160E 180
40N
20N
EQ
20S
40S

N
S
Win
d co
mpo
nent
(kno
ts)
Black line represents 3-day running mean. Orange line represents the mean seasonal wind.Fig.8(b) DARWIN 850 hPa MEAN MERIDIONAL WIND, September 2010.
20
15
10
5
0
5
10
15
201 3 5 7 9 11 13 15 17 19 21 23 25 27 29 1
W
E
Win
d co
mpo
nent
(kno
ts)
Fig.8(a) DARWIN 850 hPa MEAN ZONAL WIND, September 2010.Black line represents 3-day running mean. Orange line represents the mean seasonal wind.
-30
-20
-10
0
10
20
30
1 3 5 7 9 11 13 15 17 19 21 23 25 27 29 1

3.0
2.5
2.0
1.5
1.0
0.5
-0.5
-1.0
-1.5
-2.0
-2.5
-3.0
Time/longitude cross section, southern series.5 day running mean, averaged over 15°S to 5°S
65 85 105 125 145 165 185 65 85 105 125 145 165 185
01 JUL
01 SEP
01 AUG
01 MAY
01 JUN
01 APR
340
320
300
280
260
240
220
200
180
160
140
120
Degrees east longitudeFig.9(a) Outgoing long wave radiation (watt m-2)
Degrees east longitudeFig. 9(b) Mean sea-level pressure anomaly (hPa)
3.0
2.5
2.0
1.5
1.0
0.5
-0.5
-1.0
-1.5
-2.0
-2.5
-3.0
Time/longitude cross section, equitorial series.5 day running mean, averaged over 5°S to 5°N
65 85 105 125 145 165 185 65 85 105 125 145 165 185
01 JUL
01 SEP
01 AUG
01 MAY
01 JUN
01 APR
340
320
300
280
260
240
220
200
180
160
140
120
Degrees east longitudeFig.10(a) Outgoing long wave radiation (watt m-2)
Degrees east longitudeFig. 10(b) Mean sea-level pressure anomaly (hPa)

3.0
2.5
2.0
1.5
1.0
0.5
-0.5
-1.0
-1.5
-2.0
-2.5
-3.0
Time/longitude cross section, northern series.5 day running mean, averaged over 5°N to 15°N
65 85 105 125 145 165 185 65 85 105 125 145 165 185
01 JUL
01 SEP
01 AUG
01 MAY
01 JUN
01 APR
340
320
300
280
260
240
220
200
180
160
140
120
Degrees east longitudeFig.11(a) Outgoing long wave radiation (watt m-2)
Degrees east longitudeFig. 11(b) Mean sea-level pressure anomaly (hPa)

Explanatory Notes 1. Darwin Tropical Diagnostic Statement is a near real-time monthly diagnostic summary of the major tropical circulations within the Darwin Regional Specialised Meteorological Centre (RSMC) area of analysis responsibility, which covers 40ºN-40ºS, 70ºE-180º. Caution does need to be exercised when quoting from this publication as not all information within it has been confirmed. 2. Features discussed generally include:
. El Niño - Southern Oscillation (ENSO) aspects . Tropical cyclone (TC) occurrence . Sea surface temperature (SST) . Mean sea level pressure (MSLP).
. Lower and upper level wind
. Up-motion and convection
. Intra-seasonal variability
3. Data sources: (i) SOI = 10 x(∆PTAH - ∆PDAR) /σ
where ∆PTAH =Tahiti (91938) monthly pressure anomaly (monthly mean minus 1933-1992 mean, averaging 3-hourly observations)
∆PDAR = Darwin (94120) monthly pressure anomaly (monthly mean minus 1933-1992 mean, averaging 0900, 1500LT observations) σ = monthly deviation of the difference.
(ii) Operational tropical cyclone tracks based upon Darwin RSMC manual operational analyses. A tropical cyclone or cyclonic storm is defined as having mean wind ≥ 17 ms-1 (34 kn) or a named system. Standard practice is to accept intensity and position as promulgated by the responsible warning agency, whenever possible. This may cause apparent discontinuities in intensity or track when cyclones cross warning area boundaries. Limited post analysis may sometimes be performed when warranted. A severe TC (equivalent to typhoon or hurricane) or very severe cyclonic storm is defined as having mean wind ≥32 m s-1 (63 Kn). (iii) Tropical cyclone climatology for the northwest Pacific and the south Indian and Pacific Oceans is based on 2008 Annual Tropical Cyclone Report, by Cooper, G.A. and R.J. Falvey, (2009), US Naval Pacific Meteorology and Oceanography Center/ Joint Typhoon Warning Center, Pearl Harbour, Hawaii, USA, (available at https://metoc.npmoc.navy.mil/jtwc/atcr/2008atcr/2008atcr.pdf). North Indian Ocean records are taken from WMO Technical Document No. 430, Tropical Cyclone Report No.TCP-28 (Mandal, 1991). (iv) SST analysis based on Darwin RSMC automated operational analyses (RSMC subset of the Australian National Meteorological and Oceanographic Centre (NMOC) global analysis: blended in situ and satellite data, 1ºC resolution). The 1ºx 1º global SST climatology from the US National Centers for Environmental Prediction (Reynolds and Smith 1995). A high resolution global sea surface temperature climatology, J. Clim., 8, 1571-1583 is used for the calculation of anomalies and as the default field for the analysis first guess. (v) Mean MSLP, upper wind data, anomalies and velocity potential data from the Bureau of Meteorology’s Global Assimilation and Prediction System (GASP - refer Bourke et al 1990. The BMRC global assimilation and prediction system. ECMWF Seminar proceedings: Ten years of medium-range weather forecasting, Sep 89) and NCEP2 22 year climatology, 1979-2000. Equatorial cross section of meridional wind field was derived from the Bureau of Meteorology’s operational Tropical region Extended Limited Area Prediction System (TXLAPS_PT375n) model. (Refer- Analysis and Prediction Operations Bulletin No 59. Bur. Met., Australia.) A full web version available at: http://www.bom.gov.au/nmoc/bulletins/nmc_bulletin.shtml). (vi) The mean seasonal cycles for the Darwin 850 hPa wind components were constructed by averaging daily values over 57 years (1950 to 2006). (vii) OLR time longitude plots and maps derived from the US National Oceanic and Atmospheric Administration. 4. Some commonly-used acronyms: CS - Cyclonic storm ISO - Intra-seasonal oscillation JMA - Japan Meteorological Agency JTWC - Joint Typhoon Warning Center, Pearl Harbour MJO - Madden-Julian Oscillation MSLP - Mean Sea Level Pressure MT - Monsoon trough NET - Near-equatorial trough OLR - Out-going long-wave radiation PAGASA - Philippine Atmospheric, Geophysical and Astronomical
Services PNG - Papua New Guinea RSMC - Darwin Regional Specialised Meteorological Centre (see
note 1)
SCS - South China Sea SOI - Southern Oscillation Index SPCZ - South Pacific convergence zone SST - Sea Surface Temperature STC - Severe tropical cyclone STR - Subtropical ridge TC - Tropical cyclone (see note 3(ii)) TD - Tropical depression TXLAPS - Tropical region Extended Limited Area Prediction Scheme TS - Tropical storm (generally used for TC in northern Hemisphere sector) TUTT - tropical upper tropospheric trough VSCS - Very severe cyclonic storm
5. Subscription rates All costs in $AUSTRALIAN:
Annual subs. Postage Subs (incl postage) 95.50 (86.80 ex GST) 14.40 (Australia) 109.90 36.00 (Asia/Pacific) 131.50 51.60 (Rest of the world) 147.10 6. For further details contact: The Regional Director, Bureau of Meteorology, PO Box 40050, Casuarina, Northern Territory 0811 AUSTRALIA Telephone: (International: 61) (08) 8920 3813 Fax: (International: 61) (08) 8920 3832 E-mail: [email protected]