Embed Size (px)
Citation preview
CHEMICAL VAPOR DEPOSITION OF BORON CARBIDE
A THESIS SUBMITTED TO
THE GRADUATE SCHOOL OF NATURAL AND APPLIED SCIENCES
OF
THE MIDDLE EAST TECHNICAL UNIVERSITY
BY
MUSTAFA KARAMAN
IN PARTIAL FULFILLMENT OF THE REQUIREMENTS
FOR THE DEGREE OF DOCTOR OF PHILOSOPHY
IN
CHEMICAL ENGINEERING
SEPTEMBER 2007
Approval of the thesis:
“CHEMICAL VAPOR DEPOSITION OF BORON CARBIDE ”
submitted by MUSTAFA KARAMAN in partial fullfillment of the requirements for
the degree of Doctor of Philosophy in Chemical Engineering Department, Middle
East Technical University by,
Prof. Dr. Canan Özgen _____________________
Dean, Graduate School of Natural and Applied Sciences
Prof. Dr. Nurcan Baç _____________________
Head of Department, Chemical Engineering
Prof. Dr. Hilmi Önder Özbelge
Supervisor, Chemical Engineering, METU ____________________
Assoc. Prof. Dr. Naime Aslı Sezgi
Co-Supervisor, Chemical Engineering, METU ____________________
Examining Committee Members:
Prof. Dr. Timur Doğu
METU,ChE _____________________
Prof. Dr. H. Önder Özbelge
METU, ChE _____________________
Prof. Dr. Naci Sevinç
METU, METE _____________________
Assoc. Prof. Dr. Burhanettin Çiçek
Ankara Üniv., ChE _____________________
Assoc. Prof. Dr. Ahmet Gülce
Selçuk Üniv., ChE _____________________
Date: 07.09.2007
iii
I hereby declare that all information in this document has been obtained and
presented in accordance with academic rules and ethical conduct. I also declare
that, as required by these rules and conduct, I have fully cited and referenced
all material and results that are not original to this wok.
Name, Last name : Mustafa Karaman
Signature : ________________
iv
ABSTRACT
CHEMICAL VAPOR DEPOSITION OF BORON CARBIDE
Karaman, Mustafa
Ph.D., Department of Chemical Engineering
Supervisor: Prof. Dr. H. Önder Özbelge
Co-Supervisor: Assoc. Prof. Dr. N. Aslı Sezgi
September 2007, 164 pages
Boron carbide was produced on tungsten substrate in a dual impinging-jet
CVD reactor from a gas mixture of BCl3, CH4, and H2. The experimental set-
up was designed to minimise the effect of mass transfer on reaction kinetics,
which, together with the on-line analysis of the reactor effluent by FTIR,
allowed a detailed kinetic investigation possible.
The phase and morphology studies of the products were made by XPS, XRD,
micro hardness and SEM methods. XPS analysis showed the existence of
chemical states attributed to the boron carbide phase, together with the
existence of oxy-boron carbide species. SEM pictures revealed the formation
of 5-fold icosahedral boron carbide crystals up to 30 micron sizes for the
samples produced at 1300oC. Microhardness tests showed change of boron
carbide hardness with the temperature of tungsten substrate. The hardness
v
values (Vickers Hardness) observed were between 3850 kg/mm2 and 4750
kg/mm2 corresponding to substrate temperatures of 1100 and 1300
oC,
respectively.
The FTIR analysis of the reaction products proved the formation of reaction
intermediate BHCl2, which is proposed to occur mainly in the gaseous
boundary layer next to the substrate surface. The experimental parameters are
the temperature of the substrate, and the molar fractions of methane and
borontrichloride at the reactor inlet. The effects of those parameters on the
reaction rates, conversions and selectivities were analysed and such analyses
were used in mechanism determination studies. An Arrhenius type of a rate
expression was obtained for rate of formation of boron carbide with an energy
of activation 56.1 kjoule/mol and the exponents of methane and boron
trichloride in the reaction rate expression were 0.64 and 0.34, respectively,
implying complexity of reaction. In all of the experiments conducted, the rate
of formation of boron carbide was less than that of dichloroborane.
Among a large number of reaction mechanisms proposed only the ones
considering the molecular adsorption of boron trichloride on the substrate
surface and formation of dichloroborane in the gaseous phase gave reasonable
fits to the experimental data. Multiple non-linear regression analysis was
carried out to predict the deposition rate of boron carbide as well as formation
rate of dichloroborane simultaneously.
Keywords: CVD, Reaction Mechanism, Kinetics, Reaction Engineering,
Adsorption, Chemical Reactors

vi
ÖZ
KİMYASAL BUHAR BİRİKTİRME YÖNTEMİ İLE BOR KARBÜR
ÜRETİMİ
Karaman, Mustafa
Doktora, Kimya Mühendisliği Bölümü
Tez Yöneticisi: Prof. Dr. H. Önder Özbelge
Ortak Tez Yöneticisi: Doç. Dr. N. Aslı Sezgi
Eylül 2007, 164 sayfa
Bu çalışmada, bor karbür BCl3, CH4, ve H2, gaz karışımı kullanılarak tungsten
folyo yüzeyinde kimyasal buhar biriktirme yöntemi ile üretilmiştir. Bu
süreçteki kütle transferi adımının önemi kullanılan çift taraflı çarpan-jet
reaktör konfigürasyonu ile en aza indirilmiş ve reaktör çıkışına bağlanan FTIR
spektrofotometresi detaylı kinetik araştırmayı mümkün kılmıştır.
Üretilen malzemelerin faz ve morfoloji çalışmaları XPS, XRD, mikro sertlik
ve SEM metodları ile yapılmıştır. XPS analizi ile bor karbür fazına ait olan
kimyasal verilerin yanı sıra, oksi-bor karbürlerin varlığı da ispatlanmıştır.
SEM analizi neticesinde boyutları 30 mikrometreye varan beşgen tabanlı
piramit şeklindeki bor karbür kristallerinin varlığı gözlemlenmiştir.
Mikrosertlik analizi sonucunda tungsten folyo sıcaklığının bor karbür sertliğini

vii
önemli ölçüde etkilediği gözlemlenmiştir. Ölçülen bor karbür Vickers sertlik
değerleri 1100 ve 1300 oC tungsten folyo sıcaklık aralığında 3850 kg/mm
2 ve
4750 kg/mm2 arasında değişiklik göstermiştir.
Reaksiyon ürünlerinin FTIR analizi sonucunda yüzeyde bor karbürü oluşturan
reaksiyona ek olarak, gaz fazındaki bir başka reaksiyon sonucunda diklorobor
(BHCl2)’un oluştuğu kanıtlanmıştır. Deneysel parametreler folyo sıcaklığı ile
reaktör girişindeki metan ve bor triklorürün mol oranları olup, bu
parametrelerin iki ana reaksiyonun hızlarına, dönüşümlerine ve seçiciliklerine
etkileri irdelenmiş ve bunlar mekanizma önerme çalışmalarında kullanılmıştır.
Bütün deneysel veriler, Arrhenius tipi bir hız denklemine uyarlanmıştır.
Doğrusal dışı egri uyarlama prosedürü uygulanarak, bor karbür oluşum
reaksiyonunun aktivasyon enerjisi 56,1 kjoule/mol olarak bulunmuştur. Bor
karbür oluşum hızı, reaktör girişindeki bor triklorürün mol oranının 0,34,
metanın mol oranının 0,64’üncü kuvvetleri ile orantılıdır. Bu sonuçlar
karmaşık bir reaksiyon mekanizması olduğunu işaret etmektedir. Yapılan
bütün deneylerde bor karbür oluşum hızının diklorobor oluşum hızından düşük
olduğu açığa çıkmıştır.
Bir çok reaksiyon mekanizması modellenmiş ve bu modellerin deneyler
sonucunda gözlenen hız verilerine uyumluluğu istatistiksel olarak denenmiştir.
Bu modeller arasında bor triklorürün taban (subtrat) yüzeyine ayrışmasız
olarak tutunduğu durumlar en iyi sonucu vermiştir. Önerilen mekanizmada
diklorobor gazının sadece gaz fazındaki reaksiyon ile oluştuğu varsayılmıştır.
Diğer taraftan, bor karbür kompleks bir yüzey mekanizma serisi sonucu
oluşmaktadır.
Anahtar Kelimeler: CVD, Reaksiyon Mekanizması, Kinetik, Reaksiyon
Mühendisliği, Adsorpsiyon, Kimyasal Rektörler

viii
DEDICATION
To My Family

ix
ACKNOWLEDGEMENTS
I would like to express my deepest appreciation to my supervisor Prof. Dr.
Hilmi Önder Özbelge. His enthusiasm, inspiration, and encouragement helped
me in all stages of my thesis research. His guidence will continue to be my
source of inspiration for my future career.
I would like to thank to my co-supervisor Assoc. Prof. Dr. N. Aslı Sezgi for
her invaluable help and guidence for almost all of the stages of this study.
I am also very greatfull to my thesis commitee members, Prof. Timur Doğu
and Prof. Naci Sevinç for their insightfull comments and suggestions on this
research.
I wish to thank The Scientific and Technological Research Council of Turkey
(TUBITAK) (project no: MISAG-217) and State Planning Organization of
Turkey (project no: BAP-08-11-DPT2002K120510-IM-5) for their financial
supports of this project.
I greatfully appreciate the help of Mr. Fatih Fırat for the preparation of the
experimental set-up, and Mr. Engin Özkol, for his help in computer
programming.
I would also want to thank the staff of the Chemical Engineering Department
of METU for their support.
Finally, I would like to express my deepest gratitude to my family for their
support and encouragement throughout my whole life.
x
TABLE OF CONTENTS
ABSTRACT ................................ ................................ ......................... iv
ÖZ................................ ................................ ................................ ......... vi
DEDICATION................................ ................................ .................... viii
ACKNOWLEDGEMENTS ................................ ................................ .. ix
TABLE OF CONTENTS................................ ................................ ....... x
LIST OF TABLES................................ ................................ .............. xiii
LIST OF FIGURES ................................ ................................ ............. xv
LIST OF SYMBOLS ................................ ................................ ......... xxii
CHAPTER
1. INTRODUCTION ................................ ................................ ............. 1
1.1. Literature Survey on CVD of Boron Carbide ................................ .. 9
1.2. Objective of the Present Work................................ ....................... 12
2. EXPERIMENTAL................................ ................................ ........... 13
2.1 Experimental Set-up................................ ................................ ....... 16
2.2 Experimental Procedure ................................ ................................ . 18
3. RESULTS AND DISCUSSIONS................................ ..................... 21
3.1. Spectrophotometric Analysis of the Reactor Effluent.................... 21
3.2. Analysis of the Reactions Occuring in the Deposition Process...... 24
3.2.1. Reaction Rate Calculations ................................................................... 27
3.2.2. Conversion Calculations:...................................................................... 30
3.2.3. Selectivity Calculations: ....................................................................... 31
3.3. Analysis of the Effects of Various Experimental Parameters on the
Reaction Kinetics................................ ................................ ................. 31

xi
3.3.1. Effects of Experimental Parameters on Selectivities.............................. 38
3.3.2. Effects of Experimental Parameters on Boron Carbide Yield................ 42
3.4. Mechanism Studies on CVD of Boron Carbide from BCl3, CH4 and
H2 Gas Mixture in a Dual Impinging Jet Reactor ................................ . 46
3.5. Morphological Investigations of the Deposits ............................. 111
3.5.1. X-Ray Photoelectron Spectroscopy Results .........................................111
3.5.2. X-Ray Diffraction Results ...................................................................115
3.5.3. Scanning Electron Microscopy (SEM) Results.....................................117
3.5.4 Effect of Deposition Temperature on the Hardness of Boron Carbide ...118
4. CONCLUSIONS AND RECOMMENDATIONS.......................... 123
REFERENCES ................................ ................................ .................. 126
APPENDIX
A. FTIR CALIBRATION METHODS ................................ .............. 129
A.1 Calibration of Methane ...........................................................................129
A.2 Calibration of Boron Trichloride.............................................................131
A.3 Calibration of Hydrogen Chloride...........................................................133
B. X-RAY DIFFRACTION DATA ................................ ................... 135
C. DERIVATIONS OF RATE LAWS FROM PROPOSED
MECHANISMS................................ ................................ ................. 139
D. RAW DATA ................................ ................................ ................. 142
E. HEAT AND MASS TRANSFER CALCULATIONS AROUND THE
TUNGSTEN FILAMENT................................ ................................ .. 160
E.1 Calculation of Heat Dissipated From the Substrate Surface .....................160
E.2 Temperature profile around the filament .................................................164
E.3 Comparison of Diffusion Effects Over the Substrate Surface Between the
Impinging Jet and Parallel Flow Conditions ..................................................168
F. REPRODUCIBILITY CALCULATIONS................................ ..... 170

xii
G. COMPARISON BETWEEN EQUILIBRIUM AND THE
EXPERIMENTALLY OBSERVED CONVERSIONS...................... 172
CIRRICULUM VITAE................................ ................................ ...... 176

xiii
LIST OF TABLES
Table 1.1 Physical Properties of Boron Carbide [1].................................................. 2
Table 1.2 Boron Carbide Fiber Properties in Comparison with Some Other
Refractory Materials [1]........................................................................................... 3
Table 2.1 Experimental Conditions in the Applied Runs ........................................ 20
Table 3.1 Characteristic wavenumber ranges for the FTIR peaks for the reaction
constituents ............................................................................................................ 24
Table 3.2 Stoichiometric Table .............................................................................. 26
Table 3.3. Some of the probable surface reactions considered for CVD of boron
carbide ................................................................................................................... 48
Table 3.4 Model Parameters and Correlation Coefficients.....................................107
Table 3.4 Model Parameters and Correlation Coefficients (cont’d)........................108
Table 3.4 Model Parameters and Correlation Coefficients (cont’d)........................109
Table 3.4 Model Parameters and Correlation Coefficients (cont’d)........................110
Table 3.5. Effect of temperature on Vickers Hardness of Boron Carbide...............122
Table B.1 XRD Data for Boron Carbide[17] .......................................................135
Table B.2 XRD Data for Boron [17] .....................................................................135
Table B.3 XRD Data for α-Tungstan Carbide [17] ...............................................136
Table B.4 XRD Data for Tungstan Carbide [17]....................................................136
Table B.5 XRD Data for Tungstan [17]................................................................136
Table B.6 XRD Data for α-Tungstan Carbide [17] ...............................................136
Table B.7 XRD Data for Carbon (Diamond) [17].................................................137
Table B.8 XRD Data for Carbon (Graphite) [17]..................................................137
Table B.9 XRD Data for Silicon Oxide [17].........................................................137
Table B.10 XRD Data for Silicon Carbide [17] ....................................................138
Table B.11 XRD Data for α-Silicon Carbide [17].................................................138
Table D.1 Raw Data for the Experiment BCL3B...................................................143
Table D.2 Raw Data for the Experiment BCl3D....................................................144
xiv
Table D.3 Raw Data for Experiment BCl3F ..........................................................145
Table D.4 Raw Data for Experiment BCl3C..........................................................146
Table D.5 Raw Data for Experiment BCl3G .........................................................147
Table D.6 Raw Data for Experiment BCl3E..........................................................148
Table D.7 Raw Data for Experiment CH4D ..........................................................149
Table D.8 Raw Data for Experiment CH4B...........................................................150
Table D.9 Raw Data for the Experiment CH4E.....................................................151
Table D.10 Raw Data for the Experiment CH4F ...................................................152
Table D.11 Raw Data for the Experiment CH4A...................................................153
Table D.12 Raw Data for the Experiment TEA .....................................................154
Table D.13 Raw Data for the Experiment TEB .....................................................155
Table D.14 Raw Data for the Experiment TEC .....................................................156
Table D.15 Raw Data for the Experiment TED .....................................................157
Table D.16 Raw Data for the Experiment TEE......................................................158
Table D.17 Raw Data for the Experiment TEF......................................................159
Table F.1 Experimental Conditions for the Reproducibility Experiments ..............171
Table G.1 Thermodynamic Properties of Reactants and Products.........................173
xv
LIST OF FIGURES
Figure 1.1 The rhombohedral crystal structure of boron carbides. Atoms are placed at
the vertices of the icosahedra and within the three-atom intericosahedral chain ........ 4
Figure 1.2 Schematic drawing of the chemical vapor deposition (CVD) process ...... 6
Figure 1.3 Various fundamental steps involved in a chemical vapor deposition
process..................................................................................................................... 8
Figure 2.1 Dual Impinging-Jet Chemical Vapor Deposition Reactor ...................... 14
Figure 2.2 Experimental Set-Up............................................................................. 15
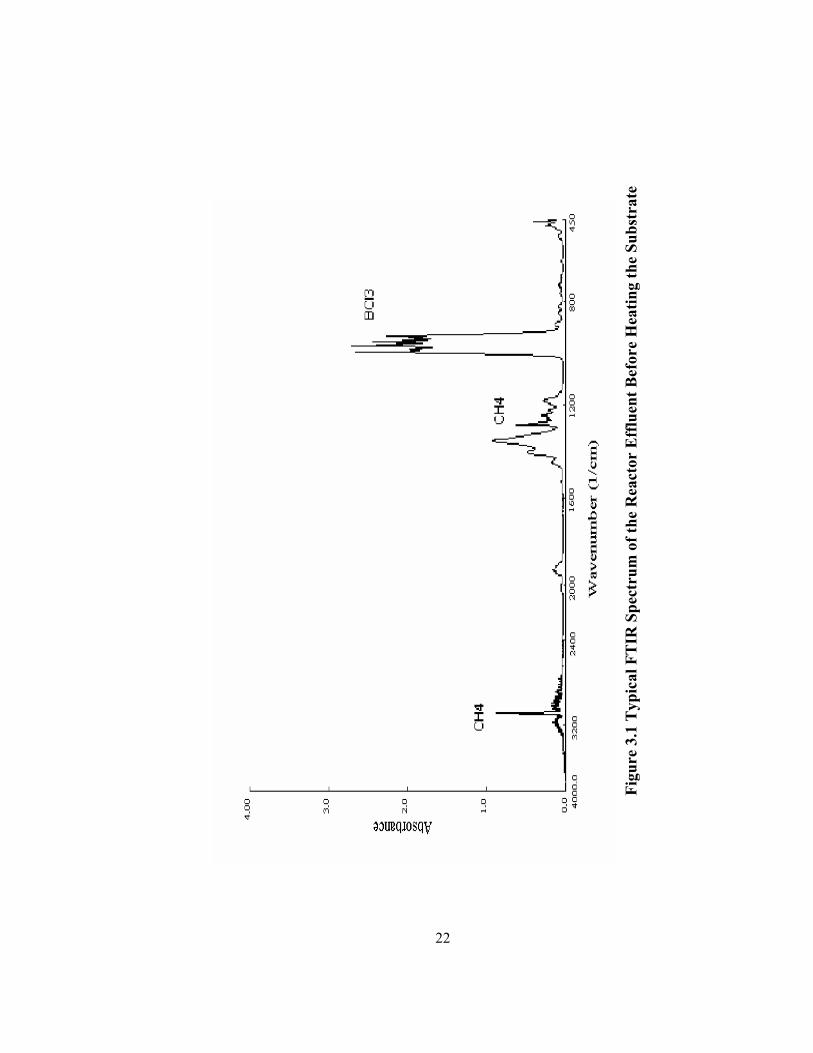
Figure 3.1 Typical FTIR Spectrum of the Reactor Effluent Before Heating the
Substrate ................................................................................................................ 22
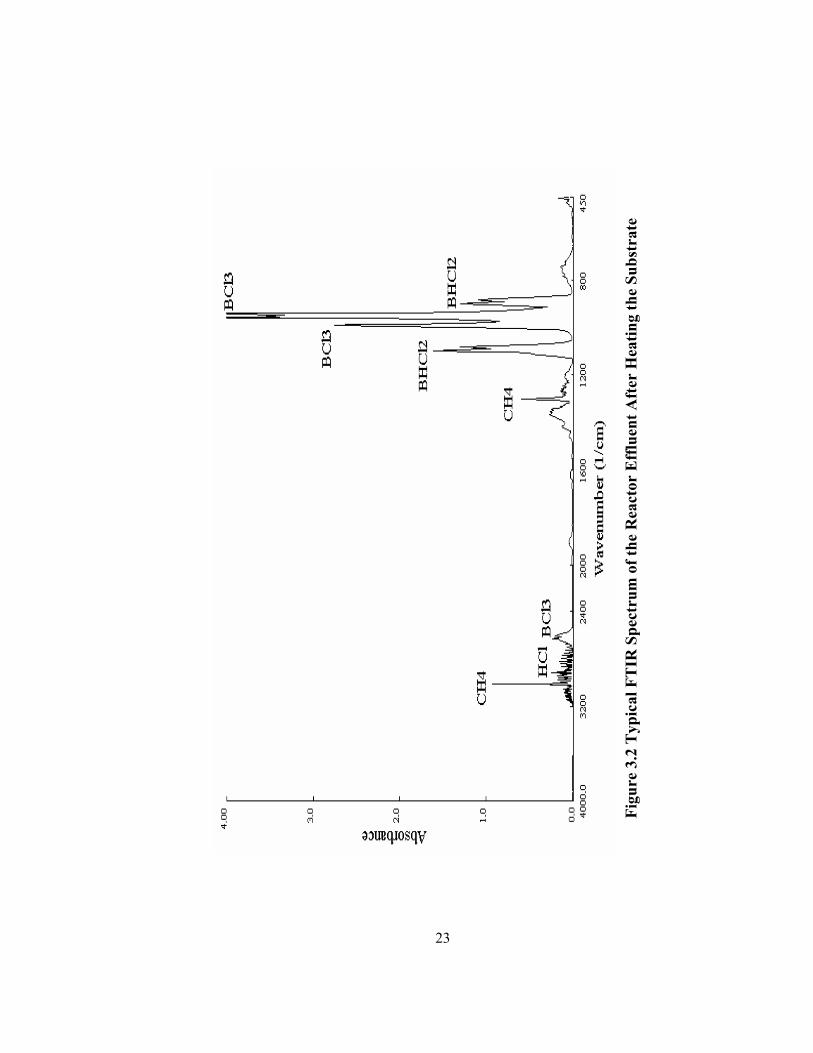
Figure 3.2 Typical FTIR Spectrum of the Reactor Effluent After Heating the
Substrate ................................................................................................................ 23
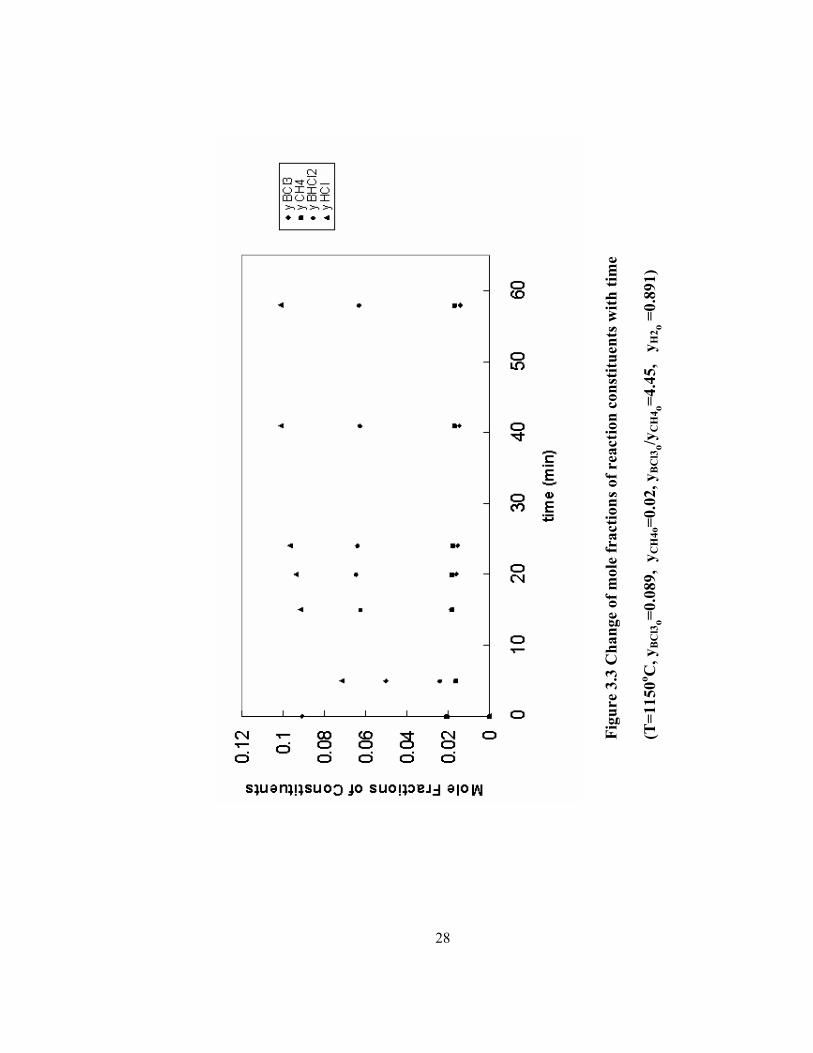
Figure 3.3 Change of mole fractions of reaction constituents with time (T=1150oC,
yBCl3o=0.089, yCH4o=0.02, yBCl3o
/yCH4o=4.45, yH2o
=0.891) ................................... 28
Figure 3.4 Comparison of the calculated B4C deposit weight (w) with the actual B4C
deposit weight (w*) ................................................................................................ 30
Figure 3.5 Effect of initial BCl3 mole fraction on the B4C and BHCl2 formation rates
with the standard deviations indicated by the error bars (yCH4o=0.02 in hydrogen,
yBCl3o/yCH4o
=1.5-5.5, T=1150oC) ............................................................................ 33
Figure 3.6 Effect of substrate temperature on B4C and BHCl2 formation rates with
the standard deviations indicated by the error bars (yBCl3o=0.081, yCH4o=0.02, in
hydrogen) .............................................................................................................. 34
Figure 3.7 Effect of initial CH4 mole fraction on B4C and BHCl2 formation rates with
the standard deviations indicated by the error bars (T=1150oC, yBCl3o
= 0.084 in
hydrogen) yBCl3o/yCH4o
=2-4.5) ............................................................................... 36

xvi
Figure 3.8 Effect of initial BCl3 (yCH4o=0.02, in hydrogen, T=1150
oC) (a) and CH4
(yBCl3o =0.084, in hydrogen, T=1150
oC) (b) mole fractions and temperature
(yBCl3o=0.081, yCH4o=0.02, in hydrogen) (c) on B4C formation rate with the standard
deviations indicated by the error bars and model predictions indicated by the dashed
lines ....................................................................................................................... 37
Figure 3.9 Effect of initial BCl3 mole fraction on B4C and BHCl2 selectivities
(yCH4o=0.02 in hydrogen, yBCl3o
/yCH4o=1.5-5.5, T=1150
oC)..................................... 39
Figure 3.10 Effect of initial CH4 mole fraction on B4C and BHCl2 selectivities (
T=1150oC, yBCl3o
= 0.084 in hydrogen ) ................................................................. 40
Figure 3.11 Effect of temperature on B4C and BHCl2 selectivities (yBCl3o=0.081,
yCH4o=0.02, in hydrogen)........................................................................................ 41
Figure 3.12 Effect of initial BCl3 mole fraction on B4C yield (yCH4o=0.02 in
hydrogen, yBCl3o/yCH4o
=1.5-5.5, T=1150oC)............................................................ 43
Figure 3.13 Effect of initial CH4 mole fraction on B4C yield ( T=1150oC, yBCl3o
=
0.084 in hydrogen )................................................................................................ 44
Figure 3.14 Effect of temperature on B4C yield (yBCl3o=0.081, yCH4o=0.02, in
hydrogen) .............................................................................................................. 45
Figure 3.15 Comparison of the effect of BCl3 inlet mole fractions on the observed
and Model 1 predicted formation rates of B4C (T=1150oC, y CH40=0.02 in hydrogen,
yBCl30/yCH40= 1.5- 5.5, simultaneous analysis)......................................................... 54
Figure 3.16 Comparison of the effect of CH4 inlet mole fractions on the observed and
Model 1 predicted formation rates of B4C (T=1150oC, y BCl30=0.084 in hydrogen,
yBCl30/yCH40=2-4.5, simultaneous analysis).............................................................. 55
Figure 3.17 Comparison of the effect of BCl3 inlet mole fractions on the observed
and Model 1 predicted formation rates of BHCl2 (T=1150oC, y CH40=0.02 in
hydrogen, yBCl30/yCH40= 1.5- 5.5, simultaneous analysis) ........................................ 56
Figure 3.18 Comparison of the effect of CH4 inlet mole fractions on the observed and
Model 1 predicted formation rates of BHCl2 (T=1150oC, y BCl30=0.084 in hydrogen,
yBCl30/yCH40=2-4.5, simultaneous analysis).............................................................. 57
xvii
Figure 3.19 Comparison of the effect of BCl3 inlet mole fractions on the observed
and Model 2 predicted formation rates of B4C (T=1150oC, y CH40=0.02 in hydrogen,
yBCl30/yCH40= 1.5- 5.5, simultaneous analysis)......................................................... 59
Figure 3.20 Comparison of the effect of CH4 inlet mole fractions on the observed and
Model 2 predicted formation rates of B4C (T=1150oC, y BCl30=0.084 in hydrogen,
yBCl30/yCH40=2-4.5, simultaneous analysis).............................................................. 60
Figure 3.21 Comparison of the effect of BCl3 inlet mole fractions on the observed
and Model 2 predicted formation rates of BHCl2 (T=1150oC, y CH40=0.02 in
hydrogen, yBCl30/yCH40= 1.5- 5.5, simultaneous analysis) ........................................ 61
Figure 3.22 Comparison of the effect of CH4 inlet mole fractions on the observed and
Model 2 predicted formation rates of BHCl2 (T=1150oC, y BCl30=0.084 in hydrogen,
yBCl30/yCH40=2-4.5, simultaneous analysis).............................................................. 62
Figure 3.23 Comparison of the effect of BCl3 inlet mole fractions on the observed
and Model 3 predicted formation rates of B4C (T=1150oC, y CH40=0.02 in hydrogen,
yBCl30/yCH40= 1.5- 5.5, simultaneous analysis)......................................................... 64
Figure 3.24 Comparison of the effect of CH4 inlet mole fractions on the observed and
Model 3 predicted formation rates of B4C (T=1150oC, y BCl30=0.084 in hydrogen,
yBCl30/yCH40=2-4.5, simultaneous analysis).............................................................. 65
Figure 3.25 Comparison of the effect of BCl3 inlet mole fractions on the observed
and Model 3 predicted formation rates of BHCl2 (T=1150oC, y CH40=0.02 in
hydrogen, yBCl30/yCH40= 1.5- 5.5, simultaneous analysis) ........................................ 66
Figure 3.26 Comparison of the effect of CH4 inlet mole fractions on the observed and
Model 3 predicted formation rates of BHCl2 (T=1150oC, y BCl30=0.084 in hydrogen,
yBCl30/yCH40=2-4.5, simultaneous analysis).............................................................. 67
Figure 3.27 Comparison of the effect of BCl3 inlet mole fractions on the observed
and Model 4 predicted formation rates of B4C (T=1150oC, y CH40=0.02 in hydrogen,
yBCl30/yCH40= 1.5- 5.5, simultaneous analysis)......................................................... 70
Figure 3.28 Comparison of the effect of CH4 inlet mole fractions on the observed and
Model 4 predicted formation rates of B4C (T=1150oC, y BCl30=0.084 in hydrogen,
yBCl30/yCH40=2-4.5, simultaneous analysis).............................................................. 71
xviii
Figure 3.29 Comparison of the effect of BCl3 inlet mole fractions on the observed
and Model 4 predicted formation rates of BHCl2 (T=1150oC, y CH40=0.02 in
hydrogen, yBCl30/yCH40= 1.5- 5.5, simultaneous analysis) ........................................ 72
Figure 3.30 Comparison of the effect of CH4 inlet mole fractions on the observed and
Model 4 predicted formation rates of BHCl2 (T=1150oC, y BCl30=0.084 in hydrogen,
yBCl30/yCH40=2-4.5, simultaneous analysis).............................................................. 73
Figure 3.31 Comparison of the effect of BCl3 inlet mole fractions on the observed
and Model 5 predicted formation rates of B4C (T=1150oC, y CH40=0.02 in hydrogen,
yBCl30/yCH40= 1.5- 5.5, simultaneous analysis)......................................................... 76
Figure 3.32 Comparison of the effect of CH4 inlet mole fractions on the observed and
Model 5 predicted formation rates of B4C (T=1150oC, y BCl30=0.084 in hydrogen,
yBCl30/yCH40=2-4.5, simultaneous analysis).............................................................. 77
Figure 3.33 Comparison of the effect of BCl3 inlet mole fractions on the observed
and Model 5 predicted formation rates of BHCl2 (T=1150oC, y CH40=0.02 in
hydrogen, yBCl30/yCH40= 1.5- 5.5, simultaneous analysis) ........................................ 78
Figure 3.34 Comparison of the effect of CH4 inlet mole fractions on the observed and
Model 5 predicted formation rates of BHCl2 (T=1150oC, y BCl30=0.084 in hydrogen,
yBCl30/yCH40=2-4.5, simultaneous analysis).............................................................. 79
Figure 3.35 Comparison of the effect of BCl3 inlet mole fractions on the observed
and Model 6 predicted formation rates of B4C (T=1150oC, y CH40=0.02 in hydrogen,
yBCl30/yCH40= 1.5- 5.5, simultaneous analysis)......................................................... 81
Figure 3.36 Comparison of the effect of CH4 inlet mole fractions on the observed and
Model 6 predicted formation rates of B4C (T=1150oC, y BCl30=0.084 in hydrogen,
yBCl30/yCH40=2-4.5, simultaneous analysis).............................................................. 82
Figure 3.37 Comparison of the effect of BCl3 inlet mole fractions on the observed
and Model 6 predicted formation rates of BHCl2 (T=1150oC, y CH40=0.02 in
hydrogen, yBCl30/yCH40= 1.5- 5.5, simultaneous analysis) ........................................ 83
Figure 3.38 Comparison of the effect of CH4 inlet mole fractions on the observed and
Model 6 predicted formation rates of BHCl2 (T=1150oC, y BCl30=0.084 in hydrogen,
yBCl30/yCH40=2-4.5, simultaneous analysis).............................................................. 84
xix
Figure 3.39 Comparison of the effect of BCl3 inlet mole fractions on the observed
and Model 7 predicted formation rates of B4C (T=1150oC, y CH40=0.02 in hydrogen,
yBCl30/yCH40= 1.5- 5.5, simultaneous analysis)......................................................... 86
Figure 3.40 Comparison of the effect of CH4 inlet mole fractions on the observed and
Model 7 predicted formation rates of B4C (T=1150oC, y BCl30=0.084 in hydrogen,
yBCl30/yCH40=2-4.5, simultaneous analysis).............................................................. 87
Figure 3.41 Comparison of the effect of BCl3 inlet mole fractions on the observed
and Model 7 predicted formation rates of BHCl2 (T=1150oC, y CH40=0.02 in
hydrogen, yBCl30/yCH40= 1.5- 5.5, simultaneous analysis) ........................................ 88
Figure 3.42 Comparison of the effect of CH4 inlet mole fractions on the observed and
Model 7 predicted formation rates of BHCl2 (T=1150oC, y BCl30=0.084 in hydrogen,
yBCl30/yCH40=2-4.5, simultaneous analysis).............................................................. 89
Figure 3.43 Comparison of the effect of BCl3 inlet mole fractions on the observed
and Model 8 predicted formation rates of B4C (T=1150oC, y CH40=0.02 in hydrogen,
yBCl30/yCH40= 1.5- 5.5, simultaneous analysis)......................................................... 92
Figure 3.44 Comparison of the effect of CH4 inlet mole fractions on the observed and
Model 8 predicted formation rates of B4C (T=1150oC, y BCl30=0.084 in hydrogen,
yBCl30/yCH40=2-4.5, simultaneous analysis).............................................................. 93
Figure 3.45 Comparison of the effect of BCl3 inlet mole fractions on the observed
and Model 8 predicted formation rates of BHCl2 (T=1150oC, y CH40=0.02 in
hydrogen, yBCl30/yCH40= 1.5- 5.5, simultaneous analysis) ........................................ 94
Figure 3.46 Comparison of the effect of CH4 inlet mole fractions on the observed and
Model 8 predicted formation rates of BHCl2 (T=1150oC, y BCl30=0.084 in hydrogen,
yBCl30/yCH40=2-4.5, simultaneous analysis).............................................................. 95
Figure 3.47 Comparison of the effect of BCl3 inlet mole fractions on the observed
and Model 9 predicted formation rates of B4C (T=1150oC, y CH40=0.02 in hydrogen,
yBCl30/yCH40= 1.5- 5.5, simultaneous analysis)......................................................... 97
Figure 3.48 Comparison of the effect of CH4 inlet mole fractions on the observed and
Model 9 predicted formation rates of B4C (T=1150oC, y BCl30=0.084 in hydrogen,
yBCl30/yCH40=2-4.5, simultaneous analysis).............................................................. 98

xx
Figure 3.49 Comparison of the effect of BCl3 inlet mole fractions on the observed
and Model 9 predicted formation rates of BHCl2 (T=1150oC, y CH40=0.02 in
hydrogen, yBCl30/yCH40= 1.5- 5.5, simultaneous analysis) ........................................ 99
Figure 3.50 Comparison of the effect of CH4 inlet mole fractions on the observed and
Model 9 predicted formation rates of BHCl2 (T=1150oC, y BCl30=0.084 in hydrogen,
yBCl30/yCH40=2-4.5, simultaneous analysis).............................................................100
Figure 3.51 Comparison of the effect of BCl3 inlet mole fractions on the observed
and Model 10 predicted formation rates of B4C (T=1150oC, y CH40=0.02 in
hydrogen, yBCl30/yCH40= 1.5- 5.5, simultaneous analysis) .......................................102
Figure 3.52 Comparison of the effect of CH4 inlet mole fractions on the observed and
Model 10 predicted formation rates of B4C (T=1150oC, y BCl30=0.084 in hydrogen,
yBCl30/yCH40=2-4.5, simultaneous analysis).............................................................103
Figure 3.53 Comparison of the effect of BCl3 inlet mole fractions on the observed
and Model 10 predicted formation rates of BHCl2 (T=1150oC, y CH40=0.02 in
hydrogen, yBCl30/yCH40= 1.5- 5.5, simultaneous analysis) .......................................104
Figure 3.54 Comparison of the effect of CH4 inlet mole fractions on the observed and
Model 10 predicted formation rates of BHCl2 (T=1150oC, y BCl30=0.084 in
hydrogen, yBCl30/yCH40=2-4.5, simultaneous analysis) ............................................105
Figure 3.55 Comparison of reaction rates pedicted by reaction mechanism model 10
and Arrhenius equation with the experimental data ...............................................111
Figure 3.56 XPS survey scan for boron carbide produced at 11500C with initial
boron trichloride to methane molar ratio of 4.0 in hydrogen ..................................113
Figure 3.57 XPS spectra of the produced solid phase before (circles) and after (dots)
the sputtering process and spectrum deconvolutions (deconvoluted components
(dashed lines), fitted results (solid lines)) (T=1150oC, yBCl3/yCH4=4.0 in hydrogen)
.............................................................................................................................114
Figure 3.58 X-ray diffraction patterns of the samples produced at different substrate
temperatures under atmospheric conditions with initial boron trichloride to methane
molar ratio of 4.0 and with a temperature of; a) 1300oC, b) 1200
oC, c) 1100
oC .....116

xxi
Figure 3.59 SEM images of the samples produced at different temperatures (P=1
atm., yCH4/yBCl3=0.25 in hydrogen at reactor inlet) a) 1100oC; b) 1200
oC; c) 1300
oC
.............................................................................................................................119
Figure 3.60 Vickers Hardness Test........................................................................121
Figure A-1 FTIR Calibration Curve for Methane (Wavenumber: 3183 cm-1
).........130
Figure A-2 FTIR Calibration Curve for Boron Trichloride (Wavenumber: 1040-920
cm-1
) .....................................................................................................................132
Figure A-3 FTIR Calibration Curve for Hydrochloric Acid (Wavenumber: 2789 cm-
1)...........................................................................................................................134
Figure E.1 Schematic representation of jet impingement on the flat surface ..........161
Figure E.2 Temperature profile in the vicinity of the heated substrate surface at 1150
oC (x: distance along the surface;z: distance from the surface)...............................168
Figure G.1 Temperature dependence of chemical equilibrium constants for boron
carbide and dichloroborane formation reactions ....................................................175

xxii
LIST OF SYMBOLS
A Substrate surface area
Ac Crossectional area of the nozzle
cp Specific heat (kJ/kg-K)
d Distance between the crystallographic planes
D The edge length of indentation in mm
Dh Hydraulic diameter of the nozzle
Ea Activation energy (kjoule/mol)
F Force applied in kilograms-force
Fi Molar flow rate of species i to the reactor (mol/min)
fi Fraction of adsorption sites occupied by species i
h Convection heat transfer coefficient
H FTIR Peak Height
H Distance between nozzle and the substrate surface in the reactor (m)
HV Vickers number
k Thermal conductivity (W/m-K)
ki Rate constant of reaction i
Ki Adsorption equilibrium constant of reaction i
ko Frequency factor
Kp Chemical equilibrium constant
Mi Molecular weight of species i (grams/mol)
N Number
Nu Nusselt number
Pi Partial pressure of species i
Pr Prandtl number
''q Heat flux

xxiii
q Heat transfer rate
R Reaction rate (g-mole/min)
R Correlation Coefficient
Re Reynolds number
s Adsorption site
S Sample standard deviation
Si Selectivity of the of species i
t Time (min)
t Student’s t
Tm Mean temperature
Vi Velocity in the i direction
VT Volumetric flow rate (cm3/min)
w Weight (grams)
x Conversion
X Sample mean
yi Mole fraction of a species i
zk The core length
α Thermal diffusivity (m2/s)
δ Boundary layer thickness
ΔH Heat of formation (J/mole)
Θ Bragg angle (Half the Diffraction Angle)
μ Viscosity (Ns/m2)
confidence interval
ρ Density (kg/m3)
ν Degrees of freedom
υ Kinematic viscosity (m2/s)

1
CHAPTER 1
INTRODUCTION
Boron carbide is an important non-metallic material with useful
physical and chemical properties. After the cubic boron nitride, it is
the hardest boron containing compound. Its high melting point, high
modulus of elasticity, large neutron capture section, low density,
chemical inertness, outstanding thermal and electrical properties make
boron carbide a strong candidate for high technology applications. In
comparison with other refractory materials, such as diamond, silicon
carbide, boron nitride, alumina, relatively little effort has been put into
studying and developing boron carbide deposition methods. This has
started to change in recent years due to the need of high quality boron
carbide based materials especially in microelectronics, nuclear
military, space and medical industries [1].
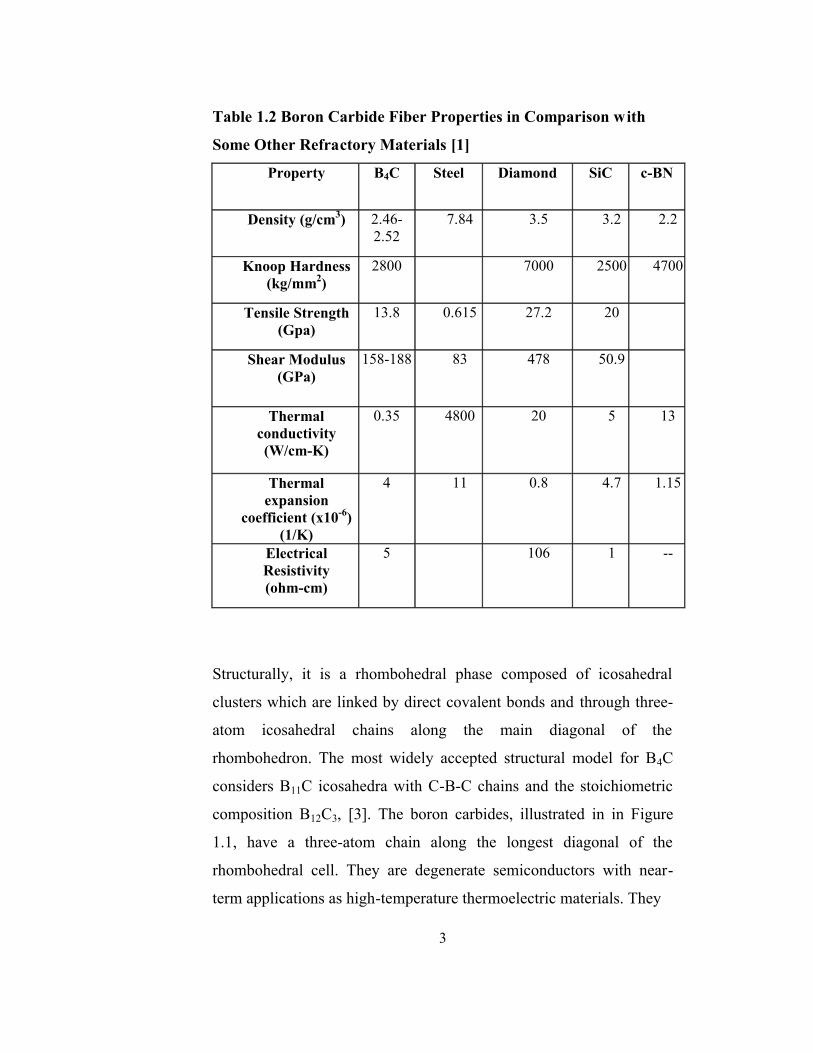
The physical properties of boron carbide are given in Table 1.1. The
fiber properties of boron carbide in comparison with some other
refractory materials are given in Table 1.2. As can bee seen in Table
1.2, boron carbide is the third hardest material at room temperature
suppressed only by diamond and cubic boron nitride. However, the
2
hardness of diamond and cubic boron nitride gradually decreases at
high temperatures.
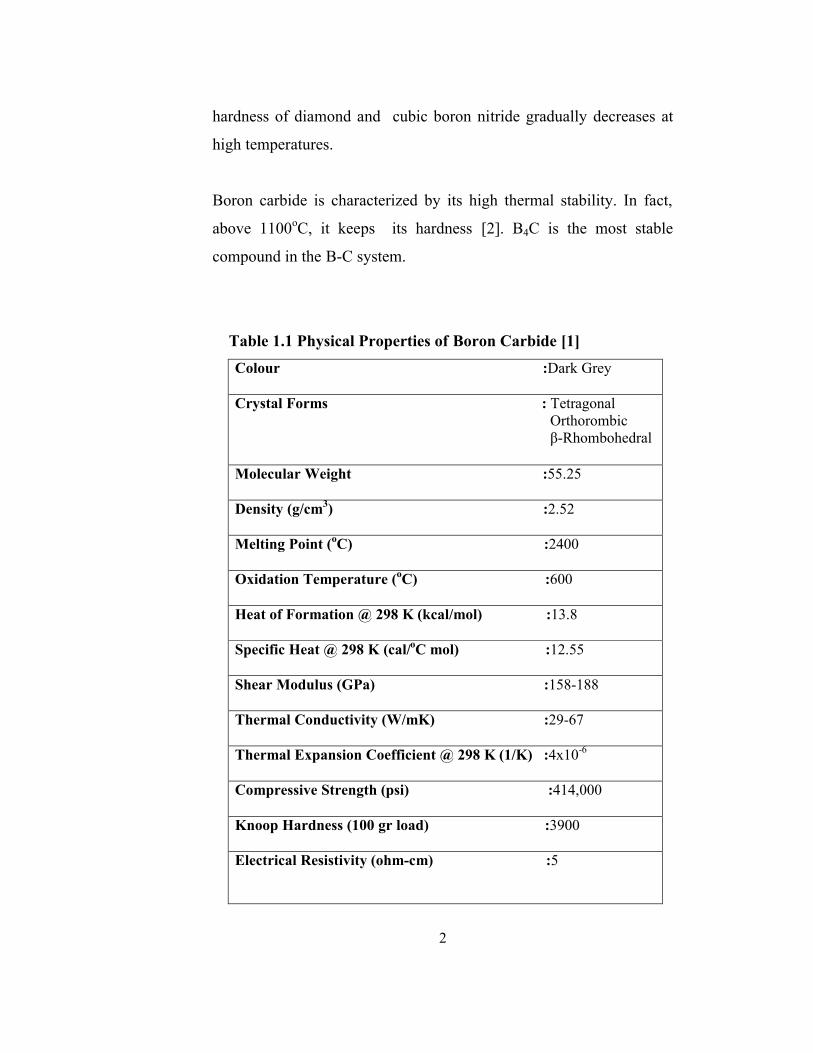
Boron carbide is characterized by its high thermal stability. In fact,
above 1100oC, it keeps its hardness [2]. B4C is the most stable
compound in the B-C system.
Table 1.1 Physical Properties of Boron Carbide [1]
Colour :Dark Grey
Crystal Forms : Tetragonal
Orthorombic
β-Rhombohedral
Molecular Weight :55.25
Density (g/cm3) :2.52
Melting Point (oC) :2400
Oxidation Temperature (oC) :600
Heat of Formation @ 298 K (kcal/mol) :13.8
Specific Heat @ 298 K (cal/oC mol) :12.55
Shear Modulus (GPa) :158-188
Thermal Conductivity (W/mK) :29-67
Thermal Expansion Coefficient @ 298 K (1/K) :4x10⁻⁶
Compressive Strength (psi) :414,000
Knoop Hardness (100 gr load) :3900
Electrical Resistivity (ohm-cm) :5
3
Table 1.2 Boron Carbide Fiber Properties in Comparison with
Some Other Refractory Materials [1]
Property B4C Steel Diamond SiC c-BN
Density (g/cm3) 2.46-
2.52
7.84 3.5 3.2 2.2
Knoop Hardness
(kg/mm2)
2800 7000 2500 4700
Tensile Strength
(Gpa)
13.8 0.615 27.2 20
Shear Modulus
(GPa)
158-188 83 478 50.9
Thermal
conductivity
(W/cm-K)
0.35 4800 20 5 13
Thermal
expansion
coefficient (x10-6
)
(1/K)
4 11 0.8 4.7 1.15
Electrical
Resistivity
(ohm-cm)
5 106 1 --
Structurally, it is a rhombohedral phase composed of icosahedral
clusters which are linked by direct covalent bonds and through three-
atom icosahedral chains along the main diagonal of the
rhombohedron. The most widely accepted structural model for B4C
considers B11C icosahedra with C-B-C chains and the stoichiometric
composition B12C3, [3]. The boron carbides, illustrated in in Figure
1.1, have a three-atom chain along the longest diagonal of the
rhombohedral cell. They are degenerate semiconductors with near-
term applications as high-temperature thermoelectric materials. They

4
Figure 1.1 The rhombohedral crystal structure of boron carbides.
Atoms are placed at the vertices of the icosahedra and within the
three-atom intericosahedral chain
exist as a single-phase material from about 8 to 20 percent atomic
carbon.
This large range of carbon composition is due to replacement of boron
atoms with carbon atoms within the icosahedral chains and the
icosahedra. However, there persists uncertainity as to the location of
the carbon atoms within the unit cell of any given composition [4].
Boron carbide was first prepared by Joly in 1883, but the
stoichiometric composition, known as ‘technical boron carbide’, was
not assigned until 1934. The interest in boron carbide microelectronic
devices and high temperature thermoelectronic conversion devices
5
started in the 1950’s. In almost all early attempts to fabricate
electronic quality boron carbides, the materials exhibited low
resistivity and therefore their use in microelectronic applications was
limited. It is produced in industrial quantities by reduction of boron
anhydrides, hot pressing, and presureless sintering. Pyrolysis of
organics, physical vapor deposition (PVD), and the chemical vapor
deposition (CVD) are frequently used to prepare boron carbides in the
laboratory. The PVD methods are often expensive and boron carbide
targets difficult to work with. On the other hand, CVD offers the
advantage of better controlled deposition of well-defined , high purity
single phase boron carbides [1].
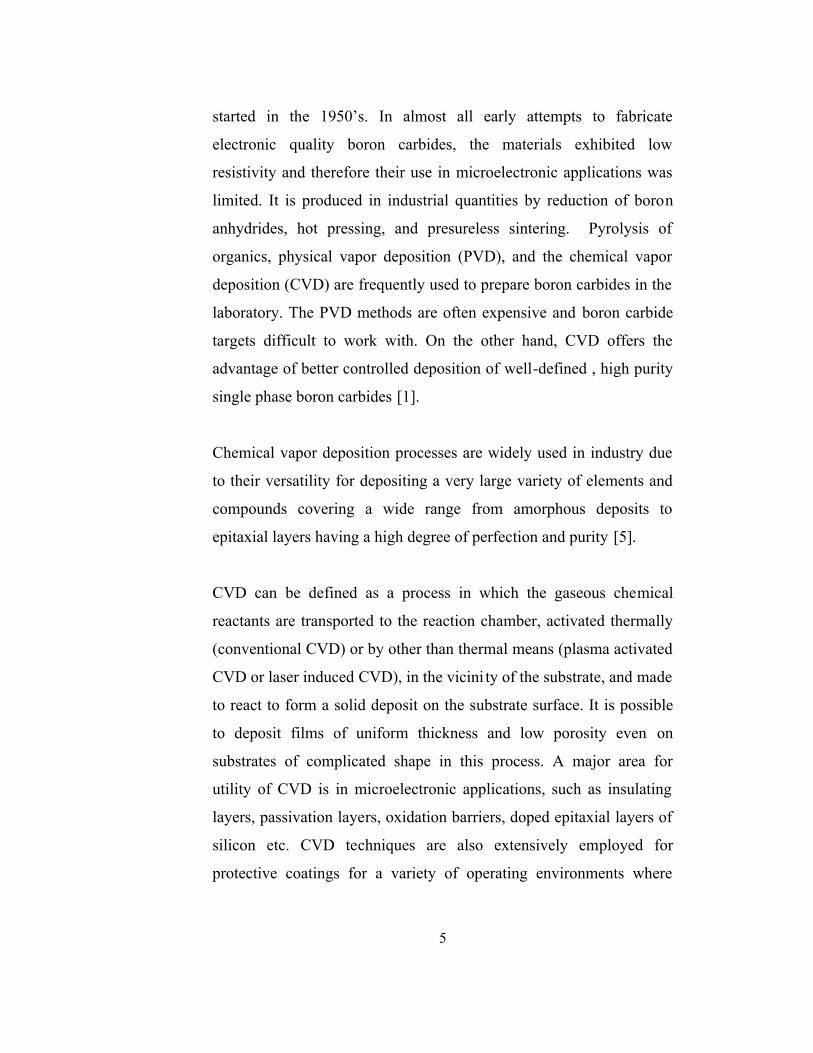
Chemical vapor deposition processes are widely used in industry due
to their versatility for depositing a very large variety of elements and
compounds covering a wide range from amorphous deposits to
epitaxial layers having a high degree of perfection and purity [5].
CVD can be defined as a process in which the gaseous chemical
reactants are transported to the reaction chamber, activated thermally
(conventional CVD) or by other than thermal means (plasma activated
CVD or laser induced CVD), in the vicini ty of the substrate, and made
to react to form a solid deposit on the substrate surface. It is possible
to deposit films of uniform thickness and low porosity even on
substrates of complicated shape in this process. A major area for
utility of CVD is in microelectronic applications, such as insulating
layers, passivation layers, oxidation barriers, doped epitaxial layers of
silicon etc. CVD techniques are also extensively employed for
protective coatings for a variety of operating environments where
6
protection is required against wear, erosion, and high temperature
oxidation [5].
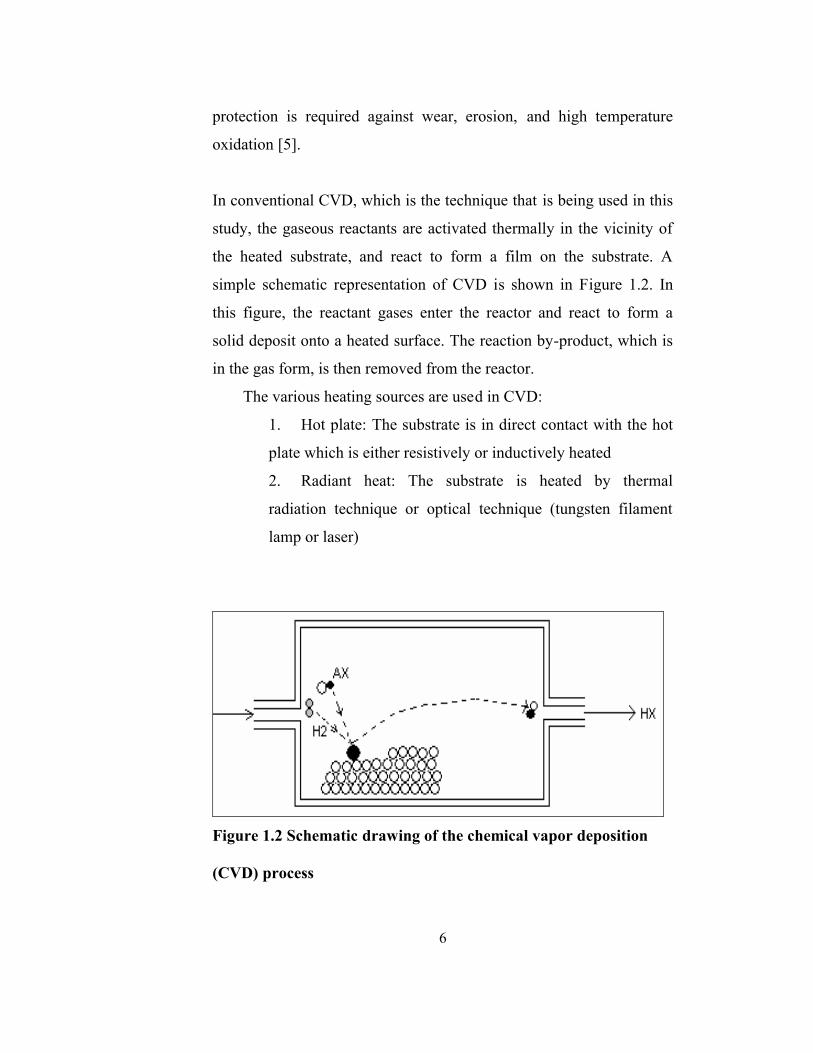
In conventional CVD, which is the technique that is being used in this
study, the gaseous reactants are activated thermally in the vicinity of
the heated substrate, and react to form a film on the substrate. A
simple schematic representation of CVD is shown in Figure 1.2. In
this figure, the reactant gases enter the reactor and react to form a
solid deposit onto a heated surface. The reaction by-product, which is
in the gas form, is then removed from the reactor.
The various heating sources are used in CVD:
1. Hot plate: The substrate is in direct contact with the hot
plate which is either resistively or inductively heated
2. Radiant heat: The substrate is heated by thermal
radiation technique or optical technique (tungsten filament
lamp or laser)
Figure 1.2 Schematic drawing of the chemical vapor deposition
(CVD) process
7
3. Heating of a conductive substrate: Conductive substrates
can be heated resistively or by RF induction.
The logical approach to the development of a CVD coating is to first
determine the feasibility of a particular coating system. The process
itself is basically governed by the following two important
mechanisms:
Thermodynamics which determines driving force and
Kinetics which determines the rate control of the chemical
reactions
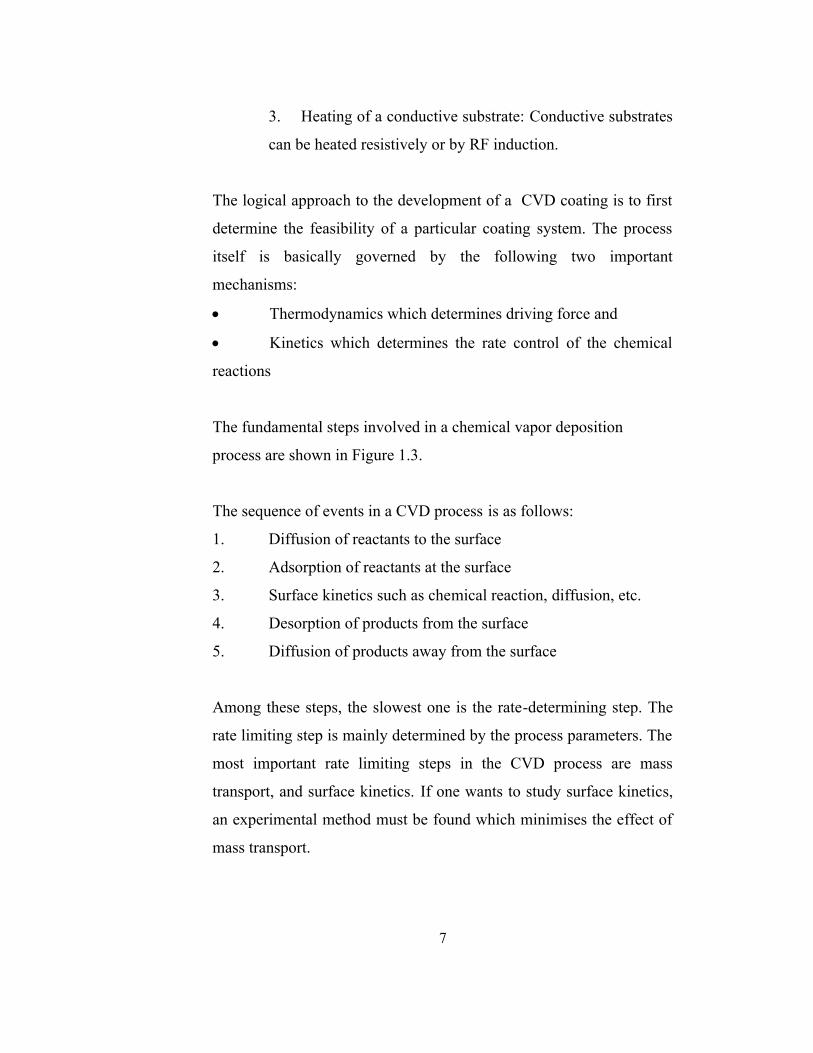
The fundamental steps involved in a chemical vapor deposition
process are shown in Figure 1.3.
The sequence of events in a CVD process is as follows:
1. Diffusion of reactants to the surface
2. Adsorption of reactants at the surface
3. Surface kinetics such as chemical reaction, diffusion, etc.
4. Desorption of products from the surface
5. Diffusion of products away from the surface
Among these steps, the slowest one is the rate-determining step. The
rate limiting step is mainly determined by the process parameters. The
most important rate limiting steps in the CVD process are mass
transport, and surface kinetics. If one wants to study surface kinetics,
an experimental method must be found which minimises the effect of
mass transport.
8
Figure 1.3 Various fundamental steps involved in a chemical
vapor deposition process
Because of the need for high quality and pure products and a well
controlled process, chemical vapor deposition was selected to be the
best method to produce boron carbide. Some other production
methods are thermal decomposition of boronyl pyridine (BOC5H5N),
reduction of boron anhydride (B2O3) and reduction of boric acid
(H3BO3) with lamp black. In all of these methods, boron carbide is
produced in powder form and contains excess amount of carbon. Such
methods are followed by hot pressing of the produced boron carbide
powder. These high temperature and complex processes result in
impure and mechanically poor products.
CVD studies made so far showed that high rates of deposition results
in non-uniform surfaces with possible cracks. It must be noted that
slow production rates are not desirable in industry. Therefore an
optimum deposition rate must be found for uniform deposits. That can

9
be achieved by finding out the dependence of deposition rates on the
process parameters.
In chemical vapor deposition process, various reactant gas mixtures
containing boron, hydrogen, carbon and halogen gases can be used to
deposit boron carbide on various substrates. Several reaction gas
mixtures are BI3-CH4, BCl3-CH4-H2, BBr3-CH4-H2, and BCl3-CCl4-
H2. The rhombohedral boron carbide can be deposited from these
reaction gas mixtures over broad temperature and vapour composition
ranges [6].
1.1. Literature Survey on CVD of Boron Carbide
Due to its outstanding properties, boron carbide has been the subject
of many investigations. The necessity for producing such a high
quality material with a well controlled process resulted in the
application of chemical vapor deposition in this area.
Cochran et al. [7] deposited boron carbide on to a variety of substrates
at 1300oC by using methane, boron trichloride and hydrogen as feed
gases. When stoichiometric amounts of CH4 and BCl3 were reacted
with an excess of H2 at 1300oC, B4C deposits were obtained. The
excess CH4 in the reaction mixture resulted in free carbon. Also
tungsten and graphite was found to be the best substrates considering
the adherence of the deposits formed. No reaction between tungsten
and boron deposit were detected either spectroscopically or visually,
tungsten was the most desirable substrate tested.

10
Ploog [8] deposited boron carbide on tantalum and boron nitride
substrates by CVD method in a non-flow reactor from BBr3, CH4, and
H2. Tetragonal, orthorombic and rhombohedral boron carbides were
obtained at different temperature, pressure and reactant gas
compositions. The lattice parameters and crystal structures of the
formed crystal phases were investigated in detail.
Jansson [9] studied CVD of boron carbide in a temperature range of
1300-1500 K at a total pressure of 50 torr, using boron trichloride,
methane and hydrogen as reactant gases in a cold wall reactor. CVD
phase diagram of the produced B-C system was obtained and using X-
ray powder diffraction analysis, cell parameters for the produced
phases were determined. It was observed that the carbon content in the
coatings increased with an increase in temperature.
Vandenbulcke [10] deposited boron carbide from a BCl3-CH4-H2
mixture by using a stagnation flow technique in a cold wall reactor.
The deposition rates and the solid compositions are compared with a
mass transfer equilibrium model. Also deposition domains of the
various structures as a function of reaction parameters (temperature
and partial pressures of reaction precursors) were obtained. At various
combinations of methane and borontrichloride within an excess
hydrogen, single phase boron carbide was obtained through a wide
range of temperature(1400-1900 K).
Grigorev et al. [11] studied the deposition of B4C from a BCl3-C7H8-
H2 mixture on to a heated tungsten filament in a non-flow reactor at a
total pressure of 0.33 atm. The experimental results were compared
with the thermodynamic calculations, which were based on Gibbs

11
phase rule. It was shown that the dependence of the composition of
the inlet gas mixture on the deposition products is complex and it is
possible to establish various means to control the deposition process.
Desphande et al. [12] deposited amorphous boron carbide thin films
using hot filament activated CVD at low temperature. Boron
trichloride and methane were used with hydrogen as reactant gases.
Films were characterized by FTIR, X-Ray photoelectron
spectroscopy, XRD, adhesion testing and SEM. High purity,
amorphous boron carbide films were obtained using chlorine based
precursor BCl3.
Conde et al. [13] synthesized boron carbide on fused silica substrates
by laser-assisted chemical vapor deposition, using CO 2 laser beam and
boron trichloride and methane as precursors. The deposited films
presented good adherence, a fine grain morphology and a mean carbon
concentration in the range from 9 to 20 atomic percent. The crystal
lattice parameters of rhombohedral-hexagonal boron carbide deposits
were obtained. Such parameters were plotted against carbon content
and a non-linear behaviour was observed, which shows a complex
structure of produced boron carbides.
Dilek et al. [14] studied the CVD of B4C on a tungsten filament from
a gas mixture of BCl3,CH4 and H2 in an impinging jet reactor. The
formation of BHCl2 was verified experimentally and a rate expression
for the formation of B4C was proposed. However, the reaction rate
expression was based on the boron trichloride to methane molar ratio
rather than the concentrations of these species.

12
1.2. Objective of the Present Work
Most of the previous studies on CVD of boron carbide consider only
the morphology of the deposited products. Usually, the deposition
rates have been determined from the thickness of the deposits divided
by the deposition time, using cross sectional scanning electron
microscopy. Only in one work, a chemical kinetic analysis of the
deposition process was carried out, but experiments were carried out
using narrow inlet gas composition ranges. Also, there is not any
proposed mechanism for the CVD of boron carbide process.
Considering such deficiencies in literature, the objectives of the
present study can be listed as follows;
To construct a CVD reactor in which diffusion effects are
minimised
To obtain kinetic information about the CVD of boron carbide
from boron trichloride, hydrogen and methane following the chemical
analysis of the product stream
To get information about the reaction rates and selectivity of
the boron carbide deposition reaction
To investigate the influence of inlet gas composition and the
substrate temperature on the kinetics of CVD of boron carbide
To propose a reaction mechanism for CVD of boron carbide
and develop the corresponding rate expressions
To find out the dependence of physical properties (morphology
and hardness) of B4C deposited on the substrate temperature

13
CHAPTER 2
EXPERIMENTAL
There is a variety of fundamental physical and chemical principles
that can control the deposition rate and quality of a film resulting from
a CVD process. The basic processes underlying CVD can be
subdivided into mass transport effects and chemical effects, each of
which can occur both in the gas and solid phases. In some cases, a
particular effect can be seperated out as rate limiting, and a CVD
process can be said to be ‘mass-transport controlled’ or ‘surface
kinetics controlled’.
In this work, the chemical kinetics of the B4C deposition on the
tungsten substrates is being studied. So that, the influence of the mass
transport limitations on the reaction rates should be minimised. In
order to minimise mass transport effects, an impinging jet reactor is
used, which was designed previously by Sezgi et al. [15] to study the
CVD of boron (Figure 2.1). In Appendix E.3, it was shown that, the
use of impinging jet geometry decreased the mass transfer boundary
layer thickness around 30 fold, compared to the parallel flow
geometry.

14
Figure 2.1 Dual Impinging-Jet Chemical Vapor Deposition Reactor

15
Fig
ure
2.2
Ex
per
imen
tal
Set
-Up

16
2.1 Experimental Set-up
The schematic drawing of the experimental system is shown in Figure
2.2. The system utilized in this study is similar to the one used by
Sezgi et. al. [15]. The dual impiging jet reactor (Figure 2.1) is placed
in a closed plexiglass cell considering the fact that boron trichloride is
a highly toxic gas. The plexiglass cell is continuously vented during
the experiments so that in case of any leakage from the reactor, the
dangerous reactant gases could be removed from the medium. Also
the part of the experimental system, which contains the pipes,
plexiglass cell containing the reactor, and the gas tubes were placed in
a vented room for safety reasons. The control equipment, that are
mass flow controllers, rotameter and the computer, were placed in the
control room, that is seperated from the vented room by a small
window. So that, in case of any danger in the vented room, the flow of
the explosive gases, which are methane and hydrogen, can be stopped
immediately. Reactor effluents were sent to a gas trap which is placed
on line after FTIR spectrophotometer.
The reactor was made of quartz because of the durability of this
material at high temperatures. In this reactor, the inlet gas mixture is
fed through two orifices and impinges parpendicularly on to the both
sides of the substrate. The orifices and the substrate are placed in the
middle of the reactor. The diameter of the reactor is 1 cm whereas the
diameter of the orifices are 1 mm. The distance between the orifices
and the substrate surface is 0.5 cm.
The reactant gases were boron trichloride, methane and hydrogen.
Helium was used in order to purge the system before and after each
17
run. Flowrates of boron trichloride, hydrogen and helium were
controlled using mass flow controllers (Aalborg GFC-171 model), and
flowrate of methane was adjusted by a rotameter. Hydrogen and
methane gases were mixed in a cross, that is located in the piping
system before the impinging jet reactor. Boron trichloride is added to
the reactant gas mixture through a tee. The piping system in which the
gases flow was made up of ¼ inch brass tubes. The boiling point of
BCl3 is 13.2 oC at 1 atm pressure. In order to avoid condensation of
BCl3, boron trichloride line in the piping system, from the BCl3 tube
exit to the mixing tee, and FTIR gas cell are heated by wrapping
heating tapes around them. The FTIR gas cell temperature was kept at
110oC during the experiments. After the mixing, the reactant gases are
fed to the reactor through the orifices and thus strike on both sides of
the tungsten substrate as a jet. The tungsten substrate was held
hanging vertically between two electrodes which were connected to
DC power supply (KIKUSUI Electronics PAD 16-30L). The upper
electrode was fixed and the lower one was dipped into the mercury
pool. The weight of the lower electrode keeps the substrate surface
smooth and streched. The temperature of the substrate surface was
measured continuously by using an optical pyrometer. The use of
quartz as a reactor material provided the visual accsess to the substrate
material so that the temperature measurements were made possible.
The temperature of the substrate varied 10oC throughout the surface
during the experiments. For that reason, temperature measurements
were carried out at three different points (top, middle and bottom parts
of the substrate) and arithmetic averages were accepted as the actual
temperature values. Also, in order to measure the reactor outlet
temperature, a Cr-Ni thermocouple (K-Type) was connected to the
reactor outlet.

18
The on-line chemical analysis of the reactor effluent was done by
using a Perkin Elmer Spectrum One model Fourier Transform Infrared
Spectrometer equipped with a Specac Sirocco Series heatable gas cell .
The pathlength of the IR beam in the gas cell was variable which
allowed the adjustment of best pathlength value for the specific
experimental requirements. For the composition ranges utilized in this
study a pathlength value of 8 meters was adjusted. In order to obtain
quantitative information on the compositions of the reactor inlet and
outlet streams, the FTIR spectra of methane, boron trichloride and
hydrochloric acid were calibrated, before starting actual experiments.
The calibration methods, together with the calibration curves are given
in Appendix A.
To test the reliability of the experimental data, reproducibility
experiment were carried out, and the standard deviations were
calculated accordingly. Details of the experiments and calculation
procedure were presented in Appendix F.
2.2 Experimental Procedure
The experimental parameters were the inlet mole fractions of methane
and boron trichloride and the temperature of the tungsten substrate.
The numerical values of the parameters for the runs conducted in this
study are listed in Table 2.1. The first step in the experimental work
was the preperation of the tungsten substrate at the desired
dimensions. The width, height, and thickness of the tungsten
substrates were 2.2 mm, 3 cm, and 0.015 mm, respectively. After that,
the substrate must be weighed precisely and placed in the impinging
jet reactor. Before each run, the experimental system should be purged
with helium gas in order to remove impurities and excess oxygen in
19
the system. Otherwise, oxygen may react dangerously with hydrogen,
which is one of the reactant gases, causing severe explosions.
The desired flowrates of methane, hydrogen, and boron trichloride
were adjusted first. The total flowrate of the gas mixture was kept
constant around 200 cm3/min in all runs. The composition of the
initial gas mixture was inspected continuously by FTIR and hence
desired adjustments on the compositions were possible. After the
composition adjustment, the tungsten substrate was heated up to the
desired temperature resistively by the DC power supply. The heating
of the substrate was carried out in a step-by-step manner, with 100oC
temperature increments per minute. Also, since the deposition of
boron carbide on the substrate surface changes the resistivity, voltage-
current adjustments of the DC power supply were necessary to keep
the temperature of the substrate constant. Depending on the target
temperature in a specific run, the current values varied between 10-25
amperes and the voltage values were varied berween 8-15 volts. After
the system reaches steady state, and the steady state concentrations of
the gases were determined from the FTIR spectra. The temperature of
the reactor effluent stream was recorded at the end of each run, and
then the whole system was purged with helium gas. Finally, produced
boron carbide deposits were removed from the reactor and weighed
again precisely.

20
Table 2.1 Experimental Conditions in the Applied Runs
Run Temperature(oC) yCH4o yBCl3o yH2o Duration
(min)
MEA 1150 0.01875 0.084 0.89725 62
MEB 1150 0.0387 0.084 0.8773 70
MED 1150 0.0423 0.084 0.8737 73
MEE 1150 0.0309 0.084 0.8851 66
MEF 1150 0.0241 0.084 0.8919 49
BCl3B 1150 0.0195 0.1181 0.8624 72
BCl3C 1150 0.01989 0.0411 0.93901 63
BCl3D 1150 0.01997 0.0894 0.89063 63
BCl3E 1150 0.0198 0.02287 0.95733 47
BCl3F 1150 0.0195 0.0761 0.9044 54
BCl3G 1150 0.02026 0.03017 0.94957 50
TEA 1000 0.02085 0.08412 0.8977 59
TEB 1100 0.02085 0.08145 0.8977 54
TEC 1200 0.02055 0.08038 0.8980 46
TED 1300 0.02031 0.08145 0.8982 53
TEE 1050 0.02055 0.08011 0.8980 50
TEF 1400 0.02070 0.08145 0.8979 27
21
CHAPTER 3
RESULTS AND DISCUSSIONS
3.1. Spectrophotometric Analysis of the Reactor Effluent
The FTIR spectra of the reactor effluent stream were taken continually
with 5-minute time intervals during the experiments. From the
obtained spectrum, it was possible to reveal the information on both
the identity and amount of a constiuent within the reactor outlet
stream. Typical FTIR spectra of the reactor effluent stream, before and
after heating the substrate, taken during a typical experiment are given
in Figures 3.1 and 3.2, respectively. The FTIR spectrum given in
Figure 3.1 was obtained when the tungsten foil was cold, hence the
only detectable peaks belong to the reactor inlet gases, namely,
methane and boron trichloride (hydrogen cannot be detected by FTIR
since its dipole moment is zero). After heating the substrate to the
desired reaction temperature, in addition to the peaks of methane and
boron trichloride, characteristic peaks of hydrochloric acid and
dichloroborane appear immediately. The FTIR spectrum of the reactor
outlet stream after heating the tungsten substrate is given in Figure
3.2, and all of the four constituents can be seen in this figure. The
peak groups which are characteristic to any constituent in the effluent
22
Fig
ure
3.1
Ty
pic
al
FT
IR S
pec
tru
m o
f th
e R
eact
or
Eff
luen
t B
efo
re
Hea
tin
g t
he
Su
bst
rate
23
Fig
ure
3.2
Ty
pic
al
FT
IR S
pec
tru
m o
f th
e R
eact
or
Eff
luen
t A
fter
Hea
tin
g t
he
Su
bst
rate

24
gas stream appear between certain values of wavenumbers and these
values are tabulated in Table 3.1.
Table 3.1 Characteristic wavenumber ranges for the FTIR peaks
for the reaction constituents
Compound Wavenumber Range (cm-1
)
Boron trichloride 1040-920
Methane 3207-2843 and 1405-1170
Hydrogen Chloride 3050-2700
Dichloroborane 1150-1050, 910-850 and 2625-2700
3.2. Analysis of the Reactions Occuring in the Deposition
Process
The XPS and XRD analyses of the produced materials have shown
that almost all of the solid material that was produced during the
deposition process was rhombohedral boron carbide. Also, the
existance of the hydrochloric acid and dichloroborane was proven
experimentally from the FTIR analysis. Hence, there are altogether 6
chemical species that take part in the overall reaction phenomena,
those are methane (CH4), boron trichloride (BCl3), hydrogen (H2),
hydrogen chloride (HCl), dichloroborane (BHCl2) and boron carbide
(B4C). The atomic balances for the species constituting these
molecules can be written as follows;
B: RBCl3 + RBHCl2
+ 4 RB4C = 0 (3.1)
C: RCH4 + RB4C = 0 (3.2)
H: 4 RCH4 + RHCl + RBHCl2
+ 2 RH2 = 0 (3.3)
Cl: 3 RBCl3 + RHCl + 2 RBHCl2
= 0 (3.4)
25
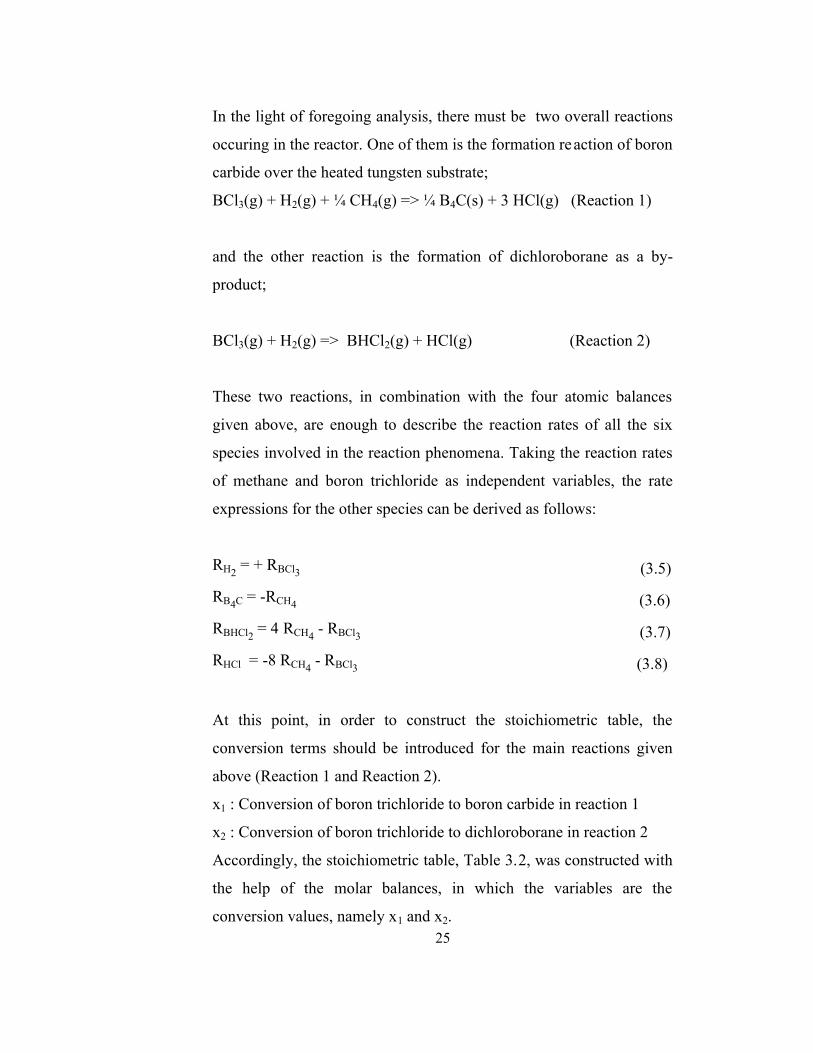
In the light of foregoing analysis, there must be two overall reactions
occuring in the reactor. One of them is the formation reaction of boron
carbide over the heated tungsten substrate;
BCl3(g) + H2(g) + ¼ CH4(g) => ¼ B4C(s) + 3 HCl(g) (Reaction 1)
and the other reaction is the formation of dichloroborane as a by-
product;
BCl3(g) + H2(g) => BHCl2(g) + HCl(g) (Reaction 2)
These two reactions, in combination with the four atomic balances
given above, are enough to describe the reaction rates of all the six
species involved in the reaction phenomena. Taking the reaction rates
of methane and boron trichloride as independent variables, the rate
expressions for the other species can be derived as follows:
RH2 = + RBCl3 (3.5)
RB4C = -RCH4 (3.6)
RBHCl2 = 4 RCH4
- RBCl3 (3.7)
RHCl = -8 RCH4 - RBCl3 (3.8)
At this point, in order to construct the stoichiometric table, the
conversion terms should be introduced for the main reactions given
above (Reaction 1 and Reaction 2).
x1 : Conversion of boron trichloride to boron carbide in reaction 1
x2 : Conversion of boron trichloride to dichloroborane in reaction 2
Accordingly, the stoichiometric table, Table 3.2, was constructed with
the help of the molar balances, in which the variables are the
conversion values, namely x1 and x2.

26
Table 3.2 Stoichiometric Table
Species
Feed Rate to
Reactor
(mol/time)
Change within
Reactor (mol/time)
Effluent Rate from
Reactor (mol/time)
BCl3 FBCl3o -(FBCl3ox1+FBCl3ox2) FBCl3o-FBCl3ox1-FBCl3ox2
H2 FH2o -(FBCl3ox1+FBCl3ox2) FH2o-FBCl3ox1-FBCl3ox2
CH4 FCH4o -1/4FBCl3ox1 FCH4o-1/4FBCl3ox1
HCl - +(3FBCl3ox1+FBCl3ox2) 3FBCl3ox1+FBCl3ox2
BHCl2 - +FBCl3ox2 FBCl3ox2
Total (=FT) Fo(=FBCl3o+
FH2o+ FCH4o)
+3/4FBCl3ox1 Fo+3/4FBCl3ox1
The mole fraction of a species i (yi) in the reactor effluent stream can
be written by dividing molar flowrate of this species to the total
effluent flowrate from the reactor. Mole fractions for each species are
given in equations from 3.9 to 3.13 below.
1oBCl
21oBCl
1oBClo
21oBCl
T
BCl
BClx3/4y1
)x-x-(1y
x3/4nF
)x-x-(1F
F
Fy
3
3
3
33
3
(3.9)
1oBCl
21oBCloH
1oBClo
21oBCloH
T
H
Hx3/4y1
)x(xy-y
x3/4FF
)x(xF-F
F
Fy
3
32
3
322
2
(3.10)
1oBCl
1oBCloCH
1oBClo
1oBCloCH
T
CH
CHx3/4y1
x1/4y-y
x3/4FF
x1/4F-F
F
Fy
3
34
3
344
4
(3.11)

27
1oBCl
21oBCl
1oBClo
21HClo
T
HCl
HClx3/4y1
)x(3xy
x3/4FF
)x(3xF
F
Fy
3
3
3
(3.12)
1oBCl
2oBCl
1oBClo
2oBCl
T
BHCl
BHClx3/4y1
xy
x3/4FF
xF
F
Fy
3
3
3
32
2
(3.13)
Mole fractions of each component in the inlet and outlet streams are
given in Appendix D.
In a typical experiment, the change of the mole fractions of the reactor
effluent gases with respect to time is given in Figure 3.3. After heating
the substrate, the system reached steady state nearly within 30
minutes. This was the common case for all of the experiments
conducted.
3.2.1. Reaction Rate Calculations
The reaction rates for each species in the reaction mixture can be
found by using the following equations in which the variables are the
conversion values x1 and x2 for Reaction 1 and Reaction 2,
respectively.
ARBCl3 = -Fo yBCl3o x1-FoyBCl3o x2 (3.14)
ARH2 = -Fo yBCl3o x1-FoyBCl3o x2 (3.15)
ARHCl = 3Fo yBCl3o x1+FoyBCl3o x2 (3.16)
ARCH4 = -1/4Fo yBCl3o x1 (3.17)
ARBHCl2 = FoyBCl3o x2 (3.18)
ARB4C = 1/4 Fo yBCl3o x1 (3.19)
28
Fig
ure
3.3
Ch
an
ge
of
mo
le f
ract
ion
s o
f re
acti
on
co
nst
itu
ents
wit
h t
ime
(T=
11
50
oC
, y
BC
l3o=
0.0
89
, y
CH
4o=
0.0
2,
yB
Cl3
o/y
CH
4o=
4.4
5,
y
H2o =
0.8
91
)

29
where, Fo is the total molar flowrate of the reactant stream and A is the
surface area of the tungsten substrate that is in contact with the
reactant gases within the reactor. The rate equations are based on
surface area rather than reactor volume. This can be considered as a
reasonable procedure for the boron carbide formation reaction because
it is already a surface reaction. Although we are not sure at the
beginning where dichloroborane reaction occurs (in fact our analyses
in Appendix E showed that it occurs in the gas phase) we can still
write its formation reaction based on the surface area. The reason
behind this approximation is that, the space time of the reactants in the
reactor is around 0.35 seconds and the temperature of the effluent
stream from the reactor does not exceed 50oC. At such a low
temperature, it is not possible to have any reaction to occur in the bulk
of the gas in the reactor. So, it can be said that, the homogeneous
reactions occuring during the deposition process must be occuring in a
very thin thermal boundary layer next to the substrate surface.
In addition to Equation 3.19, the boron carbide formation rate was
also determined from the weight change of the filament during the
reaction. Comparison of the mass of the boron carbide deposited
during a typical run (calculated using equation 3.19, using
experimentally observed conversion values) and mass of the boron
carbide evaluated from the weight change of the filament agreed well
(Figure 3.4). This result demonstrated that the two independent
reactions (Reactions 1 and 2) are sufficient to describe the reaction
system under consideration.

30
0
0.05
0.1
0.15
0 0.05 0.1 0.15
w B4C (gr)
w*
B4C
(gr)
Figure 3.4 Comparison of the calculated B4C deposit weight (w)
with the actual B4C deposit weight (w*)
3.2.2. Conversion Calculations:
The conversion values in the equations through 3.14-3.19 can be
calculated by simultaneous solution of equations 3.9 and 3.11 for x1
and x2.
For Reaction 1 (B4C formation reaction)
oBClCH
CHoCH
1
34
44
y)4
1y
4
3(
yyx
(3.20)
For Reaction 2 (BHCl2 formation reaction)

31
1)(3yy
4))(3yy-(y-1))(3yy-(yx
43
344433
CHoBCl
BClCHoCHCHBCloBCl
2
(3.21)
3.2.3. Selectivity Calculations:
The selectivities for the reactions 1 and 2 can be found as:
21
1
BCl
CB
CBxx
4x
R-
RS
3
4
4 (3.22)
21
2
BCl
BHCl
BHClxx
x
R-
RS
3
2
2 (3.23)
where, SB4C is the selectivity of the boron carbide formation rate with
respect to the boron trichloride consumption rate, whereas SBHCl2 is the
selectivity of the dichloroborane formation rate with respect to the
boron trichloride consumption rate.
3.3. Analysis of the Effects of Various Experimental
Parameters on the Reaction Kinetics
The effects of the initial boron trichloride mole fraction on the
reaction rates were analyzed by changing the boron trichloride molar
fraction in the inlet stream between 2.3% and 11.8%. In these
experiments, the mole fraction of methane in the reactor inlet stream
was kept constant near 2%, and the rest was hydrogen being in excess
to sum up the total molar flow rate to 200cm3/min.
Changes in mole fraction of hydrogen in the inlet gas mixture, in the
range of 85% and 95% seemed to have no effect on the reaction
kinetics. Low hydrogen concentrations in the inlet gas resulted in
carbon deposition rather than B4C formation. The effect of inlet BCl3
concentration on the reaction rates at a temperature of 1150oC can be
32
seen in Figure 3.5. The figure indicates that the reaction rate as well as
conversion for the boron carbide formation reaction is always lower
than that of dichloroborane formation reaction. Dichloroborane
formation reaction is believed to occur in the thin boundary layer next
to the substrate surface. In appendix E, the calculations for the
approximate temperature distribution in the vicinity of the tungsten
substrate were presented, and it was observed that there is around 90
mm3 active reaction region around both sides of the filament, in which
the temperature is greater than 350oC, above which dichloroborane
formation reactions can take place. This may be the reason of higher
production rates of dichloroborane than that of boron carbide which
occurs only through surface reactions. The rate of boron carbide
formation reaction increases with an increase in BCl3 inlet molar
fraction, and has a decreasing trend in the slope at high BCl3 inlet
mole fractions. The rate of the reaction seemed to be surface kinetics
controlled. The rate of dichloroborane formation reaction is fast
enough to consume the excess amount of BCl3 at high inlet
concentrations of BCl3. The rate of dichloroborane formation reaction
increases with an increase in BCl3 inlet molar fractions.
In Figure 3.6, the temperature dependence of B4C and BHCl2
formation rates are given. As it is seen that, boron carbide formation
rate increases continuously with temperature. With temperature rise,
the rate of dichloroborane formation reaction also increases, however
the change is not significant as compared to the effect of temperature
on the formation rate of B4C. With a change of substrate temperature
from 1000 to 1400oC, the rate of B4C deposition increases almost 4
fold, whereas the rate of BHCl2 formation increases around 1.05 fold.

33
Fig
ure
3.5
Eff
ect
of
init
ial
BC
l 3 m
ole
fra
ctio
n o
n t
he
B4C
an
d B
HC
l 2 f
orm
ati
on
rate
s w
ith
th
e st
an
dard
dev
iati
on
s in
dic
ate
d b
y t
he
erro
r b
ars
(y
CH
4o=
0.0
2 i
n h
yd
rogen
,, T
=1150
oC
)
0.0E
+00
1.0E
-05
2.0E
-05
3.0E
-05
00.
020.
040.
060.
080.
1
y B
Cl 3
R B4C (g-mol/min)
0.0E
+00
2.0E
-04
4.0E
-04
6.0E
-04
R BHCl2 (g-mol/min)
R B
4C
R B
HC
l2
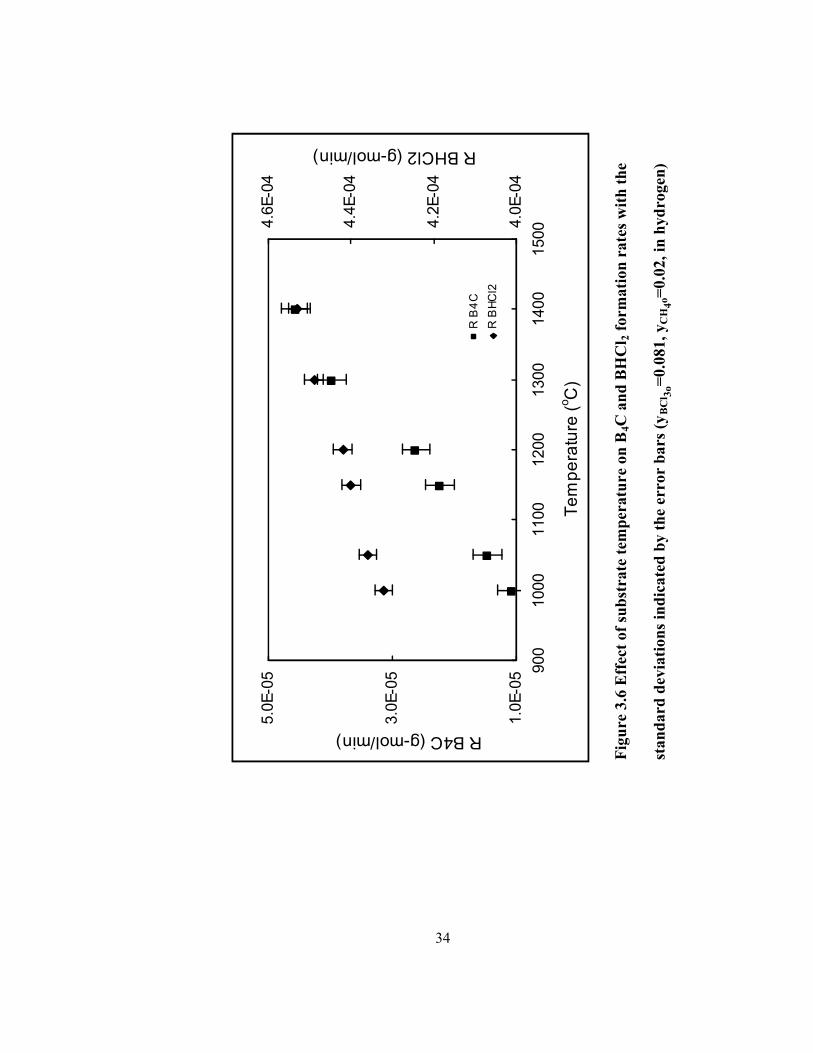
34
Fig
ure
3.6
Eff
ect
of
sub
stra
te t
emp
era
ture
on
B4C
an
d B
HC
l 2 f
orm
ati
on
ra
tes
wit
h t
he
sta
nd
ard
dev
iati
on
s in
dic
ate
d b
y t
he
err
or
ba
rs (
yB
Cl 3
o=
0.0
81
, y
CH
4o=
0.0
2,
in h
yd
rog
en)
1.0E
-05
3.0E
-05
5.0E
-05 90
010
0011
0012
0013
0014
0015
00
Tem
pera
ture
(o C)
R B4C (g-mol/min)
4.0E
-04
4.2E
-04
4.4E
-04
4.6E
-04
R BHCl2 (g-mol/min)
R B
4CR
BHC
l2

35
This further supports the idea of gas phase formation of
dichloroborane in the boundary region next to the substrate surface. It
may be expected that a change in surface temperature in this
impinging jet system may have smaller effect on the gas-phase
kinetics and hence less impact on the reaction rates compared to the
solid-phase kinetics in the formation of boron carbide. It is also seen
that the reaction rate for boron carbide formation reaction is lower
than that of dichloroborane formation reaction for the entire range of
temperature studied. The effects of methane concentration in the inlet
stream on the reaction rates were analyzed by changing methane mole
fraction in the inlet stream in the range of 1.9% and 4.2% and the
results are depicted in Figure 3.7. The change of methane mol fraction
in the inlet stream has almost no effect on the reaction rate of
dichloroborane formation reaction over the composition range of
methane that was applied during the runs. However, there is an
increasing trend in the rate of boron carbide formation reaction.
By a computerized nonlinear model fitting procedure, the
experimental data was analysed to find the model parameters. Hooke
and Jeeves [16] iteration method was used for the analysis of the data.
After the analysis, the frequency factor, ko, and activation energy, Ea,
were found to be 0.078±0.008 and 56.1±4.0 kjoule/mol, respectively.
The order of reaction with respect to BCl3 was found as 0.34±0.055,
whereas the order with respect to CH4 was found as 0.64±0.084, with
a statistical correlation coefficient of 0.95. In Figure 3.8, model
predicted B4C formation rates were compared with the experimentally
found B4C formation rates. Hence the expression for the boron carbide
formation rate can be written as,
RB4C=ko*exp(-Ea/RT)[BCl3]a[CH4]
b (3.24)
36
Fig
ure
3.7
Eff
ect
of
init
ial
CH
4 m
ole
fra
ctio
n o
n B
4C
an
d B
HC
l 2 f
orm
ati
on
ra
tes
wit
h t
he
sta
nd
ard
dev
iati
on
s in
dic
ate
d b
y t
he
err
or
ba
rs (
T=
11
50
oC
, y
BC
l 3o =
0.0
84
in
hy
dro
gen
)
yB
Cl 3
o/y
CH
4o =
2-4
.5)
2.0E
-05
3.0E
-05
4.0E
-05
5.0E
-05 0.
015
0.02
0.02
50.
030.
035
0.04
0.04
5
y C
H4
R B4C (g-mol/min)
1.0E
-04
2.0E
-04
3.0E
-04
4.0E
-04
R BHCl2 (g-mol/min)
R B
4CR
BHC
l2

37
a)
1.0E-05
2.0E-05
3.0E-05
0 0.02 0.04 0.06 0.08 0.1
y BCl3
R B
4C (g
-mol
/min
)
ExperimentalM odel
b)
2.0E-05
3.0E-05
4.0E-05
0.015 0.02 0.025 0.03 0.035 0.04 0.045
y CH4
R B
4C (g
-mol
/min
)
ExperimentalM odel
c)
1.0E-05
3.0E-05
5.0E-05
900 1000 1100 1200 1300 1400 1500
Temperature (oC)
R B
4C (g
-mol
/min
)
ExperimentalM odel
Figure 3.8 Effect of initial BCl3 (yCH4o
=0.02, in hydrogen, T=1150oC)
(a) and CH4 (yBCl3o =0.084, in hydrogen, T=1150
oC) (b) mole
fractions and temperature (yBCl3o=0.081, yCH4o=0.02, in hydrogen) (c)
on B4C formation rate with the standard deviations indicated by the
error bars and model predictions indicated by the dashed lines
38
where,
ko = 0.078±0.008
Ea = 56.1±4.0 kjoule/mol
a = 0.34±0.055
b = 0.64±0.084
3.3.1. Effects of Experimental Parameters on Selectivities
The selectivities for both reactions were calculated from equations
3.22 and 3.23, and the results are given in Figures 3.9, 3.10 and 3.11.
In all of the conducted experiments, the selectivity of dichloroborane
was always higher than that of boron carbide and the gap increases
rapidly especially at low BCl3 concentrations (see Figure 3.9). At high
values of BCl3 concentrations, the dependence of selectivities on the
boron trichloride composition gradually disappears. Compared to
effect of boron trichloride on the selectivities of both reactions,
methane has almost no effect on selectivities (Figure 3.10). So it can
be said that the selectivities are controlled by boron trichloride
composition rather than methane composition in the inlet stream. The
temperature increase causes dichloroborane selectivity to decrease. On
the other hand, the selectivity of boron carbide formation reaction
increases with temperature. It is seen that temperature rise has a
positive effect on the boron carbide formation in terms of reaction
rate, conversion and selectivity. However, it should be kept in mind
that there is a limitation on the temperature to produce boron carbide
in desired purity.
39
Fig
ure
3.9
Eff
ect
of
init
ial
BC
l 3 m
ole
fra
ctio
n o
n B
4C
an
d B
HC
l 2 s
elec
tiv
itie
s (y
CH
4o=
0.0
2 i
n
hyd
rogen
, T
=1150
oC
)
40
Fig
ure
3.1
0 E
ffec
t o
f in
itia
l C
H4 m
ole
fra
ctio
n o
n B
4C
an
d B
HC
l 2 s
elec
tiv
itie
s (
T=
11
50
oC
,
yB
Cl 3
o =
0.0
84
in
hy
dro
gen
)

41
Fig
ure
3.1
1 E
ffec
t o
f te
mp
era
ture
on
B4C
an
d B
HC
l 2 s
elec
tiv
itie
s (y
BC
l 3o=
0.0
81
, y
CH
4o=
0.0
2,
in h
yd
rog
en)

42
3.3.2. Effects of Experimental Parameters on Boron Carbide Yield
The chemical yield is defined as the mass fraction of the limiting
reactant converted to the required product. The percentage yield can
be defined as follows,
Percentage yield = actual yield / theoretical yield x 100
The theoretical yield was calculated from the reaction stoichiometry,
and it is based on the molar amount of BCl3, which is assumed to be
the rate limiting reactant.
Effects of experimental parameters on boron carbide percentage yields
are depicted in Figures 3.12, 3.13, and 3.14. The maximum boron
carbide yield observed in this study was 13%. This low yield can be
attributed to the high formation rate and seletivity of competing
dichloroborane formation reaction compared to the boron carbide
formation reaction. Also, it was shown in Appendix G that, boron
carbide formation reaction occurs too far from equilibrium, which
may be another reason for poor yields observed. Boron carbide
percentage yield decreases significantly with increasing boron
trichloride inlet molar fraction (Figure 3.12). Methane has little effect
on the yield of boron carbide compared to the boron trichloride effect
and there is an increasing trend in the yield with increasing methane
inlet molar fraction, which can be seen in Figure 3.13. There is a
linear increase in boron carbide yield with increasing substrate
temperature (Figure 3.14). So it can be said that, maximum yield can
be achieved using high substrate temperatures and low boron
trichloride inlet molar fractions.
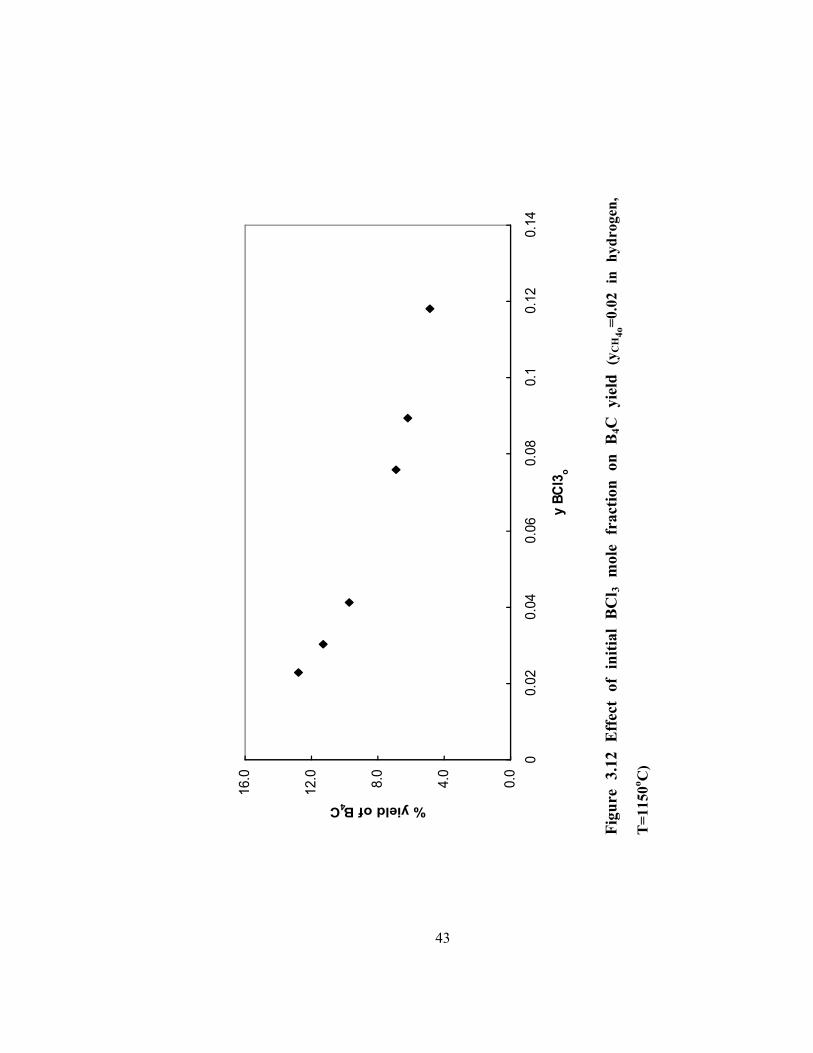
43
Fig
ure
3
.12
E
ffec
t o
f in
itia
l B
Cl 3
m
ole
fr
act
ion
o
n
B4C
y
ield
(y
CH
4o=
0.0
2
in
hyd
rogen
,
T=
1150
oC
)
0.0
4.0
8.0
12.0
16.0
00.
020.
040.
060.
080.
10.
120.
14
y BC
l3o
% yield of B4C

44
Fig
ure
3.1
3 E
ffec
t o
f in
itia
l C
H4 m
ole
fra
ctio
n o
n B
4C
yie
ld (
T=
11
50
oC
, y
BC
l 3o =
0.0
84
in
hy
dro
gen
)
0.0
4.0
8.0
12.0 0.
015
0.02
0.02
50.
030.
035
0.04
0.04
5
y C
H4 o
% yield B4C

45
Fig
ure
3.1
4 E
ffec
t o
f te
mp
era
ture
on
B4C
yie
ld (
yB
Cl 3
o=
0.0
81
, y
CH
4o=
0.0
2,
in h
yd
rog
en)
0.0
4.0
8.0
12.0
16.0
900
1000
1100
1200
1300
1400
1500
Tem
pera
ture
(o C)
% yield of B4C
46
3.4. Mechanism Studies on CVD of Boron Carbide from
BCl3, CH4 and H2 Gas Mixture in a Dual Impinging Jet
Reactor
In the previous section, an Arrhenius type rate expression was
developed for the boron carbide formation rate on tungsten substrate.
In this part, a detailed chemical investigation of CVD of boron carbide
from a reaction gas mixture of BCl3, CH4, and H2 will be presented to
find a plausible reaction mechanism, to predict the formation rate of
boron carbide, together with the rate of dichloroborane, which is the
only stable intermediate observed in our system.
The mechanism studies are carried out with the rate data for the
samples that are produced at 1150oC. At this temperature, the rate of
boron carbide formation reaction increases up to a certain value of
boron trichloride mole fractions, and then reaches a plateu and
remains nearly constant. This result may be the indication of a first
order adsorption of BCl3 on the surface. This observation is also
consistent with the study of Sezgi et. al. [17] in which boron
deposition was considered to take place in a mechanism involving first
order nondissociative adsorption of boron trichloride on the substrate
surface.
Other reaction precursors, methane and hydrogen, may or may not
adsorb on the surface, and react with adsorbed boron trichloride
through Langmuir Hinshelwood or Rideal Eley type of surface
reactions, respectively. A large number of reaction models consisting
of different types of elementary reaction steps, involving various types
of surface reactions, totally gas phase reactions, and some adsorption
and desorption reactions were proposed to predict the formation rates

47
of boron carbide and dichloroborane simultaneously. The rate laws for
the formation of boron carbide and dichloroborane were derived from
the proposed models and tested with the independent experimental
rate data using non-linear regression analysis. After regression
process, the proposed models should predict both rates with an
acceptable accuracy. Morover, many of the models contained some
common rate parameters appearing in two model rate expressions. So,
it is necessary to fit the experimental data to the two model rate
expressions simultaneously.
The various combinations of possible elementary reaction steps,
together with the selection of the rate determining step among the
elementary steps, are the factors that make the difference between the
models. Some of the most probable elementary reaction steps
considered for this system are shown in Table 3.3.
In the derivation of the models, the only stable adsorbed species were
taken as BCl3, H2 and CH4. The adsorption terms for the product gases
HCl and BHCl2 were not considered because such species are swept
away from the surface during the impingement of the reactant gases to
the substrate surface as implied by the FTIR analysis of the exit gases
and material balance calculations.

48
Table 3.3. Some of the probable surface reactions considered for
CVD of boron carbide
Adsorption reactions
BCl3 + s BCl3s (nondissociative) a1
BCl3 + 2s BCl2s+ s.Cl (dissociative) a2
BCl3 + 3s BCls + 2Cls (pyrolitic) a3
CH4 + s CH4s (nondissociative) a4
CH4 + 2s CH3s + s.H (dissociative) a5
CH4 + s Cs + 2H2 (dissociative) a6
H2 + 2s 2Hs (dissociative) a7
Surface reactions for boron carbide formation
BCs + BCl3 + H2 + s B2Cs + 2HCl + Cls b1
B2Cs + BCl3 + H2 + s B3Cs + 2HCl + Cls b2
B3Cs + BCl3 + H2 + s B4Cs + 2HCl + Cls b3
BCs + BCls + H2 B2Cs + Hs + HCl b4
B2Cs + BCls + H2 B3Cs + Hs + HCl b5
B3Cs + BCls + H2 B4Cs + Hs + HCl b6
BCls + Cs + H2 BCs + Hs + HCl b7
BCs + BCl3s+ H2 B2Cs + 2HCl + Cls b8
B2Cs + BCl3s+ H2 B3Cs + 2HCl + Cls b9
B3Cs + BCl3s+ H2 B4Cs + 2HCl + Cls b10
b11 BCs + BCl3 + 3/2 H2 B2Cs + 3HCl b11
B2Cs + BCl3 + 3/2 H2 B3Cs + 3HCl b12
B3Cs + BCl3 + 3/2 H2 B4Cs + 3HCl b13
Surface reactions for BCl3 decomposition
BCl3s+ H2 BCls + 2HCl c1
BCl3s+ Hs BCl2s+ HCls c2

49
Table 3.3. Some of the probable surface reactions considered for
CVD of boron carbide (cont’d)
BCl3s+ s BCl2s+ Cls c3
BCl2s+ Hs BCls + HCls c4
BCls + CH4 BCs + HCl + 3/2H2 c5
BCl3s+ CH4 BCs + 3HCl + 1/2H2 c6
BCl3s+ CH4 BHCs + 3HCl c7
BCl3 + CH3s BCs + 3HCl c8
BCl3s+ CH3s BCs + 3HCl + s c9
BCl3s +Cs + 2H2BCs + 3HCl + Hs c10
BCl2s + Hs BCls + HCl + s c11
BCl3s + H2 BHCl2s + HCl c12
BHCl2 formation
BCl3s + H2 + ns BHCl2s+ HCls +(n-1)s d1
BCl3s + 2(Hs) BHCl2s + HCls + s d2
BCl2s + Hs BHCl2s + s d3
BCl3s + 2HsBHCl2 + HCl + 3s d4
BCl3s + H2 BHCl2 + HCl + s d5
Desorption reactions
BHCl2s BHCl2 + s e1
HCls HCl + s e2
BCl2s BCl2 + s e3
BCls BCl + s e4
Decomposition of BHCl2
BHCl2s + s BCl2s + Hs f1
BHCl2s + BCl3s 2BCl2s + HCl f2
BHCl2s + Hs + s Bs + 2HCls f3

50
BCl3 adsorption on the substrate surface may be dissociative, partially
dissociative or nondissociative (molecular) (Table 3.3, a1-a3). Among
the extensive number of the models considered, only the ones in
which molecular adsorbtion of boron trichloride on the surface was
included in the mechanisms (a1) gave reasonable fits for the boron
carbide formation rate. Hydrogen adsorption was considered to be
dissociative (a7) at the substrate temperature studied, however
methane adsorption could be either molecular (a4), or dissociative (a5-
a6). Free carbon adsorbed to the surface further may react with
adsorbed boron trichloride to start the formation of boron carbide
phase.
The almost linear increase of the dichloroborane formation rate with
initial boron trichloride molar fractions could be mainly due to the gas
phase formation reactions. Modelling studies revealed that, the models
in which dichloroborane formation reactions was considered to take
place only in gas phase, gave very good fits, for the formation rates of
both species. On the other hand, models containing surface reaction
steps in addition to the gas phase formation reaction for
dichloroborane formation (d1-d3), gave poor fits, especially to predict
the deposition rate of boron carbide. Morover, according to the
subsequent curve fitting process, the gas phase reaction of
dichloroborane formation should be elementary and first order with
respect to BCl3 concentration. Since the hydrogen participates in
reaction, one would expect the rate law to have the form r=PBCl3PH2
.
Because hydrogen is always present in great excess, its concentration
remains essentially constant in a given run. Therefore hydrogen was
excluded from the rate law and the reaction becomes pseudo first
order. In spite of the absence of any decomposition products of BHCl2
51
on the solid phase, further dissociation of dichloroborane (f1-f3) was
considered in some models and as expected the mechanisms involving
such reactions gave poor fits.
Boron carbide formation reactions were considered to take place
through succesive series reactions, in which boron and carbon atoms
are incorporated into the solid structure to form boron carbide finally
(b1-b13). In order to eliminate the coverage dependent terms in the
final form of the rate equtions, steady state approximations were
applied for the boron-carbon containing intermediates appearing in the
succesive series rections.
The reactions leading adsorbed boron trichloride to decompose
through surface reactions involve the reaction of adsorbed BCl3 with
either gas phase hydrogen and methane (c1, c5-c7), or through
reactions involving adsorbed hydrogen (c2), or adsorbed methane
(c8).
More than 30 reaction mechanism models were proposed, and among
them, following 10 will be considered here.
Model 1
In this model boron trichloride, hydrogen and methane gases were
considered to be adsorbed on the substrate surface. Boron trichloride
adsorption is thought to be nondissociative, whereas hydrogen and
methane adsorptions were taken as dissociative adsorptions. Adsorbed
boron trichloride reacts with gaseous hydrogen through a Rideal-Eley
type of a reaction mechanism to yield BCls, which then reacts with

52
carbon and hydrogen to produce adsorbed BC. BC reacts with
adsorbed BCl and gaseous hydrogen in successive steps to produce
boron carbide finally. Dichloroborane is produced through the gas
phase reaction between hydrogen and boron trichloride, as well as
through the surface reaction of adsorbed boron trichloride and
dissociatively adsorbed hydrogen.
BCl3(g) + s a1K BCl3s
H2(g) + 2s a7K 2Hs
BCl3s + H2(g) c1K BCls + 2HCl(g)
CH4(g) + s a6K Cs + 2H2(g)
BCls + Cs + H2(g) b7k BCs + Hs + HCl(g)
BCs + BCls + H2(g) b4k B2Cs + Hs + HCl(g)
B2Cs + BCls + H2(g) b5k B3Cs + Hs + HCl(g)
B3Cs + BCls + H2(g) b6k B4Cs + Hs + HCl(g)
BCl3s + 2 Hs d4k BHCl2(g) + HCl(g) + 3s
BCl3(g) + H2(g) kg BHCl2(g) + HCl(g)
The rate limiting step was considered to be the boron carbide
formation reaction step. According to the equilibrium calculations, the
dependencies of boron carbide and dichloroborane formation reactions
on the partial pressures of the reaction gases were calculated as
follows;
21/2
Ha7
2
HCHa6BCla1
2
HCl
CHBCla6c1a1b7
B))P(K/PPKPK(1P
PPKKKkR
2243
43
4 C (3.25)
23
2243
32
2 HBClg31/2
Ha7
2
HCHa6BCla1
BClHa7a1d4
BHCl PPk))P(K/PPKPK(1
PPKKkR
(3.26)

53
The model equations were tested with the experimental data, and the
results are depicted in Figures 3.15, 3.16, 3.17, 3.18. As it is seen that
the model gave poor fit to the experimentally observed data. The
model is especially deficient for determining the rate of boron carbide
formation reaction. The model parameters together with the
correlation coefficients for both reactions are given in Table 3.4.
Model 2
In this model, dissociative adsorption of boron trichloride and
hydrogen on the substrate surface is considered. Dissociated
intermediate products, BCl2s and Hs, react on the surface and BCls
(adsorbed BCl on the surface) is formed. BCls then undergoes a
Rideal-Eley type of a surface reaction with gaseous methane to form
BCs. BCs is reacted with gaseous boron trichloride and hydrogen in
successive series reactions in the presence of a vacant site, and in each
step one boron atom is added to BC, finally forming boron carbide on
the substrate surface. Dichloroborane formation is considered to take
place in gaseous phase and through surface reactions in this model. In
surface reactions, BCl2s is reacted with adsorbed hydrogen to form
adsorbed dichloroborane, which then desorbed to the gaseous phase
leaving an empty site behind. The elementary reaction steps proposed
for this mechanism are as follows;
BCl3(g) + 2s a2k BCl2s + Cls
H2(g) + 2s a7K 2Hs
BCl2s + Hs c11k BCls + HCl(g) + s
BCls + CH4(g) c5k BCs + HCl(g) + 3/2 H2(g)
BCs + BCl3(g) + H2(g) + s b1k B2Cs + 2HCl(g) + Cls
B2Cs + BCl3(g) + H2(g) + s b2k B3Cs + 2HCl(g) + Cls

54
Fig
ure
3.1
5 C
om
par
iso
n o
f th
e ef
fect
of
BC
l 3 i
nle
t m
ole
fra
ctio
ns
on
th
e o
bse
rved
an
d M
od
el 1
pre
dic
ted
form
atio
n r
ates
of
B4C
(T
=1
15
0oC
, y
CH
40=
0.0
2 i
n h
yd
rog
en,
yB
Cl3
0/y
CH
40=
1.5
- 5
.5,
sim
ult
an
eou
s an
aly
sis)
0.0E
+00
1.0E
-05
2.0E
-05
3.0E
-05
4.0E
-05
5.0E
-05
00.
020.
040.
060.
080.
10.
120.
14
y B
Cl 30
AR B4C (g-mole/min)
Obs
Pre
d
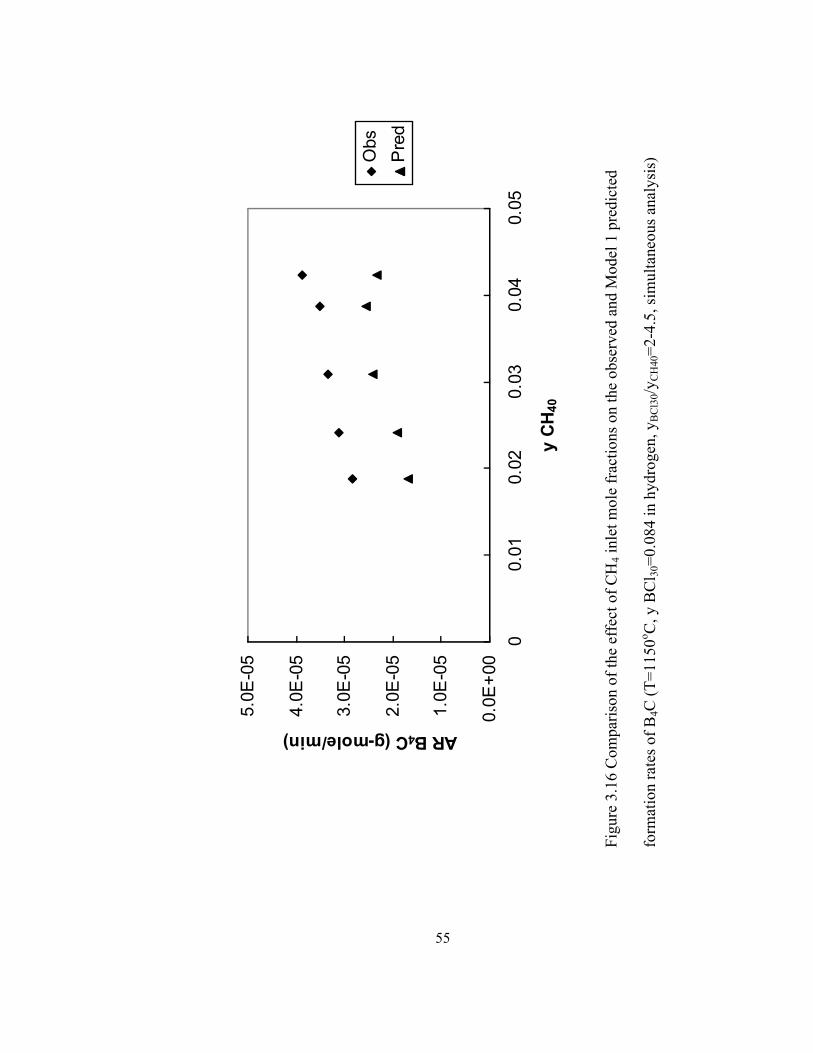
55
Fig
ure
3.1
6 C
om
par
iso
n o
f th
e ef
fect
of
CH
4 i
nle
t m
ole
fra
ctio
ns
on
th
e o
bse
rved
an
d M
od
el 1
pre
dic
ted
form
atio
n r
ates
of
B4C
(T
=1
15
0oC
, y
BC
l 30=
0.0
84
in
hy
dro
gen
, y
BC
l30/y
CH
40=
2-4
.5,
sim
ult
an
eo
us
anal
ysi
s)
0.0E
+00
1.0E
-05
2.0E
-05
3.0E
-05
4.0E
-05
5.0E
-05
00.
010.
020.
030.
040.
05
y C
H 40
AR B4C (g-mole/min)
Obs
Pre
d

56
Fig
ure
3.1
7 C
om
par
iso
n o
f th
e ef
fect
of
BC
l 3 i
nle
t m
ole
fra
ctio
ns
on
th
e o
bse
rved
an
d M
od
el 1
pre
dic
ted
form
atio
n r
ates
of
BH
Cl 2
(T
=1
15
0oC
, y
CH
40=
0.0
2 i
n h
yd
rog
en,
yB
Cl3
0/y
CH
40=
1.5
- 5
.5,
sim
ult
aneo
us
anal
ysi
s)
0.0E
+00
2.0E
-04
4.0E
-04
6.0E
-04
8.0E
-04
00.
020.
040.
060.
080.
10.
120.
14
y B
Cl 30
AR BHCl2 (g-mole/min)
Obs
Pre
d

57
Fig
ure
3.1
8 C
om
par
iso
n o
f th
e ef
fect
of
CH
4 i
nle
t m
ole
fra
ctio
ns
on
th
e o
bse
rved
an
d M
od
el 1
pre
dic
ted
form
atio
n r
ates
of
BH
Cl 2
(T
=1
15
0oC
, y
BC
l 30=
0.0
84
in
hy
dro
gen
, y
BC
l30/y
CH
40=
2-4
.5,
sim
ult
aneo
us
anal
ysi
s)
0.0E
+00
1.0E
-04
2.0E
-04
3.0E
-04
4.0E
-04
5.0E
-04
00.
010.
020.
030.
040.
05
y C
H 40
AR BHCl2 (g-mole/min)
Obs
Pre
d
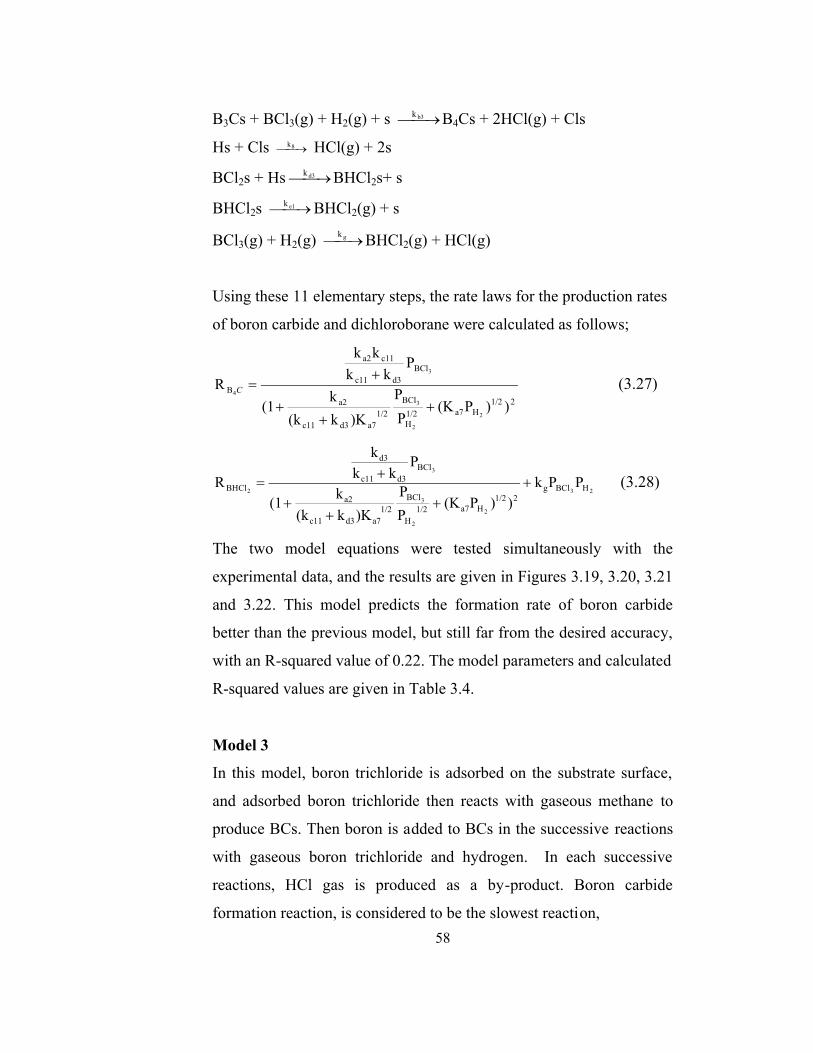
58
B3Cs + BCl3(g) + H2(g) + s b3k B4Cs + 2HCl(g) + Cls
Hs + Cls 8k HCl(g) + 2s
BCl2s + Hs d3k BHCl2s+ s
BHCl2s e1k BHCl2(g) + s
BCl3(g) + H2(g) gkBHCl2(g) + HCl(g)
Using these 11 elementary steps, the rate laws for the production rates
of boron carbide and dichloroborane were calculated as follows;
21/2
Ha71/2
H
BCl
1/2
a7d3c11
a2
BCl
d3c11
c11a2
B
))P(KP
P
)Kk(k
k(1
Pkk
kk
R
2
2
3
3
4
C (3.27)
23
2
2
3
3
2 HBClg
21/2
Ha71/2
H
BCl
1/2
a7d3c11
a2
BCl
d3c11
d3
BHCl PPk
))P(KP
P
)Kk(k
k(1
Pkk
k
R
(3.28)
The two model equations were tested simultaneously with the
experimental data, and the results are given in Figures 3.19, 3.20, 3.21
and 3.22. This model predicts the formation rate of boron carbide
better than the previous model, but still far from the desired accuracy,
with an R-squared value of 0.22. The model parameters and calculated
R-squared values are given in Table 3.4.
Model 3
In this model, boron trichloride is adsorbed on the substrate surface,
and adsorbed boron trichloride then reacts with gaseous methane to
produce BCs. Then boron is added to BCs in the successive reactions
with gaseous boron trichloride and hydrogen. In each successive
reactions, HCl gas is produced as a by-product. Boron carbide
formation reaction, is considered to be the slowest reaction,

59
Fig
ure
3.1
9 C
om
par
iso
n o
f th
e ef
fect
of
BC
l 3 i
nle
t m
ole
fra
ctio
ns
on
th
e o
bse
rved
an
d M
od
el 2
pre
dic
ted
form
atio
n r
ates
of
B4C
(T
=1
15
0oC
, y
CH
40=
0.0
2 i
n h
yd
rog
en,
yB
Cl3
0/y
CH
40=
1.5
- 5
.5,
sim
ult
an
eou
s an
aly
sis)
0.0E
+00
1.0E
-05
2.0E
-05
3.0E
-05
4.0E
-05
5.0E
-05
00.
020.
040.
060.
080.
10.
120.
14
y B
Cl 30
AR B4C (g-mole/min)
Obs
Pre
d

60
Fig
ure
3.2
0 C
om
par
iso
n o
f th
e ef
fect
of
CH
4 i
nle
t m
ole
fra
ctio
ns
on
th
e o
bse
rved
an
d M
od
el 2
pre
dic
ted
form
atio
n r
ates
of
B4C
(T
=1
15
0oC
, y
BC
l 30=
0.0
84
in
hy
dro
gen
, y
BC
l30/y
CH
40=
2-4
.5,
sim
ult
an
eo
us
anal
ysi
s)
0.0E
+00
1.0E
-05
2.0E
-05
3.0E
-05
4.0E
-05
5.0E
-05
00.
010.
020.
030.
040.
05
y C
H 40
AR B4C (g-mole/min)
Obs
Pre
d
61
Fig
ure
3.2
1 C
om
par
iso
n o
f th
e ef
fect
of
BC
l 3 i
nle
t m
ole
fra
ctio
ns
on
th
e o
bse
rved
an
d M
od
el 2
pre
dic
ted
form
atio
n r
ates
of
BH
Cl 2
(T
=1
15
0oC
, y
CH
40=
0.0
2 i
n h
yd
rog
en,
yB
Cl3
0/y
CH
40=
1.5
- 5
.5,
sim
ult
aneo
us
anal
ysi
s)
0.0E
+00
2.0E
-04
4.0E
-04
6.0E
-04
8.0E
-04
00.
020.
040.
060.
080.
10.
120.
14
y B
Cl 30
AR BHCl2 (g-mole/min)
Obs
Pre
d

62
Fig
ure
3.2
2 C
om
par
iso
n o
f th
e ef
fect
of
CH
4 i
nle
t m
ole
fra
ctio
ns
on
th
e o
bse
rved
an
d M
od
el 2
pre
dic
ted
form
atio
n r
ates
of
BH
Cl 2
(T
=1
15
0oC
, y
BC
l 30=
0.0
84
in
hy
dro
gen
, y
BC
l30/y
CH
40=
2-4
.5,
sim
ult
aneo
us
anal
ysi
s)
0.0E
+00
1.0E
-04
2.0E
-04
3.0E
-04
4.0E
-04
5.0E
-04
00.
010.
020.
030.
040.
05
y C
H 40
AR BHCl2 (g-mole/min)
Obs
Pre
d

63
which, means that this reaction is the rate limiting step in this
proposed mechanism. The elementary reaction steps are;
BCl3(g) + s a1K BCl3s
BCl3s + CH4(g) c6k BCs + 3HCl(g) + ½ H2(g)
BCs + BCl3(g) + 3/2 H2(g) b11k B2Cs + 3HCl(g)
B2Cs + BCl3(g) + 3/2 H2(g) b12k B3Cs + 3HCl(g)
B3Cs + BCl3(g) + 3/2 H2(g) b13k B4Cs + 3HCl(g)
BCl3(g) + H2(g) gkBHCl2(g) + HCl(g)
H2(g) + 2s a7K 2Hs
BCl3s + H2 (g) +s d1k BHCl2s + HCls
BHCl2s e1k BHCl2 + s
The rate expressions derived for this mechanism are;
1/2
Ha7BCla1
BClCHc6a1
CB)P(KPK1
PPkKR
23
34
4 (3.29)
23
23
32
2 HBClg21/2
Ha7BCla1
BClHa1d1
BHCl PPk))P(KPK(1
PPKkR
(3.30)
The results of the nonlinear curve fitting procedure of this model to
the observed kinetic data are shown in Figures 3.23 through 26.
Although the simultaneous analysis of the experimental data gave
reasonable fit to predict the effect of inlet BCl3 on formation rate of
B4C, the model failed in predicting the effect of inlet CH4 mole
fraction on the B4C formation rate (see Figure 3.24).

64
Fig
ure
3.2
3 C
om
par
iso
n o
f th
e ef
fect
of
BC
l 3 i
nle
t m
ole
fra
ctio
ns
on
th
e o
bse
rved
an
d M
od
el 3
pre
dic
ted
form
atio
n r
ates
of
B4C
(T
=1
15
0oC
, y
CH
40=
0.0
2 i
n h
yd
rog
en,
yB
Cl3
0/y
CH
40=
1.5
- 5
.5,
sim
ult
an
eou
s an
aly
sis)
0.0E
+00
1.0E
-05
2.0E
-05
3.0E
-05
00.
020.
040.
060.
080.
10.
120.
14
y B
Cl 30
AR B4C (g-mole/min)
Obs
Pre
d

65
Fig
ure
3.2
4 C
om
par
iso
n o
f th
e ef
fect
of
CH
4 i
nle
t m
ole
fra
ctio
ns
on
th
e o
bse
rved
an
d M
od
el 3
pre
dic
ted
form
atio
n r
ates
of
B4C
(T
=1
15
0oC
, y
BC
l 30=
0.0
84
in
hy
dro
gen
, y
BC
l30/y
CH
40=
2-4
.5,
sim
ult
an
eo
us
anal
ysi
s)
0.0E
+00
1.0E
-05
2.0E
-05
3.0E
-05
4.0E
-05
5.0E
-05
00.
010.
020.
030.
040.
05
y C
H 40
AR B4C (g-mole/min)
Obs
Pre
d

66
Fig
ure
3.2
5 C
om
par
iso
n o
f th
e ef
fect
of
BC
l 3 i
nle
t m
ole
fra
ctio
ns
on
th
e o
bse
rved
an
d M
od
el 3
pre
dic
ted
form
atio
n r
ates
of
BH
Cl 2
(T
=1
15
0oC
, y
CH
40=
0.0
2 i
n h
yd
rog
en,
yB
Cl3
0/y
CH
40=
1.5
- 5
.5,
sim
ult
aneo
us
anal
ysi
s)
0.0E
+00
2.0E
-04
4.0E
-04
6.0E
-04
8.0E
-04
00.
020.
040.
060.
080.
10.
120.
14
y B
Cl 30
AR BHCl2 (g-mole/min)
Obs
Pre
d

67
Fig
ure
3.2
6 C
om
par
iso
n o
f th
e ef
fect
of
CH
4 i
nle
t m
ole
fra
ctio
ns
on
th
e o
bse
rved
an
d M
od
el 3
pre
dic
ted
form
atio
n r
ates
of
BH
Cl 2
(T
=1
15
0oC
, y
BC
l 30=
0.0
84
in
hy
dro
gen
, y
BC
l30/y
CH
40=
2-4
.5,
sim
ult
aneo
us
anal
ysi
s)
0.0E
+00
1.0E
-04
2.0E
-04
3.0E
-04
4.0E
-04
5.0E
-04
00.
010.
020.
030.
040.
05
y C
H 40
AR BHCl2 (g-mole/min)
Obs
Pre
d
68
Model 4
In this model boron trichloride and hydrogen gases are adsorbed on
the solid surface. Then adsorbed boron trichloride reacts with gaseous
methane to produce an intermediate in the form of BHCs. Then boron
is added to BHCs in the successive reactions with gaseous boron
trichloride and hydrogen. In each successive reactions, HCl gas is
produced as a by-product. Adsorbed boron trichloride also reacts with
hydrogen, in the vicinity of a vacant site to produce adsorbed
dichloroborane, which then is desorbed back to the gaseous phase.
The rate of dichloroborane formation reaction is considered to be
assisted by this surface reaction series, in addition to the contribution
of gas phase formation reaction. The elementary reaction steps are;
BCl3(g) + s a1K BCl3s
BCl3s + CH4(g) c7k BHCs + 3HCl(g)
BHCs + BCl3(g) + H2(g) 3kB2Cs + 3HCl(g)
B2Cs + BCl3(g) + H2(g) + s b2k B3Cs + 2HCl(g) + Cls
B3Cs + BCl3(g) + H2(g) + s b3k B4Cs + 2HCl(g) + Cls
H2(g) + 2s a7K 2Hs
BCl3s + H2 + s d1k sBHCl2 + sHCl
sBHCl2 e1k BHCl2(g) + s
BCl3(g) + H2(g) gkBHCl2(g) + HCl(g)
Hs + Cls 10k HCl(g) + 2s
The rate expressions derived for Mechanism 4 are ;
69
21/2
Ha7BCla1
BClCHa1c7
B))P(KPK(1
PPKkR
23
34
4 C (3.31)
(3.32)
The rate parameters of this model was found by fitting the
experimental data to the rate expressions, simultaneously. The rate
parameters are given in Table 3.4. The simultaneous analysis of the
rate expressions with the experimental data predicted the BCl3 effect
on the formation rate of B4C well for low inlet BCl3 compositions
(See Figure 3.27). However at high BCl3 inlet molar fractions, the
model failed. For the effects of inlet CH4 and BCl3 molar fraction on
the BHCl2 formation rate and for the effect of inlet CH4 molar fraction
on B4C formation rate, the model does not give satisfactory fit to the
experimental data, either, as can be seen in Figures 3.28 through 3.30,
and corresponding correlation coefficient values given in Table 3.4.
Model 5
In this model, BCs is formed from the reaction of adsorbed boron
trichloride and gaseous methane in a reversible equilibrium reaction,
rather than an irreversible reaction. The rate limiting step is assumed
to be the step in which, boron carbide is formed on the solid surface.
This model assumes that, the adsorption term for hydrogen is
negligible, so hydrogen adsorption is not considered in the model.
Adsorbed dichloroborane is produced on the surface through the
reaction of adsorbed borontrichloride and gaseous hydrogen in an
equilibrium stage. Then dichloroborane is desorbed to the gaseous
23
23
32
2 HBClg21/2
Ha7BCla1
BClHa1d1
BHCl PPk))P(KPK(1
PPKkR
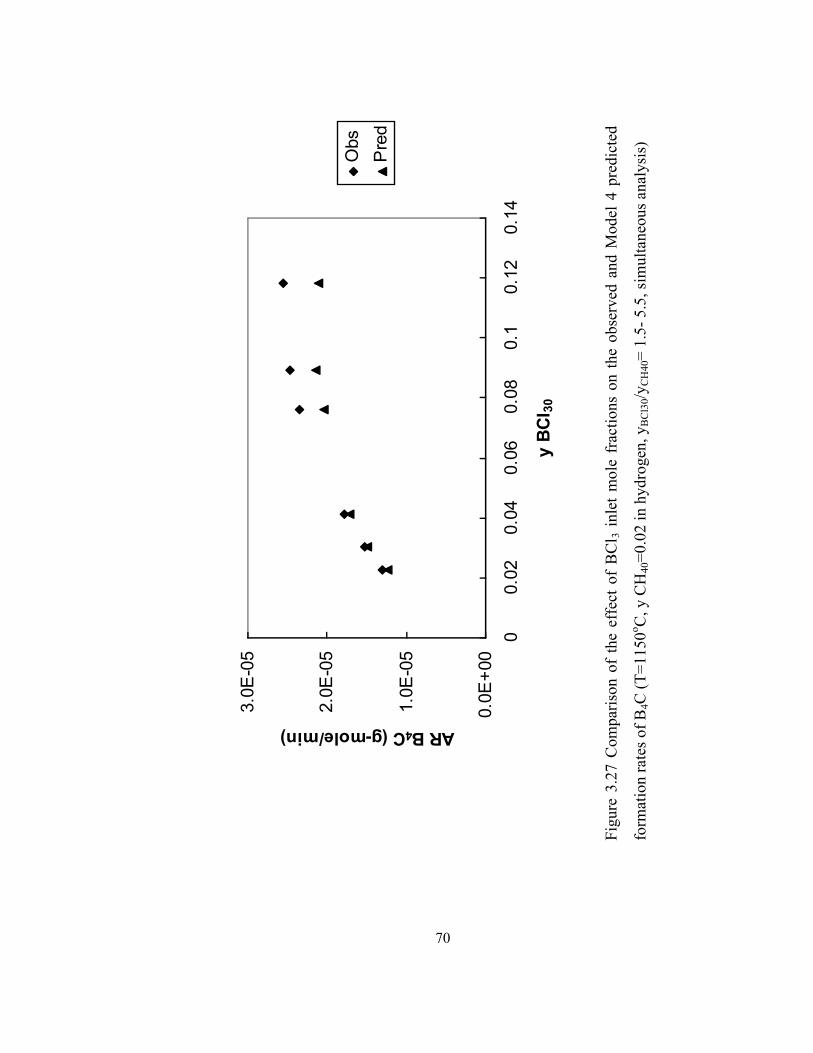
70
Fig
ure
3.2
7 C
om
par
iso
n o
f th
e ef
fect
of
BC
l 3 i
nle
t m
ole
fra
ctio
ns
on
th
e o
bse
rved
an
d M
od
el 4
pre
dic
ted
form
atio
n r
ates
of
B4C
(T
=1
15
0oC
, y
CH
40=
0.0
2 i
n h
yd
rog
en,
yB
Cl3
0/y
CH
40=
1.5
- 5
.5,
sim
ult
an
eou
s an
aly
sis)
0.0E
+00
1.0E
-05
2.0E
-05
3.0E
-05
00.
020.
040.
060.
080.
10.
120.
14
y B
Cl 30
AR B4C (g-mole/min)
Obs
Pre
d

71
Fig
ure
3.2
8 C
om
par
iso
n o
f th
e ef
fect
of
CH
4 i
nle
t m
ole
fra
ctio
ns
on
th
e o
bse
rved
an
d M
od
el 4
pre
dic
ted
form
atio
n r
ates
of
B4C
(T
=1
15
0oC
, y
BC
l 30=
0.0
84
in
hy
dro
gen
, y
BC
l30/y
CH
40=
2-4
.5,
sim
ult
an
eo
us
anal
ysi
s)
0.0E
+00
1.0E
-05
2.0E
-05
3.0E
-05
4.0E
-05
5.0E
-05
00.
010.
020.
030.
040.
05
y C
H 40
AR B4C (g-mole/min)
Obs
Pre
d

72
Fig
ure
3.2
9 C
om
par
iso
n o
f th
e ef
fect
of
BC
l 3 i
nle
t m
ole
fra
ctio
ns
on
th
e o
bse
rved
an
d M
od
el 4
pre
dic
ted
form
atio
n r
ates
of
BH
Cl 2
(T
=1
15
0oC
, y
CH
40=
0.0
2 i
n h
yd
rog
en,
yB
Cl3
0/y
CH
40=
1.5
- 5
.5,
sim
ult
aneo
us
anal
ysi
s)
0.0E
+00
2.0E
-04
4.0E
-04
6.0E
-04
8.0E
-04
00.
020.
040.
060.
080.
10.
120.
14
y B
Cl 30
AR BHCl2 (g-mole/min)
Obs
Pre
d

73
Fig
ure
3.3
0 C
om
par
iso
n o
f th
e ef
fect
of
CH
4 i
nle
t m
ole
fra
ctio
ns
on
th
e o
bse
rved
an
d M
od
el 4
pre
dic
ted
form
atio
n r
ates
of
BH
Cl 2
(T
=1
15
0oC
, y
BC
l 30=
0.0
84
in
hy
dro
gen
, y
BC
l30/y
CH
40=
2-4
.5,
sim
ult
aneo
us
anal
ysi
s)
0.0E
+00
1.0E
-04
2.0E
-04
3.0E
-04
4.0E
-04
5.0E
-04
00.
010.
020.
030.
040.
05
y C
H 40
AR BHCl2 (g-mole/min)
Obs
Pre
d
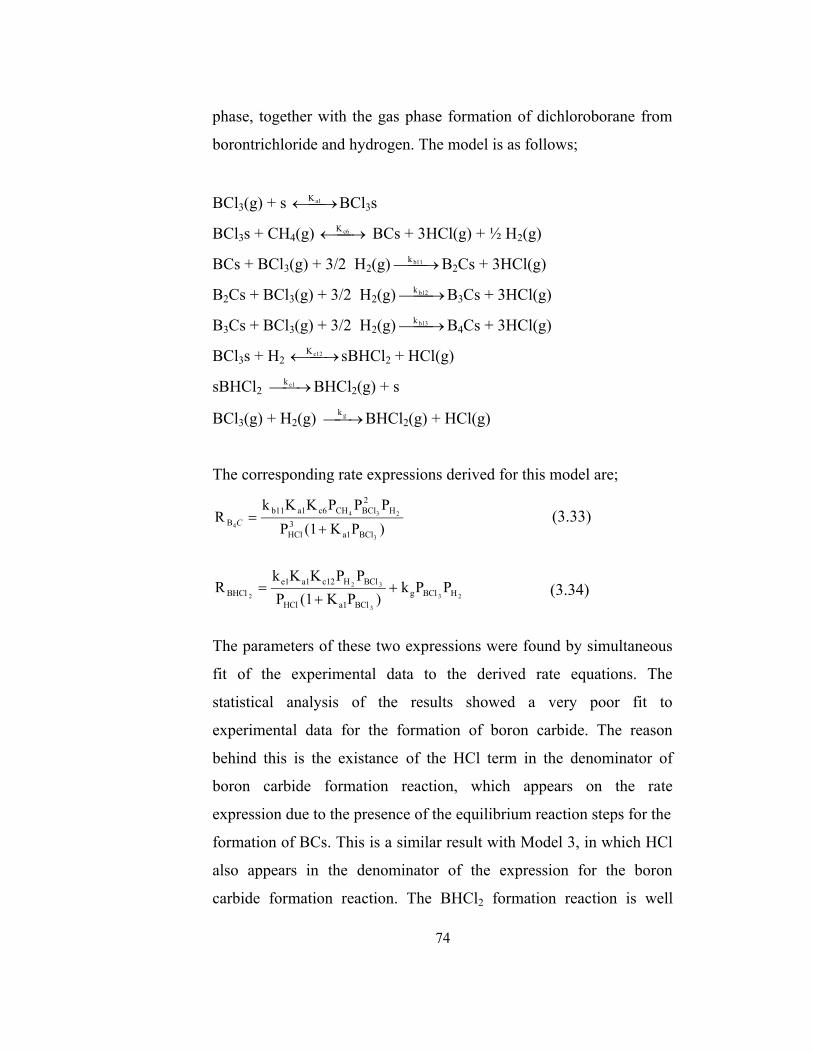
74
phase, together with the gas phase formation of dichloroborane from
borontrichloride and hydrogen. The model is as follows;
BCl3(g) + s a1K BCl3s
BCl3s + CH4(g) c6K BCs + 3HCl(g) + ½ H2(g)
BCs + BCl3(g) + 3/2 H2(g) b11k B2Cs + 3HCl(g)
B2Cs + BCl3(g) + 3/2 H2(g) b12k B3Cs + 3HCl(g)
B3Cs + BCl3(g) + 3/2 H2(g) b13k B4Cs + 3HCl(g)
BCl3s + H2 c12K sBHCl2 + HCl(g)
sBHCl2 e1k BHCl2(g) + s
BCl3(g) + H2(g) gkBHCl2(g) + HCl(g)
The corresponding rate expressions derived for this model are;
)PK(1P
PPPKKkR
3
234
4
BCla1
3
HCl
H
2
BClCHc6a1b11
B
C (3.33)
(3.34)
The parameters of these two expressions were found by simultaneous
fit of the experimental data to the derived rate equations. The
statistical analysis of the results showed a very poor fit to
experimental data for the formation of boron carbide. The reason
behind this is the existance of the HCl term in the denominator of
boron carbide formation reaction, which appears on the rate
expression due to the presence of the equilibrium reaction steps for the
formation of BCs. This is a similar result with Model 3, in which HCl
also appears in the denominator of the expression for the boron
carbide formation reaction. The BHCl2 formation reaction is well
23
3
32
2 HBClg
BCla1HCl
BClHc12a1e1
BHCl PPk)PK(1P
PPKKkR

75
described for this model, on the other hand, with an R-squared value
of 0.894. The results are depicted in Figures 3.31, 3.32, 3.33 and 3.34.
Model 6
In model 6, boron trichloride and hydrogen gases are adsorbed on the
solid surface and then adsorbed boron trichloride reacts with gaseous
methane to yield adsorbed BC. The adsorbed BC, reacts with boron
trichloride and hydrogen gases to produce B2Cs, B3Cs and finally B4C
in series reactions.
Adsorbed chlorine that is produced in the elementary steps of B4C
formation mechanism, reacts immediately with adsorbed hydrogen to
release HCl into the gas phase. Beside the gas phase reaction,
dichloroborane is produced also on the surface, in a three site reaction
of adsorbed boron trichloride with adsorbed hydrogen. Model 6
reactions are listed as follows;
BCl3(g) + s a1K BCl3s
BCl3s + CH4(g) c6k BCs + 3HCl(g) + ½ H2(g)
BCs + BCl3(g) + H2(g) + s b1k B2Cs + 2HCl(g) + Cls
B2Cs + BCl3(g) + H2(g) + s b2k B3Cs + 2HCl(g) + Cls
B3Cs + BCl3(g) + H2(g) +s b3k B4Cs + 2HCl(g) + Cls
H2 + 2s a7K 2Hs
Hs + Cls 10k HCl(g) + 2s
BCl3s + 2Hs d4k BHCl2(g) + HCl(g) + 3s
BCl3(g) + H2(g) gkBHCl2(g) + HCl(g)

76
Fig
ure
3.3
1 C
om
par
iso
n o
f th
e ef
fect
of
BC
l 3 i
nle
t m
ole
fra
ctio
ns
on
th
e o
bse
rved
an
d M
od
el 5
pre
dic
ted
form
atio
n r
ates
of
B4C
(T
=1
15
0oC
, y
CH
40=
0.0
2 i
n h
yd
rog
en,
yB
Cl3
0/y
CH
40=
1.5
- 5
.5,
sim
ult
an
eou
s an
aly
sis)
0.0E
+00
1.0E
-05
2.0E
-05
3.0E
-05
4.0E
-05
00.
020.
040.
060.
080.
10.
120.
14
y B
Cl 30
AR B4C (g-mole/min)
Obs
Pre
d
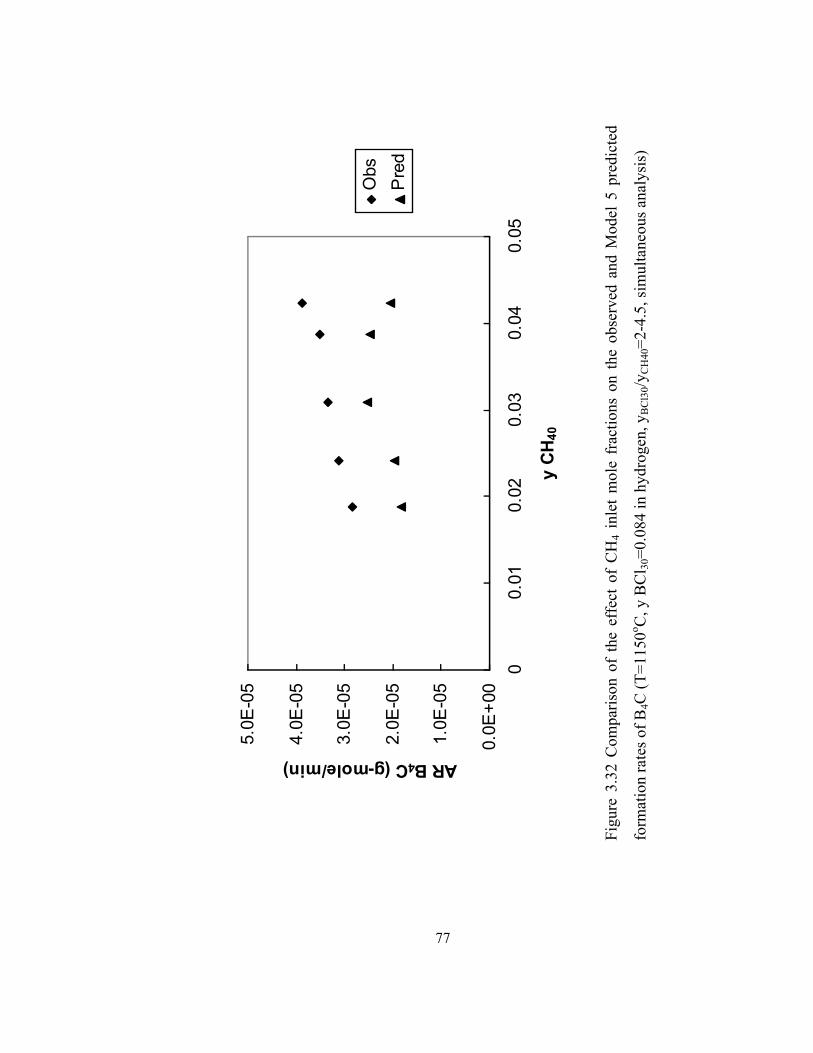
77
Fig
ure
3.3
2 C
om
par
iso
n o
f th
e ef
fect
of
CH
4 i
nle
t m
ole
fra
ctio
ns
on
th
e o
bse
rved
an
d M
od
el 5
pre
dic
ted
form
atio
n r
ates
of
B4C
(T
=1
15
0oC
, y
BC
l 30=
0.0
84
in
hy
dro
gen
, y
BC
l30/y
CH
40=
2-4
.5,
sim
ult
an
eo
us
anal
ysi
s)
0.0E
+00
1.0E
-05
2.0E
-05
3.0E
-05
4.0E
-05
5.0E
-05
00.
010.
020.
030.
040.
05
y C
H 40
AR B4C (g-mole/min)
Obs
Pre
d

78
Fig
ure
3.3
3 C
om
par
iso
n o
f th
e ef
fect
of
BC
l 3 i
nle
t m
ole
fra
ctio
ns
on
th
e o
bse
rved
an
d M
od
el 5
pre
dic
ted
form
atio
n r
ates
of
BH
Cl 2
(T
=1
15
0oC
, y
CH
40=
0.0
2 i
n h
yd
rog
en,
yB
Cl3
0/y
CH
40=
1.5
- 5
.5,
sim
ult
aneo
us
anal
ysi
s)
0.0E
+00
2.0E
-04
4.0E
-04
6.0E
-04
8.0E
-04
00.
020.
040.
060.
080.
10.
120.
14
y B
Cl 30
AR BHCl2 (g-mole/min)
Obs
Pre
d

79
Fig
ure
3.3
4 C
om
par
iso
n o
f th
e ef
fect
of
CH
4 i
nle
t m
ole
fra
ctio
ns
on
th
e o
bse
rved
an
d M
od
el 5
pre
dic
ted
form
atio
n r
ates
of
BH
Cl 2
(T
=1
15
0oC
, y
BC
l 30=
0.0
84
in
hy
dro
gen
, y
BC
l30/y
CH
40=
2-4
.5,
sim
ult
aneo
us
anal
ysi
s)
0.0E
+00
1.0E
-04
2.0E
-04
3.0E
-04
4.0E
-04
5.0E
-04
00.
010.
020.
030.
040.
05
y C
H 40
AR BHCl2 (g-mole/min)
Obs
Pre
d

80
The rate expressios derived from the model are;
1/2
Ha7BCla1
BClCHa1c6
B)P(KPK1
PPKkR
23
34
4 C (3.35)
(3.36)
The simultaneous fit of experimental data points to the equations
above, resulted in a very poor fit to predict the formation rate of boron
carbide. This can be clearly seen in Figures 3.35 and 3.36 for the
effects of inlet boron trichloride and methane gases on the boron
carbide formation rates, respectively. There is a little improvement in
predicting the formation rate of dichloroborane, considering the
previous models. The predicted rate parameters for the reactions and
corresponding R-squared values are given in Table 3.4.
Model 7
This model differs from the previous models in that it considers the
adsorption of methane gas on the solid surface. In previous models,
methane was reacted with adsorbed boron trichloride, namely through
Rideal Eley type of a reaction. In this model dissociative adsorption of
methane was assumed, to produce CH3s, which then reacted with
boron trichloride gas to form BCs. The other parts of the reaction
mechanism is similar to that of Model 6. The elementary recation
steps of this model are;
BCl3(g) + s a1K BCl3s
H2 + 2s a7K 2Hs
23
23
32
2 HBClg31/2
Ha7BCla1HCl
BClHa7a1d4
BHCl PPk))PKPK(1P
PPKKkR

81
Fig
ure
3.3
5 C
om
par
iso
n o
f th
e ef
fect
of
BC
l 3 i
nle
t m
ole
fra
ctio
ns
on
th
e o
bse
rved
an
d M
od
el 6
pre
dic
ted
form
atio
n r
ates
of
B4C
(T
=1
15
0oC
, y
CH
40=
0.0
2 i
n h
yd
rog
en,
yB
Cl3
0/y
CH
40=
1.5
- 5
.5,
sim
ult
an
eou
s an
aly
sis)
0.0E
+00
1.0E
-05
2.0E
-05
3.0E
-05
4.0E
-05
00.
020.
040.
060.
080.
10.
120.
14
y B
Cl 30
AR B4C (g-mole/min)
Obs
Pre
d
82
Fig
ure
3.3
6 C
om
par
iso
n o
f th
e ef
fect
of
CH
4 i
nle
t m
ole
fra
ctio
ns
on
th
e o
bse
rved
an
d M
od
el 6
pre
dic
ted
form
atio
n r
ates
of
B4C
(T
=1
15
0oC
, y
BC
l 30=
0.0
84
in
hy
dro
gen
, y
BC
l30/y
CH
40=
2-4
.5,
sim
ult
an
eo
us
anal
ysi
s)
0.0E
+00
1.0E
-05
2.0E
-05
3.0E
-05
4.0E
-05
5.0E
-05
00.
010.
020.
030.
040.
05
y C
H 40
AR B4C (g-mole/min)
Obs
Pre
d

83
Fig
ure
3.3
7 C
om
par
iso
n o
f th
e ef
fect
of
BC
l 3 i
nle
t m
ole
fra
ctio
ns
on
th
e o
bse
rved
an
d M
od
el 6
pre
dic
ted
form
atio
n r
ates
of
BH
Cl 2
(T
=1
15
0oC
, y
CH
40=
0.0
2 i
n h
yd
rog
en,
yB
Cl3
0/y
CH
40=
1.5
- 5
.5,
sim
ult
aneo
us
anal
ysi
s)
0.0E
+00
2.0E
-04
4.0E
-04
6.0E
-04
8.0E
-04
00.
020.
040.
060.
080.
10.
120.
14
y B
Cl 30
AR BHCl2 (g-mole/min)
Obs
Pre
d

84
Fig
ure
3.3
8 C
om
par
iso
n o
f th
e ef
fect
of
CH
4 i
nle
t m
ole
fra
ctio
ns
on
th
e o
bse
rved
an
d M
od
el 6
pre
dic
ted
form
atio
n r
ates
of
BH
Cl 2
(T
=1
15
0oC
, y
BC
l 30=
0.0
84
in
hy
dro
gen
, y
BC
l30/y
CH
40=
2-4
.5,
sim
ult
aneo
us
anal
ysi
s)
0.0E
+00
1.0E
-04
2.0E
-04
3.0E
-04
4.0E
-04
5.0E
-04
00.
010.
020.
030.
040.
05
y C
H 40
AR BHCl2 (g-mole/min)
Obs
Pre
d

85
CH4(g) + s 3k CH3s + ½ H2
BCl3(g) + CH3s 4k BCs + 3HCl(g)
BCs + BCl3(g) + H2(g) + s b1k B2Cs + 2HCl(g) + Cls
B2Cs + BCl3(g) + H2(g) + s b2k B3Cs + 2HCl(g) + Cls
B3Cs + BCl3(g) + H2(g) + s b3k B4C + 2HCl(g) + Cls
Hs + Cls 8k HCl(g) + 2s
BCl3s + H2(g) + s d1k BHCl2s + HCls(g)
BHCl2s e1k BHCl2(g) + s
BCl3(g) + H2(g) gkBHCl2(g) + HCl(g)
The rate expression derived for this model are as follows;
1/2
Ha7
BCl4
CH3
BCla1
BClCH3
B
)P(KPk
PkPK1
PPkR
2
3
4
3
34
4
C (3.37)
32
2
3
4
3
32
2 BClHg
1/2
Ha7
BCl4
CH3
BCla1
BClHa1d1
BH PPk
)P(KPk
PkPK1
PPKkR
Cl (3.38)
The details of the derivations are given in Appendix C.
The simultaneous analysis of these two rate expressions with the
experimental data gave poor aggrement (Figures 3.39 and 3.40)
especially for the BCl3 effect on the deposition rate of boron carbide.
The model increases the correlation coefficient up to 0.974 (square
root of R value) for the prediction of dichloroborane deposition rate
(Figures 3.41 and 3.42). The predicted model parameters and R-
squared values are given in Table 3.4.

86
Fig
ure
3.3
9 C
om
par
iso
n o
f th
e ef
fect
of
BC
l 3 i
nle
t m
ole
fra
ctio
ns
on
th
e o
bse
rved
an
d M
od
el 7
pre
dic
ted
form
atio
n r
ates
of
B4C
(T
=1
15
0oC
, y
CH
40=
0.0
2 i
n h
yd
rog
en,
yB
Cl3
0/y
CH
40=
1.5
- 5
.5,
sim
ult
an
eou
s an
aly
sis)
0.0E
+00
1.0E
-05
2.0E
-05
3.0E
-05
4.0E
-05
00.
020.
040.
060.
080.
10.
120.
14
y B
Cl 30
AR B4C (g-mole/min)
Obs
Pre
d
87
Fig
ure
3.4
0 C
om
par
iso
n o
f th
e ef
fect
of
CH
4 i
nle
t m
ole
fra
ctio
ns
on
th
e o
bse
rved
an
d M
od
el 7
pre
dic
ted
form
atio
n r
ates
of
B4C
(T
=1
15
0oC
, y
BC
l 30=
0.0
84
in
hy
dro
gen
, y
BC
l30/y
CH
40=
2-4
.5,
sim
ult
an
eo
us
anal
ysi
s)
0.0E
+00
1.0E
-05
2.0E
-05
3.0E
-05
4.0E
-05
5.0E
-05
00.
010.
020.
030.
040.
05
y C
H 40
AR B4C (g-mole/min)
Obs
Pre
d

88
Fig
ure
3.4
1 C
om
par
iso
n o
f th
e ef
fect
of
BC
l 3 i
nle
t m
ole
fra
ctio
ns
on
th
e o
bse
rved
an
d M
od
el 7
pre
dic
ted
form
atio
n r
ates
of
BH
Cl 2
(T
=1
15
0oC
, y
CH
40=
0.0
2 i
n h
yd
rog
en,
yB
Cl3
0/y
CH
40=
1.5
- 5
.5,
sim
ult
aneo
us
anal
ysi
s)
0.0E
+00
2.0E
-04
4.0E
-04
6.0E
-04
8.0E
-04
00.
020.
040.
060.
080.
10.
120.
14
y B
Cl 30
AR BHCl2 (g-mole/min)
Obs
Pre
d

89
Fig
ure
3.4
2 C
om
par
iso
n o
f th
e ef
fect
of
CH
4 i
nle
t m
ole
fra
ctio
ns
on
th
e o
bse
rved
an
d M
od
el 7
pre
dic
ted
form
atio
n r
ates
of
BH
Cl 2
(T
=1
15
0oC
, y
BC
l 30=
0.0
84
in
hy
dro
gen
, y
BC
l30/y
CH
40=
2-4
.5,
sim
ult
aneo
us
anal
ysi
s)
0.0E
+00
1.0E
-04
2.0E
-04
3.0E
-04
4.0E
-04
5.0E
-04
00.
010.
020.
030.
040.
05
y C
H 40
AR BHCl2 (g-mole/min)
Obs
Pre
d

90
Model 8
In this model, in addition to the adsorption of hydrogen and boron
trichloride to the solid surface, methane is also adsorbed on the
surface dissociatively in an equilibrium rection. Then BCs is formed
through a Langhmuir-Hinshelwood type of a reaction kinetics. The
formed BCs then reacts with adsorbed boron trichloride and gaseous
hydrogen to form boron carbide in successive steps. Dichloroborane,
on the other hand, is formed through two reactions. The gas phase
formation of dichloroborane involves the reaction between boron
trichloride and hydrogen gases. The surface reaction in formation of
dichloroborane involves the reaction between adsorbed boron
trichloride and gaseous hydrogen. The elementary reaction steps are as
follows;
BCl3(g) + s a1K BCl3s
H2(g) + 2s a7K 2Hs
CH4(g) + 2s a5K CH3s + Hs
BCl3s + CH3s c9k BCs + 3HCl(g) + s
BCs + BCl3s + H2(g) b8k B2Cs + 2HCl(g) + Cls
BCs + BCl3s + H2(g) b9k B3Cs + 2HCl(g) + Cls
BCs + BCl3s + H2(g) b10k B4Cs + 2HCl(g) + Cls
BCl3s + H2(g) d5k BHCl2(g) + HCl(g) + s
BCl3(g) + H2(g) gkBHCl2(g) + HCl(g)
The rate equations that are derived according to Model 8 are;
(3.39)
21/2
Ha21/2
H
1/2
a2
CHa5
BCla1
2/1
H
BClCH1/2
a2
a1a5c9
B
))P(KPK
PKPK(1P
PPK
KKk
R
2
2
4
32
34
4
C

91
(3.40)
The simultaneous fit of the experimental data to the model predicted
rate equations revealed nearly the same fit as in Model 7, for the
formation reaction of dichloroborane, with an R-squared value of
0.9255. The results are given in Figures 3.43, 3.44, 3.45 and 3.46. As
it is seen clearly from Figure 3.43 that, the model fails to predict the
rate of B4C formation reaction. The estimated parameters and the
corresponding R-squared values for Model 8 are given in Table 3.4.
Model 9
In this model, methane gas is adsorbed on the surface dissociatively to
produce adsorbed carbon. Adsorbed carbon is reacted with adsorbed
boron trichloride to form BCs, which then reacts with gaseous boron
trichloride and hydrogen, in successive steps, to obtain boron carbide
in solid form. The surface reaction in formation of dichloroborane
involves the reaction between adsorbed boron trichloride and adsorbed
hydrogen. The elementary reaction steps are;
BCl3(g) + s a1K BCl3s
H2(g) + 2s a7K 2Hs
CH4(g) + s a6k Cs + 2H2(g)
BCl3s + Cs + 2 H2 c10k BCs + 3HCl(g) + Hs
BCs + BCl3(g) + 3/2 H2(g) b11k B2Cs + 3HCl(g)
B2Cs + BCl3(g) + 3/2 H2(g) b12k B3Cs + 3HCl(g)
B3Cs + BCl3(g) + 3/2 H2(g) b13k B4Cs + 3HCl(g)
23
2
2
4
3
32
2 HBClg
1/2
Ha21/2
H
1/2
a2
CHa5
BCla1
BClHa1d5
BHCl PPk
))P(KPK
PKPK(1
PPKkR

92
Fig
ure
3.4
3 C
om
par
iso
n o
f th
e ef
fect
of
BC
l 3 i
nle
t m
ole
fra
ctio
ns
on
th
e o
bse
rved
an
d M
od
el 8
pre
dic
ted
form
atio
n r
ates
of
B4C
(T
=1
15
0oC
, y
CH
40=
0.0
2 i
n h
yd
rog
en,
yB
Cl3
0/y
CH
40=
1.5
- 5
.5,
sim
ult
an
eou
s an
aly
sis)
0.0E
+00
1.0E
-05
2.0E
-05
3.0E
-05
4.0E
-05
00.
020.
040.
060.
080.
10.
120.
14
y B
Cl 30
AR B4C (g-mole/min)
Obs
Pre
d

93
Fig
ure
3.4
4 C
om
par
iso
n o
f th
e ef
fect
of
CH
4 i
nle
t m
ole
fra
ctio
ns
on
th
e o
bse
rved
an
d M
od
el 8
pre
dic
ted
form
atio
n r
ates
of
B4C
(T
=1
15
0oC
, y
BC
l 30=
0.0
84
in
hy
dro
gen
, y
BC
l30/y
CH
40=
2-4
.5,
sim
ult
an
eo
us
anal
ysi
s)
0.0E
+00
1.0E
-05
2.0E
-05
3.0E
-05
4.0E
-05
5.0E
-05
00.
010.
020.
030.
040.
05
y C
H 40
AR B4C (g-mole/min)
Obs
Pre
d

94
Fig
ure
3.4
5 C
om
par
iso
n o
f th
e ef
fect
of
BC
l 3 i
nle
t m
ole
fra
ctio
ns
on
th
e o
bse
rved
an
d M
od
el 8
pre
dic
ted
form
atio
n r
ates
of
BH
Cl 2
(T
=1
15
0oC
, y
CH
40=
0.0
2 i
n h
yd
rog
en,
yB
Cl3
0/y
CH
40=
1.5
- 5
.5,
sim
ult
aneo
us
anal
ysi
s)
0.0E
+00
2.0E
-04
4.0E
-04
6.0E
-04
8.0E
-04
00.
020.
040.
060.
080.
10.
120.
14
y B
Cl 30
AR BHCl2 (g-mole/min)
Obs
Pre
d

95
Fig
ure
3.4
6 C
om
par
iso
n o
f th
e ef
fect
of
CH
4 i
nle
t m
ole
fra
ctio
ns
on
th
e o
bse
rved
an
d M
od
el 8
pre
dic
ted
form
atio
n r
ates
of
BH
Cl 2
(T
=1
15
0oC
, y
BC
l 30=
0.0
84
in
hy
dro
gen
, y
BC
l30/y
CH
40=
2-4
.5,
sim
ult
aneo
us
anal
ysi
s)
0.0E
+00
1.0E
-04
2.0E
-04
3.0E
-04
4.0E
-04
5.0E
-04
00.
010.
020.
030.
040.
05
y C
H 40
AR BHCl2 (g-mole/min)
Obs
Pre
d

96
BCl3s + 2Hs d4kBHCl2(g) + HCl(g) + 3s
BCl3(g) + H2(g) gkBHCl2(g) + HCl(g)
The model rate expressions derived for this model are;
22/1
H
1/2
a7BCla1
2/3
HBClCHa1c10a6
CB)P KPK(1
PPP K k kR
23
234
4 (3.41)
3
23
32
2 BClg32/1
H
1/2
a7BCla1
BClHa7a1d4
BHCl Pk)P K PK(1
PP K K kR
(3.42)
Where,
ka6kc10Ka1=60.3
Ka1=302.0
(Ka7)1/2
=38.58
kd4Ka1Ka7=3.6*10-3
kg=5.2*10-3
The simultaneous fit of the experimental data to the derived rate
expressions give poor fit for the formation of boron carbide on the
surface (Figures 3.47 and 3.48). For dichloroborane formation, model
predictions are well, for both boron trichloride and methane effects,
with an R-squard value of 0.924 (Figures 3.49 and 3.50).
Model 10
In model 10, boron trichloride is adsorbed on the surface
nondissociatively, whereas hydrogen and methane are adsorbed
dissociatively. BC is formed on the solid surface through the reaction
of adsorbed boron trichloride with adsorbed methane in the form of
CH3s. Produced BC is reacted in successive series reactions including

97
Fig
ure
3.4
7 C
om
par
iso
n o
f th
e ef
fect
of
BC
l 3 i
nle
t m
ole
fra
ctio
ns
on
th
e o
bse
rved
an
d M
od
el 9
pre
dic
ted
form
atio
n r
ates
of
B4C
(T
=1
15
0oC
, y
CH
40=
0.0
2 i
n h
yd
rog
en,
yB
Cl3
0/y
CH
40=
1.5
- 5
.5,
sim
ult
an
eou
s an
aly
sis)
0.0E
+00
1.0E
-05
2.0E
-05
3.0E
-05
00.
020.
040.
060.
080.
10.
120.
14
y B
Cl 30
AR B4C (g-mole/min)
Obs
Pre
d

98
Fig
ure
3.4
8 C
om
par
iso
n o
f th
e ef
fect
of
CH
4 i
nle
t m
ole
fra
ctio
ns
on
th
e o
bse
rved
an
d M
od
el 9
pre
dic
ted
form
atio
n r
ates
of
B4C
(T
=1
15
0oC
, y
BC
l 30=
0.0
84
in
hy
dro
gen
, y
BC
l30/y
CH
40=
2-4
.5,
sim
ult
an
eo
us
anal
ysi
s)
0.0E
+00
1.0E
-05
2.0E
-05
3.0E
-05
4.0E
-05
5.0E
-05
00.
010.
020.
030.
040.
05
y C
H 40
AR B4C (g-mole/min)
Obs
Pre
d

99
Fig
ure
3.4
9 C
om
par
iso
n o
f th
e ef
fect
of
BC
l 3 i
nle
t m
ole
fra
ctio
ns
on
th
e o
bse
rved
an
d M
od
el 9
pre
dic
ted
form
atio
n r
ates
of
BH
Cl 2
(T
=1
15
0oC
, y
CH
40=
0.0
2 i
n h
yd
rog
en,
yB
Cl3
0/y
CH
40=
1.5
- 5
.5,
sim
ult
aneo
us
anal
ysi
s)
0.0E
+00
2.0E
-04
4.0E
-04
6.0E
-04
8.0E
-04
00.
020.
040.
060.
080.
10.
120.
14
y B
Cl 30
AR BHCl2 (g-mole/min)
Obs
Pre
d
100
Fig
ure
3.5
0 C
om
par
iso
n o
f th
e ef
fect
of
CH
4 i
nle
t m
ole
fra
ctio
ns
on
th
e o
bse
rved
an
d M
od
el 9
pre
dic
ted
form
atio
n r
ates
of
BH
Cl 2
(T
=1
15
0oC
, y
BC
l 30=
0.0
84
in
hy
dro
gen
, y
BC
l30/y
CH
40=
2-4
.5,
sim
ult
aneo
us
anal
ysi
s)
0.0E
+00
1.0E
-04
2.0E
-04
3.0E
-04
4.0E
-04
5.0E
-04
00.
010.
020.
030.
040.
05
y C
H 40
AR BHCl2 (g-mole/min)
Obs
Pre
d

101
adsorbed boron trichloride and gaseous hydrogen. In the proposed
mechanism, dichloroborane is produced only through the gas phase
reaction between boron trichloride and hydrogen. The model
equations are as follows;
BCl3(g) + s a1K BCl3s
H2(g) + 2s a7K 2Hs
CH4(g) + 2s a5K CH3s + Hs
BCl3s + CH3s c9k BCs + 3HCl(g) + s
BCs + BCl3s + H2(g) b8k B2Cs + 2HCl(g) + Cls
B2Cs + BCl3s + H2(g) b9k B3Cs + 2HCl(g) + Cls
B3Cs + BCl3s + H2(g) b10k B4C + 2HCl(g) + Cls
Hs + Cls 10k HCl(g) + 2s
BCl3(g) + H2(g) gkBHCl2(g) + HCl(g)
The rate equations that are derived according to Model 10 are;
2
1/2
H
1/2
a7
CHa5
BCl3a1
2/1
H
BClCH1/2
a7
a1a5c9
B4C
)PK
PKPK1(P
PPK
KKk
R
2
4
2
34
(3.43)
(3.44)
The simultaneous fit of the experimental data to the model expression
gave good fits for the boron carbide and dichloroborane formation
reactions. The results are given in Figures 3.51 through 3.54.
Estimated model parameters together with the statistical R-squared
values are summerised in Table 3.4.
32 BClgBHCl PkR

102
Fig
ure
3.5
1 C
om
par
iso
n o
f th
e ef
fect
of
BC
l 3 i
nle
t m
ole
fra
ctio
ns
on
th
e o
bse
rved
an
d M
od
el 1
0 p
red
icte
d
form
atio
n r
ates
of
B4C
(T
=1
15
0oC
, y
CH
40=
0.0
2 i
n h
yd
rog
en,
yB
Cl3
0/y
CH
40=
1.5
- 5
.5,
sim
ult
an
eou
s an
aly
sis)
0.0E
+00
1.0E
-05
2.0E
-05
3.0E
-05
00.
020.
040.
060.
080.
10.
120.
14
y B
Cl 30
AR B4C (g-mole/min)
Obs
Pre
d

103
Fig
ure
3.5
2 C
om
par
iso
n o
f th
e ef
fect
of
CH
4 i
nle
t m
ole
fra
ctio
ns
on
th
e o
bse
rved
an
d M
od
el 1
0 p
red
icte
d
form
atio
n r
ates
of
B4C
(T
=1
15
0oC
, y
BC
l 30=
0.0
84
in
hy
dro
gen
, y
BC
l30/y
CH
40=
2-4
.5,
sim
ult
an
eo
us
anal
ysi
s)
0.0E
+00
1.0E
-05
2.0E
-05
3.0E
-05
4.0E
-05
5.0E
-05
00.
010.
020.
030.
040.
05
y C
H 40
AR B4C (g-mole/min)
Obs
Pre
d

104
Fig
ure
3.5
3 C
om
par
iso
n o
f th
e ef
fect
of
BC
l 3 i
nle
t m
ole
fra
ctio
ns
on
th
e o
bse
rved
an
d M
od
el 1
0 p
red
icte
d
form
atio
n r
ates
of
BH
Cl 2
(T
=1
15
0oC
, y
CH
40=
0.0
2 i
n h
yd
rog
en,
yB
Cl3
0/y
CH
40=
1.5
- 5
.5,
sim
ult
aneo
us
anal
ysi
s)
0.0E
+00
2.0E
-04
4.0E
-04
6.0E
-04
8.0E
-04
00.
020.
040.
060.
080.
10.
120.
14
y B
Cl 30
AR BHCl2 (g-mole/min)
Obs
Pre
d

105
Fig
ure
3.5
4 C
om
par
iso
n o
f th
e ef
fect
of
CH
4 i
nle
t m
ole
fra
ctio
ns
on
th
e o
bse
rved
an
d M
od
el 1
0 p
red
icte
d
form
atio
n r
ates
of
BH
Cl 2
(T
=1
15
0oC
, y
BC
l 30=
0.0
84
in
hy
dro
gen
, y
BC
l30/y
CH
40=
2-4
.5,
sim
ult
aneo
us
anal
ysi
s)
0.0E
+00
1.0E
-04
2.0E
-04
3.0E
-04
4.0E
-04
5.0E
-04
00.
010.
020.
030.
040.
05
y C
H 40
AR BHCl2 (g-mole/min)
Obs
Pre
d
106
The rate parameters for model 10 are,
1/2
a7
a1a5c9
K
KKk = 0.0682, Ka1 = 9.36,
1/2
a7
a5
K
K = 18.47, and kg = 0.00521
It is evident from Figures 3.51, 3.52, 3.53, and 3.54 that, the
experimental data was best described by Model 10. This model
predicts the deposition rate of B4C and BHCl2 well for the entire range
of parameters studied. The model does not consider the probable
surface reactions in the formation of BHCl2, and hence formation rate
is independent of methane partial pressure. This is also conformed by
the experimental observation in which dichloroborane formation rate
is almost unchanged with the variation of methane mole fraction.
107
Table 3.4 Model Parameters and Correlation Coefficients
Model Rate epressions drived fom proposed reaction
mechanisms
Parameters R2
B4
C R2
BHC2
1 21/2
Ha7
2
HCHa6BCla1
2
HCl
CHBCla6c1a1b7
B))P(K/PPKPK(1P
PPKKKkR
2243
43
4 C
23
2243
32
2
HBClg
31/2
Ha7
2
HCHa6BCla1
BClHa7a1d4
BHCl
PPk
))P(K/PPKPK(1
PPKKkR
a6c1a1b7 KKKk
=0.0874
a1K =3.6*10-6
a6K =35.2
a7K =1708.0
a7a1d4 KKk = 401.5
gk = 9.6*10-10
----
0.923
2
21/2
Ha71/2
H
BCl
1/2
a7d3c11
a2
BCl
d3c11
c11a2
B
))P(KP
P
)Kk(k
k(1
Pkk
kk
R
2
2
3
3
4
C
23
2
2
3
3
2
HBClg
21/2
Ha71/2
H
BCl
1/2
a7d3c11
a2
BCl
d3c11
d3
BHCl
PPk
))P(KP
P
)Kk(k
k(1
Pkk
k
R
d3c11
c11a2
kk
kk
= 31.1
1/2
a7d3c11
a2
)Kk(k
k
=
4.69*10-8
a7K = 472.82
d3c11
d3
kk
k
=472.8
gk = 2.73*10-14
0.221
0.925
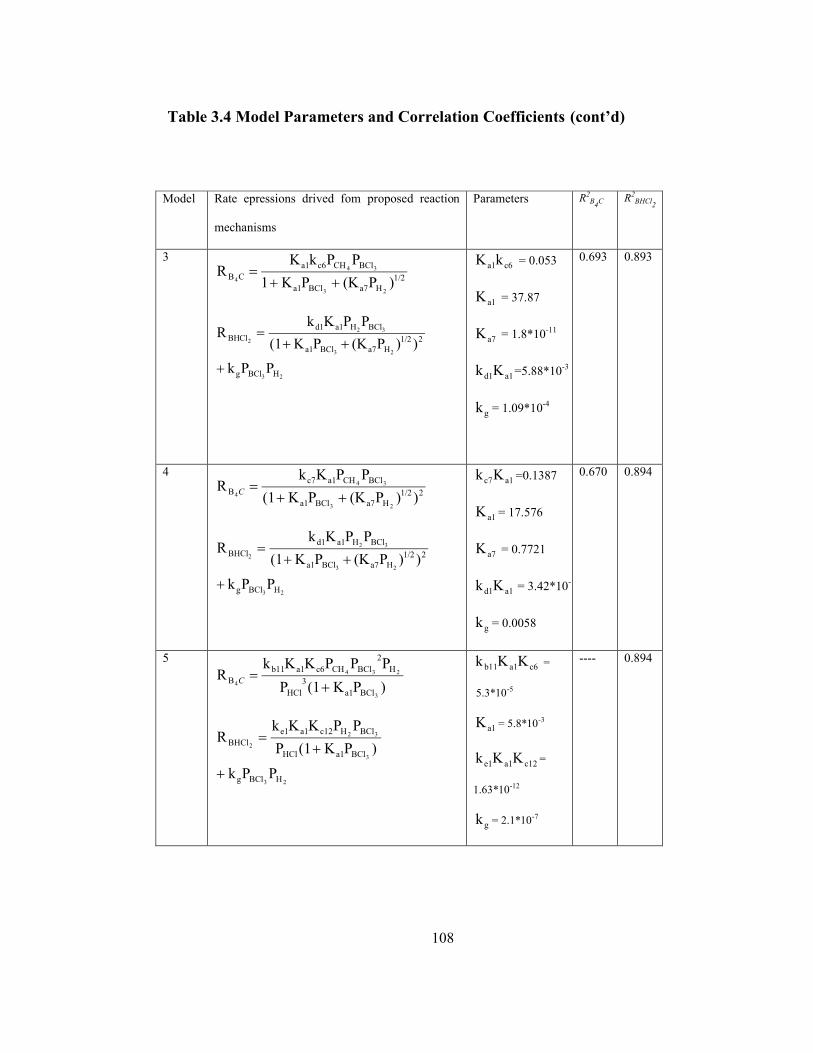
108
Table 3.4 Model Parameters and Correlation Coefficients (cont’d)
Model Rate epressions drived fom proposed reaction
mechanisms
Parameters R2B
4C R2
BHCl2
3
1/2
Ha7BCla1
BClCHc6a1
CB)P(KPK1
PPkKR
23
34
4
23
23
32
2
HBClg
21/2
Ha7BCla1
BClHa1d1
BHCl
PPk
))P(KPK(1
PPKkR
c6a1kK = 0.053
a1K = 37.87
a7K = 1.8*10-11
a1d1Kk =5.88*10-3
gk = 1.09*10-4
0.693
0.893
4
21/2
Ha7BCla1
BClCHa1c7
B))P(KPK(1
PPKkR
23
34
4 C
23
23
32
2
HBClg
21/2
Ha7BCla1
BClHa1d1
BHCl
PPk
))P(KPK(1
PPKkR
a1c7Kk =0.1387
a1K = 17.576
a7K = 0.7721
a1d1Kk = 3.42*10-10
gk = 0.0058
0.670
0.894
5
)PK(1P
PPPKKkR
3
234
4
BCla1
3
HCl
H
2
BClCHc6a1b11
B
C
23
3
32
2
HBClg
BCla1HCl
BClHc12a1e1
BHCl
PPk
)PK(1P
PPKKkR
c6a1b11 KKk =
5.3*10-5
a1K = 5.8*10-3
c12a1e1 KKk =
1.63*10-12
gk = 2.1*10-7
----
0.894

109
Table 3.4 Model Parameters and Correlation Coefficients (cont’d)
Model Rate epressions drived fom proposed reaction
mechanisms
Parameters R2B
4C R2
BHCl2
6
1/2
Ha7BCla1
BClCHa1c6
B)P(KPK1
PPKkR
23
34
4 C
23
23
32
2
HBClg
31/2
Ha7BCla1HCl
BClHa7a1d4
BHCl
PPk
))PKPK(1P
PPKKkR
a1c6Kk = 2.85
a1K = 2.0*10-5
a7K = 57343
a7a1d4 KKk =
53413
gk = 1.21*10-3
0.399
0.915
7
1/2
Ha7
BCl4
CH3
BCla1
BClCH3
B
)P(KPk
PkPK1
PPkR
2
3
4
3
34
4
C
32
2
3
4
3
32
2
BClHg
1/2
Ha7
BCl4
CH3
BCla1
BClHa1d1
BH
PPk
)P(KPk
PkPK1
PPKkR
Cl
3k = 2.656
a1K = 5.84*10-6
4
3
k
k = 154.9
a7K = 26670
a1d1Kk = 1.167
gk = 2.035*10-10
0.414
0.926
8
21/2
Ha21/2
H
1/2
a2
CHa5
BCla1
1/2
H
BClCH1/2
a2
a1a5c9
B
))P(KPK
PKPK(1P
PPK
KKk
R
2
2
4
32
34
4
C
23
2
2
4
3
32
2
HBClg
1/2
Ha21/2
H
1/2
a2
CHa5
BCla1
BClHa1d5
BHCl
PPk
))P(KPK
PKPK(1
PPKkR
1/2
a2
a1a5c9
K
KKk =
617.2
a1K = 1.02*10-5
1/2
a2
a5
K
K= 303.8
a2K = 53564
a1d5Kk = 68111
gk = 3.92*10-10
0.402
0.926

110
Table 3.4 Model Parameters and Correlation Coefficients (cont’d)
Model Rate epressions drived fom proposed reaction
mechanisms
Parameters R2B
4C R2
BHCl2
9
21/2
H
2/1
a7BCla1
3/2
HBClCHa1c10a6
CB)P KPK(1
PPP K k kR
23
234
4
3
23
32
2
BClg
31/2
H
1/2
a7BCla1
BClHa7a1d4
BHCl
Pk
)P K PK(1
PP K K kR
K k k a1c10a6 = 60.3
a1K = 302.0
a7K = 1488.4
a7a1d4 K K k =
3.6*10-3
gk = 5.2*10-3
0.754
0.955
10
2
1/2
H
1/2
a7
CHa5
BCla1
1/2
H
BClCH1/2
a7
a1a5c9
B
)PK
PKPK(1P
PPK
KKk
R
2
4
32
34
4
C
32 BClgBHCl PkR
1/2
a7
a1a5c9
K
KKk=0.0682
Ka1=9.36
1/2
a7
a5
K
K=18.47
kg=0.00521
0.977
0.948
In section 3.3, the formation rate of boron carbide was expressed in terms of an
Arrhenius type of a rate equation. In Figure 3.55, model predicted values of
B4C formation rates (mechanism model 10) were compared with the rate
values predicted from the Arrhenius equation. The correlation coefficient for
B4C formation rate was improved from 0.950 to 0.977, with the proposed
model (Model 10), so that the model predicted values are closer to the
experimentally observed values. Arrhenius type of rate expression is based
totally on the curve fitting of the experimental values to a single equation.
However, the modelling studies involve the theoretical correlations between
the reaction rates and elementary steps constituting the overall reaction
mechanism. So it is much more reliable, and efficient to describe the formation
rate for entire range of parameter variables.

111
Figure 3.55 Comparison of reaction rates pedicted by reaction
mechanism model 10 and Arrhenius equation with the
experimental data
3.5. Morphological Investigations of the Deposits
3.5.1. X-Ray Photoelectron Spectroscopy Results
The chemical compositions of the deposited films were determined by
XPS (Specs instruments) analyses which have been carried out with a
monochromatic MgKα (hw=1253.6eV) radiation. Survey scan showed
that the main ingredients of the films are boron and carbon, together

112
with a trace amount of oxygen (Figure 3.56). Despite the high purity
of gases employed and careful purging of the system before the
experiments, the oxygen intake of the films was seen clearly from the
obtained spectrum. The oxidation of boron carbide particles may be
attributed to the impingement of energetic oxygen particles onto the
substrate surface [1]. It is well known that molecular oxygen is not
very reactive in oxidation of boron carbides. However, the formation
of active oxygen ions in the boundary layer next to the substrate
surface may be the reason of the oxidation. On the other hand,
reaction with boron and carbon after adsorption of trace oxygen on the
B4C surface should not be ruled out as a possibility. After the survey
scan, the samples were bombarded with 3 keV Ar+ ions for 10
minutes, in order to investigate composition change between the
surface and the film bulk. In Figure 3.57, B1s, C1s and O1s spectra
obtained with the XPS scan before and after the sputtering process are
presented. Spectrum deconvolutions of each species were carried out
for the sputtered samples, which show the existence of different
chemical states. The deconvolution for the B1s spectrum (Fig.3.51.a)
shows the existence of the two possible boron chemical states with
binding energies centered at 188.3 and 192.4, which correspond to B-
C and B-O bonds, respectively [18].
The shift of B1s spectrum to higher binding energy values after
sputtering is attributed to the existence of the oxy-boron species in the
inner shells. C1s spectrum has a dominating peak at a binding energy
value of 282.9, which corresponds to carbide phase. The spectrum has
a shoulder on the left, which is due to the oxy -boron carbide species at
binding energy values of 286.4 (C=O) and 283.8 (C-O) [19]. The
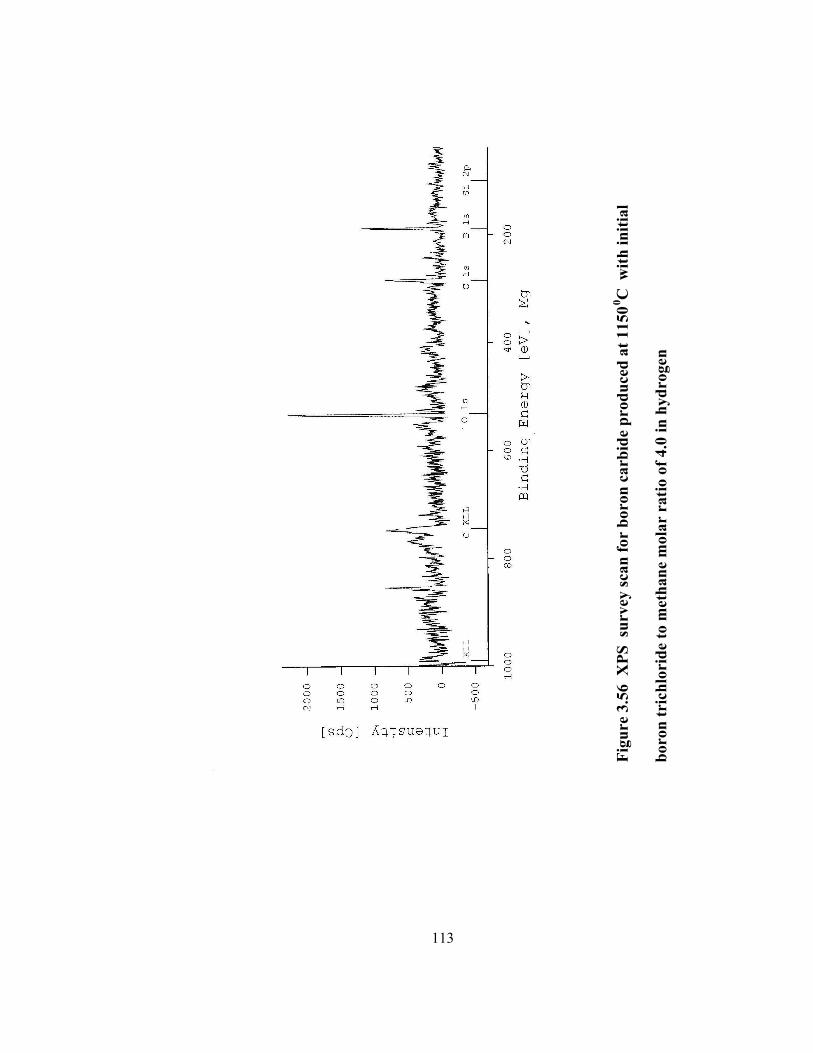
113
Fig
ure
3.5
6
XP
S
surv
ey s
can
fo
r b
oro
n c
arb
ide
pro
du
ced
at
11
50
0C
w
ith
in
itia
l
bo
ron
tri
ch
lori
de t
o m
eth
an
e m
ola
r ra
tio
of
4.0
in
hy
dro
gen

114
B1s
184189194
Binding Energy(eV)
Inte
nsity
(arb
. uni
ts)
a.
279284289Binding Energy(eV)
Inte
nsity
(arb
. uni
ts)
b.
C1s
526528530532534536538540
Binding Energy(eV)
Inte
nsity
(arb
. uni
ts) O1s
c.
Figure 3.57 XPS spectra of the produced solid phase before
(circles) and after (dots) the sputtering process and spectrum
deconvolutions (deconvoluted components (dashed lines), fitted
results (solid lines)) (T=1150oC, yBCl3/yCH4=4.0 in hydrogen)
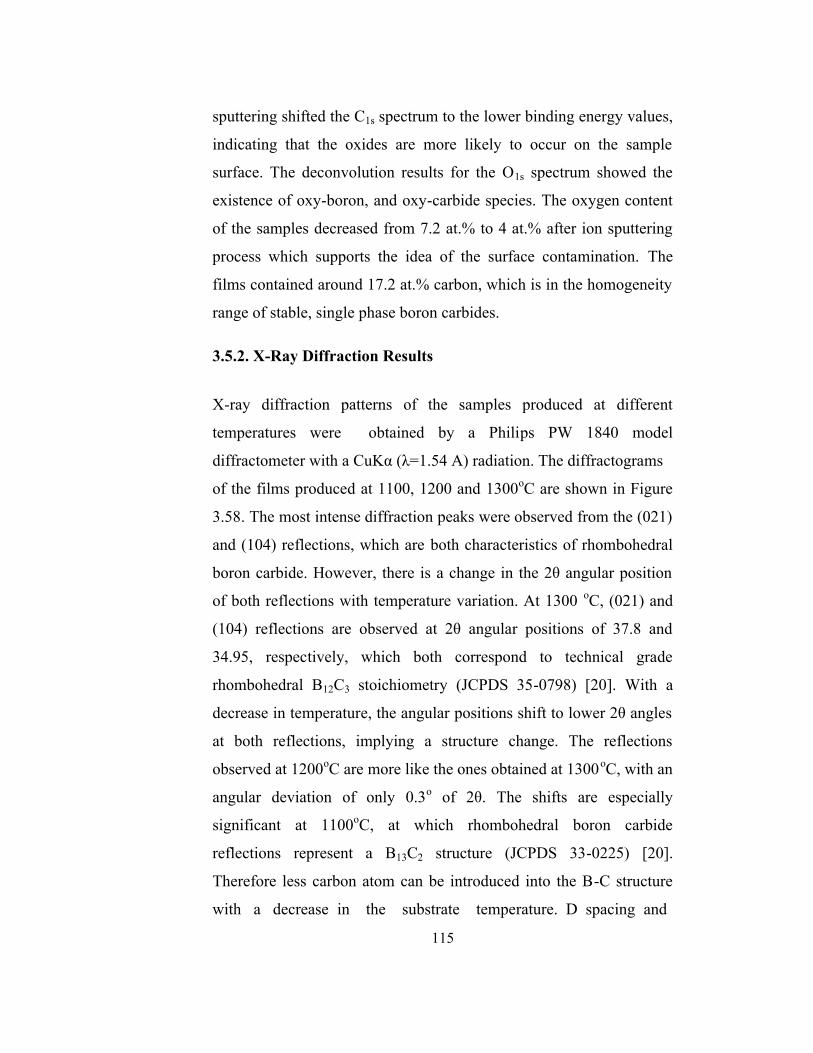
115
sputtering shifted the C1s spectrum to the lower binding energy values,
indicating that the oxides are more likely to occur on the sample
surface. The deconvolution results for the O1s spectrum showed the
existence of oxy-boron, and oxy-carbide species. The oxygen content
of the samples decreased from 7.2 at.% to 4 at.% after ion sputtering
process which supports the idea of the surface contamination. The
films contained around 17.2 at.% carbon, which is in the homogeneity
range of stable, single phase boron carbides.
3.5.2. X-Ray Diffraction Results
X-ray diffraction patterns of the samples produced at different
temperatures were obtained by a Philips PW 1840 model
diffractometer with a CuKα (λ=1.54 A) radiation. The diffractograms
of the films produced at 1100, 1200 and 1300oC are shown in Figure
3.58. The most intense diffraction peaks were observed from the (021)
and (104) reflections, which are both characteristics of rhombohedral
boron carbide. However, there is a change in the 2θ angular position
of both reflections with temperature variation. At 1300 oC, (021) and
(104) reflections are observed at 2θ angular positions of 37.8 and
34.95, respectively, which both correspond to technical grade
rhombohedral B12C3 stoichiometry (JCPDS 35-0798) [20]. With a
decrease in temperature, the angular positions shift to lower 2θ angles
at both reflections, implying a structure change. The reflections
observed at 1200oC are more like the ones obtained at 1300
oC, with an
angular deviation of only 0.3o of 2θ. The shifts are especially
significant at 1100oC, at which rhombohedral boron carbide
reflections represent a B13C2 structure (JCPDS 33-0225) [20].
Therefore less carbon atom can be introduced into the B-C structure
with a decrease in the substrate temperature. D spacing and
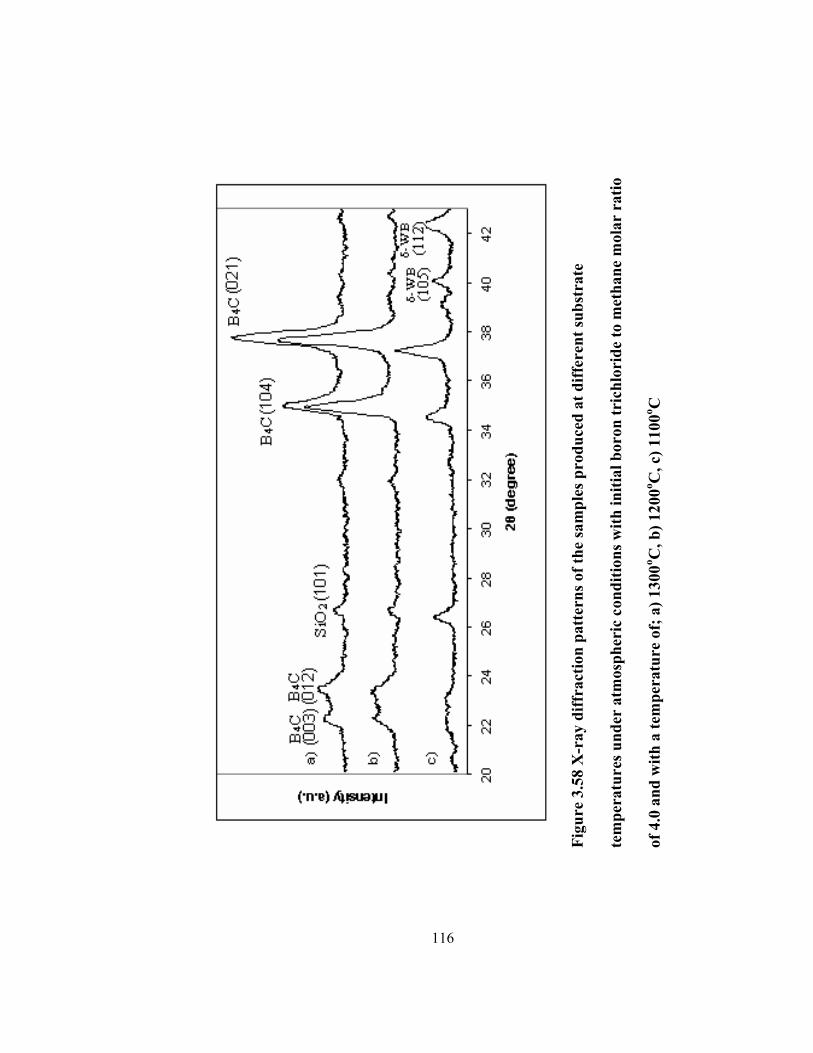
116
Fig
ure
3.5
8 X
-ra
y d
iffr
act
ion
pa
tter
ns
of
the
sam
ple
s p
rod
uce
d a
t d
iffe
ren
t su
bst
rate
tem
per
atu
res
un
der
atm
osp
her
ic c
on
dit
ion
s w
ith
in
itia
l b
oro
n t
rich
lori
de
to m
eth
an
e m
ola
r ra
tio
of
4.0
an
d w
ith
a t
emp
era
ture
of;
a)
13
00
oC
, b
) 1
20
0oC
, c)
11
00
oC
117
corresponding 2θ values for boron carbide and for some other
potential impurities in the products are listed in Appendix B.
In the unusual structure of the rhombohedral boron carbide, 5-fold
boron icosahedra are linked directly through covalent bonds and also
by a chain of three atoms located on the principal body diagonal of the
rhombohedron, as shown in Figure 1.1. 12-atom containing boron
icosahedra together with the 3 atom diagonal chain builds up a 15-
atom unit cell [21]. The change of the stoichiometry of our products
with temperature change is possibly due to the replacement of one
carbon atom with one boron atom in the C-B-C icosahedral chain,
leading B-B-C structure, at lower temperatures.
The occurrence of (101) SiO2 reflections are expected because the
samples were made powder in a pestle made of quartz, which may
possibly be scraped into the powder by harder boron carbide particles.
The presence of δ-WB is observed only at 1100oC with the
characteristic (105) and (112) reflections. This is a very meaningful
observation concerning the above discussion. At lower temperatures,
boron contents of the films are higher and more boron atoms could
have chance to diffuse through the substrate surface, forming tungsten
boride phases at the interface.
3.5.3. Scanning Electron Microscopy (SEM) Results
The temperature of the substrate surface is an important parameter
influencing the morphology of the products. It is well known that, the
deposits are better crystallized and the crystal grain size increases
when the temperature increases [10]. The surface morphologies of the
films observed in the jet stagnation region were characterized by SEM

118
(JOEL JSM-6400). Figure 3.59 shows the SEM images of the samples
produced at three different temperatures. At 1100oC, a few micron
size pyramidal crystal facets are seen.
At 1200oC, the grain size increases substantially up to around 5
micrometer. At this temperature the surface of the pyramidal geometry
is covered by tiny and uniform grains, which could be an indication of
a second nucleation and growth mechanism. At 1300oC, the surface is
covered by 10 to 40 micron size crystals having perfect 5-fold
icosahedral symmetry (Figure 3.59c). This is a very striking
observation because such large crystals having 5-fold symmetry are
rare in previous studies and in nature due to the lack of long-range
translational symmetry for those crystals [22]. It is known that, if the
extremities of a single crystal are permitted to grow without any
external constraint, the crystal will assume a regular geometric shape
having flat faces, and its shape is indicative of the crystal system. The
basic icosahedral units of B4C structure (Figure 1.1) could act as
nuclei to build up large micrometer scale icosahedral crystals with 5-
fold symmetry [22]. The mechanical properties of boron carbides
consisting of such massive icosahedral crystals could be improved
further because of high degree of symmetry observed. Quite a number
of massive 5-fold icosahedral crystals with a grain sizes larger than 30
micrometer can easily be seen in Figure 3.59c.
3.5.4 Effect of Deposition Temperature on the Hardness of Boron
Carbide
Boron carbide is an important ceramic material because of its high
hardness and strength. In general, such mechanical properties are

119
Figure 3.59 SEM images of the samples produced at different
temperatures (P=1 atm., yCH4/yBCl3=0.25 in hydrogen at reactor
inlet) a) 1100oC; b) 1200
oC; c) 1300
oC

120
highly dependent upon the chemical composition and microstructure.
In the previous sections, the effect of temperature on the chemical
composition and microstructure of the deposited boron carbide was
investigated. In this section, the effect of deposition temperature on
hardness of boron carbide will be discussed. The hardness values of
boron carbides produced by different methods are widely scattered.
Conventional high temperature B4C production methods usually result
in impurities, among them graphite, or free carbon, are the most
observed ones. Such impurities are believed to be the main reason
behind the widely scattered hardness values. On the other hand,
because of its extremely high hardness values, the sample preparation
for hardness measurements of boron carbide is very difficult. This is
another reason for highly scattered hardness results, and the
comparisons between them are difficult [23].
Vickers hardness measurement method is a standard method to
determine the hardness of materials, which has extremely hard
surfaces like boron carbide. In this study, the hardness measurements
were carried out using a microhardness tester (Instron Tukon 2100B)
having a diamond pyramid indenter. Surfaces of the specimens should
be flat and polished, for any microhardness measurement method. For
that reason, boron carbide samples were first polished prior to the
hardness analyses.
The samples were first buried into a bakalite mould, and then coarse
polishing was made using SiC sandpapers. However, since the
hardness of the B4C samples were greater than SiC, fine polishing of
the surfaces was not possible. The reason for SiC treatment was
basically to remove excess bakelite material to have a flat surface for

121
diamond polishing. Diamond paste having 3 μm particle sizes was
used for fine polishing in a Metkon-Gripo polisher. After diamond
treatment, boron carbide surfaces were well polished and flat for the
microhardness analyses. The indenter employed in Vickers test is a
square based pyramid with an apex angle of 136o (Figure 3.60). The
diamond indenter is pressed into the surface of the material with a 9.8
N load. The size of the indentation on the substrate surface is
measured with an optical microscope.
The hardness value (Vickers number, HV) is calculated using the
following expression,
HV = 1.854 (F/D2) (3.45)
where F is the force applied in kilograms-force and D2 is the area of
indentation in mm2.
Figure 3.60 Vickers Hardness Test
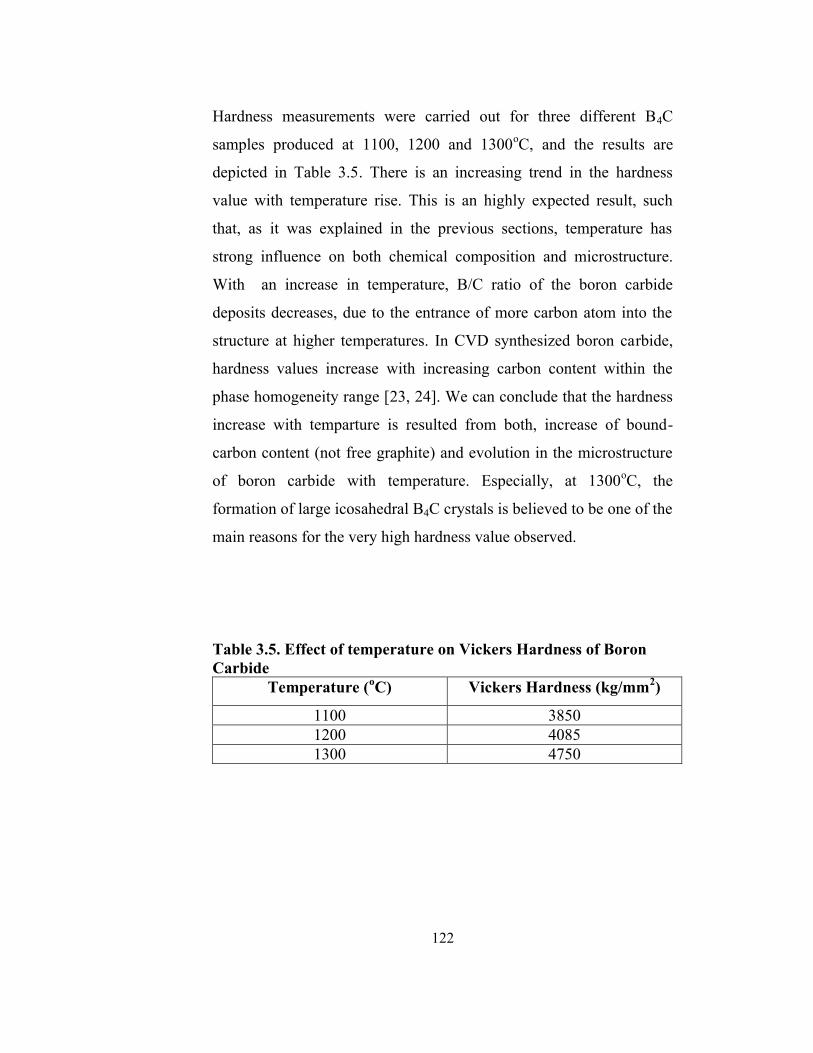
122
Hardness measurements were carried out for three different B4C
samples produced at 1100, 1200 and 1300oC, and the results are
depicted in Table 3.5. There is an increasing trend in the hardness
value with temperature rise. This is an highly expected result, such
that, as it was explained in the previous sections, temperature has
strong influence on both chemical composition and microstructure.
With an increase in temperature, B/C ratio of the boron carbide
deposits decreases, due to the entrance of more carbon atom into the
structure at higher temperatures. In CVD synthesized boron carbide,
hardness values increase with increasing carbon content within the
phase homogeneity range [23, 24]. We can conclude that the hardness
increase with temparture is resulted from both, increase of bound-
carbon content (not free graphite) and evolution in the microstructure
of boron carbide with temperature. Especially, at 1300oC, the
formation of large icosahedral B4C crystals is believed to be one of the
main reasons for the very high hardness value observed.
Table 3.5. Effect of temperature on Vickers Hardness of Boron
Carbide
Temperature (oC) Vickers Hardness (kg/mm
2)
1100 3850
1200 4085
1300 4750

123
CHAPTER 4
CONCLUSIONS AND RECOMMENDATIONS
The deposition of β-rhombohedral boron carbide on tungsten substrate
was achieved by a relatively simple process. Boron carbide deposition
was accompanied by the formation of a by-product, dichloroborane in
the gas phase, which was proven by FTIR spectrophotometer. The
formation of BHCl2 was attributed mainly to the gas phase reactions
whithin the thin thermal boundry layer next to the substrate surface. In
all of the conducted experiments, the rate of boron carbide formation
reaction was always lower than that of the dichloroborane formation
reaction. Both rates increase with an increase in the inlet molar
fraction of boron trichloride, although the B4C formation rate
stabilizes at high BCl3 inlet concentrations. This implies that the boron
carbide formation reaction may be surface reaction limited at that
temperature. All the collected kinetic data was fit in an Arrhenius type
of a model equation and the activation energy was found to be
56.1kJoule/mol. Exponents of methane and boron trichloride were
0.64 and 0.34, respectively, implying a complex reaction mechanism.
The observed correlation coefficient value after the nonlinear
regression analysis was 0.95, which actually needs to be improved by
assigning more realistic rate equations that are usually applied for

124
catalytic reactions. This was possible only by a detailed kinetic
modeling study.
In the kinetic modelling study, large number of reaction mechanisms
were proposed, and among them only the ones considering the
molecular adsorption of boron carbide on the substrate surface gave
reasonable fits. In the proposed model which best fits the experimental
data, hydrogen and methane are adsorbed dissociatively and adsorbed
boron trichloride is reduced by adsorbed methane to form an
intermediate BC molecule on the substrate surface. This intermediate
is reacted in successive series reactions including adsorbed boron
trichloride and adsorbed hydrogen to produce finally stoichiometric
B4C phase. The simultaneous fit of the experimental data to the model
expression gave good fits for the boron carbide and dichloroborane
formation reactions with the high correlation coefficient values.
The temperature of the substrate was found to have a great effect on
the film morphology and microstructure. XPS analysis shows the
existence of chemical states attributed to the boron carbide phase,
together with the existence of oxy-boron carbide species. The carbon
concentration of the products decreased with a decrease in the
substrate temperature, which was attributed to the replacement of one
carbon atom with one boron atom in the C-B-C icosahedral chain,
leading B-B-C structure, at lower temperatures. The change of surface
morphology with temperature was investigated and the production of
huge icosahedral boron carbide crystals having 5-fold symmetry at a
substrate temperature of 1300oC was accomplished. Deposition
temperature was also found to have great effect on micro-hardness of
the products, which was attributed to the dependence of

125
microstructure and chemical composition of the products on the
deposition temperature.
The dual impinging jet reactor configuration that was utilised in this
study is a powerfull tool to investigate the reaction kinetics including
complex surface reactions. However, the mass-production of boron
carbide on different substrates will require higher capacity industrial
reactors. For that reason, the kinetic data presented in this study
should be utilised in the process of designing industrial size reactors.
The design and fabrication of a pilot scale lab-to-fab reactor should be
considered to scale-up the process, to increase the commercial
potential, and to attract industrial attention.

126
REFERENCES
1. Ali O. Sezer, J.I. Brand, Materials Science and Engineering,
B79(2001), 191.
2. Zenghu Han, Geyang Li, Jiawan Tian, Mingyuan Gu, Materials
Letters, 57(2002), 899.
3. J.C. Oliveria, M.N. Oliviera, O. Conde, Surface and Coatings
Technology, 80(1996), 100.
4. D.R.Tallant, T.L.Aselage, A.N. Campbell, D.Emin, Journal of
Non-Crystalline Solids, 106(1988), 370.
5. Rointan F. Bunshah, Handbook of Hard Coatings; Noyes
Publications, 2000.
6. U.Cansson, J.O.Carlsson, B.Stridh, S.Söderberg, M.Olsson,
Thin Solid Films, 172(1989), 81.
7. A.A. Cochran and J.B. Stephenson, Metallurgical
Transactions, 1(1970), 2875.
8. K. Ploog, Journal of Crystal Growth, 24/25(1974), 197.
9. U. Casson and J.O. Carlsson, Thin Solid Films, 124(1985), 95.
10. L.G.Vandenbulcke, Ind. Eng. Chem., 24(1985), 568.
127
11. Y.M. Grigor’ev, V.A. Shugaev, A.S. Mukas’yan, N.G.
Samoilenko, A.A. Shiryaev, Russian Journal of Inorganic Chemistry,
35(1991), 1089.
12. S.V.Desphande, E. Gülari, S.J. Harris and A.M. Weiner,
Applied Physics Letters, 65(1994), 1757.
13. O.Conde, A.J. Silvestre, J.C. Oliviera, Surface and Coatings
Technology, 125(2000), 141.
14. S.N.Dilek, H.Ö.Özbelge, N.A. Sezgi, T.Doğu, Industrial &
Engineering Chemistry Research, 40(2001), 751.
15. Sezgi N.A., Doğu T., Özbelge H. Ö., ‘Kinetics of Boron Fiber
Formation’, PhD Thesis, Chemical Engineering Department, Middle
East Technical University, 1996.
16. Hooke R, Jeeves TA., J. of the ACM, 8(1961), 212-229.
17. Sezgi N.A., Dogu T., Ozbelge H.O., (1999). Chemical Engineering
Science, 54(1999), 3297.
18. W. J. Pan, J. Sun, H. Ling, N. Xu, Z. F. Ying, J. D. Wu,
Applied Surface Science, 218(2003) 297.
19. L. G. Jacobsohn, R. K. Schulze, M. E. H. Maia da Costa, M.
Nastasi, Surface Science, 572(2004) 418
20. Selected Powder Diffraction Data for Education and Training
Search Manual; International Centre for Diffraction Data, USA,
Volume 1/ Volume2, 1988.

128
21. H. O. Pierson, Handbook of Refractory Carbides and Nitrides:
Properties, Characteristics, Processing, and Applications; Noyes
Publications, Park Ridge N.J., 1996.
22. B. Wei, R. Vajtai, Y. J. Jung, F. Banhart, G. Ramanath, M. Ajayan,
The Journal of Physical Chemistry, 106(2002) 5807.
23. F. Thevenot, Journal of the European Ceramic Society,
6(1990), 205.
24. K. Niihara, A. Nakahira, T. Hirai, Journal of the American
Ceramic Society, 67(1984), C13.
25. J. Rey, G. Male, P. Kapsa, J. L. Loubet, Proc. 7th
Eur.
Conference CVD, France, 1989.
26. H. Martin, ‘Heat and Mass Transfer between Impinging Gas
Jets and Solid Surfaces’, in Advances in Heat Transfer, Vol. 13,
Academic Press, New York, 1977.
27. K. S. Raju, E. U. Schlünder, Heat and Mass Transfer,
10(1977), 131.
28. K. R. Hammond, Introduction to the Statistical Method, Knopf
Publications, New York, 1962.
29. M. Michaelidis, and R. Pollard, J. Electrochem. Soc., Solid
State Science and Technology, 131(1984), 860.

129
APPENDIX A
FTIR CALIBRATION METHODS
A.1 Calibration of Methane
Before starting calibration experiments, the system was purged with
helium in order to remove the impurities, e.g.moisture, oxygen, water
vapor, inside the gas cell of FTIR. After that, helium was closed and
hydrogen and methane gases were opened at 1 bar. The desired
methane concentration in the gas mixture was adjusted using mass
flow controllers, keeping the total gas flow rate at 200 mL/min, which
is the condition that will be applied during the actual experiments.
The FTIR spectra of the gas mixture passing through the experimental
system were taken occasionally, until the peak heights or areas were
fixed. When the peak areas or heights were fixed, that values and the
corresponding methane concentrations were recorded. The same
procedure was applied for different methane compositions and the
calibration curve for methane was plotted using the methane
composition versus corresponding FTIR peak heights (Figure A-1).
The relation between mole fraction of methane and the peak height
was found as;
yCH4 = 10.305HCH4
2 + 0.2794HCH4
+ 6x10-05
(A-1)
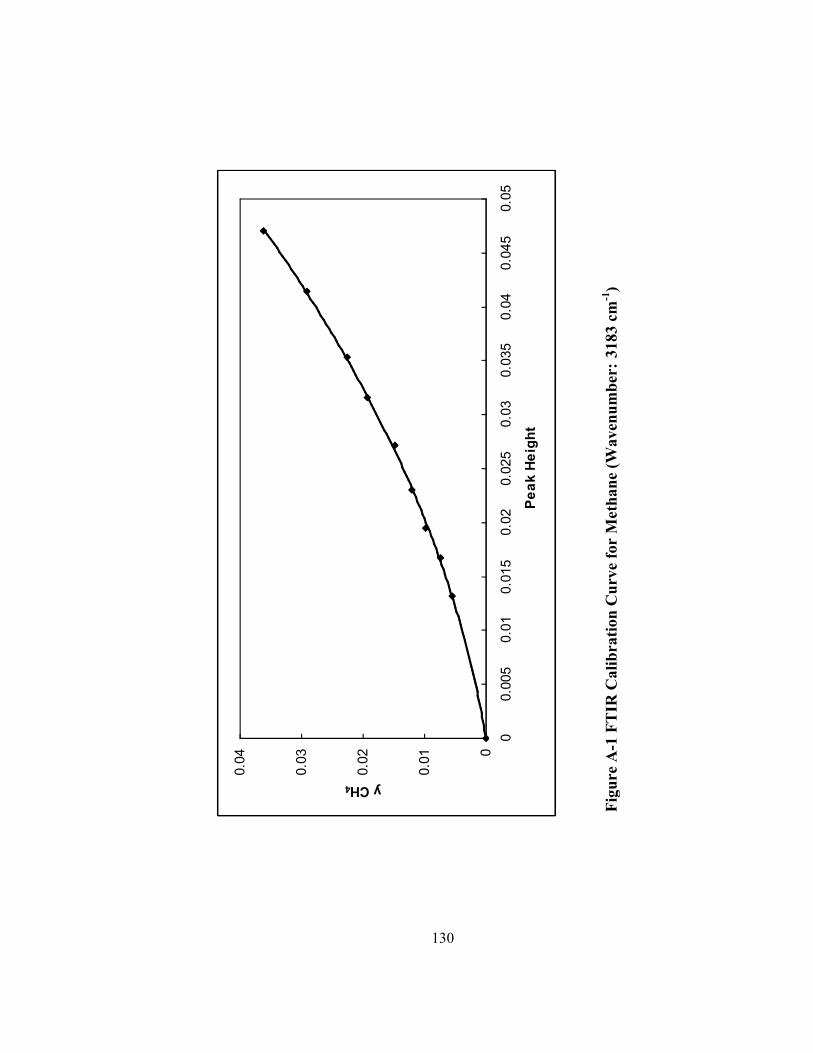
130
Fig
ure
A-1
FT
IR C
ali
bra
tio
n C
urv
e fo
r M
eth
an
e (W
av
enu
mb
er:
31
83
cm
-1)
0
0.01
0.02
0.03
0.04
00.
005
0.01
0.01
50.
020.
025
0.03
0.03
50.
040.
045
0.05
Pea
k H
eigh
t
y CH4
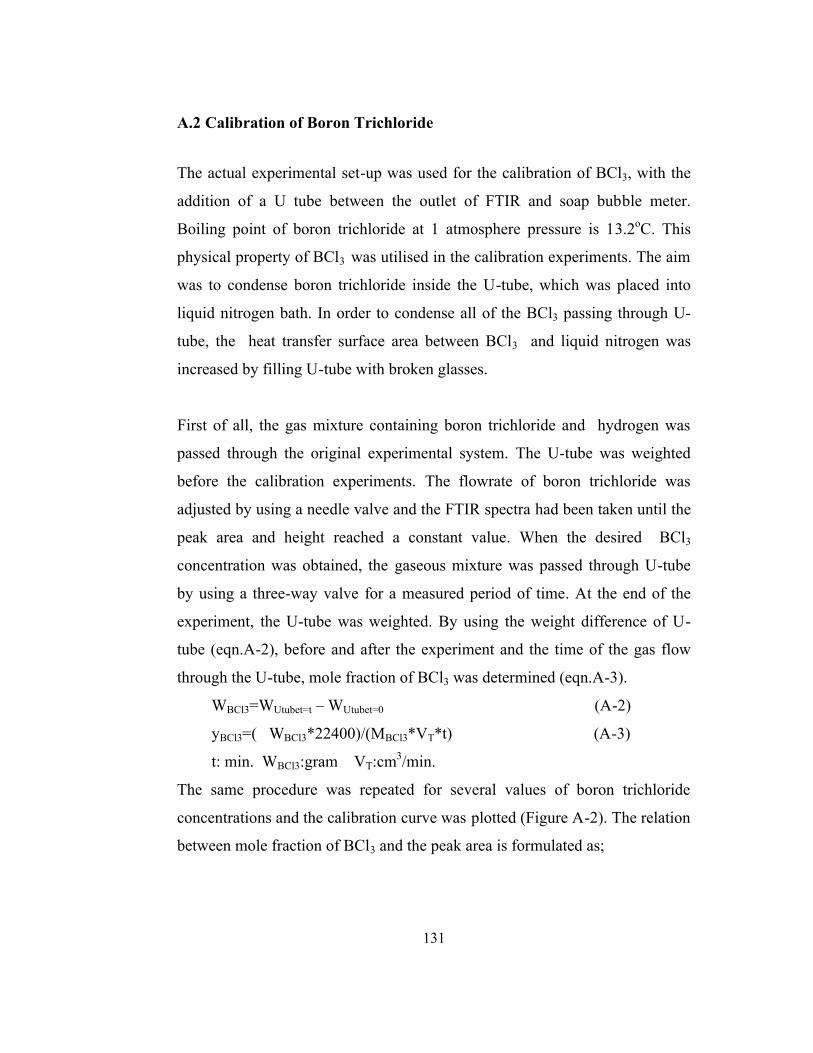
131
A.2 Calibration of Boron Trichloride
The actual experimental set-up was used for the calibration of BCl3, with the
addition of a U tube between the outlet of FTIR and soap bubble meter.
Boiling point of boron trichloride at 1 atmosphere pressure is 13.2oC. This
physical property of BCl3 was utilised in the calibration experiments. The aim
was to condense boron trichloride inside the U-tube, which was placed into
liquid nitrogen bath. In order to condense all of the BCl3 passing through U-
tube, the heat transfer surface area between BCl3 and liquid nitrogen was
increased by filling U-tube with broken glasses.
First of all, the gas mixture containing boron trichloride and hydrogen was
passed through the original experimental system. The U-tube was weighted
before the calibration experiments. The flowrate of boron trichloride was
adjusted by using a needle valve and the FTIR spectra had been taken until the
peak area and height reached a constant value. When the desired BCl3
concentration was obtained, the gaseous mixture was passed through U-tube
by using a three-way valve for a measured period of time. At the end of the
experiment, the U-tube was weighted. By using the weight difference of U-
tube (eqn.A-2), before and after the experiment and the time of the gas flow
through the U-tube, mole fraction of BCl3 was determined (eqn.A-3).
WBCl3=WUtubet=t – WUtubet=0 (A-2)
yBCl3=( WBCl3*22400)/(MBCl3*VT*t) (A-3)
t: min. WBCl3:gram VT:cm3/min.
The same procedure was repeated for several values of boron trichloride
concentrations and the calibration curve was plotted (Figure A-2). The relation
between mole fraction of BCl3 and the peak area is formulated as;
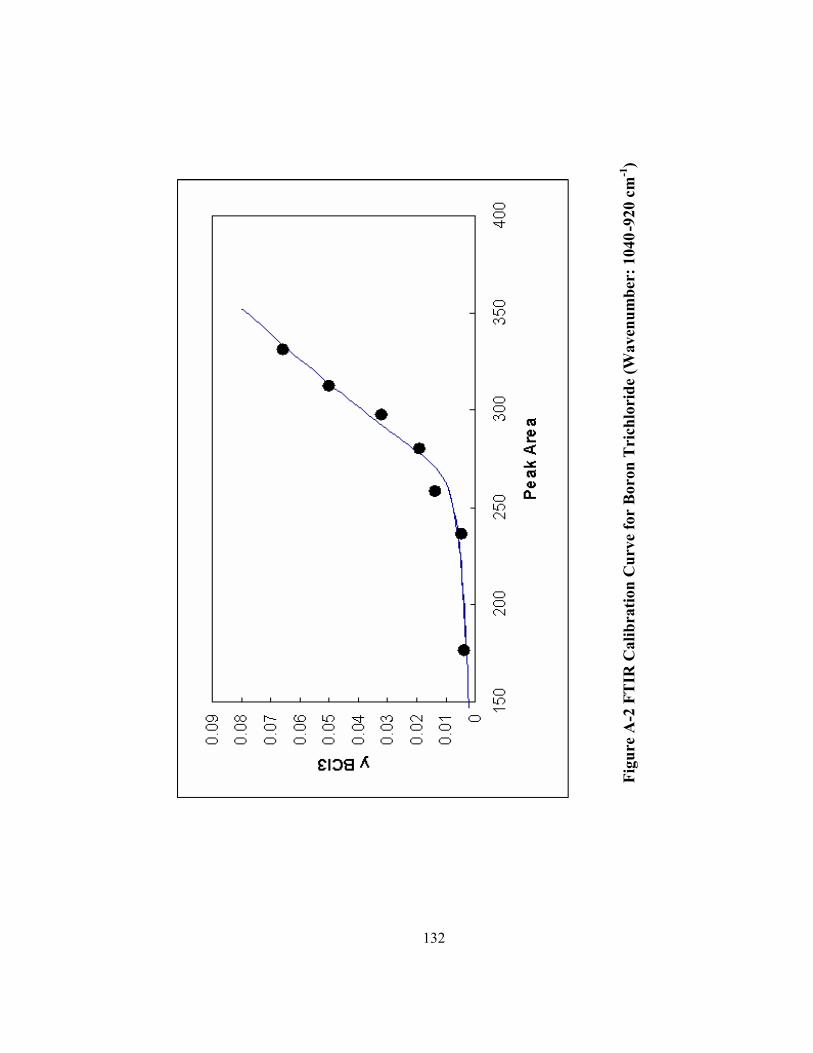
132
Fig
ure
A-2
FT
IR C
ali
bra
tio
n C
urv
e fo
r B
oro
n T
rich
lori
de
(Wa
ven
um
ber
: 1
04
0-9
20
cm
-1)

133
2
BCl3
5-
BCl3
2-
BCl3
-6-3
BClx0.9023x10x0.5977x10-(1
xx10454.00.5097x10(y
3 AA
A
(A-4)
A.3 Calibration of Hydrogen Chloride
In the calibration experiments of hydrogen chloride gas, helium was used as
carrier gas instead of hydrogen. Calibration experiments were carried out
using the actual experimental set up, except that methane gas tube was
replaced with that of hydrogen chloride. The flowrate of HCl was controlled
by means of a rotameter. Before starting the calibration experiments, the
system was purged with helium in order to remove impurities. After that, the
flowrates of HCl and helium was adjusted, keeping the total volumetric flow
rate constant at 200 mL/min. The peak height of HCl was read during the
experiments at the same wavenumber. At the end, peak heights of HCl
corresponding to different HCl concentrations was plotted (Figure A-3).
Equation A-5 gives the relation between mole fraction of HCl and the peak
height at a given wavenumber.
yHCl = -1.2754xH3
HCl+0.8281xH2
HCl+0.0409xHHCl (A.5)

134
Fig
ure
A-3
FT
IR C
ali
bra
tio
n C
urv
e fo
r H
yd
roch
lori
c A
cid
(W
av
enu
mb
er:
27
89
cm
-1)
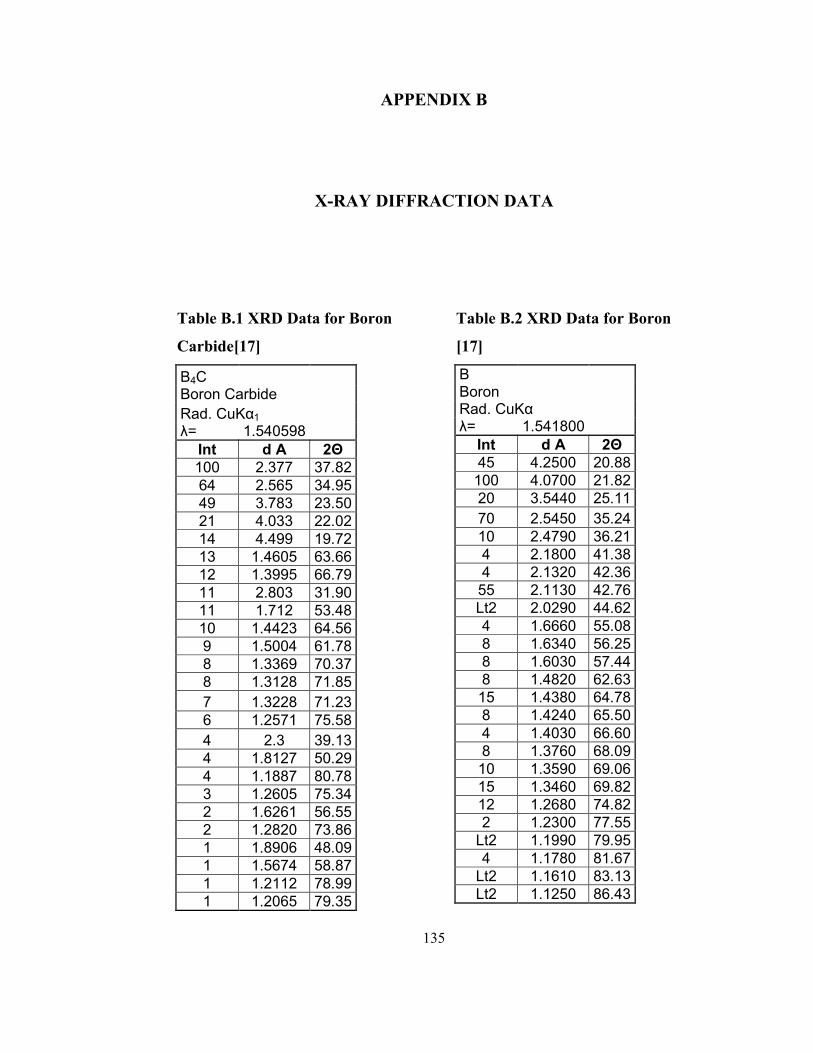
135
APPENDIX B
X-RAY DIFFRACTION DATA
Table B.1 XRD Data for Boron
Carbide[17]
B4C Boron Carbide Rad. CuKα1 λ= 1.540598
Int d A 2Θ 100 2.377 37.82 64 2.565 34.95 49 3.783 23.50 21 4.033 22.02 14 4.499 19.72 13 1.4605 63.66 12 1.3995 66.79 11 2.803 31.90 11 1.712 53.48 10 1.4423 64.56 9 1.5004 61.78 8 1.3369 70.37 8 1.3128 71.85 7 1.3228 71.23 6 1.2571 75.58 4 2.3 39.13 4 1.8127 50.29 4 1.1887 80.78 3 1.2605 75.34 2 1.6261 56.55 2 1.2820 73.86 1 1.8906 48.09 1 1.5674 58.87 1 1.2112 78.99 1 1.2065 79.35
Table B.2 XRD Data for Boron
[17]
B Boron Rad. CuKα λ= 1.541800
Int d A 2Θ 45 4.2500 20.88
100 4.0700 21.82 20 3.5440 25.11 70 2.5450 35.24 10 2.4790 36.21 4 2.1800 41.38 4 2.1320 42.36 55 2.1130 42.76 Lt2 2.0290 44.62 4 1.6660 55.08 8 1.6340 56.25 8 1.6030 57.44 8 1.4820 62.63 15 1.4380 64.78 8 1.4240 65.50 4 1.4030 66.60 8 1.3760 68.09 10 1.3590 69.06 15 1.3460 69.82 12 1.2680 74.82 2 1.2300 77.55
Lt2 1.1990 79.95 4 1.1780 81.67
Lt2 1.1610 83.13 Lt2 1.1250 86.43

136
Table B.3 XRD Data for α-
Tungstan Carbide [17]
α-W2C Tungsten Carbide Rad. CuKα1 λ= 1.540598
Int d A 2Θ 100 2.2757 39.57 25 2.596 34.52 22 2.3643 38.03 17 1.7478 52.30 14 1.4986 61.86 14 1.3469 69.77 12 1.2657 74.98 10 1.2514 75.98 3 1.1377 85.23 2 1.2975 72.84 2 1.1821 81.33
Table B.4 XRD Data for
Tungstan Carbide [17]
WC Tungsten Carbide Rad. Cu λ= 1.540560
Int d A 2Θ 100 2.518 35.63 100 1.884 48.27 45 2.84 31.47 30 1.236 77.10 25 1.294 73.06 20 1.454 63.98 20 1.151 84.01 14 1.259 75.44 6 1.42 65.70
Table B.5 XRD Data for
Tungstan [17]
W Tungsten Rad. CuKα1 λ= 1.540500
Int d A 2Θ 100 2.238 40.26 23 1.292 73.19 18 0.8459 131.17 15 1.582 58.27 11 1.0008 100.64 8 1.1188 87.02 4 0.9137 114.92 2 0.7912 153.57
Table B.6 XRD Data for α-
Tungstan Carbide [17]
C Carbon (Diamond-3C) Rad. CuKα1 λ= 1.540500
Int d A 2Θ 100 2.0600 43.92 25 1.2610 75.30 16 1.0754 91.50 8 0.8916 119.53 16 0.8182 140.59
137
Table B.7 XRD Data for Carbon
(Diamond) [17]
C Carbon (Diamond-3C) Rad. CuKα1 λ= 1.540500
Int d A 2Θ 100 2.0600 43.92 25 1.2610 75.30 16 1.0754 91.50 8 0.8916 119.53 16 0.8182 140.59
Table B.8 XRD Data for Carbon
(Graphite) [17]
C Carbon (Graphite-2H) Rad. CuKα λ= 1.541800
Int d A 2Θ 100 3.3600 26.53 10 2.1300 42.44 50 2.0300 44.64 5 1.8000 50.72 80 1.6780 54.70 10 1.5440 59.91 30 1.2320 77.47 50 1.1580 83.47 5 1.1380 85.28
Table B.9 XRD Data for Silicon
Oxide [17]
SiO2 Silicon Oxide Rad. CuKα1 λ= 1.540598
Int d A 2Θ 100 3.342 26.65 22 4.257 20.85 14 1.8179 50.14 9 1.5418 59.95 8 2.457 36.54 8 2.282 39.46 8 1.3718 68.32 7 1.3752 68.13 6 2.127 42.46 6 1.382 67.75 4 2.237 40.28 4 1.9792 45.81 4 1.6719 54.87 3 1.1843 81.15 3 1.1804 81.47 2 1.6591 55.33 2 1.288 73.46 2 1.2558 75.67 2 1.1999 79.88 1 1.8021 50.61 1 1.6082 57.24 1 1.4536 64.00 1 1.4189 65.76 1 1.2285 77.66 1 1.1978 80.05

138
Table B.10 XRD Data for Silicon
Carbide [17]
SiC Silicon Carbide Rad. CuKα λ= 1.541780
Int d A 2Θ 100 2.52 35.63 35 1.5411 60.03 25 1.314 71.84 20 2.18 41.42 5 1.2583 75.56 5 1.0893 90.10
Table B.11 XRD Data for α-
Silicon Carbide [17]
α-SiC Silicon Carbide Rad. CuKα1 λ= 1.540560
Int d A 2Θ 100 2.511 35.73 40 2.621 34.18 40 1.311 71.97 35 1.537 60.15 20 2.352 38.23 15 1.418 65.81 15 1.286 73.59 15 1.087 90.25 10 2.174 41.50 7 1.256 75.65 7 1.042 95.33
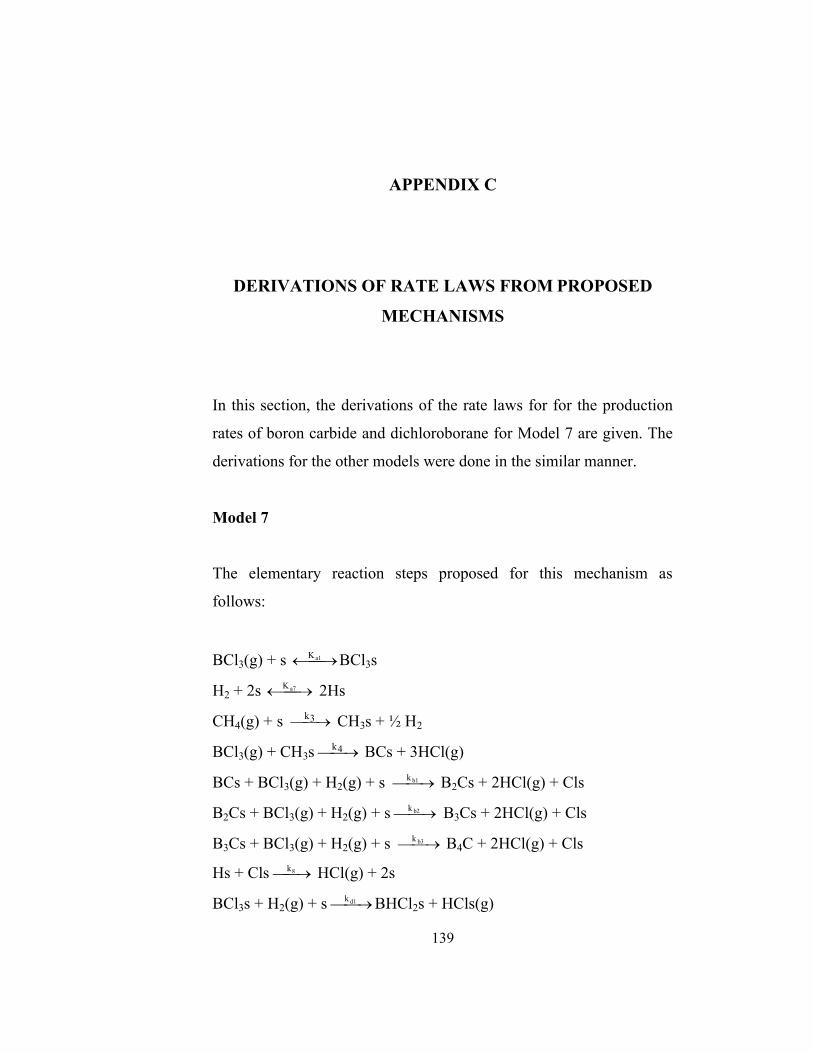
139
APPENDIX C
DERIVATIONS OF RATE LAWS FROM PROPOSED
MECHANISMS
In this section, the derivations of the rate laws for for the production
rates of boron carbide and dichloroborane for Model 7 are given. The
derivations for the other models were done in the similar manner.
Model 7
The elementary reaction steps proposed for this mechanism as
follows:
BCl3(g) + s a1K BCl3s
H2 + 2s a7K 2Hs
CH4(g) + s 3k CH3s + ½ H2
BCl3(g) + CH3s 4k BCs + 3HCl(g)
BCs + BCl3(g) + H2(g) + s b1k B2Cs + 2HCl(g) + Cls
B2Cs + BCl3(g) + H2(g) + s b2k B3Cs + 2HCl(g) + Cls
B3Cs + BCl3(g) + H2(g) + s b3k B4C + 2HCl(g) + Cls
Hs + Cls 8k HCl(g) + 2s
BCl3s + H2(g) + s d1k BHCl2s + HCls(g)

140
BHCl2s e1k BHCl2(g) + s
BCl3(g) + H2(g) gkBHCl2(g) + HCl(g)
The rate limiting step was selected to be step 7, which is a surface
reaction step, in which boron carbide was formed on the solid surface.
The rate of boron carbide and dichloroborane formation reactions can
be written as follows considering the rate limiting step:
RB4C=kb3 fB3C PBCl3 PH2
fv C.1
RBHCl2=ke1 fBHCl2
+ kg PBCl3 PH2 C.2
The fractions of the surface occupied by boron trichloride, methane
and hydrogen are;
vBCla1BCl fPKf33
C.3
v
3BCl
4CH
4
3
3CH fP
P
k
kf C.4
vHa7H fPKf2
C.5
In equations C1 and C2, the term fv, which defines the fraction of
unoccupied substrate surface, is calculated as follows;
1=fv+fH+fBCl3+fCH3 C.6
1= vHa7v
BCl
CH
4
3vBCla1 fPKf
P
P
k
kfPK
2
3
4
3 C.7
=> fv=
2
3
4
3 Ha7
BCl
CH
4
3BCla1 PK
P
P
k
kPK1
1
C.8
where total number of substrate surface sites is taken as 1.
The terms fB3C ve fBHCl2 are written for the fractions of surface
occupied by the unstable intermediates B3C and BHCl2, respectively.
Those terms were calculated using steady-state approximation,
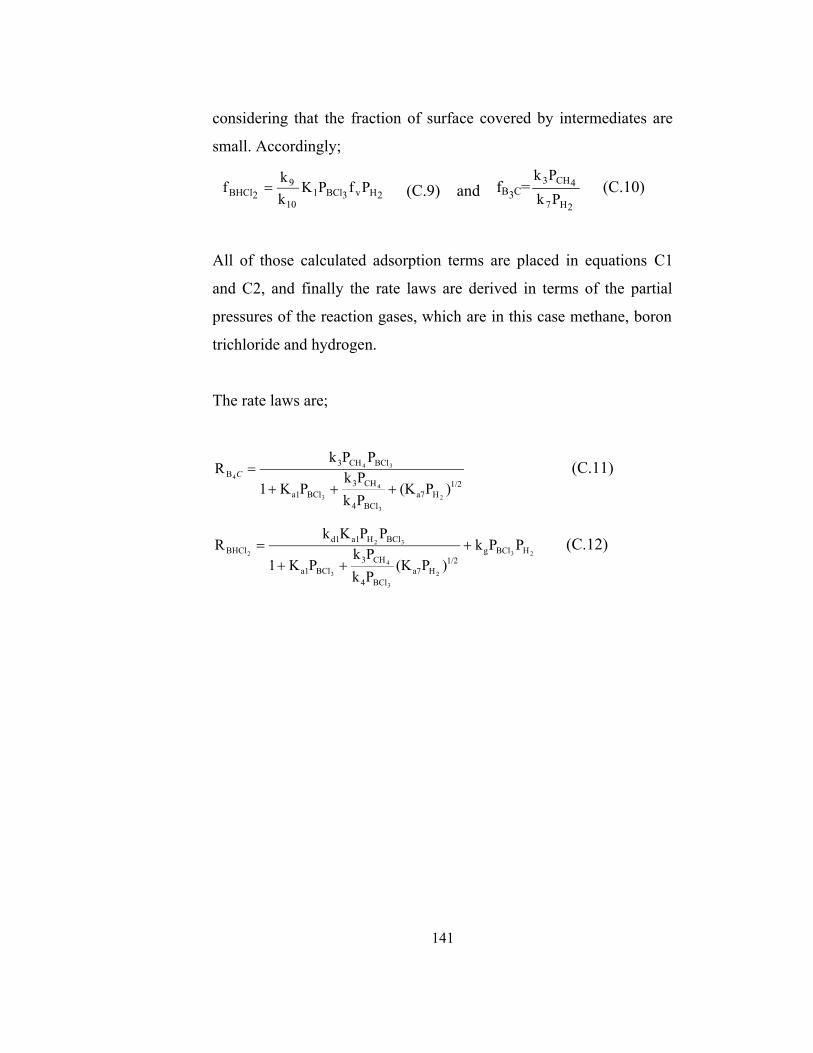
141
considering that the fraction of surface covered by intermediates are
small. Accordingly;
2Hv3BCl1
10
9
2BHCl PfPKk
kf (C.9) and fB3C=
2H7
4CH3
Pk
Pk (C.10)
All of those calculated adsorption terms are placed in equations C1
and C2, and finally the rate laws are derived in terms of the partial
pressures of the reaction gases, which are in this case methane, boron
trichloride and hydrogen.
The rate laws are;
1/2
Ha7
BCl4
CH3
BCla1
BClCH3
B
)P(KPk
PkPK1
PPkR
2
3
4
3
34
4
C (C.11)
23
2
3
4
3
32
2 HBClg
1/2
Ha7
BCl4
CH3
BCla1
BClHa1d1
BHCl PPk
)P(KPk
PkPK1
PPKkR
(C.12)

142
APPENDIX D
RAW DATA

143
Table D.1 Raw Data for the Experiment BCL3B
Run Duration yBCl3 yCH
4 yH
2 yHCl yBHCl
2 Temperature (
0C)
1 0 0.1181 0.0195 0.8624 0.0000 0.0000 1150
2 5 0.0885 0.0198 0.8330 0.0275 0.0309 1147
3 10 0.0240 0.0171 0.7635 0.1108 0.0836 1146
4 15 0.0195 0.0168 0.7585 0.1173 0.0867 1152
5 20 0.0210 0.0165 0.7594 0.1179 0.0839 1150
6 25 0.0270 0.0167 0.7657 0.1106 0.0789 1148
7 30 0.0277 0.0166 0.7662 0.1106 0.0777 1147
8 35 0.0276 0.0166 0.7661 0.1107 0.0778 1146
9 42 0.0270 0.0165 0.7653 0.1120 0.0780 1150
10 47 0.0276 0.0164 0.7658 0.1121 0.0770 1145

144
Table D.2 Raw Data for the Experiment BCl3D
Spectrum no Duration yBCl3 yCH
4 yH
2 yHCl yBHCl
2 Temperature (
0C)
1 0 0.0894 0.01997 0.8906 0.0000 0.0000 1150
2 5 0.0183 0.0177 0.8148 0.0872 0.0615 1155
3 10 0.0164 0.0170 0.8115 0.0941 0.0604 1146
4 15 0.0148 0.0174 0.8107 0.0928 0.0637 1151
5 20 0.0145 0.0168 0.8092 0.0974 0.0615 1150
6 25 0.0145 0.0165 0.8086 0.0995 0.0602 1152
7 35 0.0141 0.0168 0.8088 0.0977 0.0619 1149
8 45 0.0144 0.0169 0.8093 0.0967 0.0620 1150
9 55 0.0143 0.0167 0.8088 0.0983 0.0612 1150
10 63 0.0144 0.0169 0.8093 0.0967 0.0620 1145

145
Table D.3 Raw Data for Experiment BCl3F
Spectrum no Duration yBCl3 yCH
4 yH
2 yHCl yBHCl
2 Temperature (
0C)
1 0 0.0761 0.0195 0.9044 0.0000 0.0000 1150
2 13 0.0173 0.0188 0.8441 0.0638 0.0559 1150
3 17 0.0165 0.0183 0.8422 0.0682 0.0546 1151
4 25 0.0155 0.0181 0.8408 0.0706 0.0548 1145
5 30 0.0152 0.0178 0.8398 0.0731 0.0538 1147
6 35 0.0144 0.0175 0.8384 0.0760 0.0534 1150
7 40 0.0147 0.0174 0.8384 0.0765 0.0526 1150
8 46 0.0141 0.0163 0.8355 0.0849 0.0487 1155
9 50 0.0142 0.0165 0.8360 0.0834 0.0494 1152
10 54 0.014067 0.01662 0.8361 0.0827 0.0500 1150
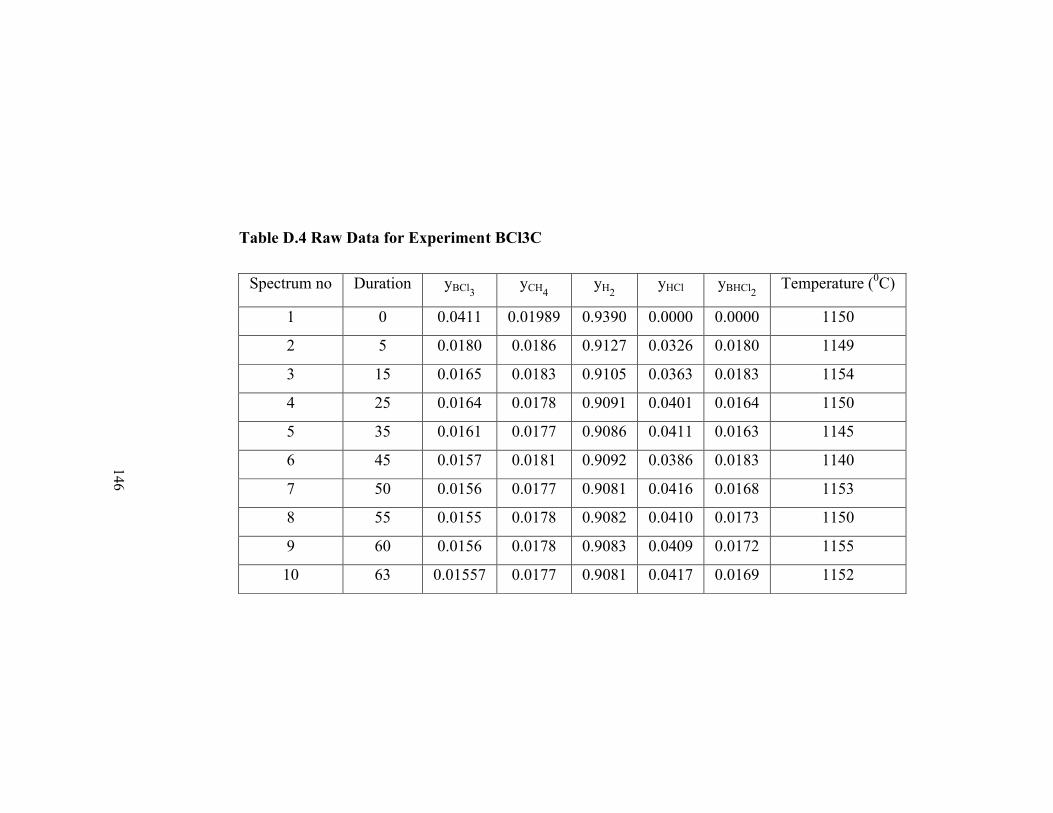
146
Table D.4 Raw Data for Experiment BCl3C
Spectrum no Duration yBCl3 yCH
4 yH
2 yHCl yBHCl
2 Temperature (
0C)
1 0 0.0411 0.01989 0.9390 0.0000 0.0000 1150
2 5 0.0180 0.0186 0.9127 0.0326 0.0180 1149
3 15 0.0165 0.0183 0.9105 0.0363 0.0183 1154
4 25 0.0164 0.0178 0.9091 0.0401 0.0164 1150
5 35 0.0161 0.0177 0.9086 0.0411 0.0163 1145
6 45 0.0157 0.0181 0.9092 0.0386 0.0183 1140
7 50 0.0156 0.0177 0.9081 0.0416 0.0168 1153
8 55 0.0155 0.0178 0.9082 0.0410 0.0173 1150
9 60 0.0156 0.0178 0.9083 0.0409 0.0172 1155
10 63 0.01557 0.0177 0.9081 0.0417 0.0169 1152
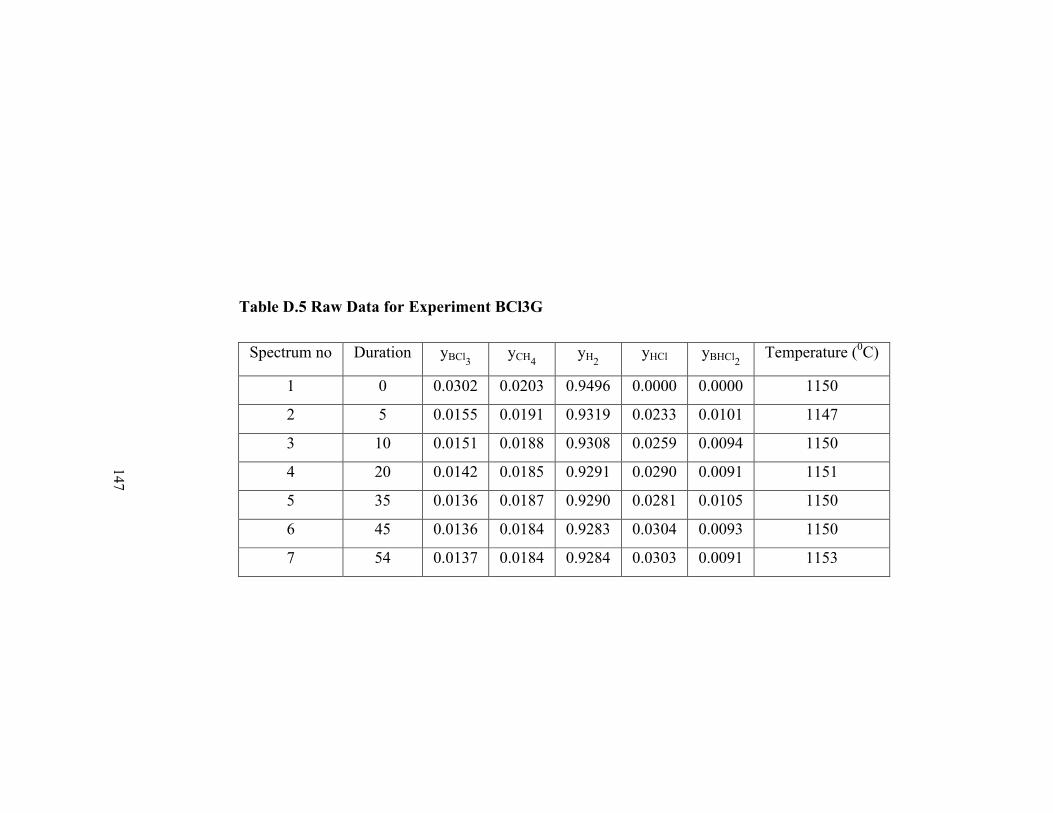
147
Table D.5 Raw Data for Experiment BCl3G
Spectrum no Duration yBCl3 yCH
4 yH
2 yHCl yBHCl
2 Temperature (
0C)
1 0 0.0302 0.0203 0.9496 0.0000 0.0000 1150
2 5 0.0155 0.0191 0.9319 0.0233 0.0101 1147
3 10 0.0151 0.0188 0.9308 0.0259 0.0094 1150
4 20 0.0142 0.0185 0.9291 0.0290 0.0091 1151
5 35 0.0136 0.0187 0.9290 0.0281 0.0105 1150
6 45 0.0136 0.0184 0.9283 0.0304 0.0093 1150
7 54 0.0137 0.0184 0.9284 0.0303 0.0091 1153
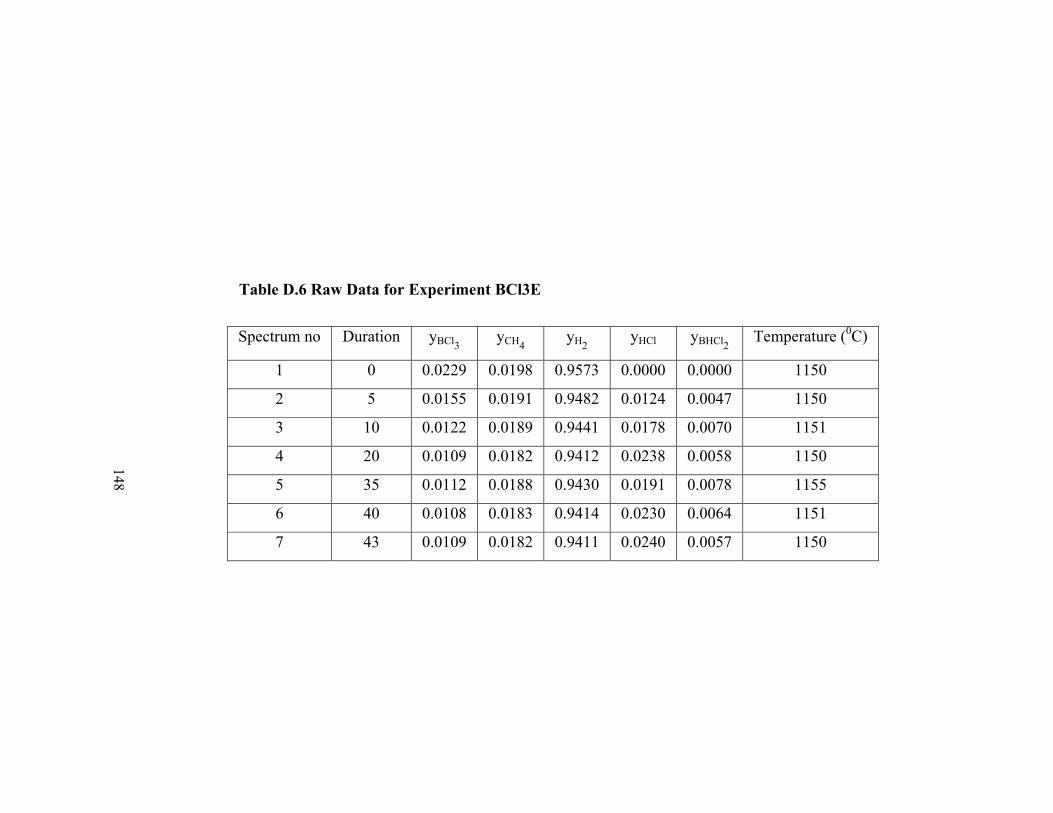
148
Table D.6 Raw Data for Experiment BCl3E
Spectrum no Duration yBCl3 yCH
4 yH
2 yHCl yBHCl
2 Temperature (
0C)
1 0 0.0229 0.0198 0.9573 0.0000 0.0000 1150
2 5 0.0155 0.0191 0.9482 0.0124 0.0047 1150
3 10 0.0122 0.0189 0.9441 0.0178 0.0070 1151
4 20 0.0109 0.0182 0.9412 0.0238 0.0058 1150
5 35 0.0112 0.0188 0.9430 0.0191 0.0078 1155
6 40 0.0108 0.0183 0.9414 0.0230 0.0064 1151
7 43 0.0109 0.0182 0.9411 0.0240 0.0057 1150

149
Table D.7 Raw Data for Experiment CH4D
Spectrum no Duration yBCl3 yCH
4 yH
2 yHCl yBHCl
2 Temperature (
0C)
1 0 0.084 0.0423 0.8737 0.0000 0.0000 1150
2 10 0.0585 0.0421 0.8478 0.0269 0.0247 1143
3 15 0.0510 0.0403 0.8367 0.0466 0.0253 1160
4 25 0.0450 0.0399 0.8299 0.0553 0.0297 1150
5 35 0.0451 0.0393 0.8288 0.0592 0.0273 1145
6 45 0.0421 0.0386 0.8244 0.0669 0.0275 1143
7 50 0.0360 0.0378 0.8168 0.0784 0.0304 1151
8 55 0.0314 0.0372 0.8111 0.0870 0.0326 1140
9 60 0.0318 0.0374 0.8119 0.0852 0.0330 1155
10 62 0.0314 0.0372 0.8111 0.0870 0.0326 1150
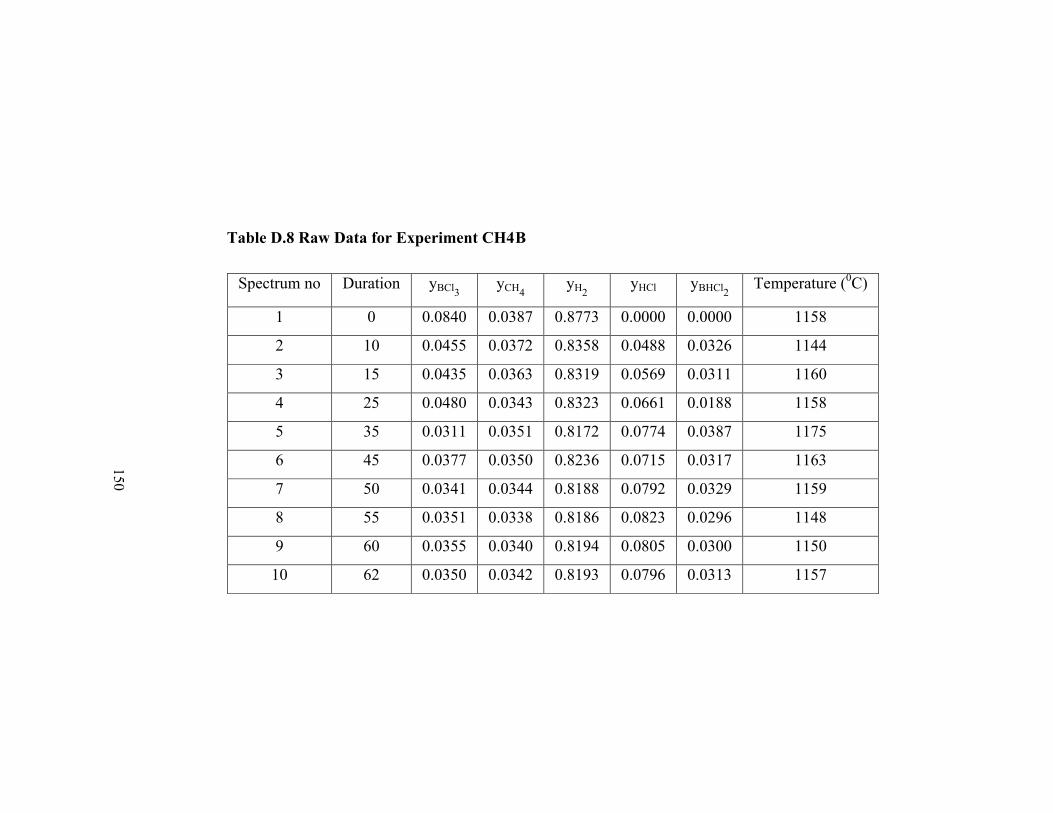
150
Table D.8 Raw Data for Experiment CH4B
Spectrum no Duration yBCl3 yCH
4 yH
2 yHCl yBHCl
2 Temperature (
0C)
1 0 0.0840 0.0387 0.8773 0.0000 0.0000 1158
2 10 0.0455 0.0372 0.8358 0.0488 0.0326 1144
3 15 0.0435 0.0363 0.8319 0.0569 0.0311 1160
4 25 0.0480 0.0343 0.8323 0.0661 0.0188 1158
5 35 0.0311 0.0351 0.8172 0.0774 0.0387 1175
6 45 0.0377 0.0350 0.8236 0.0715 0.0317 1163
7 50 0.0341 0.0344 0.8188 0.0792 0.0329 1159
8 55 0.0351 0.0338 0.8186 0.0823 0.0296 1148
9 60 0.0355 0.0340 0.8194 0.0805 0.0300 1150
10 62 0.0350 0.0342 0.8193 0.0796 0.0313 1157

151
Table D.9 Raw Data for the Experiment CH4E
Spectrum no Duration yBCl3 yCH
4 yH
2 yHCl yBHCl
2 Temperature (
0C)
1 0 0.0840 0.0309 0.8851 0.0000 0.0000 1150
2 5 0.0645 0.0308 0.8654 0.0202 0.0191 1148
3 10 0.0510 0.0305 0.8513 0.0358 0.0314 1180
4 20 0.0434 0.0294 0.8414 0.0511 0.0346 1140
5 30 0.0505 0.0294 0.8484 0.0440 0.0275 1150
6 40 0.0388 0.0279 0.8337 0.0661 0.0332 1165
7 50 0.0405 0.0288 0.8372 0.0581 0.0351 1150
8 55 0.0357 0.0282 0.8312 0.0671 0.0374 1148
9 60 0.0377 0.0272 0.8311 0.0721 0.0314 1150
10 66 0.0376 0.027 0.8306 0.0736 0.0307 1152

152
Table D.10 Raw Data for the Experiment CH4F
Spectrum no Duration yBCl3 yCH
4 yH
2 yHCl yBHCl
2 Temperature (
0C)
1 0 0.0840 0.0241 0.8919 0.0000 0.0000 1145
2 10 0.0585 0.0240 0.8662 0.0262 0.0251 1150
3 15 0.0405 0.0222 0.8443 0.0570 0.0357 1150
4 25 0.0381 0.0220 0.8415 0.0608 0.0373 1148
5 35 0.0380 0.0219 0.8412 0.0616 0.0370 1150
6 45 0.0377 0.0213 0.8396 0.0662 0.0348 1147
7 50 0.0370 0.0209 0.8381 0.0697 0.0339 1151
8 55 0.0376 0.0204 0.8376 0.0727 0.0312 1147
9 60 0.0377 0.0202 0.8373 0.0738 0.0304 1150
10 66 0.0376 0.0203 0.8373 0.0737 0.0306 1152
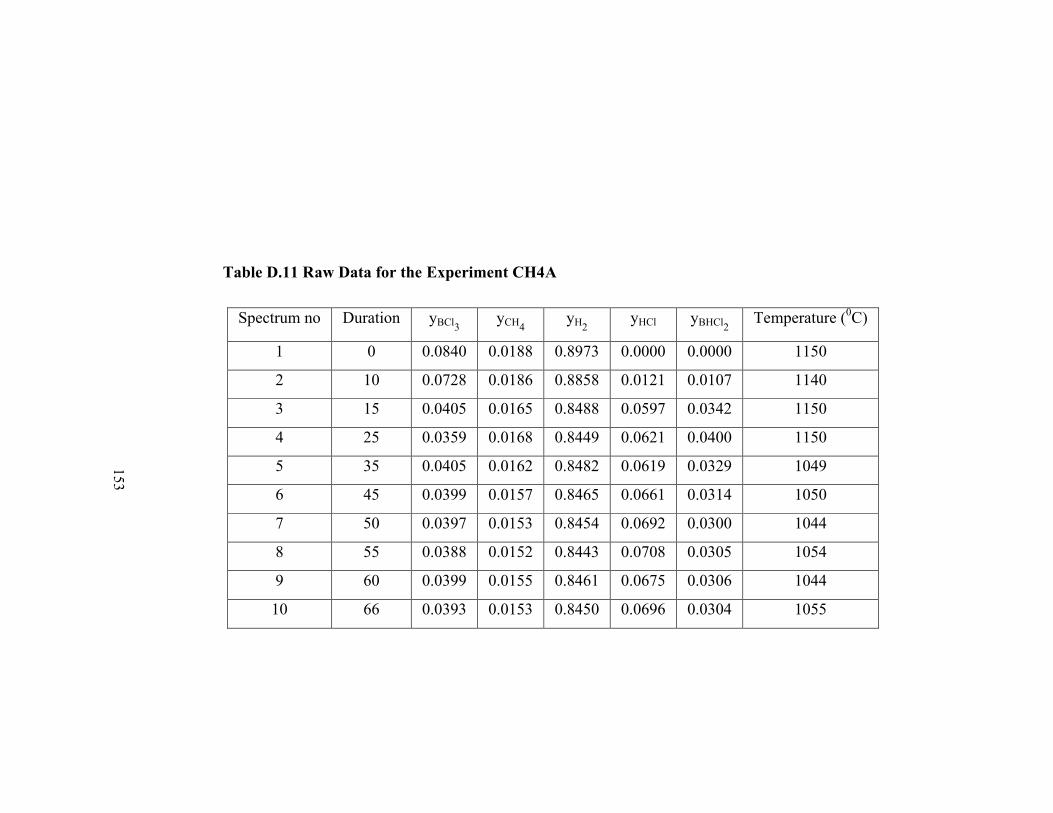
153
Table D.11 Raw Data for the Experiment CH4A
Spectrum no Duration yBCl3 yCH
4 yH
2 yHCl yBHCl
2 Temperature (
0C)
1 0 0.0840 0.0188 0.8973 0.0000 0.0000 1150
2 10 0.0728 0.0186 0.8858 0.0121 0.0107 1140
3 15 0.0405 0.0165 0.8488 0.0597 0.0342 1150
4 25 0.0359 0.0168 0.8449 0.0621 0.0400 1150
5 35 0.0405 0.0162 0.8482 0.0619 0.0329 1049
6 45 0.0399 0.0157 0.8465 0.0661 0.0314 1050
7 50 0.0397 0.0153 0.8454 0.0692 0.0300 1044
8 55 0.0388 0.0152 0.8443 0.0708 0.0305 1054
9 60 0.0399 0.0155 0.8461 0.0675 0.0306 1044
10 66 0.0393 0.0153 0.8450 0.0696 0.0304 1055
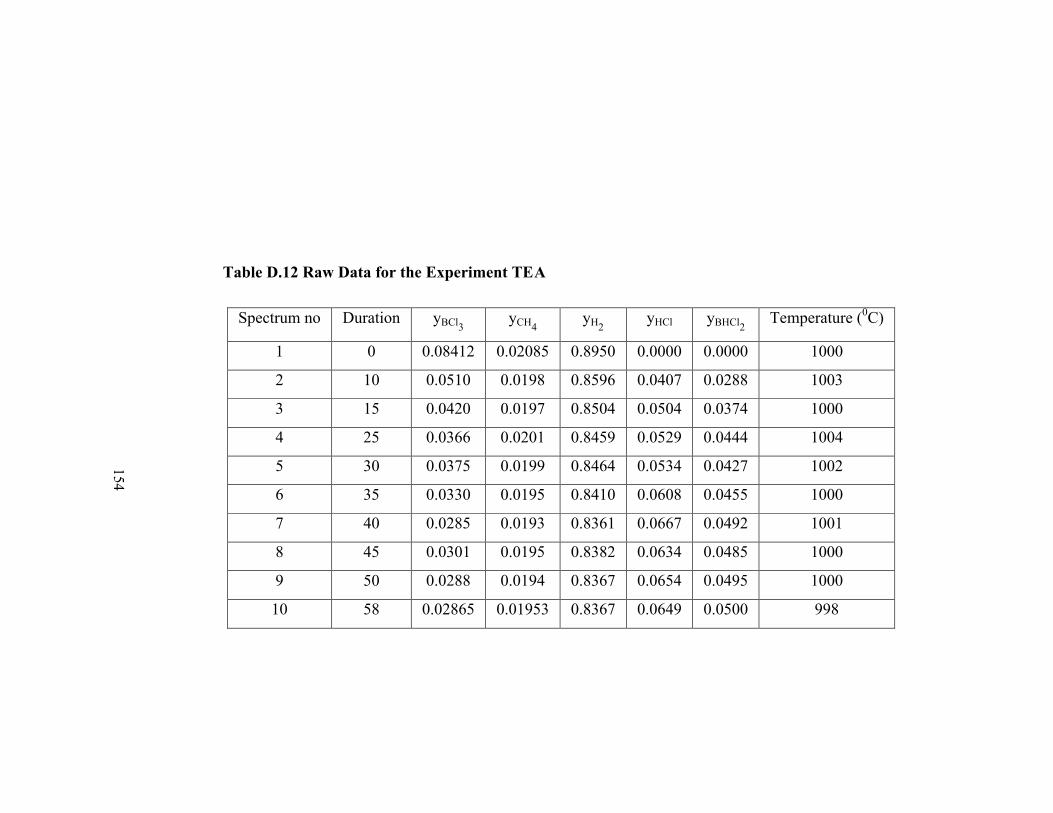
154
Table D.12 Raw Data for the Experiment TEA
Spectrum no Duration yBCl3 yCH
4 yH
2 yHCl yBHCl
2 Temperature (
0C)
1 0 0.08412 0.02085 0.8950 0.0000 0.0000 1000
2 10 0.0510 0.0198 0.8596 0.0407 0.0288 1003
3 15 0.0420 0.0197 0.8504 0.0504 0.0374 1000
4 25 0.0366 0.0201 0.8459 0.0529 0.0444 1004
5 30 0.0375 0.0199 0.8464 0.0534 0.0427 1002
6 35 0.0330 0.0195 0.8410 0.0608 0.0455 1000
7 40 0.0285 0.0193 0.8361 0.0667 0.0492 1001
8 45 0.0301 0.0195 0.8382 0.0634 0.0485 1000
9 50 0.0288 0.0194 0.8367 0.0654 0.0495 1000
10 58 0.02865 0.01953 0.8367 0.0649 0.0500 998
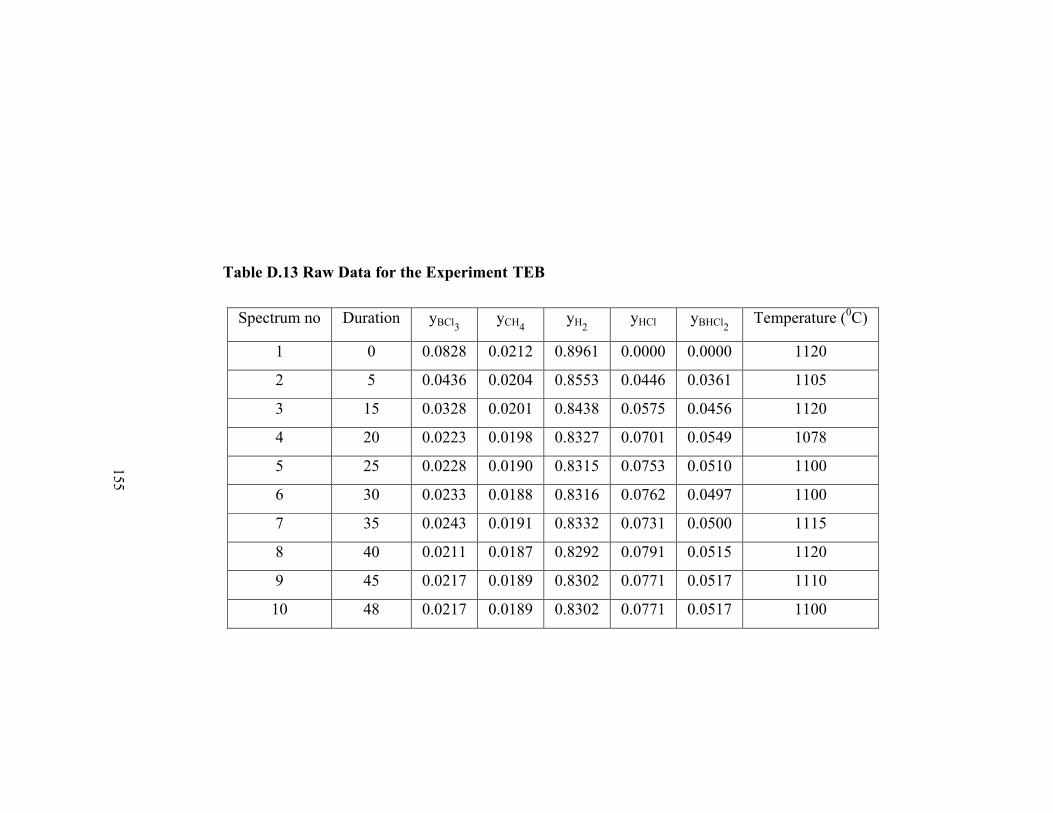
155
Table D.13 Raw Data for the Experiment TEB
Spectrum no Duration yBCl3 yCH
4 yH
2 yHCl yBHCl
2 Temperature (
0C)
1 0 0.0828 0.0212 0.8961 0.0000 0.0000 1120
2 5 0.0436 0.0204 0.8553 0.0446 0.0361 1105
3 15 0.0328 0.0201 0.8438 0.0575 0.0456 1120
4 20 0.0223 0.0198 0.8327 0.0701 0.0549 1078
5 25 0.0228 0.0190 0.8315 0.0753 0.0510 1100
6 30 0.0233 0.0188 0.8316 0.0762 0.0497 1100
7 35 0.0243 0.0191 0.8332 0.0731 0.0500 1115
8 40 0.0211 0.0187 0.8292 0.0791 0.0515 1120
9 45 0.0217 0.0189 0.8302 0.0771 0.0517 1110
10 48 0.0217 0.0189 0.8302 0.0771 0.0517 1100

156
Table D.14 Raw Data for the Experiment TEC
Spectrum no Duration yBCl3 yCH
4 yH
2 yHCl yBHCl
2 Temperature (
0C)
1 0 0.0804 0.0206 0.8991 0.0000 0.0000 1204
2 5 0.0711 0.0200 0.8855 0.0134 0.0070 1205
3 10 0.0566 0.0181 0.8668 0.0414 0.0139 1210
4 20 0.0180 0.0176 0.8274 0.0834 0.0501 1200
5 25 0.0171 0.0176 0.8265 0.0843 0.0510 1200
6 30 0.0159 0.0175 0.8251 0.0862 0.0517 1220
7 35 0.0161 0.0173 0.8249 0.0874 0.0507 1215
8 46 0.0160 0.0173 0.8249 0.0873 0.0510 1200

157
Table D.15 Raw Data for the Experiment TED
Spectrum no Duration yBCl3 yCH
4 yH
2 yHCl yBHCl
2 Temperature (
0C)
1 0 0.0815 0.0203 0.8982 0.0000 0.0000 130
2 5 0.0322 0.0171 0.8399 0.0723 0.0360 1315
3 10 0.0301 0.0162 0.8358 0.0808 0.0343 1300
4 15 0.0122 0.0160 0.8177 0.0999 0.0512 1299
5 20 0.0117 0.0159 0.8169 0.1015 0.0510 1303
6 25 0.0118 0.0159 0.8171 0.1010 0.0511 1300
7 28 0.0117 0.0159 0.8170 0.1014 0.0510 1298
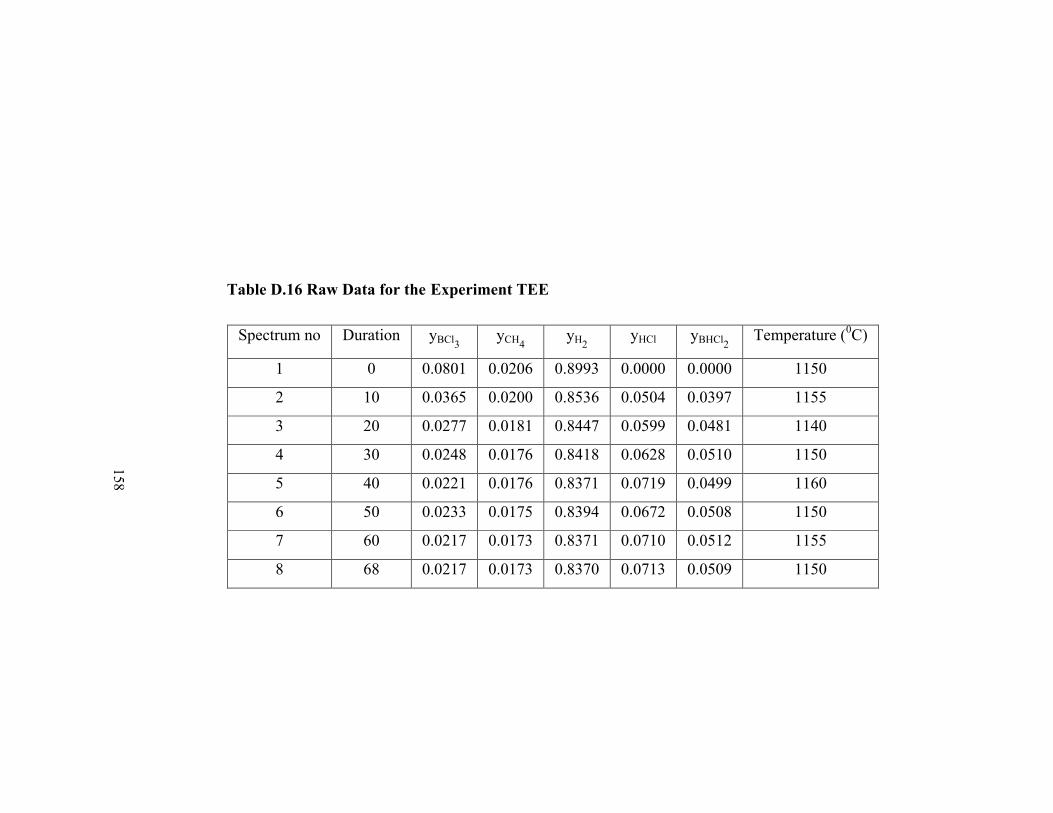
158
Table D.16 Raw Data for the Experiment TEE
Spectrum no Duration yBCl3 yCH
4 yH
2 yHCl yBHCl
2 Temperature (
0C)
1 0 0.0801 0.0206 0.8993 0.0000 0.0000 1150
2 10 0.0365 0.0200 0.8536 0.0504 0.0397 1155
3 20 0.0277 0.0181 0.8447 0.0599 0.0481 1140
4 30 0.0248 0.0176 0.8418 0.0628 0.0510 1150
5 40 0.0221 0.0176 0.8371 0.0719 0.0499 1160
6 50 0.0233 0.0175 0.8394 0.0672 0.0508 1150
7 60 0.0217 0.0173 0.8371 0.0710 0.0512 1155
8 68 0.0217 0.0173 0.8370 0.0713 0.0509 1150
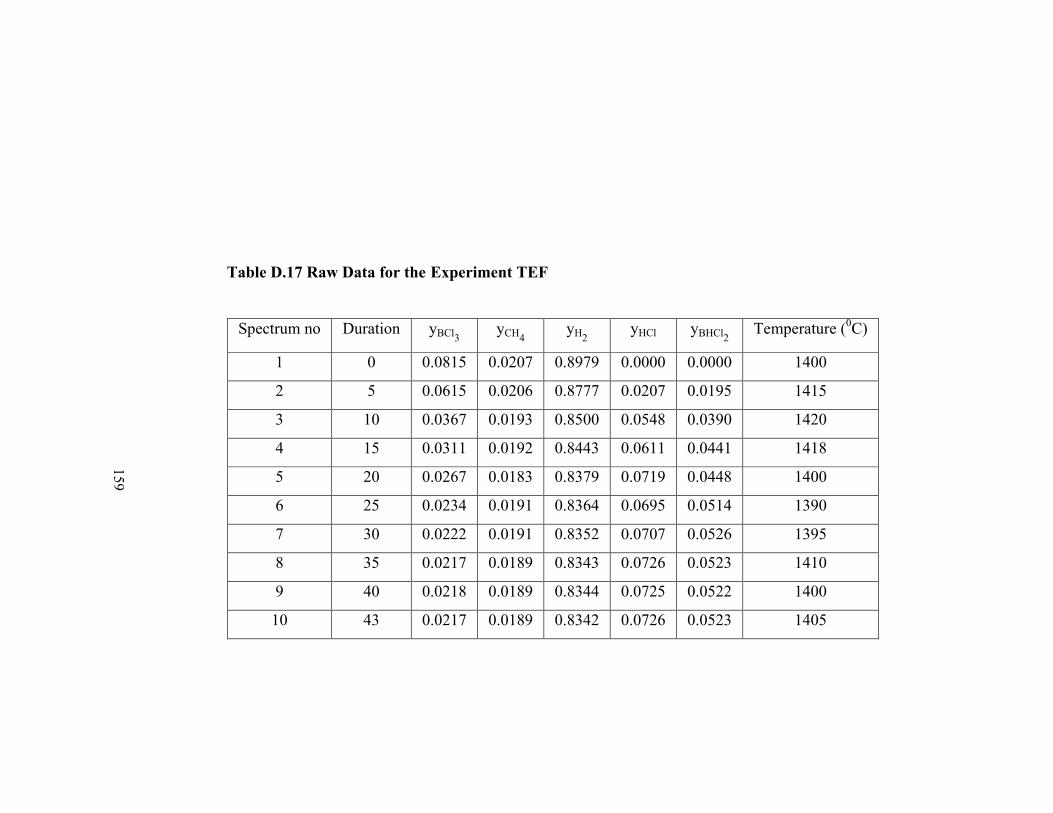
159
Table D.17 Raw Data for the Experiment TEF
Spectrum no Duration yBCl3 yCH
4 yH
2 yHCl yBHCl
2 Temperature (
0C)
1 0 0.0815 0.0207 0.8979 0.0000 0.0000 1400
2 5 0.0615 0.0206 0.8777 0.0207 0.0195 1415
3 10 0.0367 0.0193 0.8500 0.0548 0.0390 1420
4 15 0.0311 0.0192 0.8443 0.0611 0.0441 1418
5 20 0.0267 0.0183 0.8379 0.0719 0.0448 1400
6 25 0.0234 0.0191 0.8364 0.0695 0.0514 1390
7 30 0.0222 0.0191 0.8352 0.0707 0.0526 1395
8 35 0.0217 0.0189 0.8343 0.0726 0.0523 1410
9 40 0.0218 0.0189 0.8344 0.0725 0.0522 1400
10 43 0.0217 0.0189 0.8342 0.0726 0.0523 1405
160
APPENDIX E
HEAT AND MASS TRANSFER CALCULATIONS AROUND
THE TUNGSTEN FILAMENT
Impinging jet devices are usually utilised in some special applications
in order to improve the convection heat and/or mass transfer
coefficients. In this section, some emperical correlations together with
the well known energy equation will be utilised to carry out heat
transfer calculations around the heated tungsten filament. To solve the
heat transfer problem in our study, the required variables were the gas
flow rate, the nozzle diameter, and the distance between the nozzle
and the substrate surface. The empirical corelations utilised in the
following discussion are based extensively on the review paper by
Holger Martin [26].
E.1 Calculation of Heat Dissipated From the Substrate Surface
The phenomena of jet-impingement on a solid uniform surface is
usually characterised by seperating the flow pattern into three regions
(see Figure E.1). The first region is the free jet region in which the
conditions are unaffected by the jet impingement. This region starts at
the nozzle exit and extends up to the stagnation zone. At the nozzle

161
exit, the velocity profile is uniform, however, with increasing distance
from the exit, momentum exchange between the jet and ambient
causes the free boundary of the jet to broaden. In the impingement
zone flow is influenced by the substrate surface and decelerated in the
z direction and accelerated in the x direction. However, since the
ambient is stationary, the momentum change does not allow for
continious acceleration, and the stagnation zone is transformed to the
decelerating wall jet region. With increasing x, velocity component
parallel to the surface increases from zero to some maximum, and
subsequently decays to zero. Since substrate temperature is greater
than the ambient temperature, convection heat transfer occurs in both
the stagnation and wall jet regions.
Figure E.1 Schematic representation of jet impingement on the
flat surface

162
According to the Newton’s Law of Cooling, the heat dissipation due
to the convection is expressed as,
)Th(T es
'' q (E.1)
Martin [26] performed an extensive research on the convection heat
transfer for impinging jets. The recommended correlation for single
round nozzle is,
Nu = f (Re, Pr, r/Dh, H/Dh) (E.2)
(Re)F)D
H,D
r(G Pr
Nu10.42
___
(E.3)
The ranges of validity of equation E.3 are,
2 H/D 12
2.5 r/D 7.5
Since the experiments were carried out in excess hydrogen, the
calculations were carried out using the physical properties of
hydrogen gas at 1 atm., and at the mean temperature.
Physical properties (Hydrogen gas @ 1 atm.):
Tm = (1150+50)/2 = 600 0C
ρ = 0.0281 kg/m3
μ = 1.83x10⁻⁵
Ns/m2
α = 963.03 x 10⁻⁶
m2/s
k = 399.42 x 10⁻³
W/m-K
__
Cp = 14.782 kJ/kg-K
Pr = k
Cp = 0.67

163
Characteristic length is the hydraulic diameter of the nozzle Dh, which
is defined as, hc D
PA4
, where Ac is the crossectional area of the
nozzle. For circular nozzles, the characteristic length is the nozzle
diameter, D.
Nu = k
Dh h
_
(E.4) Re =
heDV (E.5)
In an our typical experiment:
H = 5x10⁻³
m
x = 1.5x10⁻²
m
Dh = 1x10⁻³
m
Re =
heDV=
sm6.51x10
sm12.2 mx101
24-
-3
= 3.25
The functions F1 and G are,
21
55.021
1 )Re005.01(Re2F (E.6)
rD)6
DH(1.01
rD1.11
r
DG
(E.7)
21
55.021
1 )Re005.01(Re2(Re)F = 21
55.021
))9.18(005.01()9.18(2 = 3.62
rD)6
DH(1.01
rD1.11
r
DG
= 0.0622
Thus Equation E.3 gives,

164
Pr
Nu0.42
___
0.0622x3.62 = 0.225
2250. 0.67
Nu0.42
___
__
Nu = 0.190 = k
Lh_
h = 5.07 W/K-m2
q = A*
h *( T-T ) = (3x10-3
x 1.5x10-2
) m2 x 5.07 W/m
2-K x (1150-
40) K
q = 0.25 W
This low flux is confirmed by the small difference in exit and entrance
temperature of the reaction mixture through the reactor.
E.2 Temperature profile around the filament
The temperature profile determination in any flow system requires
simultaneous solution of energy, mass (equation of continiuty), and
momentum (Navier-Stokes equations of motion) equations. For
complicated geometries like impinging jet, the solution requires
computer aided methods, like finite difference analysis. Here, the
analysis is much simplified by using empirical correlations for the
velocity components, which then, are used in energy equation to find
the temperature profile. It was assumed that the velocity components
are not affected by the temperature variations (the low flux value
found in the previous section verifies this assumption), considering the
extremely short residence time of the gas jet within the reactor.
The 2-dimentional energy equation is,
165
2
x
2
2
zxz
V
Cpz
T
z
TV
x
TV
(E.8)
The valid equation for the velocity on the jet axis for the whole free jet
region can be calculated following Schlunder [27] for the
axisymmetric free jets,
21
2
D C2
zD
exp1V
z)V(0,
(E.9)
where the constant C is defined as,
C = 0.127(4D/zk) and it has a value about 0.1, slightly depending on
the shape of the nozzle and the exit Reynolds number [27].
zk is the core length which is the distance from the nozzle exit where
the pressure head on the z axis has fallen to 95% of its maximum
value. Core lengths of around four slot widths can be expected for a
single round nozzle [27].
The stagnation flow begins relatively close to the surface [26]. For
single round nozzles the limiting distance is about 1.2 times the nozzle
diameter. Exact analytical solutions of the Navier-Stokes equation of
motion are known for the idealized limiting case o f infinitely extended
plane and axisymmetric laminar stagnation flows. They are typical
boundary layer flows, the velocity compoents of flow outside the
boundary layer are given by,
166
Vz = -2*aR*z (E.10) Vx = aR*x (E.11)
Where aR is a constant, which means that velocity components are
linearly proportional to the distance from the stagnation point.
The boundary layer thickness is defined as the distance from the
surface where lateral component reaches 99% of the velocity (Vx)
defined above,
δ = 1.95 (V/aR)1/2
(for stagnation flow) (E.12)
For real stagnation flows due to impinging jets, the constant aR can be
written as [26];
aR = (vD/D)(1.04-0.034H/D)
δ = D*1.95 /Re1/2
* (1.04-0.034*H/D)-1/2
δ 5*10-4
m = 0.5 mm
This value of heat transfer boundary layer thickness enables us to
make an educated guess for the thickness (or the volume) through
which the gas phase reaction is possible. If the temperature profile is
assumed to be linear in heat transfer boundary layer then,
mmK2200
5.0
40)-(1150
dz
dT (E.13)
The lowest temperature at which the reaction can take place can be
assumed as 3000C.
167
T=1150-2220z=300
z=850/2220=0.38mm
that means the reaction can possibly take place within 0.38 mm thick
gas film next to the substrate surface.
This result allows us to express the dichloroborane formation reaction
(which takes place in the gas phase) rate on per unit area basis as was
done in Section 3.2.1.
Following the above discussion, z and x components of the gas
velocity in the stagnation zone were found as,
Vx = aR*x = 1827*x [m/s] (E.14)
Vz = -2*aR*z = -3654*z [m/s] (E.15)
Then these velocity components were inserted in energy equation and
the equation was solved using bottom boundary condition as the
temperature of the substrate surface (1150 oC), and the top boundary
condition as the reactor outlet temperature (40 oC) (this outlet
temperature was observed when the substrate surface temperature was
set to 1150 oC during any experimental run).
The algebraic calculations were carried out using a Mathlab code, and
the results are summerised in a single 2-D Mathlab graphical output
plot (Figure E.2).
168
Figure E.2 Temperature profile in the vicinity of the heated
substrate surface at 1150 oC (x: distance along the surface;z:
distance from the surface)
E.3 Comparison of Diffusion Effects Over the Substrate Surface
Between the Impinging Jet and Parallel Flow Conditions
The detailed kinetic study carried out in this study was based on the
assumption that the mass transfer limitation on the reaction kinetics
were minimized. The best way to check the validity of this
assumption is to compare the mass transfer boundary layer
thicknesses in the case of jet impingement and the mass transfer
coefficient with a parallel flow system.

169
In section E.1, the boundary layer thickness was calculated for the
case of impinging jet geometry utilized in this study. In order to
predict the mass tramsfer boundary layer thickness the following
correlation was utilized,
3/1/ Scc
3/13
1 67.1/10*5.0)( c = 4.2*10-4
m
For the calculation of boundary ayer thickness for parallel flow
conditions, the flow geometry was assumed to be the flat plate in
parallel flow. The reynolds number for parallel flow over the substrate
surface can be calculated as,
LV
Re =4-
-2
x1051.6
x3x1012.2=98 (Laminar flow for entire surface)
Therefore for the boundary layer thickness,
x
x
Re
5 =
98
10*3*5 2
=0.015m
3/1/ Scc
3/1
2 67.1/015.0)( c = 1.26*10-2
m
Hence, it was observed that the mass transfer boundary layer
thickness decreased almost 30 folds, in the presence of impinging jet
system.

170
APPENDIX F
REPRODUCIBILITY CALCULATIONS
Reproducibility experiment is important to test the reliability of the
experimental data. For that purpose, three experiments were repeated on
seperate days, with nearly the same experimental conditions (Table F.1).
Having exactly the same conditions at the start of the experiments were
impossible beacuse of the control limitations.The final compositions of
the reacor effluent streams for the seperate runs were the measure of the
reproducibility. From the final composition of the reactor effluent, the
rates of the boron carbide and dichloroborane formation reactions were
calculated and a statistical analysis was done. In the statistical analysis,
the aim is to calculate the confidence intervals for both boron carbide and
dichloroborane formation rates.
In order to calculate confidence interval ( ) for the situations where
sample size is small and the population standard deviation is not known,
students-t methodology is employed, for which;
N
tSX
where
X is the sample mean and S is the sample standard deviation;
171
Table F.1 Experimental Conditions for the Reproducibility
Experiments
yCH40 yBCl30 yH20 RB4C RBHCl2
0.0208 0.0921 0.8871 3.81E-05 0.000511
0.0206 0.0894 0.8899 3.98E-05 0.000483
0.0207 0.0881 0.8912 4.06E-05 0.000461
N
x
X
N
1i
i
1
)( 2
1
N
xx
S
N
i
i
The t-distribution has one parameter which is called the degrees of
freedom (ν) where;
ν = N-1
For the large degrees of freedom values, the t-distribution approaches to
the normal distribution. For any given values of the degrees of freedom,
the t values are tabulated as a function of confidence levels [28].
For the three experimental runs given in Table F.1, the degrees of
freedom is 2. Using the t-distribution table [28], the value of t was found
to be 2.92 for 95% confidence limit.
Accordingly, the confidence intervals for the boron carbide and
dichloroborane formation rates were found as 4.1%, and 5.2%,
respectively for 95% of confidence limits.

172
APPENDIX G
COMPARISON BETWEEN EQUILIBRIUM CONVERSIONS
AND THE EXPERIMENTALLY OBSERVED
CONVERSIONS
In order to find out the extend through which reaction system approaches
equilibrium for the two overall formation reactions of boron carbide and
dichloroborane, the equilibrium constants of these two reactions (Kp1 and
Kp2, respectively) were compared with the experimentally observed
conversion values (Y1 and Y2, respectively) at different substrate
temperatures.
Y1 and Y2 values were calculated using the molar fractions of reactor
outlet gases.
1/4
CH4H2BCl3
3
HCl
1PPP
PY (G.1)
H2BCl3
HClBHCl2
2PP
PPY (G.2)
The mole fractions of each species at the reactor effluent were already
explained by equations 3.9 through 3.13, hence equations G.1 and G.2
becomes,
173
1/4
1BCl3oCH4o21BCl3oH2o21
3/4
1BCl3o
2
BCl3
3
21
1
)Xy4
1-))(yX(Xy-)(yX-X-(1)Xy
4
1(1
y)X(3XY
))X(Xy-)(yX-X-(1
X)yX(3XY
21BCl3oH2o21
2BCl321
2
Y1 and Y2 values were calculated using the reactor outlet gas
compositions for the experiments carried out at different temperatures.
The temperature dependent equilibrium constants of the boron carbide
formation reaction was calculated using well known van’t Hoff
equation,
2
rxnp
RT
H
dT
dLnK (G.3)
where,
T
298
p298rxn dTCHH (G.4)
Hence integration of equation G.3 gives Kp values at the desired
temperatures. The specific heats and heat of formation values for the
reactants and products are tabulated in Table G.1.
Table G.1 Thermodynamic Properties of Reactants and Products
Substance Cp (J/mol K=a+bT+cT2+dT3) (T in K)
ΔHf
o (J/mole) (298 K & 1 atm)
a b c d BCl3 32.61 0.139 -1.46E-04 5.44E-08 -4.03E+05 H2 27.14 9.27E-03 -1.38E-05 7.65E-09 -
B4C 95.999 2.32E-02 -4.10E-07 -8.14E-11 -6.27E+04 HCl 30.67 -0.0072 1.25E-05 -3.90E-09 -9.24E+04

174
The same procedure can be applied for dichloroborane formation
reaction, however, the temperature dependence of equilibrium constant
of dichloroborane (Kp2) is readily available in the literature [29].
)0.07x10-T0.94x10Tln08.2T
0.81x10-exp(17.51K 6-3-
-4
p2
Temperature dependence of the values of equilibrium constants Kp1 and
Kp2, in comparison with the Y1 and Y2 values is given in Figure G.1. As
can be seen clearly from the figure, magnitudes of Y1 and Y2 values are
much smaller than the equilibrium constants. This observation indicates
that in impinging jet reactor, both reactions are far from equilibrium.
175
Fig
ure
G.1
Tem
per
atu
re d
epen
den
ce o
f ch
emic
al
equ
ilib
riu
m c
on
sta
nts
for
bo
ron
ca
rbid
e a
nd
dic
hlo
rob
ora
ne
form
ati
on
rea
ctio
ns
-8-6-4-2024 0.00
055
0.00
060.
0006
50.
0007
0.00
075
0.00
08
1/T
(1/K
)
Ln K,Y
LnY
2Ln
Kp2
LnY
1Ln
Kp1

176
CIRRICULUM VITAE
NAME
Mustafa Karaman
ADRESS
Department of Chemical Engineering, Middle East Technical
University (METU),
06531, Çankaya, Ankara
Phone: 90-312-210 43 53
Fax : 90-312-210 26 00
e-mail : [email protected]
web: www.che.metu.edu.tr/~mkaraman/
DATE & PLACE OF BIRTH
Jan 14, 1980, Adana, Turkey
CITIZENSHIP
Turkish
LANGUAGES
English, read and speak
EDUCATION
Ph.D., Chemical Engineering, METU, (2002-2007)
B.Sc., Chemical Engineering, METU, (1997-2002)
High School, Adana Borsa High School, (1994-1997)
PROFESSIONAL EXPERIENCE
Research & Teaching Assistant
Chemical Engineering, METU [September 2002 - To date]
177
INTEREST AREAS
Reaction Engineering
Thin Film Synthesis and Characterization
Advanced materials
ACADEMIC EXPERIENCES
Assistantship to some undergraduate courses namely, Heat and
Mass Transfer Operations, Fluid Mechanics, Thermodynamics,
Chemical Engineering Laboratory, Introduction to Computers
and FORTRAN Programming, and assistantship to a graduate
course namely, Transport Phenomena
Attended to ‘Defence Technologies Congress’ in Ankara,
Turkey on June 2004
Attended to ‘6th
National Meeting of Chemical Engineering’ in
İzmir, Turkey on Sep 2004
Attended to ‘1st National Workshop on Boron’ in Ankara,
Turkey on April 2005
Attended to ‘2005 Materials Research Society Fall Meeting’ in
Boston, USA on November 2005
Visiting Studentship in Massachusetts Insitute of Technology,
Boston, USA between March, 2006 and April, 2005.
Attended to ‘Somer Symposium Series 1’ in Ankara, Turkey on
May 2007
PUBLICATIONS
1. Karaman M., Özbelge H.Ö., Sezgi N.A., Doğu T., ‘Kimyasal
Buhar Biriktirme Yöntemi İle Bor Karbür Üretimi’, 1. Ulusal Bor
Çalıştayı Bildiriler Kitabı, 28-29 Nisan 2005, Ankara
2. Karaman M., Özbelge H.Ö, Sezgi N.A., Doğu T., ‘Mechanism
And Characterization Studies on Boron Carbides Deposited by
Chemical Vapor Deposition Technique’, Proceedings of Materials for

178
Direct Thermal to Electric Energy Conversion, MRS (Materials
Research Society) Fall Meeting 2005, Boston USA Karaman M.,
Özbelge H.Ö, Sezgi N.A., Doğu T., ‘Kinetic Investigation of
Chemical Vapor Deposition of B4C on Tungsten Substrate’, AICHE
Journal, 52, 12, 4161-4166, 2006.
3. Karaman M., Özbelge H.Ö, Sezgi N.A., Doğu T., ‘Mechanism
studies on CVD of boron carbide from a gas mixture of BCl 3, CH4 and
H2 in a dual impinging jet reactor’, Chemical Engineering Science,
under review.
RESEARCH PROJECTS
1. H.Önder Özbelge and Mustafa Karaman ‘Chemical Vapor
Deposition of Boron Carbide’, Project code: Misag-217, TUBITAK
(The Scientific and Technological Council of Turkey), Ankara, 2002-
2006.
2. H.Önder Özbelge and Mustafa Karaman ‘Kinetic Studies on CVD
of Boron Carbides’, Project code: BAP-08-DPT2002K120510-İM-5,
DPT (State Planning Organization of Turkey), Ankara, 2002-2007.
COMPUTER RELATED SKILLS
Programming Languages: FORTRAN 77/90
Operating Systems: Windows 9X/2000/XP
Commercial and Research Software Packages: Visio, SigmaStat,
Statistica, Mathcad, Chemcad, Mathematica, Microsoft Office (Word,
Excel, PowerPoint, Frontpage)